Article

Optimization of Virtual Inertia Control for DC Microgrid Based on Model Predictive Control

1
School of Energy and Electrical Engineering, Qinghai University, Xining 810016, China
2
School of Electrical Engineering, Yanshan University, Qinhuangdao 066004, China
*
Author to whom correspondence should be addressed.
Energies 2025, 18(23), 6180; https://doi.org/10.3390/en18236180
Submission received: 16 October 2025 / Revised: 10 November 2025 / Accepted: 24 November 2025 / Published: 25 November 2025
(This article belongs to the Special Issue Power Electronics for Renewable Energy Systems and Energy Conversion)

Abstract

To mitigate voltage transients caused by power fluctuations in microgrid systems, this study investigates model predictive control and virtual inertia control for the voltage regulation strategy of energy storage unit converters. By drawing an analogy with the virtual synchronous machine equation in AC systems, the virtual capacitor inertia equation is derived for DC systems. Subsequently, model predictive control (MPC) is integrated with virtual inertia (VI) control, leading to the development of an MPC-VI cooperative control method. The reference value for the inner control loop is computed in real time using model prediction, enabling the injection of a counteracting signal opposite to the direction of DC bus voltage fluctuation during disturbances. This approach effectively suppresses rapid voltage variations and enhances system inertia. Furthermore, by incorporating a threshold-based mechanism, the issue of prolonged dynamic response time is mitigated. Simulation and experimental results demonstrate that, compared to conventional control strategies, the proposed MPC-VI method significantly attenuates instantaneous and severe voltage fluctuations, allowing for a more gradual voltage transition during transient events. Additionally, with the implementation of the threshold equation, the system returns to steady state without notable delay, preserving the droop characteristics of the control scheme.

1. Introduction

As an effective way of distributing energy power supply, DC microgrid does not have problems such as frequency and power angle stability, and has the advantages of high controllability and reliability, which has broad application prospects [1]. In DC microgrid, various distributed power supplies and energy storage systems use power electronic converters as the bridge for power exchange with the microgrid, and its response speed is remarkably swift. When the distributed power supply and load are frequently switched on, the DC bus voltage will fluctuate violently and instantaneously, posing a threat to the stable operation of DC microgrid system [2]. Some researchers use power-type energy storage devices such as supercapacitors to quickly smooth the internal power fluctuations of the system [3], but they are expensive and idle when the system is in a steady state, resulting in a waste of resources. Therefore, virtual inertia control of DC microgrids has been studied [4]. By referring to the Virtual Synchronous Generator (VSG) [5], the Virtual DC Motor (VDCM) control strategy [6] is introduced into the DC microgrid, so that the converter can simulate the characteristics of the DC motor. Although VDCM can make the converter have a certain inertia and increase the damping of the system, it is relatively complicated in the control strategy. Considering that DC bus voltage is a key indicator to measure system stability in DC microgrid, the control method of a virtual capacitor is introduced into the control strategy, that is, the characteristics of real capacitor are simulated in the control strategy, thereby indirectly increasing the capacitance value at DC bus and improving system inertia [7]. By analogy with VSG control strategy in AC system, the literature [8] proposes a virtual inertia control strategy applied to bidirectional grid-connected converters in the DC microgrid. Virtual capacitance is introduced into the inertia equation to suppress voltage fluctuations and improve the inertia of the system, but the value of virtual capacitance is fixed. The literature [9] proposes a flexible virtual inertia control strategy for bidirectional grid-connected converters in DC microgrids. By setting the threshold of DC bus voltage change rate, the virtual capacitance is segmented according to the threshold of change rate, so that the value of virtual capacitance can be flexibly changed to improve the dynamic characteristics of the system while enhancing the inertia of the system. The literature [10] established a discrete model for the entire DC microgrid system, taking DC bus voltage tracking error and virtual inertia coefficient as objective functions, and constrained by the DC bus voltage change rate, and strengthened inertia for interface converters of different units in the microgrid system by forecasting methods, so as to achieve the increase in inertia of the entire system. It is verified by hardware-in-the-loop experiments. The literature [11] takes the bidirectional grid-connected converter as the object. In the battery test system of the DC microgrid, with the variation of the DC bus voltage as the optimization objective and the variation range of the DC bus voltage as the constraint, a control strategy combining constrained model predictive control and virtual inertia control is proposed. By predicting the expected increment of the DC bus current, the predicted current increment is superimposed into the droop control to change the current reference value, providing inertial support for the DC bus, but the solution process is rather complex. The literature [12] takes bidirectional Buck/Boost converter as the object, and proposes a predictive virtual capacitance control by applying the finite set model predictive control, so that the virtual capacitance can obtain a large value at the beginning of the fluctuation, and become a small value when it approaches the steady state, so as to optimize the dynamic response of the system.
Aiming at the problem that the system has fast response speed and lacks inertia, the DC bus voltage fluctuates greatly after the system is disturbed, and the traditional fixed virtual capacitor attached inertia control is not flexible enough to provide inertia for the system. If the value is too large, the system dynamic response speed will be too slow, and the value is too small and cannot meet the inertia requirements of the system. This article presents the voltage regulation mode of the energy storage converter. An MPC-VI optimization control strategy based on model predictive control combined with additional inertial control is proposed. By calculating the current given value of a flexible battery converter, the output power of the battery can be changed in time, the inertia of the system can be improved, and the DC bus voltage fluctuation caused by power fluctuation can be suppressed.

2. DC Microgrid Structure and Modeling

2.1. DC Microgrid Structure

The overall architecture of the investigated DC microgrid is illustrated in Figure 1. Under normal operating conditions, the photovoltaic generation system operates in maximum power point tracking mode and is connected to the microgrid via the Boost converter P-DC. The energy storage unit enables bidirectional power flow through the Buck/Boost bidirectional DC-DC converter Bi-DC. The grid-connected converter G-VSC functions as the interface for bidirectional energy exchange between the microgrid and the main grid. The DC load and AC load are connected to the DC bus through the Buck converter L-DC and the inverter L-VSG, respectively. To ensure DC bus voltage stability, it is essential to manage the power flow appropriately so as to maintain a balanced power condition within the microgrid.

2.2. Energy Storage Unit Interface Converter Modeling

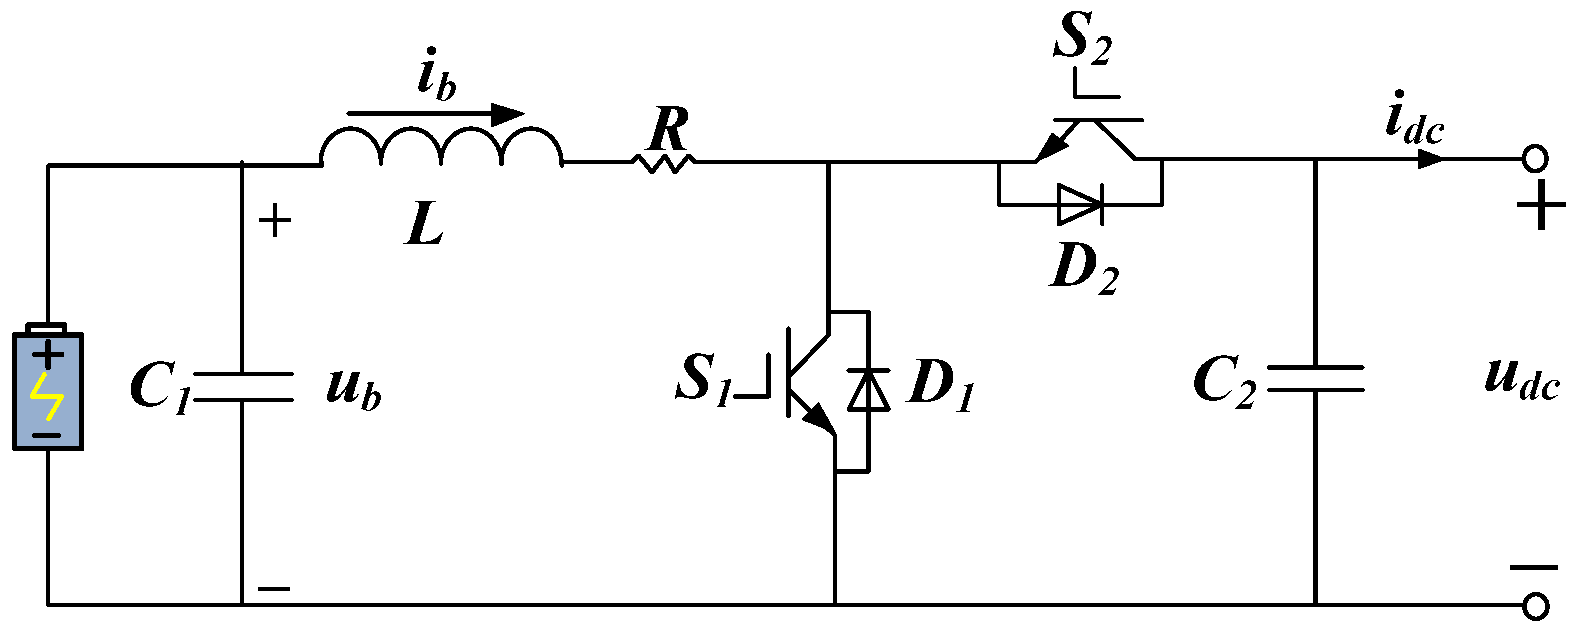
The energy storage unit interface converter topology selected in this paper is a widely used non-isolated bidirectional Buck/Boost converter, as shown in Figure 2. When the battery power flows to the DC bus side, the direction is positive.
According to Figure 2, the average mathematical model of the bidirectional Buck/Boost converter can be obtained as shown in Equation (1) [13]:
C 2 d u d c d t = ( 1 d ) i b i d c L d i b d t = u b ( 1 d ) u d c R i b
where d is the duty cycle of S1 in Boost mode.

3. Virtual Inertia Optimization of Energy Storage Unit Based on MPC

3.1. Virtual Capacitor Attached Inertia Control Principle

In AC microgrid, to enable the inverter to simulate the inertia, damping, and primary frequency modulation characteristics of the synchronous generator, the active power–frequency droop control is commonly adopted as follows:
P r e f = P N + k d ( ω N ω )
Equation (2) is the active power–frequency droop equation, where Pref and PN are the given and rated active power of the active power, k d is the droop coefficient, and ω Ν and ω are, respectively, the rated angular frequency and the actual angular frequency. Then, the mechanical equation of VSG is shown in Equation (3):
P r e f P e D ( ω ω N ) = J ω N d ω d t
where D is the damping coefficient, Pe is the electromagnetic power, and J is the moment of inertia.
In DC microgrids, current–voltage droop control is usually adopted, and its droop equation is as follows:
i r e f = k d ( U N u d c )
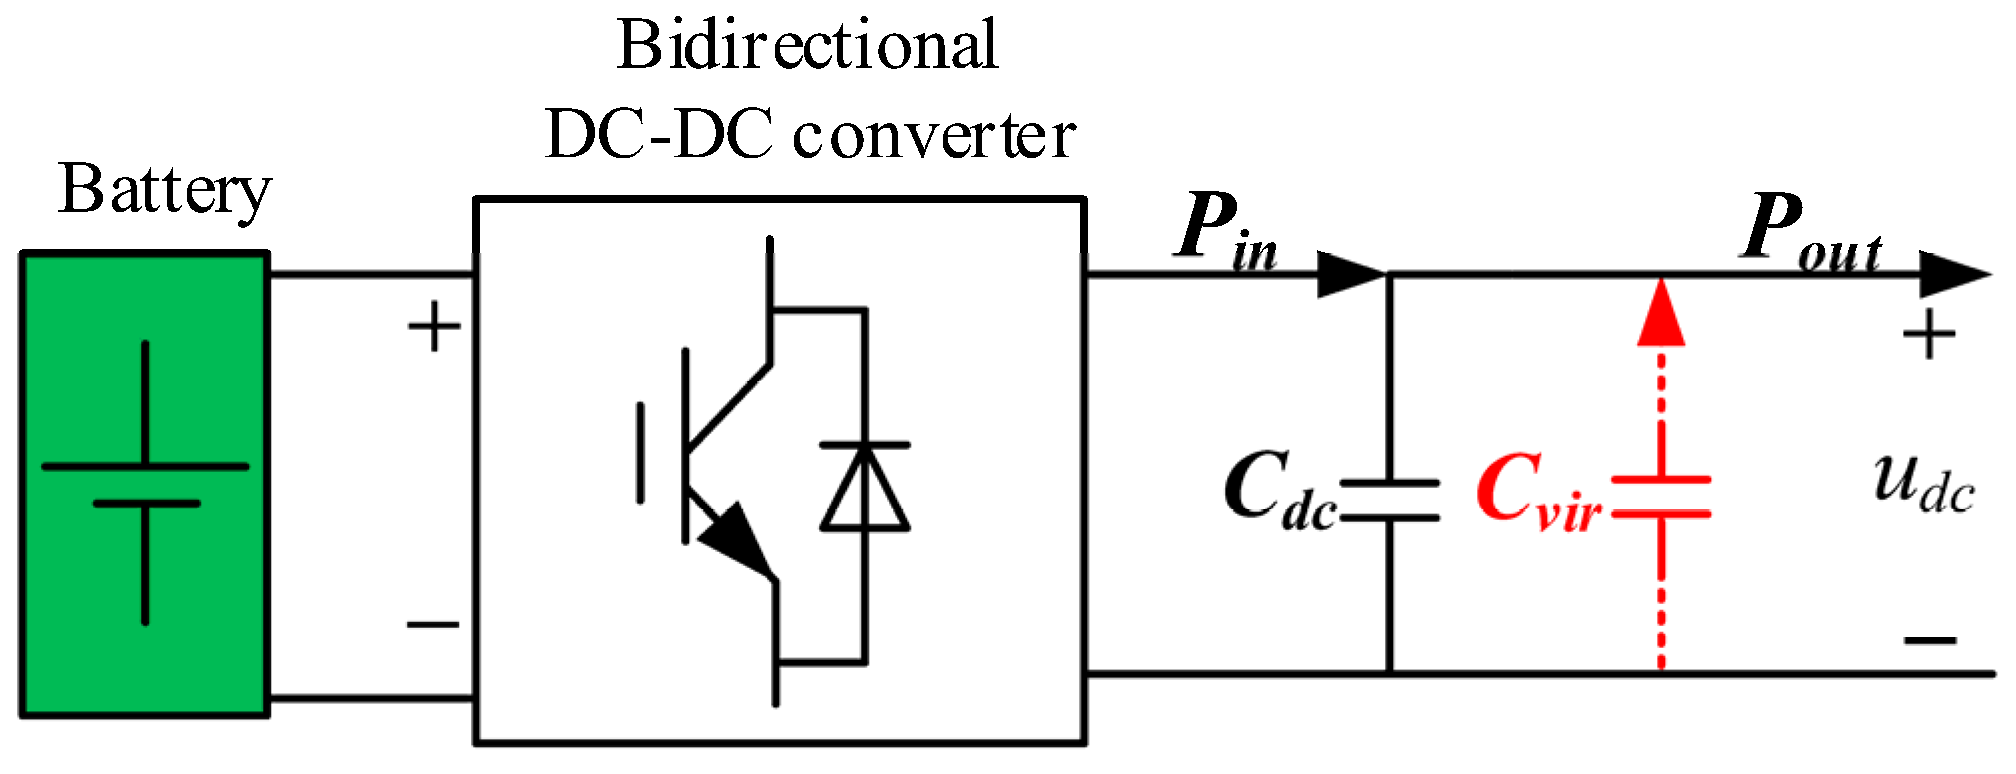
In Equation (4), iref is the reference value of converter output current, kd is the droop coefficient, and UN and udc are the rated value and actual value of DC bus voltage, respectively. In DC microgrid, to reduce voltage fluctuations at the DC bus bar and improve the system inertia of the DC microgrid, increasing the capacitance at the DC bus bar is the most direct method, but directly increasing the capacitance at the DC bus bar will also bring about problems such as increased system cost and loss. Therefore, the control method of virtual capacitance is introduced in the DC microgrid. To effectively simulate the actual capacitance to suppress voltage fluctuations, see Figure 3:
In the figure, C v i r is the virtual capacitor. In this case, the virtual power absorbed by the virtual capacitor is
Δ P v i r = C v i r u d c d u d c d t
Therefore, the current flowing through the virtual capacitor is
Δ i = C v i r d u d c d t = i r e f i d c
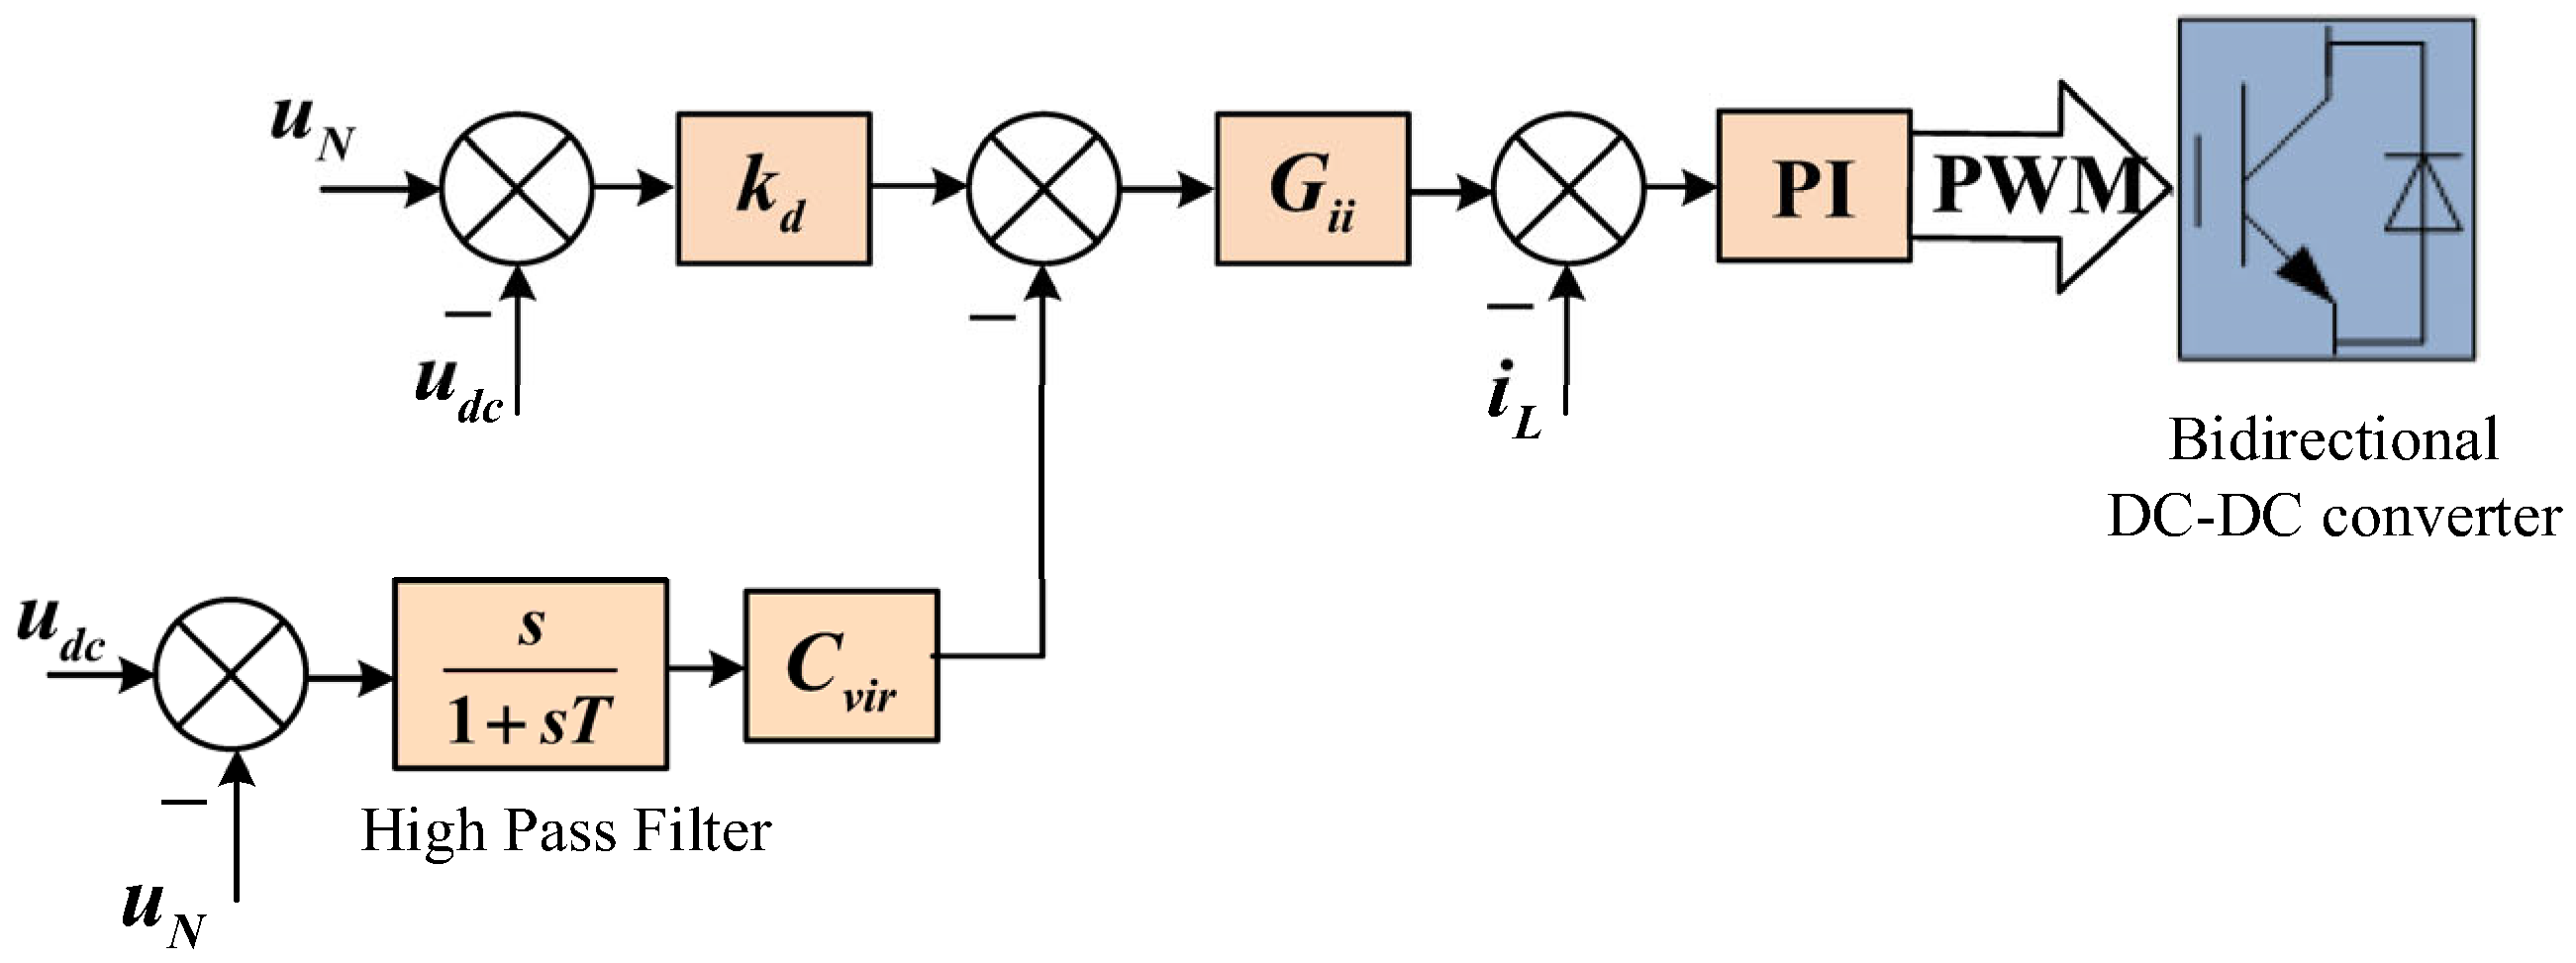
The inertia equation of the additional inertia control of the virtual capacitor is shown in Equation (7), thus the block diagram of the additional virtual inertia control can be obtained, as shown in Figure 4:
i d c * = k d ( U N u d c ) C v i r d u d c d t k d ( U N u d c ) C v i r s u d c 1 + s T
where i d c * is the given value of the output current of the converter.
Considering the power balance of the converter, the inductance current can be calculated by Equation (8):
i b = u d c u b i d c
So, there are
G b i = u d c u b

3.2. Modeling and Stability Analysis of Virtual Capacitor Attached Inertial Control

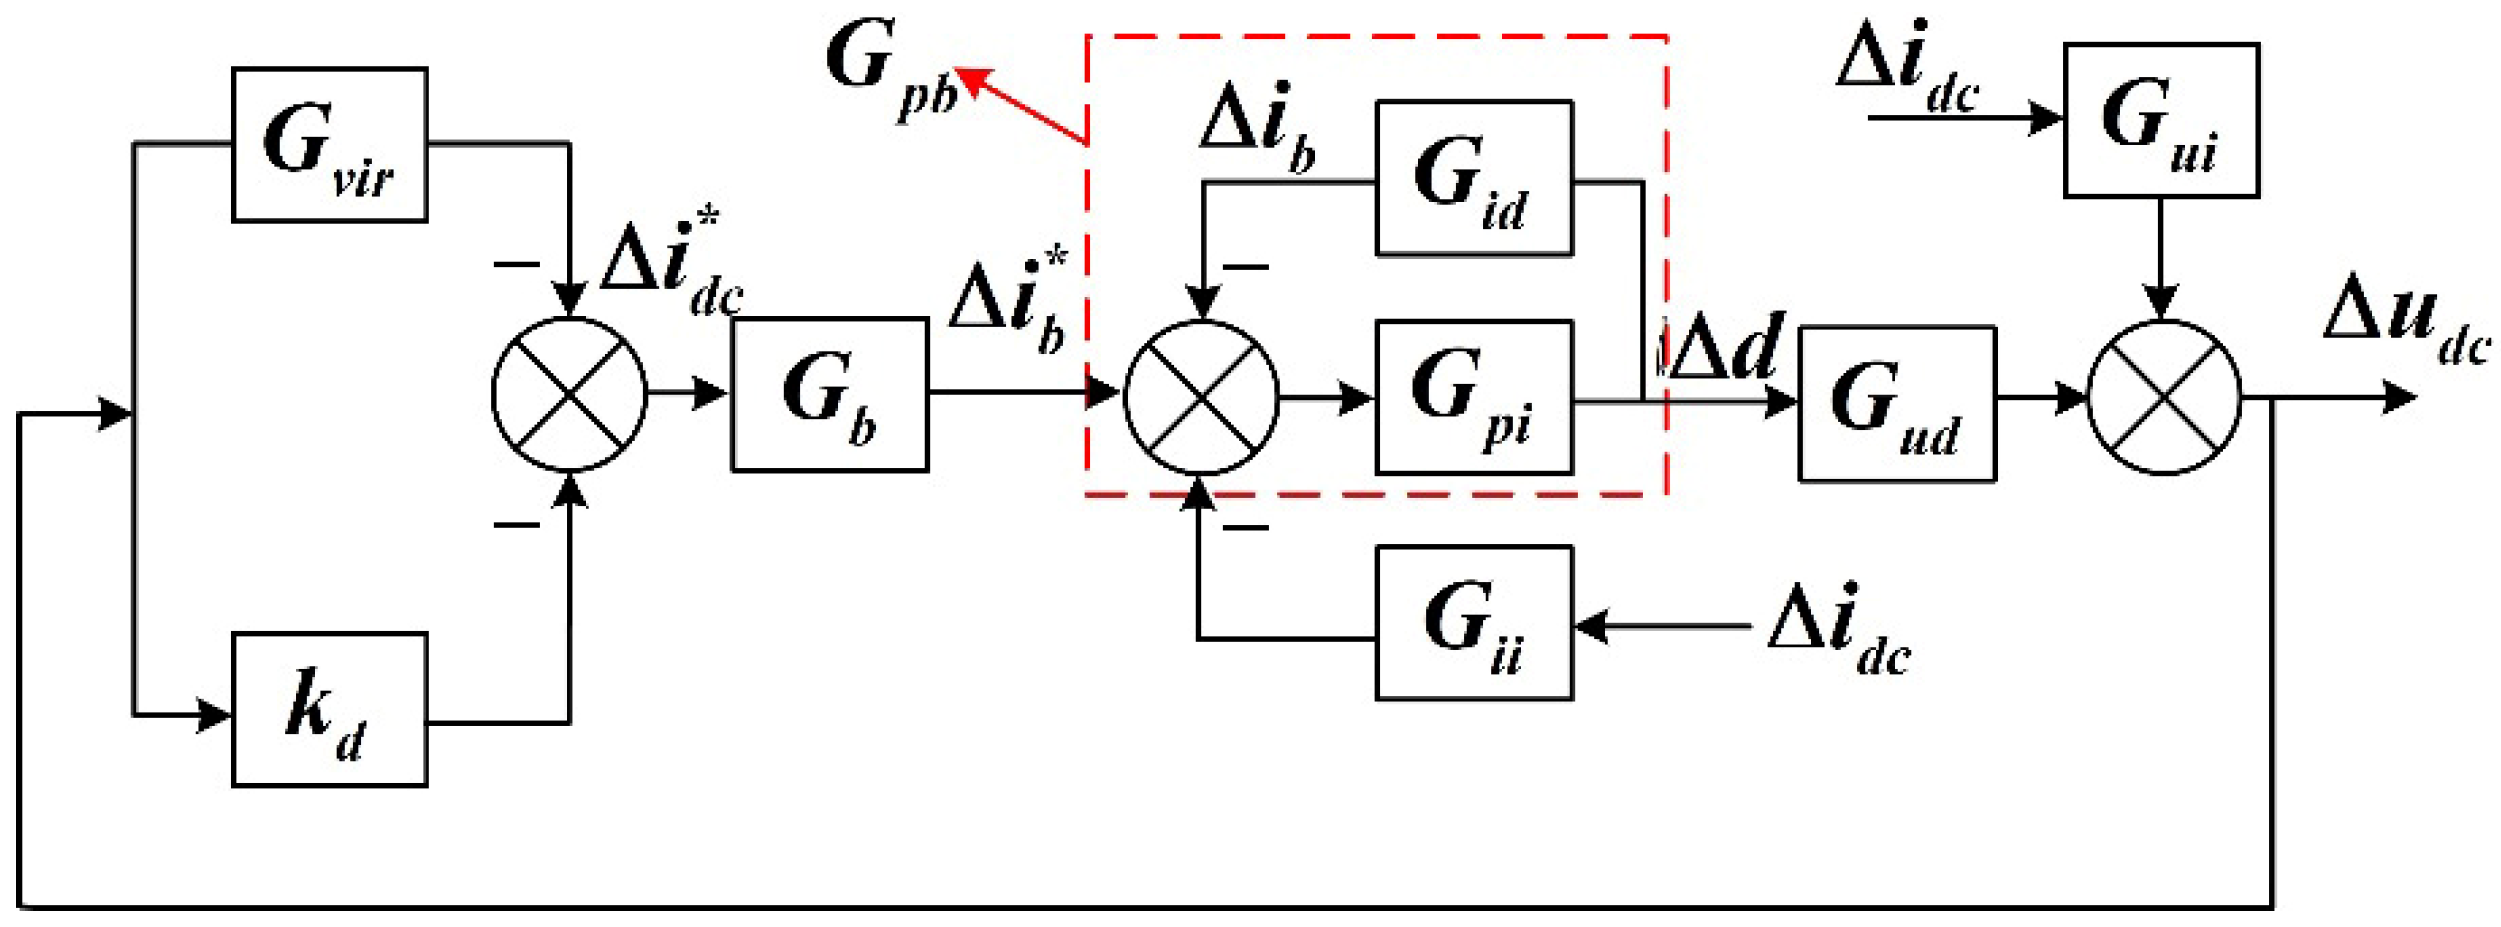
In order to explore the effect of virtual capacitance parameters on the system of fixed virtual capacitance attached inertial control, the small signal modeling of Bi-DC is carried out first. The small signal model is shown in Equations (10)–(16), and the small signal control block diagram of the additional inertia control of the fixed virtual capacitor can be obtained, as shown in Figure 5.
G v i r = C v i r T s T + 1
G b i = Δ i b Δ i d c = U d c U b
G i d = Δ i b Δ d = s C U d c + ( 1 D ) I b L C s 2 + R C s + ( 1 D ) 2
G i b = k p + k i s
G u d = Δ u d c Δ d = L I b s R I b + ( 1 D ) U d c L C s 2 + R C s + ( 1 D ) 2
G i i = Δ i b Δ i d c = 1 D L C s 2 + R C s + ( 1 D ) 2
G u i = Δ u d c Δ i d c = L s R L C s 2 + R C s + ( 1 D ) 2
where G p i is PI controller, U d c , I d c , I b , and D are the DC steady-state quantities of u d c , i d c , i b , and d , respectively; and Δ u d c , Δ i d c , Δ i b , and Δ d are small signal disturbances of u d c , i d c , i b , and d , respectively. It can be obtained from Figure 5 that the impedance transfer function of fixed virtual capacitance with virtual inertia control is
Z ( s ) = Δ u d c Δ i d c = G i i G p b G u d G u i 1 + ( G v i r + k ) G b i G p b G u d
Among them, the DC bus voltage fluctuation range is set to 2% of the rated value, so k d = i max / Δ u max = 3.28 .
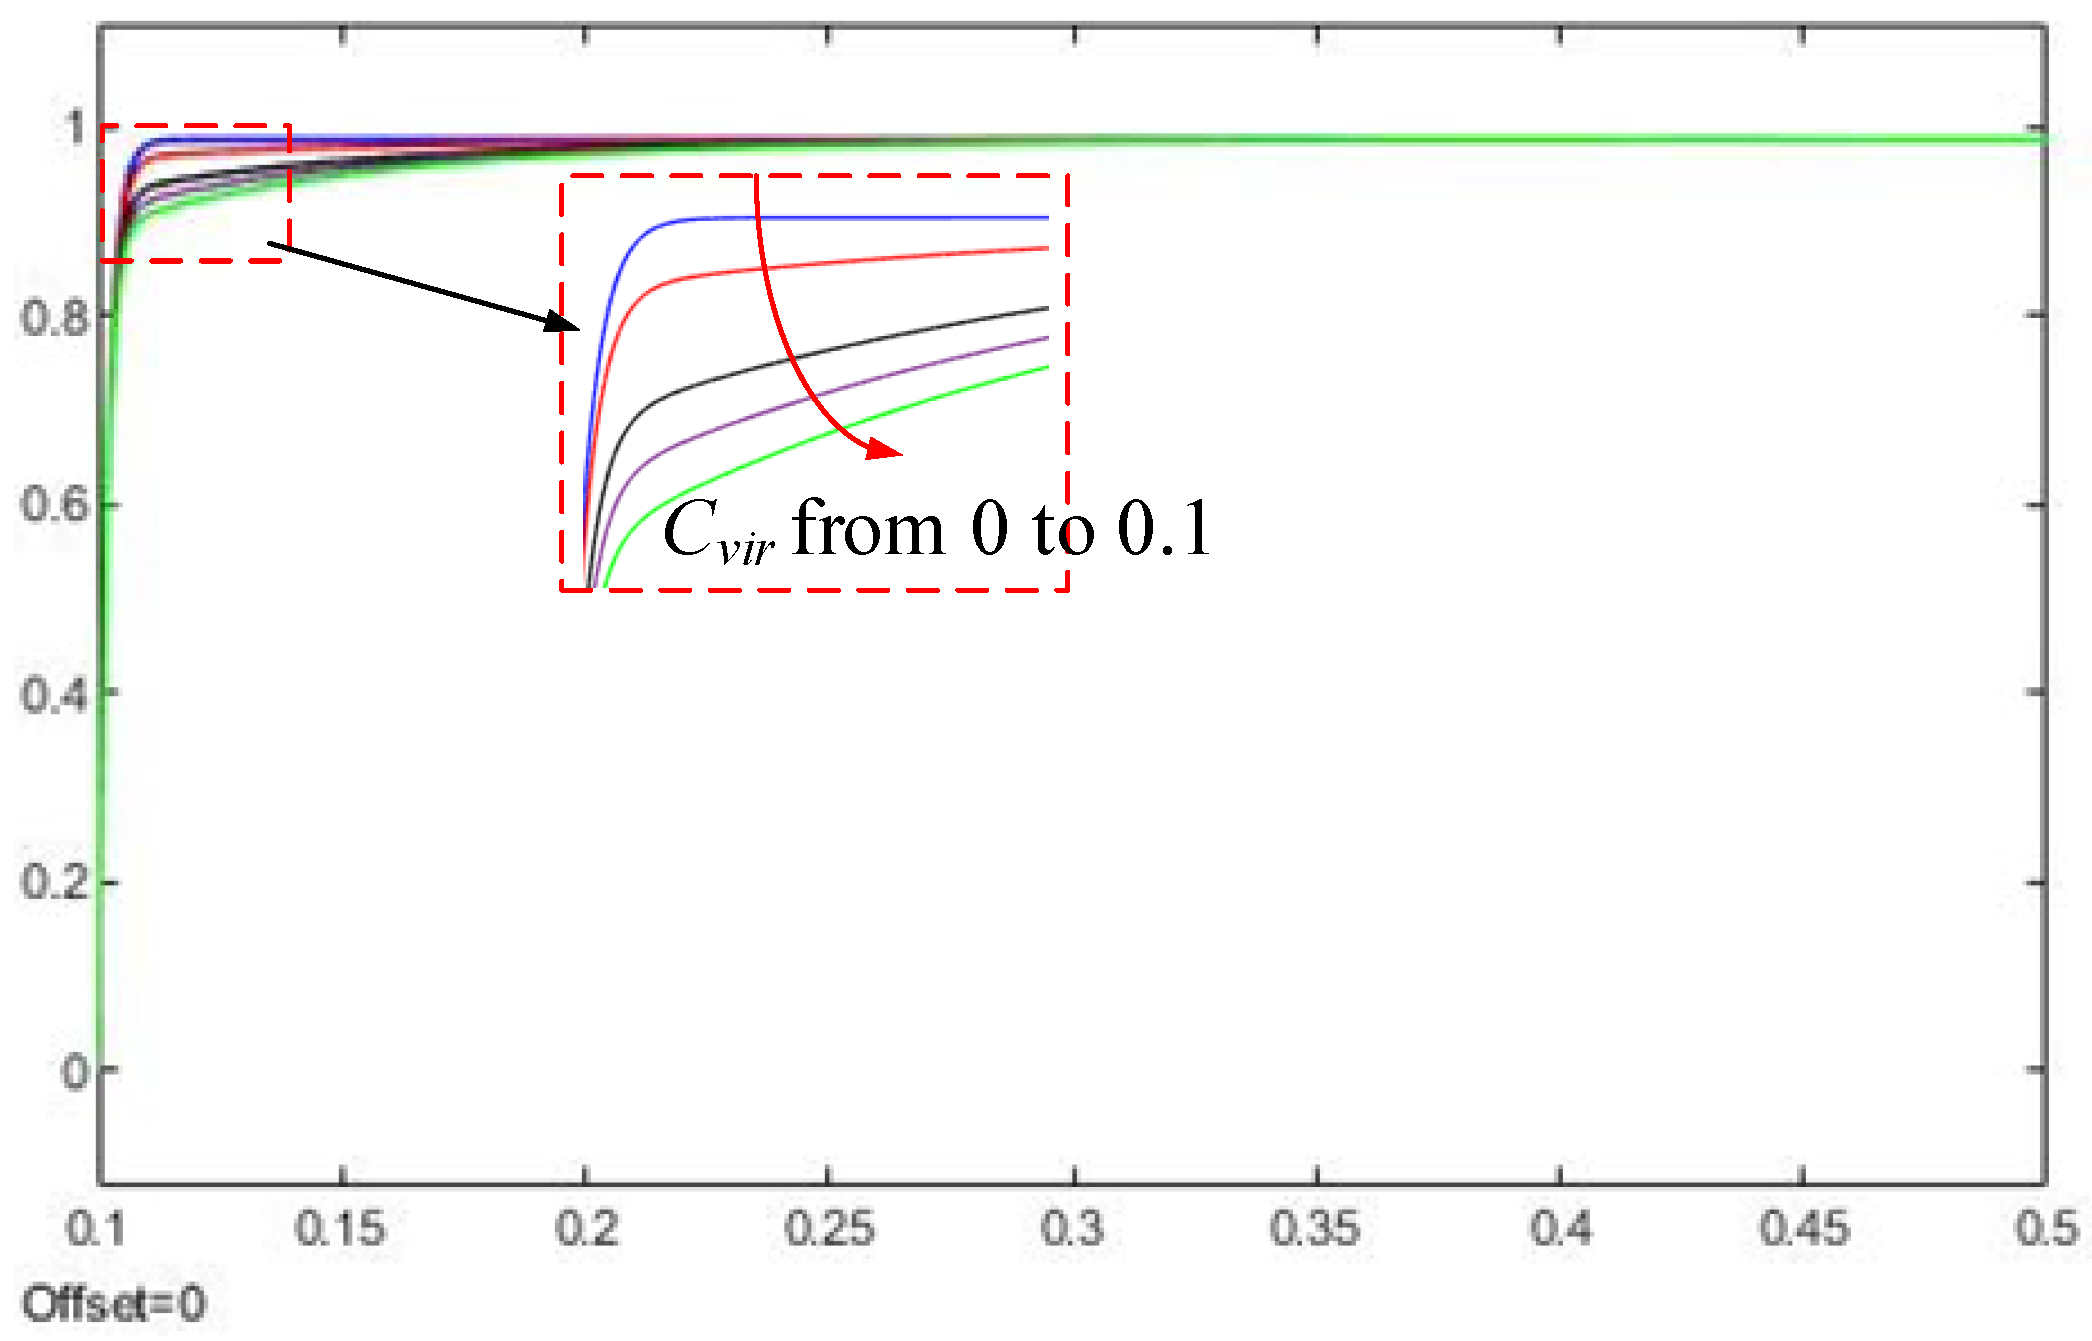
Figure 6 shows the unit step response of Z(s) under different C v i r , and its physical meaning is that when the output current of Bi-DC decreases by 1A, the DC bus voltage variation Δ u d c responds to time.
As can be seen from Figure 6, when sudden interference occurs in the system, the DC bus voltage changes slowly with the increase in C v i r value, indicating that the increase in C v i r value helps to slow down the voltage sudden change.
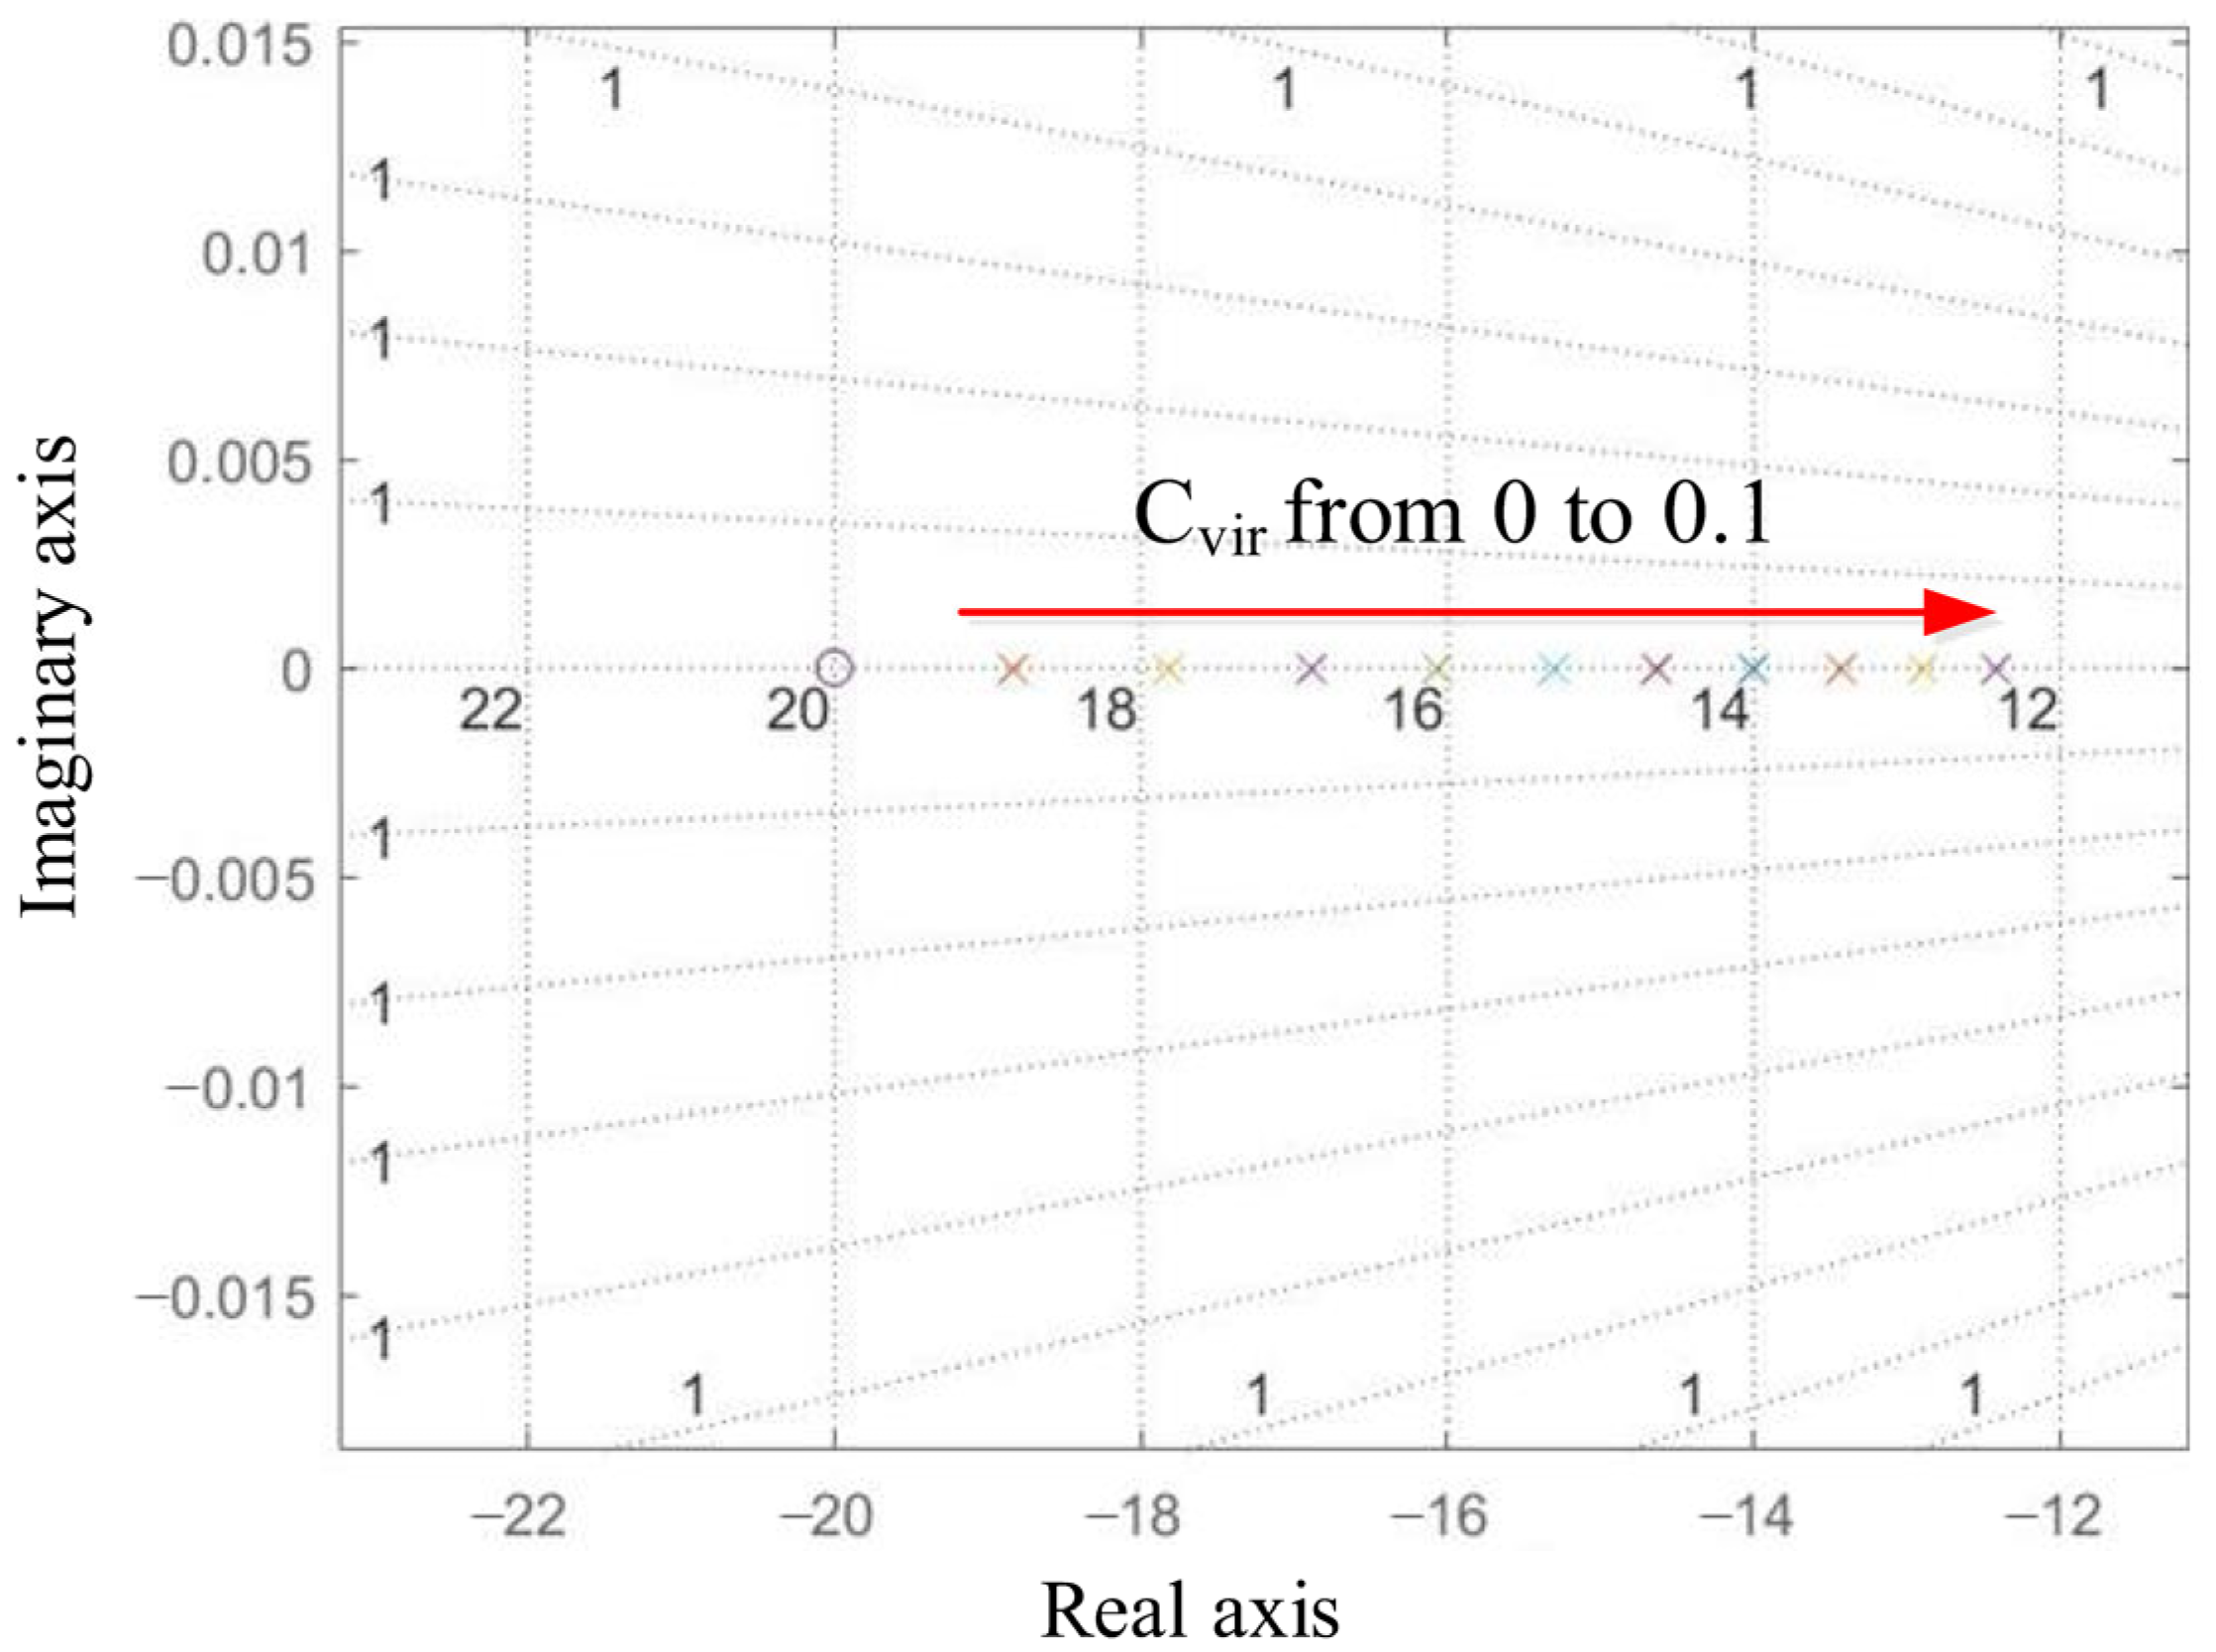
According to the expression of Z(s), by drawing its zero-pole distribution map, the dominant pole distribution map when C v i r changes can be obtained. It can be seen from Figure 7 that as the virtual capacitance value increases, the dominant pole of the system gradually approaches the origin, indicating that the larger the value, the slower the response speed of the system. When system disturbances occur, the increase can improve the inertia characteristics of the system and suppress the instantaneous fluctuations of the voltage.

3.3. MPC-VI Control Design

As can be seen from the previous section, the value of virtual capacitance also has a great influence on the stability of the system. Therefore, the method of combining model predictive control and virtual inertia can be used to provide a relatively optimal given value for the current inner loop, so that the battery current can change rapidly, and the power fluctuation can be suppressed.
In order to obtain an inertia equation similar to the mechanical equation of VSG, by analogy between Equation (7) and Equation (3), a virtual inertia equation of the DC microgrid similar to Equation (3) can be obtained. The virtual inertia equation is
i s e t i d c k d ( u d c u N ) = C v i r d u d c d t
As can be seen from Equation (18), changing the value of i s e t can reduce the DC bus voltage change rate, thereby suppressing voltage fluctuations.
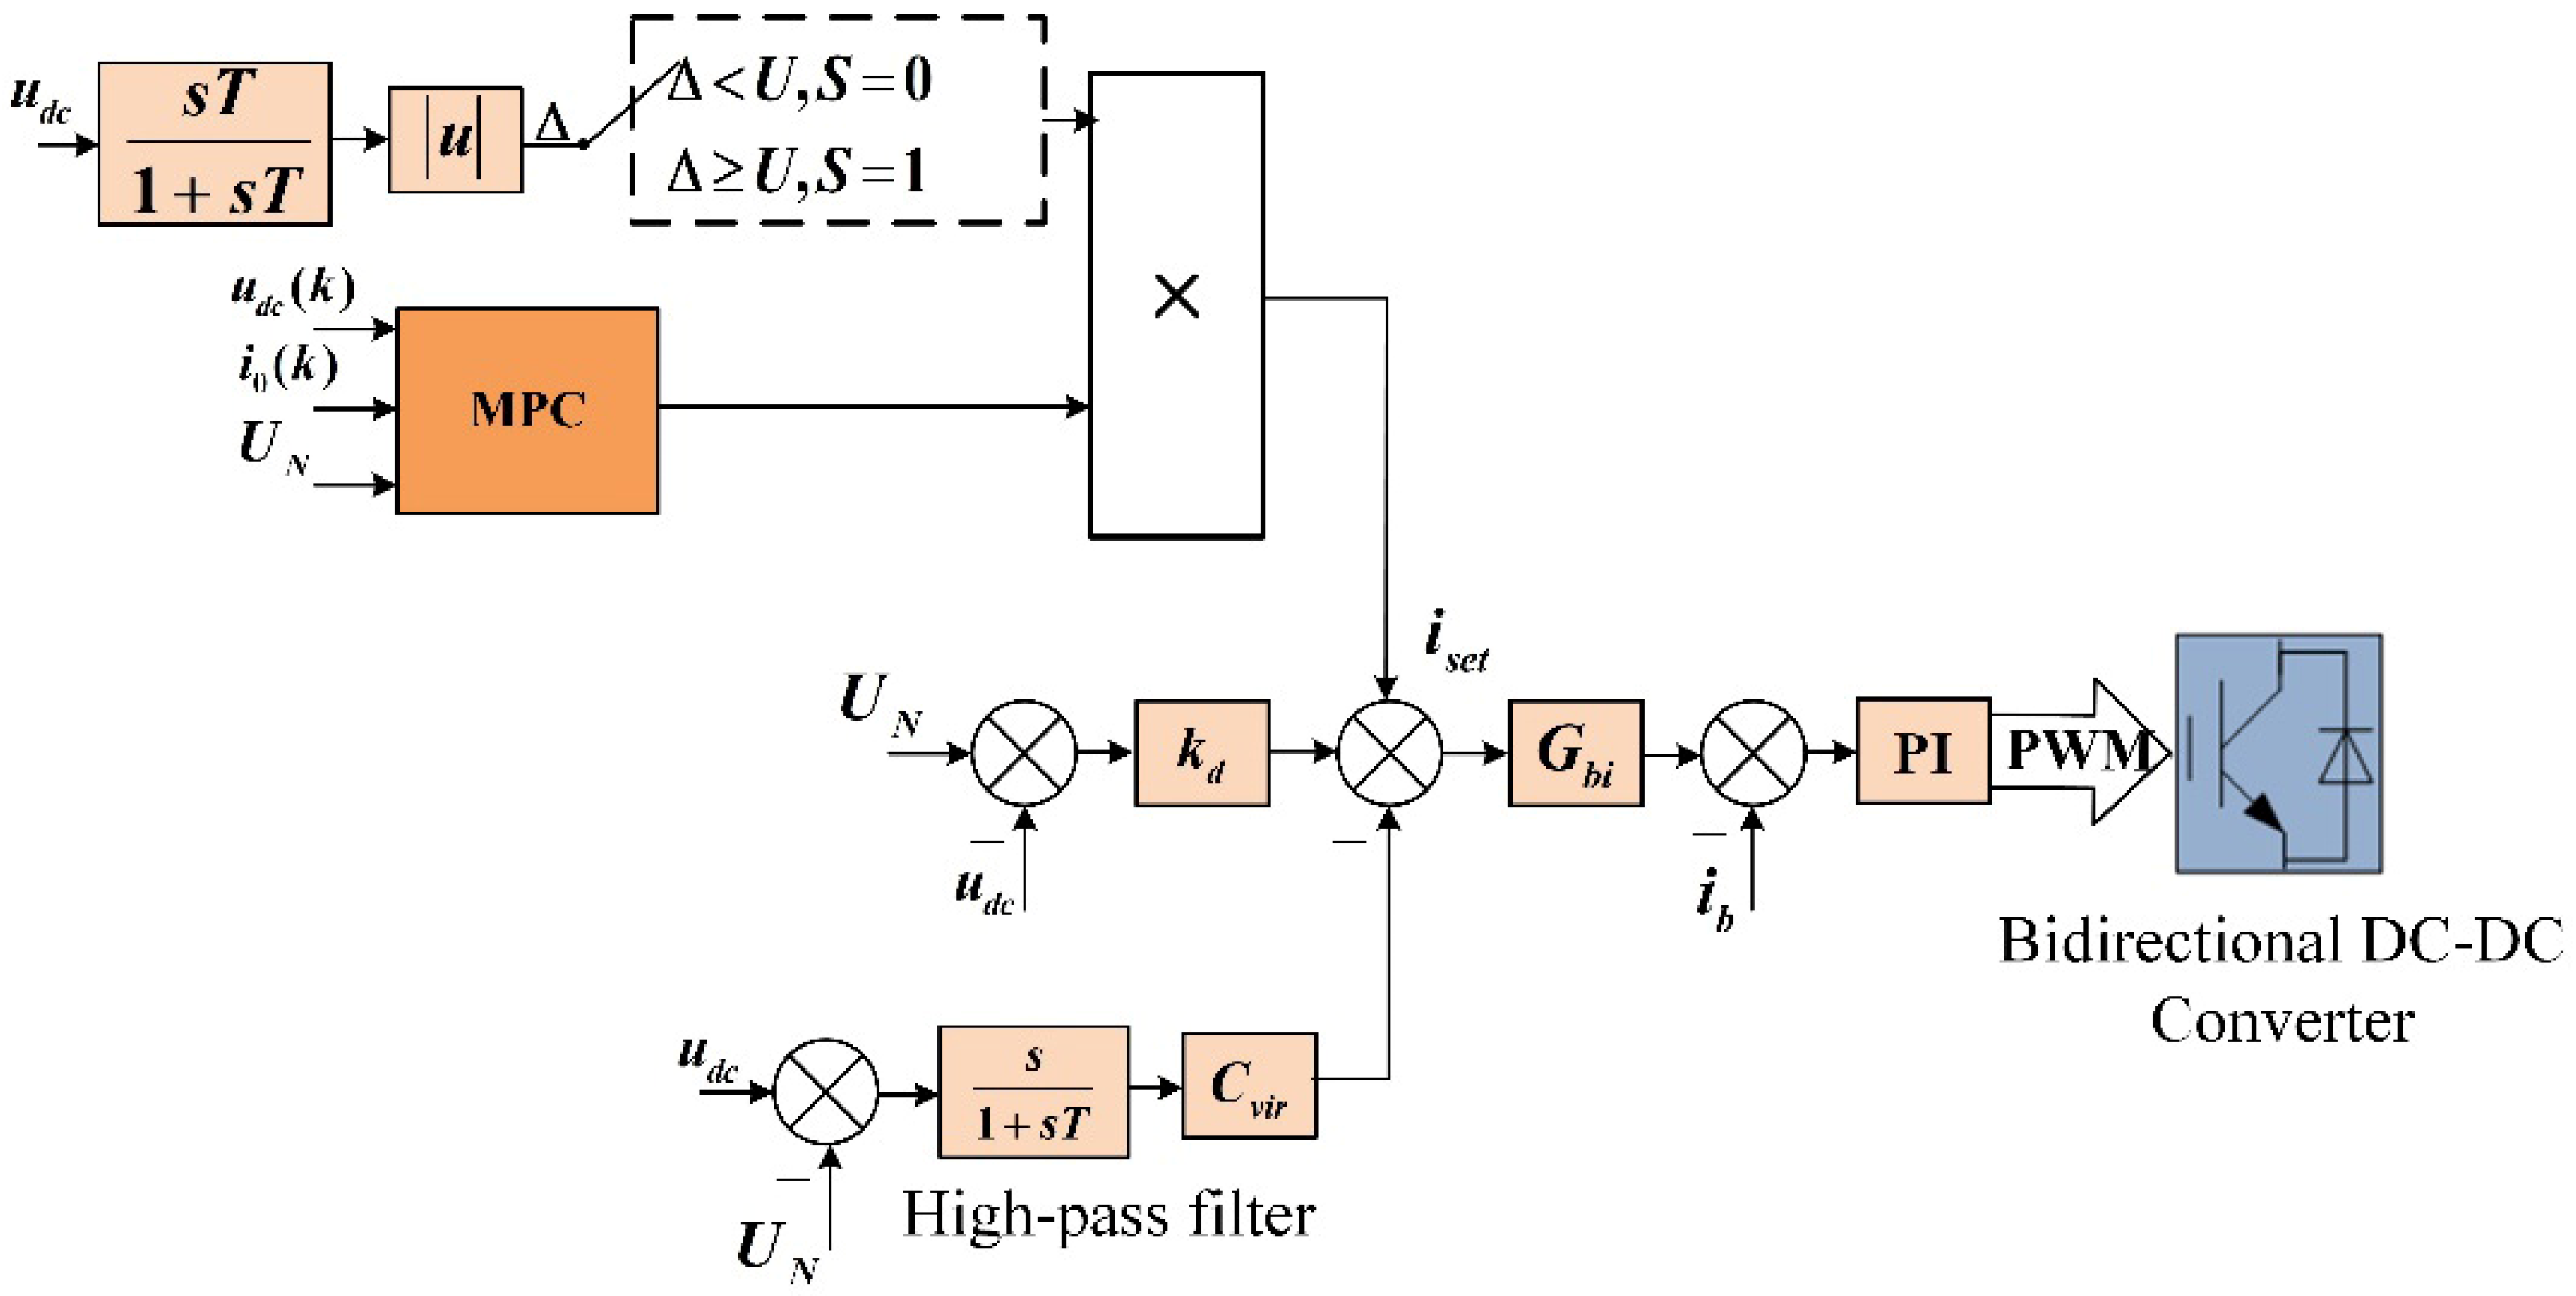
The control block diagram of the control method is shown in Figure 8. The outer ring includes sag control and additional virtual capacitor inertia control. A flexible reference current i s e t is obtained by model prediction through the mathematical model of Equation (18), and the power of the battery can be changed in real time.

3.3.1. MPC-VI Predictive Model

Rewrite Equation (18) as follows.
d ( u d c U N ) d t = 1 C v i r k d ( u d c U N ) + 1 C v i r i s e t 1 C v i r i d c
Rewrite the above equation into the form of a state-space Equation:
x ( t ) = k d C v i r x ( t ) + 1 C v i r u ( t ) 1 C v i r d ( t ) y ( t ) = x ( t )
where the state variable is x ( t ) = u d c ( t ) u N , the input quantity is u ( t ) = i s e t ( t ) , the output current of the energy storage converter is the disturbance quantity, d ( t ) = i d c ( t ) , and y ( t ) are the output quantity. Equation (20) is discretized as shown in Equation (21):
x ( k + 1 ) = A x ( k ) + B u u ( k ) + B d d ( k ) y ( k + 1 ) = x ( k + 1 )
In the above Equation, x ( k ) , u ( k ) , and d ( k ) are the state quantity, input quantity, and disturbance quantity obtained at the current sampling time, and x ( k + 1 ) and y ( k + 1 ) are the quantity of states and output at time k + 1 predicted by time k , where, as follows:
A = e k d C v i r T s , B u = 1 C v i r 0 T s e k d C v i r τ d τ , B d = 1 C v i r 0 T s e k d C v i r τ d τ
where T s is the discrete sampling time of the system. It is assumed that the measurable interference does not change after k time, that is
d ( k ) = d ( k + 1 ) = d ( k + 2 ) = = d ( k + n )
where n = 1 , 2 , p , p is the prediction time domain. Considering the accuracy and calculation burden of the system, the prediction time domain adopted in this paper is p = 3 , and then the prediction model changes as shown in Equation (23) are as follows:
Y ( k + 1 | k ) = F x ( k ) + Φ U ( k ) + D d ( k )
where
Y ( k + 1 | k ) d e f ¯ ¯ y ( k + 1 ) y ( k + 2 ) y ( k + 3 ) , U ( k ) d e f ¯ ¯ u ( k ) u ( k + 1 ) u ( k + 2 ) , F = A A 2 A 3 T
Φ = B u 0 0 A B u B u 0 A 2 B u A B u B u , D = B d i = 0 1 A i B d i = 0 2 A i B d T
Denote the current sampling period at time k , and y ( k + i ) and u ( k + i 1 ) are the output and input quantities at time k + i predicted at time k , where i = 1 , 2 , 3 .

3.3.2. Objective Function Design

The control objective of virtual inertia is to smoothly change the DC bus voltage when the system is disturbed, based on three-step prediction. Therefore, the design objective function is shown in Equation (24):
J = i = 1 3 λ 1 | y ( k + i ) y ( k ) | 2 + λ 2 | u ( k + i 1 ) u ( k 1 ) | 2 + λ 3 | u d c ( k + i ) u r e f | 2
where u r e f = U N ( 1 / k d ) i d c .
The first term of the objective function is the voltage change of the DC bus. To avoid a large change in the input value, which will cause a large current ripple and make the system unstable, the control action change is introduced in the second item. To reduce the fluctuation of DC bus voltage and affect the dynamic characteristics of the system, the third item is the penalty of the deviation between DC bus voltage and the given value in droop control. λ 1 , λ 2 , and λ 3 are the weight coefficients. λ 3 should not be too large, otherwise it will affect the inertia effect. y ( k ) represents the output obtained from the current sampling, and u ( k 1 ) is the input applied to the system in the last sampling period, that is, the i s e t calculated in the last sampling period. Then, write Equation (24) as a quadratic matrix, as shown in Equation (25):
J = [ Y ( k + 1 | k ) I y ( k ) ] T Q [ Y ( k + 1 | k ) I y ( k ) ] + [ U ( k ) I u ( k 1 ) ] T R [ U ( k ) I u ( k 1 ) ]       + [ Y T ( k + 1 | k ) + I ( 1 / k d ) ] T P [ Y T ( k + 1 | k ) + I ( 1 / k d ) ]
where, Q, R, and P are the weight coefficient matrix, and the weight coefficient matrix and I are shown in Equation (26):
Q = d i a g { λ 1 , λ 1 , λ 1 } R = d i a g { λ 2 , λ 2 , λ 2 } P = d i a g { λ 3 , λ 3 , λ 3 } I = 1 1 1 T
By expanding Equation (25) and discarding the term without U(k), Equation (27) can be obtained as follows.
J = x ( k ) G T Q H + x ( k ) H T Q G + H T Q H + H T Q D d ( k ) + d ( k ) D T Q + U ( k ) T R U ( k ) u ( k 1 ) U ( k ) T R I u ( k 1 ) Ι T R U ( k ) + x ( k ) F T P H + x ( k ) H T P F + H T P H + d ( k ) H T P K + d ( k ) K T P H
where G = F I , H = Φ U ( k ) , K = D + 1 / k d I .

3.3.3. Solution of the Control Quantity

In order to obtain the minimum value of J , the derivative of Equation (27) with respect to U(k) is made equal to 0, thereby obtaining the sequence of input quantities, as shown in Equation (28):
U ( k ) = ( L + R + M ) 1 [ x ( k ) ( N + V ) + d ( k ) Γ S ]
where
L = Φ T Q Φ , M = Φ T P Φ , N = Φ T Q G
V = Φ T P F , S = u ( k 1 ) R I , Γ = Φ T ( Q D + R K )
After obtaining the sequence of inputs, take the first element of U(k) and apply it to the system, as shown in Equation (29):
u ( k ) = 1 0 0 U ( k )
At the same time, in order that the converter can meet the droop curve without destroying the dynamic characteristics of the system, and avoid the time for the system to return to the new steady state value being too long, the threshold value is set to detect whether the high-frequency component of the DC bus voltage exceeds the threshold value, so that the model prediction controller intervenes in the control when the threshold value is exceeded. The threshold Equation is shown in Equation (30):
u ( k ) = 0 , s T u d c 1 + s T < U u ( k ) ,     s T u d c 1 + s T U
When below the threshold, the model predicts that the controller’s output is 0, when the control loop is a simple fixed virtual capacitor with inertial control, and when the threshold is reached, the output U(k) is calculated.
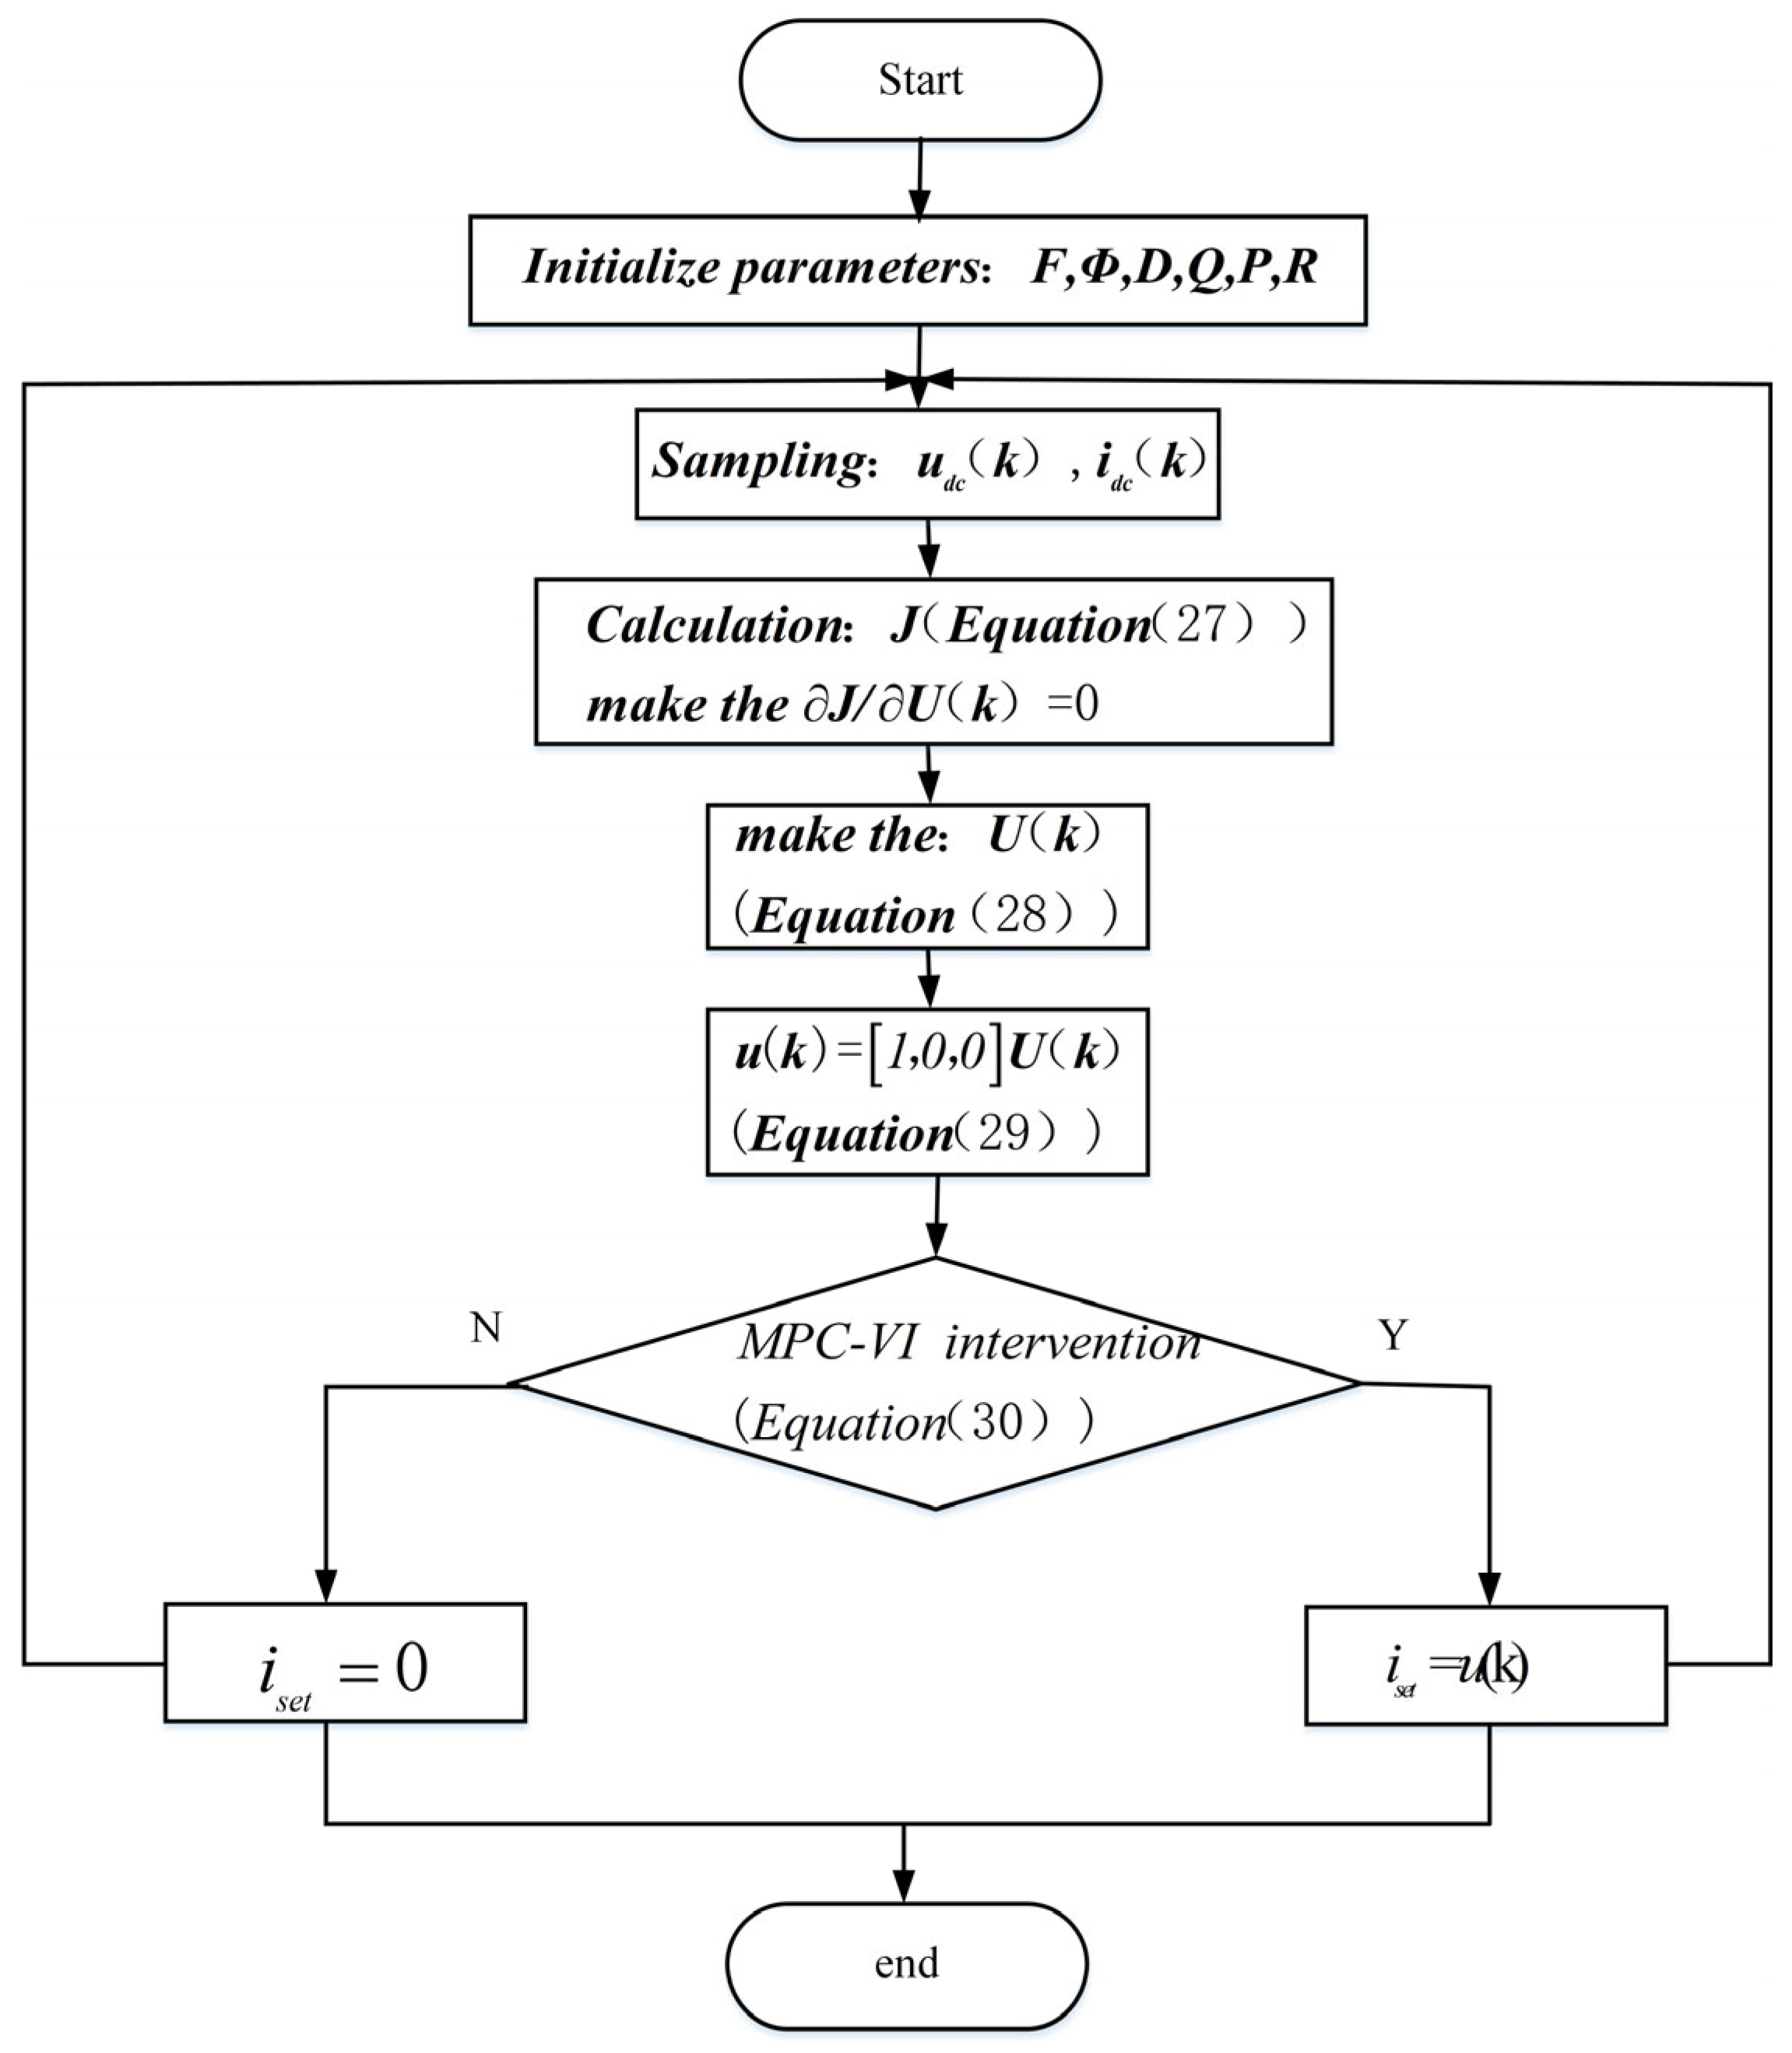
Figure 9 shows the flow chart of MPC-VI control strategy:

4. Simulation Analysis

To evaluate the effectiveness of the proposed method, simulations were conducted in the 2018 Version of MATLAB/Simulink environment. The proposed approach was compared with two alternative control strategies: a conventional double closed-loop voltage and current control without virtual inertia, and an additional inertial control method using two different fixed virtual capacitance values (set to 10 and 50 times the value used in the MPC-VI control). Table 1 presents the control parameters for the MPC-VI strategy. In this study, the virtual capacitance under MPC-VI control was set to 1 mF, while the fixed virtual capacitance values were configured as 0.01 F and 0.05 F, respectively. Table 2 lists the parameters of other components within the system. To ensure a clear comparison, both the photovoltaic unit and the grid-connected unit were operated at full power, supplying the DC microgrid. The initial load power was set to 33 kW, resulting in an excess of power in the system. Consequently, the energy storage unit converter initially operated in Buck mode.

4.1. Step Response Simulation Comparison

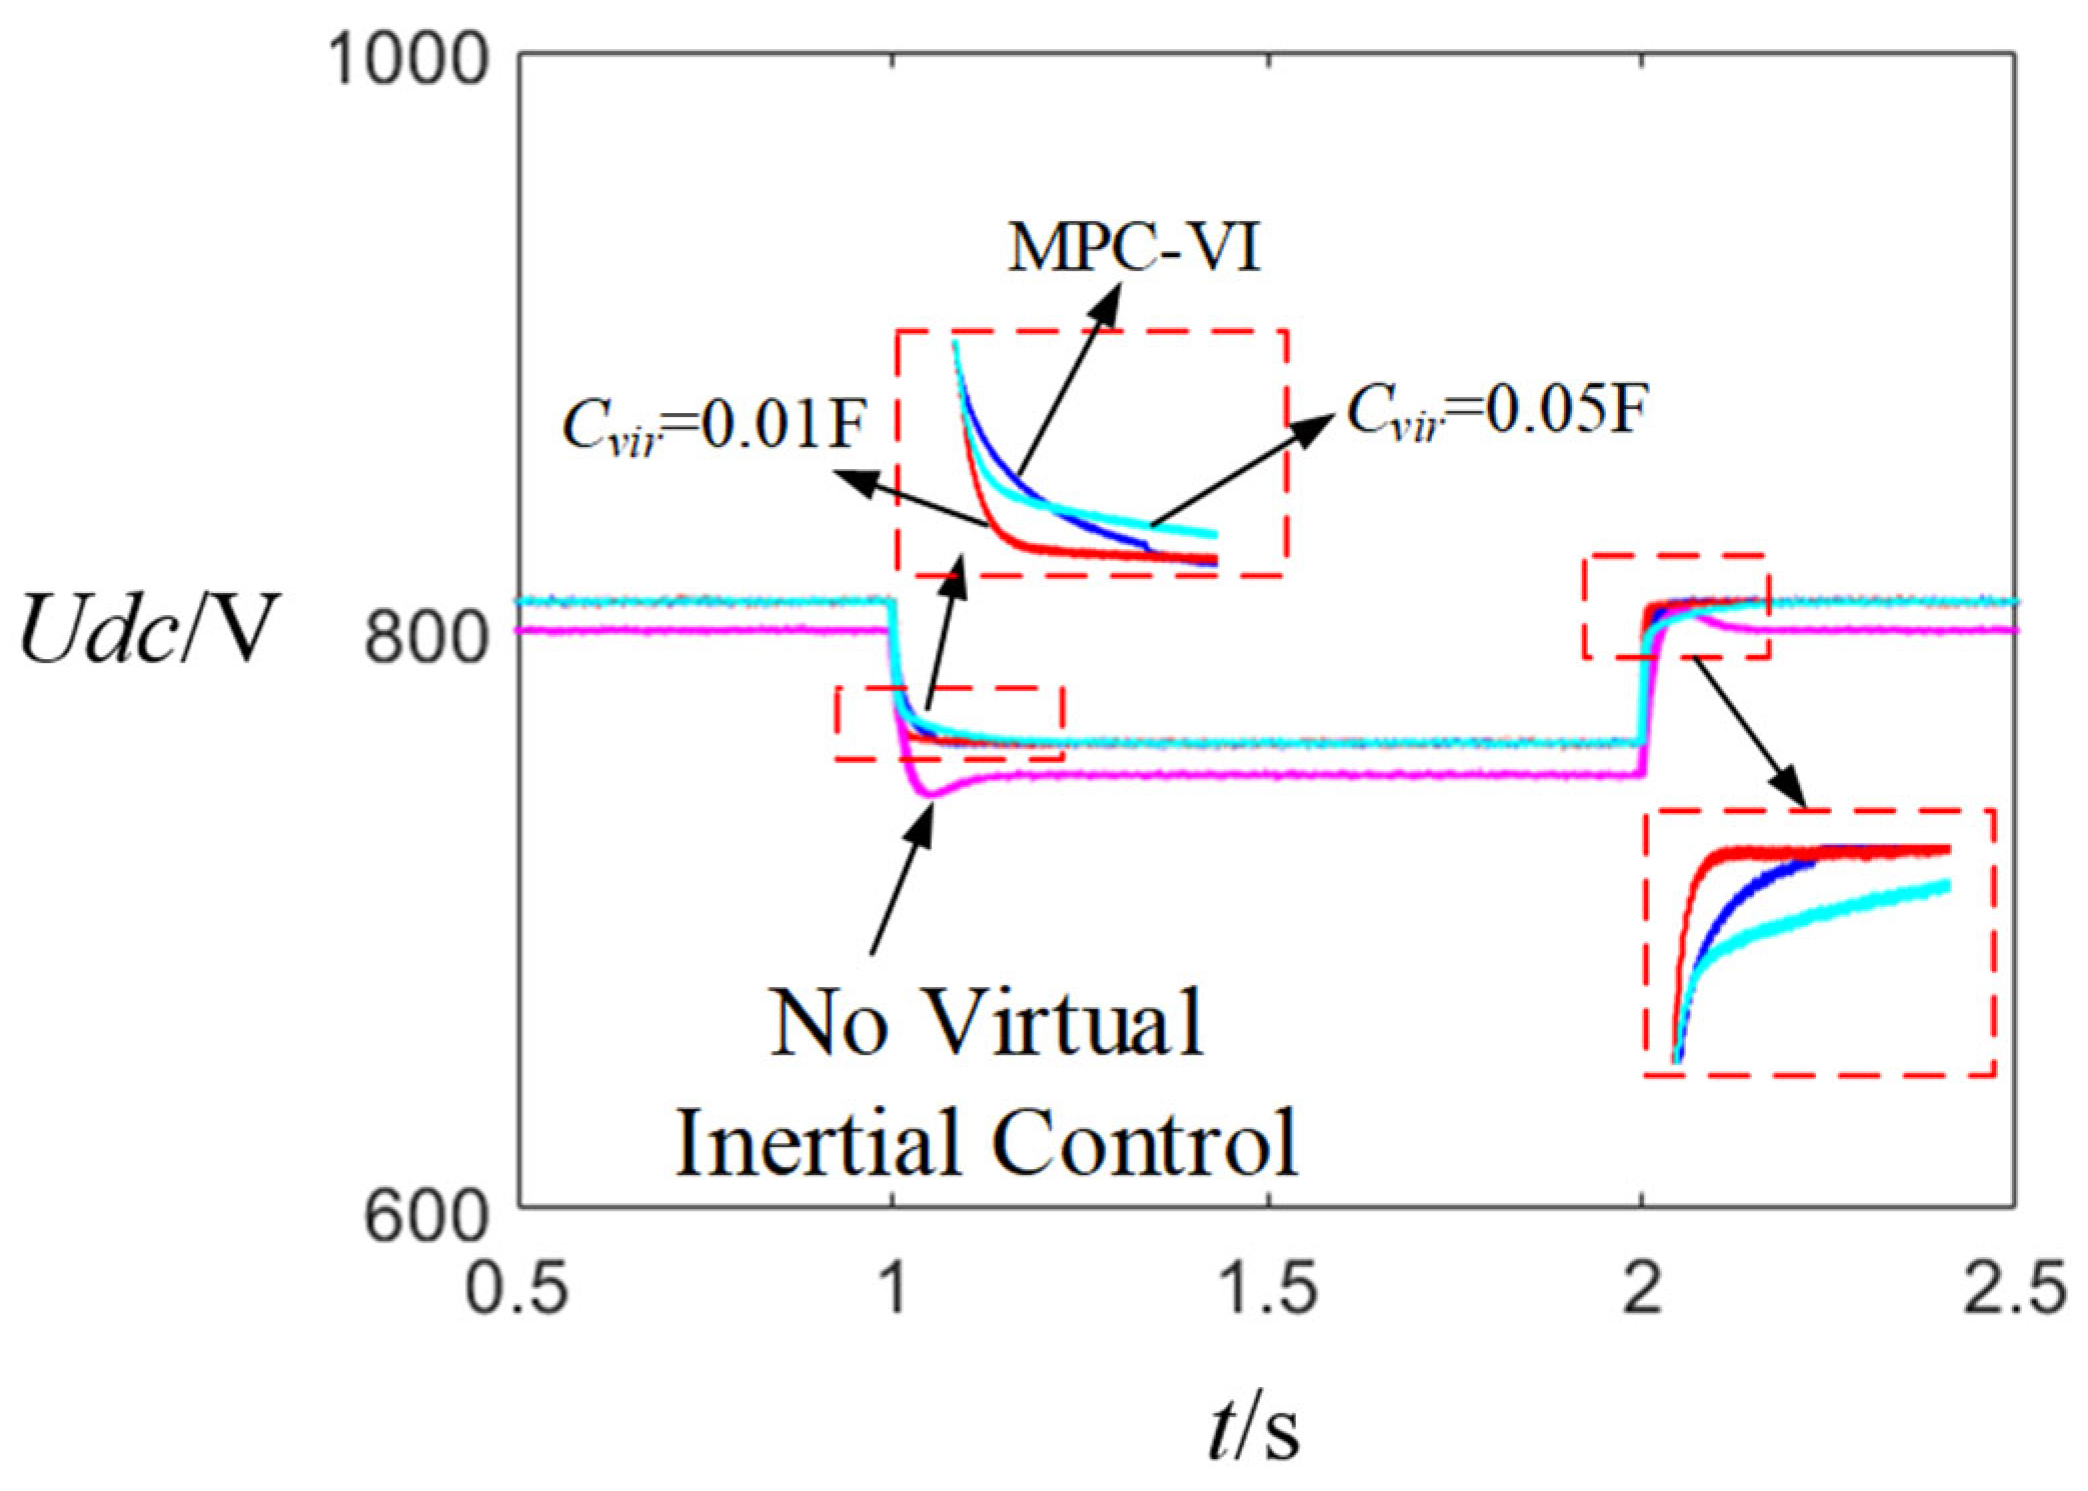
Figure 10 shows the step response to the wave shape.
As shown in Figure 10, when the reference value increases or decreases, the DC bus voltage under the non-virtual inertia control exhibits significant overshoot and undershoot, indicating low system inertia. In contrast, the DC bus voltage under MPC-VI control changes most gradually at the initial stage, yet it recovers to the new steady state more quickly than under the large fixed virtual capacitance control, thereby avoiding the issue of excessively long transient time associated with a large, fixed capacitor. When the reference value increases, the MPC-VI response is slower than that under the small fixed virtual capacitance control, but faster than under the large virtual capacitance value. This demonstrates the ability of MPC-VI to provide appropriate system inertia while avoiding an extended recovery time during the later phase of the dynamic response.

4.2. Load Mutation Simulation Comparison

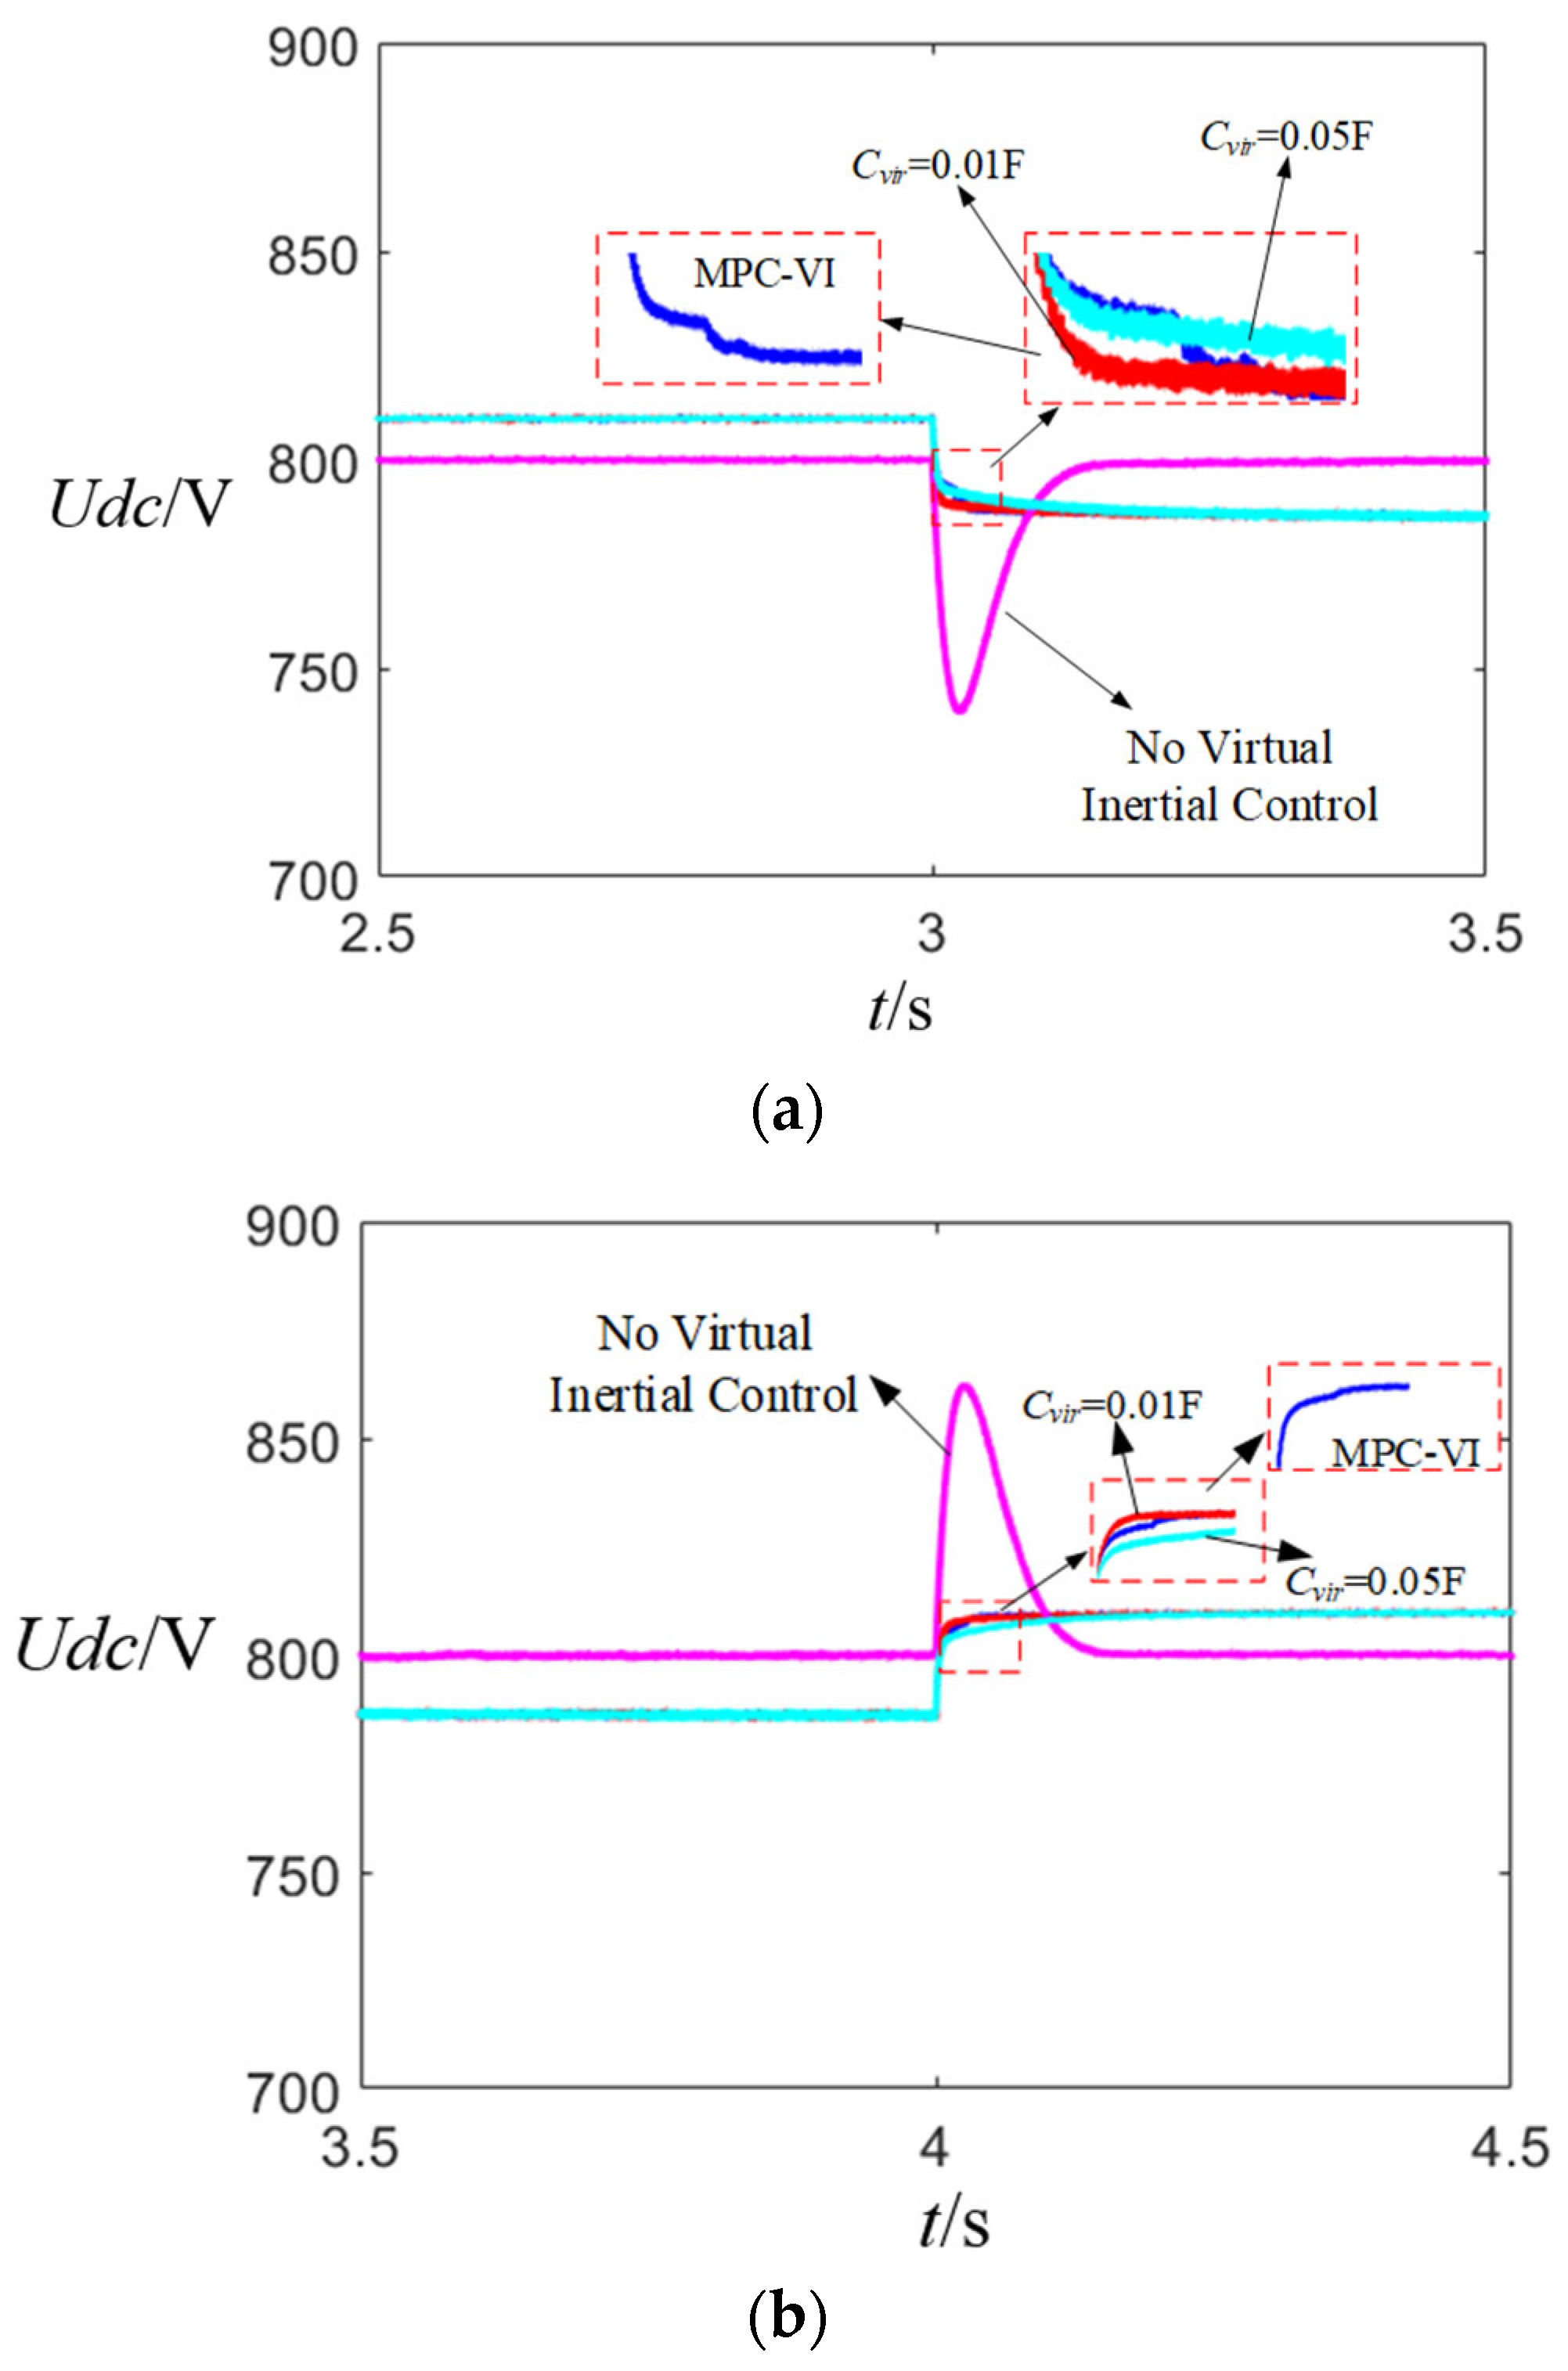
As shown in Figure 11, regardless of whether the load increases or decreases, the DC bus voltage exhibits significant fluctuations in the absence of virtual inertia control. Under MPC-VI control, the DC bus voltage demonstrates increased inertia compared to the case with a smaller fixed virtual capacitor, while achieving a shorter recovery time than that with a larger fixed virtual capacitor. A comparison of the step response under both load increase and decrease conditions confirms that the MPC-VI control is more effective in suppressing DC bus voltage fluctuations during voltage dips than during voltage rises.
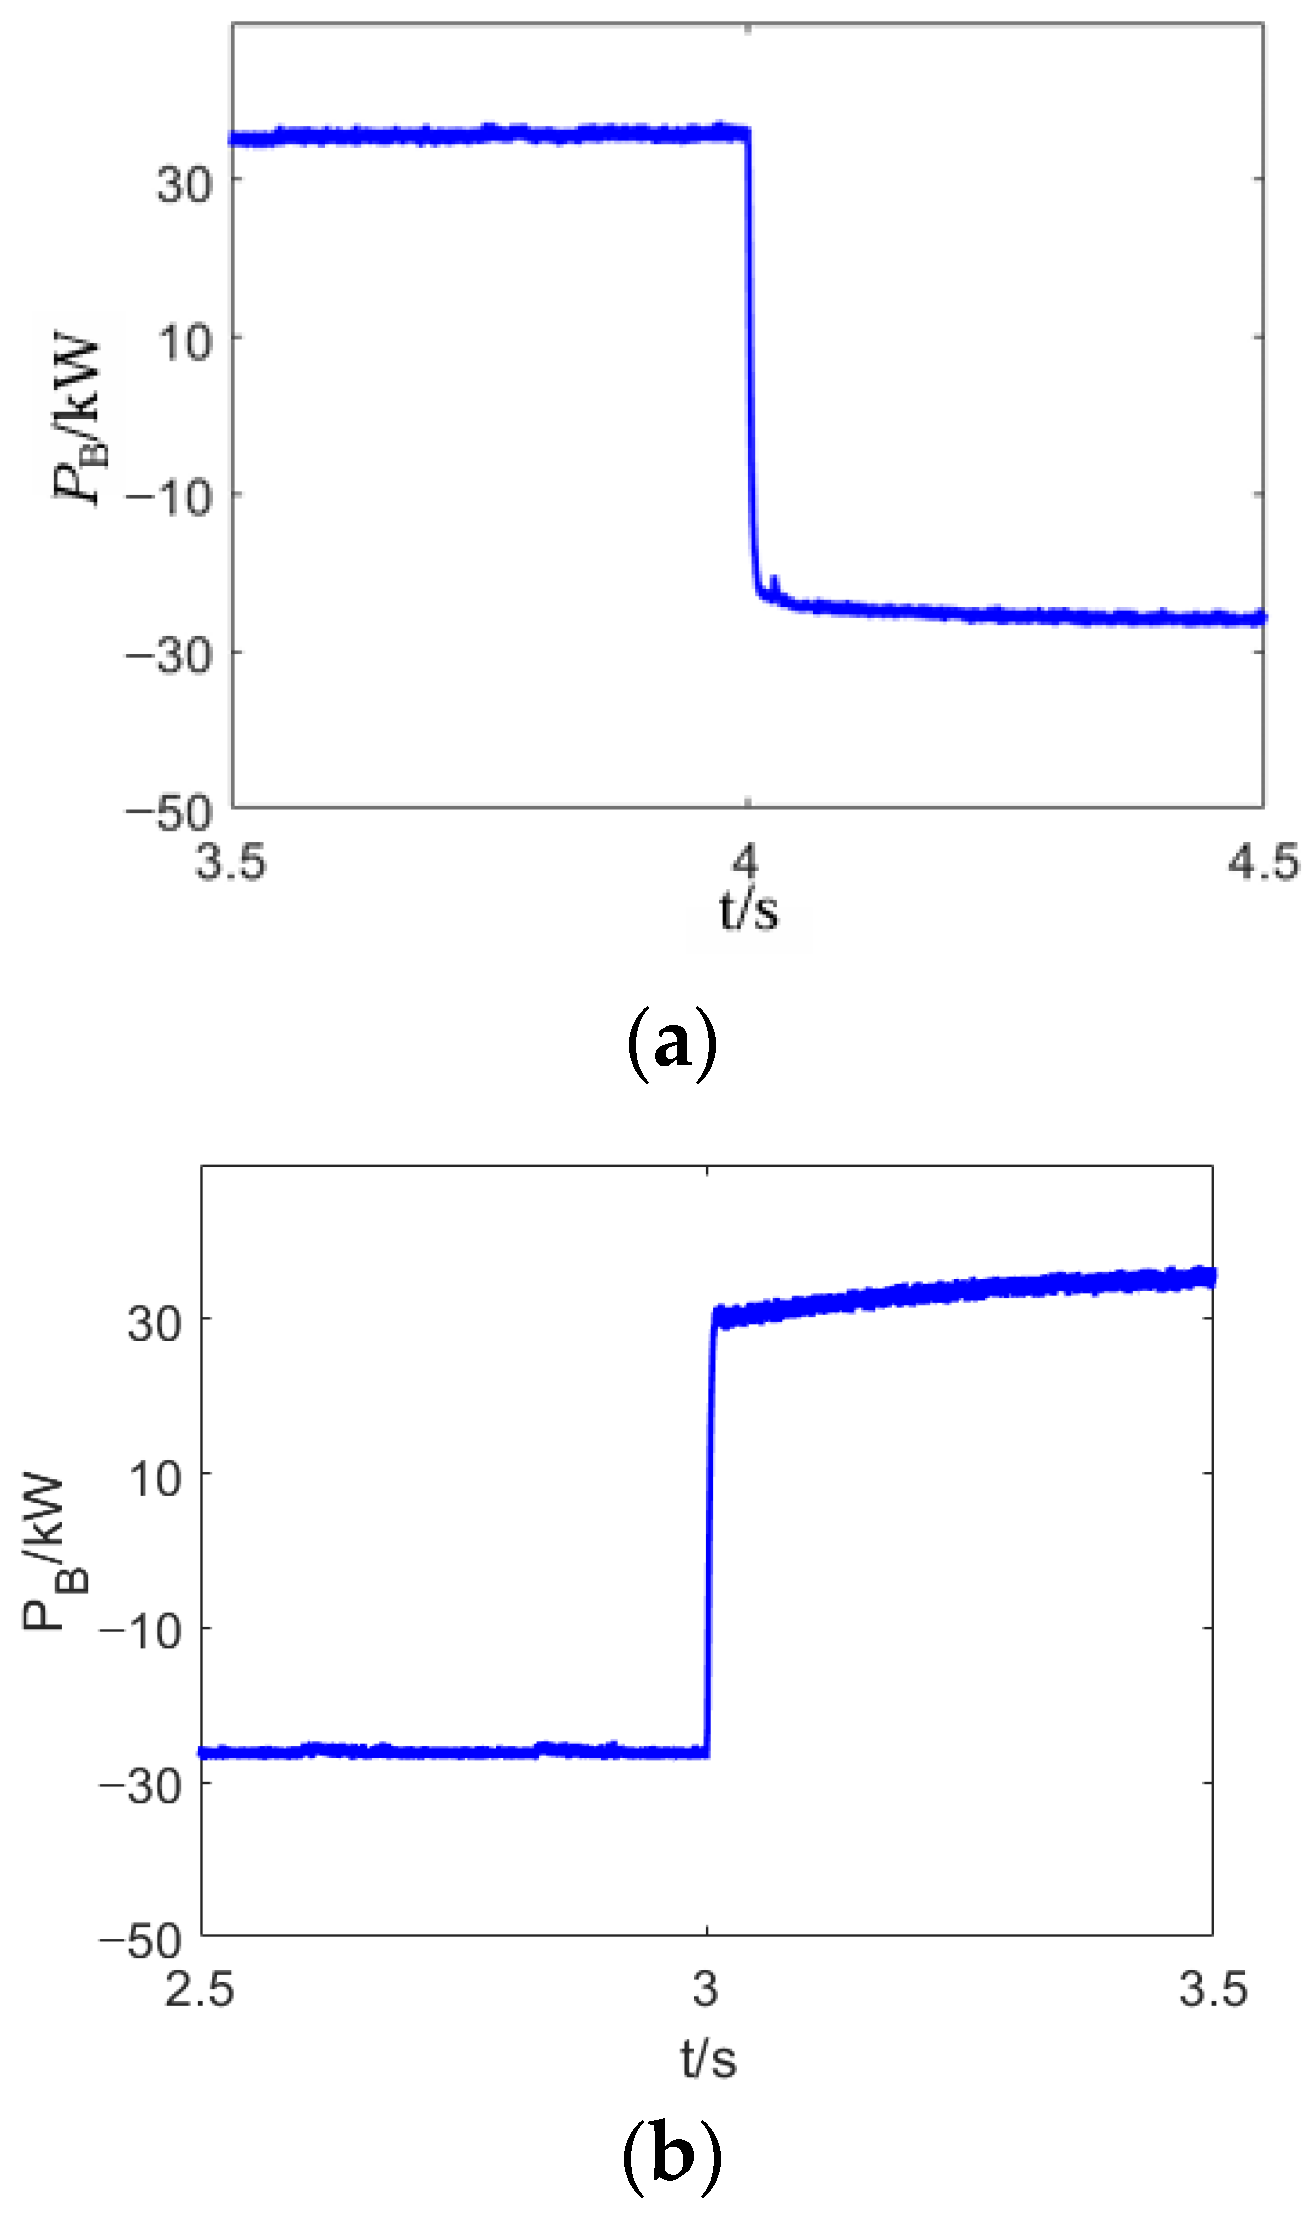
As can be seen from Figure 12, when the load changes, the energy storage converter under the control of MPC-VI can make the power of the battery change rapidly, suppress the power fluctuations, and thus suppress the DC bus voltage fluctuations.
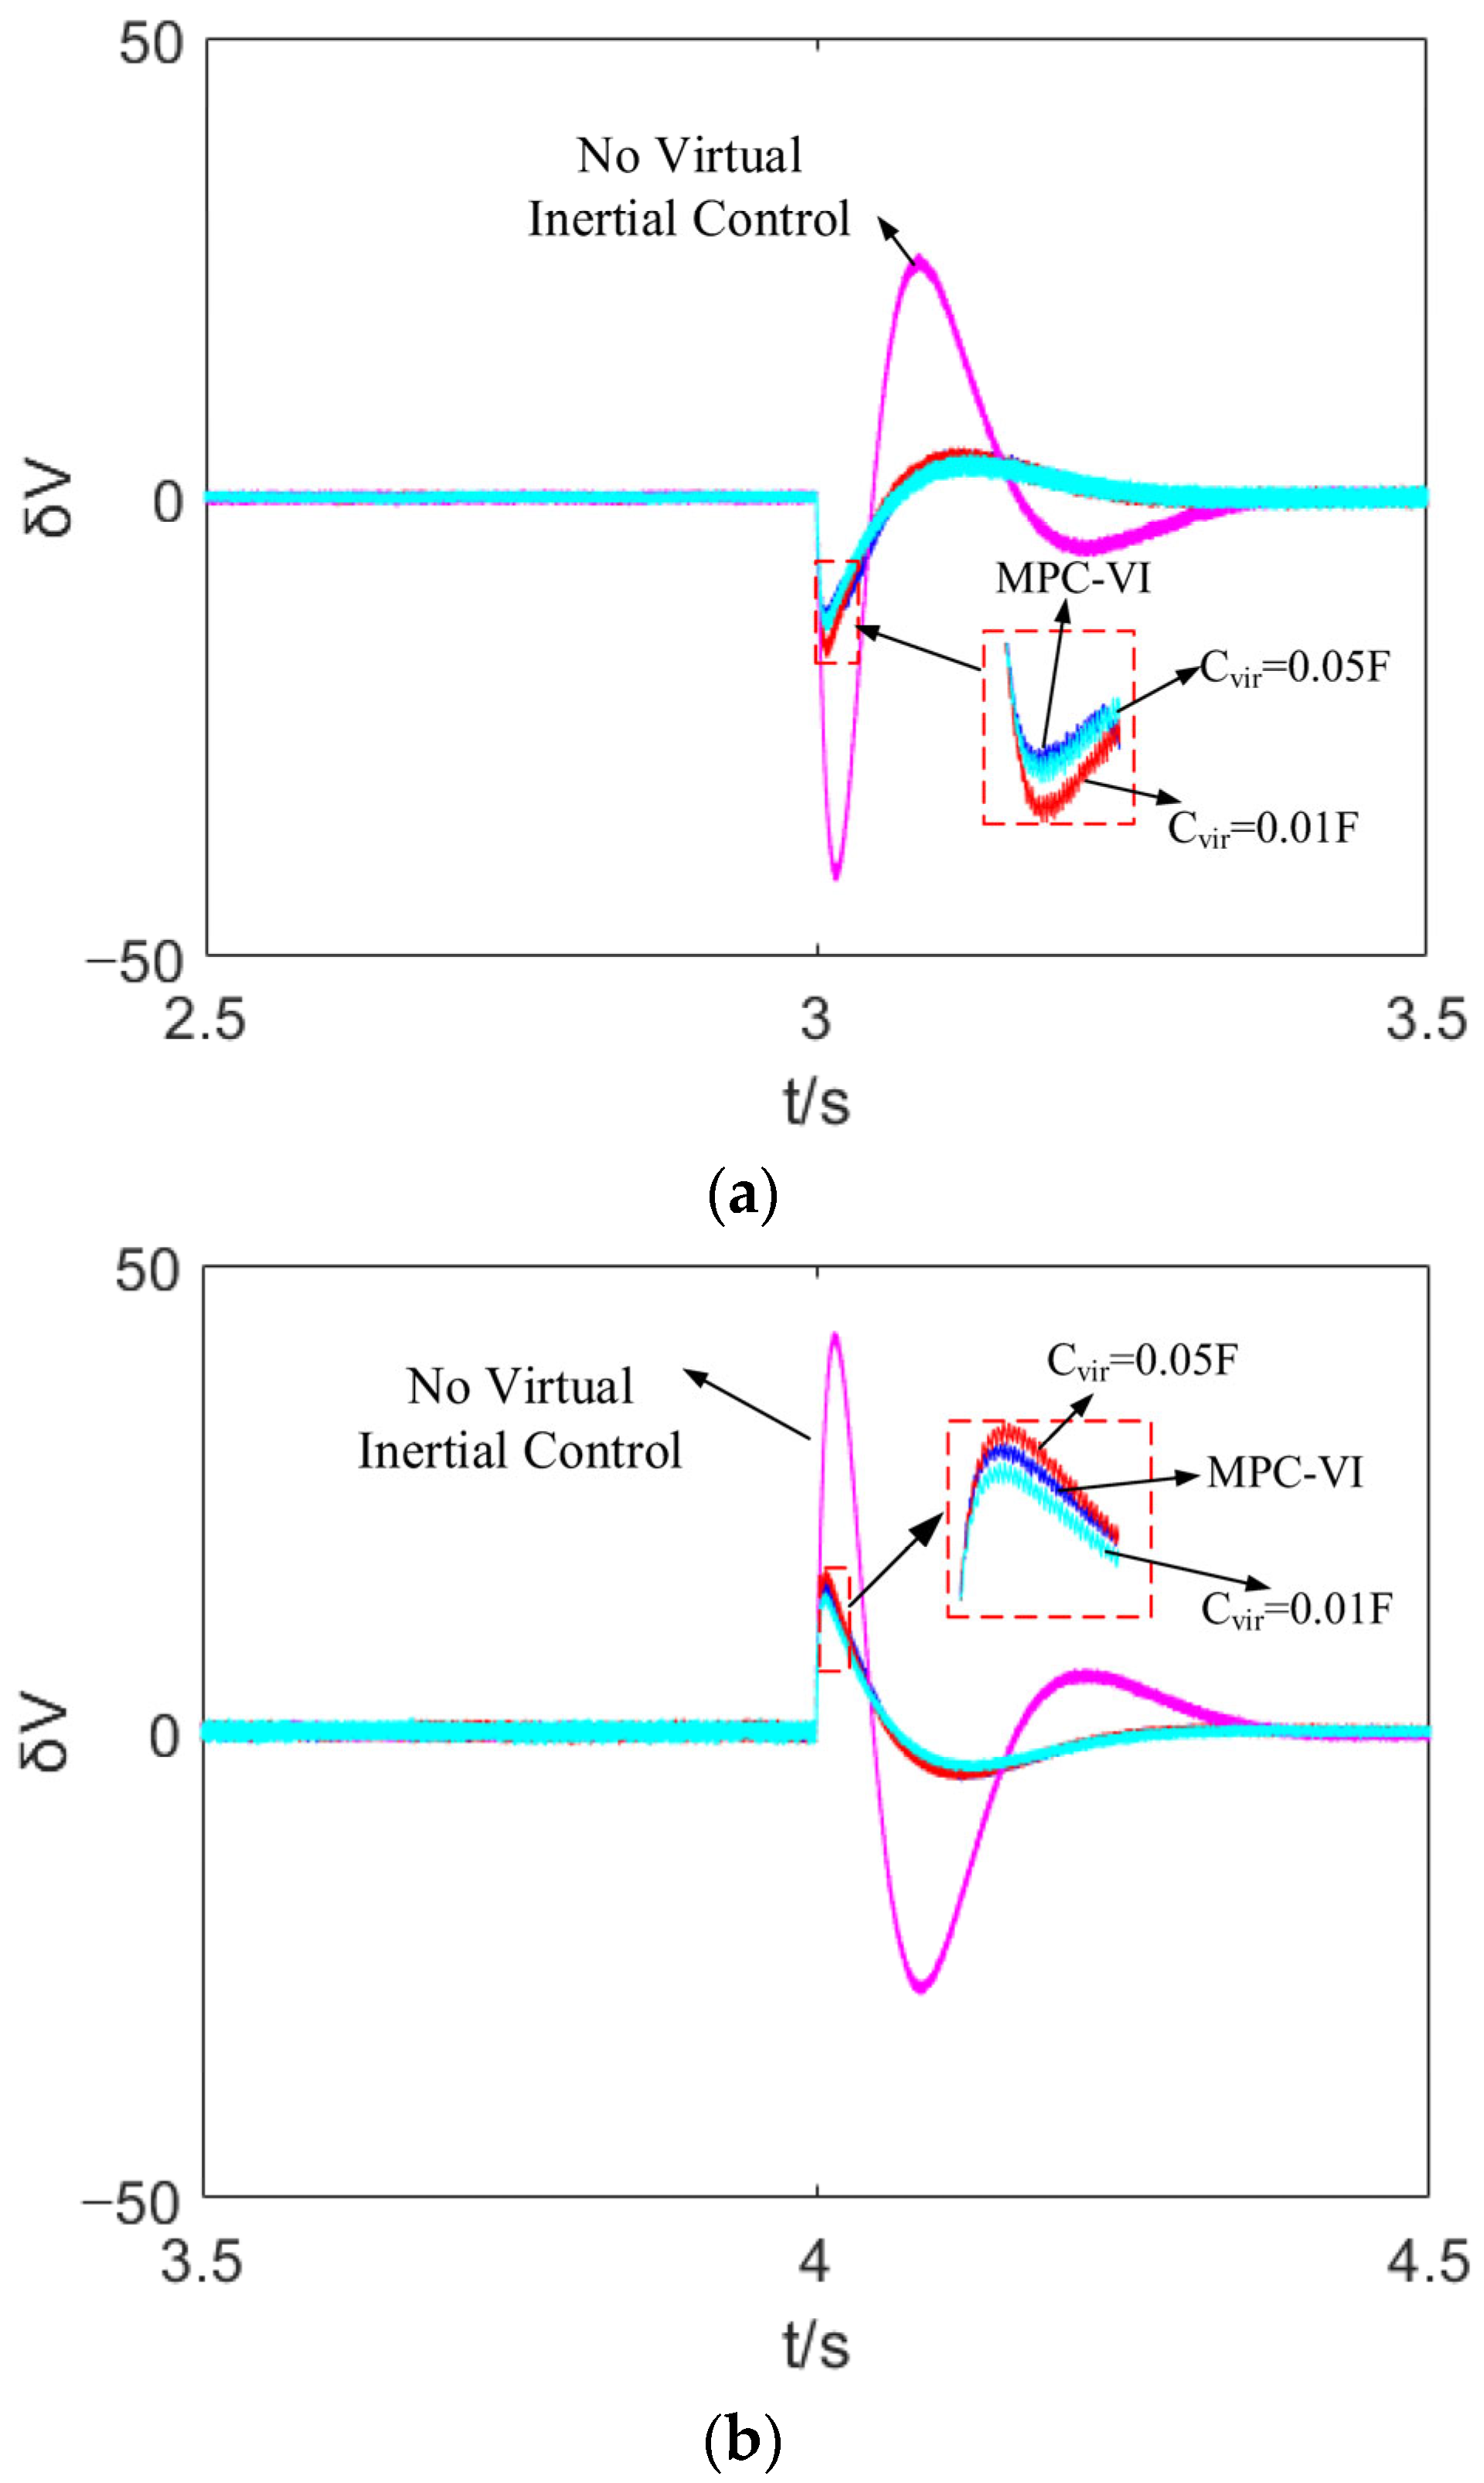
Based on Figure 13, the MPC-VI control effectively suppresses high-frequency components in the initial segment following a sudden load increase, while also accelerating the steady-state recovery in the later stage through the threshold mechanism. In the case of a sudden load reduction, the high-frequency component under MPC-VI control remains smaller than that under a small fixed virtual capacitor.
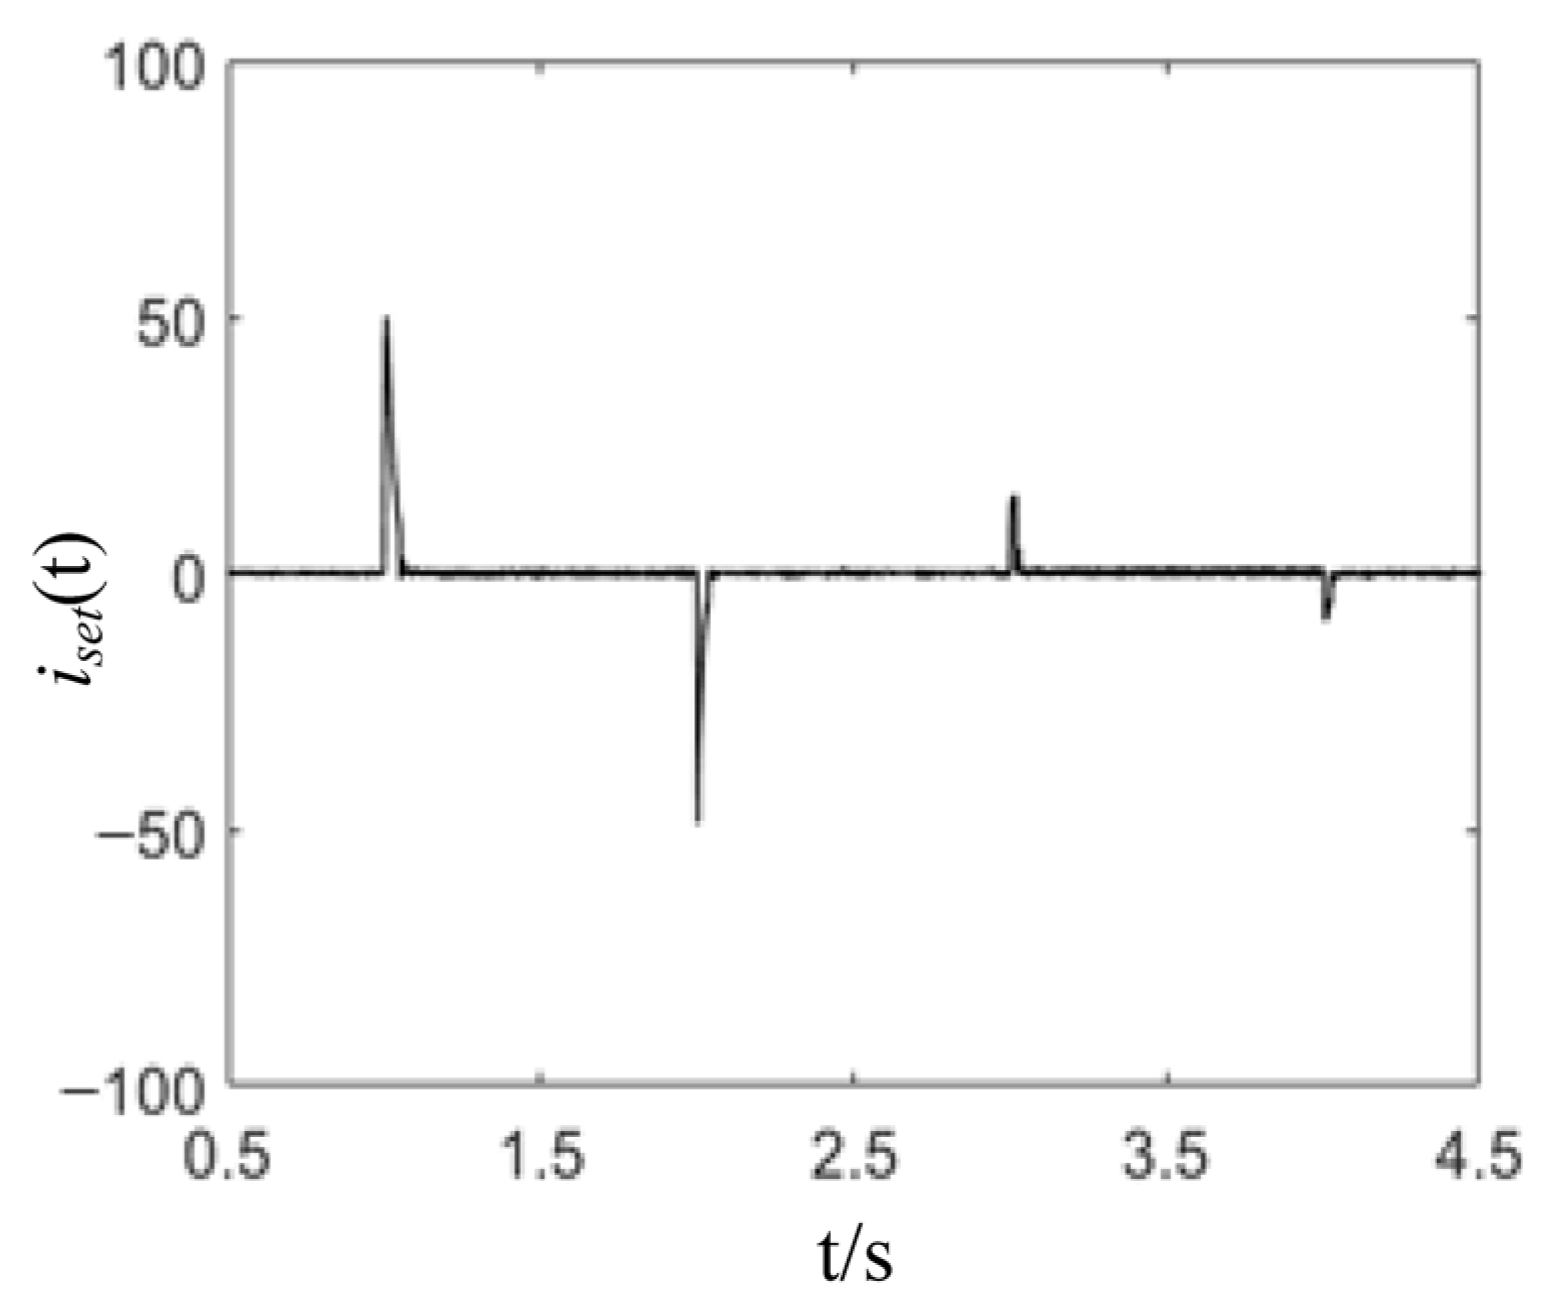
As shown in Figure 14, the waveform of i s e t ( t ) is derived from the model predictive control under both step response and load mutation conditions. It can be observed that when a disturbance occurs within the system, a value opposing the DC bus voltage fluctuation is introduced into the current inner loop, thereby inhibiting the voltage fluctuation and, as a result, increasing the system inertia.

5. Experimental Verification

5.1. Experimental Platform Construction

To further verify the effectiveness of the proposed control method, a bidirectional Buck/Boost converter hardware platform was constructed and compared with the additional virtual inertia control ( C v i r = 500   μ F ) of the fixed capacitor with double closed-loop control of voltage and current without virtual inertia. The DSP uses the TMS320F28335 from TI Company as the main control chip (Mansfield, TX, USA).
Parameters of the main circuit are shown in Table 3:
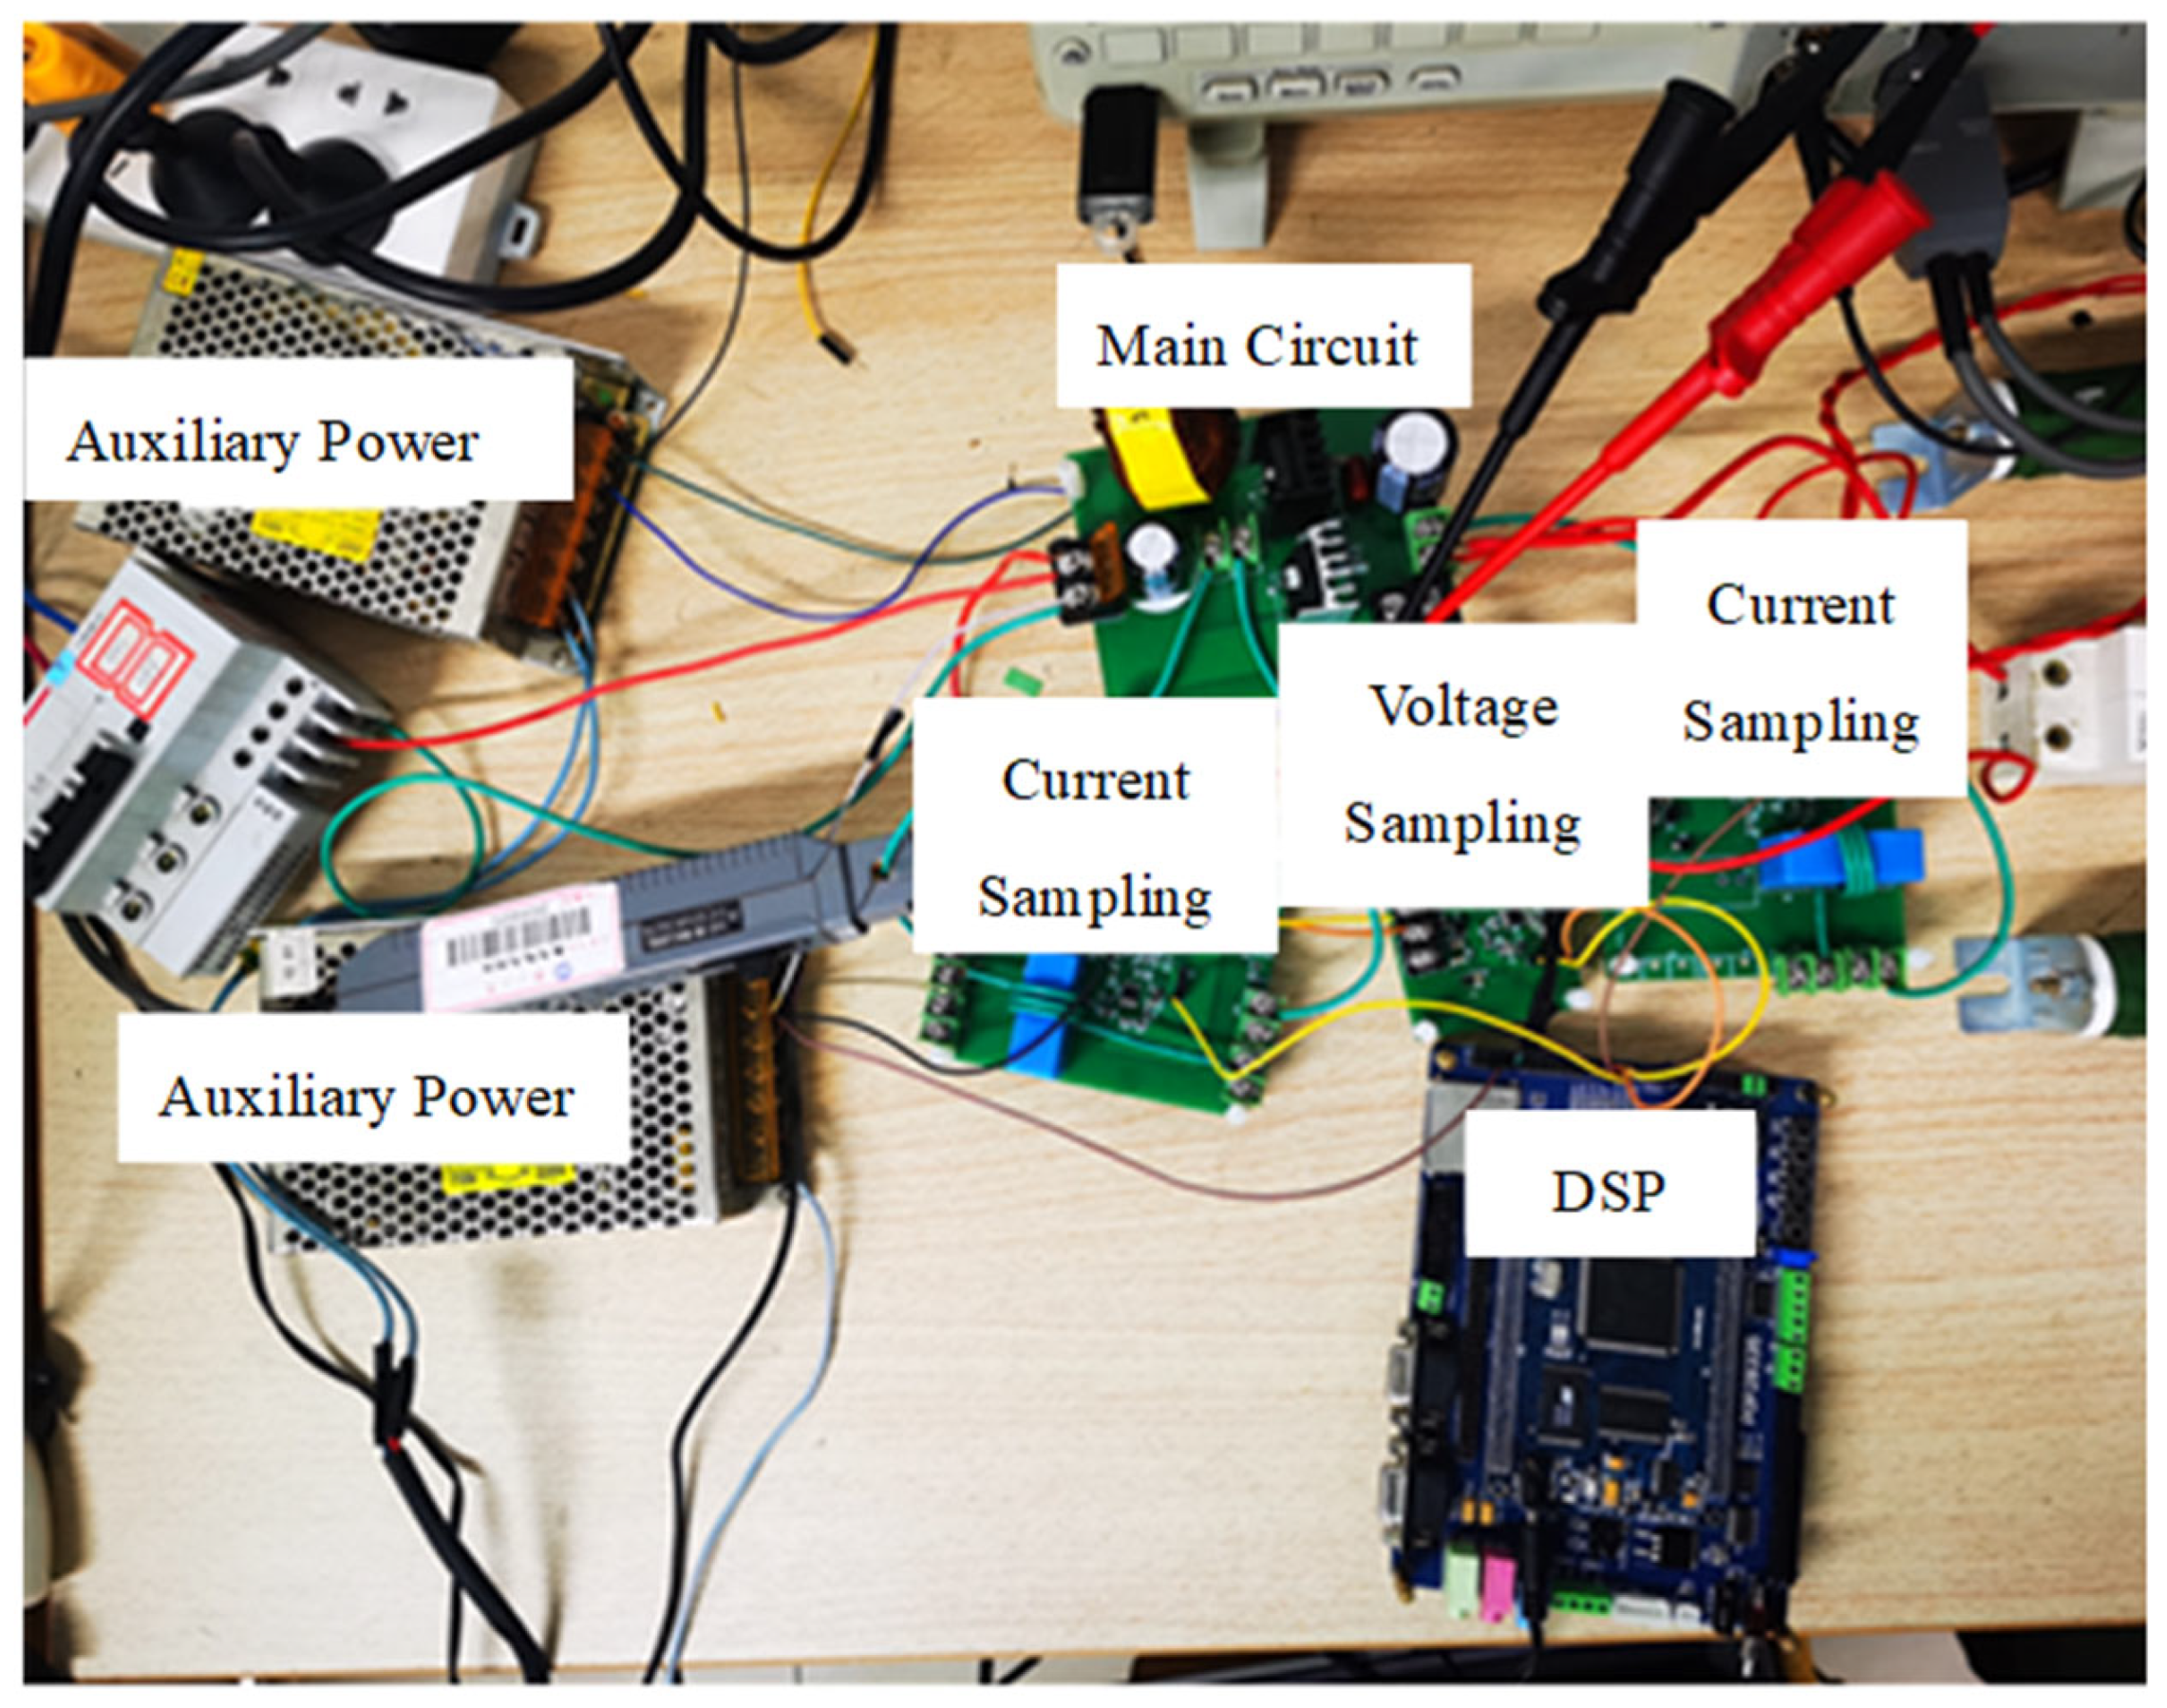
Figure 15 is the main part of the experimental platform, and the experimental control parameters are shown in Table 4.

5.2. Stability and Dynamic Performance Test

5.2.1. Step Response Comparison

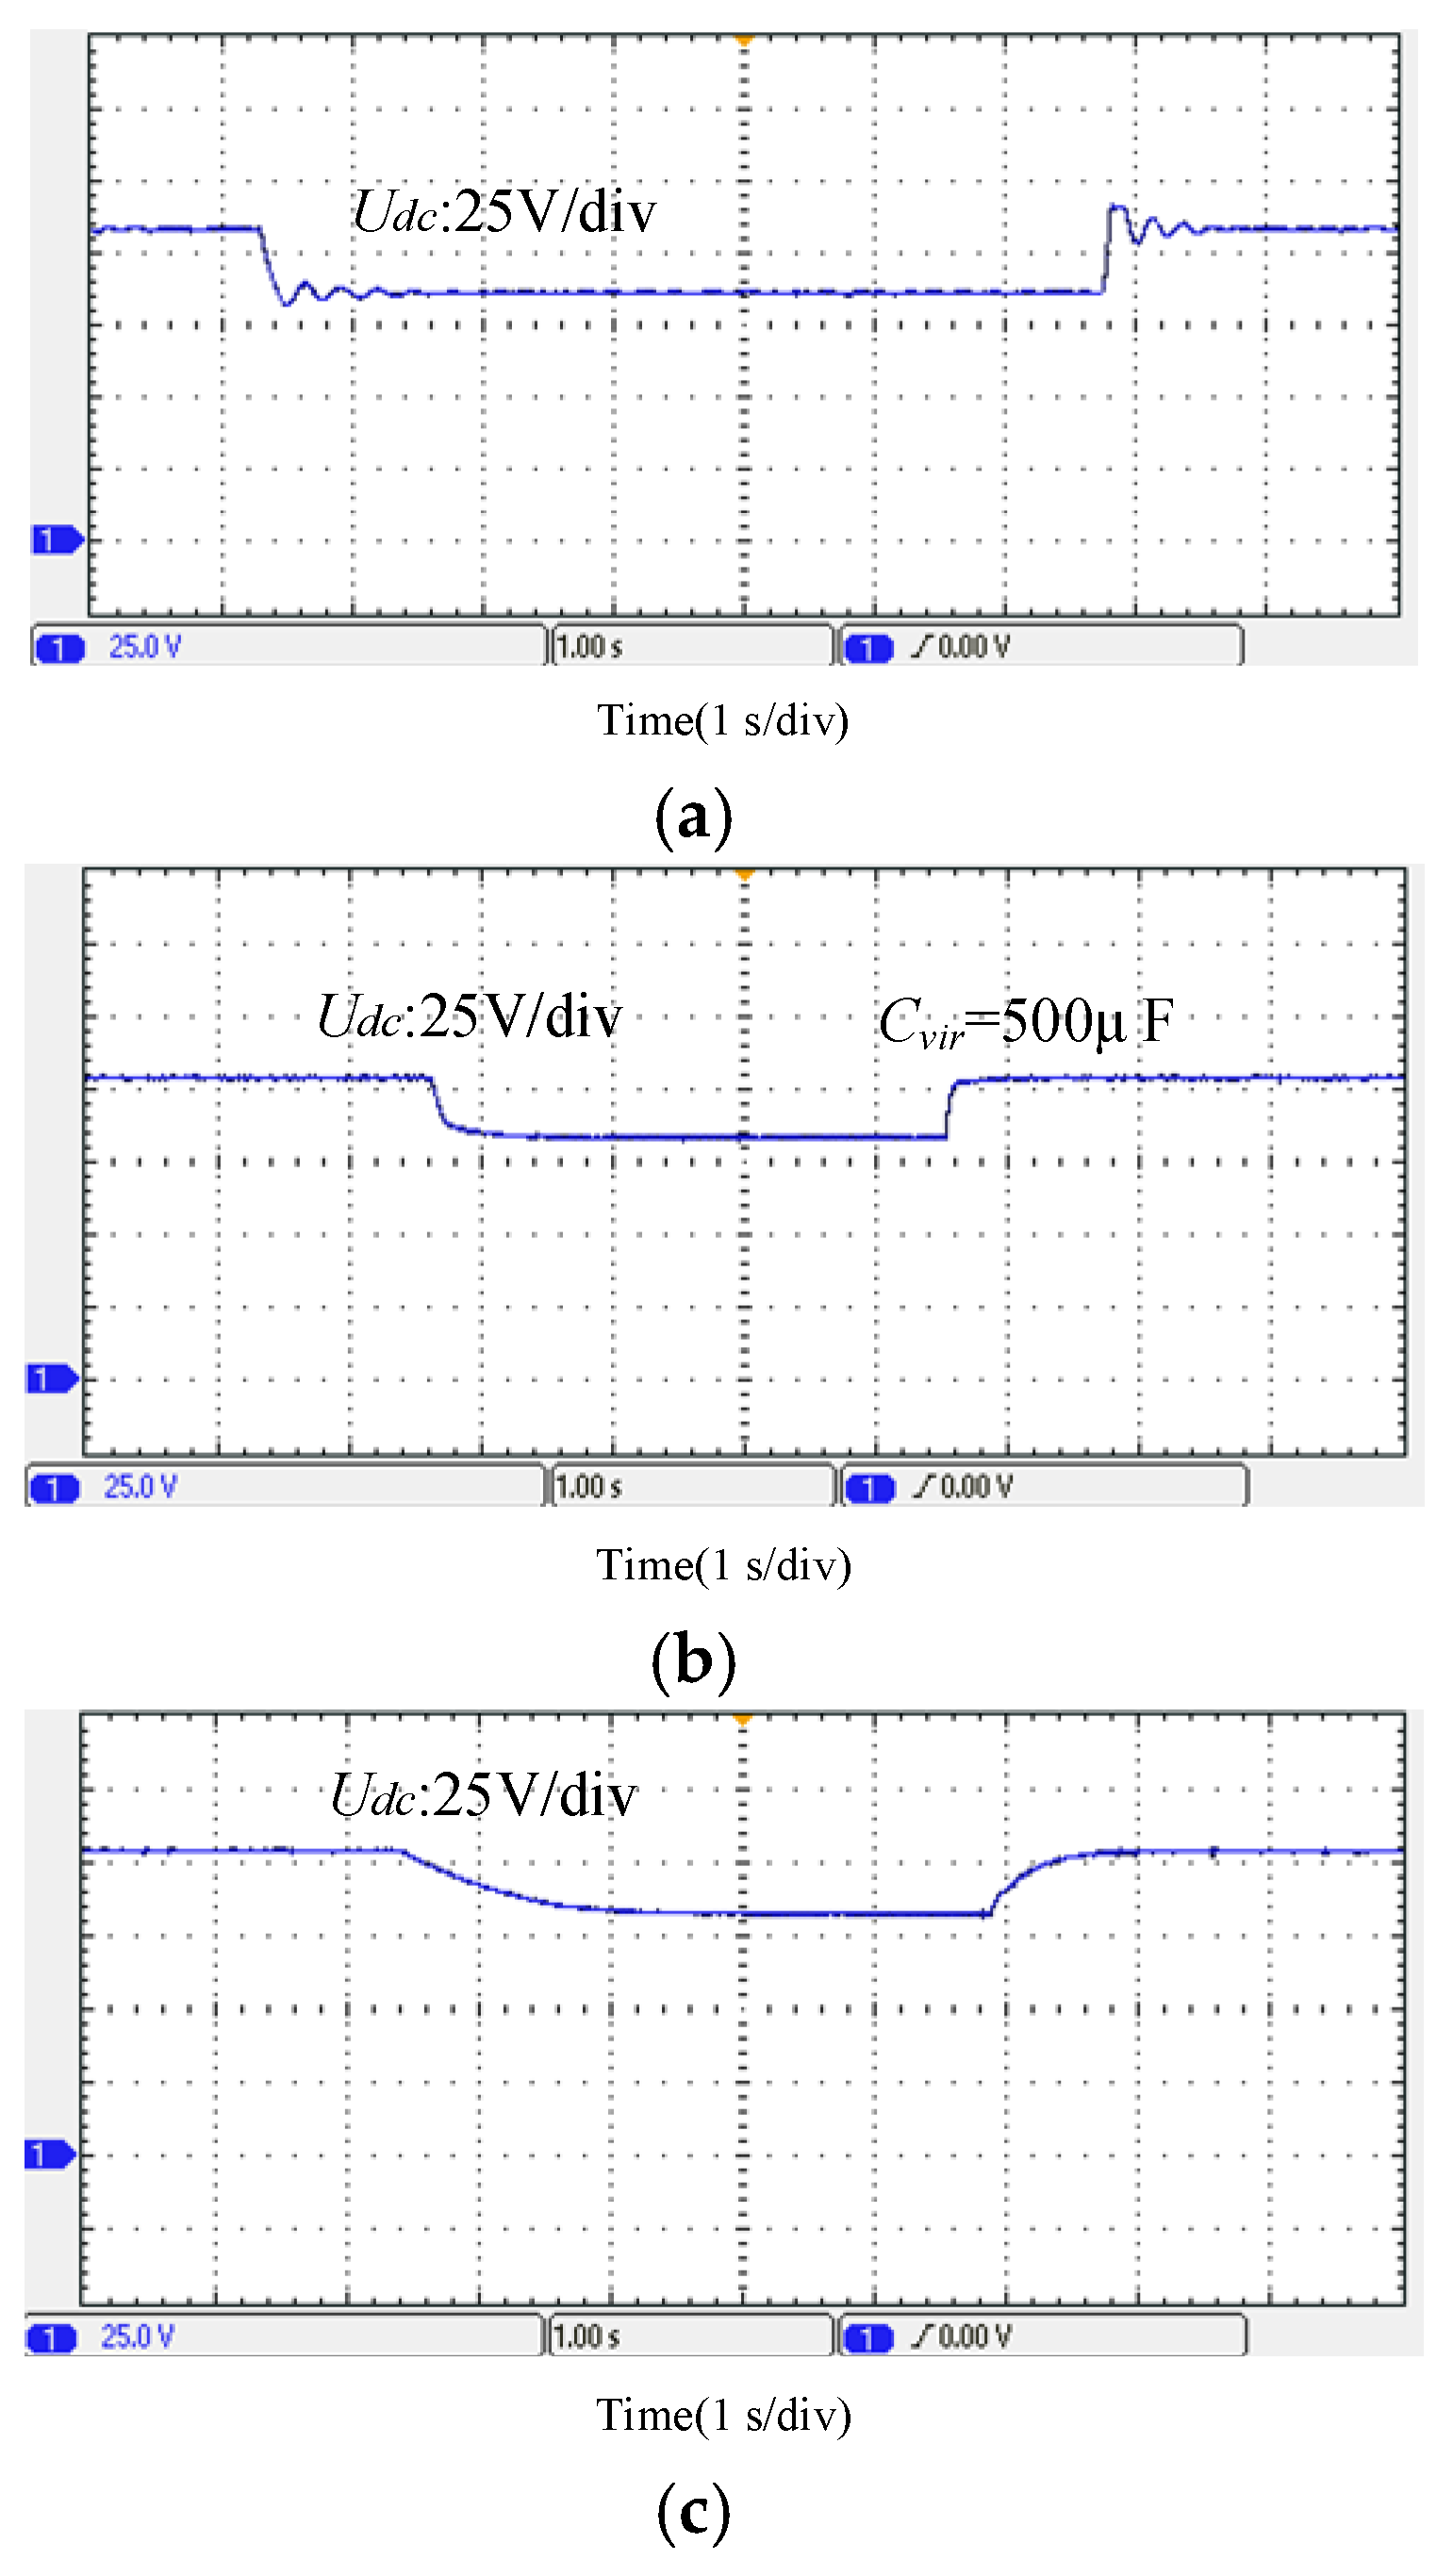
A comparative analysis of the MPC-VI control algorithm was conducted against both the virtual inertia-free double-loop control and an additional virtual inertia control method. As presented in Figure 16a, the high-voltage side waveform under double-loop control displays the most pronounced oscillations and sustains significant fluctuations before returning to the steady state, consequently leading to a poor inertia effect. Although the additional virtual inertia control, shown in Figure 16b, achieves some suppression of voltage fluctuations, its initial voltage slope is notably steep when the reference value changes, thus failing to provide ideal inertia. Conversely, Figure 16c reveals that the MPC-VI control yields the gentlest voltage variation, with a markedly decreased slope at the instant of the disturbance, which confirms a considerable reinforcement of the system’s inertia at the initial stage.

5.2.2. Load Mutation Response Comparison

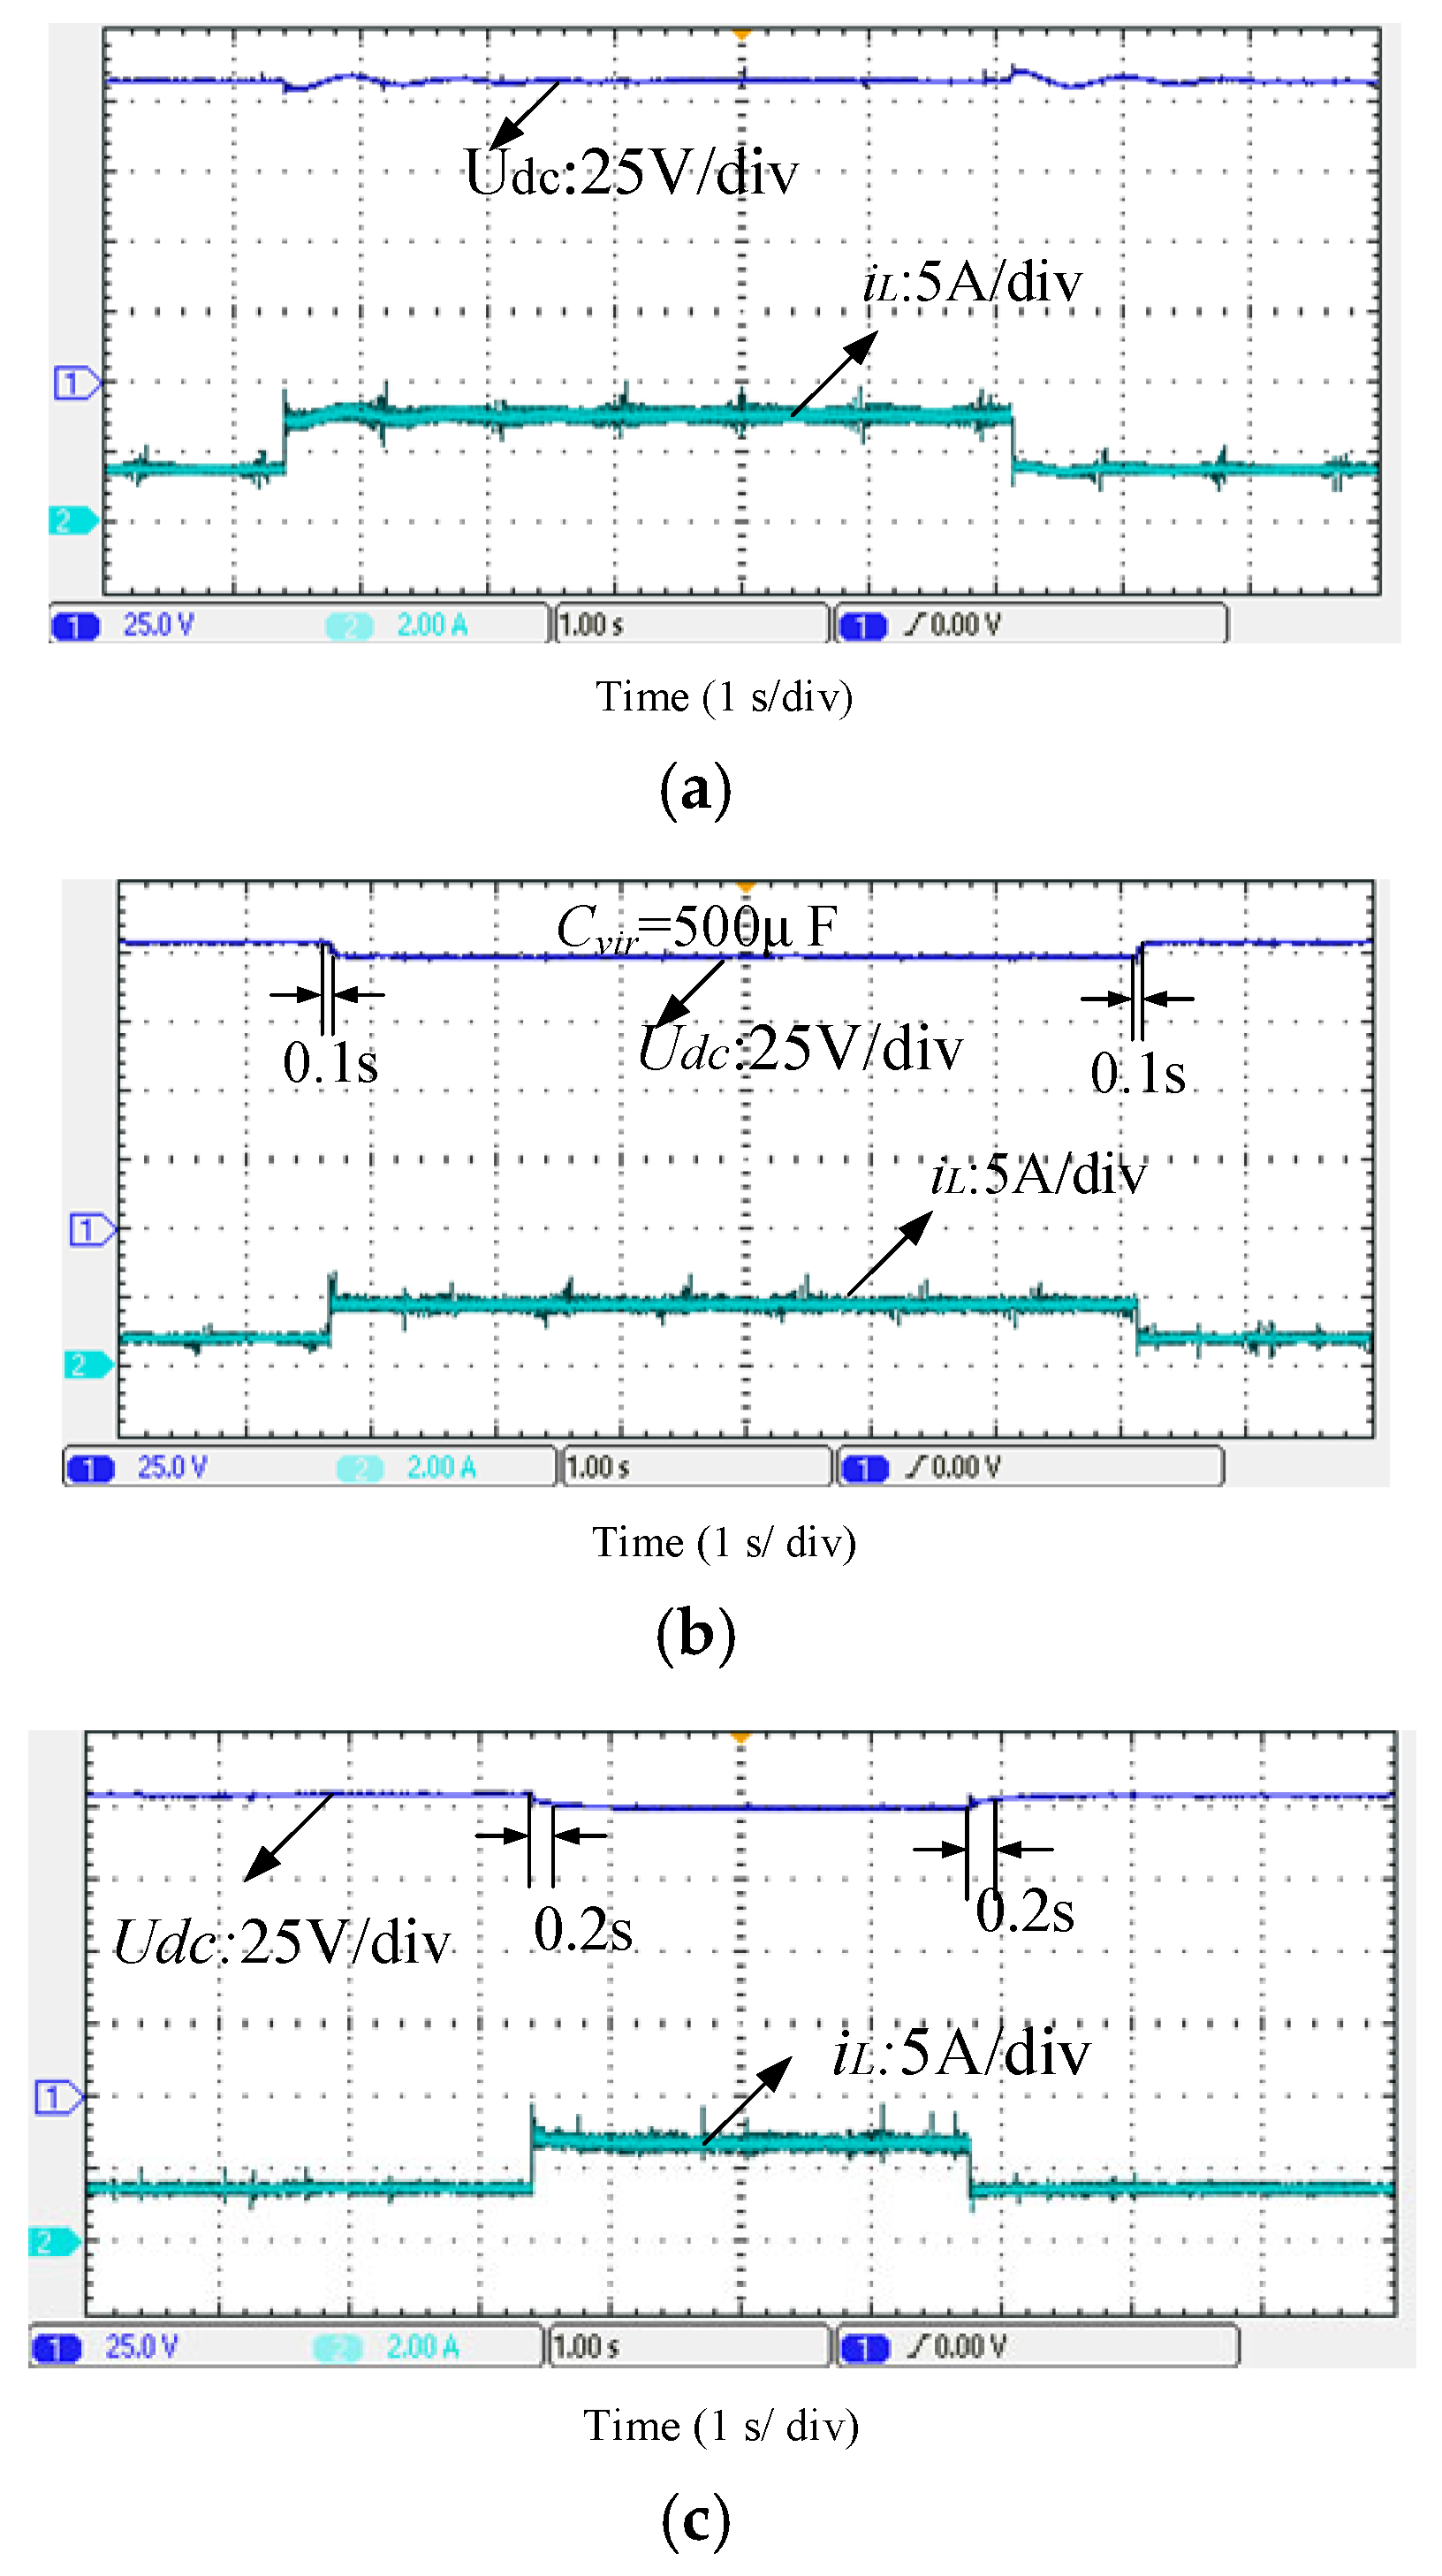
As shown in Figure 17a, the voltage waveform under the conventional voltage and current double-loop control exhibits severe fluctuations and a prolonged recovery time to steady state. The inductor current responds sluggishly, resulting in poor suppression of power oscillations. From Figure 17b, it can be observed that under additional virtual inertia control, the voltage initially changes abruptly with a large slope during load disturbances; however, the system rapidly settles to a new steady state after both load application and removal. In contrast, Figure 17c demonstrates that the MPC-VI control effectively suppresses initial voltage oscillations when the high-voltage side is subjected to load disturbances. This significantly reduces the rate of voltage change during both rising and falling transitions. Moreover, the inductor current responds rapidly, power fluctuations are quickly restrained, and voltage variations are minimized, collectively enhancing both the system inertia and power quality.

6. Conclusions

Due to the fast response of power electronic converters and the inherently low inertia of such systems, voltage transients tend to occur under external disturbances. While conventional additional virtual inertia control offers limited improvement in dynamic performance, this study analyzes its effect by establishing a small-signal model of the energy storage converter under this strategy. A pole-zero distribution diagram under different virtual capacitance values is plotted, revealing that although a large virtual capacitance can slow down the dynamic response, it also reduces converter stability while improving certain aspects of system performance.
Leveraging the advantage of model predictive control (MPC) in enabling real-time online computation, this paper proposes an MPC-based virtual inertia (MPC-VI) optimization control strategy for the bidirectional Buck/Boost converter. Using a virtual inertia equation as the prediction model, the method predicts the optimal reference current and adjusts the battery power in a timely manner to suppress voltage fluctuations. By introducing a threshold equation, the recovery time to a new steady-state value is shortened, thereby improving the system’s dynamic response time.
Simulations and experiments were conducted to compare the proposed MPC-VI strategy with both non-virtual inertia control and conventional fixed virtual capacitance methods. The results demonstrate that under MPC-VI control, the DC bus voltage is effectively suppressed at the early stage of fluctuations, without unduly prolonging the dynamic response time. In the future, multiple converters can be connected in parallel and a more practical DC microgrid experimental platform can be built to carry out more experimental verification in many aspects.

Author Contributions

G.Y.: Conceptualization, Methodology, Supervision, Writing—Review and Editing, Funding acquisition; Z.J.: Writing—Original Draft, Writing—Review and Editing, Visualization; X.S.: Writing—Review and Editing, Funding acquisition; S.L.: Conceptualization, Methodology, Software, Validation. All authors have read and agreed to the published version of the manuscript.

Funding

This research was funded by the Open Project of the Key Laboratory of Intelligent Operation of New Energy Power System of the Ministry of Education of China (KFKT-25LAB-05).

Data Availability Statement

The original contributions presented in this study are included in the article. Further inquiries can be directed to the corresponding author.

Conflicts of Interest

The authors declare no conflicts of interest.

References

  1. Zhu, X.; Li, Z.; Meng, F. Stability analysis of DC microgrid based on different grid structures. Trans. China Electrotech. Soc. 2021, 36, 166–178. [Google Scholar]
  2. Peng, Q.; Fang, J.; Yang, Y.; Liu, T.; Blaabjerg, F. Maximum virtual inertia from DC-link capacitors considering system stability at voltage control timescale. IEEE J. Emerg. Sel. Top. Circuits Syst. 2021, 11, 79–89. [Google Scholar] [CrossRef]
  3. Zhang, M.; Xu, Q.; Zhang, C.; Nordström, L.; Blaabjerg, F. Decentralized coordination and stabilization of hybrid energy storage systems in DC microgrids. IEEE Trans. Smart Grid 2022, 13, 1751–1761. [Google Scholar] [CrossRef]
  4. Lu, S.; Yu, T.; Liu, H.; Zhang, W.; Sui, Y.; Yang, J.; Zhang, L.; Zhou, J.; Wang, H. Research on Flexible Virtual Inertia Control Method Based on the Small Signal Model of DC Microgrid. Energies 2022, 15, 8360. [Google Scholar] [CrossRef]
  5. Lu, Z.; Sheng, W.; Liu, H.; Sun, L.; Wu, M.; Li, R. Application and challenge of virtual synchronous machine technology in power system. Proc. CSEE 2017, 37, 349–359. [Google Scholar]
  6. Zhi, N.; Ding, K.; Huang, Q.; Li, W.; Zhang, H. Control strategy of virtual DC motor based on P-U droop characteristic. Trans. China Electrotech. Soc. 2021, 36, 1238–1248. [Google Scholar]
  7. Jami, M.; Shafiee, Q.; Bevrani, H. Dynamic improvement of DC microgrids using a dual approach based on virtual inertia. J. Mod. Power Syst. Clean Energy 2020, 10, 667–677. [Google Scholar] [CrossRef]
  8. Wu, W.; Chen, Y.; Luo, A.; Zhou, L.; Zhou, X.; Yang, L. A virtual inertia control strategy for bidirectional grid connected converters in DC micro-grids. Proc. CSEE 2017, 37, 360–372. [Google Scholar]
  9. Meng, J.; Zou, P.; Wang, Y.; Wang, C. Small-signal modeling and parameter analysis of the DC microgrid based on flexible virtual inertia control. Trans. China Electrotech. Soc. 2019, 34, 2615–2626. [Google Scholar]
  10. Zhao, S.; Wang, H.; Tian, N.; Meng, J.; Wang, C.; Tian, Y. Model predictive control based DC microgrid virtual inertia optimal method. Trans. China Electrotech. Soc. 2023, 38, 3264–3276. [Google Scholar]
  11. Long, B.; Zeng, W.; Rodriguez, J.; Guerrero, J.M.; Chong, K.T. Voltage regulation enhancement of DC-MG based on power accumulator battery test system: MPC-controlled virtual inertia approach. IEEE Trans. Smart Grid 2021, 13, 71–81. [Google Scholar] [CrossRef]
  12. Zhu, X.; Hou, S.; Li, Z. Voltage Dynamic Response Optimization of DC Microgrid Based on Model Predictive Control. Power Grid Technol. 2020, 44, 2187–2195. [Google Scholar]
  13. Zhi, N.; Zhang, H.; Xiao, X.; Yang, J. System-level stability analysis of DC microgrid with distributed control strategy. Proc. CSEE 2016, 36, 368–378. [Google Scholar]
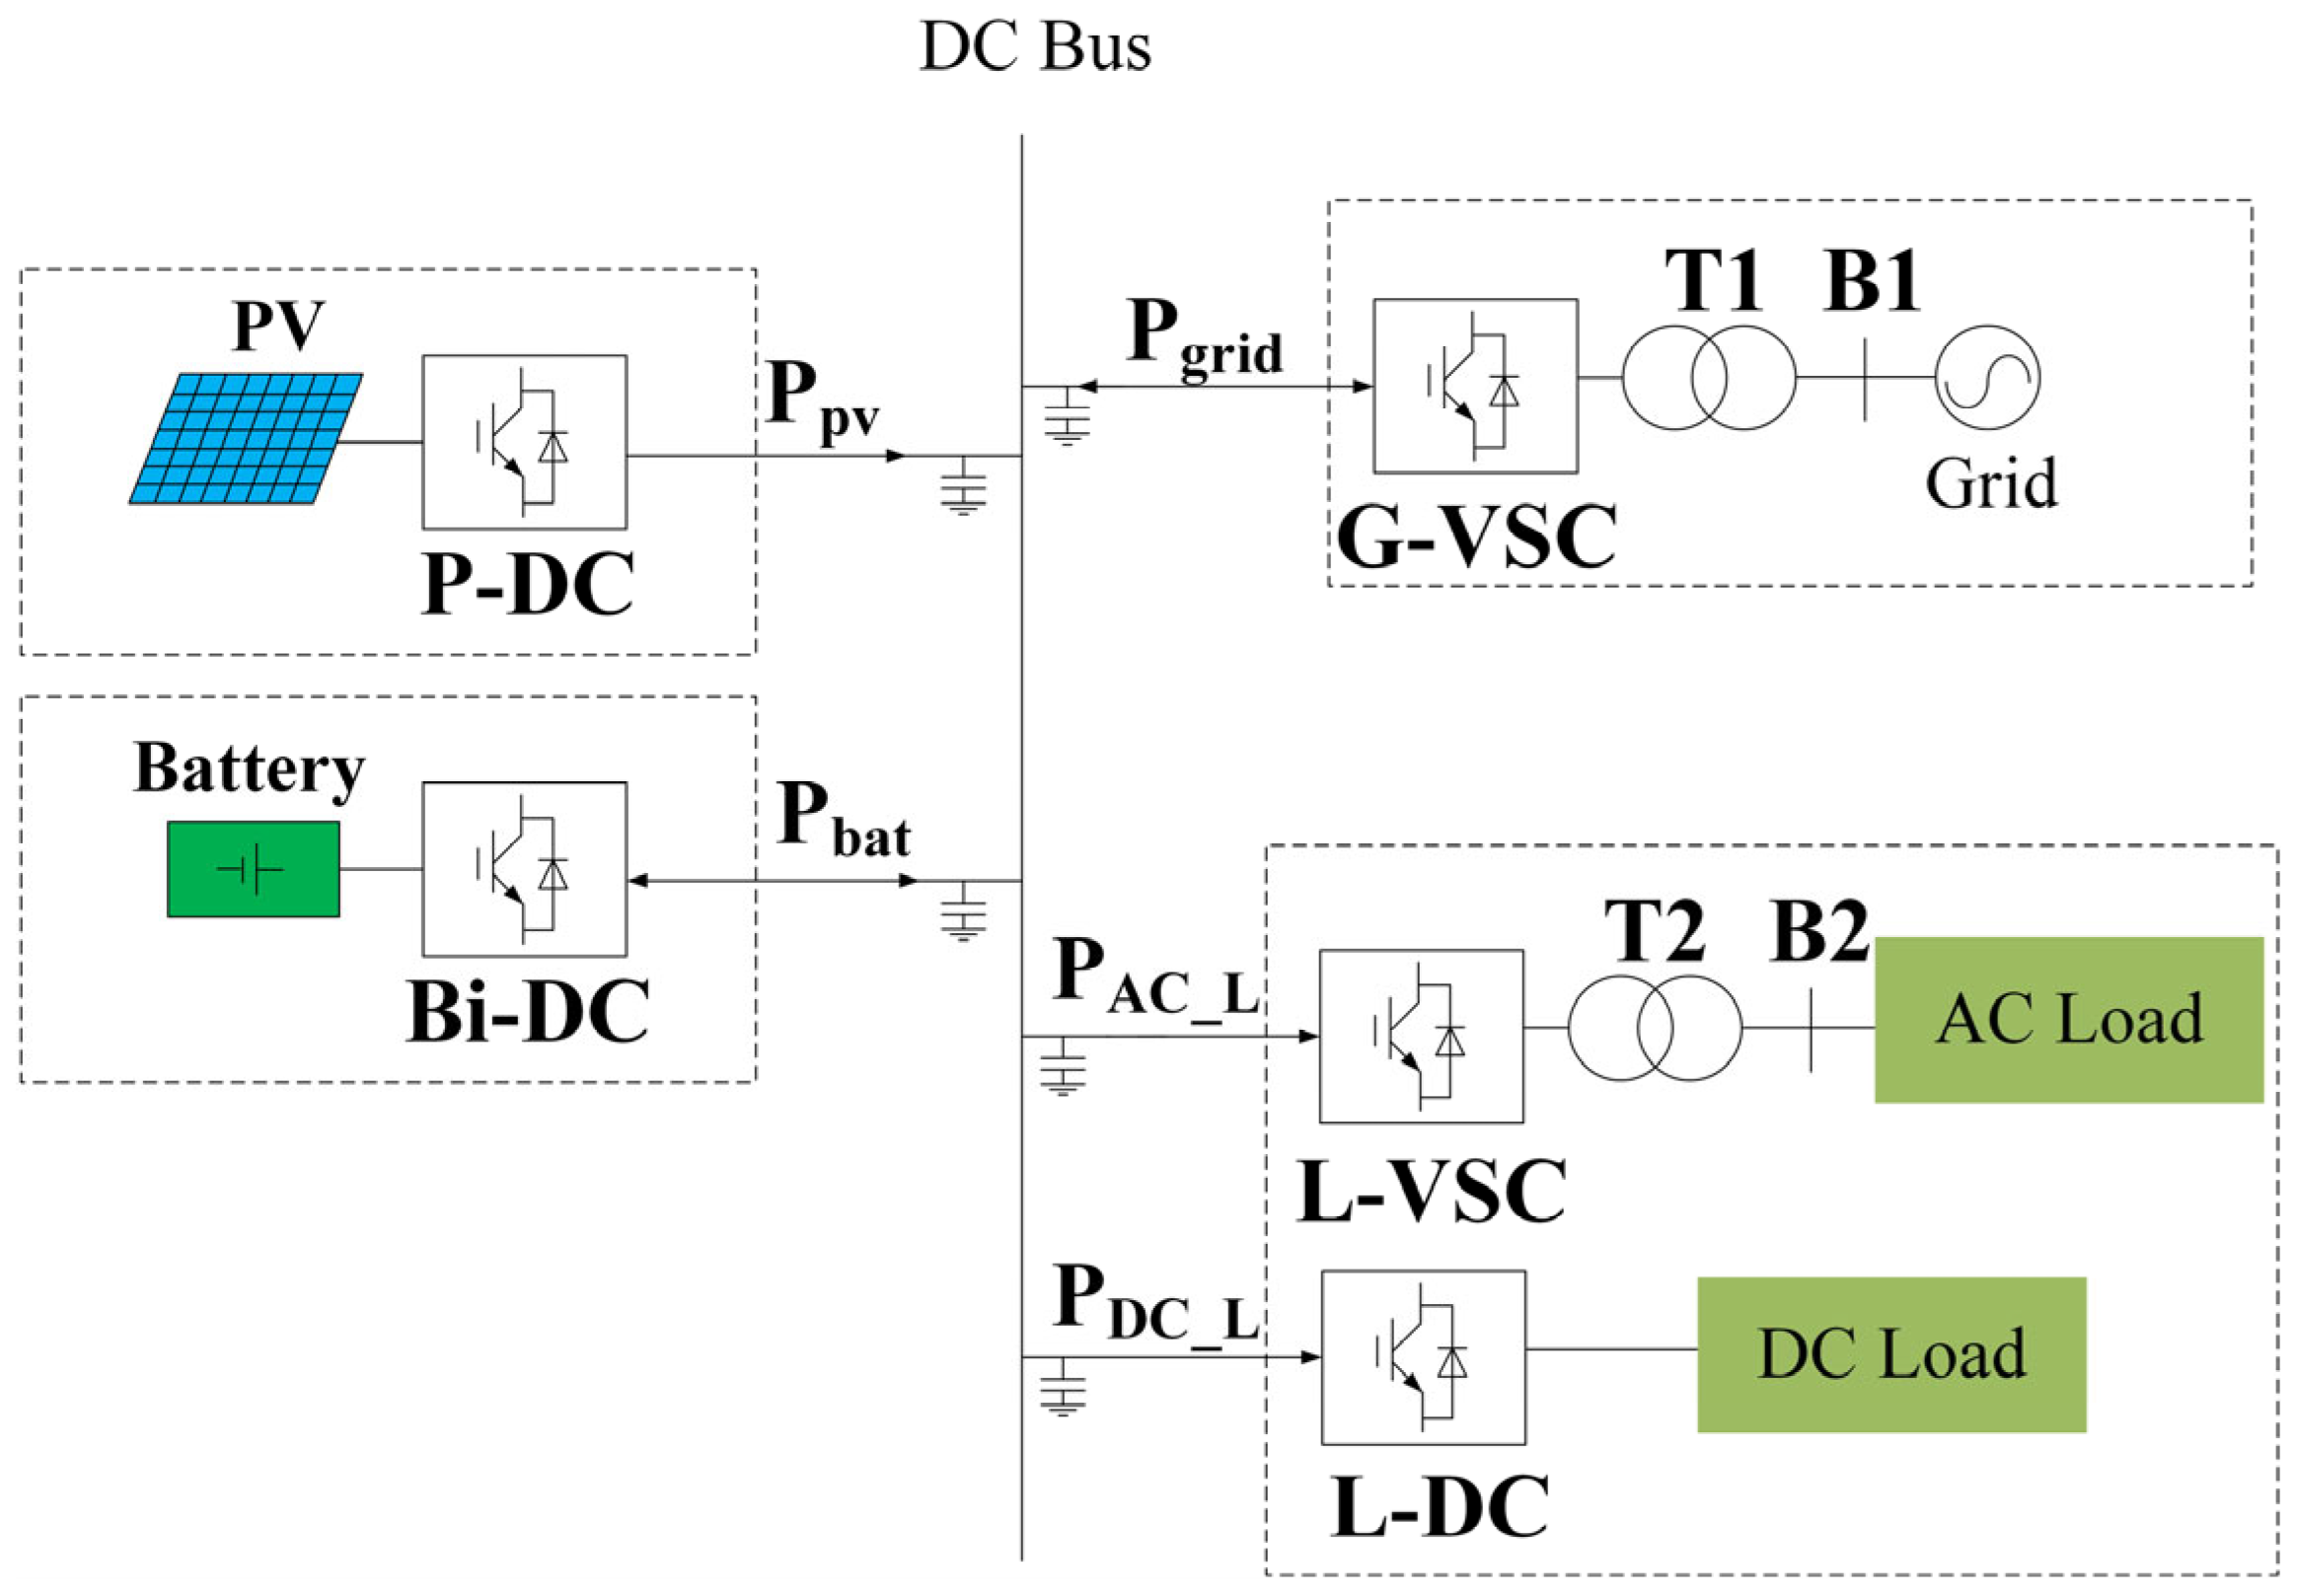
Figure 1. DC microgrid general structure diagram.
Energies 18 06180 g001
Figure 2. Bidirectional Buck/Boost converter topology.
Energies 18 06180 g002
Figure 3. Schematic diagram of virtual capacitor principle.
Energies 18 06180 g003
Figure 4. Additional virtual inertia control block diagram.
Energies 18 06180 g004
Figure 5. Additional virtual inertia control block diagram and small signal control block diagram.
Energies 18 06180 g005
Figure 6. Unit step response of Z(s).
Energies 18 06180 g006
Figure 7. Distribution of dominant poles for Z(s).
Energies 18 06180 g007
Figure 8. MPC-VI control block diagram.
Energies 18 06180 g008
Figure 9. MPC-VI control algorithm flowchart.
Energies 18 06180 g009
Figure 10. Step response comparison waveform.
Energies 18 06180 g010
Figure 11. Load surging simulation comparison waveforms. (a) Load surge DC bus voltage comparison waveform; (b) load drop DC bus voltage comparison waveform.
Energies 18 06180 g011
Figure 12. Simulated waveforms of MPC-VI controlled load surging battery. (a) Battery power under load surges waveform; (b) battery power under load drops waveform.
Energies 18 06180 g012
Figure 13. Comparison waveforms of high-frequency components of load surge DC bus voltage. (a) Contrast waveform of high frequency component of DC bus voltage with load surge; (b) contrast waveform of high frequency component of DC bus voltage with load drop.
Energies 18 06180 g013
Figure 14. iset(t) waveform.
Energies 18 06180 g014
Figure 15. Experimental platform built.
Energies 18 06180 g015
Figure 16. Step response comparison waveform. (a) Voltage waveform of high voltage side under double closed-loop control of voltage and current; (b) voltage waveform of high voltage side under traditional additional virtual inertia control; and (c) voltage waveform of high voltage side under MPC-VI control.
Energies 18 06180 g016
Figure 17. Load sudden response comparison waveform. (a) Voltage and current double closed-loop control; (b) Traditional additional virtual inertia control; (c) MPC-VI control.
Energies 18 06180 g017
Table 1. MPC-VI control parameters.
ParametersValues
Sampling Time Ts/μs20
Droop Coefficient kd3.28
Virtual Capacitance Cvir/mF1
Weight Coefficient λ1, λ2, λ31, 1, 0.02
Predictive Time Domain p3
Time Constant T0.05
Threshold Value U0.2
Table 2. System simulation parameters.
ParametersValues
Rated voltage of DC bus udc/V800
P-DC Nominal capacity PVN/kW25
G-VSC Nominal capacity PGN/kW50
Bi-DC Nominal capacity PBN/kW40
Dc bus capacitance Cdc/mF5
Ac grid frequency/Hz50
Sampling time/μs20
Load L1/kW5
Load L2/kW8
Load L3/kW7.5
Load L4/kW30
Load L5/kW50
Table 3. Main circuit parameters.
ParametersValues
High voltage side rated voltage udc/V110
Low voltage side rated voltage uin/V48
Rated power P/W150
Inductance L/mH2.5
Low-voltage filter capacitor C1/μF470
High-voltage filter capacitor C2/μF100
Table 4. MPC-VI experimental control parameters.
ParametersValues
Switching frequency/Hz20 k
Control frequency/Hz40 k
Droop coefficient0.12
Virtual capacitance Cvir/μF20
Threshold value U1
Weight coefficient λ1, λ2, λ31, 1, 0.001
Disclaimer/Publisher’s Note: The statements, opinions and data contained in all publications are solely those of the individual author(s) and contributor(s) and not of MDPI and/or the editor(s). MDPI and/or the editor(s) disclaim responsibility for any injury to people or property resulting from any ideas, methods, instructions or products referred to in the content.