Article

Cooling Performance of Night Ventilation and Climate Adaptation of Vernacular Buildings in the Turpan Basin with an Extremely Hot–Arid Climate

1
School of Civil Engineering and Architecture, Xi’an University of Technology, Xi’an 710048, China
2
School of Mechanics and Transportation Engineering, Northwestern Polytechnical University, Xi’an 710129, China
*
Author to whom correspondence should be addressed.
Energies 2025, 18(23), 6135; https://doi.org/10.3390/en18236135 (registering DOI)
Submission received: 28 October 2025 / Revised: 15 November 2025 / Accepted: 21 November 2025 / Published: 23 November 2025
(This article belongs to the Special Issue Energy Efficiency and Thermal Performance in Buildings)

Abstract

This study investigates the cooling potential of night ventilation and the climate adaptability of local vernacular buildings in the Turpan basin, aiming to identify passive energy-saving design strategies. A rural building with an air-drying shelter was selected for summer indoor environment measurements (two stages: all-day window closure vs. night ventilation), and a numerical model was established to simulate the impacts of window-to-wall ratio and window shading projection factor on the indoor environment. Results indicate that night ventilation introduces cool outdoor air to replace indoor hot air, cools building components, improves thermal comfort, and reduces cooling energy demand. Without additional cooling technology, increasing the window-to-wall ratio lowers nighttime temperatures but increases Degree Discomfort Hours, while appropriately sized shading devices mitigate daytime overheating from larger windows. Benefiting from the high thermal storage capacity of earth-appressed walls, semi-underground rooms offer better comfort with lower temperatures and higher humidity; for aboveground rooms, orientation is critical due to intense solar radiation. The air-drying shelter reduces solar radiant heat absorption and inhibits convective/radiative heat transfer on the roof’s external surface, significantly lowering its temperature from noon to midnight. This leads to notable reductions in the roof’s internal surface temperature (1.02 °C in the sealed stage, 2.09 °C during night ventilation) and the average indoor temperature (1.70 °C).

1. Introduction

1.1. Background

The building sector accounts for approximately 40% of global total energy consumption and emits 30% of global greenhouse gas emissions, according to the United Nations Environment Programme (UNEP) [1]. In China, around 45% of the total population resides in rural areas, and rural building energy consumption constitutes 25% of the country’s total building energy consumption [2]. Thus, an urgent goal for rural building energy efficiency in China is the development of passive heating and cooling technologies that can enhance indoor thermal comfort without overreliance on heating, ventilation, and air conditioning (HVAC) systems.
Vernacular buildings, constructed using traditional technologies and natural raw materials, are widely recognized for their adaptation to local climatic characteristics and socio-cultural features [3]. Investigating the climate adaptation strategies embedded in vernacular buildings is therefore essential for providing a reference for low-energy modern rural building design. Over the past decades, numerous studies worldwide have focused on the thermal performance and climate adaptability of vernacular buildings. Yang et al. [4] reviewed 55 previous studies published since 2010 to explore the climate responsiveness of vernacular buildings. Their findings revealed that vernacular buildings effectively address local climatic challenges, demonstrating high adaptability through the use of locally available materials and cost-effective technologies. Notably, over 70% of these studies were conducted in Asian—a region renowned for its rich traditional culture and long history—with China leading the research on the climate adaptability of vernacular buildings.
Based on the average temperatures of the hottest and coldest months, China is divided into five climate zones: Severe Cold (SC), Cold, Hot Summer and Cold Winter (HSCW), Hot Summer and Warm Winter (HSWW) and Mild zones [5]. Significant variations in meteorological conditions across these zones have resulted in remarkable diversity in the plane layout, structural form, thermal performance, and functionality of vernacular buildings. As illustrated in Figure 1, distinct differences in the characteristics of vernacular buildings are evident across the five climate zones due to climatic disparities. For instance, vernacular buildings in the Cold and SC zones are characterized by enclosed inner courtyards surrounded by thick-walled dwellings, which help protect the internal microclimate by shielding against cold wind in winter. Additionally, large glass windows are commonly installed on south-facing walls to maximize solar energy absorption for passive heating during colder months. In contrast, the HSCW and HSWW zones experience high air temperature, intense solar irradiance, and abundant rainfall in summer. Vernacular buildings in these zones typically feature sloping roofs, light-colored walls, and light wells to reduce solar heat gain and enhance buoyancy-driven natural ventilation.
In recent years, several studies have focused on the indoor environment, climate adaptability, and design optimization of vernacular buildings in China [6,7,8]. These studies have selected typical vernacular building types, including Tulou [9], Pekong [10], Kangba [10], Yaodong [11], underground cave dwellings [12], and cliff-side cave dwellings [13], which are distributed in Fujian Province, the Tibetan Plateau, and the Loess Plateau, respectively. The findings have provided valuable insights into the climate adaptation strategies of vernacular buildings in several regions of China. Notably, the vernacular buildings selected in existing studies are mostly constructed with earth materials and wooden frameworks. The thermal mass and thermal resistance offered by thick earthen envelopes help maintain a stable indoor environment, mitigating excessively high temperatures and large diurnal temperature fluctuations in summer, as well as extremely low outdoor temperatures in winter. Even today, rural residents in northwestern China continue to inhabit earth dwellings despite harsh climatic conditions.
The Turpan basin, located in the east-central part of the Xinjiang Uygur Autonomous Region at an altitude of 154 m below sea level, belongs to Cold climate zone of China [14]. Climate data from the Typical Meteorological Year (TMY) are presented in Figure 2. As shown, the Turpan basin features an extremely hot and arid climate with significant diurnal temperature variations in summer. Specifically, the outdoor temperature ranges from 14.70 °C to 45.40 °C, with the maximum daily average temperature reaching 36.65 °C. As the hottest region in China, the Turpan basin experiences over 100 days per year with outdoor temperatures exceeding 35 °C [15]. Additionally, the region is endowed with abundant solar energy, with an average peak daily solar radiation intensity of 805.54 W/m2, leading to an extremely dry environment with an average relative humidity of 31.13%. Furthermore, the Turpan basin boasts substantial wind resources, with an average summer wind speed of 4.57 m/s. Therefore, thermal insulation, sun shading, and natural ventilation can be considered effective cooling technologies for the Turpan basin, leveraging local climatic conditions such as high peak temperatures, large diurnal temperature variations, intense solar irradiance, and favorable wind speeds.
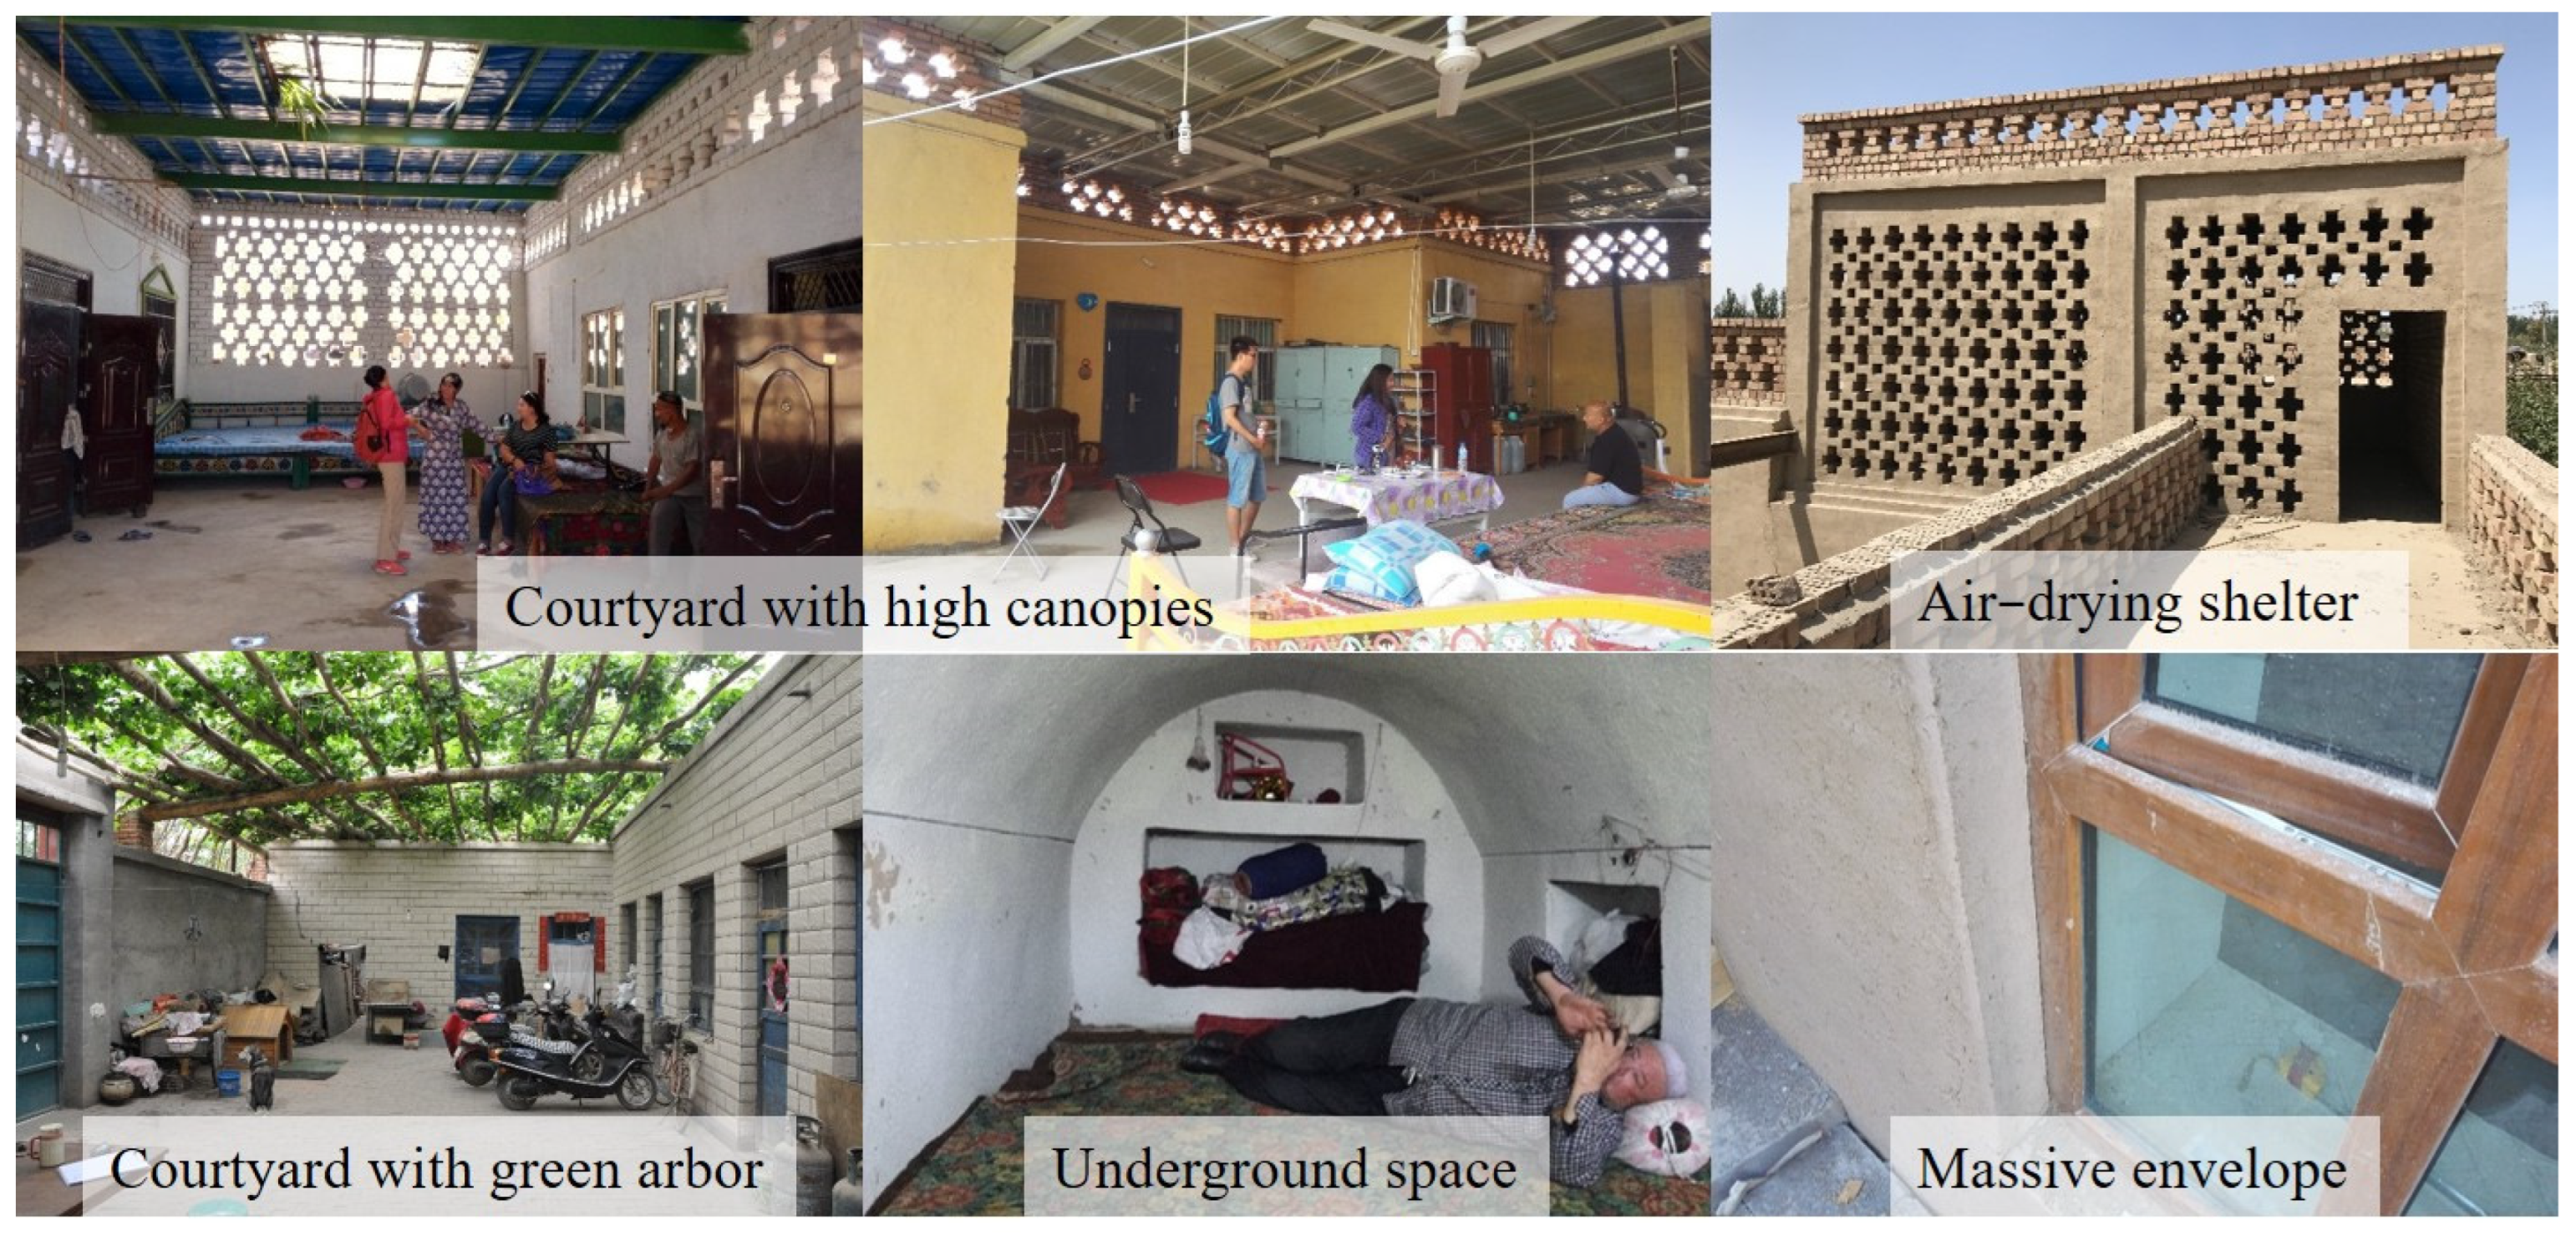
Earth vernacular buildings, rich in regional characteristics and cultural connotations, are widely adopted by residents in the Turpan basin. As shown in Figure 3, prominent features of these vernacular buildings include diversified courtyards, shaded spaces, underground spaces, air-drying shelters, and massive earth walls. Shaded spaces—semi-open areas provided by canopies or arbors—are popular among local residents for dining, short rest, and leisure activities in summer [17]. Chang et al. [18] carried out a one-year survey on the thermal environment of indoor and semi-open spaces in vernacular buildings in the Turpan basin. Their results showed that the air temperature and air velocity in semi-open spaces are higher than those in indoor spaces, and local residents prefer to stay in semi-open spaces during daytime in summer. Yang et al. [19] investigated the effects of massive earthen envelopes and semi-basements on the indoor thermal environment through field measurements, finding that massive earthen envelopes can improve the indoor thermal environment, with semi-basements being the most effective strategy for meeting local residents’ thermal comfort needs. According to He et al. [20], multi-layered spaces (comprising courtyards, above-ground spaces, and underground spaces) can mitigate the adverse impacts of the extremely hot and arid climate on the indoor environment in the Turpan basin. As one of the most representative characters of Turpan’s vernacular buildings, air-drying shelters are positioned on building roofs for grape drying. Zhang et al. [21] conducted a field measurement to explore the thermal regulation effect of air-drying shelters on the indoor thermal environment of enclosed rooms. Existing studies have investigated the passive strategies inherent in the morphological features of Turpan’s vernacular buildings and analyzed their effects on the indoor environment during extremely hot and arid summer. Zhang et al. [22] identified the optimal design parameters of these passive strategies through a series of simulation studies, which can provide an effective reference for improving indoor comfort; however, the indoor thermal environment of the optimized buildings still exceeds the local thermal comfort range. According to studies by Ezzeldin et al. [23] and Mohamed et al. [24], natural ventilation is regarded as an effective cooling technology for improving indoor thermal comfort and reducing cooling energy demand under hot and arid climate. Therefore, the indoor thermal environment of Turpan’s vernacular buildings during hot and arid summer is expected to be further improved through the application of natural ventilation.

1.2. Cooling Performance of Natural Ventilation in Hot and Arid Climate

Night ventilation is an energy-free passive cooling technology, which is particularly suitable for hot and arid regions with large diurnal temperature variations. Osman et al. [25] analyzed the climate change in Khartoum from 1987 to 2015, and confirmed the adaptability of natural ventilation under hot and arid climate conditions. According to the study by Dong et al. [26], a hypothetical building constructed of uninsulated earth walls with 300 mm thickness could only achieve indoor operative temperatures that are within the 80% acceptability limits for 63% of the time in the hot and arid climate. For a naturally ventilated building with earth walls of the same thickness, the percentage of comfortable indoor temperature can be raised by 7.60% if the windows are fully opened. The effective ventilation parameters that impact cooling performance include airflow rate, indoor–outdoor temperature difference and the quantity of exposed thermal mass [27].
Michael et al. [28] examined the cooling performance of natural ventilation by taking into account different ventilation strategies, namely daytime, full day and nighttime ventilation. The results revealed that night ventilation is the most effective approach for passive cooling in the hot summer, compared with the other two ventilation strategies. Similarly, Kyritsi et al. [29] confirmed the effectiveness of night ventilation in summer and further explored the impact of window opening patterns on the indoor thermal environment. The results showed that the increased airflow generated by cross ventilation extends the time during which the operative temperature remains within the 80% and 90% acceptability limits. The window opening patterns may be referred to as ventilation modes in other literature [30]. Omrani et al. [31] suggested that ventilation mode is the main design parameter influencing cooling performance, and particularly cross ventilation outperforms single-sided ventilation with respect to achieving a comfortable indoor thermal environment. Besides ventilation modes, window orientation and window opening area are also crucial factors affecting the cooling performance of night ventilation [32]. Al-Yasiri et al. [33] investigated the effect of night ventilation on the indoor environment of a single room with high heat storage capacity, considering window orientation and window-to-wall ratio (WWR). The numerical study revealed that window orientation has a significant impact on the ventilation cooling performance, and indoor thermal comfort could be improved by using larger window size.
It is noteworthy that internal thermal mass level is also a key factor affecting the ventilation cooling performance [34]. Light internal thermal mass is inadequate for effectively absorbing and storing indoor heat gains, which is detrimental to reducing the peak indoor temperature and minimizing indoor temperature fluctuation. Earth buildings constructed with thick rammed or adobe walls provide heavy thermal mass to improve night ventilation cooling performance [35]. Bassoud et al. [36] investigated the summer thermal comfort of a ventilated adobe building in arid desert region. The result showed that the indoor temperature varies between 31.50 °C and 33.50 °C, and 44% of people rate their thermal sensation as “neutral”. Fernandes et al. [37] performed a similar study on thermal performance of a ventilated rammed earth building located in Southern Portugal. The findings demonstrated that the measured rooms, with the aid of night ventilation, have thermal comfort conditions at the center of the comfort range, and the occupants’ thermal sensation votes are “neutral”.
The Turpan basin, as a typical region with an extremely hot and arid climate in China, boasts a large number of earth vernacular buildings. Improving the indoor thermal environment of these earth vernacular buildings by means of night ventilation is of great significance for reducing the energy consumption of rural residential buildings across China. Currently, the studies on the thermal performance of rural vernacular buildings in the Turpan Basin primarily focus on the impacts of inherent building characteristics—including architectural space configuration, thermal properties of the building envelope, and shading devices—on the indoor thermal environment. However, insufficient attention has been devoted to enhancing the indoor thermal environment through night ventilation technology. In the Turpan Basin, can the integration of earth-building design strategies with night ventilation technology yield optimal cooling effects? Does the architectural space organization of earth vernacular buildings (e.g., semi-basements, air-drying shelters) influence the cooling performance of night ventilation? Under the extremely hot-arid climate, what effects do ventilation design parameters such as window orientation and opening area exert on the indoor thermal environment? Adequate research on these issues will provide targeted guidance for the energy-saving design of earth vernacular buildings in the Turpan basin, such as the reasonable layout of functional spaces like semi-basements and air-drying shelters, as well as window orientation and opening area that facilitate night ventilation cooling.
The main aim of the present study is to investigate the cooling performance of night ventilation in the Turpan basin with extremely hot and arid climate, and then to evaluate the climate adaptation performance of Turpan’s vernacular buildings. A typical vernacular building constructed by earth bricks was selected to measure its thermal performance, such as indoor air temperature, relative humidity and surface temperature of building envelope. The cooling potential of night ventilation in the Turpan basin was estimated by comparing the indoor thermal conditions between night ventilation and closed-windows scenarios. In order to evaluate the impact of functional space layout on cooling performance of night ventilation, a series of comparative analyses were conducted on the indoor environment test results of rooms with different orientations and on different floors. In addition, a numerical building model was developed based on the characteristics of the measured building. The indoor air temperatures were simulated using building performance simulation software EnergyPlus version 8.7.0 to examine the influences of the opening area and shading projection factor of windows with varying orientations on cooling performance of night ventilation. This study can provide references for climate adaptation design of rural residential buildings in the Turpan basin with extremely hot and arid climate, helping reduce summer air-conditioning energy use in local residences.

2. Methodology

2.1. The Building’s Characteristics

In this study, a two-story vernacular building with an air-drying shelter was selected for indoor environment measurements under extremely hot and dry climatic conditions. The appearance of the selected building is shown in Figure 4. The building was constructed using earth bricks for thermal performance and reinforced with concrete beams and columns for seismic resistance. The building has a total floor area of 200.1 m2, consisting of one living room, one dining room, four bedrooms, one kitchen, one bathroom, one storeroom, and one air-drying shelter. Among the bedrooms, two are semi-underground rooms, serving as the main living spaces in summer. The key characteristics of the vernacular building are listed in Table 1. As demonstrated in Table 1, the thick earth walls provide high thermal mass to delay heat transfer during hot climate, and the air-drying shelter offers solar shading to reduce heat gain for the building’s roof. The sectional details of each type of building envelope are shown in Figure 5.

2.2. Field Measurement

The field measurements, lasting nine days, were carried out to investigate the thermal performance of the selected vernacular building in summer. The indoor thermal environment of the vernacular building without ventilation was measured from 0:00 on 1 July to 24:00 on 5 July 2022 (the first stage). During this stage, all windows and doors of the building were closed. Subsequently, an indoor environmental quality test with night ventilation was performed from 0:00 on 7 July to 24:00 on 10 July 2022 (the second stage). In the second stage of the field measurements, the windows and doors remained closed during the daytime but were opened from night until the next morning, as detailed in Table 2. Throughout the entire measurement period, the studied vernacular building was unoccupied, and no HVAC equipment or other electrical devices were used in the building.
In this study, TESTO 175-H1 temperature and humidity recorders were placed at a height of 1.5 m above the ground to measure the thermal environment of selected rooms in the studied building. The measured rooms represent indoor spaces with different orientations and at different floors. The surface temperatures of the building’s envelopes were monitored using two JTNT-A Multi-channel temperature recorders. Sensors were installed on the interior and exterior surfaces of the building walls, the building roof, and the air-drying shelter’s roof. The measuring points for the internal surface temperatures of the building walls were located at a height of 1.0 m above the studied rooms’ floors. Sensors were arranged on the exterior surface of the building wall corresponding to the measuring point of the internal surface temperature, for measuring the exterior surface temperature of the building wall. To protect the measured results from solar radiation, the sensors of the aforementioned devices were covered with tinfoil. Air velocity in the air-drying shelter was recorded using DELTAOHM HD-31 Multifunction tester equipped with a hot-wire anemometer. The hot-wire anemometer was positioned 1.0 m above the external surface of the kitchen. Additionally, meteorological conditions such as outdoor air temperature, relative humidity, global horizontal solar radiation, and air velocity were measured using an ONSET H21-USB weather station. The weather station was installed near the studied building in an unshaded area, free from obstacles such as surrounding buildings and trees. The installation heights of the solar radiation and wind speed test sensors were 2.0 m and 2.5 m above the outdoor ground, respectively. The specific measurement points in this study are illustrated in Figure 6. Detailed setup information for all devices used in this study is listed in Table 3.

2.3. Numerical Simulation

A basic numerical model was established using the advanced building performance simulation software EnergyPlus version 8.7.0 based on the characteristics of the measured vernacular building. To validate the basic building model, the measured results of meteorological data were averaged for each hour, and then used as the climatic input data for calculating the hourly indoor temperature of the basic building model. Model validation was then performed by comparing the simulated indoor temperature with the measured data. After validation, the indoor temperatures of the studied rooms with different orientations were simulated considering variations in window-to-wall ratio (WWR). The windows were set to remain open between 21:00 and 9:00 the next morning, and the WWR options were 15%, 20%, 25%, 30%, and 35%. Additionally, the living room with a 35% WWR was selected as the research object, and overhangs were installed on the south-facing windows. The window shading projection factor—calculated as the width of the window shading divided by the distance between the bottom of the window shading and the window sill—was set to 0.1, 0.3, 0.5, 0.7, and 0.9. The validated building model was run from June 1 to August 31 to simulate the indoor temperatures of the night ventilation rooms with variation in WWR and window shading projection factor. To evaluate the improvement of indoor thermal comfort through night ventilation with different WWRs and window shading projection factors, Degree Discomfort Hours (DDH) was used in this study and was calculated using the following equation:
D D H = 1 2208 T i n T a c c
where Tin is the hourly indoor temperature [°C], Tacc is the acceptable temperature for local residents in summer [°C]. According to the study by Yan et al. [38], the maximum of 80% acceptable temperature limit for local residents in the Turpan basin is 34 °C, which was adopted as the acceptable temperature in this study. To estimate the effect of WWR on the night ventilation cooling performance of rooms with different orientations, HVAC equipment, lighting, water heating equipment, and other electrical devices were unconsidered.

3. Results and Discussion

3.1. Outdoor Climate Analysis

Figure 7 demonstrates the meteorological conditions during the field measurements, including outdoor air temperature, relative humidity, global horizontal solar radiation, and wind speed. From July 1 to July 5 (the first stage of the field measurements), the studied building experienced extremely hot and arid weather conditions, with an average outdoor air temperature of 35.55 °C and a mean relative humidity of 24.91%. The outdoor temperature exhibited an average diurnal variation of 16.57 °C during this stage and reached a maximum of 47.03 °C at 17:20 on July 5. In comparison to the first stage, the outdoor overheating was alleviated during the second stage (from July 7 to July 10). The average and maximum outdoor temperatures during the second stage were 33.32 °C and 43.07 °C, respectively, 2.23 °C and 3.96 °C lower than those in the first stage. Relative humidity decreased with increasing outdoor air temperature and increased with decreasing outdoor air temperature. The measured results showed that relative humidity ranged from 11.50% to 42.80% during the field measurements, indicating that relative humidity in the Turpan basin remains quite low in summer. The average values of relative humidity in two stages were 24.91% and 24.54%, respectively. Intense solar radiation is considered as the main reason for the high temperature and low relative humidity in the Turpan basin. During the first stage, the maximum daily solar radiation intensities reached 939.40 W/m2, 968.10 W/m2, 965.60 W/m2, 986.90 W/m2, and 885.60 W/m2, while those in the second stage were 805.60 W/m2, 895.60 W/m2, 875.60 W/m2, and 908.10 W/m2. In addition, the average wind speed during the field measurements was 1.46 m/s, with a maximum of 8.56 m/s. These results indicate that the Turpan basin is endowed with abundant wind resources in summer, and night ventilation can be identified as an effective cooling strategy in the Turpan basin due to its favorable wind speeds, high maximum outdoor temperatures, and large temperature fluctuations.

3.2. Cooling Potential of Night Ventilation in Turpan Basin

3.2.1. Cooling Performance of Night Ventilation During the Field Measurements

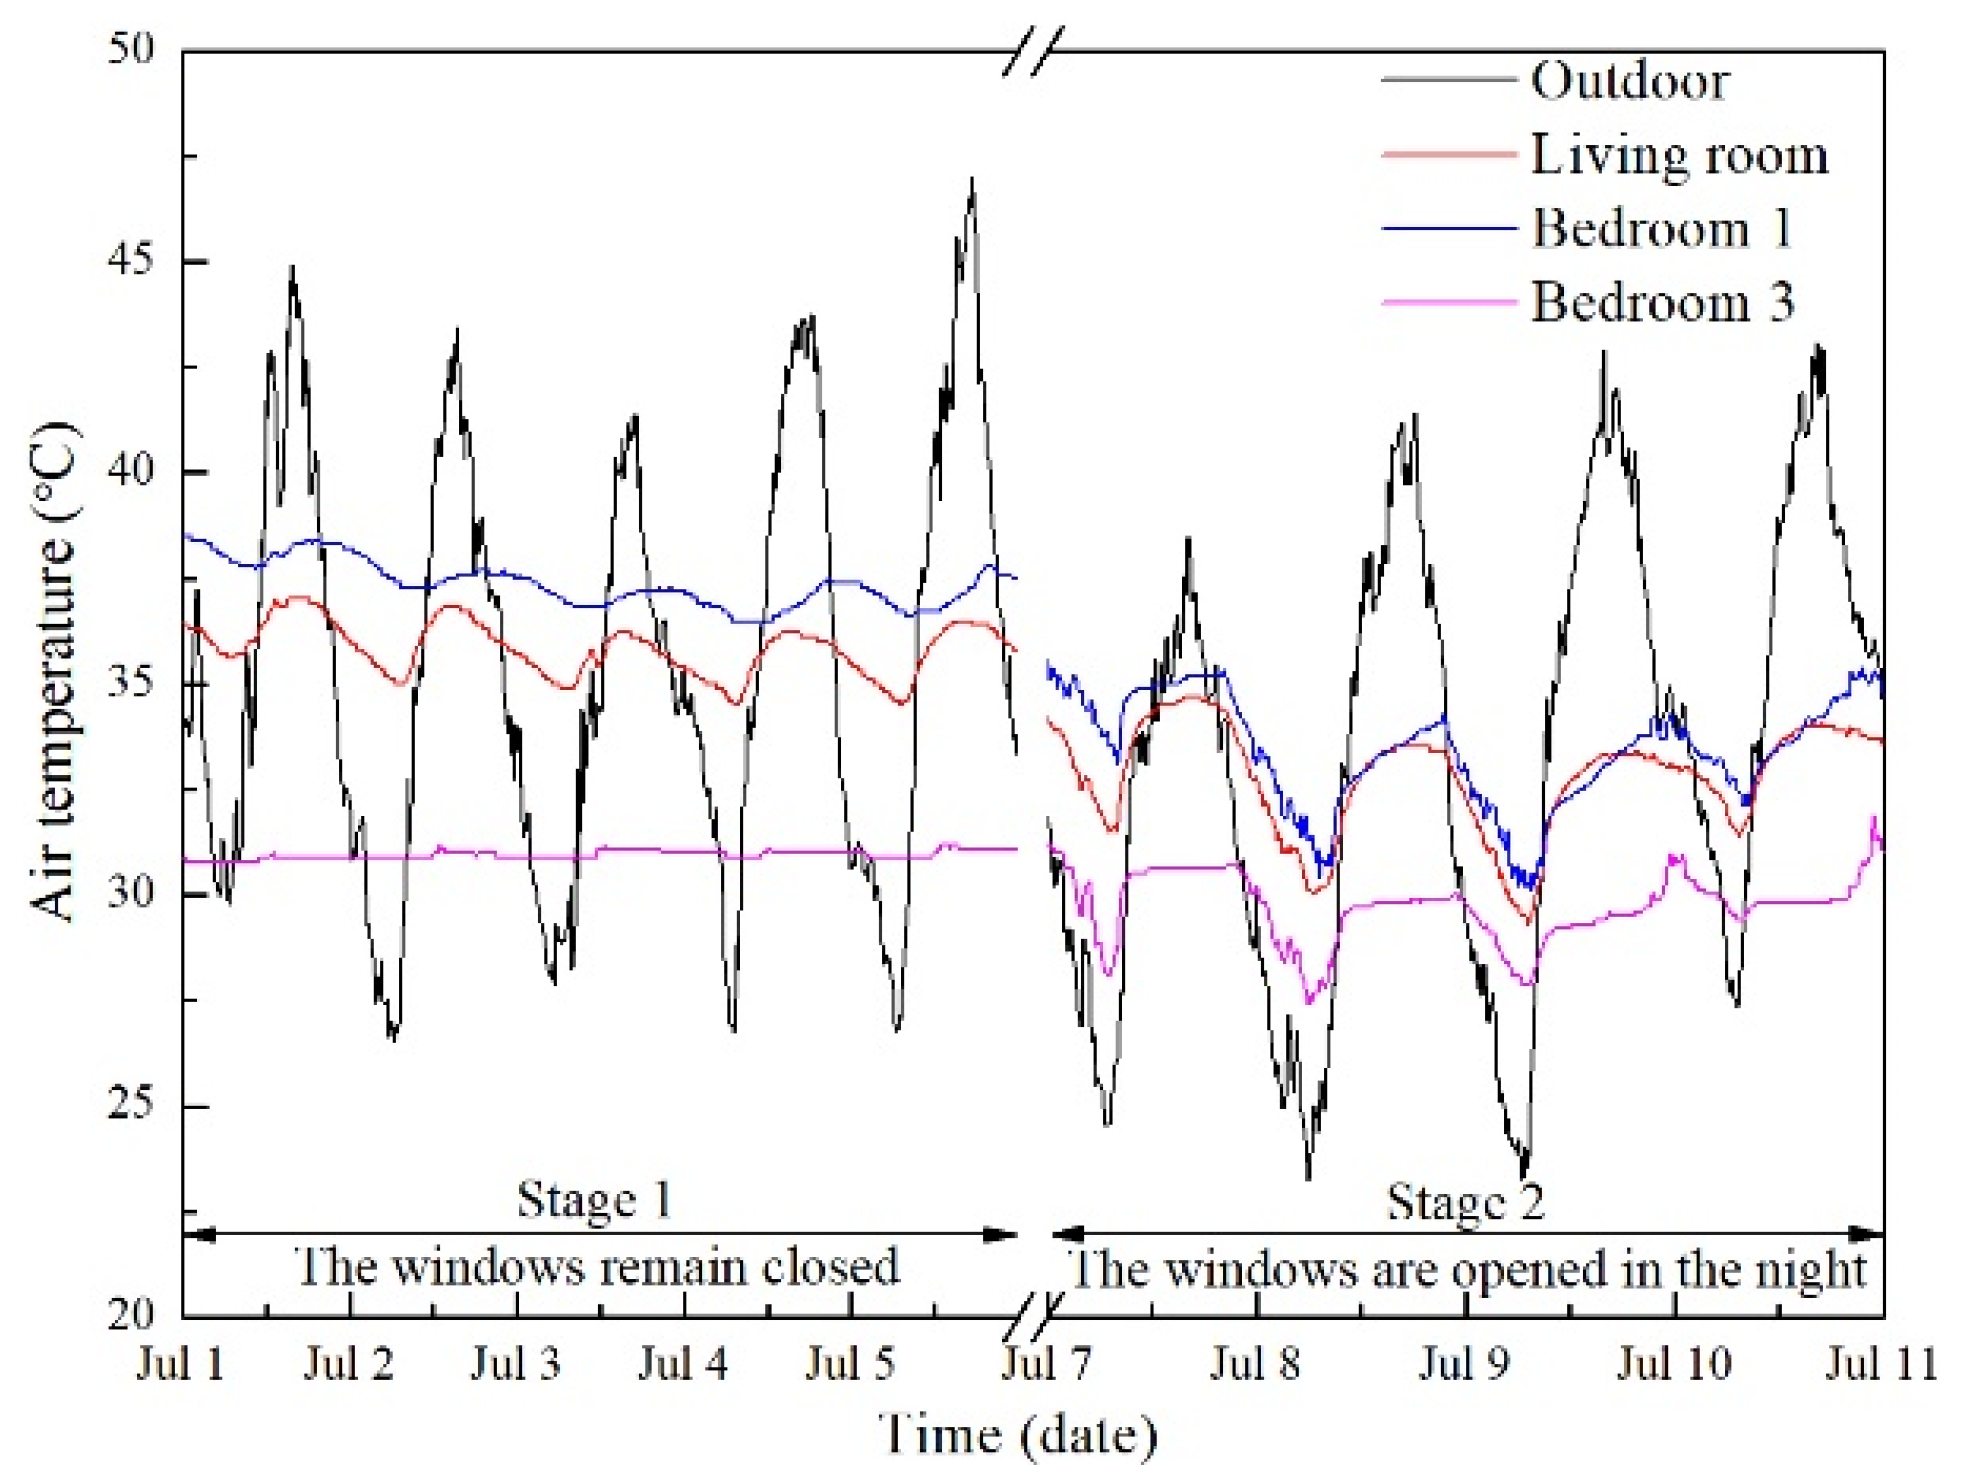
The measured values of indoor air temperature for the various rooms are depicted in Figure 8. During the entire field measurement period, significant differences in indoor thermal comfort were observed among the different rooms. In the first stage of field measurements (0:00 on July 1~24:00 on July 5), the strongest correlation between indoor and outdoor thermal conditions was observed in the living room. The indoor air temperature of the living room significantly rose as the outdoor temperature increased, and then notably declined with decreasing outdoor temperature. The rapid rise in indoor temperature could be attributed to the solar radiation heat transmitted through the windows situated in the external walls of the living room. When the outdoor temperature dropped, the heat stored inside the living room during the daytime was released through the building envelopes, including external walls, windows, doors and roofs. In comparison, the indoor temperature of Bedroom 1 fluctuated within a smaller amplitude, and the average temperature was 37.37 °C, which was 1.53 °C higher than that of the living room. It is worth noting that Bedroom 3, a semi-underground room, provided an acceptable living space in summer under the extremely hot and arid climate. Its indoor temperature fluctuated minimally (0.40 °C) with an average air temperature of 30.96 °C, which was close to the local people’s neutral temperature of 30.10 °C [17].
The cooling performance of night ventilation in the Turpan basin can be evaluated by comparing the indoor thermal conditions between the first and second stages of field measurements. As shown in Figure 8, obvious decreases in indoor temperature were observed in each of the studied rooms during the night ventilation period. For instance, the indoor temperatures of the living room and Bedroom 1 dropped by 3.50 °C and 3.80 °C, respectively, from 20:30 on July 7 to 9:00 on July 8. Even in the semi-underground room (Bedroom 3), where the air temperature remained stable during the first stage of measurements, the indoor air temperature still declined by 2 °C. The ratio between the indoor temperature reduction and the outdoor temperature reduction during the night ventilation period serves as an evaluation index for cooling performance. Given that the doors and windows of all studied rooms were kept closed during the first stage, this evaluation index was calculated by dividing the indoor temperature reduction from 21:00 at night to 9:00 the next morning by the outdoor temperature reduction. The average values of this evaluation index for the living room, Bedroom 1, and Bedroom 3 in the first stage were 0.13, 0.09 and 0.01, respectively. In the second stage, the average values of this evaluation index for the living room, Bedroom 1, and Bedroom 3 were 0.32, 0.34 and 0.22, respectively. These results indicate that when the outdoor temperature decreases by 1 °C, the indoor temperature decrease in the rooms with night ventilation is more conspicuous. This is because when the windows are opened for night ventilation, the lower temperature outdoor air enters the indoor space, replacing the warmer indoor air, thereby creating a more comfortable living environment during the night. In addition, night ventilation contributes to cooling the building envelopes, thereby enhancing the heat storage capacity of the building envelopes and reducing the indoor temperature during the daytime of the subsequent day. For example, the outdoor climatic condition on July 4 was close to that on July 9: the maximum outdoor temperatures on July 4 and July 9 were 43.77 °C and 42.92 °C, respectively. However, the differences in indoor temperature of the studied rooms between July 4 and July 9 were significant: the maximum indoor temperature of the living room on July 4 was 36.20 °C, which was 2.90 °C higher than that on July 9, and the peak indoor temperature of Bedroom 1 on July 4 was 37.50 °C, which was 3.20 °C higher than that on July 9. Therefore, night ventilation provided by opening windows and doors helps to introduce cooler outdoor air into the indoor space to reduce the indoor temperature during the nighttime and to enhance the heat storage capacity of the building envelopes to improve indoor thermal comfort during the daytime.

3.2.2. Effect of Window-to-Wall Ratio on Indoor Thermal Comfort of Night Ventilation Rooms with Different Orientations

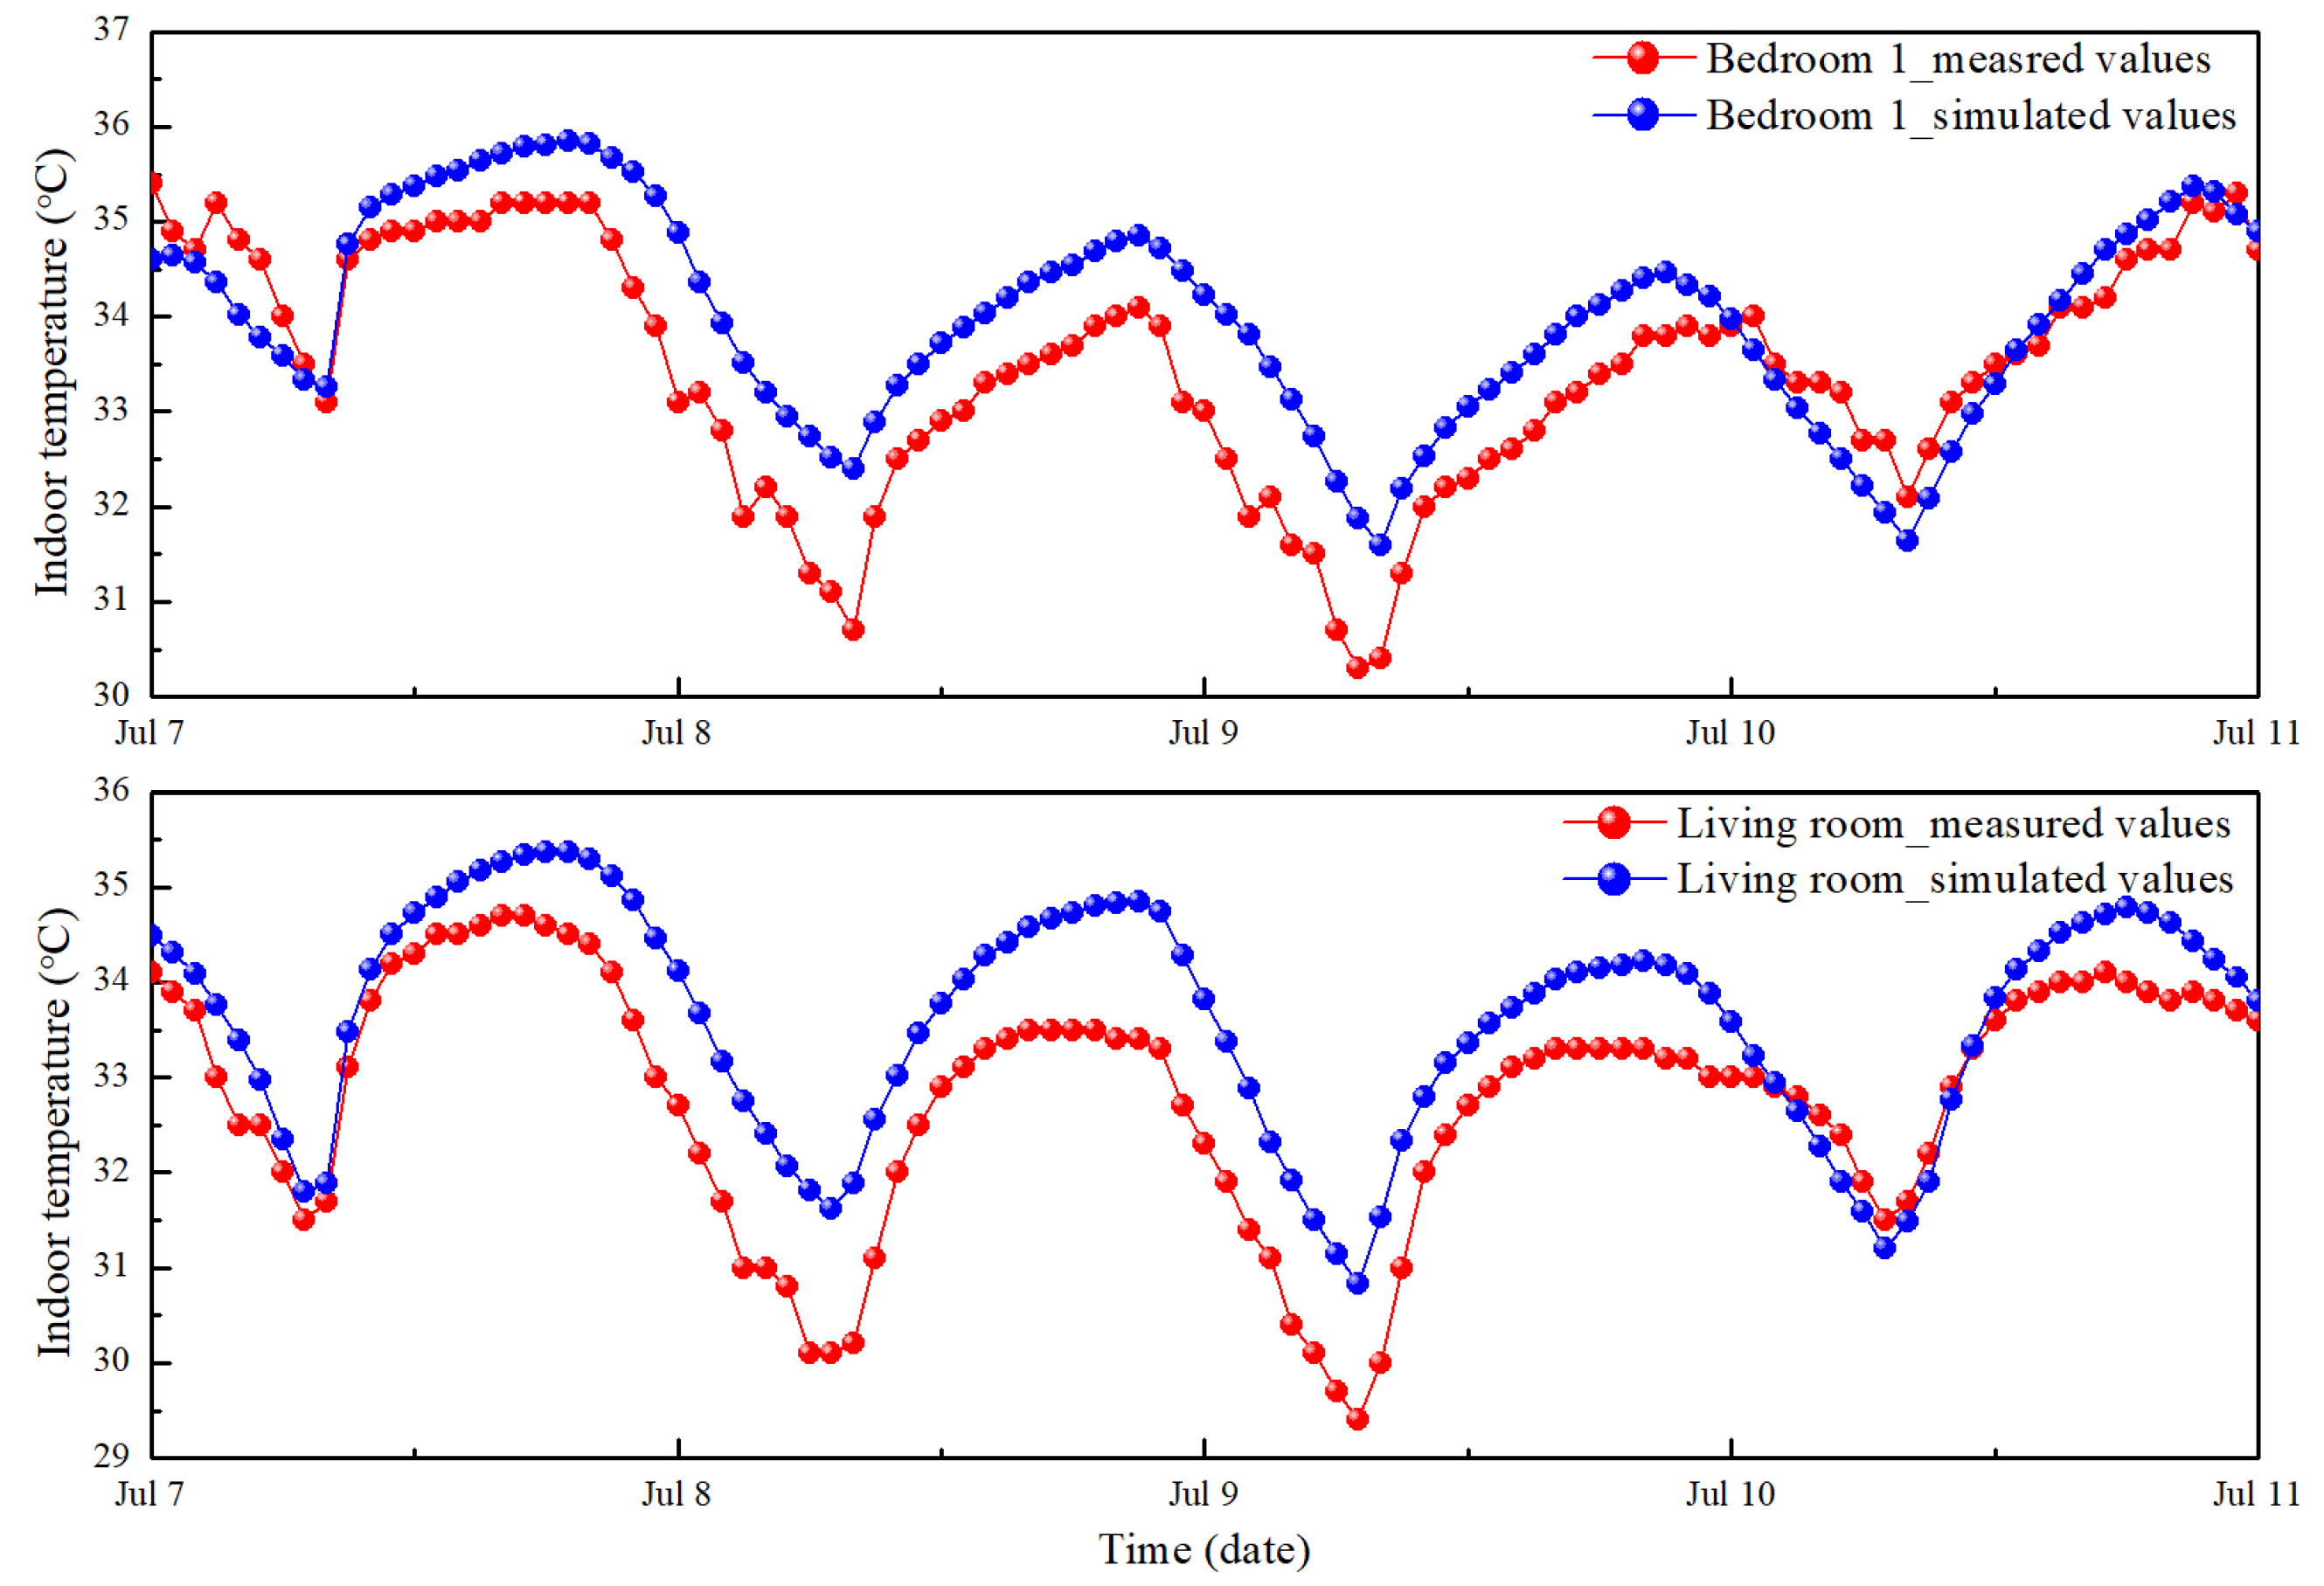
In order to validate the numerical building model, the indoor temperatures of Bedroom 1 and the living room were simulated using the measured meteorological data from the second stage, and then the simulated indoor temperatures of two studied rooms were compared with the measured results. Bedroom 1 and the living room, respectively, represent indoor spaces with windows oriented north and south. Figure 9 illustrates the simulated and measured indoor temperatures of two studied rooms, and the simulated results are almost consistently higher than the measured results. This phenomenon may stem from multiple factors. For instance, there are inevitably slight discrepancies between the actual thermal properties of building materials and their theoretical values used in the numerical building model; the actual solar heat gain coefficient of windows differs from the theoretical value in the numerical model due to dust accumulation on the exterior surface of the glass; additionally, experimenters entering and exiting the measurement rooms to adjust instruments result in the indoor temperature changes. In this study, the average value of the difference between the simulated and measured indoor temperatures in Bedroom 1 was 2.09%, and that in the living room was 2.60%. Generally speaking, a numerical model can be regarded as satisfactory provided that the discrepancy between the simulated and measured results is within 5%. Moreover, the variation trends of the simulated and measured indoor temperatures in the two studied rooms are consistent. Therefore, it can be concluded that the numerical building model is capable of simulating the indoor temperatures of Turpan’s vernacular buildings with night ventilation.
In this study, the indoor temperature of the validated building model was simulated by varying WWR. The simulated indoor temperatures of Bedroom 1 and the living room are presented in Figure 10 and Figure 11, respectively. As depicted in Figure 10, during the summer season (from June 1 to August 31), the simulated indoor temperatures of Bedroom 1 (a north-facing room) with different WWRs ranged from 28 °C to 44 °C. To precisely analyze the effect of WWR on the indoor thermal environment of naturally ventilated Bedroom 1, the simulated indoor temperatures from July 29 to August 5 were selected. This period is regarded as the hottest week of the year. As WWR increased from 15% to 35%, the indoor temperature of Bedroom 1 during the daytime rose significantly, while the nighttime temperature decreased notably. The significant increase in daytime indoor temperature with increasing WWR can be explained by the fact that the thermal resistance of windows is significantly lower than that of walls. The enlargement of the window area intensifies conductive heat transfer through the windows. When the windows were opened for night ventilation, the increased WWR allowed more cool air to flow into Bedroom 1 through the windows, which is beneficial for reducing nighttime indoor temperature.
Compared with Bedroom 1, increasing the WWR had a more prominent effect on the daytime indoor temperature of the living room (a south-facing room). For the same WWR, the daytime indoor temperature of the living room was approximately 2 °C higher than that of Bedroom 1. This phenomenon can be attributed to the fact that increasing the area of the south-facing windows amplifies direct solar radiation gain through the windows, thus elevating the indoor temperature. Furthermore, the substantial daytime indoor heat gain restricts the cooling performance of night ventilation without mechanical ventilation assistance. As a result, when the WWR reached 35%, the lowest indoor temperature of the living room still remained above 36 °C.
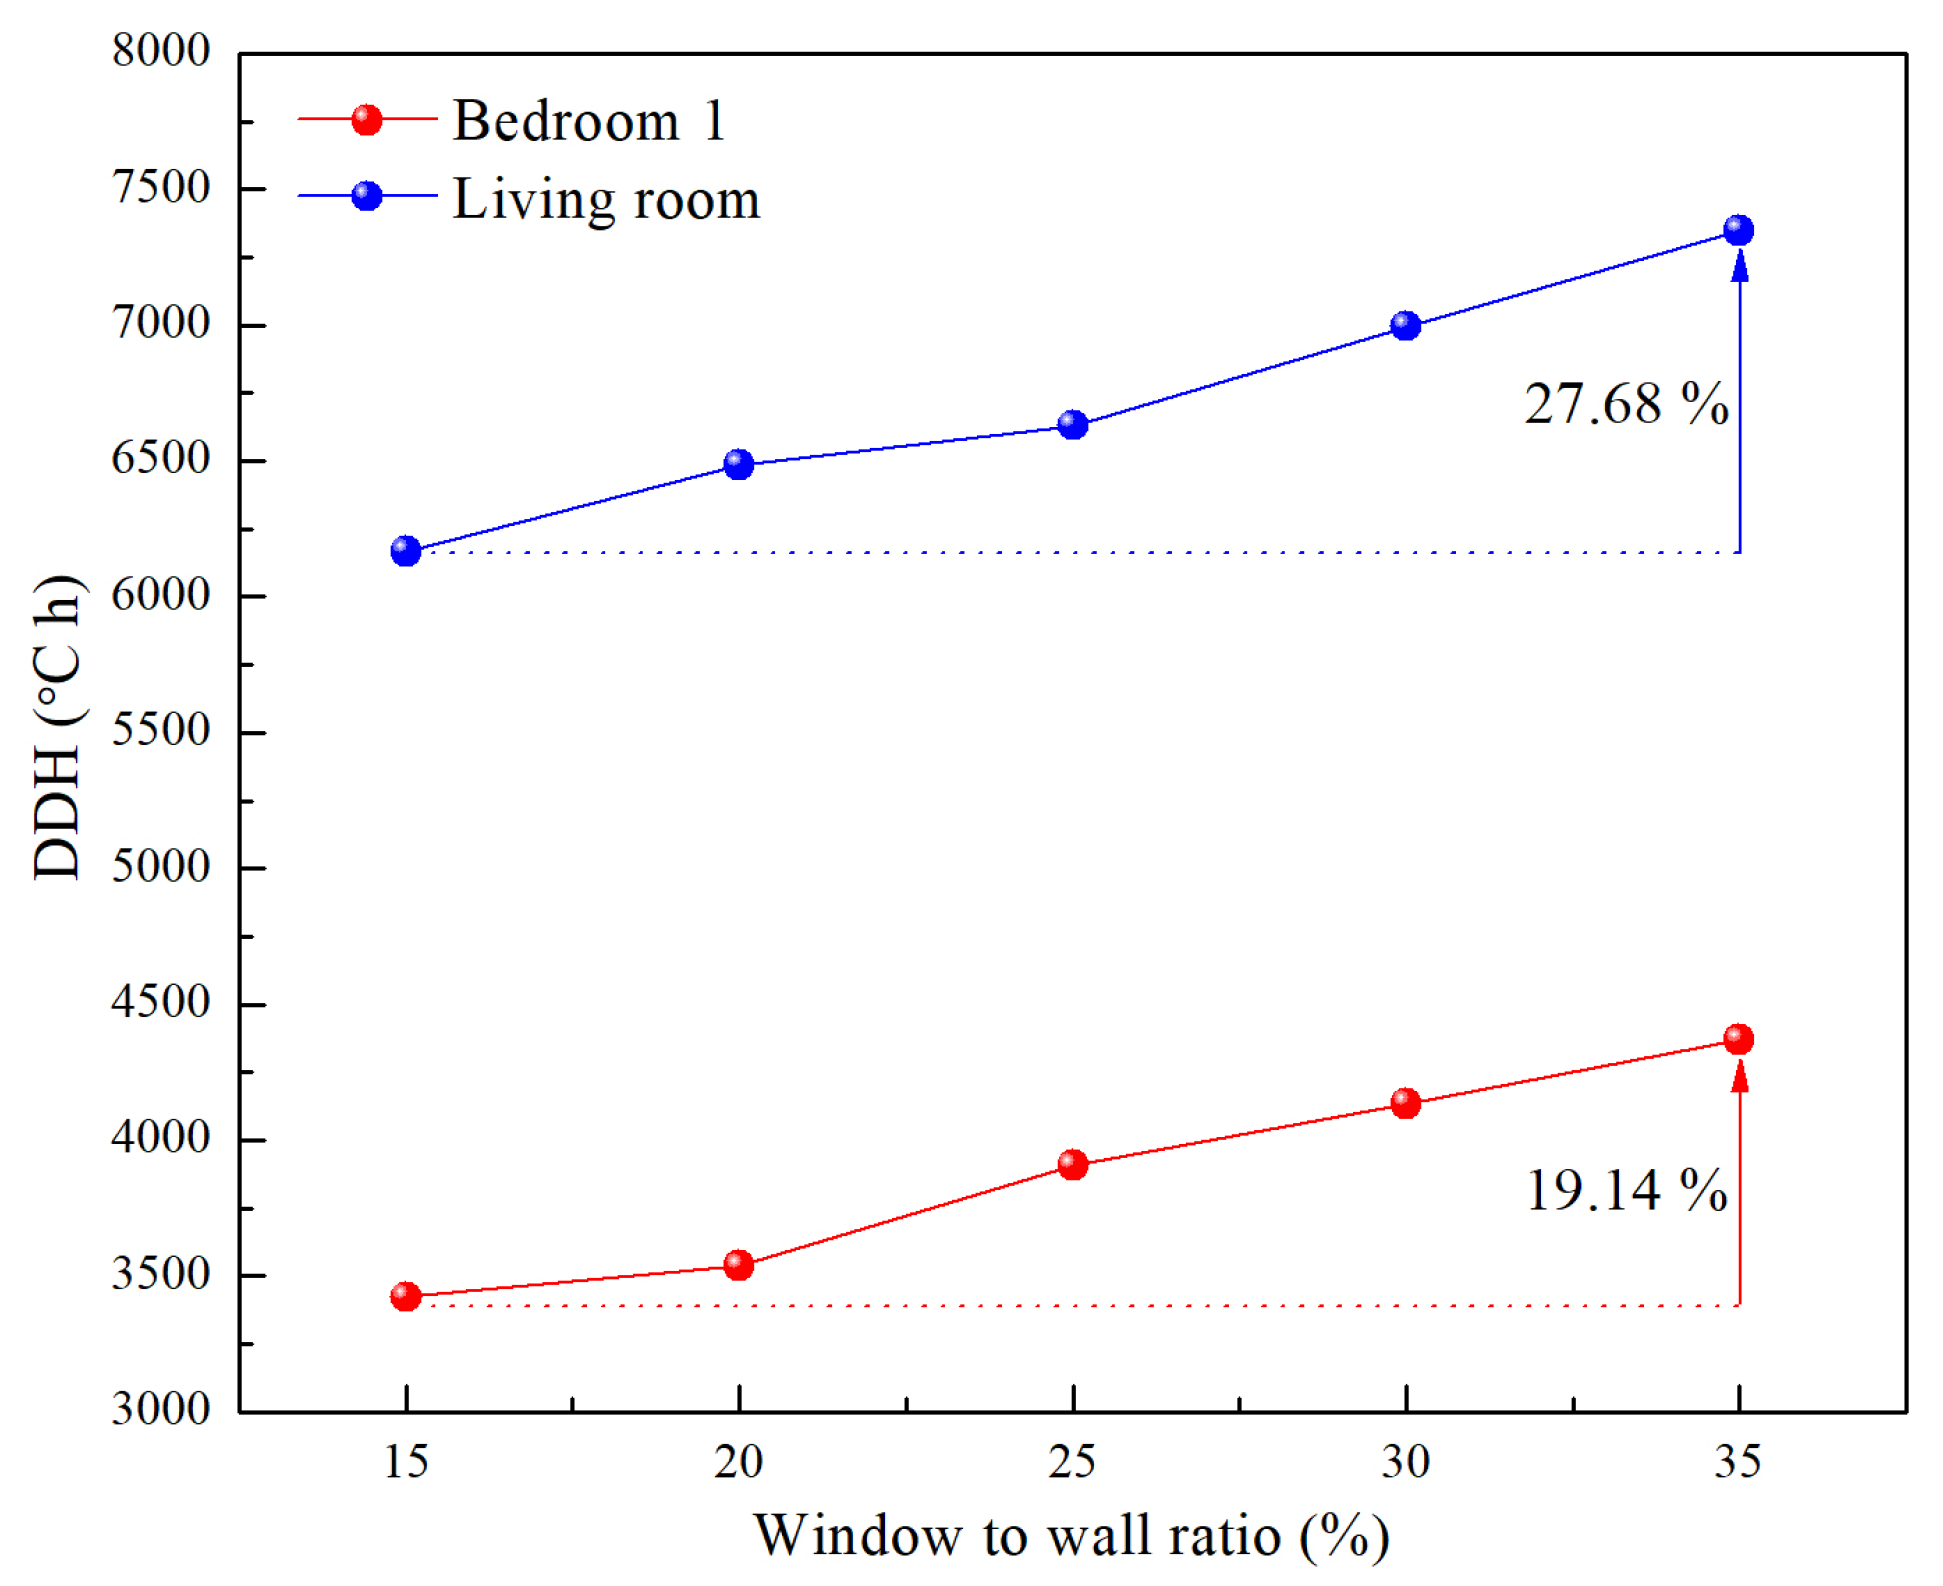
To quantitatively evaluate the cooling performance of night ventilation with increasing WWR, the DDH values of Bedroom 1 and the living room during the summer (from June 1 to August 31) were calculated, and the results are presented in Figure 12. As shown in Figure 12, the DDH values of both studied rooms increased significantly with the growth of WWR. Specifically, the DDH value of Bedroom 1 increased by 19.14% as the WWR rose, and that of the living room increased by 27.68%. These results indicate that increasing the WWR without considering other cooling strategies can indeed lower nighttime indoor temperatures through night ventilation. However, it will also lead to a significant increase in the DDH values during the summer, which is detrimental to the overall cooling effectiveness of night ventilation.

3.3. Effect of Orientation on Indoor Thermal Environment for Night Ventilation Building

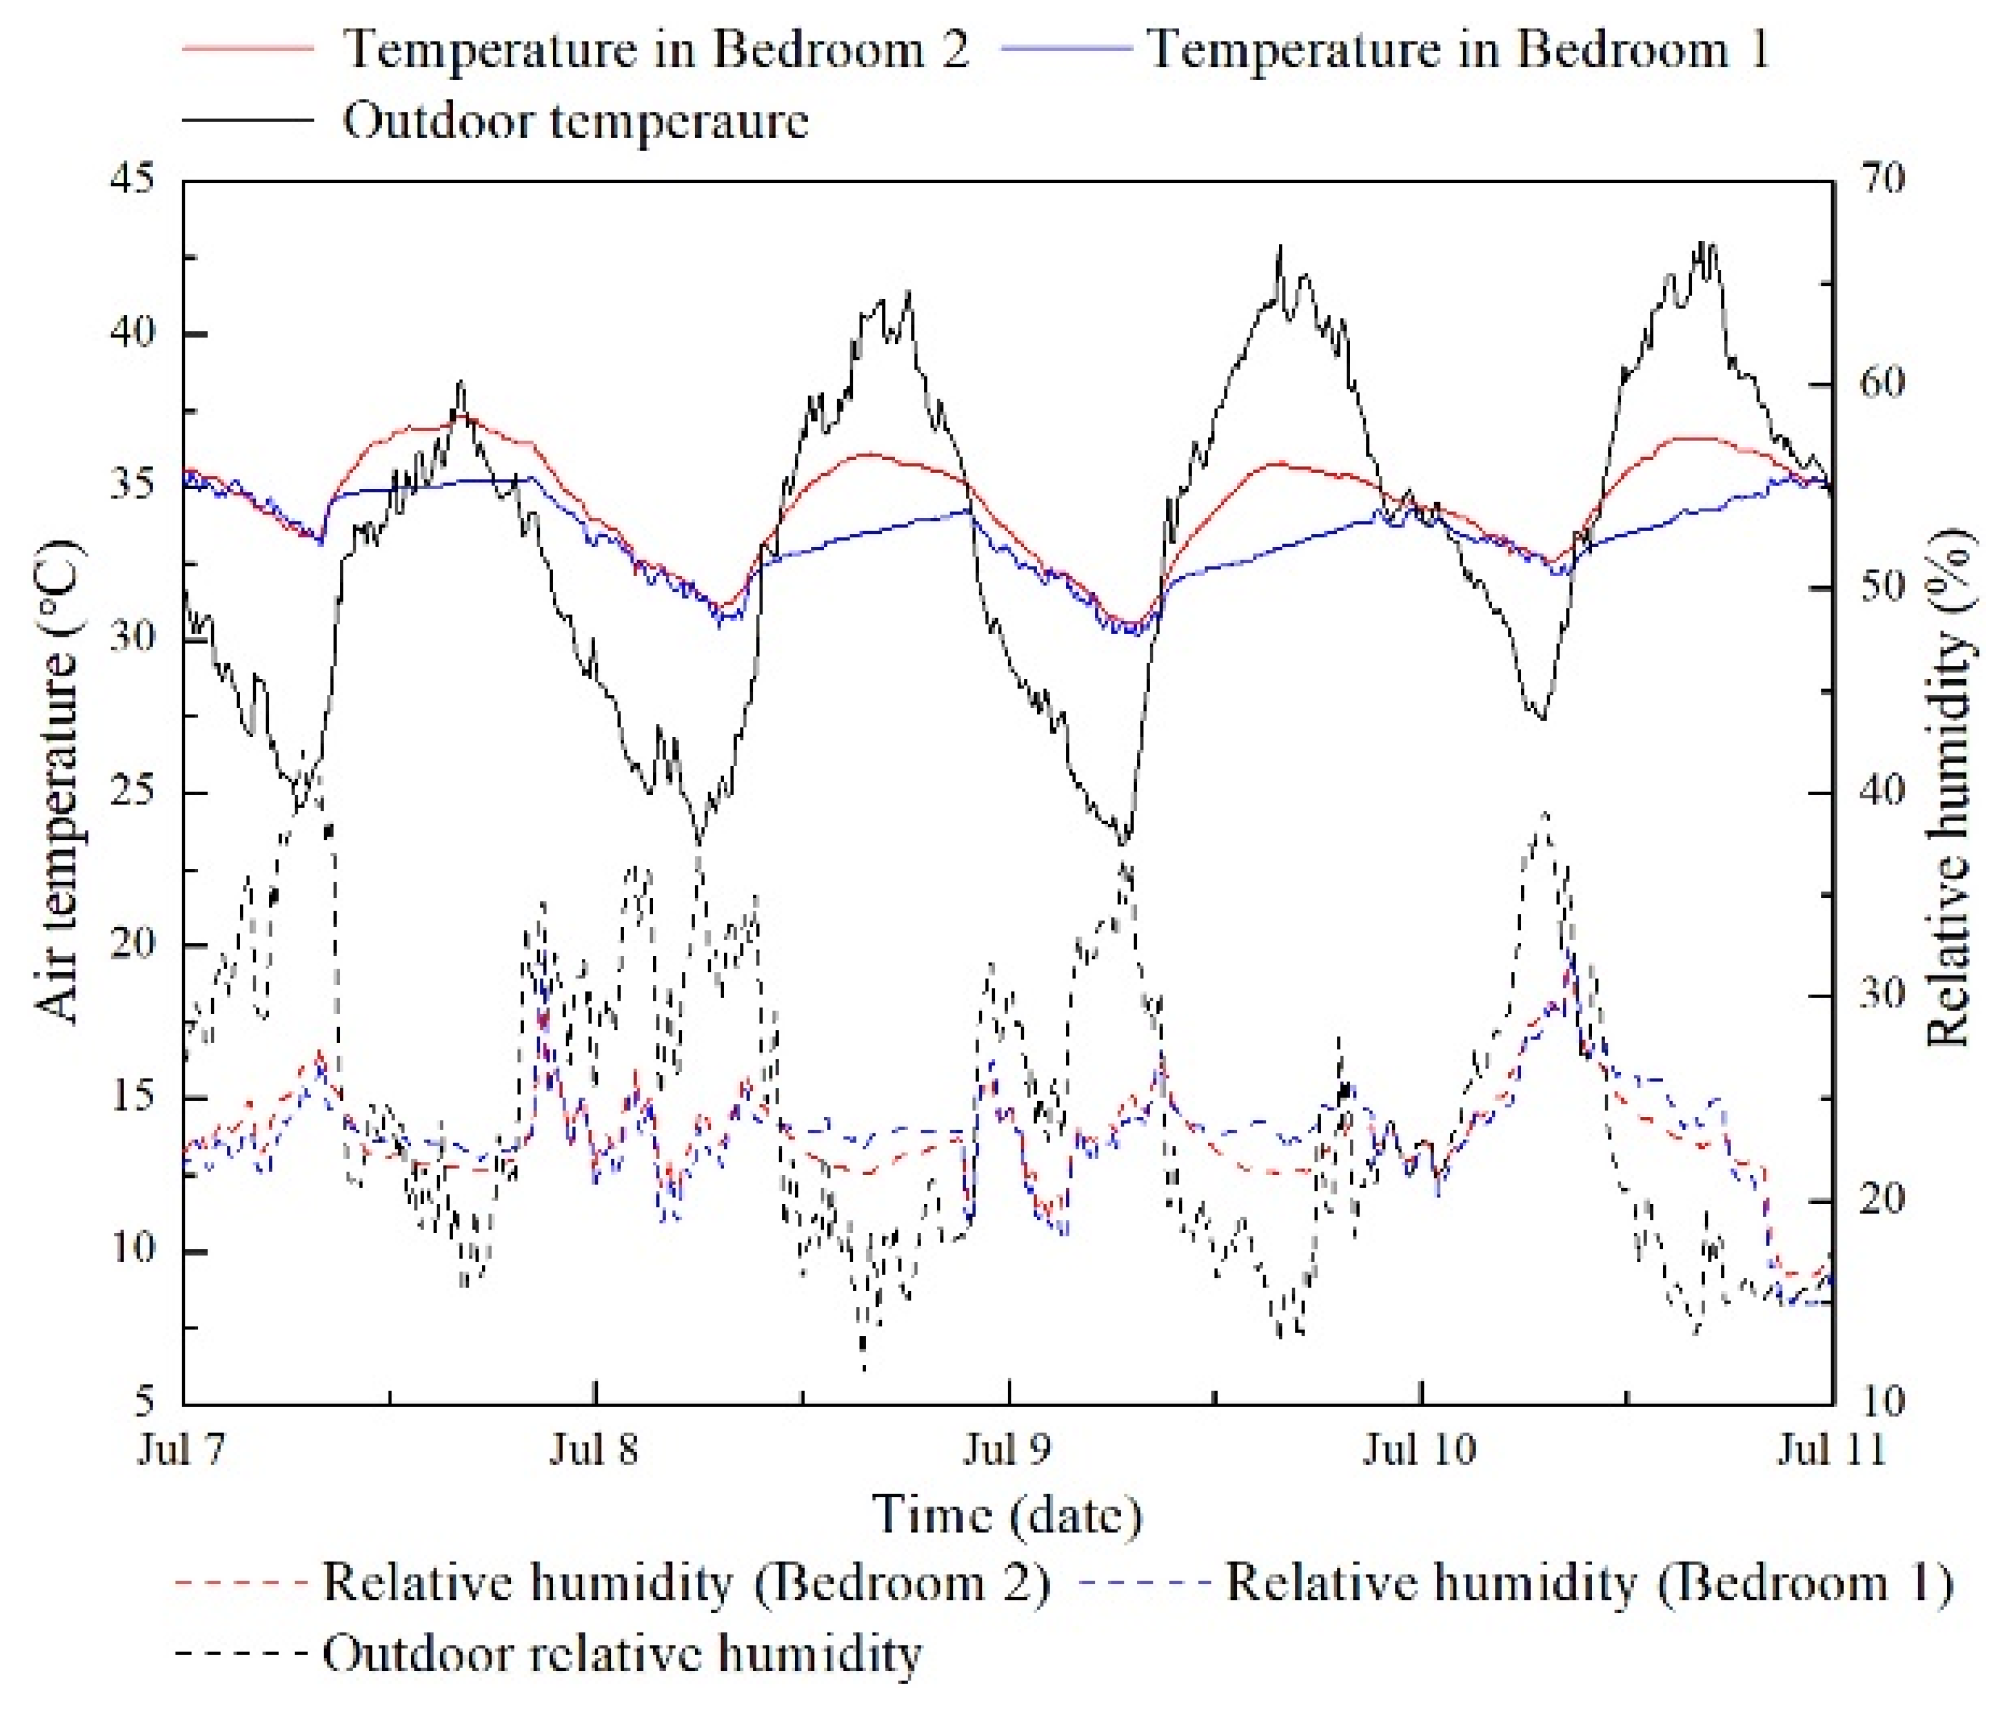
Building orientation is a critical factor that influences the indoor thermal comfort of night-ventilated buildings, especially in the Xinjiang Uygur Autonomous Region located in Northwest China [39]. To evaluate the impact of room orientation on the indoor thermal environment of naturally ventilated buildings in the Turpan basin, the indoor air temperature and relative humidity of the studied rooms with various orientations were measured from 0:00 on July 7 to 24:00 on July 10. Figure 13 illustrates the thermal conditions of the aboveground rooms with differing orientations. Upon closing the windows and doors in the morning, the indoor air temperature of the studied rooms correspondingly rose with the outdoor temperature. The indoor temperature of south-oriented Bedroom 2 increased rapidly to around 37 °C and reached its maximum at approximately 16:00, when the outdoor temperature was the highest. Conversely, north-facing Bedroom 1 experienced a slower temperature increase, and the peak indoor temperature occurred around 21:00, when the windows and doors were opened for night ventilation. During the period when the rooms were sealed, the measured indoor air temperature of Bedroom 2 was significantly higher than that of Bedroom 1. The average daytime indoor temperature of Bedroom 2 was 35.53 °C, which was 1.78 °C higher than that of Bedroom 1. The average daily indoor temperature fluctuation of Bedroom 2 was 4.55 °C, while that of Bedroom 1 was 3.43 °C. These results can be explained by direct solar energy gains through the south-facing windows, which accelerates indoor heat accumulation and temperature increase. Therefore, window shading is an effective approach to reduce the indoor temperature of south-facing rooms during summer in the Turpan basin. Notably, the indoor temperatures of two studied rooms decreased promptly when the windows and doors were opened for night ventilation, and the differences in indoor temperature between Bedroom 1 and Bedroom 2 during the night ventilation periods were minimal.
The Turpan basin is characterized by an extremely dry climate in summer, and as shown in Figure 13, the measured outdoor relative humidity values were below 40% during the second stage of the field measurements. There was a distinct correlation between outdoor temperature and relative humidity: outdoor relative humidity decreased as outdoor temperature increased, and rose as outdoor temperature decreased. The average outdoor relative humidity during this stage of the measurements was 24.54%, and the minimum value was as low as 11.60%. The maximum and minimum outdoor relative humidity values mostly occurred around 7:00 and 16:00, respectively. Compared to outdoor relative humidity, the indoor relative humidity values of two studied rooms fluctuated with a smaller amplitude. This phenomenon may be explained by the hygroscopic performance of the earthen envelopes—i.e., the adsorption and desorption isotherms of the earth materials. Zhang et al. [40] measured the equilibrium moisture contents of earth materials at different relative humidities, and the evolution of equilibrium moisture content with increasing relative humidity demonstrated that earthen materials are capable of regulating indoor relative humidity. In addition, obvious differences in indoor relative humidity between Bedroom 1 and Bedroom 2 were observed during the daytime, with the indoor relative humidity values of Bedroom 1 being higher than those of Bedroom 2. These results indicate that north-facing Bedroom 1 provides a more comfortable living space with lower indoor temperature and higher relative humidity in summer.
Figure 14 demonstrates the measured indoor air temperature and relative humidity values of two semi-underground rooms from 0:00 on July 7 to 24:00 on July 10. When the windows were kept closed during the daytime, the indoor temperatures of two semi-underground rooms remained roughly stable, and the indoor temperature variations in two studied rooms over time were close to each other, even though the studied rooms face opposite directions. When the windows were opened at around 21:00 in the evening, the indoor temperatures of two studied rooms gradually decreased at a similar rate, and the difference in the minimum indoor temperature between two semi-underground rooms was less than 1 °C. These results indicate that the effect of orientation on the indoor thermal environment of semi-underground rooms is negligible. In addition, the daytime indoor relative humidity values of the semi-underground rooms were higher than those at nighttime. When the windows were opened for ventilation at approximately 21:00, the indoor relative humidity of the semi-underground rooms decreased rapidly, and they then followed the trend of outdoor relative humidity.

3.4. Effect of Shading Projection Factor of Windows on Indoor Thermal Comfort of Night Ventilation Rooms

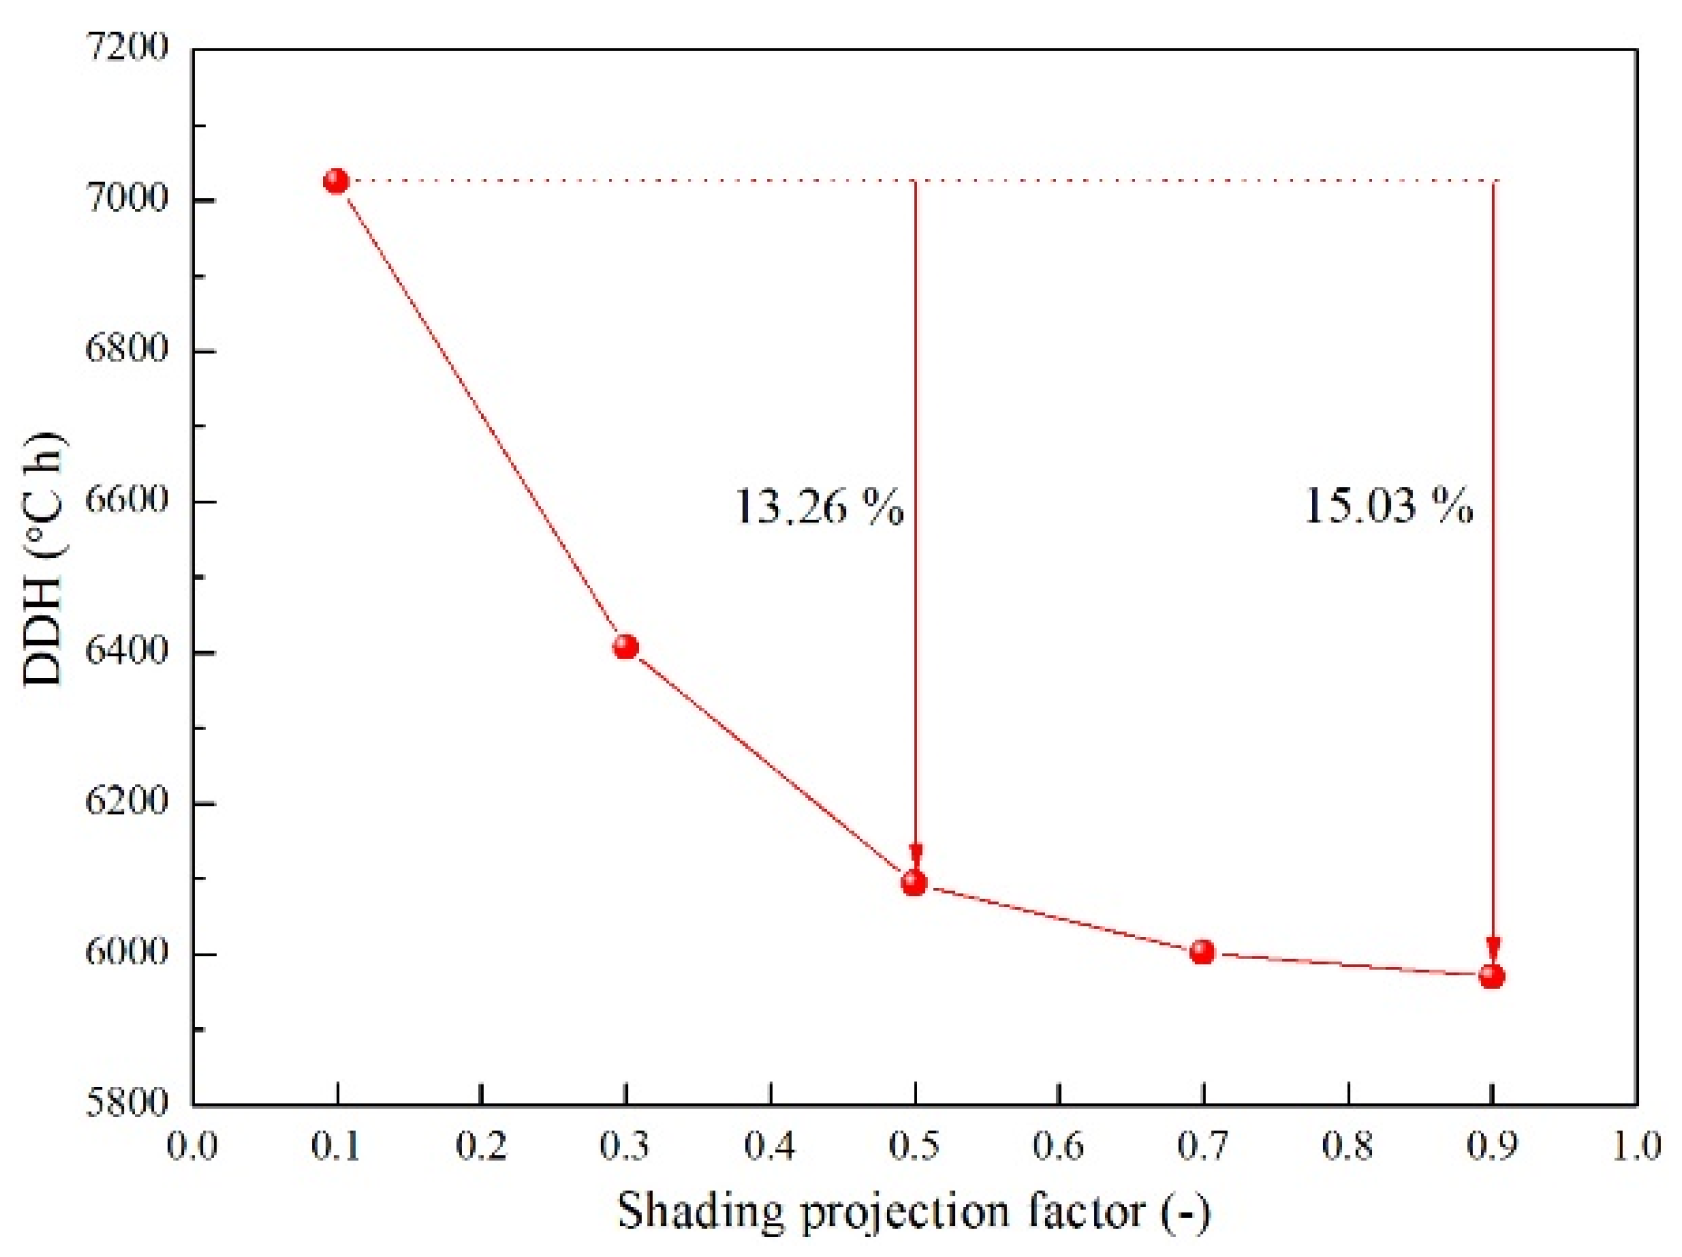
Increasing WWR is beneficial to the cooling performance of night ventilation but also increases solar radiation heat gain during the daytime, leading to a reduction in indoor thermal comfort. This issue is particularly prominent for south-facing rooms. Combining night ventilation with window shading can strike a balance between nighttime ventilation cooling and daytime solar heat gain mitigation, but parametric analysis of window shading devices is required to achieve the goal of these two passive design strategies exerting synergistic thermal regulation effects. Considering that a WWR of 35% leads to a significant increase in indoor temperature during the daytime, this study sets the WWR of the living room at 35% and adjusts the shading projection factor of its south-facing windows to 0.1, 0.3, 0.5, 0.7, and 0.9, respectively. Numerical simulations were conducted on the indoor environment of the living room in summer, and the simulated indoor air temperature results during the hottest week of the year were selected for analysis to explore the influence of the shading projection factor on the indoor thermal environment. As shown in Figure 15, the projection factor of shading devices installed on south-facing windows exerts a significant influence on the indoor air temperature of the living room. With an increase in the shading projection factor, the indoor air temperature of the living room exhibits a gradual decreasing trend. Specifically, when the shading projection factor is 0.1, the average daily maximum temperature during the hottest week reaches 42.69 °C. As the shading projection factor increases to 0.5, this average daily maximum temperature decreases by 0.62 °C. This observation indicates that installing appropriately sized shading devices on windows can offset the elevated daytime solar radiation heat gain resulting from the increased WWR, which is adopted to enhance night ventilation performance. Furthermore, when the shading projection factor is further increased to 0.9, no significant additional reduction in daytime indoor air temperature is observed. This is attributed to the fact that shading devices with a projection factor of 0.5 are already capable of blocking nearly all direct solar radiation, thereby eliminating the heating effect of solar radiation incident into the indoor space. Consequently, a further increase in the shading projection factor fails to yield substantial additional benefits.
Figure 16 depicts the variation in the DDH values in the living room with the shading projection factor of south-facing windows during the summer period (June 1 to August 31). As illustrated in the figure, the DDH of the living room decreases significantly as the shading projection factor increases from 0.1 to 0.9. Specifically, when the shading projection factor increases from 0.1 to 0.5, the DDH of the living room declines from 7025.55 °C h to 6094.01 °C h, corresponding to a reduction of 13.26%. When the shading projection factor is further increased to 0.9, the DDH only decreases by 124.19 °C h, accounting for an approximate reduction of 1.77%. These findings highlight the significance of adopting appropriately sized shading devices (with a shading projection factor of 0.5) for enhancing the summer thermal comfort of earth vernacular buildings in the Turpan basin. The combination of two passive strategies—window shading and night ventilation—can simultaneously address the requirements of nighttime ventilation cooling and daytime solar radiation heat gain reduction.

3.5. Comparison of Indoor Thermal Conditions Between the Above-Ground and Semi-Underground Rooms

The Turpan basin experiences an extremely harsh summer climate, characterized by intense solar radiation, high air temperature, and low relative humidity. Local individuals tend to construct semi-underground structures to counteract the overheating caused by these climatic conditions. To evaluate the improved thermal conditions in semi-underground spaces, the indoor thermal environment indexes of the semi-underground room have been compared with those of the above-ground room.
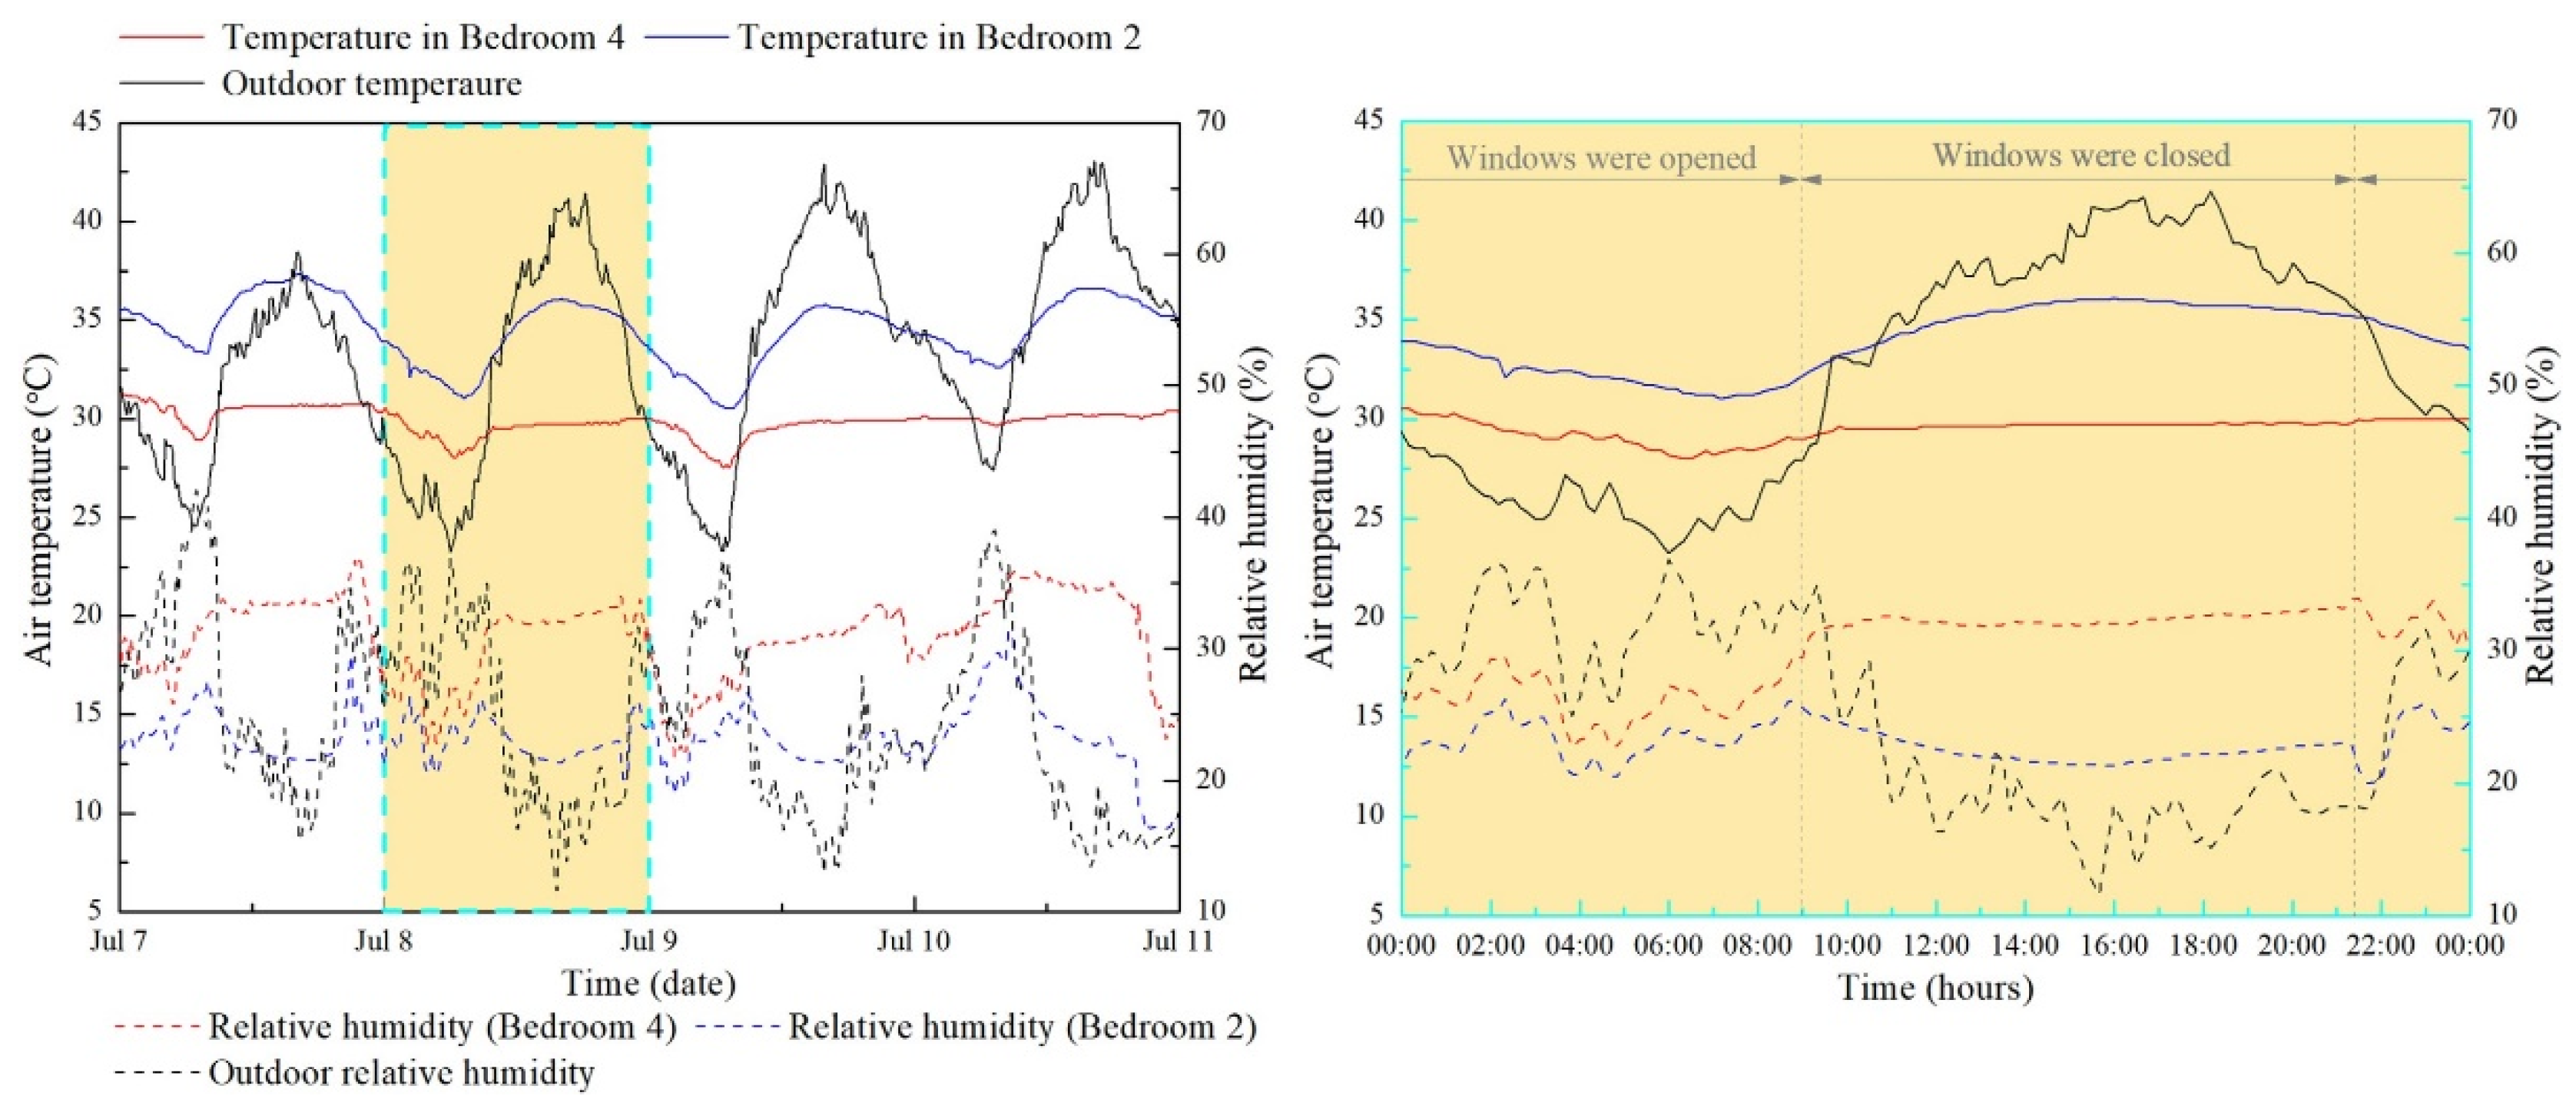
Figure 17 shows the indoor temperature and relative humidity of the studied rooms from 0:00 on July 7 to 24:00 on July 10. Bedroom 2 is an above-ground south-facing room, while Bedroom 4 is a semi-underground south-facing room. As shown in Figure 17, the indoor temperature of Bedroom 2 was significantly higher than that of Bedroom 4. The indoor temperature of Bedroom 2 ranged from 30.50 °C to 37.30 °C with an average temperature of 34.50 °C, while that of Bedroom 4 fluctuated between 27.50 °C and 31.20 °C with a mean temperature of 29.86 °C. During the 24 h period from July 8 to July 9, the maximum and minimum indoor temperatures of Bedroom 2 were 5.60 °C and 3 °C higher than those of Bedroom 4, respectively. In addition, the indoor temperature of Bedroom 2 was highly responsive to outdoor temperature. When the windows and doors were kept closed during the daytime, the indoor temperature of Bedroom 2 soared as the outdoor temperature increased and reached its peak around the time when the maximum outdoor temperature occurred. When the outdoor temperature dropped in the late afternoon, the indoor temperature of Bedroom 2 reduced slightly and remained above 35 °C until the windows were opened for ventilation. As the windows and doors were opened at about 21:00, cooler outdoor air was introduced into the indoor space for convective cooling, leading to a significant drop in the indoor temperature of Bedroom 2. Specifically, the indoor temperature of Bedroom 2 decreased from 35.20 °C to 30.50 °C during the night ventilation period (from 21:20 on July 8 to 8:45 on July 9). Notably different from Bedroom 2, the indoor temperature of Bedroom 4 remained almost constant when the windows were kept closed. As the outdoor temperature rose from 27.90 °C to 41.18 °C, the indoor temperature of Bedroom 4 increased by only 0.70 °C. Compared with Bedroom 2, Bedroom 4 presented a moister indoor environment during the field measurement. The indoor relative humidity of Bedroom 4 fluctuated within the range of 21.70% to 36.80%, with an average value of 30.94%. Residents in the Turpan basin exhibit a higher tolerance to indoor environment characterized by low relative humidity [38]. Generally, the relative humidity they prefer does not exceed 40%, which helps to maintain dry skin and smooth breathing. Consequently, the moister air in Bedroom 4 is beneficial for local residents’ thermal comfort and human health.
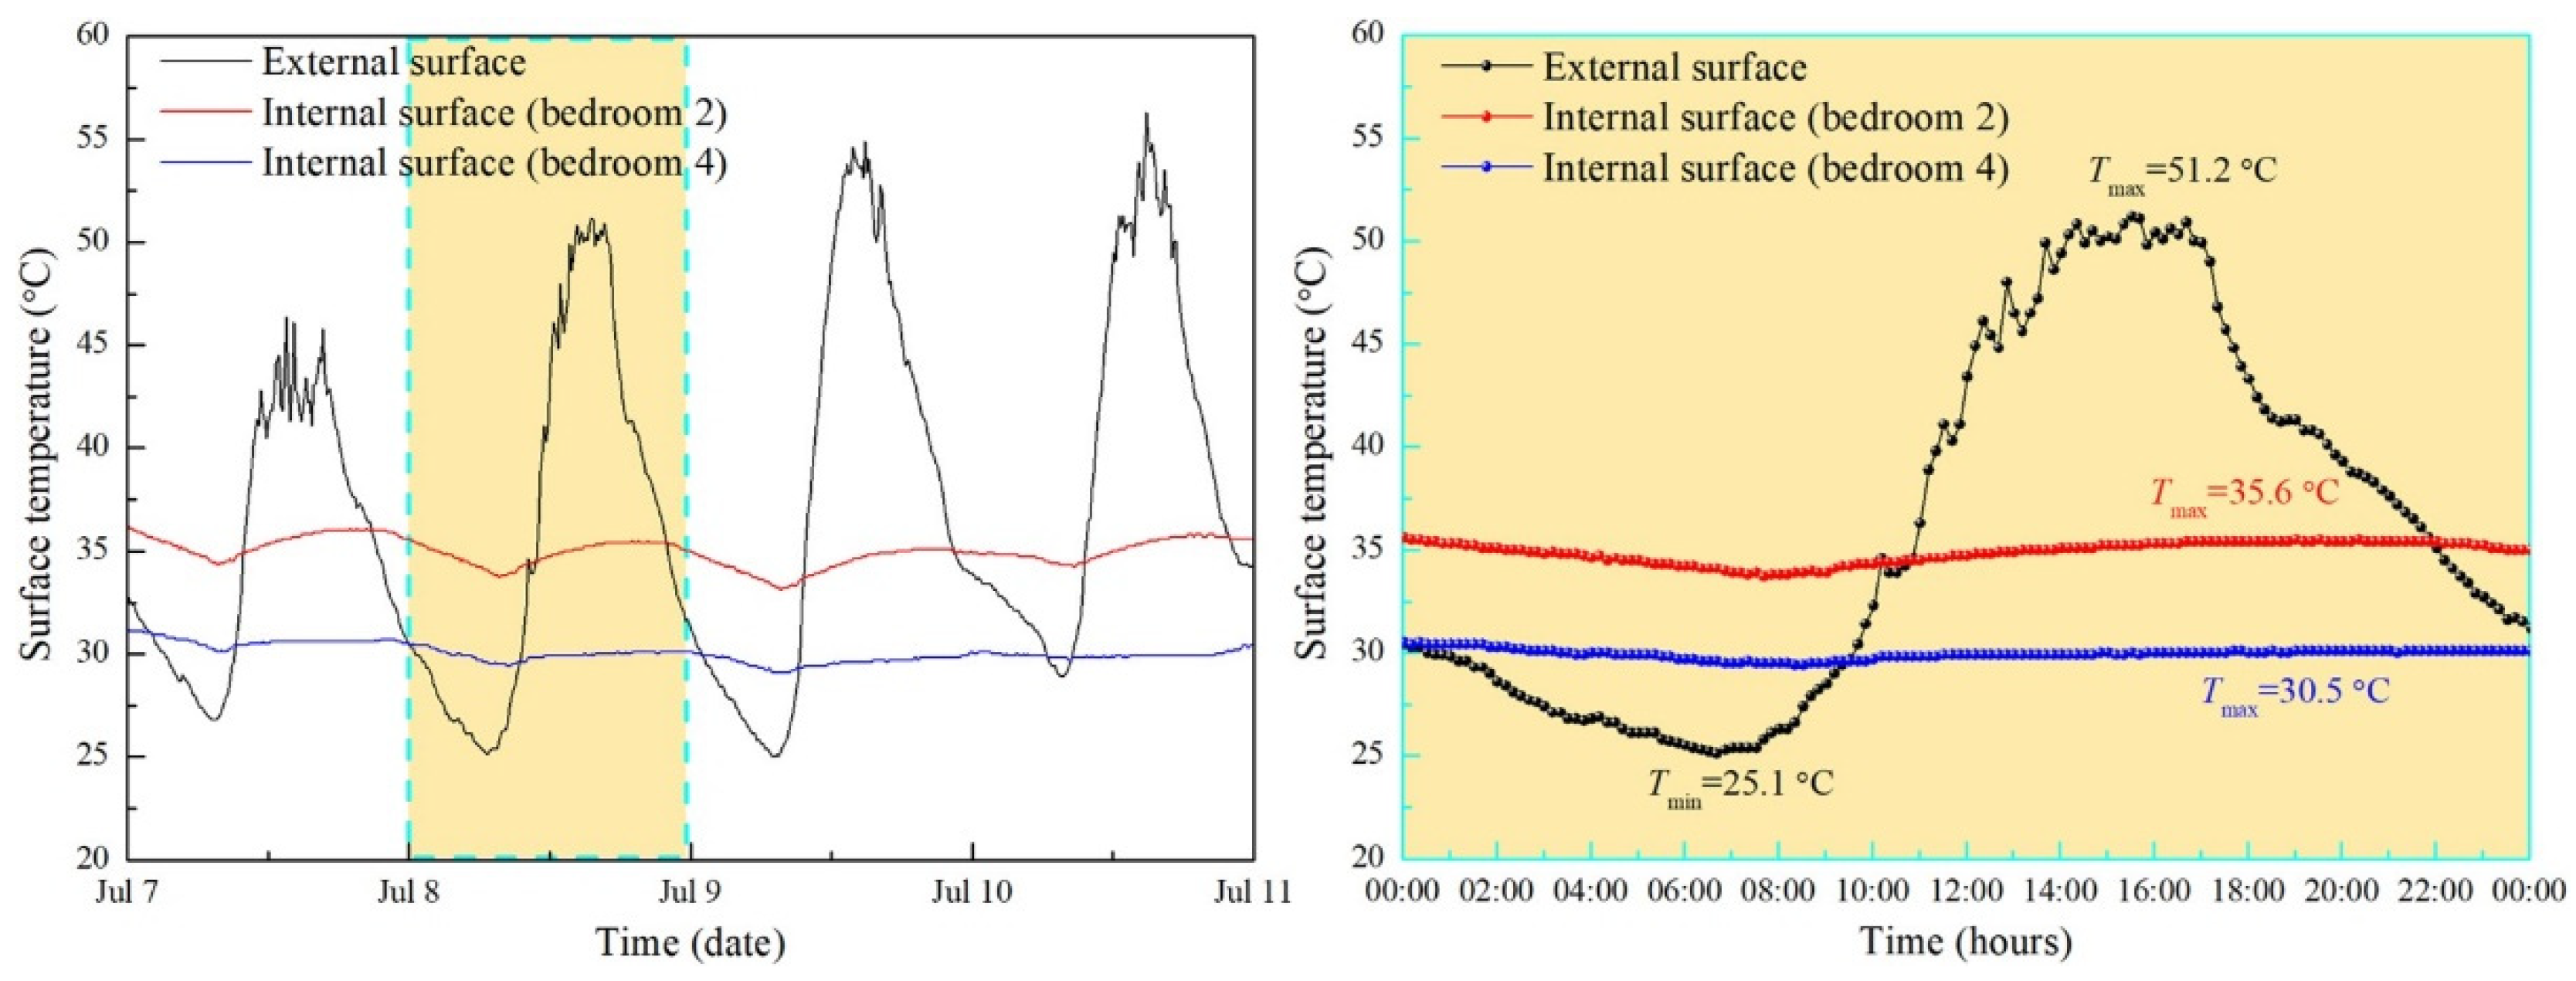
To explain the significant difference in indoor temperature between the above-ground and semi-underground rooms, the surface temperatures of the external walls were monitored, as depicted in Figure 18. The figure shows that the external surface temperature of the south-facing wall fluctuated violently, with an average diurnal variation of 25.75 °C. The daily maximum external surface temperatures reached up to 46.40 °C, 51.20 °C, 54.90 °C, and 56.30 °C, respectively. The large peaks and fluctuations in the external surface temperature were primarily due to heat transfer between the wall’s external surface and the outdoor environment, especially the excessive solar radiation absorbed by the external surface during the day. Notably, the internal surface temperature of Bedroom 2’s wall exhibited significantly smaller fluctuations than the external surface temperature. July 8 was selected as a representative day for in-depth analysis. The internal surface temperature of Bedroom 2’s wall ranged from 33.70 °C to 35.60 °C, with the maximum temperature occurring at 19:00. In contrast, the external surface temperature fluctuated between 25.10 °C and 51.20 °C, and its peak temperature appeared at 15:30. The daily amplitude of the external surface temperature was 13.7 times that of the internal surface temperature of Bedroom 2’s wall. Moreover, the occurrence of the maximum internal surface temperature was delayed by 3.5 h compared to that of the maximum external surface temperature. These results indicate that the thick earthen wall is capable of moderating temperature swings due to its high thermal resistance and thermal inertia. A notable difference in internal surface temperature was also observed between Bedroom 4’s and Bedroom 2’s walls. The internal surface temperature of Bedroom 4’s wall was lower than that of Bedroom 2’s wall. From 0:00 on July 8 to 24:00 on July 8, the maximum and average values of the internal surface temperature of Bedroom 4’s wall were 5.10 °C and 4.94 °C lower than those of Bedroom 2’s wall, respectively. In addition, the internal surface temperature of Bedroom 4’s wall exhibited a diurnal variation of only 1.10 °C, ranging from 29.40 °C to 30.50 °C. Consequently, constructing a semi-underground space is an effective method to mitigate outdoor thermal disturbance and enhance indoor thermal stability, owing to the substantial thermal storage capacity of the earth-appressed wall.

3.6. Effect of Air-Drying Shelter on Indoor Thermal Conditions for Night Ventilation Building

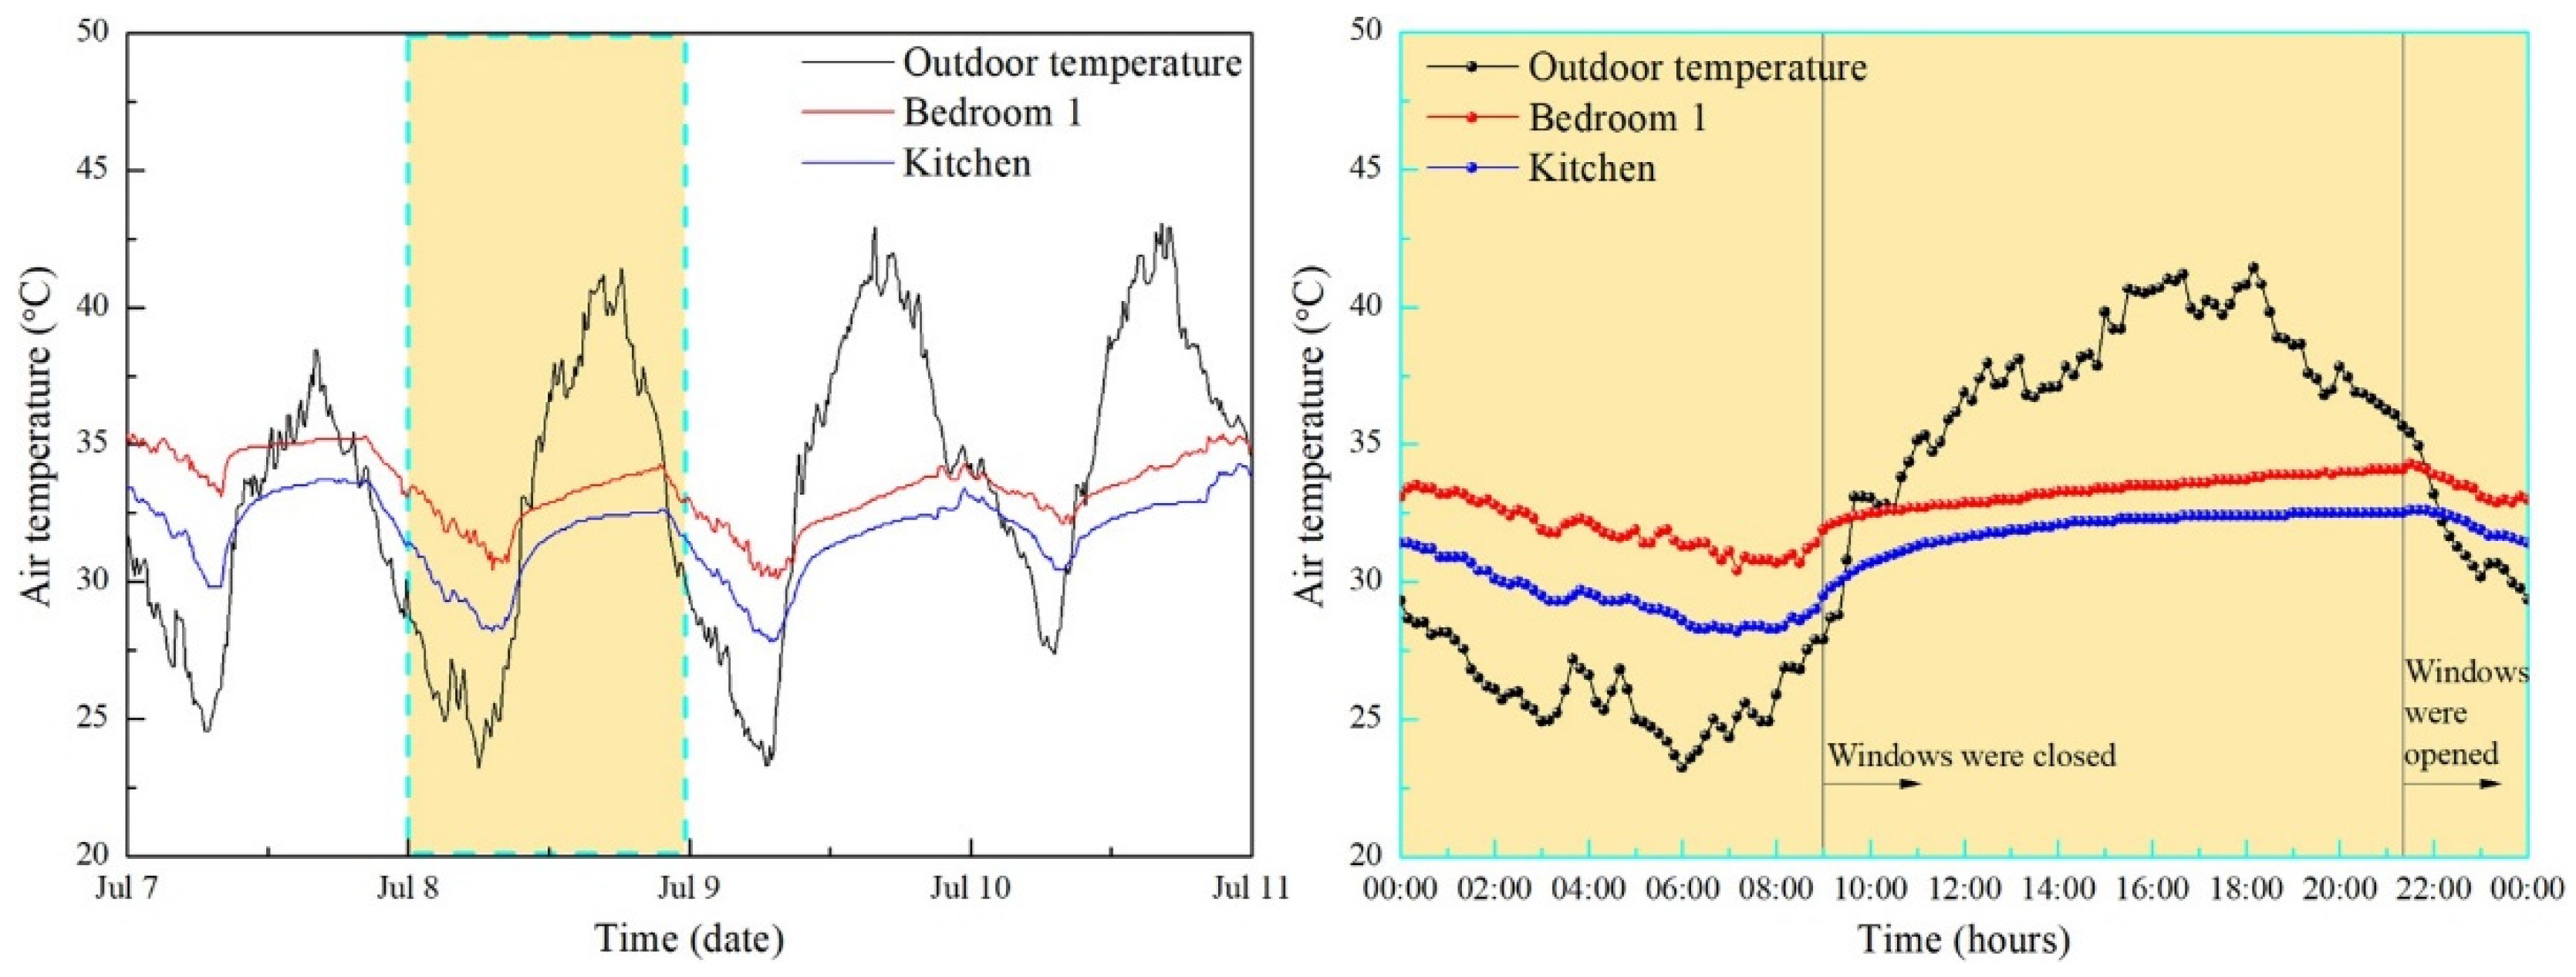
In this study, the indoor temperatures of Bedroom 1 and the kitchen were monitored, and further compared to each other to investigate the effect of air-drying shelter on the indoor environment. Bedroom 1 was selected as a reference room, while the kitchen represented a room with an air-drying shelter on its roof. Both rooms share similar design parameters, including orientation, window area and thermal performance of the building envelope. As shown in Figure 19, the indoor temperature of the kitchen consistently remained lower than that of Bedroom 1. The average indoor temperature of the kitchen was 33.44 °C, which was 1.70 °C lower than that of Bedroom 1. The room incorporating an air-drying shelter on the roof could provide a cooler indoor environment in summer. On July 8, a representative day for detailed analysis, the fluctuation in the indoor temperature of the kitchen was 4.40 °C, 0.50 °C higher than that of Bedroom 1. The cooler indoor environment and amplified daily temperature variation of the kitchen may be explained by the difference in the surface temperatures of the studied rooms’ roofs, as the air-drying shelter positioned on the kitchen’s roof is the most significant difference between the studied rooms.
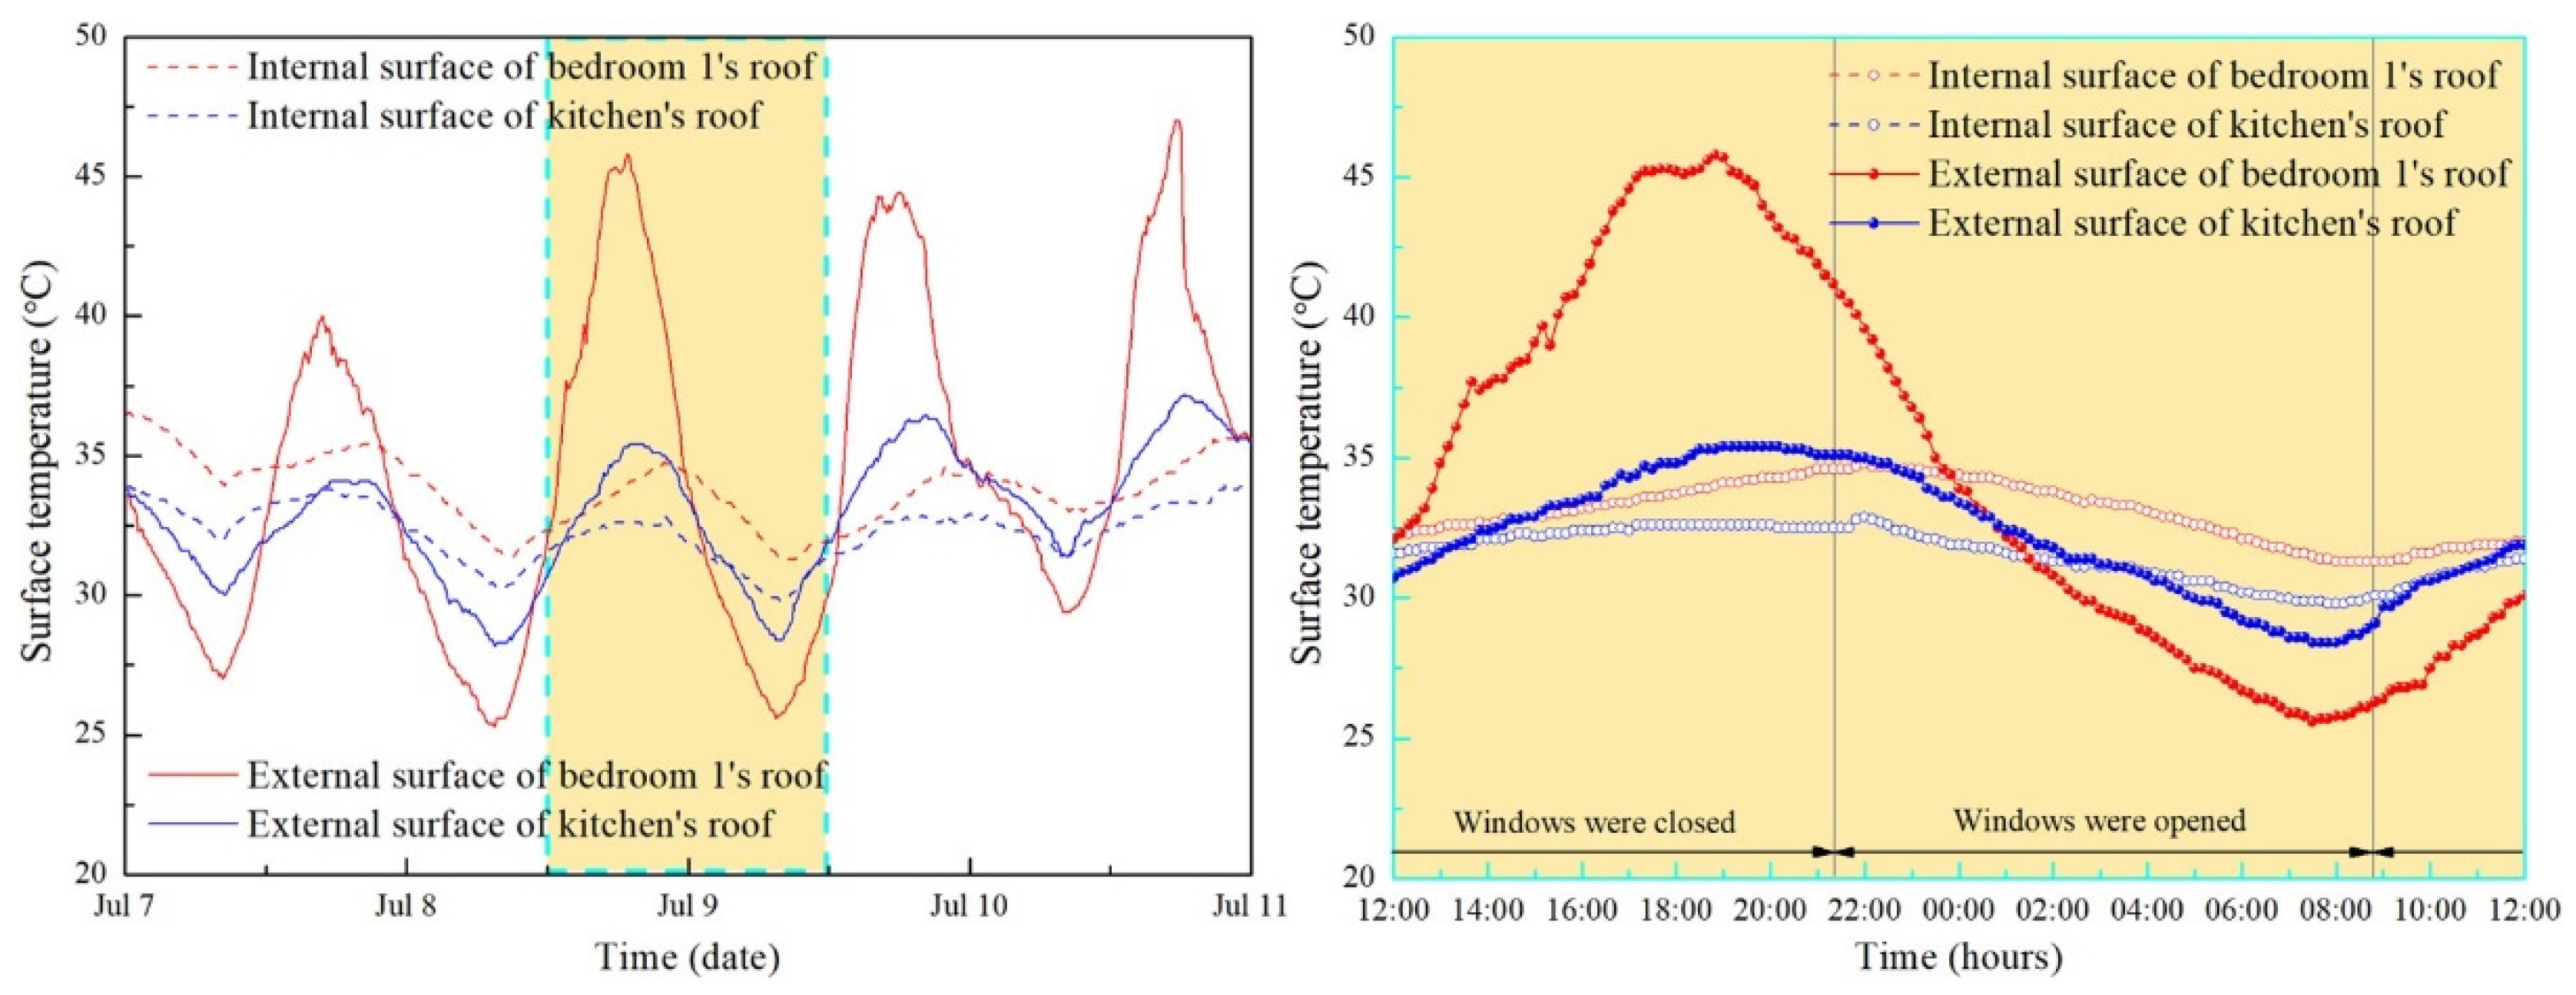
Figure 20 depicts the internal and external surface temperatures of the roofs of Bedroom 1 and the kitchen. Notably, there was a significant difference in the internal surface temperature distributions of the studied roofs. The internal surface temperature of the kitchen’s roof was lower than that of Bedroom 1’s roof, especially during the ventilation periods. From 12:00 on July 8 to 12:00 on July 9, the difference in the average values of the internal surface temperature during the sealed room period was 1.02 °C, while that during the night ventilation period was 2.09 °C. The lower internal surface temperature of the kitchen’s roof during the sealed room period was mainly attributed to the significantly lower external surface temperature of the kitchen’s roof. The maximum external surface temperature of the kitchen’s roof was 10.40 °C lower than that of Bedroom 1’s roof. When the windows were opened at nighttime, the internal surface temperatures of the studied roofs decreased due to the convective cooling caused by night ventilation. The difference in the internal surface temperatures between two studied roofs increased from 2.10 °C to 2.50 °C and then rapidly decreased to 1.30 °C. The maximum value of the internal surface temperature difference appeared around 0:00 on July 9. These observations suggest that the internal surface temperature of the kitchen’s roof dropped at a faster rate than that of Bedroom 1’s roof before midnight, because the internal surface of the kitchen’s roof absorbed less heat during the daytime and released stored heat more efficiently through convective cooling. The lower values and higher decrease rate of the internal surface temperature of the kitchen’s roof can be considered as the main reason for the lower values and larger daily fluctuation of the indoor temperature of the kitchen.
As shown in Figure 20, it is evident that the external surface temperature of Bedroom 1’s roof fluctuated within a wider range compared to that of the kitchen’s roof. From noon to midnight, the external surface temperature of Bedroom 1’s roof was significantly higher, due to the immense solar radiant heat absorbed by the external surface. Conversely, Bedroom 1’s roof exhibited lower external surface temperatures from midnight to the following morning. For instance, the external surface temperature of Bedroom 1’s roof decreased rapidly from around 19:00 on July 8, and dropped below the kitchen’s roof temperature after midnight on July 9. To explain this phenomenon, Figure 21 displays the monitored air temperatures of the outdoor environment and the air-drying shelter. It is well known that the external surfaces of building envelopes release heat through convective and radiative heat transfer during nighttime, where convective heat transfer is greatly influenced by outdoor air temperature and wind speed. As shown in Figure 21, the air temperature inside air-drying shelter was significantly higher than the outdoor temperature from midnight to the following morning, and the wind speed inside the air-drying shelter was notably lower than the outdoor wind speed. These factors led to a greater heat loss from the external surface of Bedroom 1’s roof in the form of convective heat transfer, resulting in a lower external surface temperature. Furthermore, the air-drying shelter on the roof obstructed the radiant heat dissipation from the roof’s external surface to the atmospheric window. This is another reason why the external surface temperature of Bedroom 1’s roof was lower than that of the kitchen’s roof during nighttime.

4. Conclusions and Limitations

This study conducted a two-stage field measurement (windows closed vs. night ventilation) and numerical simulation to investigate the night ventilation cooling performance and thermal performance of a typical vernacular building in Turpan basin. Major conclusions are as follows:
  • Night ventilation effectively reduces indoor temperature. On a representative day, two aboveground rooms and one semi-underground room cooled by 3.50 °C, 3.80 °C and 2 °C, respectively, during ventilation. For every 1 °C drop in outdoor temperature, indoor temperatures decreased by 0.22–0.34 °C (night ventilation) vs. 0.01–0.13 °C (windows closed). Night ventilation also lowered next-day peak temperatures by 2.90–3.20 °C.
  • Window-to-wall ratio and shading projection factor significantly affect thermal environment: Higher window-to-wall ratios enhance nighttime cooling but raise daytime temperatures and DDH values. DDH rose by 19.14% and 27.68% for two aboveground rooms when the ratio increased from 15% to 35%. Appropriately sized shading devices effectively mitigate daytime overheating from larger window areas. For rooms with a 35% window-to-wall ratio, DDH decreases by 13.26% when the shading projection factor increases from 0.1 to 0.5.
  • Building orientation matters for aboveground rooms: South-facing rooms experience faster warming and higher temperatures due to direct solar gain; north-facing rooms are more comfortable (lower temperature, higher relative humidity). Window shading improves south-facing rooms’ summer comfort. Orientation has negligible effects on semi-underground rooms.
  • Semi-underground rooms offer superior comfort: Compared to aboveground rooms, they have lower temperatures (5.60 °C lower maximum, 3 °C lower minimum on a representative day), smaller temperature fluctuations (3.7 °C vs. 6.80 °C), and higher relative humidity (21.70–36.80%), benefiting local residents’ thermal comfort and health.
  • Thick earth walls mitigate temperature swings via high thermal resistance and inertia: The external surface temperature’s daily amplitude was 13.7 times that of the internal surface, with a 3.5 h lag in peak internal temperature. Semi-underground rooms’ wall internal surfaces were 5.10 °C cooler on average, with a diurnal variation of only 1.10 °C, enhancing thermal stability.
  • Air-drying shelters regulate roof heat transfer: They reduced roof external surface temperature from noon to midnight and lowered average indoor temperature by 1.70 °C. During sealed and night ventilation periods, roof internal surface temperatures decreased by 1.02 °C and 2.09 °C, respectively.
A major limitation of this study lies in the insufficient exploration on the cooling performance of natural night ventilation integrated with mechanical ventilation. The combination of mechanical ventilation and natural night ventilation can augment the air flow entering the indoor environment during the night. Due to the significant difference between the outdoor temperature and indoor temperature during summer nights in the Turpan basin, mechanical ventilation can be employed to increase the air change rate of night ventilation, which can contribute to the reduction in the indoor temperature and cooling of indoor thermal mass, thus enhancing the cooling performance of night ventilation for the vernacular buildings in the Turpan basin. The strengthening effect of mechanical ventilation on the cooling performance of natural night ventilation should be considered in future studies, in order to provide a more effective reference for modern vernacular buildings with low energy consumption in the Turpan basin.

Author Contributions

Conceptualization, L.Z. and W.Z.; methodology, L.Z. and W.Z.; validation, Q.H. and L.Z.; formal analysis, Q.H. and L.Z.; investigation, Q.H. and L.Z.; resources, L.Z., G.S. and Y.Z.; data curation, Q.H., L.Z. and W.Z.; writing—original draft preparation, Q.H. and L.Z.; writing—review and editing, W.Z., G.S. and Y.Z.; visualization, Q.H.; supervision, W.Z., G.S. and Y.Z.; project administration, W.Z.; funding acquisition, L.Z. and W.Z. All authors have read and agreed to the published version of the manuscript.

Funding

This study is supported by the National Nature Science Foundation of China (No. 52008337) and Shaanxi Provincial Key Research and Development Project (No. 2024SF-YBXM-629).

Data Availability Statement

The raw data supporting the conclusions of this article will be made available by the authors on request.

Conflicts of Interest

The authors declare no conflicts of interest.

References

  1. Arumugam, P.; Ramalingam, V.; Vellaichamy, P. Effective PCM, insulation, natural and/or night ventilation techniques to enhance the thermal performance of buildings located in various climates–A review. Energy Build. 2022, 258, 111840. [Google Scholar] [CrossRef]
  2. Zhang, Z.; Zhang, Y.; Jin, L. Thermal comfort in interior and semi-open spaces of rural folk houses in hot-humid areas. Build. Environ. 2018, 128, 336–347. [Google Scholar] [CrossRef]
  3. Zheng, W.; Wei, F.; Su, S.; Cai, J.; Wei, J.; Hu, R. Effect of the envelope structure on the indoor thermal environment of low-energy residential building in humid subtropical climate: In case of brick-timber vernacular dwelling in China. Environ. Technol. Innov. 2022, 28, 102884. [Google Scholar] [CrossRef]
  4. Yang, W.; Xu, J.; Lu, Z.; Yan, J.; Li, F. A systematic review of indoor thermal environment of the vernacular dwelling climate responsiveness. J. Build. Eng. 2022, 53, 104514. [Google Scholar] [CrossRef]
  5. Liu, M.; Shen, B.; Liu, L.; Li, Q.; Mao, W.; Gan, Z.; Liu, H. Source tracing the bedroom bacteria across different climate zones in China during the heating season. Build. Environ. 2024, 259, 111651. [Google Scholar] [CrossRef]
  6. Huang, L.; Hamza, N.; Lan, B.; Zahi, D. Climate-responsive design of traditional dwellings in the cold-arid regions of Tibet and a field investigation of indoor environments in winter. Energy Build. 2016, 128, 697–712. [Google Scholar] [CrossRef]
  7. Sun, H.; Leng, M. Analysis on building energy performance of Tibetan traditional dwelling in cold rural area of Gannan. Energy Build. 2015, 96, 251–260. [Google Scholar] [CrossRef]
  8. Zhang, J.; Xu, W.; Li, A.; Zheng, K.; Zhang, J. Modified method for evaluating improved technologies for indoor thermal environment of earth buildings. Build. Environ. 2018, 144, 673–681. [Google Scholar] [CrossRef]
  9. Li, Q.; You, R.; Chen, C.; Yang, X. A field investigation and comparative study of indoor environmental quality in heritage Chinese rural buildings with thick rammed earth wall. Energy Build. 2013, 62, 286–293. [Google Scholar] [CrossRef]
  10. Nie, Q.; Zhao, S.; Zhang, Q.; Liu, P.; Yu, Z. An investigation on the climate-responsive design strategies of vernacular dwellings in Khams. Build. Environ. 2019, 161, 106248. [Google Scholar] [CrossRef]
  11. Zhu, X.; Liu, J.; Yang, L.; Hu, R. Energy performance of a new Yaodong dwelling, in the loess Plateau of China. Energy Build. 2014, 70, 159–166. [Google Scholar] [CrossRef]
  12. Zhu, J.; Tong, L.; Li, R.; Yang, J.; Li, H. Annual thermal performance analysis of underground cave buildings based on climate responsive design. Renew. Energy 2020, 145, 1633–1646. [Google Scholar] [CrossRef]
  13. Zhao, X.; Nie, P.; Zhu, J.; Tong, L.; Liu, Y. Evaluation of thermal environments for cliff-side cave dwellings in cold region of China. Renew. Energy 2020, 158, 154–166. [Google Scholar] [CrossRef]
  14. Yang, L.; Hao, T.; Liu, Y.; Yuan, W.; Liu, J. Dry and hot climate adaption prototype of Traditional dwellings. Build. Energy Effic. 2021, 49, 105–115. (In Chinese) [Google Scholar]
  15. Zhang, L.; Sang, G.; Han, W. Effect of hygrothermal behaviour of earth brick on indoor environment in a desert climate. Sustain. Cities Soc. 2020, 55, 102070. [Google Scholar] [CrossRef]
  16. Zhang, Q. Development of the typical meteorological database for Chinese locations. Energy Build. 2006, 38, 1320–1326. [Google Scholar] [CrossRef]
  17. Yan, H.; Yang, L.; Zheng, W.; He, W.; Li, D. Analysis of behaviour patterns and thermal responses to a hot-arid climate in rural China. J. Therm. Biol. 2016, 59, 92–102. [Google Scholar] [CrossRef]
  18. Chang, S.; He, W.; Yan, H.; Yang, L.; Song, C. Influences of vernacular building spaces on human thermal comfort in China’s arid climate areas. Energy Build. 2021, 244, 110978. [Google Scholar] [CrossRef]
  19. Yang, L.; Fu, R.; He, W.; He, Q.; Liu, Y. Adaptive thermal comfort and climate responsive building design strategies in dry-hot and dry-cold areas: Case study in Turpan, China. Energy Build. 2020, 209, 109678. [Google Scholar] [CrossRef]
  20. He, W.; Wu, Z.; Jin, R.; Liu, J. Organization and evolution of climate responsive strategies, used in Turpan vernacular buildings in arid region of China. Front. Archit. Res. 2023, 12, 556–574. [Google Scholar] [CrossRef]
  21. Zhang, L.; Sang, G.; Zhu, Y.; Cui, X.; Han, W.; Zhang, Y.; Yu, H. Thermal regulation mechanism of air-drying shelter to indoor environment of earth buildings located in Turpan basin with extremely dry and hot climate conditions. Sustain. Cities Soc. 2023, 91, 104416. [Google Scholar] [CrossRef]
  22. Zhang, L.; Sang, G.; Cui, X.; Han, W. Design optimization of rural building in dry-hot and dry-cold area using a back propagation (BP) neural network. Energy Build. 2022, 259, 111899. [Google Scholar] [CrossRef]
  23. Ezzeldin, S.; Rees, S.J. The potential for office buildings with mixed-mode ventilation and low energy cooling systems in arid climates. Energy Build. 2013, 65, 368–381. [Google Scholar] [CrossRef]
  24. Mohamed, S.; Al-Khatri, H.; Calautit, J.; Omer, S.; Riffat, S. The impact of a passive wall combining natural ventilation and evaporative cooling on school’s thermal conditions in a hot climate. J. Build. Eng. 2021, 44, 102624. [Google Scholar] [CrossRef]
  25. Osman, M.M.; Sevinc, H. Adaptation of climate-responsive building design strategies and resilience to climate change in the hot/arid region of Kharttoum, Sudan. Sustain. Cities Soc. 2019, 47, 101429. [Google Scholar] [CrossRef]
  26. Dong, X.; Soebarto, V.; Griffith, M. Achieving thermal comfort in naturally ventilated rammed earth houses. Build. Environ. 2014, 82, 588–598. [Google Scholar] [CrossRef]
  27. Solgi, E.; Hamedani, Z.; Fernando, R.; Skates, H.; Orji, N.E. A literature review of night ventilation strategies in buildings. Energy Build. 2018, 173, 337–352. [Google Scholar] [CrossRef]
  28. Michael, A.; Demosthenous, D.; Philokyprou, M. Natural ventilation for cooling in Mediterranean climate: A case study in vernacular architecture of Cyprus. Energy Build. 2017, 144, 333–345. [Google Scholar] [CrossRef]
  29. Kyritsi, E.; Michael, A. An assessment of the impact of natural ventilation strategies and window opening patterns in office buildings in the mediterranean basin. Build. Environ. 2020, 175, 106384. [Google Scholar] [CrossRef]
  30. Taleb, H.M. Natural ventilation as energy efficient solution for achieving low-energy houses in Dubai. Energy Build. 2015, 99, 284–291. [Google Scholar] [CrossRef]
  31. Omrani, S.; Garcia-Hansen, V.; Capra, B.R.; Drogemuller, R. Effect of natural ventilation mode on thermal comfort and ventilation performance: Full-scale measurement. Energy Build. 2017, 156, 1–16. [Google Scholar] [CrossRef]
  32. Izadyar, N.; Miller, W.; Rismanchi, B.; Garcia-Hansen, V. Impacts of façade openings’ geometry on natural ventilation and occupants’ perception: A review. Build. Environ. 2020, 170, 106613. [Google Scholar] [CrossRef]
  33. Al-Yasiri, Q.; Alktranee, M.; Szabó, M.; Arıcı, M. Building envelope-enhanced phase change material and night ventilation: Effect of window orientation and window-to-wall ratio on indoor temperature. Renew. Energy 2023, 218, 119263. [Google Scholar] [CrossRef]
  34. Guo, R.; Hu, Y.; Liu, M.; Heiselberg, P. Influence of design parameters on the night ventilation performance in office buildings based on sensitivity analysis. Sustain. Cities Soc. 2019, 50, 101661. [Google Scholar] [CrossRef]
  35. Rincón, L.; Carrobé, A.; Martorell, I.; Medrano, M. Improving thermal comfort of earthen dwellings in sub-Saharan Africa with passive design. J. Build. Eng. 2019, 24, 100732. [Google Scholar] [CrossRef]
  36. Bassoud, A.; Khelafi, H.; Mokhtari, A.M.; Bada, A. Evaluation of summer thermal comfort in arid desert areas. Case study: Old adobe building in Adrar (South of Algeria). Build. Environ. 2021, 205, 108140. [Google Scholar] [CrossRef]
  37. Fernandes, J.; Mateus, R.; Gervásio, H.; Silva, S.M.; Bragança, L. Passive strategies used in Southern Portugal vernacular rammed earth buildings and their influence in thermal performance. Renew. Energy 2019, 142, 345–363. [Google Scholar] [CrossRef]
  38. Yan, H.; Liu, Q.; Zhao, W.; Pang, C.; Dong, M.; Zhang, H.; Gao, J.; Wang, H.; Hu, B.; Yang, L.; et al. The coupled effect of temperature, humidity, and air movement on human thermal response in hot-humid and hot-arid climates in summer in China. Build. Environ. 2020, 177, 106898. [Google Scholar] [CrossRef]
  39. Dai, J.; Wang, J.; Bart, D.; Gao, W. The impact of building enclosure type and building orientation on indoor thermal comfort–A case study of Kashgar in China. Case Stud. Therm. Eng. 2023, 49, 103291. [Google Scholar] [CrossRef]
  40. Zhang, L.; Yang, L.; Jelle, B.P.; Wang, Y.; Gustavsen, A. Hygrothermal properties of compressed earthen bricks. Constr. Build. Mater. 2018, 162, 576–583. [Google Scholar] [CrossRef]
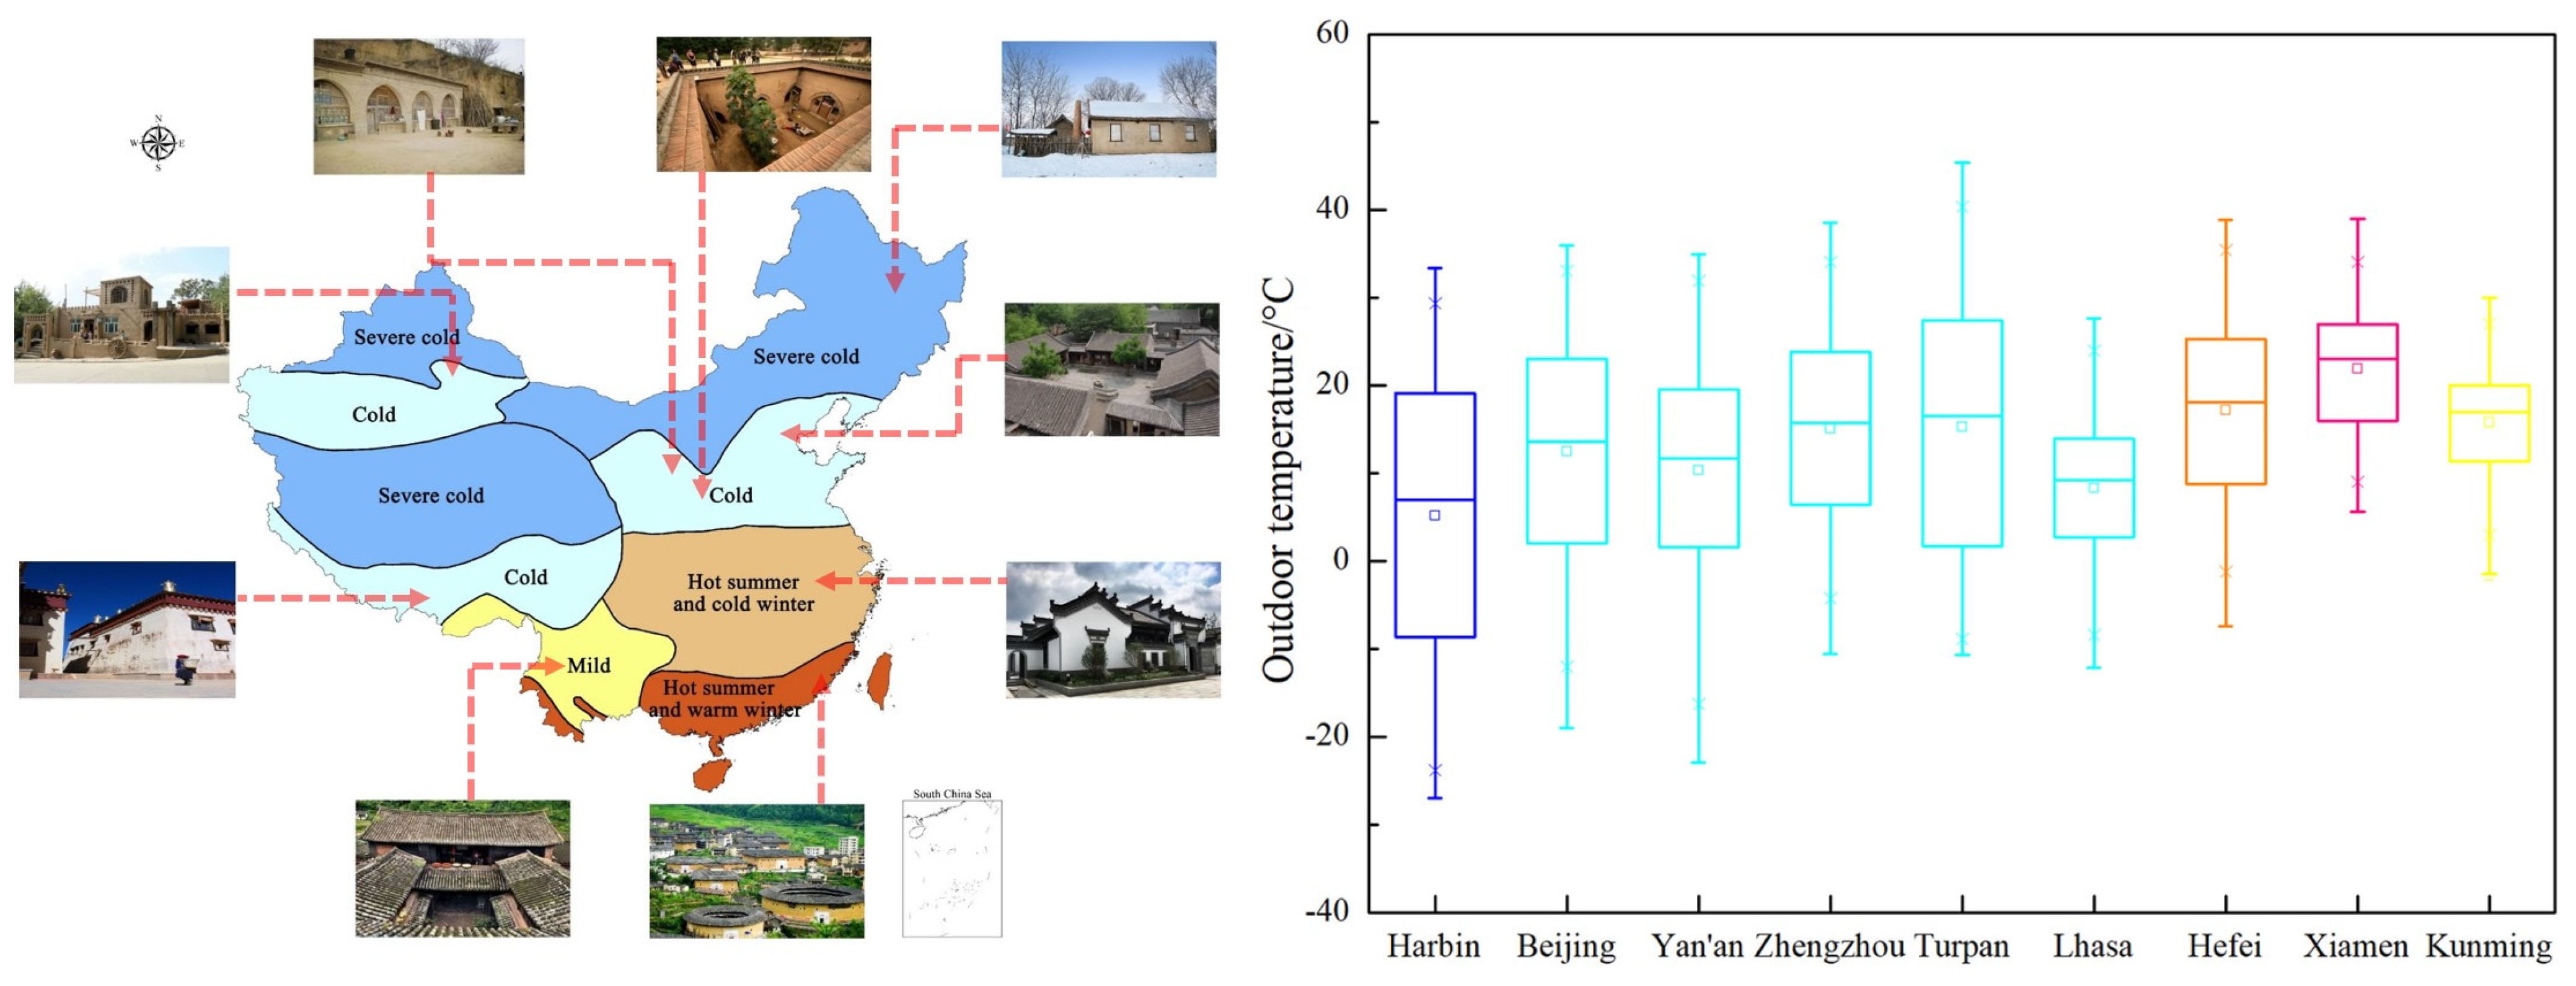
Figure 1. The vernacular dwellings in different climate zones (left) and climate conditions in typical cities of various climate zones (right). All images of the vernacular buildings’ appearance are downloaded from the internet, and these images are in open access.
Energies 18 06135 g001
Figure 2. Climate conditions for Turpan basin in summer: outdoor temperature and relative humidity (left) and solar irradiance and wind speed (right) [16].
Energies 18 06135 g002
Figure 3. The obvious features of vernacular building in Turpan basin. All images depicting the characteristics of the Turpan’s earthen buildings were taken on−site by the authors.
Energies 18 06135 g003
Figure 4. Exterior photo of vernacular building and indoor spaces. All images depicting the characteristics of the studied building were taken on−site by the authors.
Energies 18 06135 g004
Figure 5. Sectional details of the exterior wall and roof of the studied vernacular building.
Energies 18 06135 g005
Figure 6. Layout and measurement points of the studied building.
Energies 18 06135 g006
Figure 7. Outdoor climate conditions during the field measurements.
Energies 18 06135 g007
Figure 8. Indoor air temperature for different studied rooms during the field measurements.
Energies 18 06135 g008
Figure 9. Comparison between measured and simulated results of indoor temperature for two studied rooms.
Energies 18 06135 g009
Figure 10. The simulated results of indoor temperature in bedroom 1 with different window-to-wall ratio.
Energies 18 06135 g010
Figure 11. The simulated results of indoor temperature in living room with different window-to wall-ratio.
Energies 18 06135 g011
Figure 12. The DDH values of bedroom 1 and living room with window-to-wall ratio.
Energies 18 06135 g012
Figure 13. Indoor thermal environment indexes of the aboveground rooms.
Energies 18 06135 g013
Figure 14. Indoor thermal environment indexes of the semi-underground rooms.
Energies 18 06135 g014
Figure 15. The simulated results of indoor temperature in living room with different shading projection factors.
Energies 18 06135 g015
Figure 16. The DDH values of living room with various shading projection factors of windows.
Energies 18 06135 g016
Figure 17. Indoor thermal environment indexes of the southern rooms at different levels.
Energies 18 06135 g017
Figure 18. The surface temperature of the external walls for the studied rooms at different levels.
Energies 18 06135 g018
Figure 19. Comparison of indoor temperature between bedroom 1 and kitchen.
Energies 18 06135 g019
Figure 20. The surface temperature of the studied rooms’ roof.
Energies 18 06135 g020
Figure 21. The air temperature and wind speed values inside and outside air−drying shelter.
Energies 18 06135 g021
Table 1. The vernacular building’s characteristics.
Detail Information
Height7.07 m
Earth bricksBulk density is 1780 kg/m3. Thermal conductivity is 0.7246 W/m K. Specific heat capacity is 875 J/kg K.
Exterior wallsEarth walls with thickness of 500 mm. Thermal resistance is 0.69 m2 K/W. Thermal inertia is 1062 J/m2 K s1/2.
Interior wallsEarth walls with thickness of 200 mm. Thermal resistance is 0.27 m2 K/W. Thermal inertia is 1062 J/m2 K s1/2.
Building’s roofA multilayer roof composed of wooden flat board (10 mm), wooden grille (60 mm), wooden purlin (150 mm), wooden board (10 mm), straw mat, straw−soil (200 mm) and cement plaster (30 mm) in turn.
Air−drying shelter’s roofWooden flat board covered with 200 thick straw−soil.
Carved walls of air−drying shelter200 mm thick carved walls with sixty or ninety holes. The area of single hole is 0.04 m2.
WindowsPainted wooden frame windows with 6 mm thick single layer glazing.
Table 2. Operation schedule of windows and doors in indoor thermal environment measurement.
DateClosing TimeOpening Time
July 708:00 in the morning20:30 in the night
July 809:00 in the morning21:20 in the night
July 908:45 in the morning21:10 in the night
July 1009:15 in the morning20:15 in the night
Table 3. Parameters and setup information of the used devices.
EquipmentRangeAccuracyLogging Interval
TESTO 175-H1 temperature and humidity recorder−20~55 °C
0~100%RH
±0.4 °C
±2%RH
10 min
JTNT-A Multi-channel temperature recorder−20~120 °C± 0.5 °C10 min
DELTAOHM HD-31 Multifunction tester0.1~40 m/s±0.2 m/s10 s
ONSET H21-USB weather station−40~75 °C
0~100%RH
0~1280 W/m2
±0.2 °C
±2.5%RH
±10 W/m2
10 min
Disclaimer/Publisher’s Note: The statements, opinions and data contained in all publications are solely those of the individual author(s) and contributor(s) and not of MDPI and/or the editor(s). MDPI and/or the editor(s) disclaim responsibility for any injury to people or property resulting from any ideas, methods, instructions or products referred to in the content.