Abstract
While community energy initiatives and pilot projects have demonstrated technical feasibility and economic benefits, their site-specific nature limits transferability to systematic, scalable investment models. This study addresses this gap by proposing a modular framework for Renewable Energy Valleys (REVs), developed from real-world Community Energy Lab (CEL) demonstrations in Crete, Greece, which is an island with pronounced seasonal demand fluctuation, strong renewable potential, and ongoing hydrogen valley initiatives. Four modular business schemes are defined, each representing different sectoral contexts by combining a baseline of 50 residential units with one representative large consumer (hotel, rural households with thermal loads, municipal swimming pool, or hydrogen bus). For each scheme, a mixed-integer linear programming model is applied to optimally size and operate integrated solar PV, wind, battery (BAT) energy storage, and hydrogen systems across three renewable energy penetration (REP) targets: 90%, 95%, and 99.9%. The framework incorporates stochastic demand modeling, sector coupling, and hierarchical dispatch schemes. Results highlight optimal technology configurations that minimize dependency on external sources and curtailment while enhancing reliability and sustainability under Mediterranean conditions. Results demonstrate significant variation in optimal configurations across sectors and targets, with PV capacity ranging from 217 kW to 2840 kW, battery storage from 624 kWh to 2822 kWh, and hydrogen systems scaling from 65.2 kg to 192 kg storage capacity. The modular design of the framework enables replication beyond the specific context of Crete, supporting the scalable development of Renewable Energy Valleys that can adapt to diverse sectoral mixes and regional conditions.
1. Introduction
Electricity systems in Europe face the objectives of cutting carbon emissions while keeping supply secure and affordable. The rapid deployment of variable renewable energy sources (RES), mainly photovoltaic (PV) and wind, has introduced pronounced temporal and spatial mismatches between supply and demand. During periods of insufficient renewable output, systems incur substantial costs through reliance on external electricity imports (often non-renewable), whereas during periods of surplus generation, clean energy is frequently curtailed. These mismatches are further exacerbated by aging and capacity-constrained transmission grid infrastructure, which causes network congestion and impedes the seamless integration of additional renewable resources [1].
The European Clean Energy Package has catalyzed the development of community energy initiatives, with studies demonstrating that optimally designed energy communities can achieve up to 20% cost reductions and 6% emissions reductions compared to conventional energy supply systems [2]. However, a critical challenge in scaling these projects lies in the transition from unique, site-specific demonstration projects to standardized, replicable business models that can be systematically deployed across diverse geographical and socioeconomic contexts. While pilot implementations provide valuable technical insights, their varying scales, load compositions, and technology configurations often limit direct comparability and hinder the development of scalable investment frameworks [3].
Renewable Energy Valleys can address these challenges by coupling local storage, flexible demand, and smart grid controls at the community scale through the strategic integration of distributed renewable energy sources, advanced storage technologies, and sector coupling within a defined geographical region. These localized energy ecosystems can combine photovoltaics, wind turbines (WT), battery energy storage systems (BESS), hydrogen production and storage, and electric mobility infrastructure to create resilient, self-sufficient energy communities that significantly reduce dependence on centralized grid systems while providing economic and environmental benefits to local stakeholders [4].
Crete, the largest Greek island (8336 km2) and fifth largest in the Mediterranean, has 634,930 residents whose numbers, and electricity demand nearly double during the May–October tourist season, peaking in July and August [5,6]. Until its 2021 link to the mainland via the 2 × 200 MW Peloponnese interconnection, Crete relied on three oil-fired thermal plants with steam turbines (205 MW), diesel generators (149.3 MW), and gas turbines (415.1 MW), which in 2019 produced 2.44 TWh, complemented by 298 MW of wind and PV capacity yielding 0.67 TWh (24% share) [7]. Seasonal and daily demand swings, grid isolation, and restrictions on intermittent RES penetration to maintain stability have constrained renewable integration, leaving Crete vulnerable to generator trips and grid faults despite robust local expertise in outage management [8].
Crete exemplifies an ideal REV setting due to its abundant solar and wind resources, grid import dependence, and active pilot projects such as the CRAVE-H2 Hydrogen Valley, which aims to produce 500 t/year of green hydrogen for mobility and grid balancing [9,10,11]. The CRETE VALLEY project further refines these designs, integrating PV, wind, BESS, electrolyzers (EL), and fuel cells across four Community Energy Labs (CELs) to validate the REV concept within the island of Crete and under realistic conditions [11].
In recent years, the increasing deployment of renewable energy systems has led to significant advances in microgrid technologies, community energy frameworks, and optimization methods. Meta-heuristic optimization techniques have been extensively applied to microgrid management, addressing challenges including renewable intermittency, cost-effective dispatch, storage sizing, and system reliability. Akter et al. provide a comprehensive review of meta-heuristic algorithms such as Particle Swarm Optimization and Genetic Algorithms, highlighting their ability to enhance microgrid operational performance and economic efficiency [12]. Ahmed et al. investigate sectoral coupling pathways to achieve 100% renewable energy systems, presenting a stepwise transition model tailored to Northern Ireland’s energy sectors, emphasizing flexibility and techno-economic viability [13]. Barabino et al. focus on energy communities, examining their technical design, business models, and optimization objectives, and advocate for integrated multi-energy and sector-coupled approaches to achieve sustainability goals [14]. Complementing these findings, the recent review by the research team in [15], surveys the application of machine learning techniques within energy communities, underscoring their potential in enhancing demand response, forecasting, and load management to enable effective decentralized energy systems. Recent policy innovations such as Energy Quota Trading (EQT) have demonstrated significant potential to enhance energy efficiency and promote green development by leveraging market-based mechanisms for resource allocation, with positive spatial spillover effects observed in pilot regions. Such policies complement technical optimization efforts at the community scale by creating systemic incentives for efficient energy use and supporting the transition toward sustainable energy systems [16].
A broad set of studies has focused on the optimal sizing and operational optimization of hybrid renewable systems integrating batteries, hydrogen storage, and diverse renewable generation technologies. Various approaches include incremental cost heuristics [17], frequency droop-based control models [18,19,20,21,22,23], and multi-objective evolutionary algorithms such as NSGA-II and gravitational search algorithms [19,20,21]. These methods sought to simultaneously minimize costs, loss of power supply probability, and environmental impacts while maximizing renewable energy shares. Notable outcomes include significant cost reductions, near-zero energy waste, and improved system reliability across climatic conditions. Environmental externalities have also been integrated through carbon tax scenarios, enhancing sustainability perspectives. While these contributions provide strong methodological foundations, gaps remain in addressing complex mixed-load configurations at community scale that combine diverse sectoral consumers (residential, tourism, municipal infrastructure, and transport) and optimize dispatch hierarchies to jointly maximize renewable self-consumption, minimize grid reliance, extend component lifespans, eventually forming sustainable business schemes.
This study addresses these gaps by applying a mixed integer linear programming (MILP) based, multi-objective optimization framework to derive optimal sizing and operational strategies for integrated renewable–battery–hydrogen systems that derived by transforming real-world CEL demonstrations from the CRETE-Valley project into four standardized, modular business schemes that maintain technological diversity while enabling systematic comparison and replication. The original CEL configurations varied significantly in scale, ranging from 20 to 200 residential units, and incorporated diverse large consumers including hotels, greenhouses, municipal facilities, and transport infrastructure. To enable direct comparison and facilitate business case development, this work standardizes all schemes to a common baseline of 50 residential houses (100 m2 each) plus one representative large consumer, creating four distinct modular schemes:
- Scheme 1 (Domestic and tourism sectors): 50 residential houses and 1 hotel (1000 m2, 100 guests), integrating photovoltaics and battery storage to address combined electrical and thermal loads typical of tourism-oriented communities.
- Scheme 2 (Cold-climate domestic sector): 50 residential houses featuring photovoltaics and small wind turbines to serve rural communities with significant thermal demands due to higher altitude.
- Scheme 3 (Domestic and municipal sectors): 50 residential houses and 1 Olympic-sized swimming pool (50 × 20 m), incorporating large-scale photovoltaic parks and wind turbines with battery storage to address high-demand municipal infrastructure typical of urban and semi-urban communities.
- Scheme 4 (Domestic and transport sectors): 50 residential houses and transport infrastructure (1 hydrogen fuel cell bus), utilizing photovoltaic systems integrated with hydrogen production, storage, and fuel cell (FC) technologies to enable comprehensive transport sector coupling.
Each scheme is optimized using mixed-integer linear programming to determine optimal technology sizing and operational strategies for three renewable energy penetration targets: 90%, 95%, and 99.9%. This multi-target approach provides flexibility for implementation based on local investment capacity, regulatory frameworks, and grid integration constraints, while the modular structure enables systematic scaling and replication across similar contexts. The workflow of the present paper is presented in Figure 1.
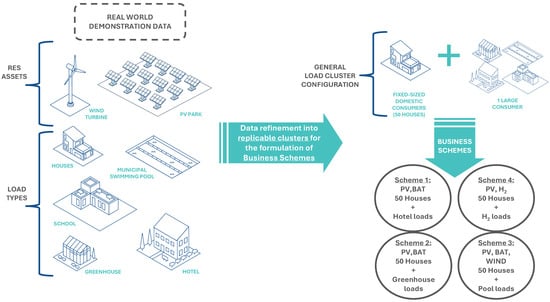
Figure 1.
Workflow to define replicable business schemes stemming from real world demonstration data.
The primary objective of this study is to develop and validate a modular and scalable optimization framework that enables the design of sector-specific renewable energy microgrids with integrated energy storage and hydrogen systems. The hypothesis underlying this work is that a standardized, sector-adapted modular approach can systematically optimize system configurations across diverse community contexts, ensuring technical efficiency and economic viability while maintaining flexibility for high renewable penetration levels.
The primary contribution of this work is the development of an optimization framework that receives the replicable modular schemes as input and it optimizes the sizing of all the components. The provision of optimal technology configurations for each scheme across multiple REP targets, will potentially enable stakeholders to select appropriate solutions based on their specific sectoral focus, investment capacity, and sustainability goals. The ultimate goal is to accelerate the transition from demonstration projects to commercially viable renewable energy valley schemes.
This study “Modular RES and Energy Storage Schemes Deployed in a Renewable Energy Valley” focuses on the optimal integration and sizing of renewable generation, battery, and hydrogen systems for diverse demand clusters. The core contributions are:
- A sizing methodology that leverages stochastic load profiles, RES generation, and technical objectives validated for the unique climate and grid conditions of Crete.
- Optimal sizing of RES, BESS, and hydrogen systems to satisfy combined urban and residential loads across four distinct schemes.
- Operational hierarchy and control scheme, embedded within the optimization framework, which includes demand response, battery-first dispatch, and hydrogen system roles.
Section 2 presents the technology demonstrations in four CELs (Arvi, Lasithi Plateau, Arkalochori, and Moires) including their renewable energy source (RES) assets and load profiles. Section 3 outlines modular RES and storage schemes with the optimization framework, energy management strategy (EMS), and modeling of key components such as PV, wind, batteries, electrolyzers, fuel cells, and hydrogen storage. It also specifies the data inputs for these schemes. Section 4 presents the results and discussions, evaluating the technical performance of the proposed modular systems.
2. Demonstration of Deployed Technologies in Community Energy Labs
This section provides an overview of both the renewable resource potential and the actual CEL configurations deployed across the four demonstration sites in Crete. The scope of this section is to establish the foundational conditions for the modular optimization framework presented in Section 3, reflecting the diverse local configuration, combining RES technologies and specific consumer groups.
2.1. RES Potential of Selected Sites
The four CEL locations, Arvi, Lasithi Plateau, Arkalochori, and Moires, exhibit strong and varied renewable energy profiles typical of Mediterranean climates. Each site features abundant solar radiation and wind potential, with monthly and seasonal profiles that influence both RES and broader system performance. Figure 2 illustrates the monthly global horizontal irradiation and mean temperature for the demonstration regions, drawing from PVGIS data and meteorological records [22].
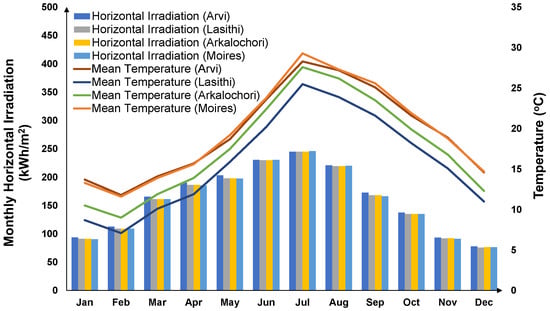
Figure 2.
Monthly global horizontal irradiation and mean temperature of the specific regions considered in each scheme [22].
These annual and monthly trends set key boundary conditions for technology selection, sizing decisions, and operational strategies across all CELs. While the solar resource is high and relatively stable, intra-annual variation and short-term intermittency are present, requiring the inclusion of energy storage and sector-coupling solutions to effectively balance generation and demand. Wind resources, where present (notably Arkalochori), offer additional support, particularly during evening hours and winter months when solar output may be reduced. Wind speed data for the selected sites were obtained also from the PVGIS database to accurately characterize the wind resource available for energy conversion and measurements were taken at reference height. The annual wind speed profiles exhibit notable seasonal and diurnal variability, with higher wind speeds typically observed during the winter months and at night, complementing the solar generation profiles. This complementary behavior enhances the overall renewable energy potential and provides valuable balancing capabilities for hybrid energy systems modeled in the study (specifically Scheme 3). Figure 3 presents the monthly averages for wind speed in m/s across the four locations selected for the Schemes.
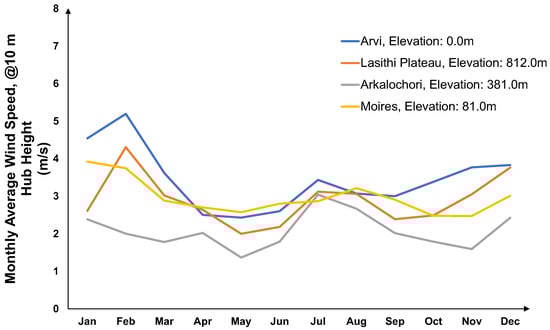
Figure 3.
Monthly average wind speed of the specific regions considered in each scheme [22].
2.2. CEL 1: Arvi
CEL 1, located in Arvi, serves a cluster of local consumers including 20 residential houses, 1 school, and 1 hotel as shown in Figure 4. Analyzing the load profiles of CEL 1 is essential to accurately capture the typical energy consumption patterns of a mixed cluster consisting of residential houses, a school, and a hotel. This detailed demand data forms the basis for modeling the electrical loads that the modular scheme aims to serve, ensuring that the sizing and operation of energy systems are aligned with realistic usage scenarios.
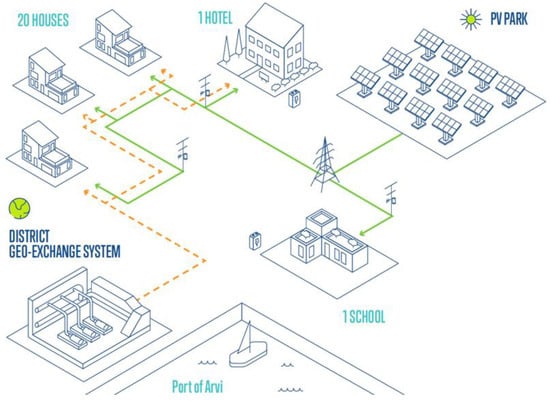
Figure 4.
Energy system configuration in CEL 1. Current deployment within the project. Green and orange lines electrical energy and thermal energy respectively.
Characterization of Loads
The residential component consists of 20 houses, each with an average floor area of 100 m2. The typical annual primary energy demand for these buildings is approximately 150 kWh/m2, resulting in a total annual consumption of 15,000 kWh per household [23]. This demand is split into 4000 kWhe (electrical) and 11,000 kWhth (thermal) per household. The thermal energy, approximately 110 kWh/m2, primarily addresses space cooling (which is predominant over heating) and domestic hot water needs.
The hotel establishment in Arvi spans 1000 m2 across four floors with 20 rooms and accounts for approximately 3000 annual guests. It operates from April 1st to the end of October. The electrical load demand, which incorporates heating and cooling needs expressed as electrical consumption (with a COP of 3), is estimated at 25 kWhe per guest. The stochastic profile generated based on these assumptions illustrates the hotel’s annual electrical load is shown in Figure 5.
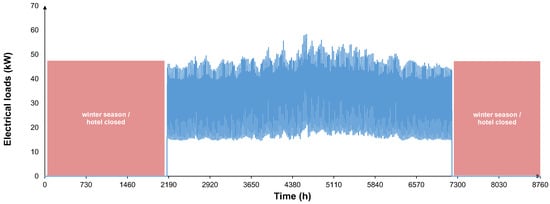
Figure 5.
Hourly electrical load profile in the course of one year for the case of the hotel building in scheme 1. Hotel remains closed during the winter period.
The school building in Arvi is a typical small educational facility with a total floor area of approximately 200 m2. Based on benchmarks from the research team in [24], the school’s annual thermal energy demand is estimated at 200 kWh/m2, resulting in a total of 40,000 kWhth/year or 13,333 kWhel/year. This amount of energy is expressed as electrical load (with a COP of 3). Similarly, the annual electrical energy demand is estimated at 70 kWh/m2, leading to a total of 14,000 kWhel/year. When averaged over the 9 months that the school is operating (excluding weekends also), this corresponds to a daily electrical load of approximately 155 kWhel/day (including thermal needs expressed as electrical). Figure 5 depicts the annual electrical load of the school building.
The characterization of the loads provides an essential foundation to capture realistic energy demand patterns across the varied sectors considered. To enable a consistent and comparable analysis within the modular scheme framework, the residential load figures are subsequently scaled to represent a fixed number of 50 residential units per scheme as shown in Figure 6. This scaling aligns the demand modeling with the configuration assumptions used in the simulation and optimization of the respective modular scheme.
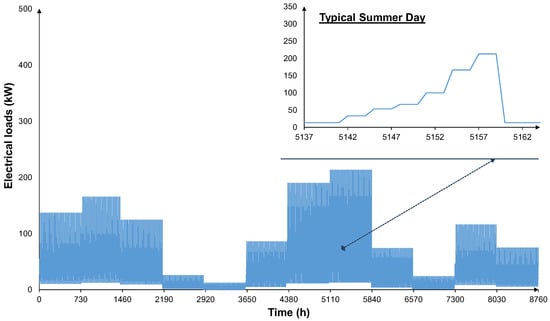
Figure 6.
Hourly electrical load profile in the course of one year for the case of the 50 residential buildings of scheme 1, and during a typical summer day during August.
Table 1 summarizes the key load data that inform the subsequent modeling and optimization steps in the modular formulation Scheme 1.

Table 1.
Overall figures of load components for Scheme 1.
2.3. CEL 2: Lasithi Plateau
CEL 2, situated in the Lasithi Plateau, integrates 50 residential houses and a greenhouse, as shown in Figure 7. The load analysis of CEL 2 provides crucial insights into the higher heating demands and seasonal variability inherent in a cold-climate rural setting with agricultural activities. Incorporating these consumption patterns into the modeling framework enables the design of demand-responsive and efficient energy solutions tailored to these specific sectoral needs within the modular scheme.
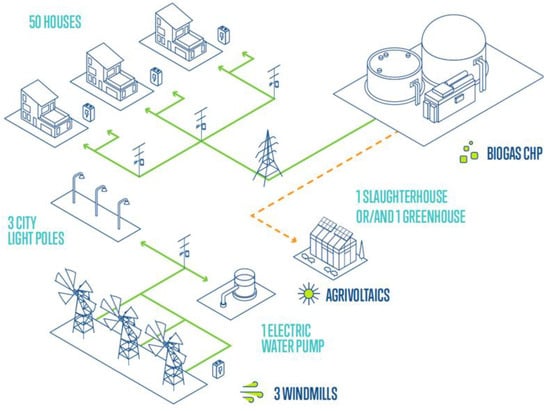
Figure 7.
Energy system configuration in CEL 2. Current deployment within the project. Green and orange lines electrical energy and thermal energy respectively.
Characterization of Loads
The residential component in CEL 2 comprises 50 houses, each with an average floor area of 100 m2. These units exhibit similar electrical energy demand patterns to those in CEL 1. However, due to the higher altitude of the Lasithi Plateau, the heating demand are also increased. This results in a total annual consumption of 9300 kWhe per household, which includes thermal needs expressed as electrical consumption (with a COP of 3). This demand is further broken down into 4000 kWhe and 16,000 kWhth per household.
The greenhouse included in CEL 2 maintains a constant thermal demand of 40 kWth whenever the ambient temperature falls below 16 °C. This threshold ensures indoor climate stability for year-round crop cultivation, concentrating heating requirements primarily from November through April. Hourly temperature data from a Typical Meteorological Year (TMY) for the Lasithi Plateau, sourced from the PVGIS database, were used to derive the heating load [22]. A binary control logic applies, setting the thermal load to 40 kW below 16 °C and 0 kW otherwise. The resulting hourly thermal load profile confirms that heating demand is almost exclusively active during winter and adjacent months, with no operation in summer. The total annual thermal energy demand for the greenhouse is approximately 153,600 kWhth/year.
The characterization of the loads provides an essential foundation to capture realistic energy demand patterns across the varied sectors considered. The available data for the residential load match the required fixed number of 50 residential units per scheme so no scaling was performed for this scheme. Figure 8 illustrates the annual electrical load of the residential consumers along with the daily pattern.
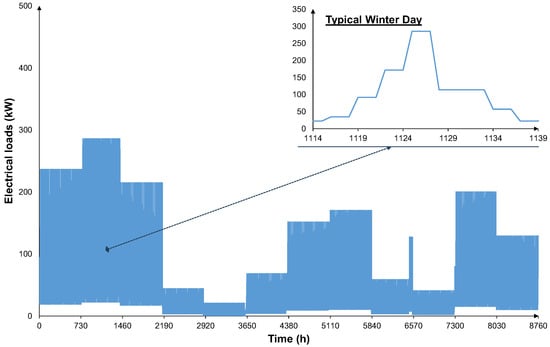
Figure 8.
Hourly electrical load profile in the course of one year for the case of the 50 residential buildings, and during a typical winter day during February in Scheme 2.
Table 2 summarizes the key load data that inform the subsequent modeling and optimization steps in the modular formulation for Scheme 2.
Table 2.
Overall figures of load components for Scheme 2.
2.4. CEL 3: Arkalochori
CEL 3, located in Arkalochori, is composed of 200 residential houses with both electrical and thermal demand (expressed as electrical), and one municipal swimming pool with both electrical and thermal demand (express as electrical). Figure 9 presents the configuration of the CEL. Understanding the load characteristics of CEL 3 is key to representing the complex mixed-use community, which includes a significant municipal facility with both electrical and thermal demands. This load data facilitates the development of a robust modular scheme capable of meeting diverse and substantial energy requirements through optimized system design.
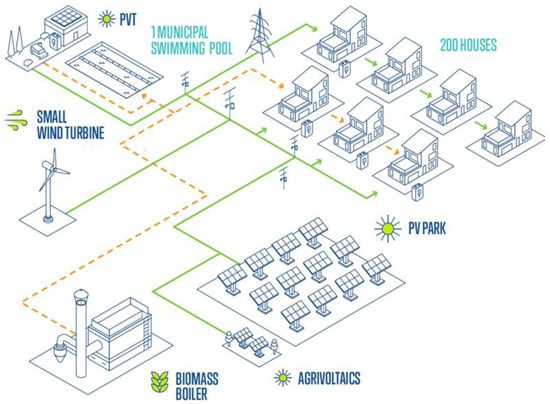
Figure 9.
Energy system configuration in CEL 3. Current deployment within the project. Green and orange lines electrical energy and thermal energy respectively.
Characterization of Loads
CEL 3 includes 200 residential houses, each with an average floor area of 100 m2, that primarily have electrical demand. Their electrical energy needs are similar to those in other CELs, with an annual consumption of 4000 kWhe per household. Additionally, there are 70 residential houses (out of the 200), also 100 m2 each, that require both electrical and thermal energy. These homes have a lower heating demand compared to CEL 2 due to the specific altitude of Arkalochori. Their annual consumption is 4000 kWhe and 14,000 kWhth per household.
A municipal swimming pool facility, specifically an Olympic-sized pool (50 × 20 m), is another significant consumer in CEL 3. Its heating loads are considered for the analysis, with an annual thermal demand profile provided in Figure 10. The annual thermal demand for the swimming pool is 1,932,500 kWhth/year, and its annual electrical demand is 107,000 kWhe/year [25].
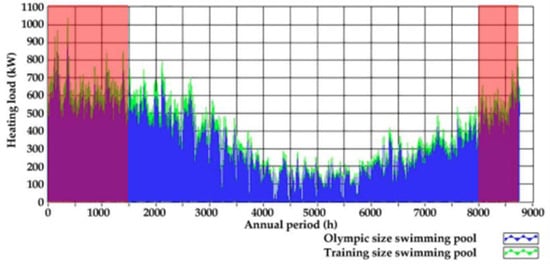
Figure 10.
Annual heating load of the two swimming pools in the Arkalochori sports center in scheme 3 [17]. Only the Olympic sized pool is considered for the simulations. Red areas in the beginning and end of the annual period represent loads that are not considered in the analysis.
The characterization of the loads provides an essential foundation to capture realistic energy demand patterns across the varied sectors considered. Subsequently, the residential load figures are scaled to represent a fixed number of 50 residential units for Scheme 3, as shown in Figure 11.
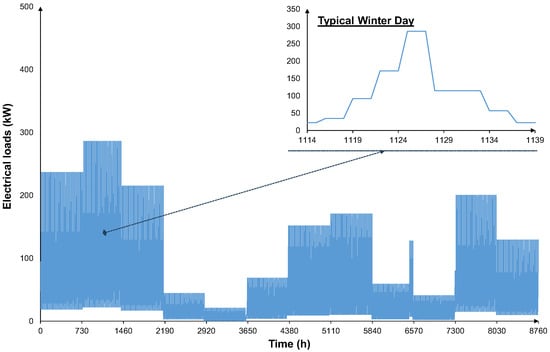
Figure 11.
Hourly electrical load profile in the course of one year for the case of the residential buildings (50 houses) and a typical winter day in Scheme 3.
Table 3 summarizes the key load data that inform the subsequent modeling and optimization steps in the modular formulation for Scheme 3.
Table 3.
Overall figures of load components for Scheme 3.
2.5. CEL 4: Moires
CEL 4 in Moires is designed to serve 60 residential and commercial buildings, five EV charging stations, and one hydrogen fuel cell bus. This configuration aims to test energy autonomy, smart demand management, and grid support, with potential Vehicle-to-Grid (V2G) functionality offering additional flexibility from the mobility sector. The system integrates renewable energy through the guarantee of origin of the grid, hydrogen production via electrolysis, and fuel cell generation units (Figure 12).
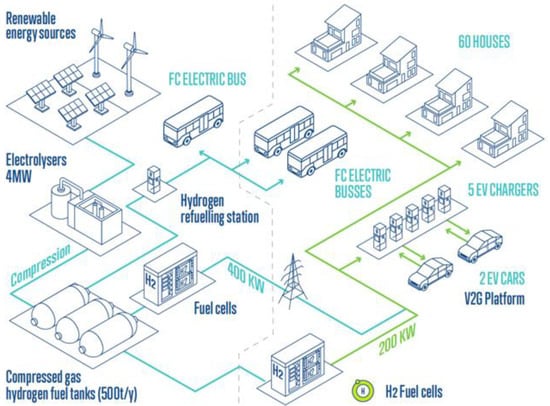
Figure 12.
Energy system configuration in CEL 4. Current deployment within the project.
Characterization Loads
Analyzing the load data for CEL 4 is fundamental to capturing the combined demands of residential, commercial, and mobility sectors, including electric vehicle charging and hydrogen-fueled transport. This demand modeling supports the creation of integrated modular energy schemes that address the intricacies of sector coupling.
For CEL 4, in order to be able to produce green hydrogen, an electricity supply agreement supported by Guarantees of Origin (GOs) for the provision of green electricity to the integrated system is considered. Therefore, the term “grid import” as in an external source is not considered in this demonstration.
Hydrogen production is a central element, with the production technology being a 4 MW alkaline electrolysis plant capable of producing maximum 500 tons of hydrogen per year (500,000 kg/year) [9]. This substantial production capacity is designed to meet the demands of the fuel cell buses and other potential hydrogen applications.
The residential and commercial component in CEL 4 comprises 60 buildings. The energy data for the residential buildings are assumed to be similar to those of CEL 1 (Arvi) due to climatic and geographical similarities. Each household has a total annual primary energy consumption of 15,000 kWh, split into 4000 kWhe and 11,000 kWhth.
CEL 4 includes five electric vehicle (EV) charging stations, each with a charging capacity of 22 kW. It is assumed that each charger operates for an average of 5 h per day, resulting in a daily energy demand of 550 kWh across all stations, or approximately 200,750 kWh/year. This demand is intended to be covered entirely by the hydrogen-powered fuel cell system, supporting local decarbonization and sector coupling objectives. EV charging behavior exhibits distinct temporal and energy demand patterns, influenced by user habits, location, and charger type. During weekdays, charging tends to peak in the morning (08:00–10:00) and evening (18:00–22:00), while weekend patterns are more evenly distributed. Session durations can range from under an hour to 6–8 h, with energy delivered typically between 7–22 kWh [26].
The system also incorporates one hydrogen fuel cell bus, representing a promising application for large-scale hydrogen deployment in transportation. These buses can accommodate substantial onboard hydrogen storage (typically 35–50 kg at 350 bar), allowing for high driving autonomy and operational flexibility [27]. Consumption is estimated at 8–10 kg per 100 km [28,29], with an operating range of up to 450 km and rapid refueling times of less than 10 min. Each bus is expected to cover approximately 200 km per day, leading to a daily hydrogen demand of 18 kg per bus. Assuming 300 operating days per year, the annual hydrogen consumption at 5400 kg/year. This demand is to be met by the on-site hydrogen production and refueling infrastructure.
The characterization of the loads provides the foundation to capture realistic energy demand patterns across the sectors considered. Subsequently, the residential load figures are scaled to represent a fixed number of 50 residential units for Scheme 4, as shown in Figure 13.
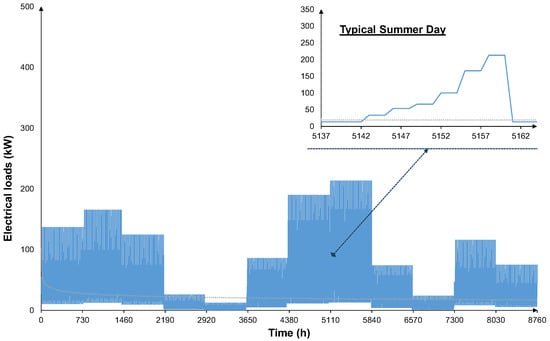
Figure 13.
Hourly electrical load profile in the course of one year for the case of the 50 residential buildings, and during a typical summer day during August in scheme 4.
Table 4 summarizes the key load data that inform the subsequent modeling and optimization steps in the modular formulation for Scheme 4.
Table 4.
Overall figures of load components for Scheme 4.
3. Modular RES & Energy Storage Schemes for Replicable Load Clusters
3.1. Methodology and Optimization Framework
The transition from the diverse, site-specific Community Energy Lab (CEL) configurations described in Section 2 to replicable modular business schemes requires the development of a systematic optimization and energy management framework. The modular schemes presented in Figure 1 provide a common baseline of 50 residential houses plus one large consumer per sector (domestic, tourism, municipal, transport). To ensure comparability among the four sectoral schemes, the baseline residential cluster was standardized at 50 units. Hourly load data originally obtained from CEL demonstrations and literature (single-house datasets) were linearly scaled to account for the cluster size chosen (50 units). The 50-unit reference reflects the scale of modern European energy community pilots and demonstration clusters, which commonly comprise 40–100 households in practice, as exemplified by sites in the RESCHOOL project, the Energy Communities Repository, and recent European Commission initiatives [2,30,31]. This approach allows for direct comparison of technically optimal technology configurations and supports the development of scalable business models that can be easily replicated across similar contexts.
The present study designs and employs a multi-objective mixed-integer linear programming framework to determine the optimal sizing and operation of renewable energy sources (PV and WT), BESS, hydrogen production/storage, and fuel cells within each scheme. This framework has been demonstrated in a slightly different context as an effective approach for renewable energy systems optimization in community-scale applications [32]. The methodology accommodates the distinct characteristics and energy demands of each scheme, aiming to facilitate increased integration of renewable energy sources while maintaining operational feasibility and equipment health.
Renewable energy penetration targets of 90%, 95%, and 99.9% were selected to represent progressively stringent decarbonization scenarios aligned with the European Union’s Green Deal and 2050 carbon neutrality objectives. The 90% and 95% levels correspond to intermediate high renewable shares expected in island and regional systems over the next decades, while the nearly 100% target of 99.9% illustrates the asymptotic technical limits of renewable energy integration under current storage and flexibility technologies. Lower or gradual intermediate targets (e.g., 50%, 75%) were not considered to focus the analysis on challenging high-penetration cases relevant for deep decarbonization pathways, which also correspond to the targets of a renewable energy valley.
The optimization addresses multiple objectives simultaneously across the three REP levels (90%, 95%, and 99.9%) to provide flexibility based on local constraints and investment capacity. Primarily, it seeks to maximize REP, defined as the ratio of renewable-derived energy consumed by the integrated system to the total energy demand over the analysis period. Concurrently, it minimizes the total amount of curtailed renewable energy throughout the operating horizon, addressing a critical challenge in high-penetration renewable systems. The formulation also reduces reliance on external energy sources and preserves component lifetime by encouraging operation within nominal ranges to mitigate degradation effects.
The objective function is expressed as a weighted sum of these goals, following established multi-objective optimization practices for energy systems [33,34], formalized as follows:
where denotes the curtailed renewable energy at timestep , and is calculated by:
with representing the total electrical load at time . The weighing coefficients and are user-defined to balance the relative importance of minimizing curtailment and external source back-up versus maximizing renewable penetration.
The decision variables encompass the discrete quantities of PV panels (NPV) and wind turbines (NWT), as well as continuous variables such as the battery storage capacity (CBAT) and hydrogen storage capacity (CH2). This mixed-integer formulation has been shown to provide superior solutions for renewable energy system sizing compared to purely continuous approaches. Operational variables over the discretized time horizon include the power outputs of PV and wind units, charging and discharging power of the battery, state of charge (SOC) of the battery, hydrogen tank levels, power outputs of the electrolyzer and fuel cell units, grid import flows, and curtailed power.
Equality constraints ensure power balance at each timestep, equating the sum of supply (including renewable generation, storage discharges, fuel cell output, and external source imports) to the sum of demand components (comprising load, storage charging, electrolyzer consumption, and curtailment):
Inequality constraints impose upper bounds on renewable generation based on resource availability and installed capacity, enforce the battery and hydrogen storage operating limits, and constrain electrolyzer and fuel cell operations. The battery SOC evolves according to charging and discharging dynamics, following established battery modeling approaches for energy storage optimization. The hydrogen tank level is similarly modeled considering conversion efficiencies. Additional constraints bound exchange capacities with external sources and ensure non-negativity of curtailment. These constraints are essential for maintaining system stability and operational feasibility in integrated energy systems.
The MILP model spans a full year of operation with hourly time steps. This temporal resolution has been identified as optimal for capturing renewable energy variability while maintaining computational efficiency. The model is implemented and solved using solvers in MATLAB version R2023a capable of handling mixed-integer problems. Recent studies have demonstrated that MILP-based approaches can achieve convergence times significantly faster than nonlinear alternatives while maintaining solution quality [35,36,37]. Model parameters and objective weights can be tuned to explore a range of feasible solutions, enabling analysis of trade-offs between system size, renewable utilization, and operational metrics.
3.2. Energy Management Strategy and Operational Hierarchy
The energy management strategy implemented in this study is based on the Hybrid Automata (HA) algorithm, building upon the framework proposed by Kafetzis et al. [38]. This approach allows for a formal and systematic definition of the system’s operation, precisely managing the interaction between discrete (e.g., component on/off states) and continuous (e.g., battery SOC, hydrogen tank pressure) dynamics. The HA is particularly well-suited for systems with diverse energy sources and storage technologies, enabling a robust and expandable control framework.
This EMS is embedded within the optimization framework, simulating the hourly operation of each integrated system scheme throughout a typical meteorological year. It defines a strict dispatch priority for each energy asset, designed to maximize self-consumption of locally generated renewable energy, minimize interaction with external energy back-up sources (such as the grid or diesel generators), and crucially, maintain components within their efficient and nominal operating ranges to maximize their lifetime. The general hierarchy is as follows:
- Direct consumption: Locally generated electricity from PV and WT is prioritized for immediate consumption by the connected electrical loads.
- Battery charging: Surplus renewable electricity, when available and local electrical demand is met, is directed to charge the BESS until its maximum capacity is reached. This implements a “battery-first dispatch” strategy.
- Hydrogen production (electrolysis): If the BESS is fully charged and renewable generation still exceeds local electrical demand, excess electricity is utilized by the electrolyzer to produce hydrogen, which is then stored. This enables long-term energy storage and acts as a flexible load for surplus RES.
- Battery discharge: When local renewable generation is insufficient to meet demand, the BESS discharges to cover the electrical deficit.
- Fuel cell dispatch: If battery storage is depleted, the hydrogen fuel cell converts stored hydrogen back into electricity to meet the remaining electrical demand. This provides dispatchable power and enhances energy autonomy.
- External energy back-up source (grid/diesel generator): As a last resort, if all local generation (RES, battery discharge, fuel cell dispatch) is insufficient, electricity is imported from the main grid or supplied by other external backup sources to cover the remaining electrical deficit.
- Thermal demands are managed by dedicated thermal systems (geothermal, biomass boiler) with their specific dispatch rules, or by electrical heating components as part of the overall electrical load (as in Scheme 2).
In this framework, the external backup source is assumed to be a diesel generator to represent the conventional fallback generation required to ensure system reliability at high renewable penetration targets (90%, 95%, 99.9%). This assumption aligns with scenarios where the local grid is either absent or insufficiently reinforced. However, in the CEL cases, the external source corresponds to the interconnected grid, which contains a blend of renewable and fossil-fuel generation. Therefore, the actual external backup may include renewable energy from the broader system rather than purely diesel. The environmental and economic benefits of its minimization, are thoroughly investigated by the authors through a life cycle perspective in an upcoming manuscript.
While the overarching Hybrid Automata methodology serves as the base, the EMS for each scheme is tailored to its specific energy demand patterns, renewable energy production profiles, and system configuration. These adaptations ensure the optimal performance and longevity of the integrated system in each unique context.
3.3. Component Modeling
This section details the mathematical models employed to represent the key components of the Scheme energy systems. Each energy component within the four Schemes is mathematically modeled to capture its operational characteristics, efficiencies, and constraints. These models are integrated into the MILP formulation.
In this study, key component models, including battery degradation and hydrogen leakage, are simplified to maintain the solvability of the yearly MILP optimization model within reasonable computational time and resources. Battery degradation is represented through operational constraints limiting depth-of-discharge and state-of-charge bounds without explicit cycle aging or calendar degradation calculations. Hydrogen leakage is neglected, assuming minimal impact over the modeled time horizon. These simplifications balance modeling complexity and solver performance providing a baseline assessment, which is the focus of this work, but abstract from detailed lifetime and cost implications. More advanced formulations integrate cycle-counting degradation cost functions and state-of-health dynamics in MILP frameworks, enabling a trade-off between battery usage intensity and lifetime costs [39,40].
3.3.1. Photovoltaic Systems
PV generation is modeled based on incident solar irradiance and temperature-dependent module performance. The instantaneous DC output power at time is calculated as:
3.3.2. Wind Turbines
Wind power output is calculated using manufacturer-specific turbine power curves characterizing the relationship between wind speed at hub height and electrical output:
Wind speeds measured at reference heights were extrapolated to turbine hub height using the power law:
3.3.3. Battery Energy Storage Systems
The battery dynamics are governed by the energy balance equation:
with constraints enforcing state-of-charge limits:
and charging/discharging power limitations based on rated inverter power and manufacturer specifications. Battery degradation is approximated by limiting depth-of-discharge and ensuring operation within nominal SOC ranges, consistent with literature on lifetime extension strategies.
3.3.4. Electrolyzer
The electrolyzer converts surplus electricity into hydrogen with conversion efficiency , modeled by:
The electrolyzer operates within a power range:
3.3.5. Fuel Cell
Hydrogen consumption in the fuel cell is converted to electrical power by:
subject to the fuel-cell rated power:
The model incorporates minimum load constraints and ramp rate limitations reflecting system dynamics and practical operational requirements.
3.3.6. Hydrogen Storage
Hydrogen storage is treated as a balance between production and consumption:
Leakage losses are not considered in the modeling activities due to the short simulation horizons relative to storage timescales and potential leakages.
3.3.7. Modeling Parameters and Assumptions
The study incorporates technical and operational parameters for all renewable energy sources, storage systems, and conversion technologies (Table 5). This among others includes capital expenditures (CAPEX) for each component, which are integral to defining the economic characteristics of the technologies. However, it is important to note that while CAPEX data is considered, the optimization focuses on operational objectives related to system performance and component lifetime. In addition, operational and maintenance (O&M) costs, both fixed and variable, are included in the analysis. These costs influence the efficiency and expected lifetime of the technologies but are not directly optimized within the model. Their consideration ensures that the systems are evaluated with realistic cost implications over the operational period. Finally, device efficiencies are detailed for all key technologies, such as batteries (round-trip efficiency), electrolyzers, and fuel cells. These efficiency parameters directly impact energy conversion and storage processes and play a critical role in determining system energy balances and overall performance.
Table 5.
Consolidated input parameters and technical specifications for photovoltaic systems, wind turbines, battery storage, electrolyzers, fuel cells, hydrogen storage, and load profiles used in the scheme models.
4. Results & Discussions
This section presents the outcomes of the multi-objective optimization conducted for each scheme, detailing the optimal sizing of renewable energy generation assets such as photovoltaic systems and wind turbines, battery energy storage systems, and hydrogen-related components including electrolyzers, fuel cells, and hydrogen storage tanks. The optimization is performed for different renewable energy penetration targets (90%, 95%, and 99.9%).
The following table (Table 6) summarizes the optimal system configurations obtained, reflecting the modular schemes standardized as clusters of fifty residential consumers combined with a representative large consumer specific to each sector. The results reveal that for higher renewable energy penetration targets, there is a consistent increase in photovoltaic system capacity and battery storage size. In the municipal sector scheme (Scheme 3), wind turbines complement the photovoltaic systems, contributing to the variability mitigation in energy generation. In Scheme 4, hydrogen-based systems play a significant role in meeting the demand profile of hydrogen buses. Additionally, the volume of excess electricity generated increases substantially as renewable energy penetration approaches near-total coverage, underscoring the need for strategic management of surplus energy through storage and demand response mechanisms to maximize local utilization and minimize grid interactions.
Table 6.
Optimal sizing of renewable energy assets for each scheme and for different renewable energy factors (90%, 95%, 99.9%).
Figure 14, Figure 15, Figure 16 and Figure 17 present detailed visualizations of the optimized system configurations and operational patterns for each of the four schemes and for the indicative case of 95% renewable energy penetration scenario that well aligns with potential decarbonization target. Higher penetration levels, such as 99.9%, while theoretically achievable, require disproportionately large infrastructure investments and are thus less practical for near-term implementation, as depicted in Table 6.
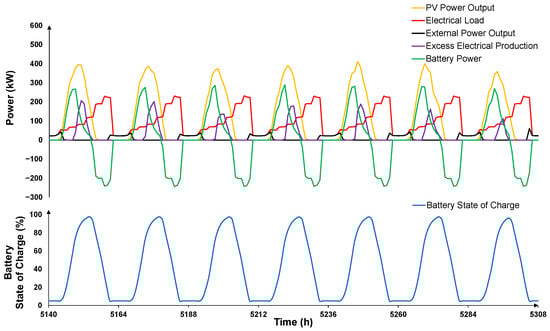
Figure 14.
Operational dynamics of Scheme 1 during a typical summer week showing photovoltaic power generation, electrical load demand, external power supply, excess electrical production, and battery power (negative is discharged power) (upper panel), alongside battery state of charge variations (lower panel).
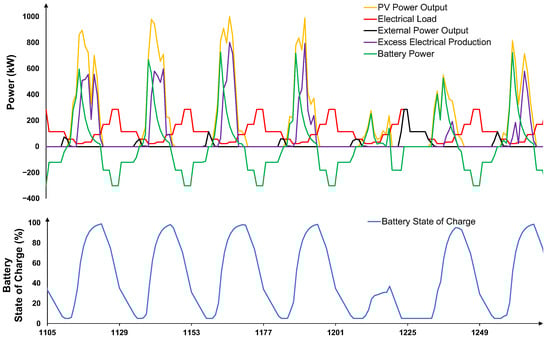
Figure 15.
Operational dynamics of Scheme 2 during a typical winter week showing photovoltaic power generation, electrical load demand, external power supply, excess electrical production, and battery power flows (negative is discharged power) (upper panel), alongside battery state of charge variations (lower panel).
Figure 16.
Operational dynamics of Scheme 3 during a typical winter week (last week of January) showing photovoltaic and wind power generation, electrical load demand, external power supply, excess electrical production, and battery power flows (negative is discharged power) (upper panel), alongside battery state of charge variations (lower panel).
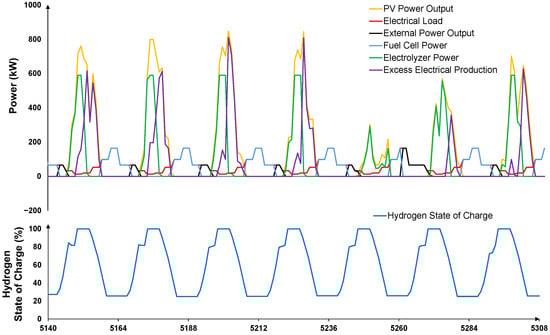
Figure 17.
Operational dynamics of Scheme 4 during a typical summer week showing photovoltaic power generation, electrolyzer consumption, fuel cell output, and electrical load demand (upper panel), alongside hydrogen storage level (lower panel).
The operational periods illustrated represent a typical week within summer (1st week of August) for Scheme 1 (tourism) and Scheme 4 (transport), while Schemes 2 (cold-climate rural) and 3 (municipal) depict representative winter week operations (last week of January). This seasonal differentiation reflects the distinct climatic and altitude characteristics of the respective schemes. Schemes 1 and 4 experience peak energy demands during summer months due to intensive cooling requirements for hotels that align with tourist activity. Conversely, Schemes 2 and 3, reflecting higher altitude locations, demonstrate their most challenging operational conditions during winter periods when heating demands for residential buildings, greenhouses, and municipal swimming pools reach their maximum levels.
Figure 14 illustrates the operational dynamics of Scheme 1, focused on the tourism sector, during a typical summer week (1st week of August). The operational patterns observed are a direct result of the tailored EMS formulated specifically for this tourism-focused configuration. In this period, PV power generation closely follows the daily solar pattern, peaking at midday, which aligns well with the electrical load demand driven by residential cooling and hotel occupancy increased activities in summer. The battery energy storage system actively charges during periods of excess PV generation and discharges to meet evening and night loads when solar generation ceases, effectively smoothing the daily energy profile according to the battery-first dispatch strategy embedded in the EMS. Notably, the battery state of charge displays daily cyclical behavior reflecting this charge–discharge pattern, ensuring energy availability for evening consumption and reducing reliance on the external grid supply as prioritized by the EMS hierarchy. Excess electrical production occurs primarily during peak midday solar hours exceeding local demand and battery charging capacity, indicating potential for further integration of flexible loads or increased storage capacity. The EMS successfully demonstrates effective battery-first dispatch strategy and high utilization of locally generated solar power tailored to the specific tourism sector load patterns.
Figure 15 presents the operational dynamics of Scheme 2 (cold-climate residential sector) during a typical winter week (last week of January). Electrical loads consist solely of residential heating and appliance demand. PV generation is limited by low winter irradiance, so the battery storage system plays a crucial role, it charges during the few midday hours when solar output exceeds residential demand, and discharges during peak evening heating periods. Imports from the external source supply residual demand when both PV and battery are insufficient. Excess electricity remains minimal, reflecting the tighter balance between local generation and load. The EMS’s battery-first dispatch ensures that all available PV output is stored or consumed before importing, smoothing the daily load profile and maximizing renewable self-consumption in this cold-climate scenario.
Figure 16 presents the operational dynamics of Scheme 3 (municipal sector) during a typical winter week. In this cold-climate scenario, both PV and wind contribute intermittently, with PV peaks at midday while wind generation is distributed more evenly, including overnight hours. The municipal swimming pool’s substantial heating and electrical loads create a high baseline demand that often exceeds instantaneous renewable output. The battery system provides a buffer between these mismatches by charging from excess renewable generation, primarily during midday solar peaks and strong wind events, and discharging during evening and early morning peak demand. External grid imports fill any remaining deficit when renewables and storage are insufficient. Notably, excess electricity exports occur when combined PV and wind output exceeds both local demand and battery charging capacity, underscoring the need for appropriately sizing storage or integrating additional flexible municipal loads. The EMS effectively prioritizes local RES consumption, followed by battery dispatch, before resorting to grid imports, smoothing the winter load profile for this municipal application.
Figure 17 illustrates the operational behavior of Scheme 4 (transport sector) over a representative summer week. PV generation peaks at midday, supplying both immediate electrical loads and the electrolyzer for hydrogen production. The electrolyzer operates primarily during high solar output hours, converting surplus PV into hydrogen stored in the tank (lower panel). Stored hydrogen is then dispatched via the fuel cell during evening and early-morning periods when PV is unavailable, meeting both residential and electrolyzer load demands. The hydrogen bus refueling demand creates distinct storage drawdowns, shown as step decreases in tank level. External source imports are nearly eliminated, reflecting the EMS’s strict priority: direct PV use, hydrogen production, fuel cell dispatch, and only then external source back-up. This scheme demonstrates effective sector coupling, leveraging hydrogen as a medium for both stationary and mobility loads in a high-irradiance context.
Beyond the technical and operational dynamics, it is important to consider the economic implications associated with increasing renewable penetration in these modular schemes. As renewable penetration targets escalate, our MILP optimization results indicate a nonlinear increase in the required capacities of major components, particularly energy storage and hydrogen systems. This results in a significant rise in CAPEX, with system capacities more than doubling when progressing from 90% to 99.9% renewable penetration. Such disproportionate cost escalations yield diminishing returns in additional renewable integration, underscoring a critical trade-off between maximizing decarbonization and maintaining economic feasibility. This observation stresses the importance of incorporating economic considerations into the design of scalable business schemes for renewable energy valleys, suggesting that intermediate renewable targets may offer the most balanced and viable paths to implementation.
5. Conclusions
This study analyzed four modular business schemes derived from real-world community energy lab demonstrations within the CRETE Valley project, representing domestic and tourism, cold-climate rural, municipal, and transport sectors. By standardizing distinct sectoral load clusters to a common baseline of 50 residential units plus one large consumer, the study enables sizing, comparison, and optimization of renewable energy assets and storage systems configurations under Mediterranean conditions. Key takeaways from this work:
- Tourism and rural schemes require moderate renewable energy capacities and battery storage primarily for smoothing daily generation-demand mismatches.
- Municipal and transport schemes involve more diverse and higher loads, necessitating larger photovoltaic arrays and combined battery and hydrogen storage solutions to balance intra-day variability and enable seasonal or sector-coupled energy storage.
- All schemes exhibit temporal mismatches between renewable output and local consumption, underscoring the importance of tailored energy storage sizing, dispatch hierarchies, and flexible demand management to maximize local renewable utilization.
- The transport sector highlights the feasibility of PV-driven electrolysis and fuel cells meeting both stationary and mobility energy demands, contingent on precise alignment of electrolyzer capacity and hydrogen storage with solar generation profiles.
- The proposed multi-objective mixed-integer linear programming optimization framework successfully identified modular technology configurations for 90%, 95%, and 99.9% renewable penetration targets, balancing renewable self-consumption, curtailment minimization, and reduced external energy dependence.
- The modular approach offers scalable, replicable solutions that can be adapted across different sectoral mixes and regional conditions, supporting the acceleration of renewable energy valley deployment beyond isolated pilot projects.
These baseline insights directly informed the multi-objective MILP optimization framework in this work, which determined RES, BESS, and hydrogen component sizes and dispatch strategies to achieve 90%, 95%, and 99.9% renewable penetration. By embedding sector-specific load clusters within a unified optimization framework, the analysis delivered scalable configurations for renewable energy valleys under Mediterranean conditions. These findings provide valuable insights into the design of community-scale renewable energy systems tailored to diverse sectors, illustrating how technology portfolios adapt in response to sector-specific demands and renewable energy penetration targets.
From a policy perspective, the results of this study highlight the critical need for further analysis of the environmental and economic impact of Community Energy Labs and the technologies they deploy. While modular renewable frameworks show strong technical feasibility, their overall sustainability performance remains dependent on factors such as fluctuations in the grid energy mix and the carbon intensity of imported electricity at different times. Policymakers should therefore promote the systematic inclusion of environmental indicators and life-cycle cost components in future demonstration projects, coupled with continuous monitoring of real-world deployment outcomes. This will help develop incentives and support mechanisms that more accurately reflect the environmental and social value of such community energy systems, thereby fostering their effective adoption and long-term success.
Future work should focus on quantifying the real-world environmental and economic performance of sector-coupled community energy systems, especially under dynamic grid conditions, prices and fluctuating carbon intensities. Developing metrics that capture these temporal variations in carbon footprints will improve operational decision-making for renewable microgrids. Additionally, expanding modeling frameworks to include uncertainties related to technology costs, fuel prices, and policy environments will strengthen their applicability.
Author Contributions
Conceptualization, A.K., G.K., M.B., K.D.P. and A.T.; Data curation, A.K.; Formal analysis, A.K. and M.B.; Investigation, A.K., G.K., M.B., K.D.P. and A.T.; Methodology, A.K., G.K., M.B. and K.D.P.; Project administration, K.D.P., E.S., V.M. and A.T.; Resources, A.K., G.K., M.B., K.D.P., E.S. and V.M.; Software, A.K.; Supervision, K.D.P.; Validation, A.K., G.K., M.B., K.D.P. and A.T.; Visualization, A.K., G.K., M.B. and K.D.P.; Writing—original draft preparation, A.K., G.K., M.B. and K.D.P.; Writing—review and editing, A.K., G.K., M.B., K.D.P., E.S., V.M. and A.T. All authors have read and agreed to the published version of the manuscript.
Funding
This research was funded by the Horizon Europe European Commission project CRETE VALLEY (Grant Agreement No. 101136139).
Data Availability Statement
The original contributions presented in this study are included in the article. Further inquiries can be directed to the corresponding author(s).
Acknowledgments
The content of the paper is the sole responsibility of its authors and does not necessarily reflect the views of the European Commission. The authors would also like to thank Panos Seferlis and George Marnellos for their valuable guidance and insightful comments during the course of this research.
Conflicts of Interest
The authors declare no conflict of interest.
Abbreviations
The following abbreviations are used in this manuscript:
| BAT | Battery |
| BESS | Battery Energy Storage Systems |
| CAPEX | Capital Expenditure |
| CEL | Community Energy Lab |
| EL | Electrolyzer |
| EMS | Energy Management Strategy |
| EQT | Energy Quota Trading |
| FC | Fuel Cell |
| HA | Hybrid Automata |
| MILP | Mixed Integer Linear Programming |
| O&M | Operation & Maintenance |
| PV | Photovoltaic |
| REV | Renewable Energy Valley |
| REP | Renewable Energy Penetration |
| RES | Renewable Energy Source |
| SOC | State of Charge |
| STC | Standard Test Conditions |
| TMY | Typical Meteorological Year |
| V2G | Vehicle to Grid |
| WT | Wind Turbine |
| chg | Charging |
| const | Consumption |
| curt | Curtailment |
| dis | Discharge |
| ext | External |
References
- ENTSO-E. Opportunities for a More Efficient European Power System by 2050 (TYNDP 2024); Infrastructure Gaps Report: Brussels, Belgium, 2024. [Google Scholar]
- European Commission. Clean Energy for All Europeans Package. Available online: https://energy.ec.europa.eu/topics/markets-and-consumers/energy-consumers-and-prosumers/energy-communities_en (accessed on 30 August 2025).
- Community Power Coalition (FEDARENE). Powering Communities: How to Deliver a Citizens’ Energy Package That’s Fair and Accessible to All; Community Power Coalition Position Paper: Brussels, Belgium, 2025. [Google Scholar]
- Skaloumpakas, P.; Sarmas, E.; Rachmanidis, M.; Marinakis, V. Reshaping the energy landscape of Crete through renewable energy valleys. Sci. Rep. 2024, 14, 8038. [Google Scholar] [CrossRef]
- Karapidakis, E.; Mozakis, I.; Nikologiannis, M.; Tsikalakis, A. Zero Carbon Emissions Due to Ultra-High RES Penetration in Interconnected Island. Appl. Sci. 2024, 14, 4668. [Google Scholar] [CrossRef]
- Katsaprakakis, D.A.; Michopoulos, A.; Skoulou, V.; Dakanali, E.; Maragkaki, A.; Pappa, S.; Condaxakis, C. A Multidisciplinary Approach for an Effective and Rational Energy Transition in Crete Island, Greece. Energies 2022, 15, 3010. [Google Scholar] [CrossRef]
- HEDNO. Available online: https://www.deddie.gr/en/services/non-interconnected-islands/ (accessed on 20 September 2025).
- Gigantidou, A. Annual Technical Bulletin for the Exploitation of the Electrical System of Crete in 2019; Technical private report; Hellenic Electricity Distribution Network Operator, S.A.: Heraklion, Greece, 2019. [Google Scholar]
- CORDIS. CRAVE-H2 Project: Cretan-Aegean Hydrogen Valley. Available online: https://cordis.europa.eu/project/id/101112169 (accessed on 2 September 2025).
- Bampaou, M.; Panopoulos, K.D. An overview of hydrogen valleys: Current status, challenges and their role in increased renewable energy penetration. Renew. Sust. Energy 2025, 207, 114923. [Google Scholar] [CrossRef]
- CRETE VALLEY Project: Transforming Crete into a Renewable, Secure and Independent Energy System for All. Available online: https://cretevalley.eu/ (accessed on 30 August 2025).
- Akter, A.; Zafir, E.I.; Dana, N.H.; Joysoyal, R.; Sarker, S.K.; Li, L.; Muyeen, S.M.; Das, S.K.; Kamwa, I. A review on microgrid optimization with meta-heuristic techniques: Scopes, trends and recommendation. Energy Strategy Rev. 2024, 51, 101298. [Google Scholar] [CrossRef]
- Ahmed, F.; Li, X.; Alotaibi, N. Sectoral coupling pathway towards a 100% renewable energy system. Renew. Energy 2025, 219, 123456. [Google Scholar] [CrossRef]
- Barabino, E.; Fioriti, D.; Guerrazzi, E.; Mariuzzo, I.; Poli, D.; Raugi, M.; Razaei, E.; Schito, E.; Thomopulos, D. Energy Communities: A review on trends, energy system modelling, business models, and optimisation objectives. Sustain. Energy Grids Netw. 2023, 36, 101187. [Google Scholar] [CrossRef]
- Amin, M.A.; Procopio, R.; Invernizzi, M.; Bonfiglio, A.; Jia, Y. Exploring the role of Energy Communities: A Comprehensive Review. Energy Convers. Manag. 2025, 25, 100883. [Google Scholar] [CrossRef]
- Du, M.; Wu, F.; Luo, L.; Wang, Q.; Liao, L. Spatial effects of the market-based energy allocation on energy efficiency: A quasi-natural experiment of energy quota trading. Energy 2025, 318, 134901. [Google Scholar] [CrossRef]
- Τezer, T. Multi-objective optimization of hybrid renewable energy systems with green hydrogen integration and hybrid storage strategies. Int. J. Hydrogen Energy 2025, 142, 1249–1271. [Google Scholar] [CrossRef]
- Shaier, A.A.; Elymany, M.M.; Enany, M.A.; Elsonbaty, N.A. Multi-objective optimization and algorithmic evaluation for EMS in a HRES integrating PV, wind, and backup storage. Sci. Rep. 2025, 15, 1147. [Google Scholar] [CrossRef] [PubMed]
- Mahmoudi, S.M.; Maleki, A.; Rezaei Ochbelagh, D. Multi-objective optimization of hybrid energy systems using gravitational search algorithm. Sci. Rep. 2025, 15, 2550. [Google Scholar] [CrossRef]
- Hesaroor, K.; Das, D. Optimal sizing of energy storage system in islanded microgrid using incremental cost approach. J. Energy Storage 2019, 24, 100768. [Google Scholar] [CrossRef]
- Samimi, A.; Nikzad, M.; Zakipour, A. Optimal sizing model of battery energy storage in a droop-controlled islanded multi-carrier microgrid based on an advanced frequency droop model. Sci. Rep. 2025, 15, 2540. [Google Scholar] [CrossRef] [PubMed]
- Joint Research Centre. Photovoltaic Geographical Information System (PVGIS). Available online: https://re.jrc.ec.europa.eu/pvg_tools/en/tools.html (accessed on 30 August 2025).
- Vourdoubas, J. Creation of zero CO2 emissions residential buildings due to operating and embodied energy use on the island of Crete, Greece. Open J. Energy Effic. 2017, 6, 141–154. [Google Scholar] [CrossRef][Green Version]
- Papadakis, N.; Katsaprakakis, D.A. A Review of Energy Efficiency Interventions in Public Buildings. Energies 2023, 16, 6329. [Google Scholar] [CrossRef]
- Katsaprakakis, D.A.; Papadakis, N.; Giannopoulou, E.; Yiannakoudakis, Y.; Zidianakis, G.; Kalogerakis, M.; Katzagiannakis, G.; Dakanali, E.; Stavrakakis, G.M.; Kartalidis, A. Rational Use of Energy in Sports Centres to Achieve Net Zero: The SAVE Project (Part A). Energies 2023, 16, 4040. [Google Scholar] [CrossRef]
- Giorgi, L.; Obushevs, A.; Korba, P. Electric vehicles load profile generator based on the probability density functions. In Proceedings of the IEEE 62nd International Scientific Conference on Power and Electrical Engineering of Riga Technical University (RTUCON), Riga, Latvia, 15–17 November 2021. [Google Scholar] [CrossRef]
- About Fuel Cell Electric Buses. Available online: https://www.fuelcellbuses.eu/wiki/fuel-cell-electric-buses-fuel-cell-electric-buses/about-fuel-cell-electric-buses (accessed on 19 July 2025).
- Caponi, R.; Ferrario, A.M.; Del Zotto, L.; Bocci, E. Hydrogen refueling stations and fuel cell buses four year operational analysis under real-world conditions. Int. J. Hydrogen Energy 2023, 48, 20957–20970. [Google Scholar] [CrossRef]
- Ballard Power Systems Bus Transit—Fuel Cell Electric Buses. 2017. Available online: https://www.ballard.com/markets/transit-bus (accessed on 14 May 2025).
- RESCHOOL Project. Local Energy Communities. Available online: https://www.reschool-project.eu/local-energy-communities/ (accessed on 20 October 2025).
- BUILD UP. More Than 9000 Energy Communities in Europe. Available online: https://build-up.ec.europa.eu/en/news-and-events/news/more-9000-energy-communities-europe (accessed on 20 October 2025).
- Żołądek, M.; Figaj, R.; Kafetzis, A.; Panopoulos, K. Energy-economic assessment of self-sufficient microgrid based on wind turbine, photovoltaic field, wood gasifier, battery, and hydrogen energy storage. Int. J. Hydrogen Energy 2024, 52, 728–744. [Google Scholar] [CrossRef]
- Chen, W.; Ren, H.; Zhou, W. Review of multi-objective optimization in long-term energy system models. Glob. Energy Interconnect 2023, 6, 645–660. [Google Scholar] [CrossRef]
- Marocco, P.; Ferrero, D.; Martelli, E.; Santarelli, M.; Lanzi, A. An MILP Approach for the Optimal Design of Renewable Battery–Hydrogen Energy Systems for Off-Grid Insular Communities. Energy Convers. Manag. 2021, 245, 114564. [Google Scholar] [CrossRef]
- Cosic, A.; Stadler, M.; Mansoor, M.; Zellinger, M. Mixed-Integer Linear Programming Based Optimization Strategies for Renewable Energy Communities. Energy 2021, 237, 121559. [Google Scholar] [CrossRef]
- Epelle, E.I.; Gerogiorgis, D.I. A computational performance comparison of MILP vs. MINLP formulations for oil production optimisation. Comput. Chem. Eng. 2020, 140, 106946. [Google Scholar] [CrossRef]
- Liu, G.; Ferrari, M.; Chen, Y. A mixed integer linear programming-based distributed energy management for three-phase unbalanced active distribution network. IEEE Trans. Smart Grid 2024, 15, 1534–1547. [Google Scholar] [CrossRef]
- Kafetzis, A.; Ziogou, C.; Panopoulos, K.D.; Papadopoulou, S.; Seferlis, P.; Voutetakis, S. Energy management strategies based on hybrid automata for islanded microgrids with renewable sources, batteries and hydrogen. Renew. Sustain. Energy Rev. 2020, 134, 110118. [Google Scholar] [CrossRef]
- Nebuloni, R.; Ilea, V.; Berizzi, A.; Bovo, C.; Meraldi, L.; Moretti, L.; Raboni, P. A MILP Battery Degradation Logarithmic Model With Real-Time Cycle Counting Calculation. IEEE Trans. Smart Grid 2025, 61, 8297–8306. [Google Scholar] [CrossRef]
- Nguyen, Q.M.; Nguyen, D.L.; Nguyen, T.K. A mixed-integer linear programming model for microgrid optimal scheduling considering BESS degradation and RES uncertainty. J. Energy Storage 2024, 73, 114663. [Google Scholar] [CrossRef]
- Paudyal, B.R.; Imenes, A.G. Investigation of temperature coefficients of PV modules through field measured data. Solar Energy 2021, 224, 425–439. [Google Scholar] [CrossRef]


Disclaimer/Publisher’s Note: The statements, opinions and data contained in all publications are solely those of the individual author(s) and contributor(s) and not of MDPI and/or the editor(s). MDPI and/or the editor(s) disclaim responsibility for any injury to people or property resulting from any ideas, methods, instructions or products referred to in the content. |
© 2025 by the authors. Licensee MDPI, Basel, Switzerland. This article is an open access article distributed under the terms and conditions of the Creative Commons Attribution (CC BY) license (https://creativecommons.org/licenses/by/4.0/).