Article

Nanofluid Cooling Enhances PEM Fuel Cell Stack Performance via 3D Multiphysics Simulation

1
Department of Naval Architecture and Ocean Engineering, Pusan National University, Busan 46241, Republic of Korea
2
The Korea Ship and Offshore Research Institute (KOSORI), Pusan National University, Busan 46241, Republic of Korea
3
Department of Naval Architecture and Ocean Engineering, Chosun University, Gwangju 61452, Republic of Korea
*
Author to whom correspondence should be addressed.
Energies 2025, 18(21), 5824; https://doi.org/10.3390/en18215824
Submission received: 7 October 2025 / Revised: 29 October 2025 / Accepted: 1 November 2025 / Published: 4 November 2025

Abstract

The proton-exchange membrane fuel cell (PEMFC) generates a significant reaction and ohmic heat during operation, imposing stringent cooling requirements. This study employs a three-dimensional, non-isothermal, steady multiphase multiphysics model to investigate heat generation and transport in a three-cell PEMFC stack using deionized water, CuO, and Al2O3 nanofluids (1 vol%) as coolants. The base (no-coolant) configuration was validated against a published polarization curve for a nine-cell stack. Introducing coolant channels increased the area-averaged current density from 2426 A m−2 (no coolant) to 2613 A m−2 (water), 2678 A m−2 (CuO), and 2702 A m−2 (Al2O3), representing up to an 11.4% performance improvement while reducing the peak cell temperature by approximately 7–8 °C. Among the examined coolants, Al2O3 nanofluid achieved the lowest maximum temperature and a favorable pressure drop, whereas water maintained the most uniform temperature field. A price-performance factor (PPF) was introduced to evaluate the techno-economic trade-off between cost and cooling benefit. This study highlights that, despite scale-related limitations between three-cell simulations and nine-cell experiments, nanofluid coolants offer a practical route toward thermally stable and high-performance PEMFC operation.

1. Introduction

Proton-exchange membrane fuel cells (PEMFCs) are emerging as a leading clean energy technology for various applications, including transportation, stationary power, portable power systems, uninterruptible power systems (UPSs), and grid-connected distributed generation systems [1,2,3]. PEMFCs are favored for their high power density, quick start-up, and low operating temperatures, achieving efficiencies exceeding 60% [4,5,6]. Despite these advantages, the global commercialization of PEMFCs faces significant challenges due to issues with durability and high costs [7]. The primary cost drivers include the Nafion membrane and platinum-based catalyst layers, while effective thermal management is crucial for ensuring the reliability and longevity of these cells durability [8,9,10].
Heat generation in PEMFCs primarily arises from the entropic electrochemical reactions that occur during electricity production, specifically the hydrogen oxidation reaction (HOR) at the anode and oxygen reduction reaction (ORR) at the cathode [11,12].
Figure 1 illustrates the basic principles of PEMFC operation with their corresponding reactions. In addition to these reactions, heat is also generated due to the ohmic resistance of the membrane and the condensation of water vapor [13,14]. Nearly 50% of the total energy produced is converted to heat, which can be expressed as follows [15]:
q ¨ = E t o t a l E c e l l × i
where E t o t a l represents the theoretical maximum cell potential represents complete conversion of chemical energy into electrical power, E c e l l is the operational voltage of the cell, where i is the current density. The value of E t o t a l is typically 1.25 V (using the higher heating value, HHV) or 1.48 V (using the lower heating value, LHV), depending on whether the by-product is liquid water or water vapor.
As shown in Equation (1), the heat generated ( q ¨ ) increases with rising current density and decreasing cell voltage [10,13]. This heat is localized in specific parts of cell, resulting in a non-uniform temperature distribution. Heat transfer within the cell occurs through convective heat transfer between fluids and solid components, as well as conductive heat transfer between the solid and porous components [16].
According to Ramousse et al. [17], the total heat produced in a PEMFC originates from two primary sources. The first is Joule heating, arising from protonic resistance in the membrane, while the second results from the electrochemical reactions occurring at the electrodes. The magnitude and distribution of heat generation are influenced by several factors, including (a) variations in material composition and manufacturer, (b) polytetrafluoroethylene (PTFE) content in the gas diffusion layer (GDL), (c) water content, and (d) mechanical compression. Moreover, the thermal properties of PEMFC components and their interfaces during operation may differ substantially from those measured in ex situ conditions. This discrepancy arises because component compression within an operating stack is non-uniform beneath the flow-field lands and channels [18,19], altering the local thermal and contact properties.
Heat transfer within the PEMFC is also closely coupled with internal water transport [14], an interaction recognized as a key challenge in improving PEMFC performance [20]. Among various mechanisms, temperature-driven water transport—such as thermo-osmosis in the membrane and phase-change-induced flow in porous diffusion media—has recently gained significant attention [21,22]. These processes depend strongly on the local temperature gradient and mean temperature of each component. In turn, the redistribution of water profoundly affects the thermal balance and temperature field within the cell, thereby influencing overall cooling efficiency and operational stability of PEMFC stacks.
However, operating PEMFC stacks at elevated temperatures, although beneficial for reaction kinetics and water management, can accelerate degradation of the membrane, catalyst, and other critical components [13,23]. Consequently, efficient thermal management is essential to ensure both high performance and long-term durability of PEMFC systems. Therefore, effective thermal management, including the use of auxiliary cooling systems, is essential to remove excess heat and maintain a uniform temperature distribution within the stack [24].
Depending on the power output and application, different active and passive cooling systems can be implemented for PEMFC stacks. Active cooling systems, which are more common in high-power applications (>10 kW), typically involve additional equipment such as a fan/blower, and cooling channels with circulating fluids [25,26]. These systems may also require a control system to regulate the coolant temperature, flow rates, and other parameters. In contrast, passive cooling systems rely on natural convection, conduction, and radiation, often using heat spreaders, heat pipes, or vapor chambers [10]. While passive cooling is simple, cost-effective, energy-efficient, and quiet, active liquid cooling is preferred for high-power PEMFC stacks due to its superior ability to handle high thermal loads [10,24]. In liquid cooling systems, heat is transferred from the cell through the bipolar plate into the coolant, which then flows through the stack’s coolant channels. The heated coolant is subsequently pumped to a heat exchanger, where it releases heat to the surrounding environment or for other purposes such as heating. Common coolants include deionized water, known for its high specific heat, and anti-freeze mixtures such as ethylene glycol and water [27]. However, cooling with these fluids requires a more complex system design, including components such as a coolant loop, heat exchanger, radiator, pump, flow regulation valve, and deionizing filter, all of which increase cost and weight [28,29]. Optimizing the cooling flow field and channel geometry is also necessary to improve cooling performance [24].
Recent advancements suggest that adding nanometer-sized particles to the base fluids, such as water and ethylene glycol, known as nanofluids, can significantly enhance thermal conductivity, specific heat, and thermal diffusivity [30,31,32]. Moreover, using nanofluids can potentially reduce the size of the cooling system, addressing packaging constraints in engine compartments and improving the overall economics of fuel cell systems [33,34]. For effective cooling in proton exchange membrane fuel cells (PEMFCs), nanofluids must exhibit low electrical conductivity (<2 µS), high boiling (>90 °C) and low freezing (<−40 °C) points, superior thermal conductivity (>0.4 W m−1 K−1), high specific heat (>3 kJ kg−1 K−1), low viscosity (<1 cP at 80 °C), long-term chemical stability (>5000 h), compatibility with common PEMFC materials, and safe, non-toxic characteristics [35,36]. Their incorporation enhances heat transfer through improved thermal conductivity and micro-convection, allowing for system miniaturization and reliable performance under cold conditions [35,37]. However, challenges remain in maintaining nanoparticle dispersion, controlling pH and electrical conductivity, managing thermal stresses and long-term stability, and addressing high production costs and potential environmental impacts associated with nanoparticle use and disposal [35,38]. Also, nanofluids pose technical challenges, including long-term stability and electrical conductivity, which can adversely affect the electrical performance of PEMFCs [35].
Zakaria et al. [39,40] explored the use of Al2O3 at low concentrations (0.1 and 0.5 vol%, volume percentage) in various water-ethylene glycol mixture mixtures in a single PEMFC cooling plate, finding that the higher concentrations improved heat transfer at the cost of increased pressure drop. Bargal et al. [41] implemented zinc oxide (ZnO) and aluminum nitride (AlN) nanoparticles in a 50/50 water-ethylene glycol mixture, observing enhanced heat transfer rates with higher particle concentrations, with ZnO performing better. Johari et al. [42] and Khalid et al. [43] introduced hybrid nanofluid, Al2O3–SiO2, in green bio-glycerol and water as base fluids, respectively, significantly improving thermal conductivity with increased SiO2 content. Mei et al. [44] used 1 vol% TiO2-SiO2 in a 60% water and 40% ethylene glycol mixture inside a cooling channel with porous metal foam, concluding that the combination is unsuitable for PEMFCs. Ma et al. [45] examined the electrical discharge effects and heat transfer capabilities of deionized water, Al2O3, and graphene nanofluids for cooling PEMFCs. To mitigate leakage currents in nanofluids, a compact Al2O3 insulating coating was applied to the cooling channel using supersonic plasma spray technology. This study found that graphene nanofluid had the best heat transfer performance, evidenced by the lowest index of uniform temperature (IUT) and the lowest maximum temperature.
Although several studies have explored nanofluid-based cooling for PEMFCs, most prior works have focused primarily on single-plate thermal or hydrodynamic analyses under constant heat flux conditions. For instance, Zakaria et al. [39,40] experimentally and numerically examined Al2O3–water/ethylene glycol mixtures for single cooling plates and reported enhanced heat transfer at low nanoparticle concentrations but without resolving internal heat generation mechanisms. Similarly, Sahin et al. [46] investigated NiFe2O4–water nanofluid cooling under variable heat flux conditions and demonstrated improved temperature uniformity but at the expense of higher pumping power. However, none of these studies addressed the coupled multiphysics behavior, specifically, the spatial distribution of electrochemical and ohmic heat sources within a multi-cell PEMFC stack. The present work fills this gap by developing a three-dimensional, non-isothermal, multiphase multiphysics model that simultaneously captures electrochemical, thermal, and fluid transport interactions in a three-cell PEMFC stack. Furthermore, a new price–performance factor (PPF) is introduced to quantitatively evaluate the trade-off between the cost and cooling benefits of different nanofluid coolants, providing a unique techno-economic perspective absent from previous CFD literature.

2. Numerical Modeling

2.1. Governing Equations and Solution Procedure

The numerical simulation of PEMFC must include a comprehensive three-dimensional, non-isothermal, steady-state multiphase model, accounting for complex interactions between various phases and transport phenomena. This model considers Multiphysics interactions involving fluids, porous materials, solid, and ionic conductive materials, all influenced by both microscale and macroscale design characteristics [47]. Several simplifying assumptions are made in this model [48,49]:
  • PEMFC operations are assumed to be under steady-state conditions.
  • The gases are modeled as ideal, incompressible, flowing laminar in the channels.
  • The gas diffusion layer (GDL) and catalyst layer (CL) are considered isotropic and homogeneous porous layers, with constant values for porosity, tortuosity, and permeability.
  • Reactants are assumed to be dry gases.
  • The operating temperature is fixed at 300 K to prevent membrane hydration.
  • The cooling channel is assumed to be well-insulated, rendering current leakage negligible despite the higher electrical conductivity of nanofluids. In this simulation, the electrical conductivity of the coolant materials is considered to be zero.
  • The three-cell model is assumed to represent the thermal and flow behavior of the full nine-cell stack, based on symmetry and uniform boundary conditions, allowing for a reduced computational cost while maintaining accuracy in predicting representative temperature and performance trends.
A dedicated Eulerian-mixture multiphase (MMP) model is employed to describe the interpenetrating nature of two physically immiscible phases (gas and liquid) in the same pressure field, with their volume fractions partitioned accordingly. The five fundamental conservation laws—mass, momentum, species, electric charge, and energy—are considered, and their modified governing equations for the fluid mixture, including the source term specifications, are summarized in Table 1 and Table 2.
Modeling of the electric conductivity is challenging, as it is influenced by the water content generated during chemical reactions. This water content, denoted by λ , within the membrane, is linked to water vapor activity, which it turn affects the conductivity of the protonic membrane. The relationship is modeled as follows [50]:
λ = 0.043 + 17.81 a 39.85 a 2 + 36.0 a 3 ,                   f o r   0     a     1 14.0 + 1.4 a 1 ,       for   1     a     3
The membrane electrical conductivity, σ m (in S/m), is determined by the following empirical correlation [50,51]:
σ m = 0.5139 · λ 0.326 e 1268 . 1 303 1 T
where activity, a = P v p P s a t + 2 s , and saturation, s .
The saturation vapor pressure, P s a t , is given by:
P s a t = 10 2.1794 + 0.02953 T 273 9.1837 × 10 05 T 273 2 + 1.445 × 10 07 T 273 3
H2O transport occurs through Fickian diffusion, necessitating the modeling of dissolved water diffusivity within the membrane [52]:
D w , m = 4.1 · 10 10 λ 25 0.25 1 + tanh λ 2.5 14
A water transport source term, S w = n d j e / F , is included to account for the electro-osmotic drag effect, effectively coupling the H2O and H+ transport (i.e., the ionic current j e ) in the electrolyte. The electro-osmotic drag coefficient is defined as n d = 2.5 λ / 22 [50].
Electric current conservation is maintained by equalizing the total current generated in the anode catalyst layer ( V a n ) with that consumed in cathode catalyst layers ( V c a t ) , expressed as follows:
V a n i a n · d V = V c a i c a · d V
where i a n and i c a t are electric current densities resulting from electrochemical reactions in their respective catalyst layers, as expressed by the Butler-Volmer equation:
i a n = i 0 , a n c H 2 c H 2 r e f γ a exp α r e d , a n F η a n R T exp α o x , a n F η a n R T
i c a t = i 0 , c a c O 2 c O 2 r e f γ c exp α r e d , c a t F η c a t R T exp α o x , c a t F η c a t R T
where i 0 , a n and i 0 , c a t are the reference exchange current densities for the anode and cathode, α r e d , a n and α o x , c a t are the transfer coefficients, γ a n and γ c a t are the concentration coefficients, η a n and η c a t are the overpotentials, F is the Faraday constant (9.65 × 10⁷ C/kg-mol), and c H 2 and c O 2 are the local H2 and O2 concentrations, with c H 2 r e f and c O 2 r e f being their respective reference concentrations, respectively.

2.2. Flow Channel Design and Computational Domain

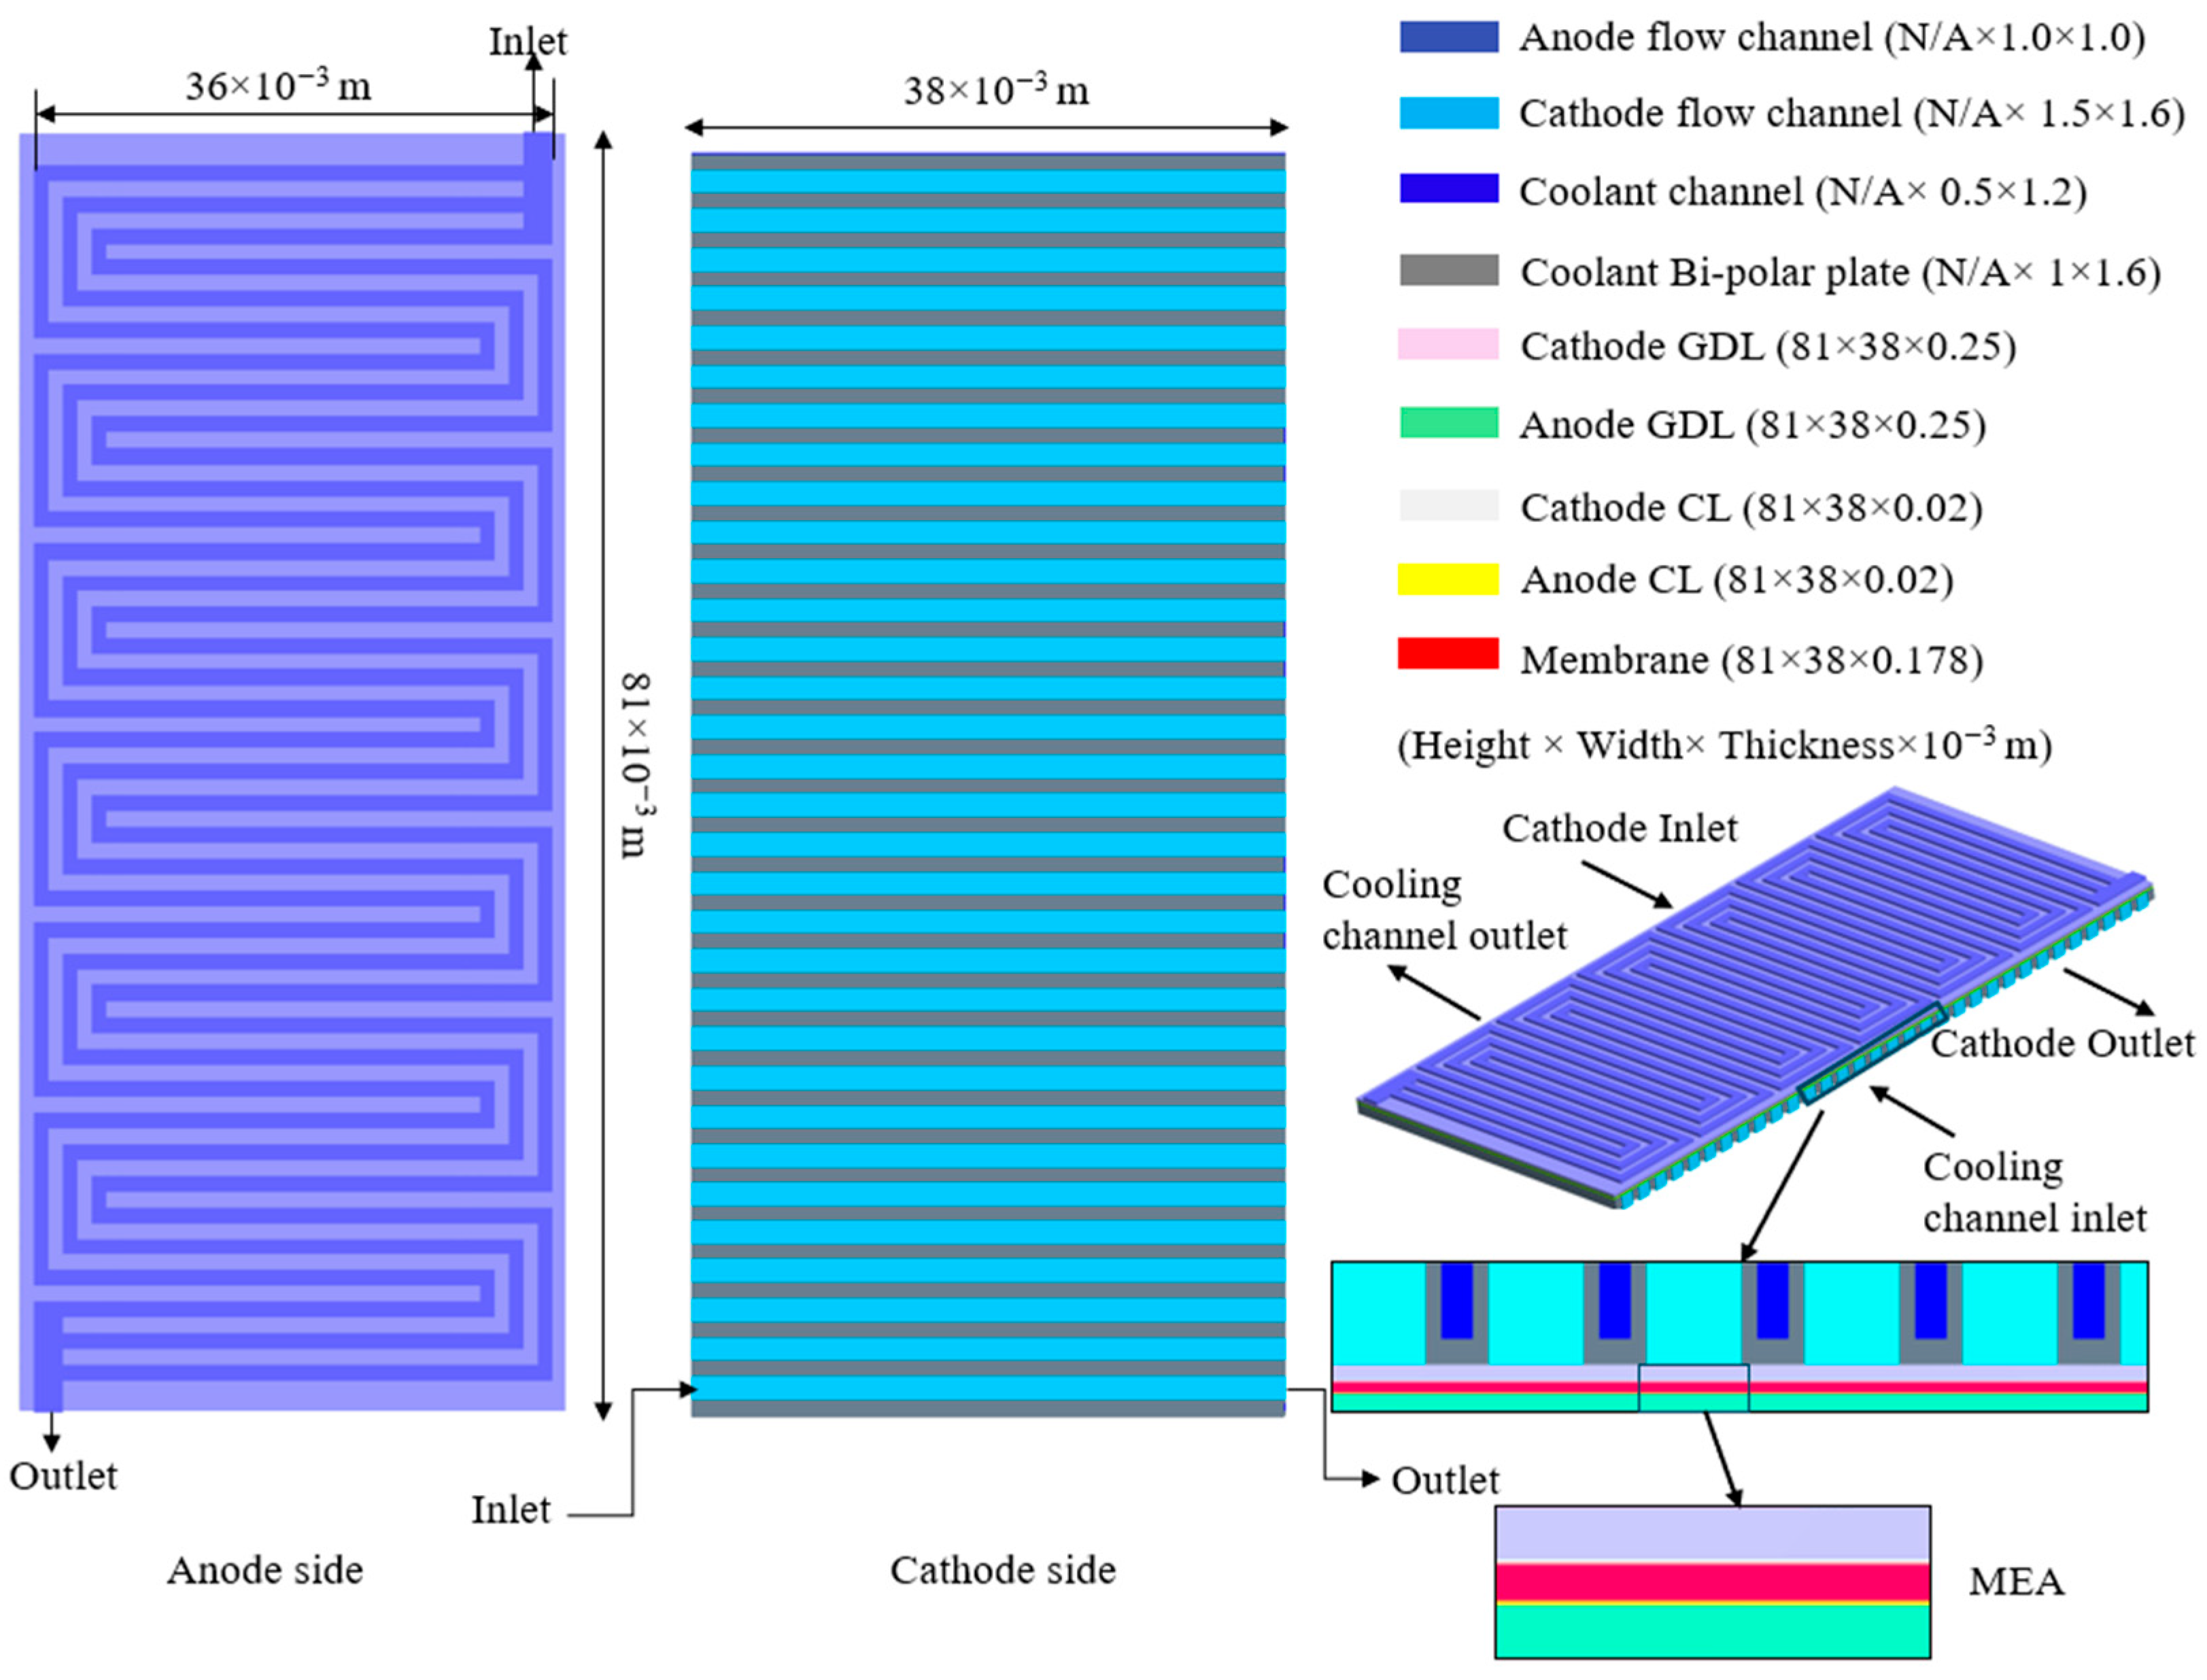
Building on the simulation work conducted in previous studies [53,54], the PEMFC stack in this study consists of 3 cells connected in series. The anode and cathode sides are designed with distinct flow channel configurations: a 3-channel serpentine pattern on the anode and 32 straight channels on the cathode side. Figure 2 provides a schematic representation of the PEMFC components, along with their respective dimensions. The membrane electrode assembly (MEA) comprises a gas diffusion layer (GDL) and catalyst layer (CL) on both sides of a single central membrane. Figure 3 illustrates the computational domain for the PEMFC stack. A structured and directed mesh (polygonal mesh) was generated for flow channel (FCL), CL, GDL, and membrane, ensuring high accuracy in the simulation. For the bipolar plate (BPL), an automated mesh (polyhedral mesh) was selected based on the results of a grid convergence index (GCI) calculation, which will be discussed in detail in a subsequent section.
Table 3 and Table 4 presents 3 details of mesh and the physical properties of PEMFC components, respectively.

2.3. Boundary Conditions and Coolant Properties

A three-dimensional multiphysics model of the PEMFC was developed and implemented using SIMCENTER STARCCM+ 2021.2 on a 96 CPU Linux workstation. The boundary conditions applied in this simulation are critical to accurately replicating the operating environment and ensuring the validity of the results. Table 5 summarizes the operating condition of the PEMFC stack, including parameters such as the temperature, pressure, and reactant flow rates.
In this study, the properties of Al2O3 and CuO nanofluids with a 1% volume concentration of nanoparticles, using water as the base fluid are adapted from previous work [55]. These nanofluids were selected due to their superior thermal conductivity and potential to enhance the thermal management of PEMFCs. The thermophysical properties of the coolant materials, including density, specific heat, thermal conductivity, and viscosity, are detailed in Table 6.
The boundary conditions for the simulation were carefully defined to reflect realistic operating scenarios. The inlet boundary conditions for the gas channels were set based on the specified flow rates and temperatures of the reactants, while the outlet boundary conditions were defined to maintain a fixed pressure drop across the channels. The cooling channels were assigned constant temperature boundary conditions at the inlet, with the flow assumed to be fully developed and laminar.
Additionally, the thermal and mass transfer interactions between the different components of the PEMFC, such as the gas diffusion layer (GDL), catalyst layer (CL), and membrane, were modeled using appropriate interface conditions to ensure continuity of heat flux and species concentration across the interfaces.
The preparation and characterization of the nanofluids, including the stability of the nanoparticle suspension and the verification of their thermophysical properties, were also rigorously conducted to ensure the reliability of the simulation results. The choice of 1% particle concentration was based on a balance between maximizing thermal conductivity and minimizing potential issues such as increased viscosity or particle aggregation, which could negatively impact the performance of the coolant.

3. Simulation Results and Discussion

3.1. Grid Uncertainty Analysis

To ensure numerical accuracy and verify mesh independence, a grid uncertainty analysis was performed following the Grid Convergence Index (GCI) methodology outlined by Roache [57]. Three successively refined grids (coarse, medium, and fine) were generated with a refinement ratio of approximately r = 1.33. The monitored variable, f, represents the computed electric potential/current density, and the results obtained on the three grids (f1, f2, f3) were used to determine the observed order of accuracy p through Richardson extrapolation:
G C I f i n e = F s ε r P 1
G C I c o a r s e = F s ε r P r P 1
ε = f n + 1 f n f n
p = l n f n + 2 f n + 1 f n + 1 f n ln r
where F s = 1.25 , ε and r represent the factor of safetythe relative error and the ratio of the number of grids, respectively. For detailed information please refer to authors previous publication [48,49].
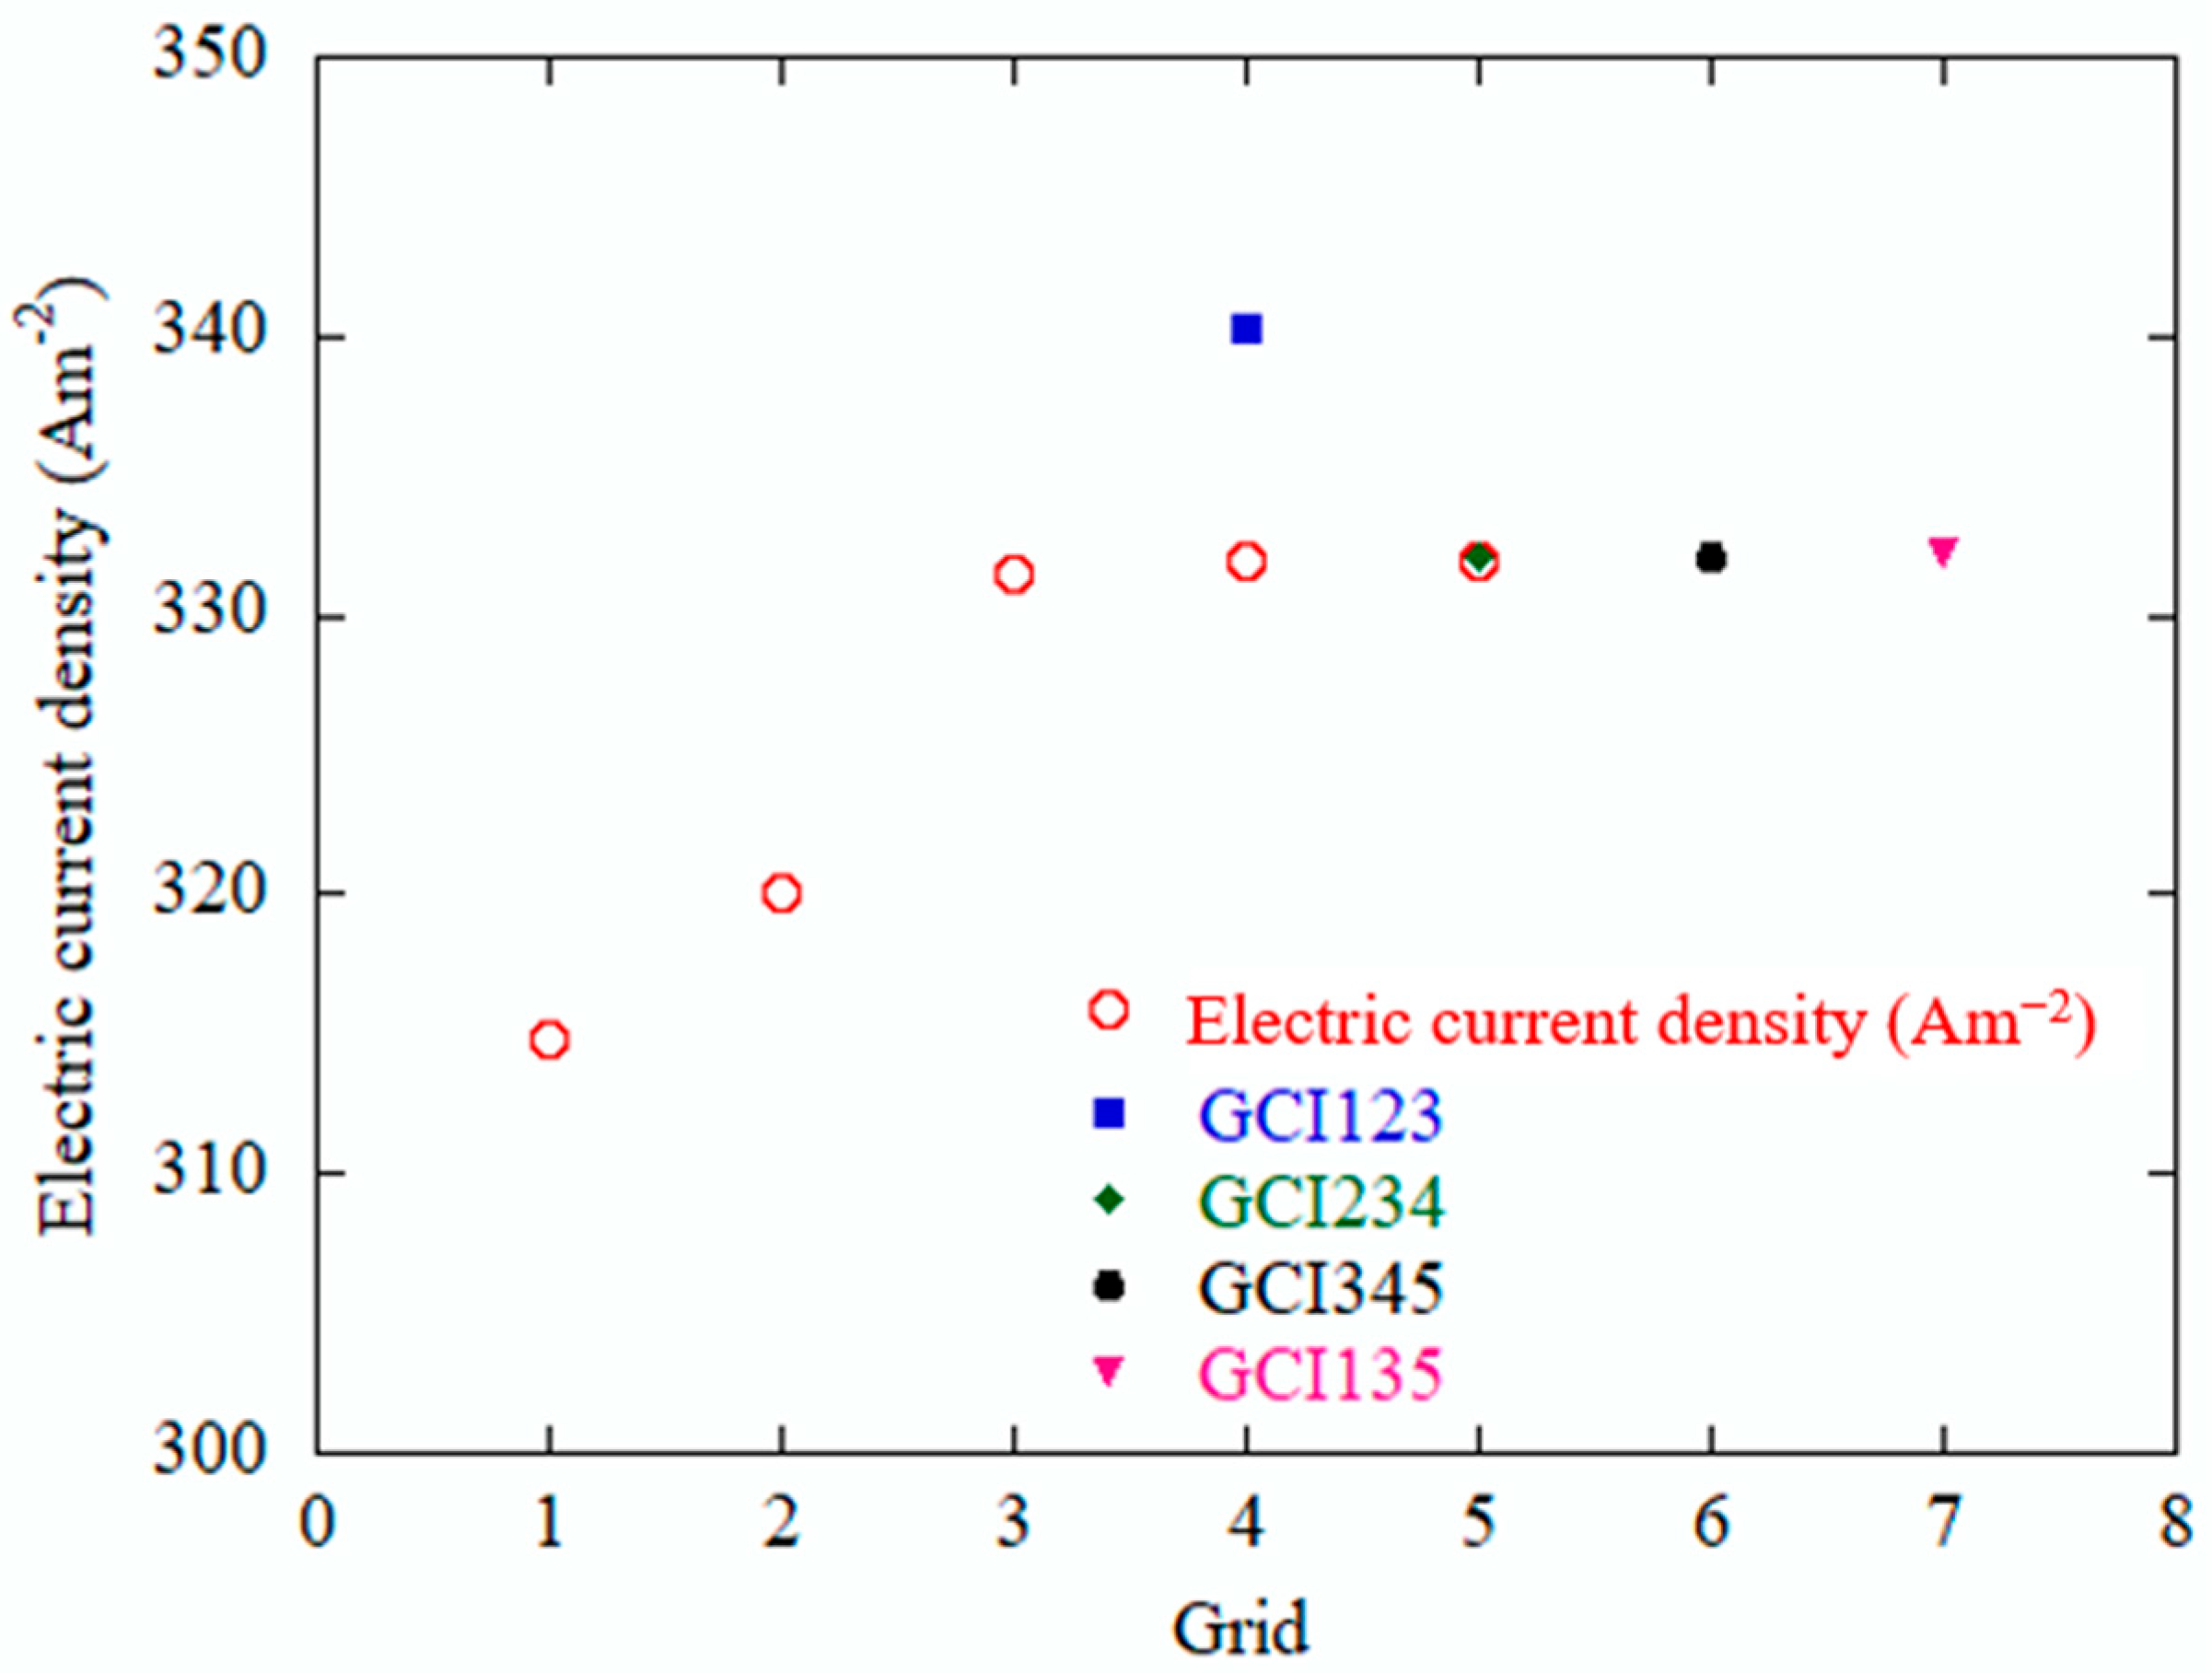
To perform the grid convergence test, the electric potential was calculated using different grid system from Grid 1 (1,706,530) to Grid 5 (6,344,894). The GCI results, obtained from Equations (9)–(12) are presented in Table 7. Although the extrapolation estimate using Grid 123 and the simulation value using Grid 4 show slightly different results, it can be confirmed that the result of Grid 234 converges to show results similar to the simulation value of Grid 5. The calculated GCI values represent the numerical percentage uncertainty between successive mesh levels. The fine-grid GCI was found to be below 1%, confirming that the solution is mesh-independent and within the asymptotic convergence range. By plotting in a graph, as shown in Figure 4, the overall convergence results can be acquired. Therefore, the grid system of Grid 3 showing the convergence was used for subsequent simulations.

3.2. Experimental Validation

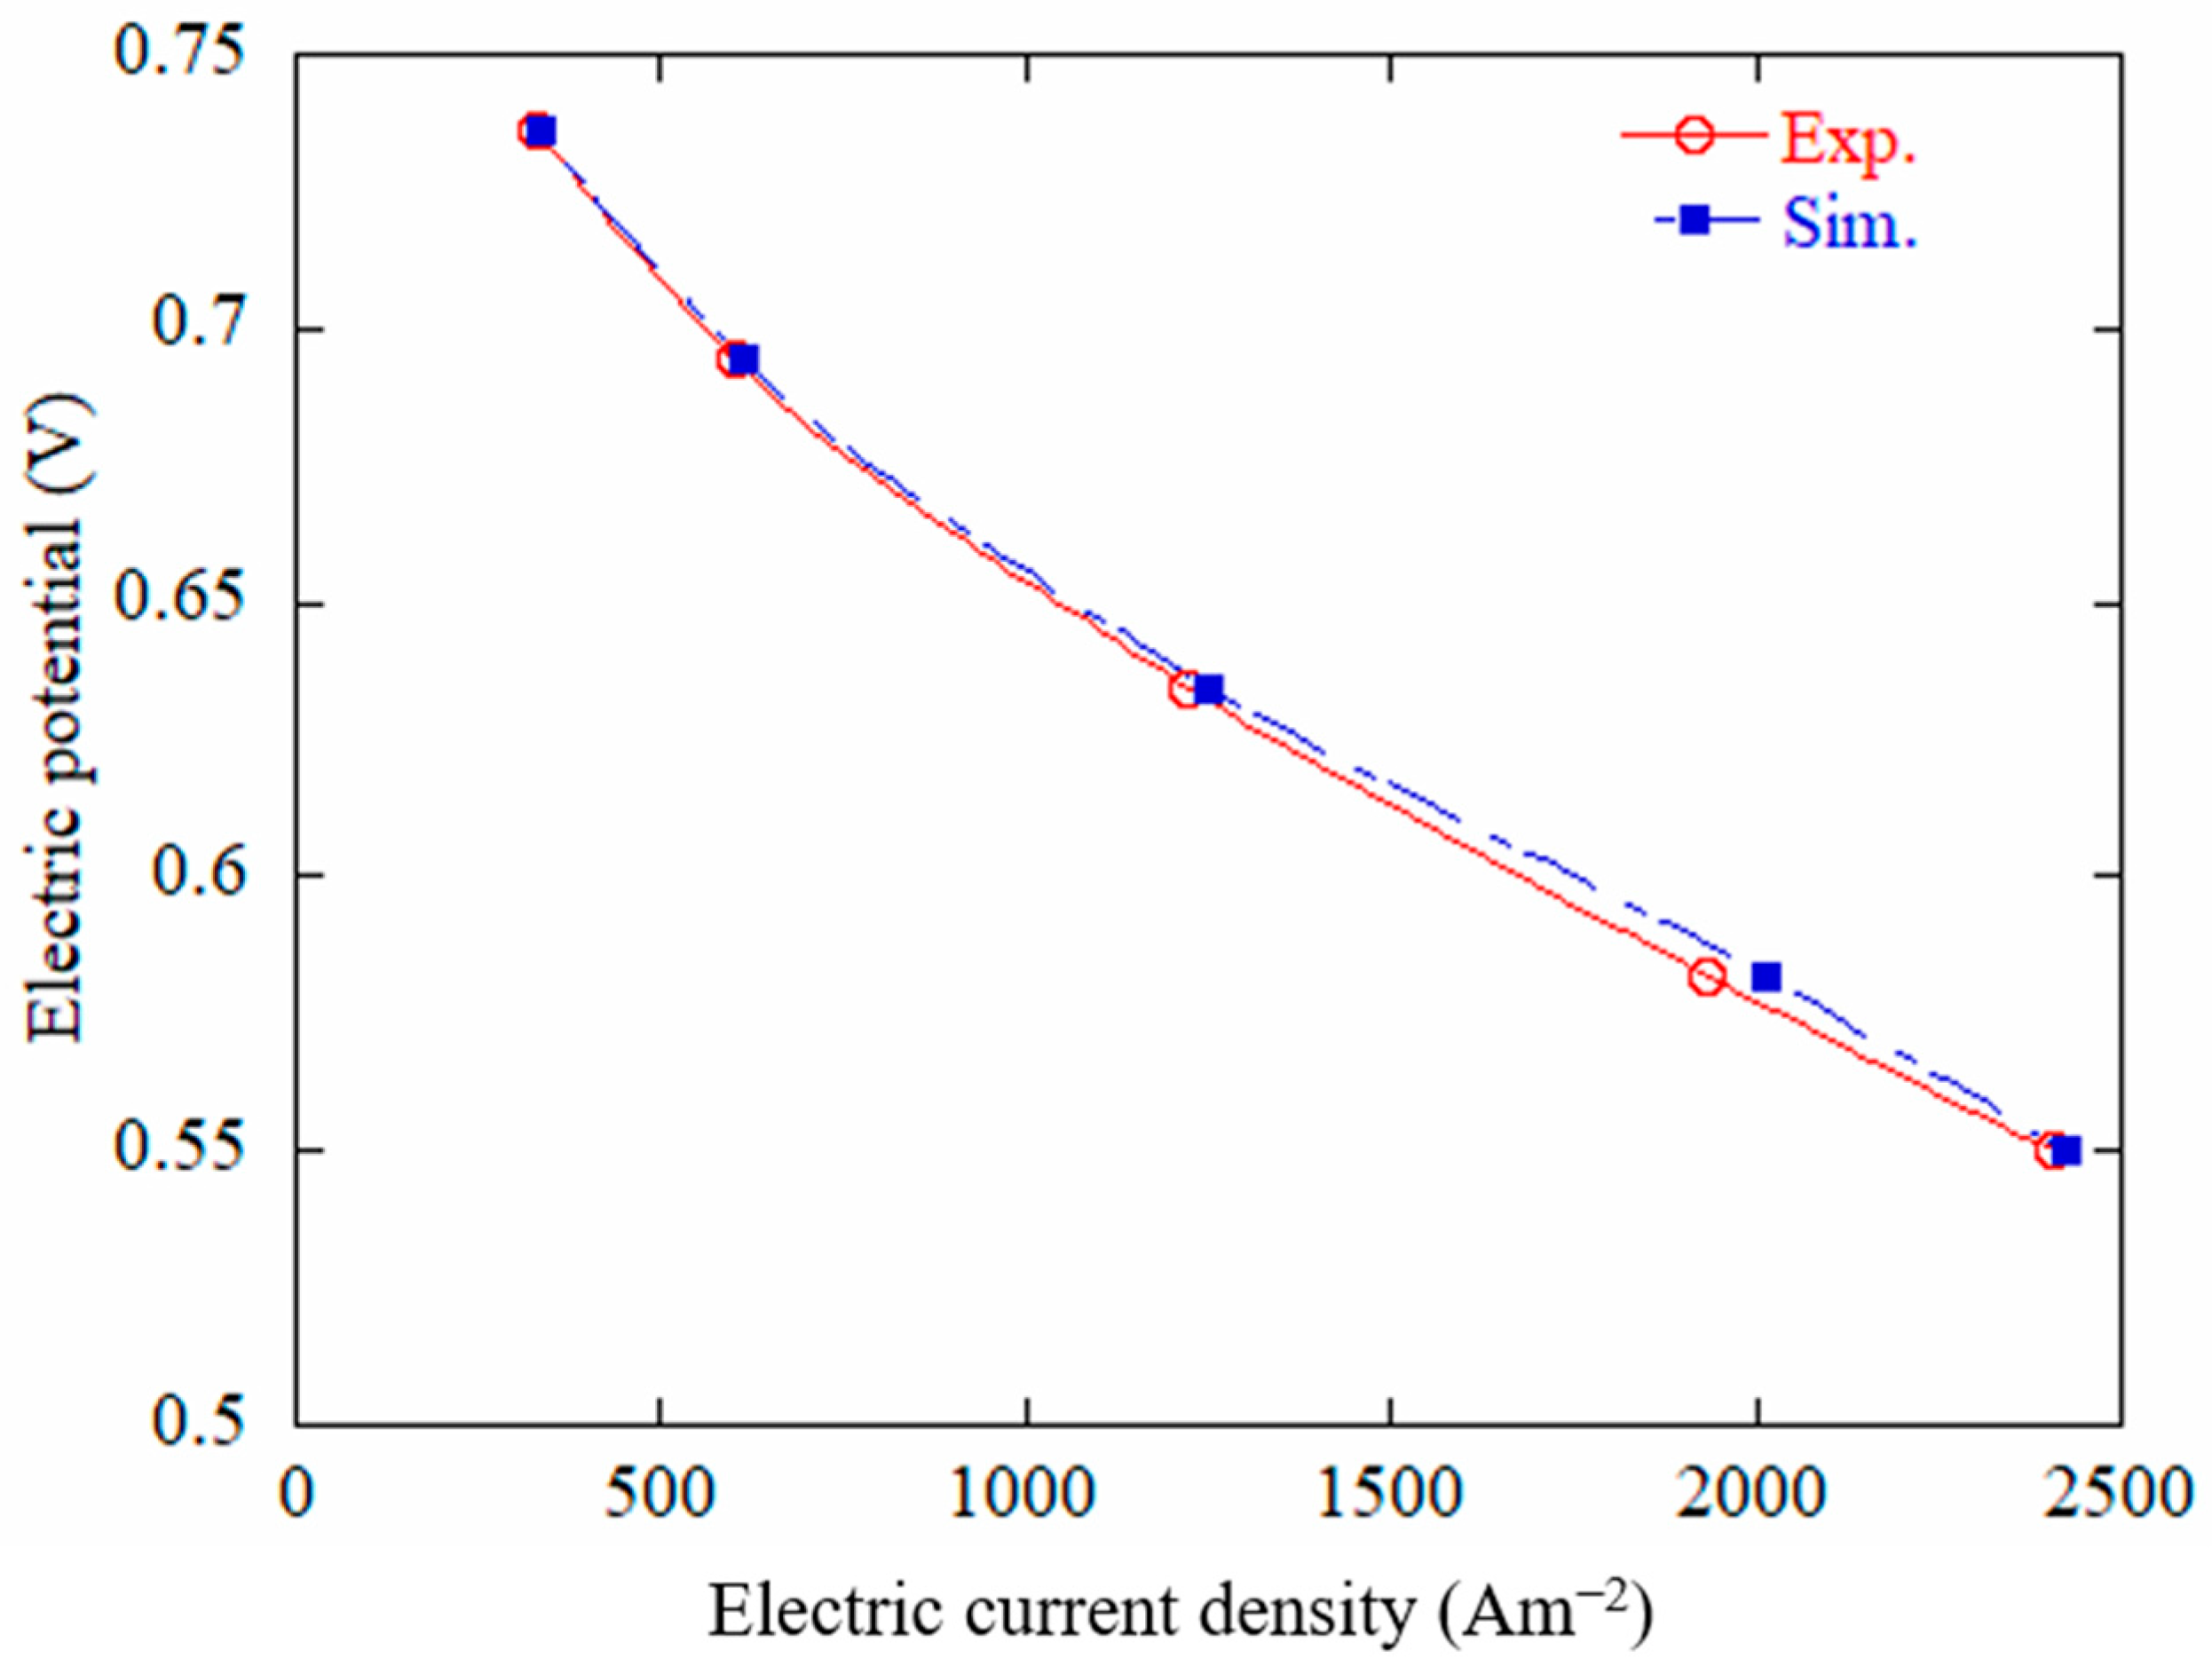
The simulated polarization curve was compared with the experimental results for validation, as shown in Figure 5. The polarization curve for the PEMFC stack without coolant closely matches the experimental data, from activation losses at low current densities to concentration losses at higher current densities. Although The PEMFC stack in the real experiment [53] contains 9 cells, higher than the current simulation case (PEMFC with 3 cells), and the design and operating parameters are similar.
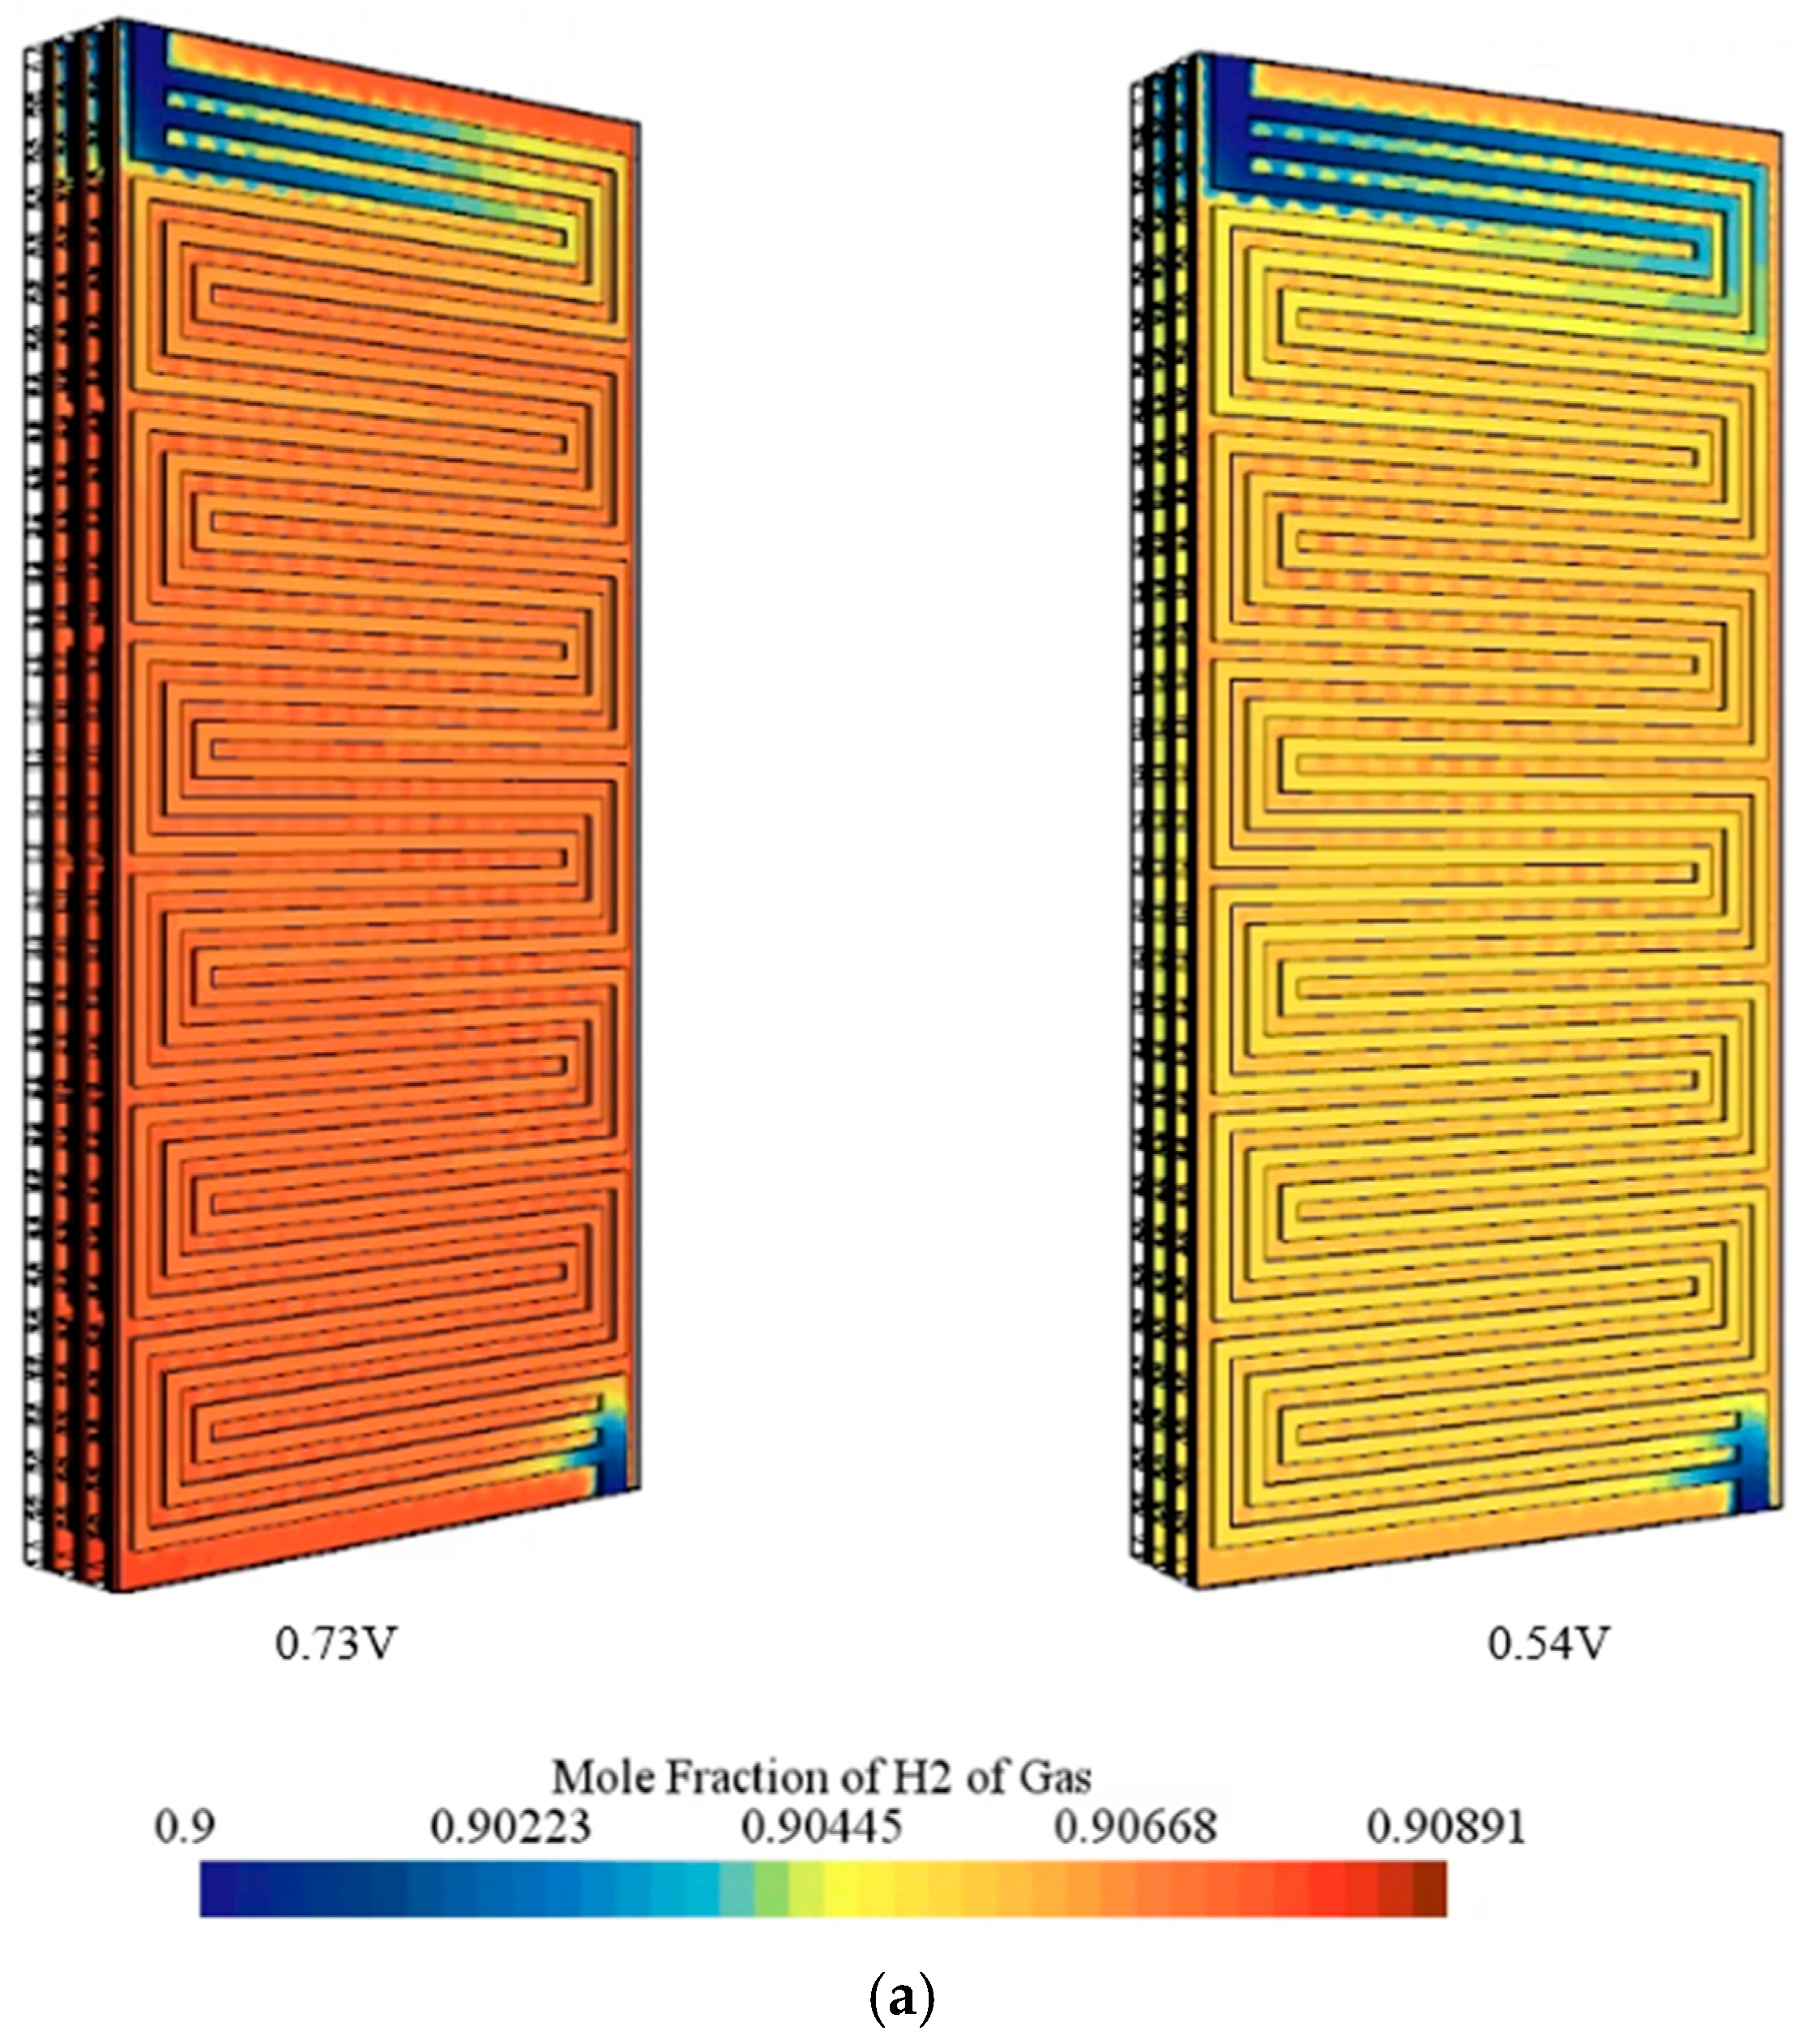
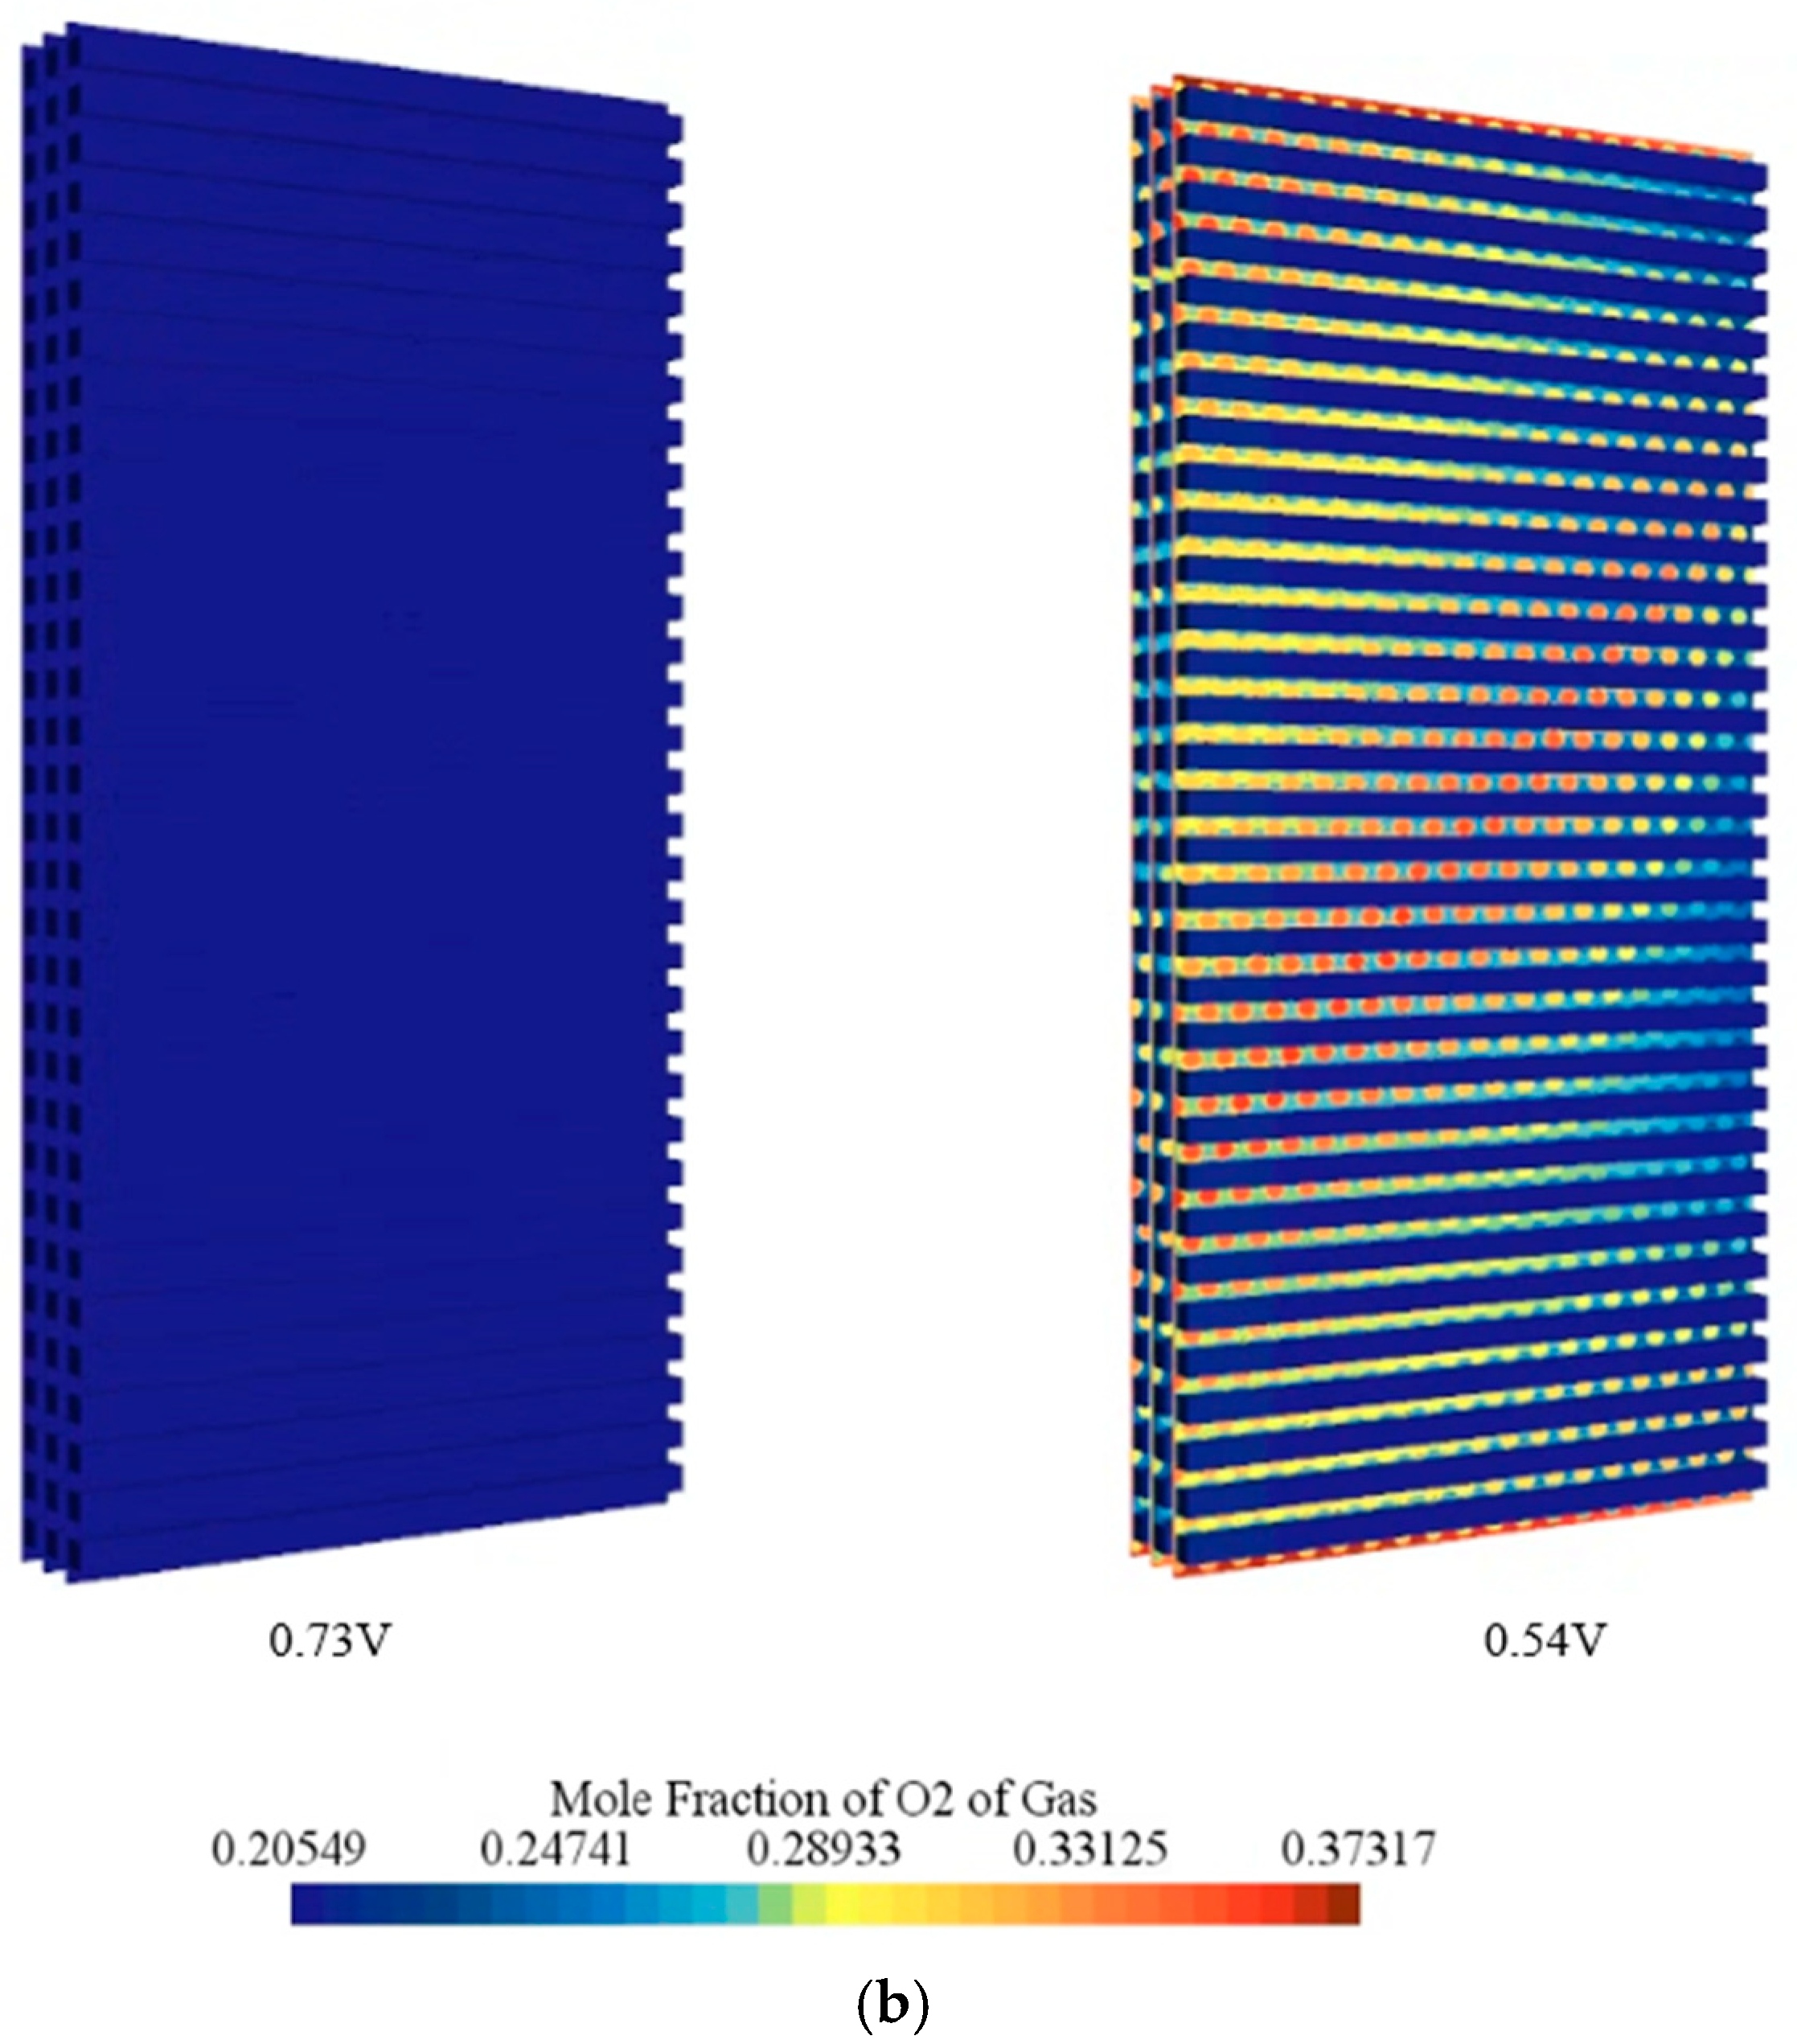
The voltage was applied to the cathode current collector, and the reaction distributions were analyzed for the corresponding voltage. To understand the mole fraction distribution on the anode side at different voltages, two extreme cases, i.e., 0.73 V and 0.54 V, are shown in Figure 6. In Figure 6a, the hydrogen distribution on the anode side of the PEMFC is shown at two different voltages. At 0.73 V, the mole fraction of hydrogen remains high and relatively uniform throughout the serpentine flow channels, with only slight depletion visible near the outlet. This uniformity indicates that hydrogen consumption is limited under low current density, as the reaction rate is relatively slow at higher voltages. In contrast, at 0.54 V, corresponding to high current density, hydrogen is consumed more rapidly along the channel length, leading to significant gradients and visible depletion near the outlet region. This highlights the risk of localized fuel starvation under heavy load conditions. In Figure 6b, the oxygen distribution on the cathode side is presented. At 0.73 V, oxygen mole fraction remains nearly constant and close to inlet conditions, showing that oxygen utilization is minimal when the current density is low. However, at 0.54 V, strong gradients develop across the cathode channels, with clear depletion in active reaction zones. This uneven distribution indicates oxygen starvation, which is a well-known limiting factor for PEMFC performance at high current density.
When considering both sides together, the results demonstrate the effect of voltage on fuel cell operation. At high voltage (0.73 V), both hydrogen and oxygen are evenly distributed, ensuring efficient operation but with limited reactant utilization. At low voltage (0.54 V), the increased reaction rate causes severe hydrogen and oxygen depletion, leading to mass transport limitations, concentration polarization, and possible performance degradation.
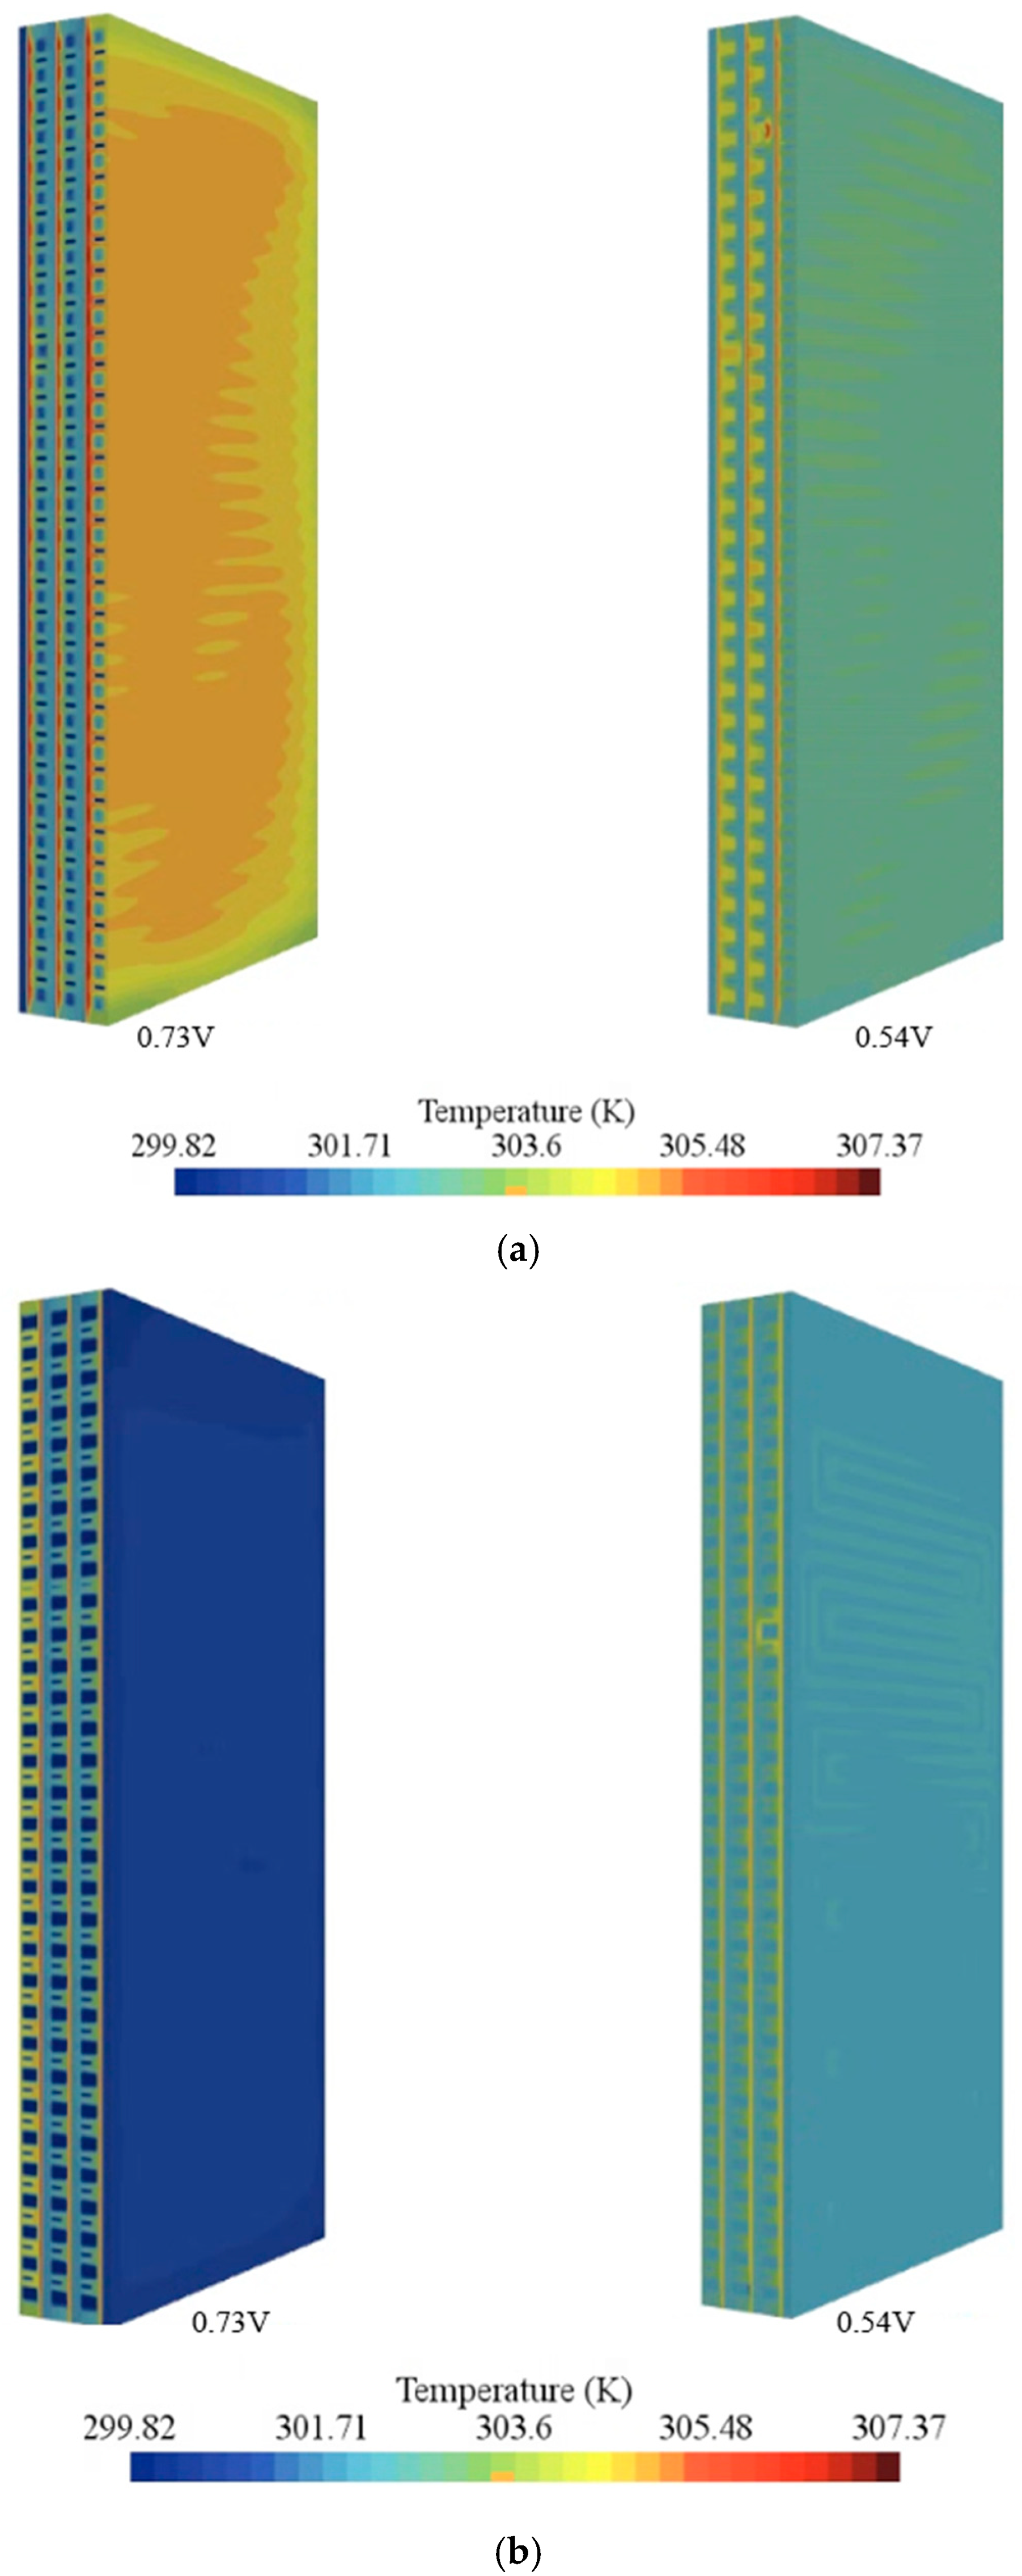
In Figure 7a, the temperature distribution on the cathode side of the PEMFC is shown at 0.73 V and 0.54 V. At the higher voltage of 0.73 V, corresponding to lower current density, the temperature across the domain is more uniform, with only mild gradients visible. This occurs because the electrochemical reaction rate and associated heat generation are relatively low, keeping the temperature rise limited. At the lower voltage of 0.54 V, representing higher current density, stronger temperature gradients are observed, particularly near the reaction zones and close to the flow channels, where significant heat is released due to increased electrochemical activity and ohmic losses.
In Figure 7b, the anode side temperature distribution follows a similar trend. At 0.73 V, the structure remains cooler and more uniform, while at 0.54 V, localized hot regions develop along the channels, especially in the absence of active coolant flow. This indicates that as the load increases, the heat generated within the cell accumulates and elevates local temperatures, leading to uneven distribution.
Taken together, the results highlight the impact of voltage on thermal behavior in PEMFCs. At high voltage (low current density), the temperature remains stable and evenly distributed, reducing thermal stress on the cell components. At low voltage (high current density), more heat is produced, causing non-uniform temperature to rise that is especially evident in the coolant channel regions where heat removal is absent. This uneven heating can lead to local hot spots, accelerated membrane dehydration, and long-term degradation of fuel cell performance. However, the bipolar plate near the cathode and coolant channels shows a high temperature region, due to the absence of coolant, which acts as an extended surface by absorbing all the heat.
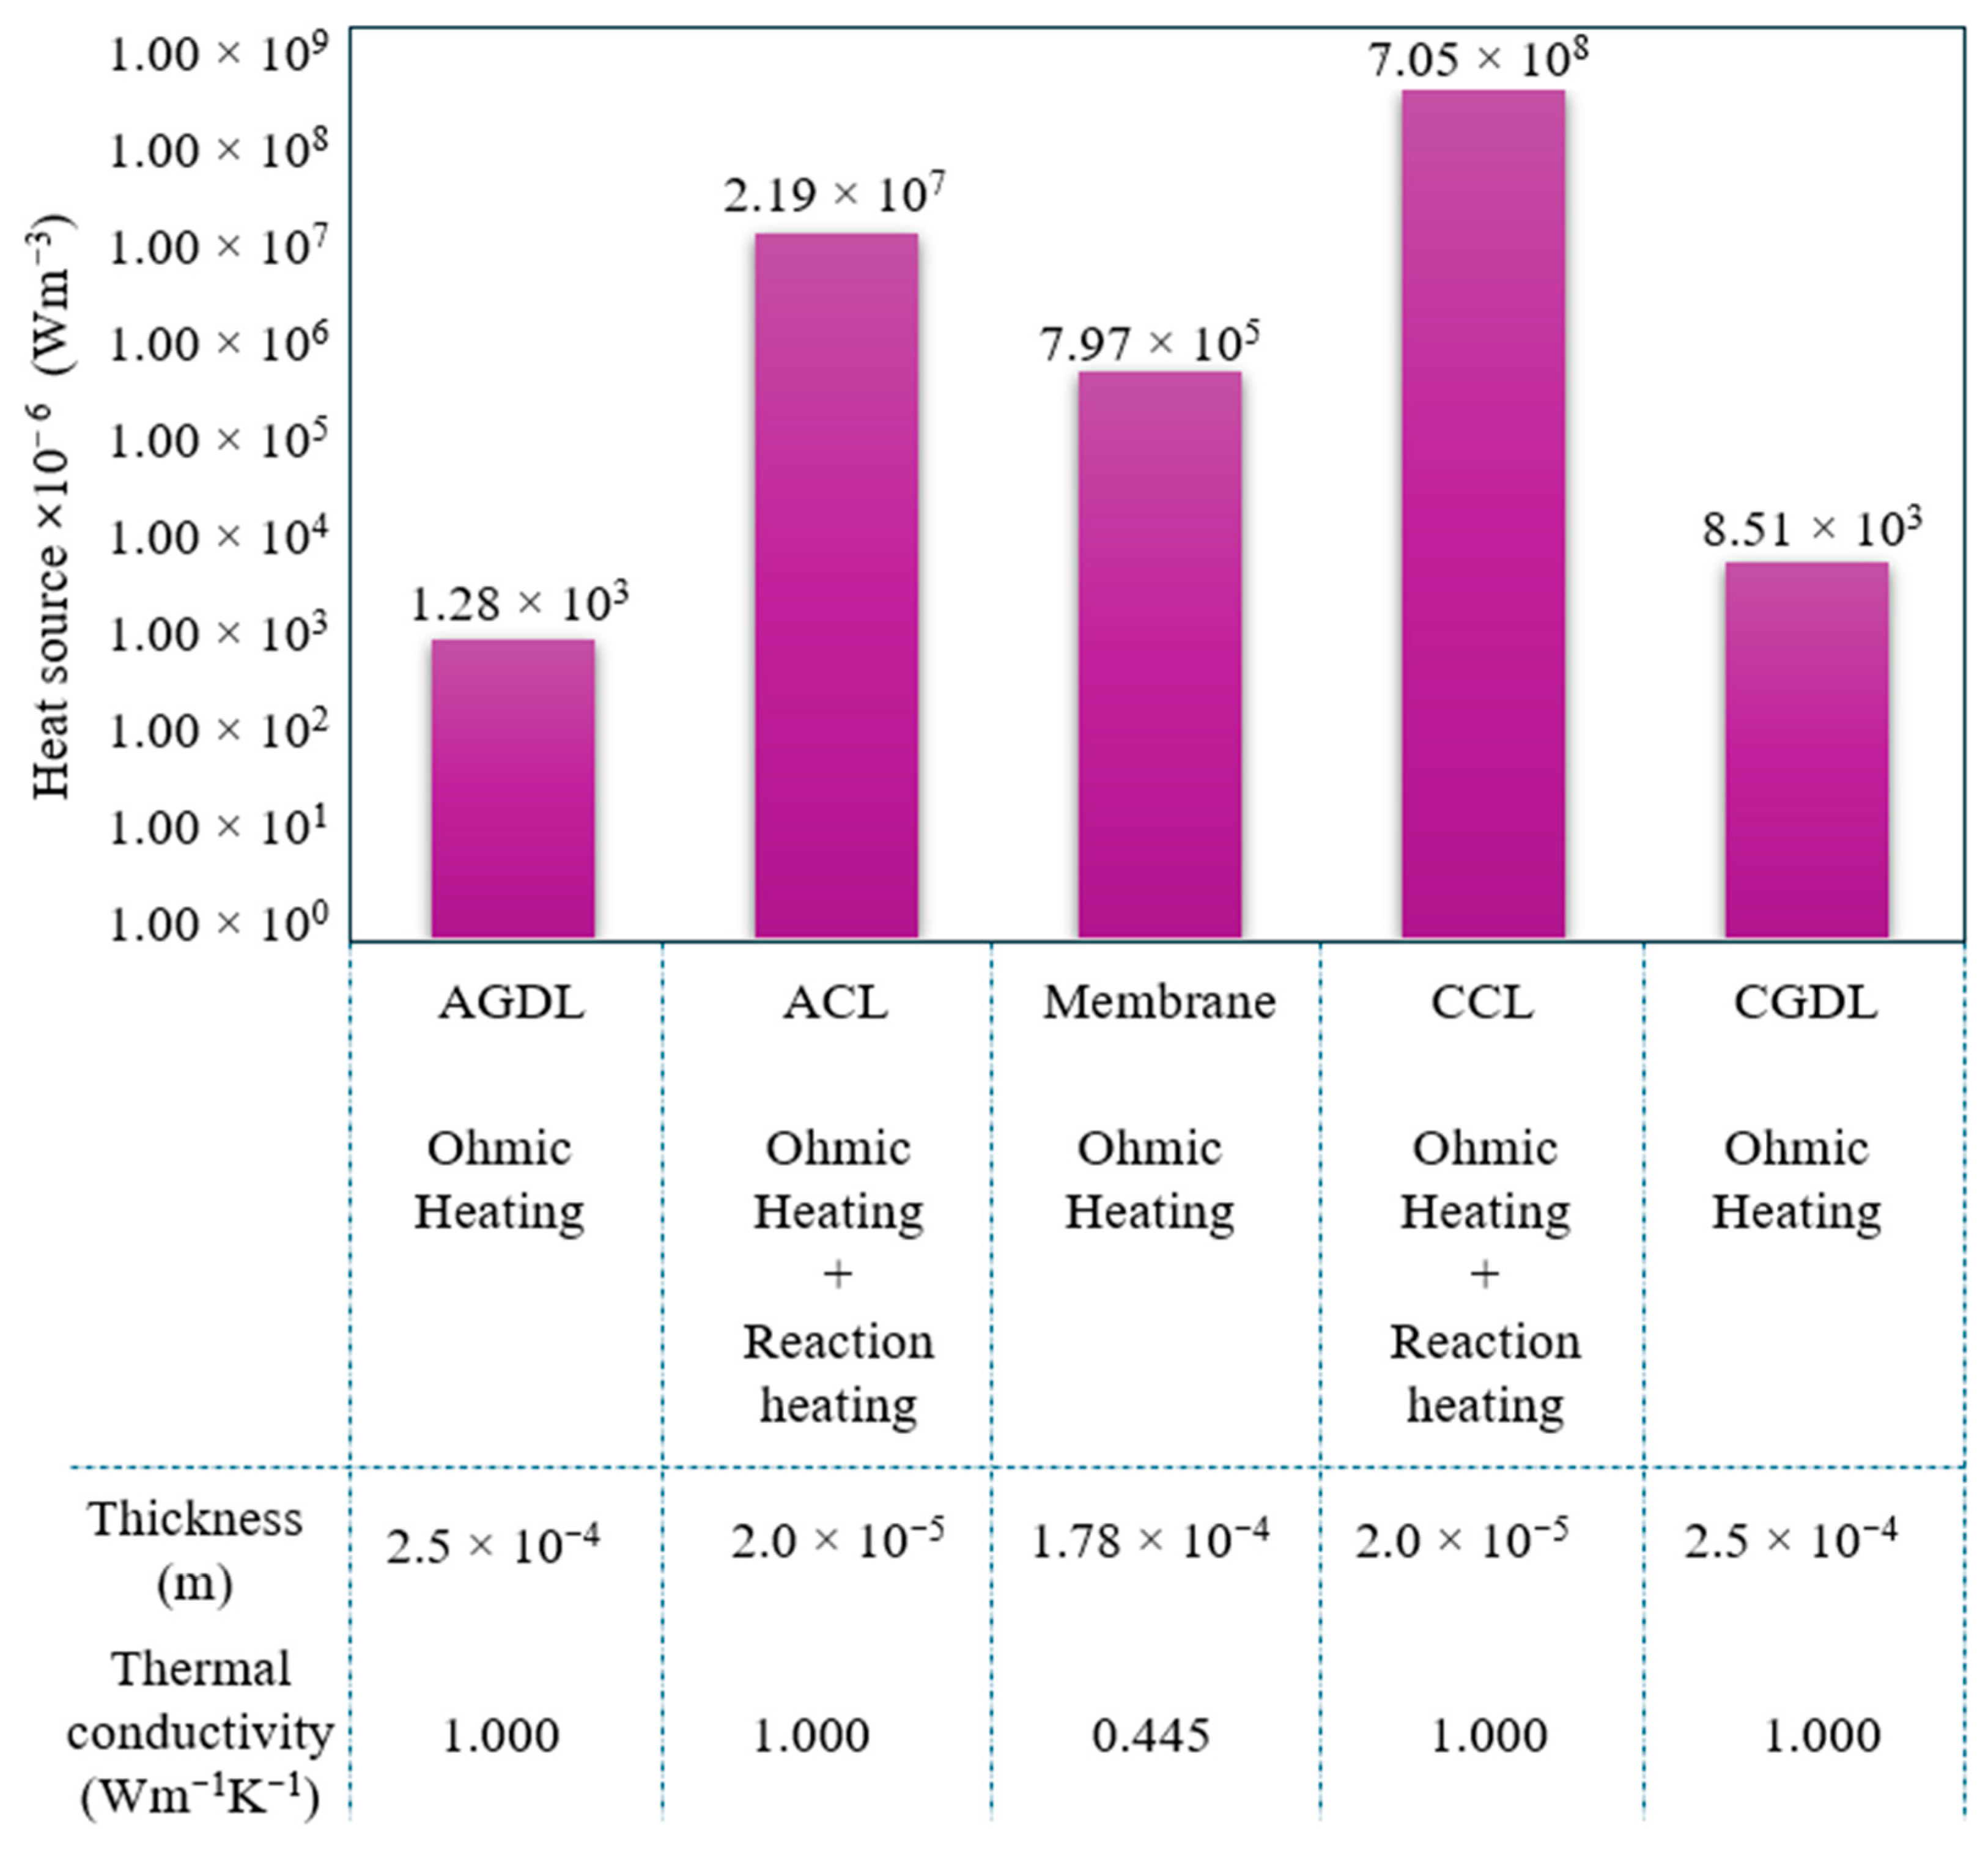
Figure 8 illustrates the heat source distribution within different layers of a Proton Exchange Membrane Fuel Cell (PEMFC), expressed in terms of the volumetric heat generation rate (Wm−3) [58]. The bar chart highlights how different mechanisms of heat generation, primarily ohmic heating and reaction heating, are distributed across the anode and cathode components.
On the anode side, the Anode Gas Diffusion Layer (AGDL) exhibits minimal heat generation (1.28 × 10³ W/m3), attributed solely to ohmic heating, as no electrochemical reactions occur within this porous medium. The Anode Catalyst Layer (ACL) shows significantly higher heat generation (2.19 × 10¹³ Wm−3), due to the combination of ohmic resistance and reaction heat from the hydrogen oxidation reaction (HOR). The membrane produces moderate heat (7.97 × 10¹¹ Wm−3), arising purely from ionic ohmic losses, as protons migrate through its relatively low thermal conductivity (0.445 Wm−1K−1) compared to other layers. On the cathode side, the Cathode Catalyst Layer (CCL) exhibits the highest heat generation of all layers (7.05 × 10⁸ W/m3), due to a combination of substantial ohmic heating and exothermic reaction heating from the oxygen reduction reaction (ORR), which is more sluggish and energy intensive than the HOR. Finally, the Cathode Gas Diffusion Layer (CGDL) produces very little heat (8.51 × 10⁹ Wm−3), again limited to ohmic heating.
The bottom table contextualizes these results with structural parameters. The ACL and CCL are very thin (2.0 ×10⁻⁵ m each), yet they dominate heat generation, particularly the CCL, due to their central role in electrochemical reactions. By contrast, the GDLs are thicker (2.50 ×10⁻⁴ m) but contribute negligibly to overall heating. The membrane, with intermediate thickness (1.78 × 10⁻⁴ m) and low thermal conductivity, contributes moderately through ionic ohmic heating but also acts as a thermal bottleneck. In summary, this figure emphasizes that the catalyst layers, especially the cathode catalyst layers, are the primary sources of heat in PEMFCs, driven by both ohmic and reaction heating.
Figure 8 exhibits close agreement with trends reported in experimental [58,59], particularly the peak thermal activity near the cathode catalyst layer and uniform heat dispersion through the membrane. This correspondence indicates that the electrochemical–thermal coupling in the model accurately represents real PEMFC behavior, thereby affirming its validity beyond the polarization curve comparison.
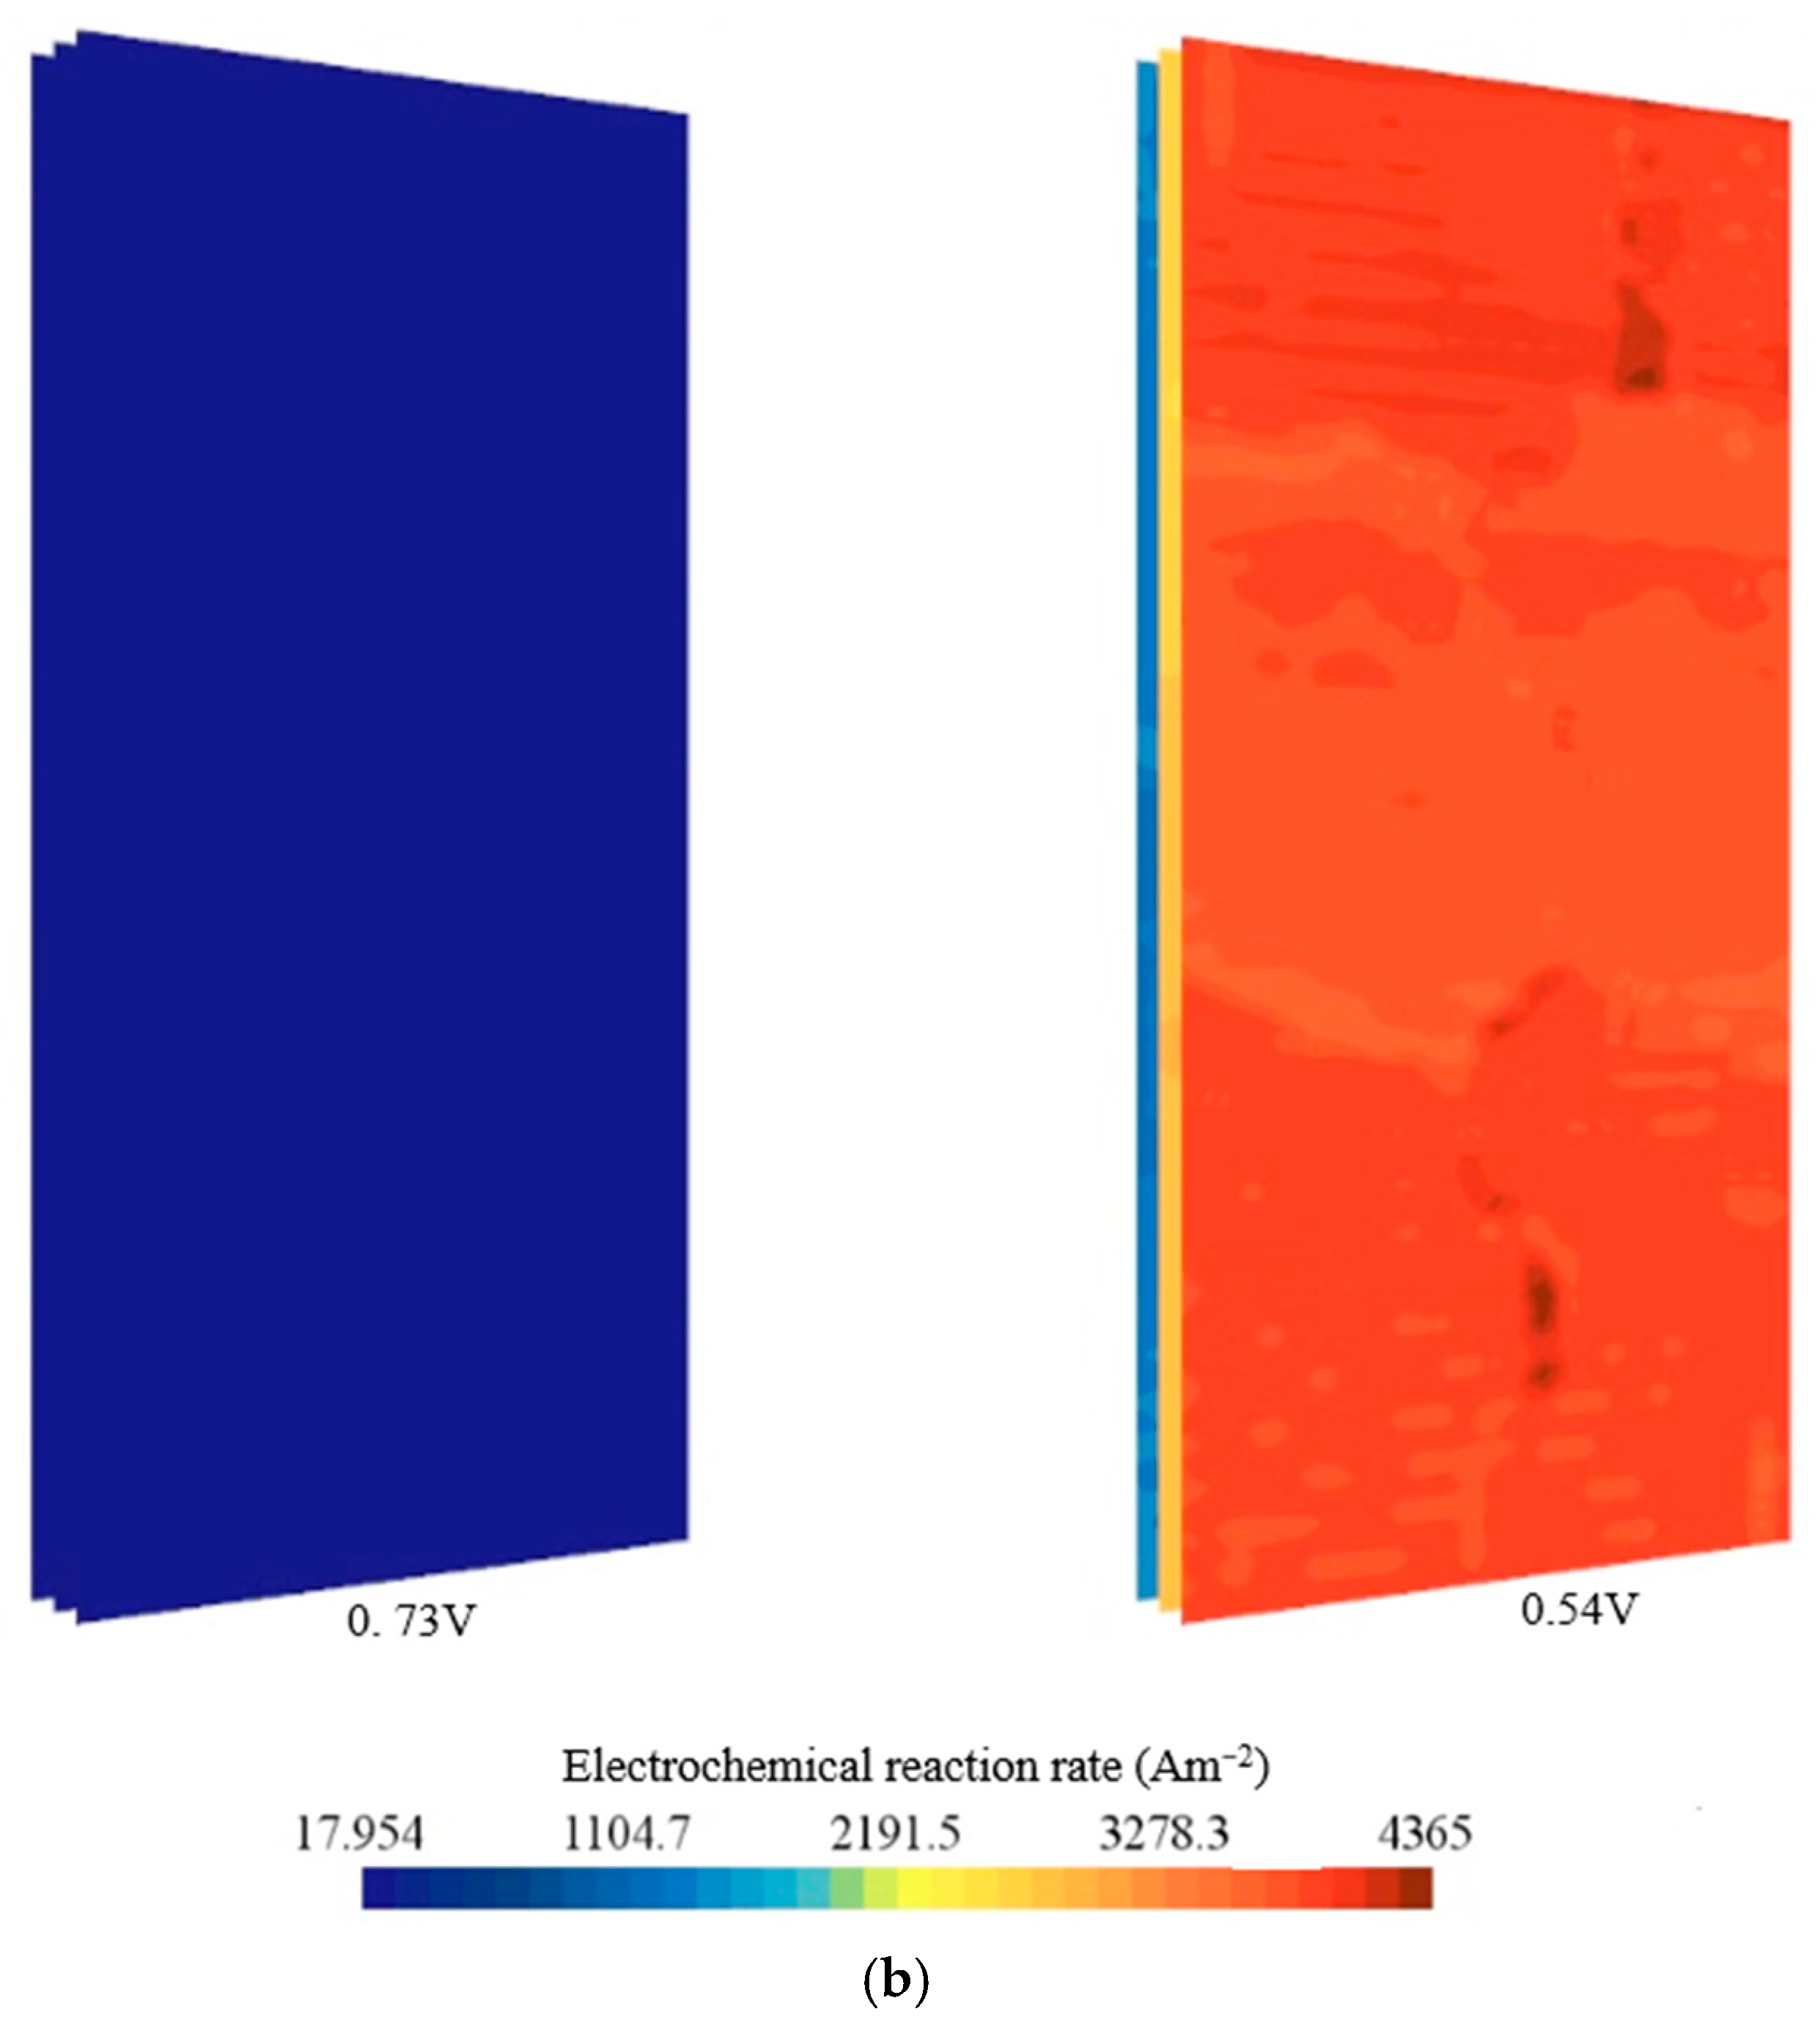
In Figure 9, the water content of the membrane and electrochemical reaction rate at CCL interphase are investigated at high and low voltages. At 0.73 V, corresponding to low current density, the membrane shows higher and more uniformly distributed water content, as electro-osmotic drag and back-diffusion are balanced under modest reaction conditions. This is consistent with the relatively low electrochemical reaction rate shown in Figure 9b, where oxygen reduction proceeds slowly, generating limited additional water on membrane. At 0.54 V, however, the higher current density drives a significant increase in the electrochemical reaction rate (Figure 9b), resulting in non-uniform spatial activity. Despite stronger oxygen reduction kinetics, the water content in the membrane (Figure 8) decreases under this condition due to greater electro-osmotic drag pulling water toward the cathode and possible local drying near the anode side. When combined with earlier observations of reactant depletion (Figure 6) and heat accumulation (Figure 7), these results highlight how low-voltage, high-current operation enhances power output but simultaneously aggravates issues such as uneven hydration, local drying, and thermal stress [60]. In contrast, high-voltage operation ensures better membrane hydration and stability, albeit at reduced power density.

3.3. Effect of Coolants

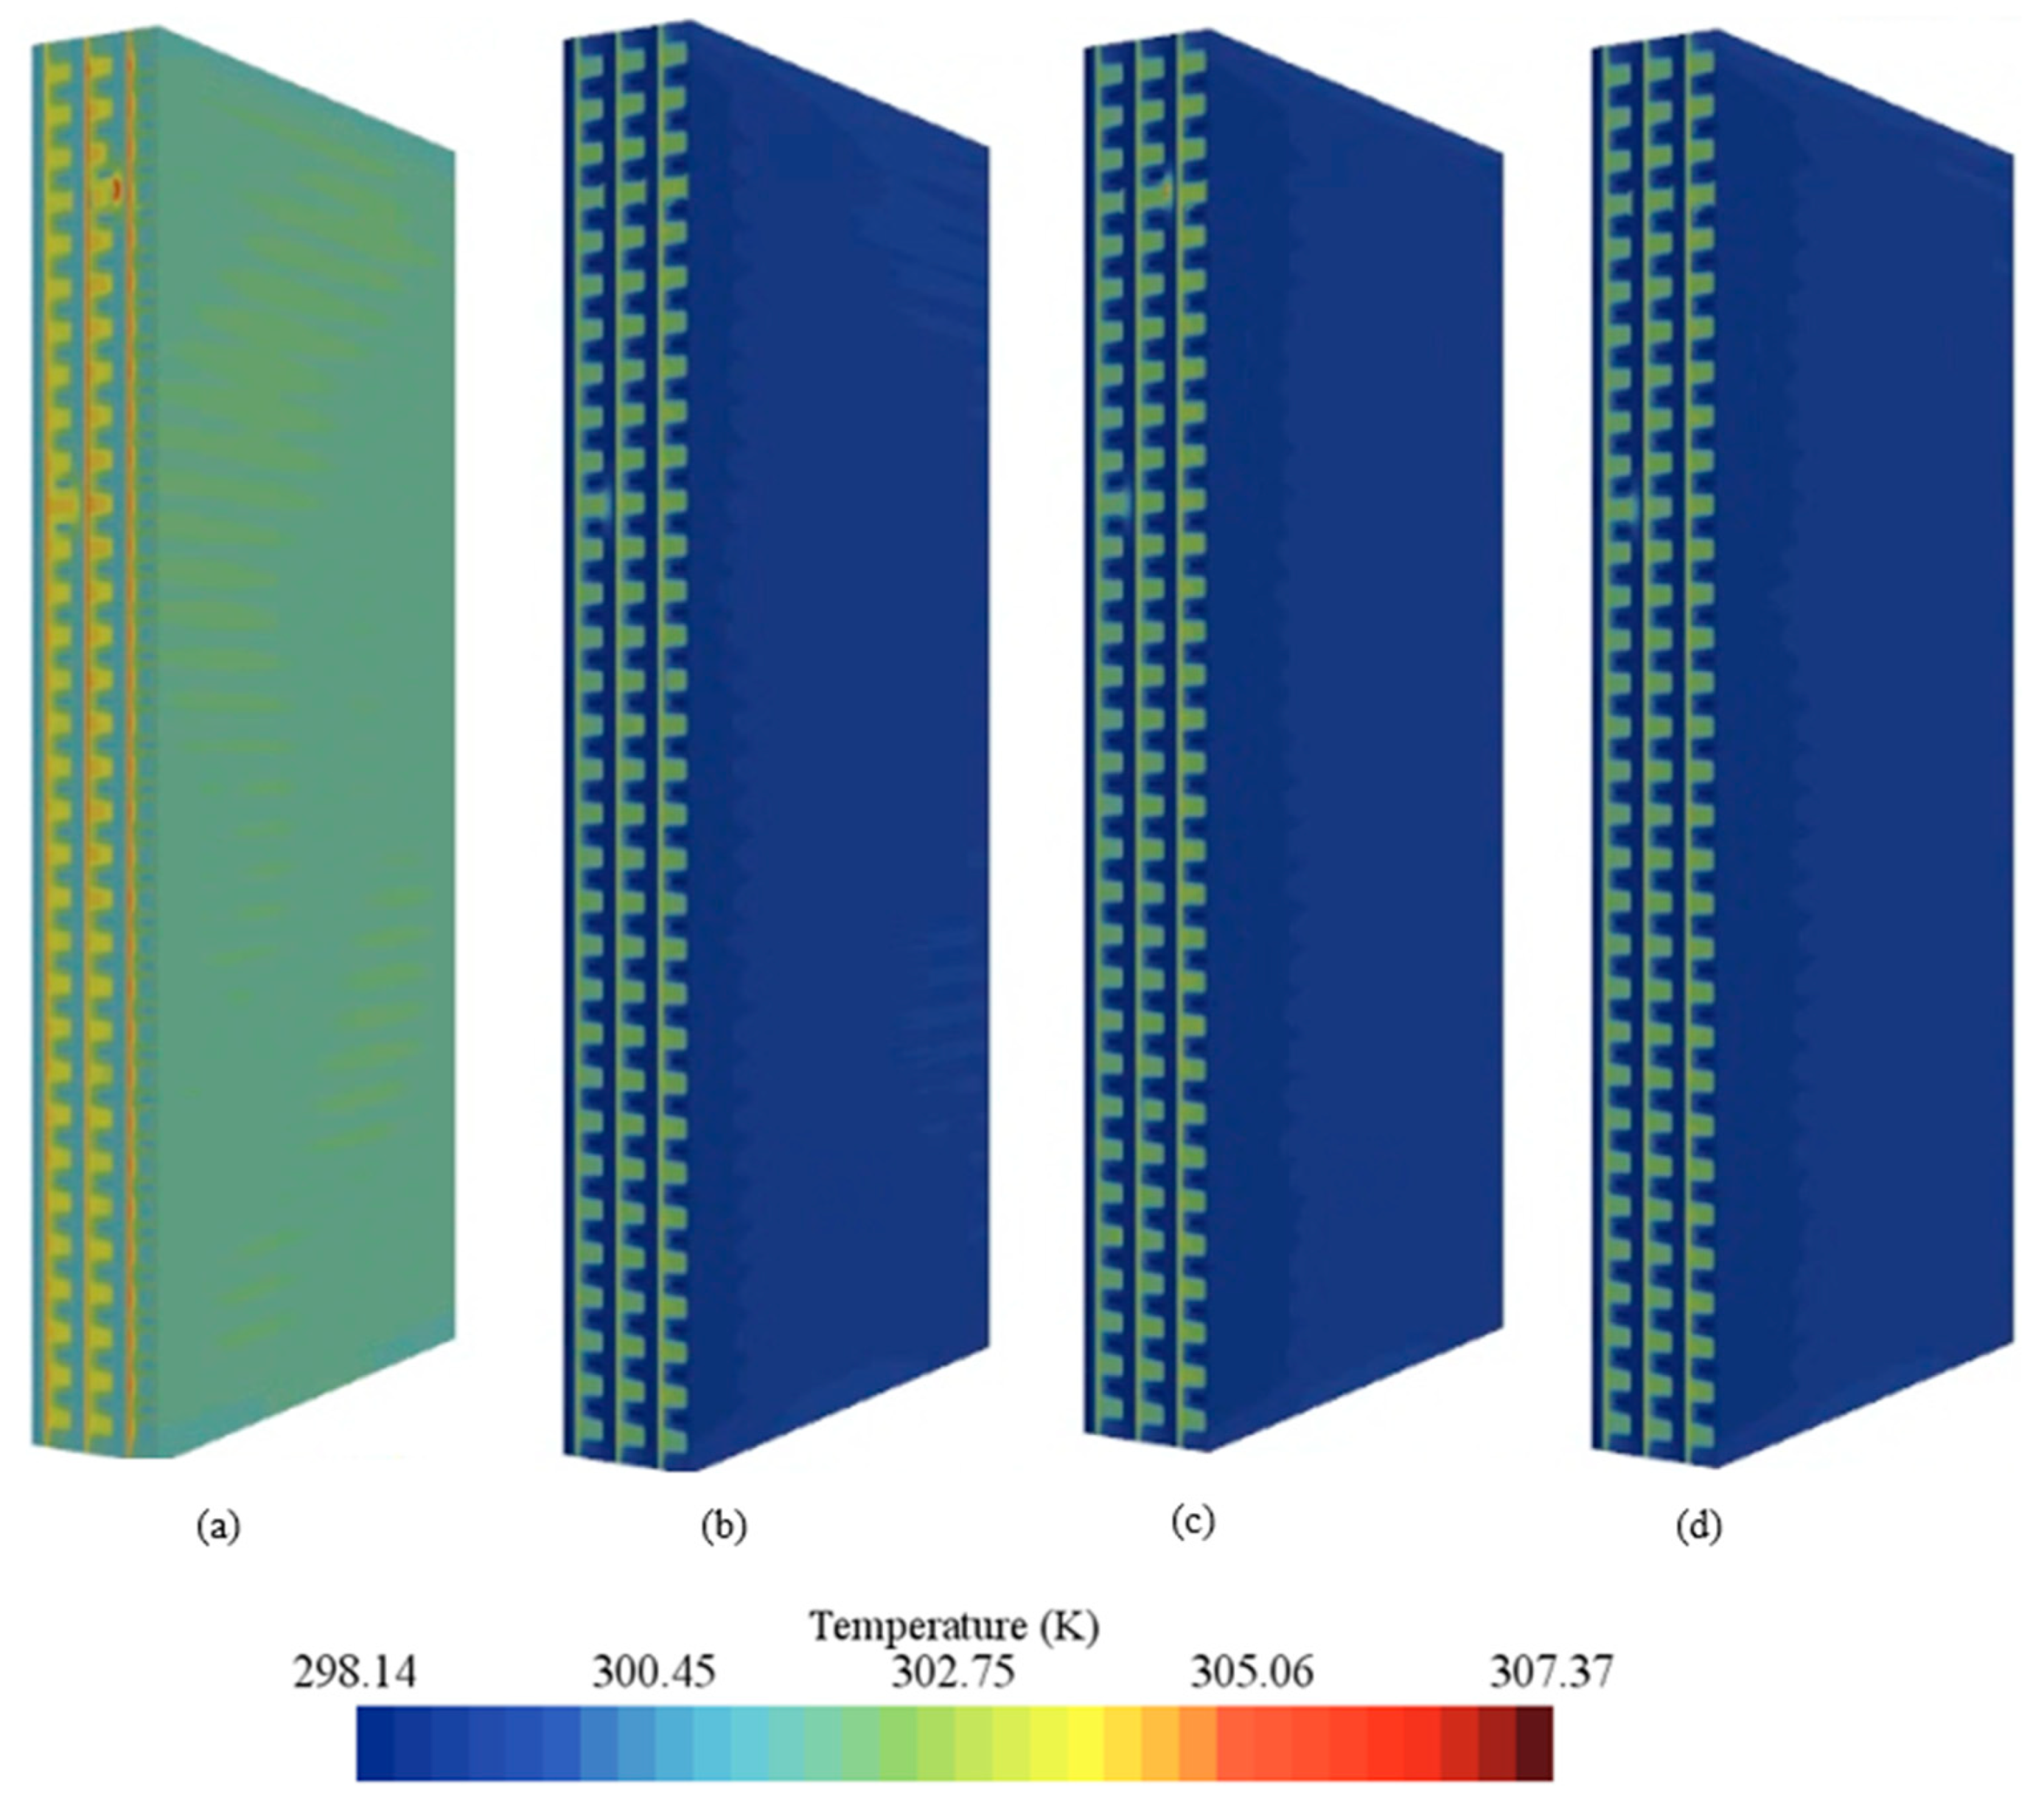
Figure 10 shows the temperature distribution in a PEMFC stack operating at low voltage (0.54 V) and high current density under four different thermal management conditions: (a) without coolant, (b) with deionized water, (c) with CuO nanofluid, and (d) with Al2O3 nanofluid. In the absence of a coolant, the stack exhibits a pronounced temperature rise, particularly near the cathode outlet region, due to intensified electrochemical reactions and ohmic heating at high current density. The introduction of coolants into the channels markedly reduces the overall temperature, with the cooling effectiveness following the order of water < CuO < Al2O3. This trend is attributed to the higher thermal conductivity of nanofluids, while Al2O3 nanofluid provides superior heat removal despite its lower specific heat compared to water. However, it is noteworthy that the water-cooled configuration results in a more uniform temperature distribution across the stack, minimizing local hot spots and thermal gradients. When combined with the earlier observations of heat generation concentration in the catalyst layers and temperature rise at low voltage, these results highlight the critical role of coolant selection in mitigating thermal stresses.
Figure 11 compares the electrical current density of the PEMFC at low voltage (0.54 V) under different cooling conditions. Without coolant, the current density remains the lowest at 2426 A m−2 due to excessive heat buildup and non-uniform temperature distribution, which impair membrane hydration and reaction kinetics.
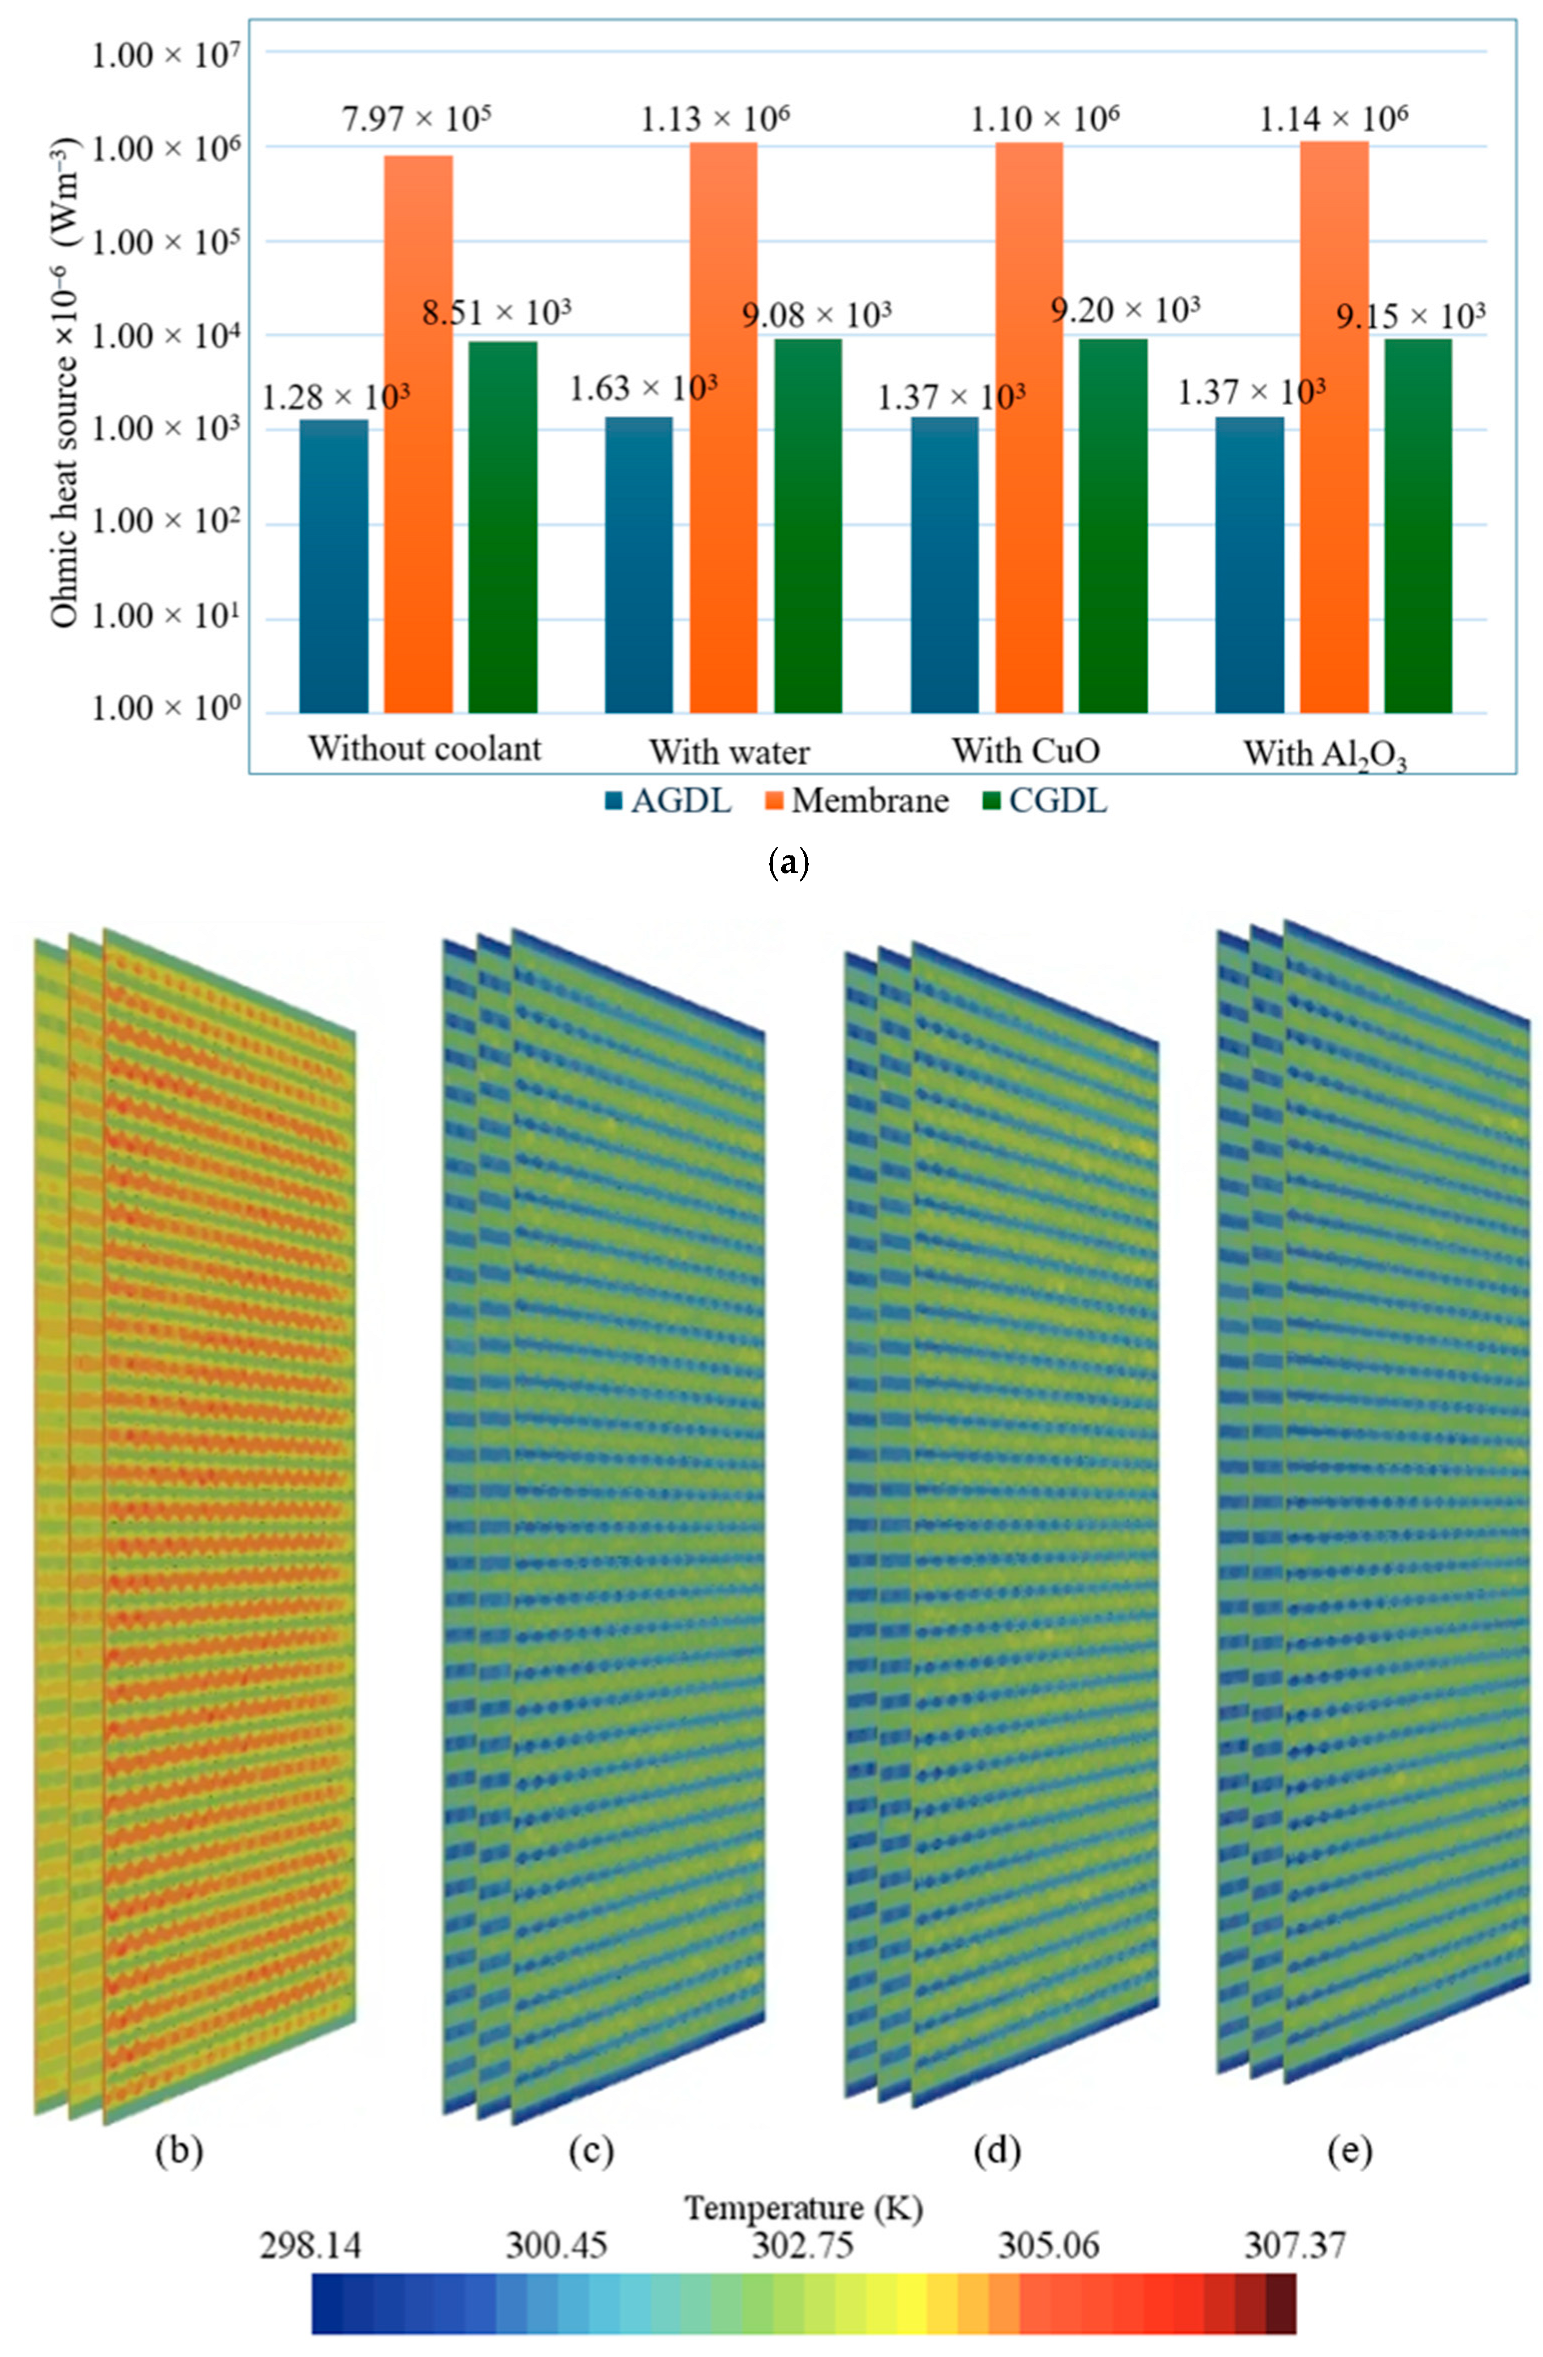
The introduction of coolants significantly enhances performance, with current density increasing to 2613 A m−2, 2678 A m−2, and 2702 A m−2 for water, CuO nanofluid, and Al2O3 nanofluid, respectively. These improvements correspond to gains of 7.77%, 10.38%, and 11.37% compared to the no-coolant case. The superior performance with nanofluids, particularly Al2O3, is supposed to be attributed to their higher thermal conductivity, which improves heat removal and sustains favorable operating conditions. To understand the reason behind the efficient cooling of Al2O3, ohmic heat sources of conductive materials are compared for each component in Figure 12. Figure 12 presents a comparison of ohmic heat sources in different components of the PEMFC, along with the corresponding temperature distribution at the cathode gas diffusion layer (CGDL) side under various coolant conditions at low voltage (0.54 V) and high current density. The membrane is identified as the dominant contributor to ohmic heat generation, reaching values in the order of 1012 W m−3, while the anode and cathode GDLs contribute significantly less, with heat sources remaining in the 103 W/cm3 range. In the absence of coolant, this concentrated ohmic heating leads to elevated and non-uniform temperature fields across the stack, particularly toward the cathode outlet, as shown in Figure 12a. The introduction of coolants effectively reduces the overall temperature, with water, CuO nanofluid, and Al2O3 nanofluid each lowering heat accumulation to varying extents. Among these, Al2O3 nanofluid demonstrates the strongest cooling performance due to its higher thermal conductivity, which enhances heat removal and mitigates hot spots. Nevertheless, the temperature contours in Figure 12b–e indicate that while nanofluids improve peak heat dissipation, water cooling provides a more uniform temperature distribution across the cell.
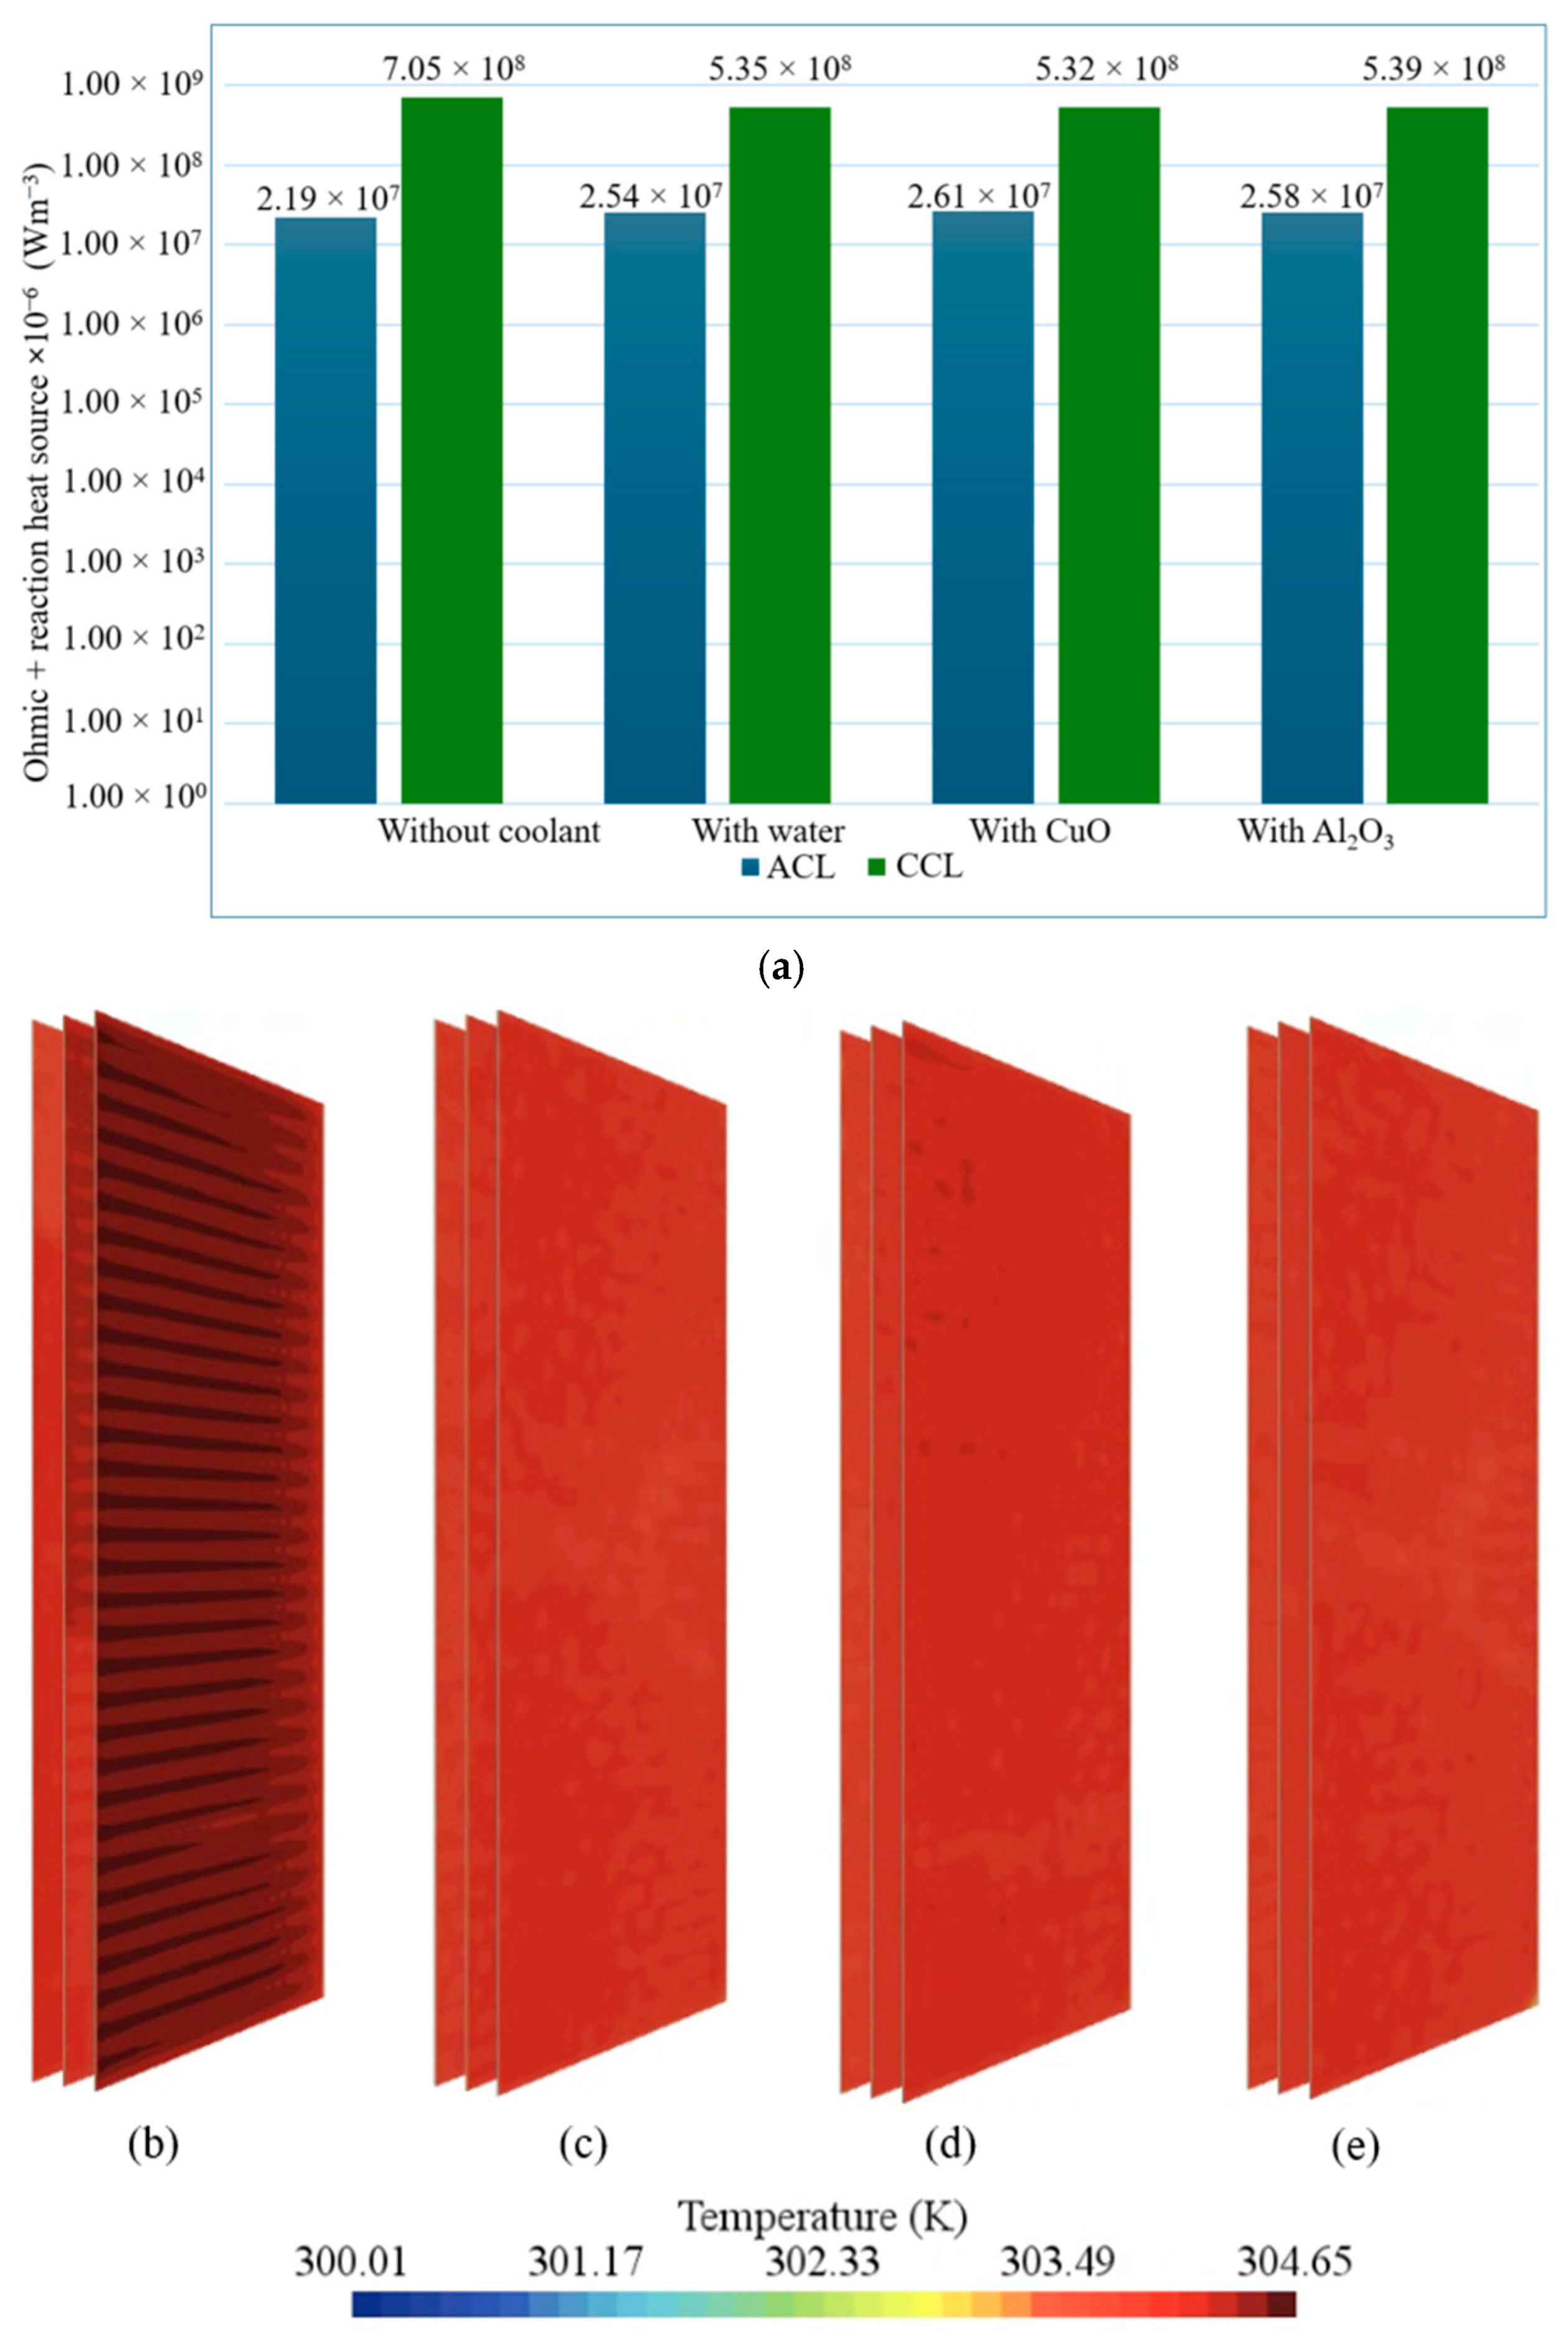
It is worth noting that a combination of ohmic and heat sources is measured for cathode CL as the combined heat source is considered for that component. In addition to that, the heat source from the anode side was ignored as most of the heat is generated on the cathode side, mostly by electrochemical reaction [59].
Again, Figure 13 compares the combined ohmic and reaction heat sources in the PEMFC under different cooling conditions and illustrates the corresponding temperature distribution on the cathode catalyst layer (CCL) side at low voltage (0.54 V) and high current density. The results show (Figure 12a) that the combined heat source is highest for the Al2O3-cooled case, followed by CuO and water, while the stack without coolant exhibits the lowest volumetric heat source. This trend arises because the higher thermal conductivity of Al2O3 nanofluid facilitates more effective heat removal, which sustains elevated electrochemical activity on the cathode side. Enhanced oxygen reduction reaction (ORR) rates at the CCL generate more water and heat, thereby increasing both reaction heating in the catalyst layers and ohmic heating in the membrane. Despite producing the largest heat source, the Al2O3-cooled system achieves lower overall stack temperatures than the other cases, as evident in the temperature fields of Figure 13b–e. This indicates that efficient cooling not only prevents thermal buildup but also promotes higher current density by enabling more vigorous electrochemical reactions. In contrast, the stack without coolant accumulates excessive heat despite showing the lowest intrinsic heat generation, since no medium is present to dissipate the localized heating. Collectively, these results emphasize that coolant selection directly couples thermal regulation with reaction kinetics, and that Al2O3 nanofluid offers superior performance by simultaneously enhancing heat removal and supporting higher reaction activity in PEMFCs.
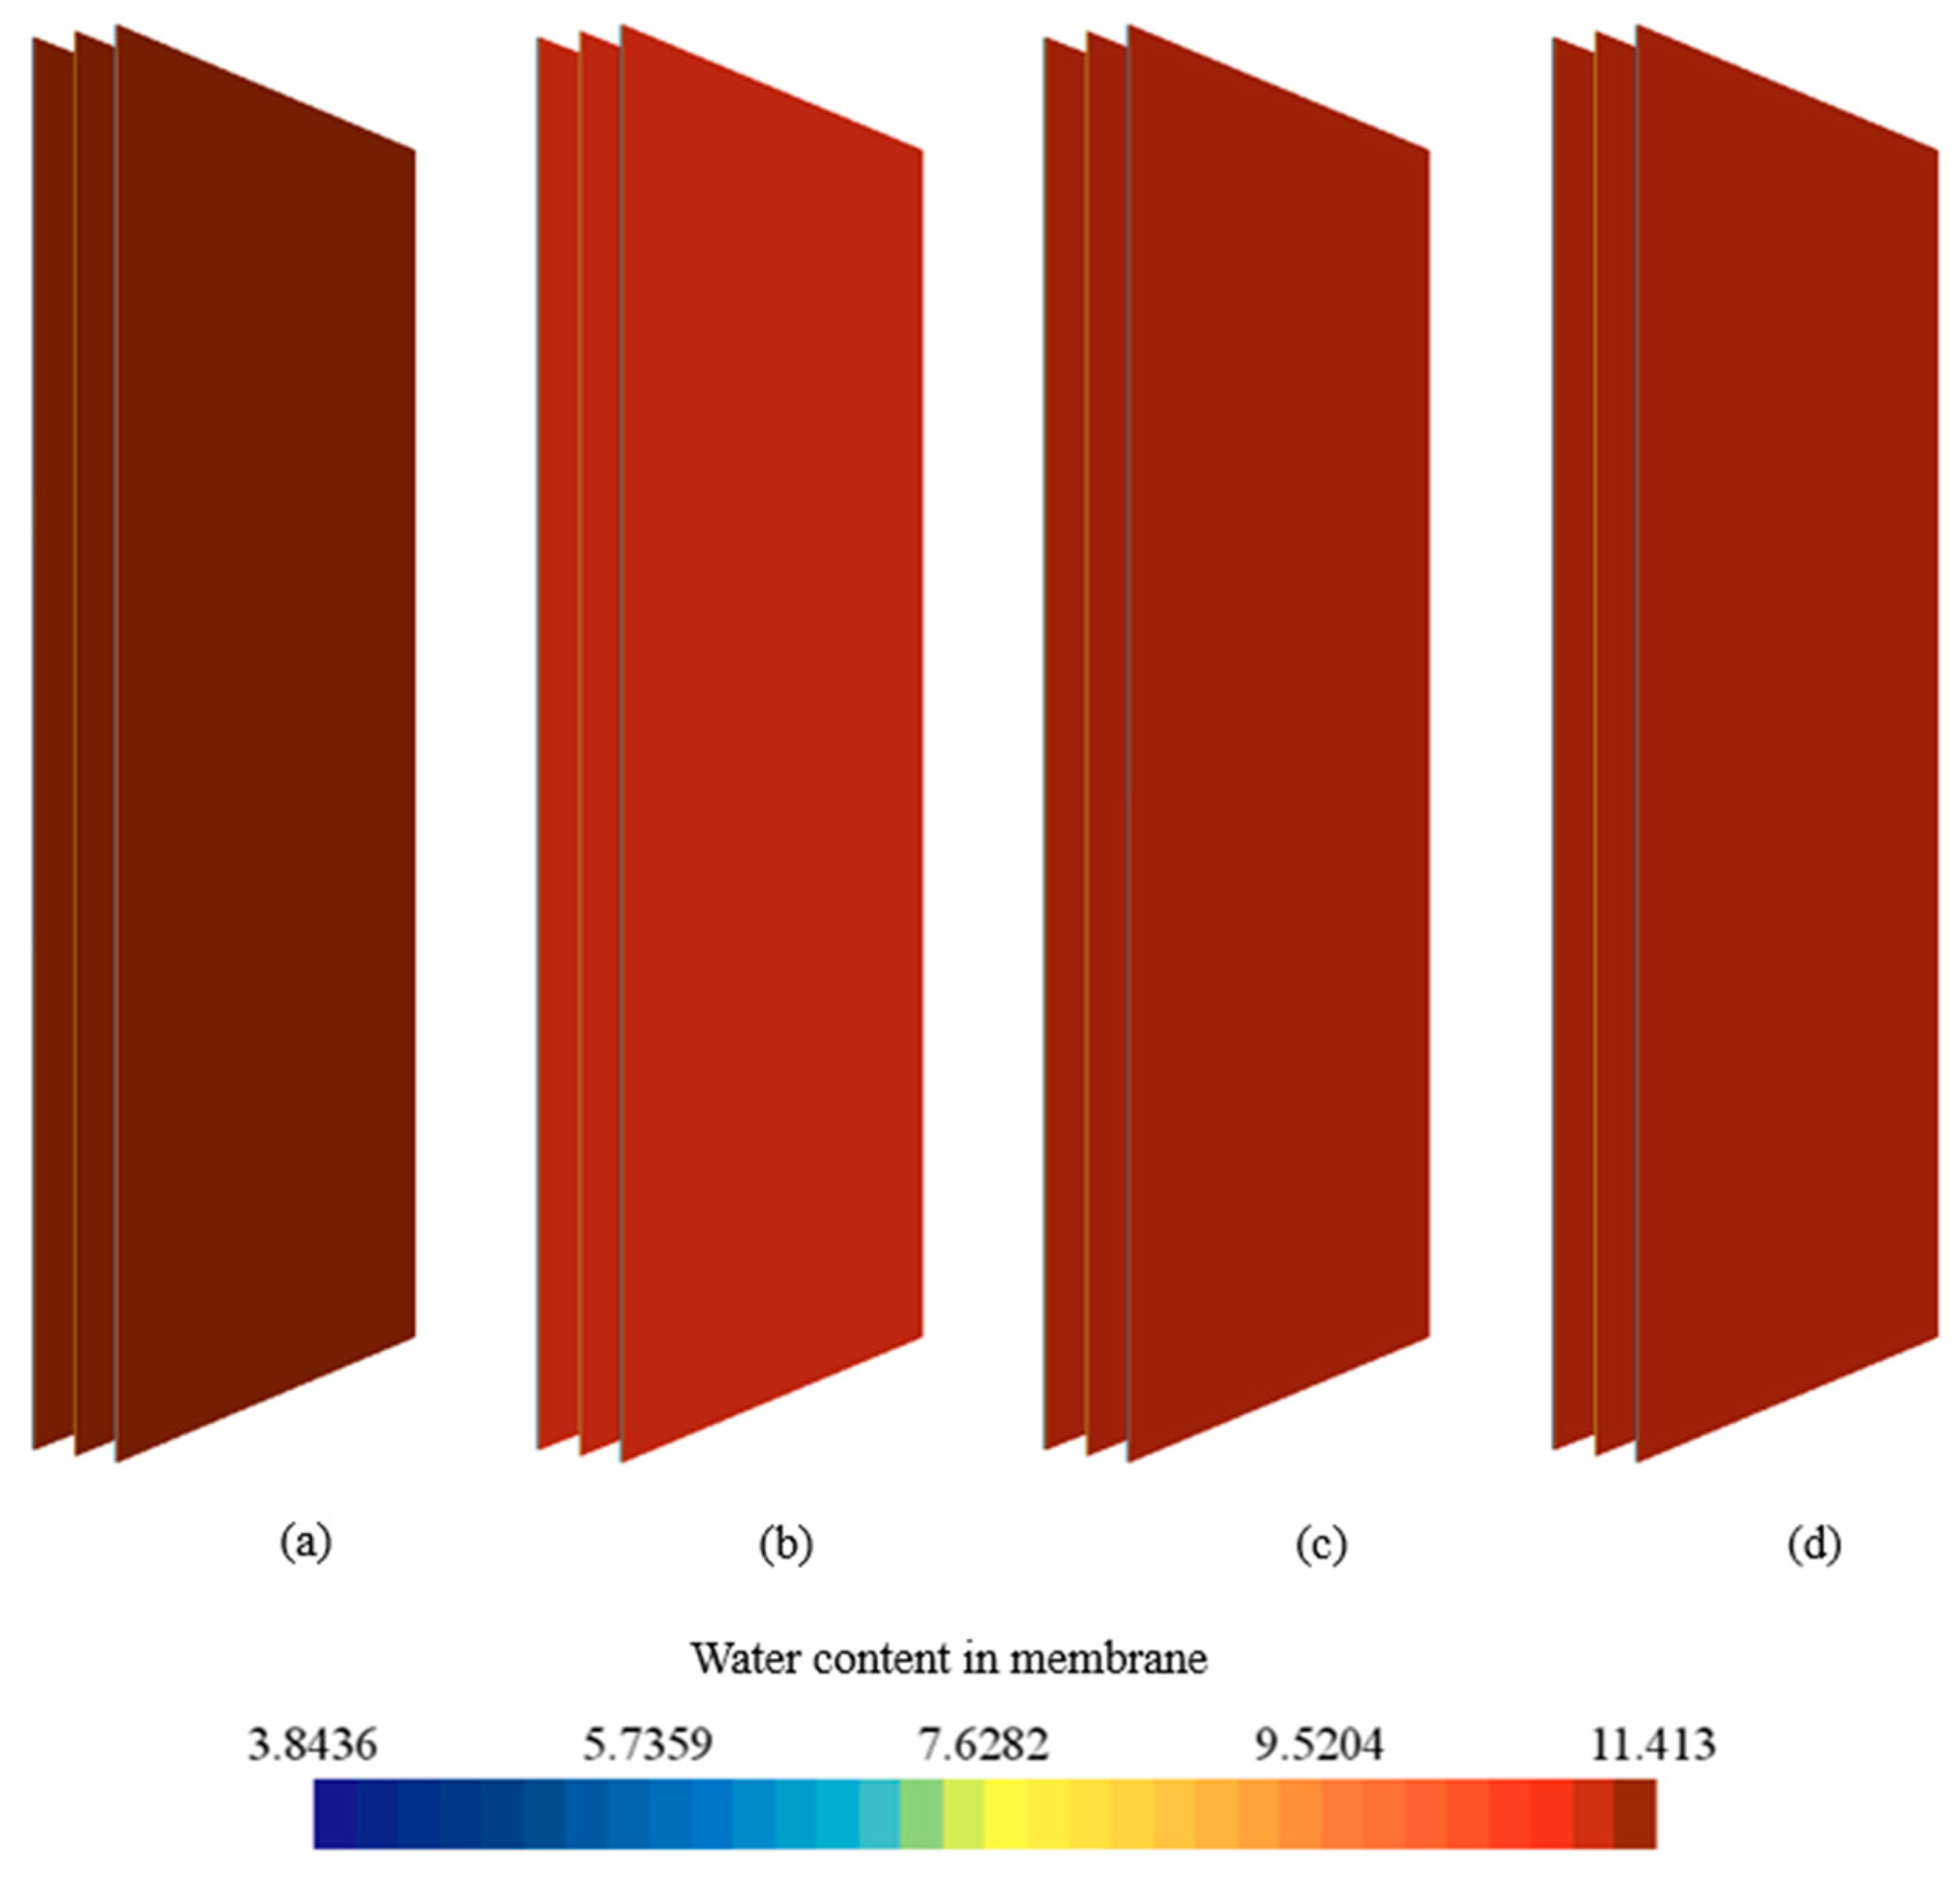
To understand the reason for the high ohmic heat in the membrane region, the water content is investigated. Figure 14 shows the distribution of water content in the membrane for each case. High water content indicates more ORR activity on the cathode side. As a result, the ohmic resistance decreases because higher water content leads to increased membrane conductivity and less ohmic heat [61]. Based on Figure 9, the water content should be higher in the PEMFC with Al2O3. In contrast, the water content is higher in the PEMFC without coolant and lower in the PEMFC with water. Figure 15 shows the electrochemical reaction rate (ORR) at the membrane-cathode interface. From the figure, it is clearly seen that the PEMFC with Al2O3 has a higher reaction rate compared to other cases. Another striking fact is the high reaction regime at the top side, which gradually decreases toward the bottom part. This is very common for serpentine flow channels, where more reactions occur in the inlet region where the pressure is higher [62]. Therefore, more H2 is consumed at the top of the anode channel (serpentine channel) as can be seen in Figure 6a. This explains the lower water content at the membrane and the high electrochemical reaction heating at the CCL for the PEMFC with Al2O3 and CuO, despite their high current density performance. On the other hand, a high reaction rate produces more water, which reduces the ohmic resistance of the membrane. On the other hand, the heat generated by this reaction increases the local temperature, leading to membrane dry-out [60,63]. In an attempt to interpret the electrochemical rate more clearly, Figure 15e presents the variation in the electrochemical reaction rate along the vertical distance along the membrane-cathode interface for four cooling conditions: without coolant, with water, with CuO nanofluid, and with Al2O3 nanofluid. The reaction rate exhibits a minimum near the mid-section of the channel and increases toward the outlet region due to the progressive rise in local temperature and reactant consumption. Among the cases studied, the configuration without coolant shows the highest and most non-uniform reaction profile, indicating local overheating and uneven electrochemical activity. In contrast, the use of nanofluids, particularly CuO and Al2O3, results in a lower and more uniform reaction rate distribution, demonstrating their effectiveness in maintaining thermal uniformity and mitigating hot-spot formation within the PEMFC stack.
The higher heat generation observed with nanofluids in Figure 13 should not be interpreted solely as improved cooling performance but as a reflection of enhanced electrochemical activity due to improved mass transport and reactant availability. Nanofluids facilitate more uniform reactant distribution and reduce local oxygen starvation, leading to higher current densities and corresponding reaction heat. However, their superior thermal conductivity and convective properties enable this additional heat to be efficiently dissipated, resulting in a lower peak temperature and improved thermal uniformity across the catalyst layer. It is also important to recognize that uncontrolled or excessive heat generation could indicate increased entropy production and inefficiency. Hence, the observed thermal behavior represents a balance between electrochemical enhancement and effective heat management, confirming that the improved performance of nanofluid coolants arises from both enhanced reaction kinetics and superior thermal transport characteristics, rather than from mere heat generation itself.
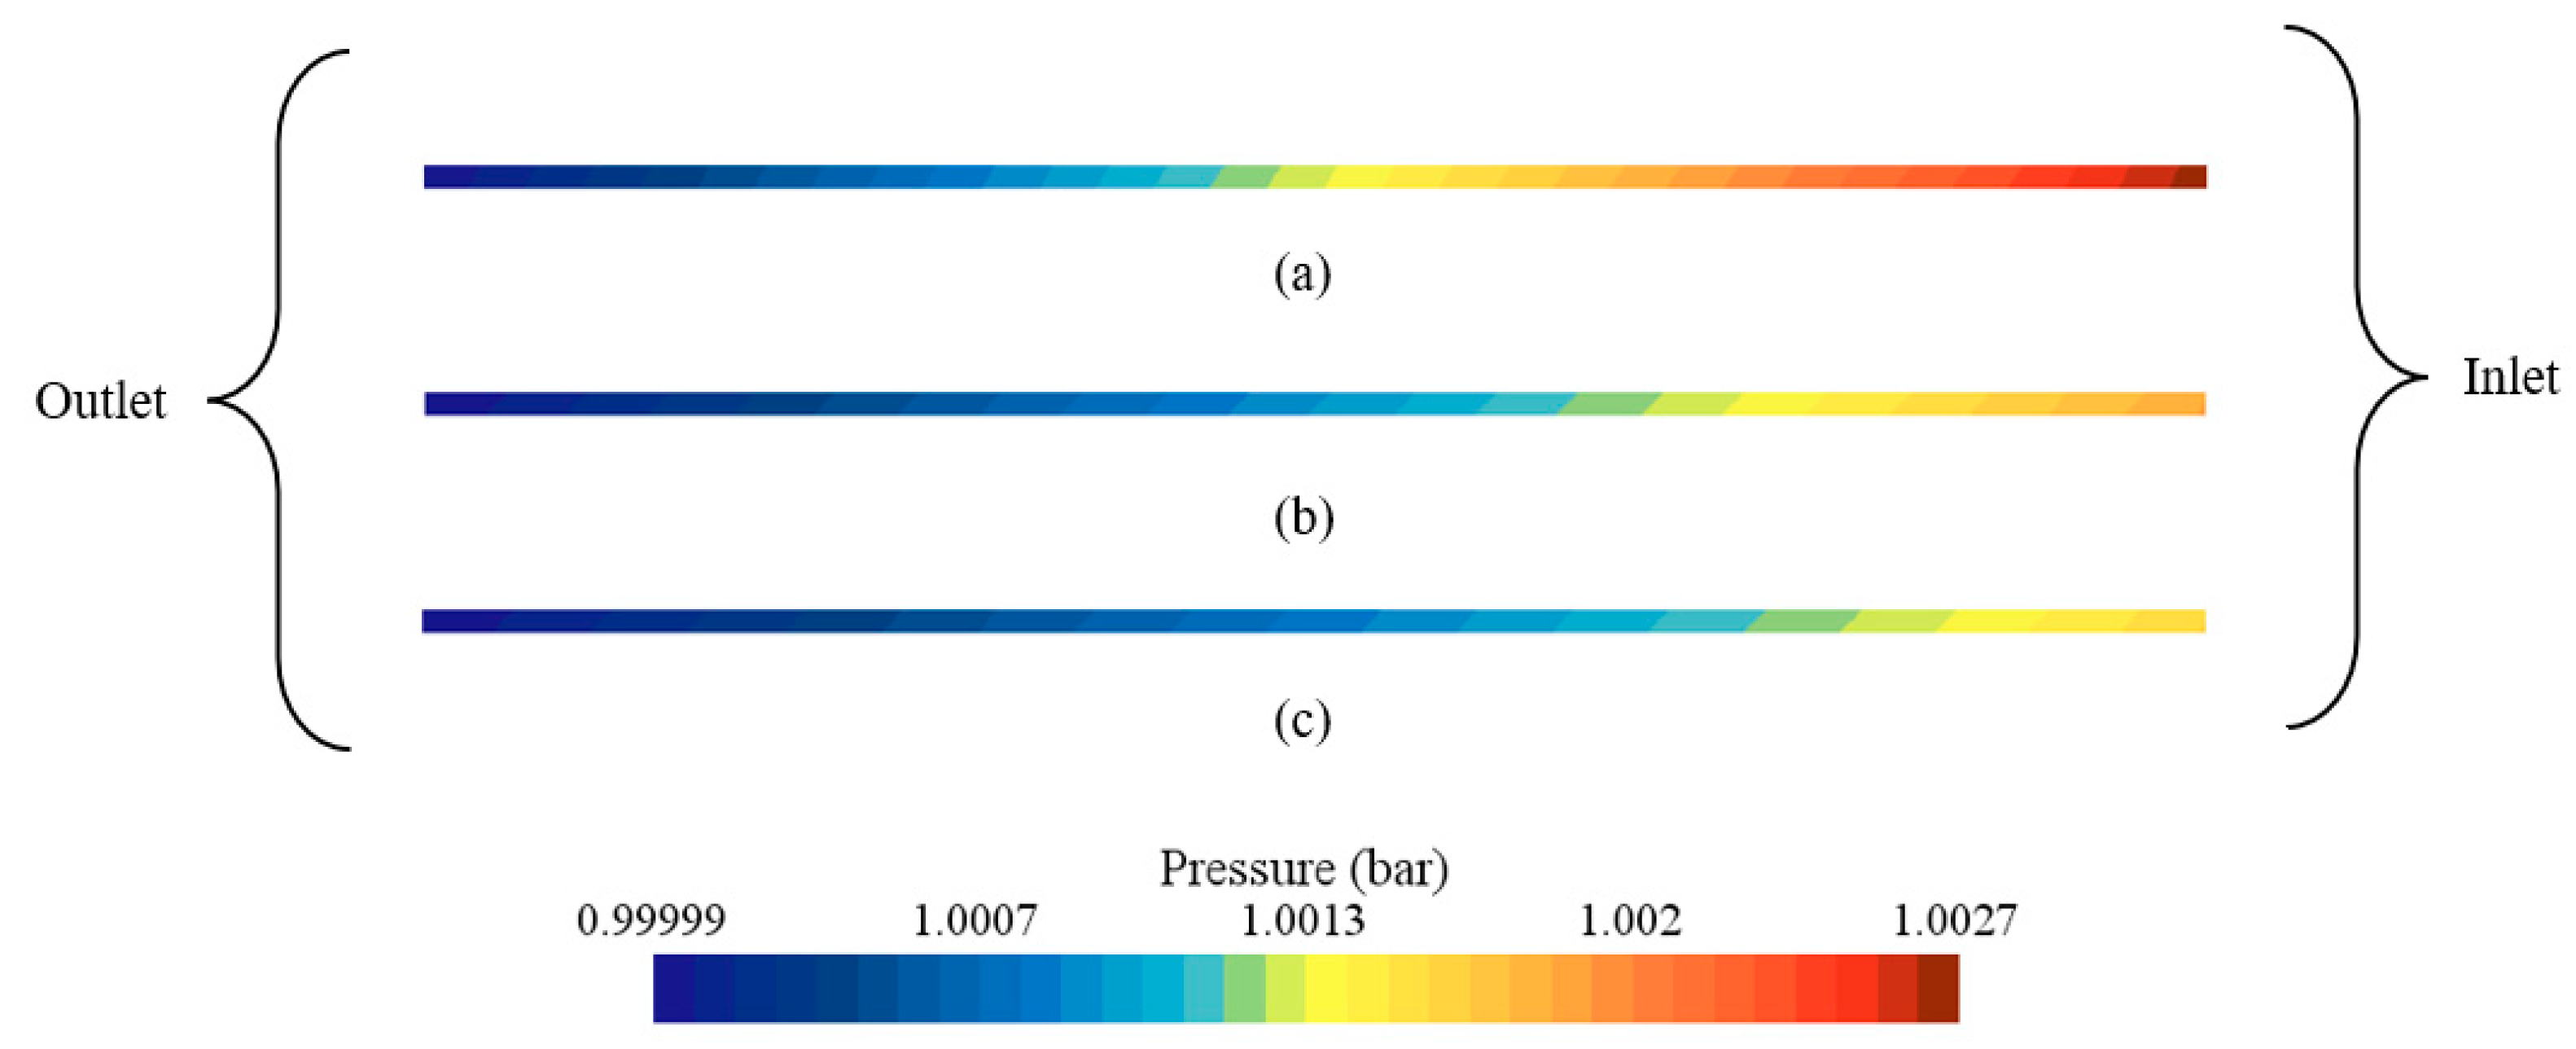
Figure 16 illustrates the pressure distribution of a single coolant channel containing three coolants. Although there is an obvious difference between the density and dynamic viscosity of the three coolants (see Table 5), the effect of viscosity is more pronounced. The pressure drop for Al2O3 is low because the dynamic viscosity is much lower than those of the other two coolants. Therefore, Al2O3 is able to remove heat quickly and efficiently due to its low pressure drop and high thermal conductivity. In addition, Al2O3 requires minimal coolant circulation, which will enhance overall stack efficiency in real-world applications [63].
Table 8 shows the performance of the coolants with respect to PEMFC without coolants. The results demonstrate that the average and maximum temperatures decrease noticeably when nanofluids are employed, with Al2O3 nanofluid showing the lowest peak temperature (303.81 K) and the smallest surface temperature deviation (1.19 × 10⁻¹ K), indicating more effective heat removal and superior temperature uniformity. Additionally, the pressure drop remains within a reasonable range, with Al2O3 exhibiting the lowest value due to its lower viscosity and higher thermal conductivity compared to water and CuO nanofluid. These numerical results corroborate the visual temperature and reaction-rate distributions discussed in Figure 10, Figure 11, Figure 12, Figure 13, Figure 14 and Figure 15, confirming that Al2O3 nanofluid offers the best balance of cooling efficiency and flow performance, while water provides the most uniform temperature field. Overall, this quantitative analysis strengthens the manuscript by providing measurable evidence to support the thermal and hydrodynamic behavior of different coolants in the PEMFC stack.

3.4. Performance Price Factor for Nanofluids and Economic Challenges

To evaluate the economic index of nanofluid, Alirezaie et al. [64] proposed the following performance and cost relationship:
P P F = T C R p r i c e s $ l i t × 1000
Here, the thermal conductivity ratio, T C R = K N F / K B F , where K N F and K B F area the thermal conductivity of nanofluid and base fluid, respectively. The price of 100 gm of Al2O3 and CuO particles are 70 and 75 $, respectively [65].
The volume concentration is calculated by following:
ϕ = ω n p ρ n p ω n p ρ n p + ω b f ρ b f
Here, ρ n p is the density of nano particle, ρ b f is the density of base fluid, ω b f is the weight of base fluid, and ω n p = weight of nano particle.
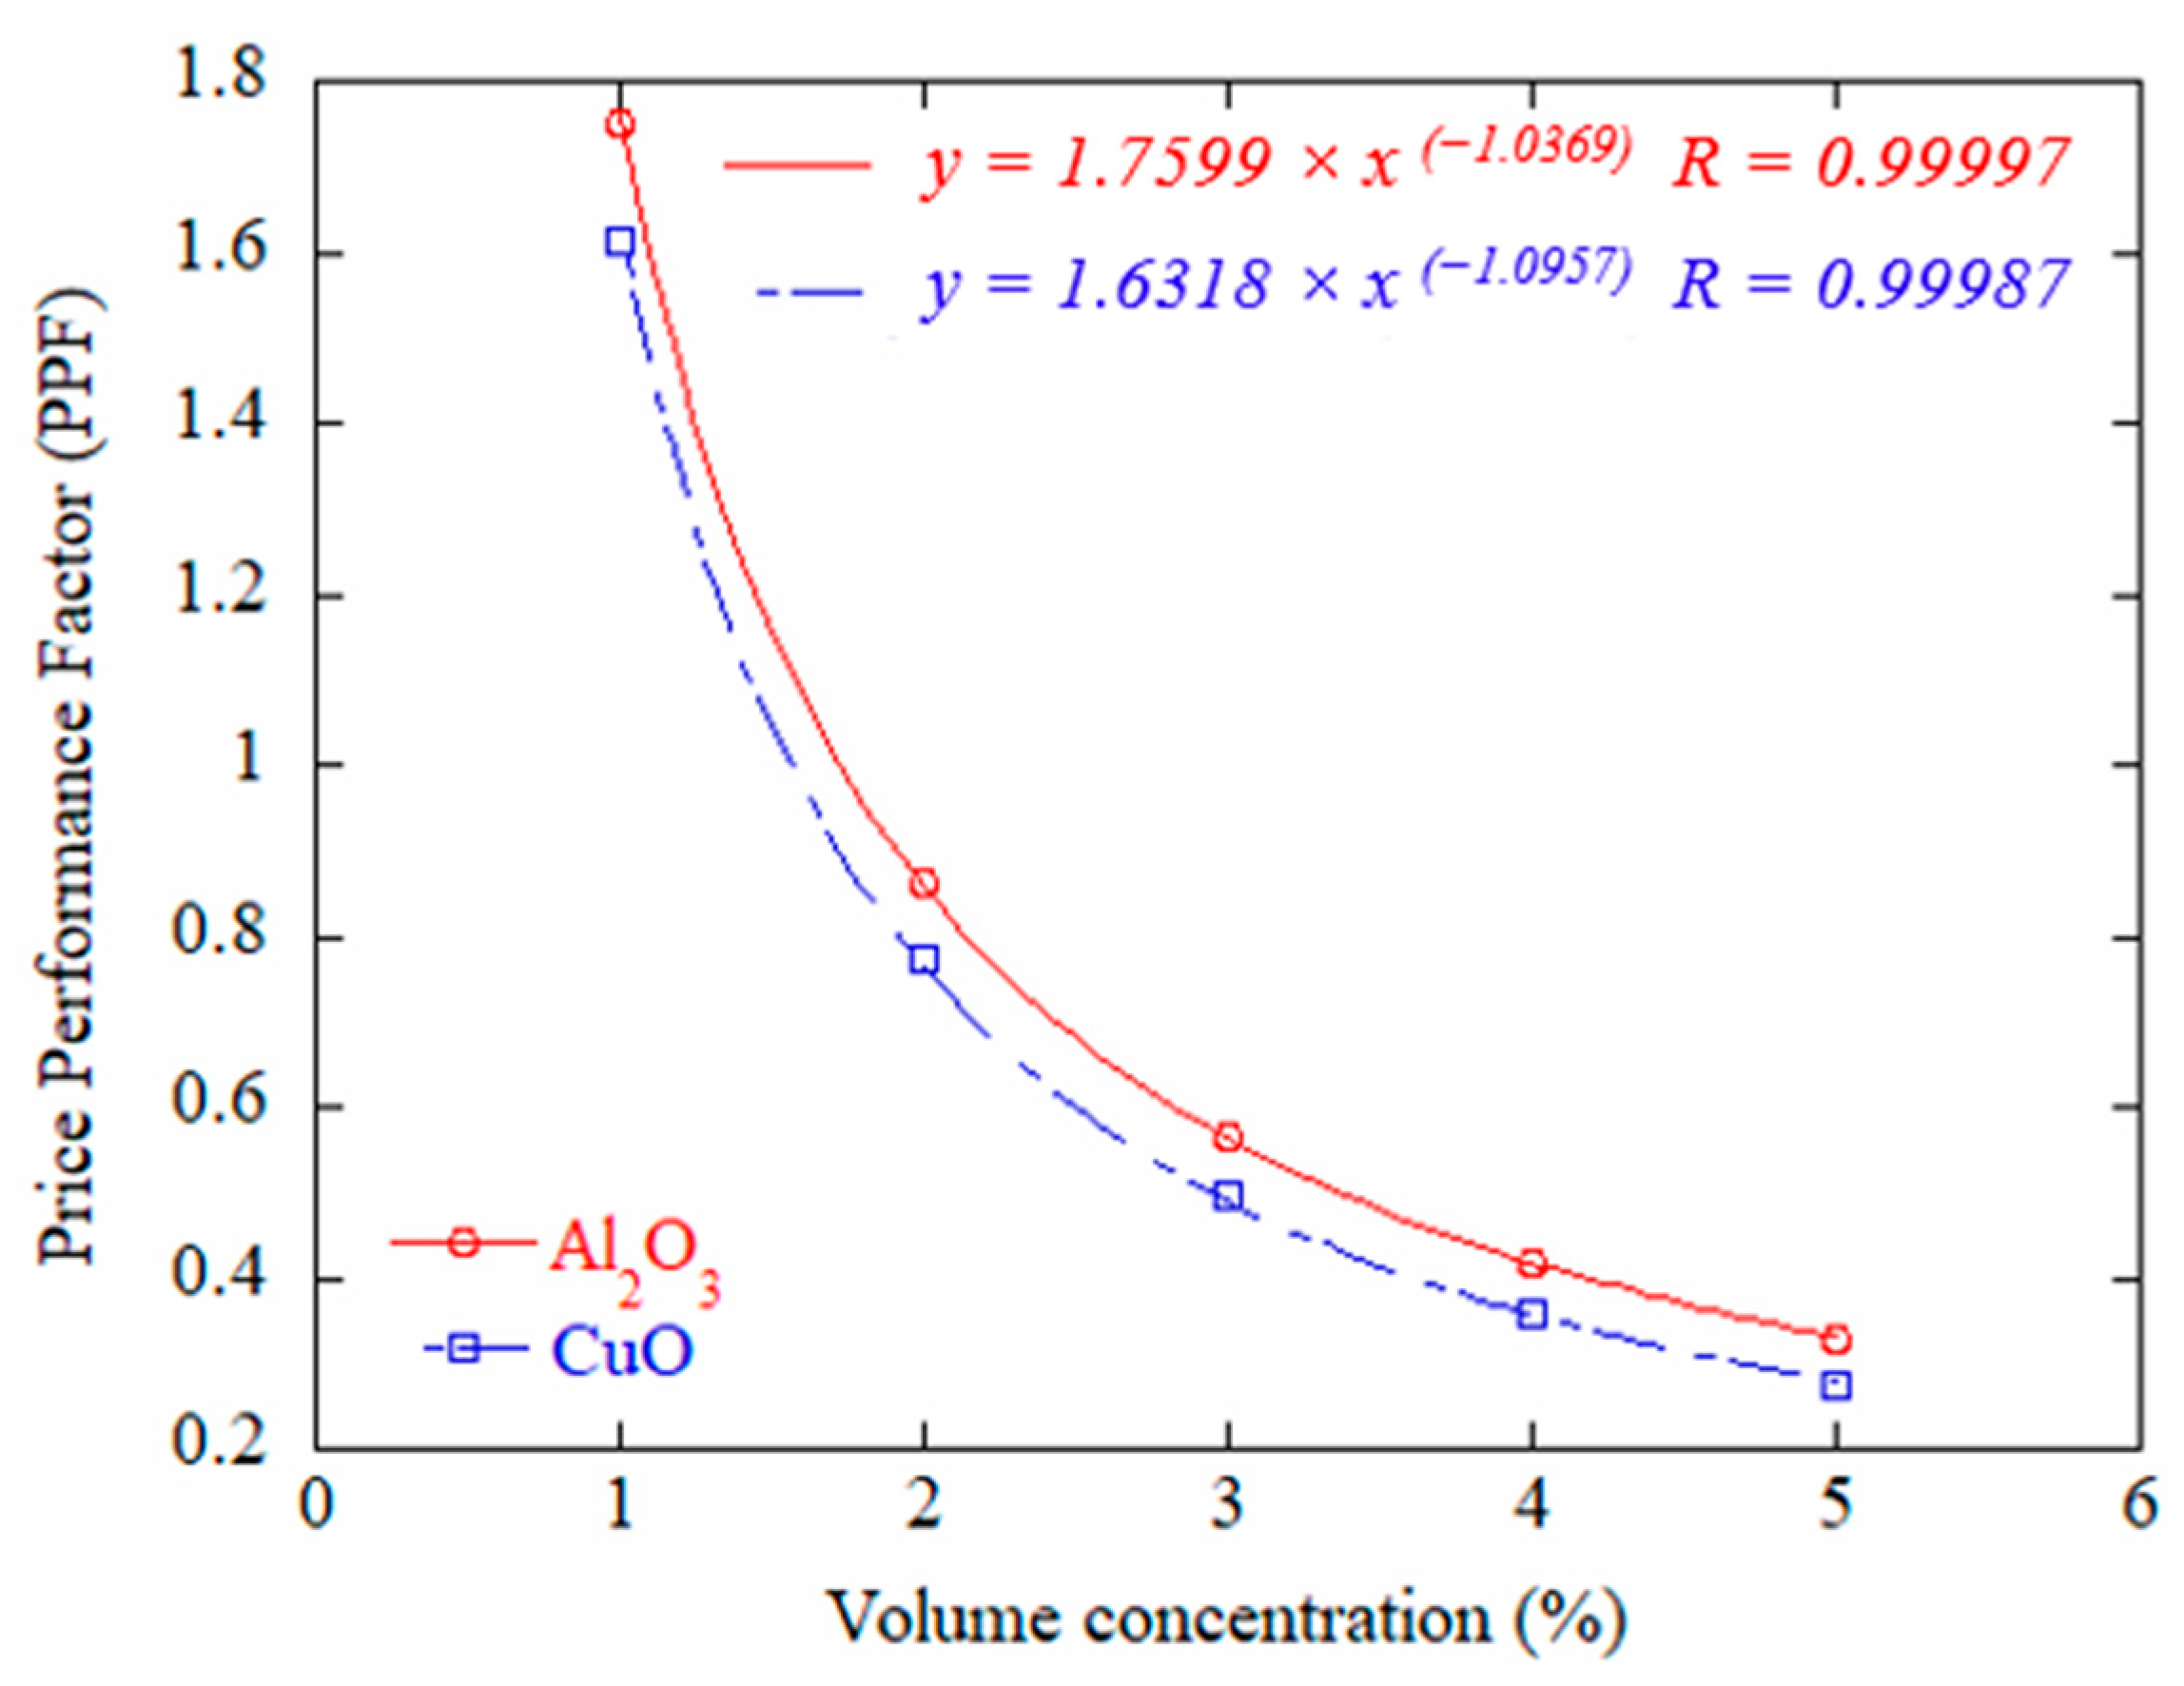
Figure 17 demonstrates that Al2O3 is more cost-effective than CuO at a similar volume concentration. In addition, nanofluids with higher thermal conductivity have a lower PPF. In this respect, deionized water would be a better choice. However, when considering the cost of the large heat exchanger and additional deionizing unit for deionized water, nanofluids may be a more feasible option.
It should be noted that the current PPF analysis provides a relative comparison of nanofluid performance based on thermal conductivity enhancement versus material cost; however, it does not capture the total life-cycle economics. For a more realistic evaluation, future studies should incorporate a sensitivity analysis that accounts for nanoparticle synthesis scale, fluid stability duration, and maintenance frequency. Furthermore, normalizing cost metrics such as USD per kW thermal load or per operational hour will enhance the applicability of the PPF model to industrial PEMFC systems. Such expanded economic modeling would offer valuable insight into the trade-offs between thermal performance gains and long-term operational costs, supporting the transition of nanofluid cooling from laboratory-scale validation to commercial deployment.

4. Conclusions and Future Works

A 3D, non-isothermal multiphase–multiphysics simulation was performed to assess the coolant effects in a three-cell PEMFC stack after validation of the case without coolant against a published polarization curve. The simulation results show are as follows:
  • At high voltage of 0.73 V, the hydrogen and oxygen fields were predicted to remain nearly uniform, whereas at 0.54 V, strong outlet-side gradients and local starvation were observed, indicating mass-transport limitation.
  • Temperature fields were uniform at 0.73 V and exhibited hot regions at 0.54 V, especially near cathode outlets without active cooling.
  • Component-wise analysis showed that heat generation was concentrated in the catalyst layers, particularly the cathode catalyst layer, while gas-diffusion layers contributed marginally; the membrane produced moderate ohmic heating and acted as a thermal bottleneck.
  • Introducing coolant channels increased the area-averaged current density from 2426 A m−2 without coolant to 2613, 2678, and 2702 A m−2 with water, CuO, and Al2O3, corresponding to gains of 7.77%, 10.38%, and 11.37%.
  • Among the examined coolants, Al2O3 provided the lowest peak temperature and a favorable pressure drop owing to its higher thermal conductivity and lower viscosity, whereas water yielded the most uniform temperature field.
  • Enhanced cooling with nanofluids supported higher oxygen reduction activity at the cathode catalyst layer and thus increased reaction heat while sustaining higher current density, whereas water maintained more stable hydration and uniformity, highlighting a performance–durability trade-off.
  • A price to performance analysis indicated that Al2O3 at one percent volume fraction achieved a more favorable balance than CuO under the assumed prices, while deionized water remained attractive when long-term stability and cost are prioritized.
Despite these promising findings, several limitations should be acknowledged. The present study is based on a steady-state model with constant thermophysical properties and therefore does not capture transient effects such as coolant flow fluctuations, nanoparticle agglomeration, or heat load variations during dynamic operations. The electrical conductivity of the nanofluid was neglected, assuming negligible influence on charge transport; however, this assumption requires further verification through dielectric and stability testing. The validation of this model is limited to comparison with polarization curves from the literature, without direct experimental validation of spatial distributions such as temperature, flow field, or membrane hydration. In addition, the scalability of nanofluid cooling for multi-cell stacks may introduce additional challenges in maintaining uniform flow and minimizing parasitic losses.
Future research will focus on addressing these limitations. A single-cell PEMFC test setup incorporating nanofluid cooling will be developed to experimentally validate the predicted temperature and current-density profiles. This will be followed by transient modeling to investigate time-dependent effects and optimize flow-field design for scale-up applications. Through these combined efforts, the present modeling framework will evolve into a validated and experimentally supported tool for designing thermally efficient and stable PEM fuel cell systems.

Author Contributions

Conceptualization, R.K. and J.-C.P.; methodology, R.K.; formal analysis, R.K.; investigation, R.K.; data curation, R.K.; writing—original draft preparation, R.K.; writing—review and editing, J.-C.P. and S.-M.J.; supervision, J.-C.P.; project administration, J.-C.P.; funding acquisition, J.-C.P. All authors have read and agreed to the published version of the manuscript.

Funding

This research was supported by the Industrial Strategic Technology Development Program—Development of high-accuracy prediction method of phase change, BOR, and pressure change in the cargo hold of LNG/LH2 ships in consideration of the operating environment (20026368) funded by the Ministry of Trade, Industry & Energy (MOTIE, Republic of Korea).

Data Availability Statement

Data will be made available upon request.

Conflicts of Interest

The authors declare no conflicts of interest.

Abbreviations

ACLanode catalyst layer
AGDLanode gas diffusion layer
BPLbi-polar plate
CCcoolant channel
CFDcomputational fluid dynamics
CLcatalyst layer
CBPLcathode bi-polar plate
CCLcathode catalyst layer
CGDLcathode gas diffusion layer
FCLflow channel
GDLgas diffusion layer
MEAmembrane electrode assembly
ORRoxygen reduction reaction
PEMFCproton exchange/polymer electrolyte membrane fuel cell
PPFperformance price factor
RHrelative humidity
Symbols
awater activity (m−1)
cmolar concentration, kmol m−3
Dmass diffusivity (m2 s−1)
Ecell potential, V
FFaraday’s constant
mmass
Mmolecular weight, g/mol
n d electroosmotic drag coefficient
ppartial pressure, atm
Rideal gas constant, 8.3143 Jmol−1K−1
Ssource term
sliquid volume fraction
Ttemperature, K
u m velocity vector, cm s−1
Greek letters
α transfer coefficient, water transport coefficient kmol2 (J·m·s)−1
ϵ porosity
η overpotential, V
θ contact angle
κ ionic conductivity of the membrane, S/cm
λ water content
μ dynamic viscosity, kg m−1s−1
μwmembrane water chemical potential
v velocity, m s−1
ρ density, kg m−3
σ standard conductivity in the electronically conducting phase, S/cm
τ G tortuosity
κ thermal conductivity, Wm−1 K−1
ϕ source term of charge
Subscripts and superscripts
act activation
an anode
ca cathode
e electrolyte
eq equilibrium
G gas phase
H2hydrogen
H2Owater
O2oxygen
ref reference
s solid

References

  1. Wang, Y.; Chen, K.S.; Mishler, J.; Cho, S.C.; Adroher, X.C. A review of polymer electrolyte membrane fuel cells: Technology, applications, and needs on fundamental research. Appl. Energy 2011, 88, 981–1007. [Google Scholar] [CrossRef]
  2. Lai, J.-S.; Ellis, M.W. Fuel cell power systems and applications. Proc. IEEE 2017, 105, 2166–2190. [Google Scholar] [CrossRef]
  3. Sun, L.; Jin, Y.; Pan, L.; Shen, J.; Lee, K.Y. Efficiency analysis and control of a grid-connected PEM fuel cell in distributed generation. Energy Convers. Manag. 2019, 195, 587–596. [Google Scholar] [CrossRef]
  4. Alaswad, A.; Omran, A.; Sodre, J.R.; Wilberforce, T.; Pignatelli, G.; Dassisti, M.; Baroutaji, A.; Olabi, A.G. Technical and commercial challenges of proton-exchange membrane (PEM) fuel cells. Energies 2020, 14, 144. [Google Scholar] [CrossRef]
  5. Wang, Y.; Diaz, D.F.R.; Chen, K.S.; Wang, Z.; Adroher, X.C. Materials, technological status, and fundamentals of PEM fuel cells—A review. Mater. Today 2020, 32, 178–203. [Google Scholar] [CrossRef]
  6. Wright, S. Comparison of the theoretical performance potential of fuel cells and heat engines. Renew. Energy 2004, 29, 179–195. [Google Scholar] [CrossRef]
  7. Gittleman, C.; Jorgensen, S.; Waldecker, J.; Hirano, S.; Mehall, M. Automotive fuel cell R&D needs. In DOE Fuel Cell Pre-Solicitation Workshop; Department of Energy: Lakewood, CO, USA, 2010. [Google Scholar]
  8. James, B.D.; Kalinoski, J.A.; Baum, K.N. Mass Production Cost Estimation for Direct H2 PEM Fuel Cell Systems for Automotive Applications: 2008 Update; Contract No. GS-10F-0099J; U.S. Department of Energy: Washington, DC, USA, 2009.
  9. Weihai, J.; Zhongwen, Z.; Cheng, L.; Minxin, K.; Chong, Z.; Boqi, S. Model-based fuzzy control for the thermal management of PEM fuel cells. In Proceedings of the 2020 Chinese Automation Congress (CAC), Shanghai, China, 6–8 November 2020. [Google Scholar]
  10. Baroutaji, A.; Arjunan, A.; Ramadan, M.; Robinson, J.; Alaswad, A.; Abdelkareem, M.A.; Olabi, A.-G. Advancements and prospects of thermal management and waste heat recovery of PEMFC. Int. J. Thermofluids 2021, 9, 100064. [Google Scholar] [CrossRef]
  11. Yu, Y.; Chen, M.; Zaman, S.; Xing, S.; Wang, M.; Wang, H. Thermal management system for liquid-cooling PEMFC stack: From primary configuration to system control strategy. eTransportation 2022, 12, 100165. [Google Scholar] [CrossRef]
  12. Marappan, M.; Palaniswamy, K.; Velumani, T.; Chul, K.B.; Velayutham, R.; Shivakumar, P.; Sundaram, S. Performance studies of proton exchange membrane fuel cells with different flow field designs—review. Chem. Rec. 2021, 21, 663–714. [Google Scholar] [CrossRef]
  13. Zhang, G.; Kandlikar, S.G. A critical review of cooling techniques in proton exchange membrane fuel cell stacks. Int. J. Hydrogen Energy 2012, 37, 2412–2429. [Google Scholar] [CrossRef]
  14. Kandlikar, S.G.; Lu, Z. Thermal management issues in a PEMFC stack—A brief review of current status. Appl. Therm. Eng. 2009, 29, 1276–1280. [Google Scholar] [CrossRef]
  15. Daud, W.; Rosli, R.; Majlan, E.; Hamid, S.; Mohamed, R.; Husaini, T. PEM fuel cell system control: A review. Renew. Energy 2017, 113, 620–638. [Google Scholar] [CrossRef]
  16. Yuan, J.; Faghri, M.; Sundén, B. On heat and mass transfer phenomena in PEMFC and SOFC and modeling approaches. In Transport Phenomena in Fuel Cells; WIT Press: Southampton, UK, 2005; Volume 19, p. 133. [Google Scholar]
  17. Ramousse, J.; Lottin, O.; Didierjean, S.; Maillet, D. Heat sources in proton exchange membrane (PEM) fuel cells. J. Power Sources 2009, 192, 435–441. [Google Scholar] [CrossRef]
  18. Lai, Y.-H.; Rapaport, P.A.; Ji, C.; Kumar, V. Channel intrusion of gas diffusion media and the effect on fuel cell performance. J. Power Sources 2008, 184, 120–128. [Google Scholar] [CrossRef]
  19. Kandlikar, S.; Lu, Z.; Lin, T.; Cooke, D.; Daino, M. Uneven gas diffusion layer intrusion in gas channel arrays of proton exchange membrane fuel cell and its effects on flow distribution. J. Power Sources 2009, 194, 328–337. [Google Scholar] [CrossRef]
  20. Jiao, K.; Li, X. Water transport in polymer electrolyte membrane fuel cells. Prog. Energy Combust. Sci. 2011, 37, 221–291. [Google Scholar] [CrossRef]
  21. Zaffou, R.; Yi, J.S.; Kunz, H.R.; Fenton, J.M. Temperature-driven water transport through membrane electrode assembly of proton exchange membrane fuel cells. Electrochem. Solid-State Lett. 2006, 9, A418. [Google Scholar] [CrossRef]
  22. Kim, S.; Mench, M.M. Investigation of temperature-driven water transport in polymer electrolyte fuel cell: Thermo-osmosis in membranes. J. Membr. Sci. 2009, 328, 113–120. [Google Scholar] [CrossRef]
  23. Rodatz, P.; Büchi, F.; Onder, C.; Guzzella, L. Operational aspects of a large PEFC stack under practical conditions. J. Power Sources 2004, 128, 208–217. [Google Scholar] [CrossRef]
  24. Bargal, M.H.; Abdelkareem, M.A.; Tao, Q.; Li, J.; Shi, J.; Wang, Y. Liquid cooling techniques in proton exchange membrane fuel cell stacks: A detailed survey. Alex. Eng. J. 2020, 59, 635–655. [Google Scholar] [CrossRef]
  25. Han, J.; Yu, S. Ram air compensation analysis of fuel cell vehicle cooling system under driving modes. Appl. Therm. Eng. 2018, 142, 530–542. [Google Scholar] [CrossRef]
  26. Yu, S.; Jung, D. A study of operation strategy of cooling module with dynamic fuel cell system model for transportation application. Renew. Energy 2010, 35, 2525–2532. [Google Scholar] [CrossRef]
  27. Chen, Q.; Zhang, G.; Zhang, X.; Sun, C.; Jiao, K.; Wang, Y. Thermal management of polymer electrolyte membrane fuel cells: A review of cooling methods, material properties, and durability. Appl. Energy 2021, 286, 116496. [Google Scholar] [CrossRef]
  28. Sasmito, A.P.; Birgersson, E.; Mujumdar, A.S. Numerical evaluation of various thermal management strategies for polymer electrolyte fuel cell stacks. Int. J. Hydrogen Energy 2011, 36, 12991–13007. [Google Scholar] [CrossRef]
  29. Soupremanien, U.; Le Person, S.; Favre-Marinet, M.; Bultel, Y. Tools for designing the cooling system of a proton exchange membrane fuel cell. Appl. Therm. Eng. 2012, 40, 161–173. [Google Scholar] [CrossRef]
  30. Kleinstreuer, C.; Feng, Y. Experimental and theoretical studies of nanofluid thermal conductivity enhancement: A review. Nanoscale Res. Lett. 2011, 6, 229. [Google Scholar] [CrossRef] [PubMed]
  31. Godson, L.; Raja, B.; Lal, D.M.; Wongwises, S. Enhancement of heat transfer using nanofluids—An overview. Renew. Sustain. Energy Rev. 2010, 14, 629–641. [Google Scholar] [CrossRef]
  32. Wong, K.V.; De Leon, O. Applications of nanofluids: Current and future. Adv. Mech. Eng. 2010, 2, 519659. [Google Scholar] [CrossRef]
  33. Wang, X.-Q.; Mujumdar, A.S. A review on nanofluids-part II: Experiments and applications. Braz. J. Chem. Eng. 2008, 25, 631–648. [Google Scholar] [CrossRef]
  34. Najafi, B.; Mamaghani, A.H.; Baricci, A.; Rinaldi, F.; Casalegno, A. Mathematical modelling and parametric study on a 30 kWel high temperature PEM fuel cell based residential micro cogeneration plant. Int. J. Hydrogen Energy 2015, 40, 1569–1583. [Google Scholar] [CrossRef]
  35. Islam, M.; Shabani, B.; Rosengarten, G.; Andrews, J. The potential of using nanofluids in PEM fuel cell cooling systems: A review. Renew. Sustain. Energy Rev. 2015, 48, 523–539. [Google Scholar] [CrossRef]
  36. McMullen, P.; Mohapatra, S.; Donovan, E. Advances in PEM fuel cell nano-coolant. In Fuel Cell Seminar & Energy Exposition; Curran Associates Inc.: Columbus, OH, USA, 2013. [Google Scholar]
  37. Xuan, Y.; Li, Q. Heat transfer enhancement of nanofluids. Int. J. Heat Fluid Flow 2000, 21, 58–64. [Google Scholar] [CrossRef]
  38. Madheswaran, D.K.; Vengatesan, S.; Varuvel, E.G.; Praveenkumar, T.; Jegadheeswaran, S.; Pugazhendhi, A.; Arulmozhivarman, J. Nanofluids as a coolant for polymer electrolyte membrane fuel cells: Recent trends, challenges, and future perspectives. J. Clean. Prod. 2023, 424, 138763. [Google Scholar] [CrossRef]
  39. Zakaria, I.; Mohamed, W.; Bin Mamat, A.; Saidur, R.; Azmi, W.; Mamat, R.; Sainan, K.; Ismail, H. Thermal analysis of heat transfer enhancement and fluid flow for low concentration of Al2O3 water-ethylene glycol mixture nanofluid in a single PEMFC cooling plate. Energy Procedia 2015, 79, 259–264. [Google Scholar] [CrossRef]
  40. Zakaria, I.; Azmi, W.; Mamat, A.; Mamat, R.; Saidur, R.; Abu Talib, S.; Mohamed, W. Thermal analysis of Al2O3–water ethylene glycol mixture nanofluid for single PEM fuel cell cooling plate: An experimental study. Int. J. Hydrogen Energy 2016, 41, 5096–5112. [Google Scholar] [CrossRef]
  41. Bargal, M.H.S.; Souby, M.M.; Abdelkareem, M.A.A.; Sayed, M.; Tao, Q.; Chen, M.; Wang, Y. Experimental investigation of the thermal performance of a radiator using various nanofluids for automotive PEMFC applications. Int. J. Energy Res. 2021, 45, 6831–6849. [Google Scholar] [CrossRef]
  42. Johari, M.N.I.; Zakaria, I.A.; Azmi, W.; Mohamed, W. Green bio glycol Al2O3-SiO2 hybrid nanofluids for PEMFC: The thermal-electrical-hydraulic perspectives. Int. Commun. Heat Mass Transf. 2022, 131, 105870. [Google Scholar] [CrossRef]
  43. Khalid, S.; Zakaria, I.; Azmi, W.H.; Mohamed, W.A.N.W. Thermal–electrical–hydraulic properties of Al2O3–SiO2 hybrid nanofluids for advanced PEM fuel cell thermal management. J. Therm. Anal. Calorim. 2021, 143, 1555–1567. [Google Scholar] [CrossRef]
  44. Mei, B.; Barnoon, P.; Toghraie, D.; Su, C.-H.; Nguyen, H.C.; Khan, A. Energy, exergy, environmental and economic analyzes (4E) and multi-objective optimization of a PEM fuel cell equipped with coolant channels. Renew. Sustain. Energy Rev. 2022, 157, 112021. [Google Scholar] [CrossRef]
  45. Ma, H.; Liu, J.; Liang, W.; Li, J.; Zhao, W.; Sun, P.; Ji, Q. Effects of PEMFC cooling channel insulation coating on heat transfer and electrical discharge characteristics of nanofluid coolants. Appl. Energy 2024, 357, 122514. [Google Scholar] [CrossRef]
  46. Sahin, F.; Acar, M.C.; Genc, O. Experimental determination of NiFe2O4-water nanofluid thermophysical properties and evaluation of its potential as a coolant in polymer electrolyte membrane fuel cells. Int. J. Hydrogen Energy 2024, 50, 1572–1583. [Google Scholar] [CrossRef]
  47. Kaiser, R.; Ahn, C.-Y.; Kim, Y.-H.; Park, J.-C. Performance and mass transfer evaluation of PEM fuel cells with straight and wavy parallel flow channels of various wavelengths using CFD simulation. Int. J. Hydrogen Energy 2024, 51, 1326–1344. [Google Scholar] [CrossRef]
  48. Kaiser, R.; Ahn, C.Y.; Lee, S.Y.; Kim, Y.H.; Park, J.C. Numerical Analysis of Water Management and Reactant Distribution in PEM Fuel Cells with a Convergent 5-Channel Serpentine Flow Field for Emission-Free Ships. Int. J. Nav. Archit. Ocean Eng. 2025, 17, 100649. [Google Scholar] [CrossRef]
  49. Kaiser, R.; Ahn, C.-Y.; Kim, Y.-H.; Park, J.-C. Towards Reliable Prediction of Performance for Polymer Electrolyte Membrane Fuel Cells via Machine Learning-Integrated Hybrid Numerical Simulations. Processes 2024, 12, 1140. [Google Scholar] [CrossRef]
  50. Springer, T.E.; Zawodzinski, T.A.; Gottesfeld, S. Polymer electrolyte fuel cell model. J. Electrochem. Soc. 1991, 138, 2334. [Google Scholar] [CrossRef]
  51. Tawfik, H.; Hung, Y.; Mahajan, D. Metal bipolar plates for PEM fuel cell—A review. J. Power Sources 2007, 163, 755–767. [Google Scholar] [CrossRef]
  52. Karimi, S.; Fraser, N.; Roberts, B.; Foulkes, F.R. A review of metallic bipolar plates for proton exchange membrane fuel cells: Materials and fabrication methods. Adv. Mater. Sci. Eng. 2012, 2012, 828070. [Google Scholar] [CrossRef]
  53. Macedo-Valencia, J.; Sierra, J.; Figueroa-Ramírez, S.; Díaz, S.; Meza, M. 3D CFD modeling of a PEM fuel cell stack. Int. J. Hydrogen Energy 2016, 41, 23425–23433. [Google Scholar] [CrossRef]
  54. Hernández-Herrera, C.; Sierra, J.; Ordoñez, L.; Figueroa-Ramírez, S.; Mandujano-Ramírez, H. Numerical assessment of heat transfer on a PEM fuel cell stack with different refrigeration systems: Heat source management. Int. J. Electrochem. Sci. 2022, 17, 220554. [Google Scholar] [CrossRef]
  55. Chaudhari, S.; Chakule, R.; Talmale, P. Experimental study of heat transfer characteristics of Al2O3 and CuO nanofluids for machining application. Mater. Today Proc. 2019, 18, 788–797. [Google Scholar] [CrossRef]
  56. Tlili, I.; Rabeti, M.; Shadloo, M.S.; Abdelmalek, Z. Forced convection heat transfer of nanofluids from a horizontal plate with convective boundary condition and a line heat source embedded in porous media. J. Therm. Anal. Calorim. 2020, 141, 2081–2094. [Google Scholar] [CrossRef]
  57. Roache, P.J. Perspective: A Method for Uniform Reporting of Grid Refinement Studies. J. Fluids Eng. 1994, 116, 405–413. [Google Scholar] [CrossRef]
  58. Kandlikar, S.G.; Lu, Z. Fundamental research needs in combined water and thermal management within a proton exchange membrane fuel cell stack under normal and cold-start conditions. J. Fuel Cell Sci. Technol. 2009, 6, 044001. [Google Scholar] [CrossRef]
  59. Kandlikar, S.G.; Lu, Z.; Trabold, T.A. Current status and fundamental research needs in thermal management within a PEMFC stack; Keynote Paper. In Proceedings of the 10th UK Heat Transfer Conference, Edinburgh, UK, 10–12 September 2007. [Google Scholar]
  60. Ge, N.; Banerjee, R.; Muirhead, D.; Lee, J.; Liu, H.; Shrestha, P.; Wong, A.; Jankovic, J.; Tam, M.; Susac, D.; et al. Membrane dehydration with increasing current density at high inlet gas relative humidity in polymer electrolyte membrane fuel cells. J. Power Sources 2019, 422, 163–174. [Google Scholar] [CrossRef]
  61. Dannenberg, K.; Ekdunge, P.; Lindbergh, G. Mathematical model of the PEMFC. J. Appl. Electrochem. 2000, 30, 1377–1387. [Google Scholar] [CrossRef]
  62. Işıklı, F.; Işıklı, H.; Sürmen, A. Effect of Number of Channels on Performance of PEM Fuel Cells for Serpentine Type Channel Configuration. Arabian J. Sci. Eng. 2025, 50, 2595–2612. [Google Scholar] [CrossRef]
  63. Khan, S.S.; Shareef, H.; Ibrahim, A.A. Improved semi-empirical model of proton exchange membrane fuel cell incorporating fault diagnostic feature. J. Mod. Power Syst. Clean Energy 2020, 9, 1566–1573. [Google Scholar] [CrossRef]
  64. Alirezaie, A.; Hajmohammad, M.H.; Ahangar, M.R.H.; Esfe, M.H. Price-performance evaluation of thermal conductivity enhancement of nanofluids with different particle sizes. Appl. Therm. Eng. 2018, 128, 373–380. [Google Scholar] [CrossRef]
  65. Sergis, A.; Hardalupas, Y. Anomalous heat transfer modes of nanofluids: A review based on statistical analysis. Nanoscale Res. Lett. 2011, 6, 391. [Google Scholar] [CrossRef] [PubMed]
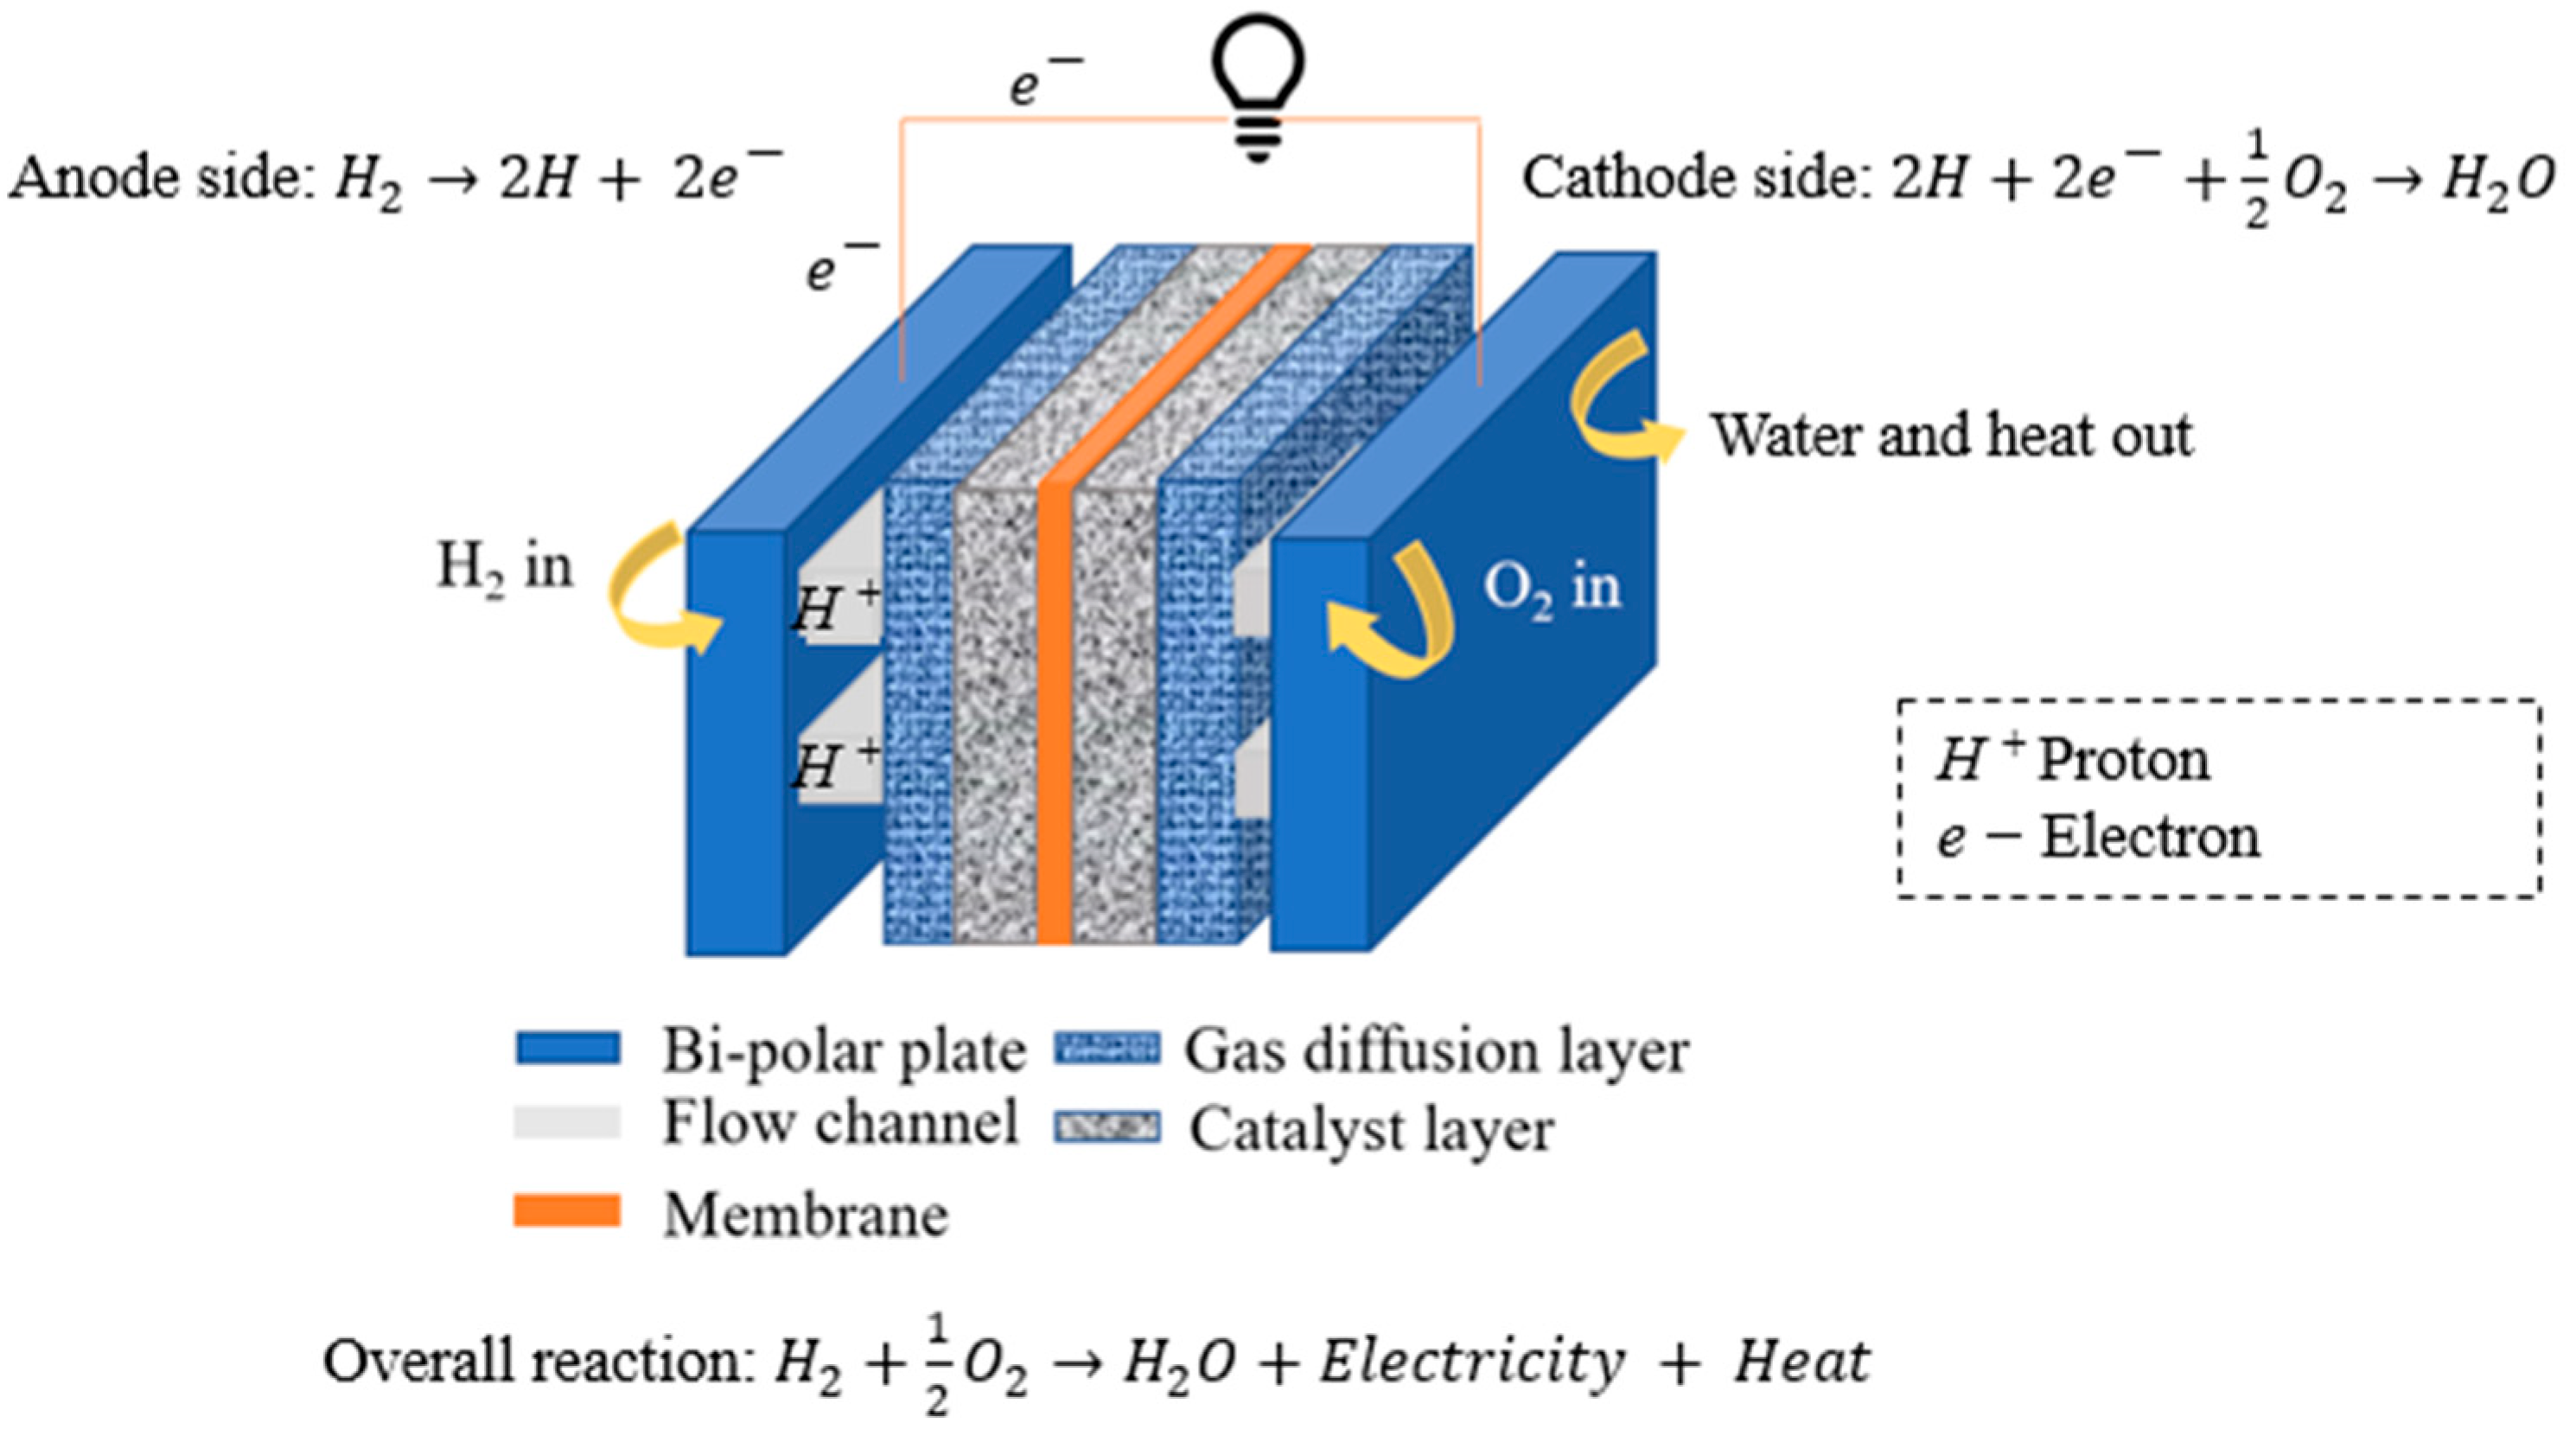
Figure 1. Schematic view of PEMFC operation illustrating reactant paths, product water, membrane, catalyst layers, gas-diffusion layers, and bipolar plates.
Energies 18 05824 g001
Figure 2. Flow-field geometries and component dimensions used in simulations: serpentine anode side channels, straight cathode channels, and membrane electrode assembly (MEA) layering.
Energies 18 05824 g002
Figure 3. Computational domain of the three-cell PEMFC stack showing anode and cathode flow-fields, cathode-side coolant channels, and solid components.
Energies 18 05824 g003
Figure 4. Area-averaged electric current density and GCI versus grid levels demonstrating mesh convergence.
Energies 18 05824 g004
Figure 5. Polarization curve of the simulated no-coolant case compared with experimental data [53].
Energies 18 05824 g005
Figure 6. Three-dimensional view of (a) hydrogen (H2) and (b) oxygen (O2) distribution on the anode and cathode side, respectively at different voltages.
Energies 18 05824 g006aEnergies 18 05824 g006b
Figure 7. Three-dimensional temperature distributions from the perspective of (a) cathode side and (b) anode side at two operating voltages; the left subpanels corresponding to 0.73 V and the right to 0.54 V.
Energies 18 05824 g007
Figure 8. Volumetric heat-source distributions of PEMFC stack (without coolant) at 0.54 V among AGDL, ACL, membrane, CCL, CGDL with axis units clarified; catalyst layers dominating.
Energies 18 05824 g008
Figure 9. Three-dimensional view in (a) the membrane water content at two operating voltages of and (b) the electrochemical reaction rate at the interface between the membrane and the cathode catalyst layer for 0.73 V and 0.54 V from the left.
Energies 18 05824 g009aEnergies 18 05824 g009b
Figure 10. Temperature fields at 0.54 V for four configurations: (a) without coolant, (b) with water, (c) with CuO nano fluid, and (d) with Al2O3 nanofluid.
Energies 18 05824 g010
Figure 11. Comparison of stack electric current density at 0.54 V of PEMFC under different cooling conditions.
Energies 18 05824 g011
Figure 12. (a) Ohmic-heat distributions by component and CGDL-side temperature fields at low voltage (0.54 V) and high current density for PEMFC; (b) without coolant, (c) with water, (d) with CuO, and (e) with Al2O3.
Energies 18 05824 g012
Figure 13. (a) Combined ohmic and reaction volumetric heat source of PEMFC in ACL and CCL at 0.54 V for four cases: without coolant, water, CuO, Al2O3. Temperature distribution at the CCL; (b) without coolant, (c) with water, (d) with CuO, and (e) with Al2O3.
Energies 18 05824 g013
Figure 14. Membrane water-content distribution at 0.54 V for (a) without coolant, (b) with water, (c) with CuO, and (d) with Al2O3.
Energies 18 05824 g014
Figure 15. The oxygen-reduction electrochemical reaction rate at the membrane-cathode interface (a) without coolant, (b) with water, (c) with CuO, (d) with Al2O3 and (e) electrochemical reaction rate distribution along membrane-cathode interface height for various coolant conditions.
Energies 18 05824 g015
Figure 16. Pressure distributions along a single coolant channel for (a) water, (b) CuO, and (c) Al2O3.
Energies 18 05824 g016
Figure 17. Price-performance analysis of nanofluids following the conductivity-ratio metric.
Energies 18 05824 g017
Table 1. Governing equations for mixture-model conservation of mass, momentum, species, energy, and charge in a multiphase multiphysics model [20,47,48].
Equations
Mass ρ g u m = S m
Momentum ρ g u g u g 2 1 α 1 2 = p g + μ g u g ϵ 1 α 1 + u g T ϵ 1 α 1 2 3 μ g u g ϵ 1 α 1 + S u
Species ρ g γ i u g = ρ g D i e f f γ i + S i
Energy ρ m C p e f f T u g = k e f f T + S T
Charge κ e f f · ϕ e = S Φ ,   σ e f f · ϕ s = S Φ
Table 2. Region-wise source terms for bipolar plates, flow channels, catalyst layers, gas-diffusion layers, and membrane [20,47,48].
BPFCL/CCCLGDLMembrane
Mass u m = 0 S m = S g l S m = i S i S m = i S i u m = 0
Momentum u m = 0 = 0
S u = 0
S u = μ g K G D L u m i x S u = μ g K G D L u m i x u m = 0
Species (gas) S i = 0 S i = 0 S H 2 , a n = M H 2 2 F i a n
S H 2 O , a n = M H 2 O 2 F i a n
S O 2 , c a = M O 2 4 F i c a
S H 2 O , c a = M H 2 O 2 F i c a M H 2 O F i c a   n d
S i = 0 γ i = 0
Energy S T = i s 2 k e f f S T = 0 Anode CL:
S T = i s 2 k e f f + i e 2 σ e f f + i a n η a c t + i a n T S 2 F
Cathode CL:
S T = i s 2 k e f f + i e 2 σ e f f + i c a η a c t + i c a T S 2 F
S T = i s 2 k e f f S T = i e 2 σ e f f
Charge S ϕ s = 0 ;
S ϕ e = 0 ;
Φ s = 0 ,
Φ e = 0
Anode CL:
S ϕ s = i a n ; S ϕ e = i a n ;
Cathode CL:
S ϕ s = i c a ; S ϕ e = i c a ;
S ϕ s = 0 ;
S ϕ e = 0 ;
S ϕ s = 0 ;
S ϕ e = 0 ;
Table 3. Details of mesh.
ComponentMesh OperationsNo. of Cells
Anode BPLAutomated Polyhedral Mesher18,390
Anode GDLDirected Polygonal Mesher22,533
Anode CLDirected Polygonal Mesher32,190
MembraneDirected Polygonal Mesher32,190
Cathode ClDirected Polygonal Mesher32,190
Cathode FCLDirected Polygonal Mesher1580
Cathode GDLDirected Polygonal Mesher22,533
Cooling BPLAutomated Polyhedral Mesher3716
Cooling FCLDirected Polygonal Mesher2748
Table 4. Physical parameters and properties of PEMFC components; porosity, tortuosity, thermal and electrical properties with corrected unit typography.
ParametersValues
Membrane density1970 kg m−3
Equivalent weight of membrane, EW1100 kg kmol−1
Membrane specific heat903 Jk−1 K−1
CL Porosity/Contact Angle0.2/145°
CL tortuosity1.1
CL thermal conductivity1.0 Wm−1 K−1
CL electrical conductivity2000 S m−1
GDL Porosity/Contact Angle0.4/145°
GDL tortuosity1.2
GDL Resistivity8 mΩ cm2
GDL thermal conductivity1.3 Wm−1 K−1
GDL electrical conductivity5000 S m−1
BPL density2250 Kg m−3
BPL thermal conductivity24.0 Wm−1 K−1
BPL specific heat707.68 JKg−1 K−1
BPL electrical conductivity125,000 S m−1
Permeability of anode/cathode gas diffusion layers, K8.7 × 10−14
Anode   exchange   current   density ,   i 0 , a n 695 × V−3.638 (A m−2)
Cathode   exchange   current   density ,   i 0 , c a 0.695 × V−3.638 (A m−2)
Anode apparent charge transfer coefficient2
Cathode apparent charge transfer coefficient2
H2 diffusivity1.10 × 10−4
H2O diffusivity7.35 × 10−5
O2 diffusivity3.30 × 10−5
O2 diffusivity4.00 × 10−5
Table 5. Boundary and operating conditions for anode, cathode, and coolant channels including flow rates, temperatures, outlet pressure, and wall treatment.
Anode FCLCathode FCLCoolant Channel
Species mole fractionH2: 0.90|H2O: 0.10O2: 0.21|N2 = 0.79
Mass flow rate3.42 × 10−7 (kg s−1)3.26 × 10⁻⁵ (kg s−1)1.38 × 10⁻⁴ (kg s−1)
Temperature300.15 K300.15 K300.15
Pressure at the outletAtmosphericAtmosphericAtmospheric
Wall treatmentNo-slipNo-slipNo-slip
Table 6. Thermophysical properties of deionized water and of Al2O3 and CuO nanofluids at 1 vol% [55,56].
Nano Particle/Base FluidThermal Conductivity κ, Wm−1 K−1Density ρ, kg m−3Specific Heat
JKg−1 K−1
Dynamic Viscosity
Pa s
Deionized water0.61399941790.000844
CuO0.7361052.23966.500.00068
Al2O30.7651007.44154.70.000612
Table 7. Grid-convergence metrics and Richardson-extrapolation results; renumbered to avoid duplication with operating-conditions tables.
Mesh123234345135
r1.331.331.331.7689
f1331.479331.934331.915331.915
f2320.096331.479331.934331.479
f3314.89320.096331.479314.89
p2.74322211.28968331.9346.379947
Electric current density
(A m−2)
341.0726331.9529331.915331.9268
ε −0.03434−0.001375.72 × 10−5−0.00131
GCIfine3.6177390.0071345.55 × 10−440.004432
GCIcoarse8.1915420.1787230.0071550.168853
R2.1865160.039972−0.041760.026282
Table 8. Quantitative comparison of coolant performance in the PEMFC stack at 0.54 V, showing average and maximum temperatures, surface temperature deviation (uniformity index) on the cathode catalyst layer, and pressure drop across top and bottom coolant channels. The results highlight improved cooling efficiency and reduced thermal non-uniformity with nanofluid coolants, particularly Al2O3.
CoolantAvg. Temp.
(K)
Max. Temp.
(K)
Surface Standard Deviation of Temp on Cathode CL.Pressure Drop on Cathode Side, Top Channel, Pin − Pout (Bar)Pressure Drop on Cathode Side, Bottom Channel
Pin − Pout (Bar)
Without301.48307.373.25 × 10−1−8.91 × 10−21.85
With water301.31303.913.01 × 10−1−8.85 × 10−21.86
With CuO301.29303.981.64 × 10−1−1.22 × 10−11.85
With Al2O3301.28303.811.19 × 10−1−9.25 × 10−21.80
Disclaimer/Publisher’s Note: The statements, opinions and data contained in all publications are solely those of the individual author(s) and contributor(s) and not of MDPI and/or the editor(s). MDPI and/or the editor(s) disclaim responsibility for any injury to people or property resulting from any ideas, methods, instructions or products referred to in the content.