Numerical Analysis of FOWT Dynamics with Fully Coupled and Decoupled Methods: A Comparative Study
Abstract
1. Introduction
2. Theoretical Methodology
2.1. Numerical Analysis Methods
2.2. The Dynamic Equation of the FOWT Motion
2.3. Analysis Methods for the Rotor and Tower
2.4. Analysis Methods for Platform and Mooring System
3. Validation of the Numerical Model
3.1. Model Description
3.2. Free Decay Test
3.3. Motion Response Amplitude Operators (RAOs)
3.4. Time-Domain Analysis
3.4.1. Irregular Wave-Only Condition
3.4.2. Combined Irregular Waves and Wind Condition
4. Comparative Study of Coupled and Decoupled Analysis Methods
4.1. RAOs and Dynamic Response Results
4.2. Different Turbulence Intensities and Wind Speeds
5. Conclusions
- Under the wave-only condition, the numerical analysis indicates a 9.9% reduction in surge amplitude, an 11.7% reduction in pitch amplitude, and a relatively similar response in mooring tension; under the combined wave-wind condition, the numerical analysis shows a 1.72% smaller surge amplitude, a 5.14% smaller pitch amplitude, and a 7.22% smaller mooring tension amplitude. Overall, the results of the motion and mooring tension response from numerical analysis are smaller than those from the model test, but the differences between them are not very obvious, which verifies the correctness of the fully coupled numerical analysis method presented in this study.
- The motion responses of the experimental model are consistently larger than the predictions from the fully coupled numerical model. Meanwhile, the decoupled model, which is computationally cheaper and generally considered less accurate, produces results that are also larger than the coupled model in some cases. This indicates that, in some specific condition, the decoupled model’s predictions are actually closer to the experimental data than the fully coupled model.
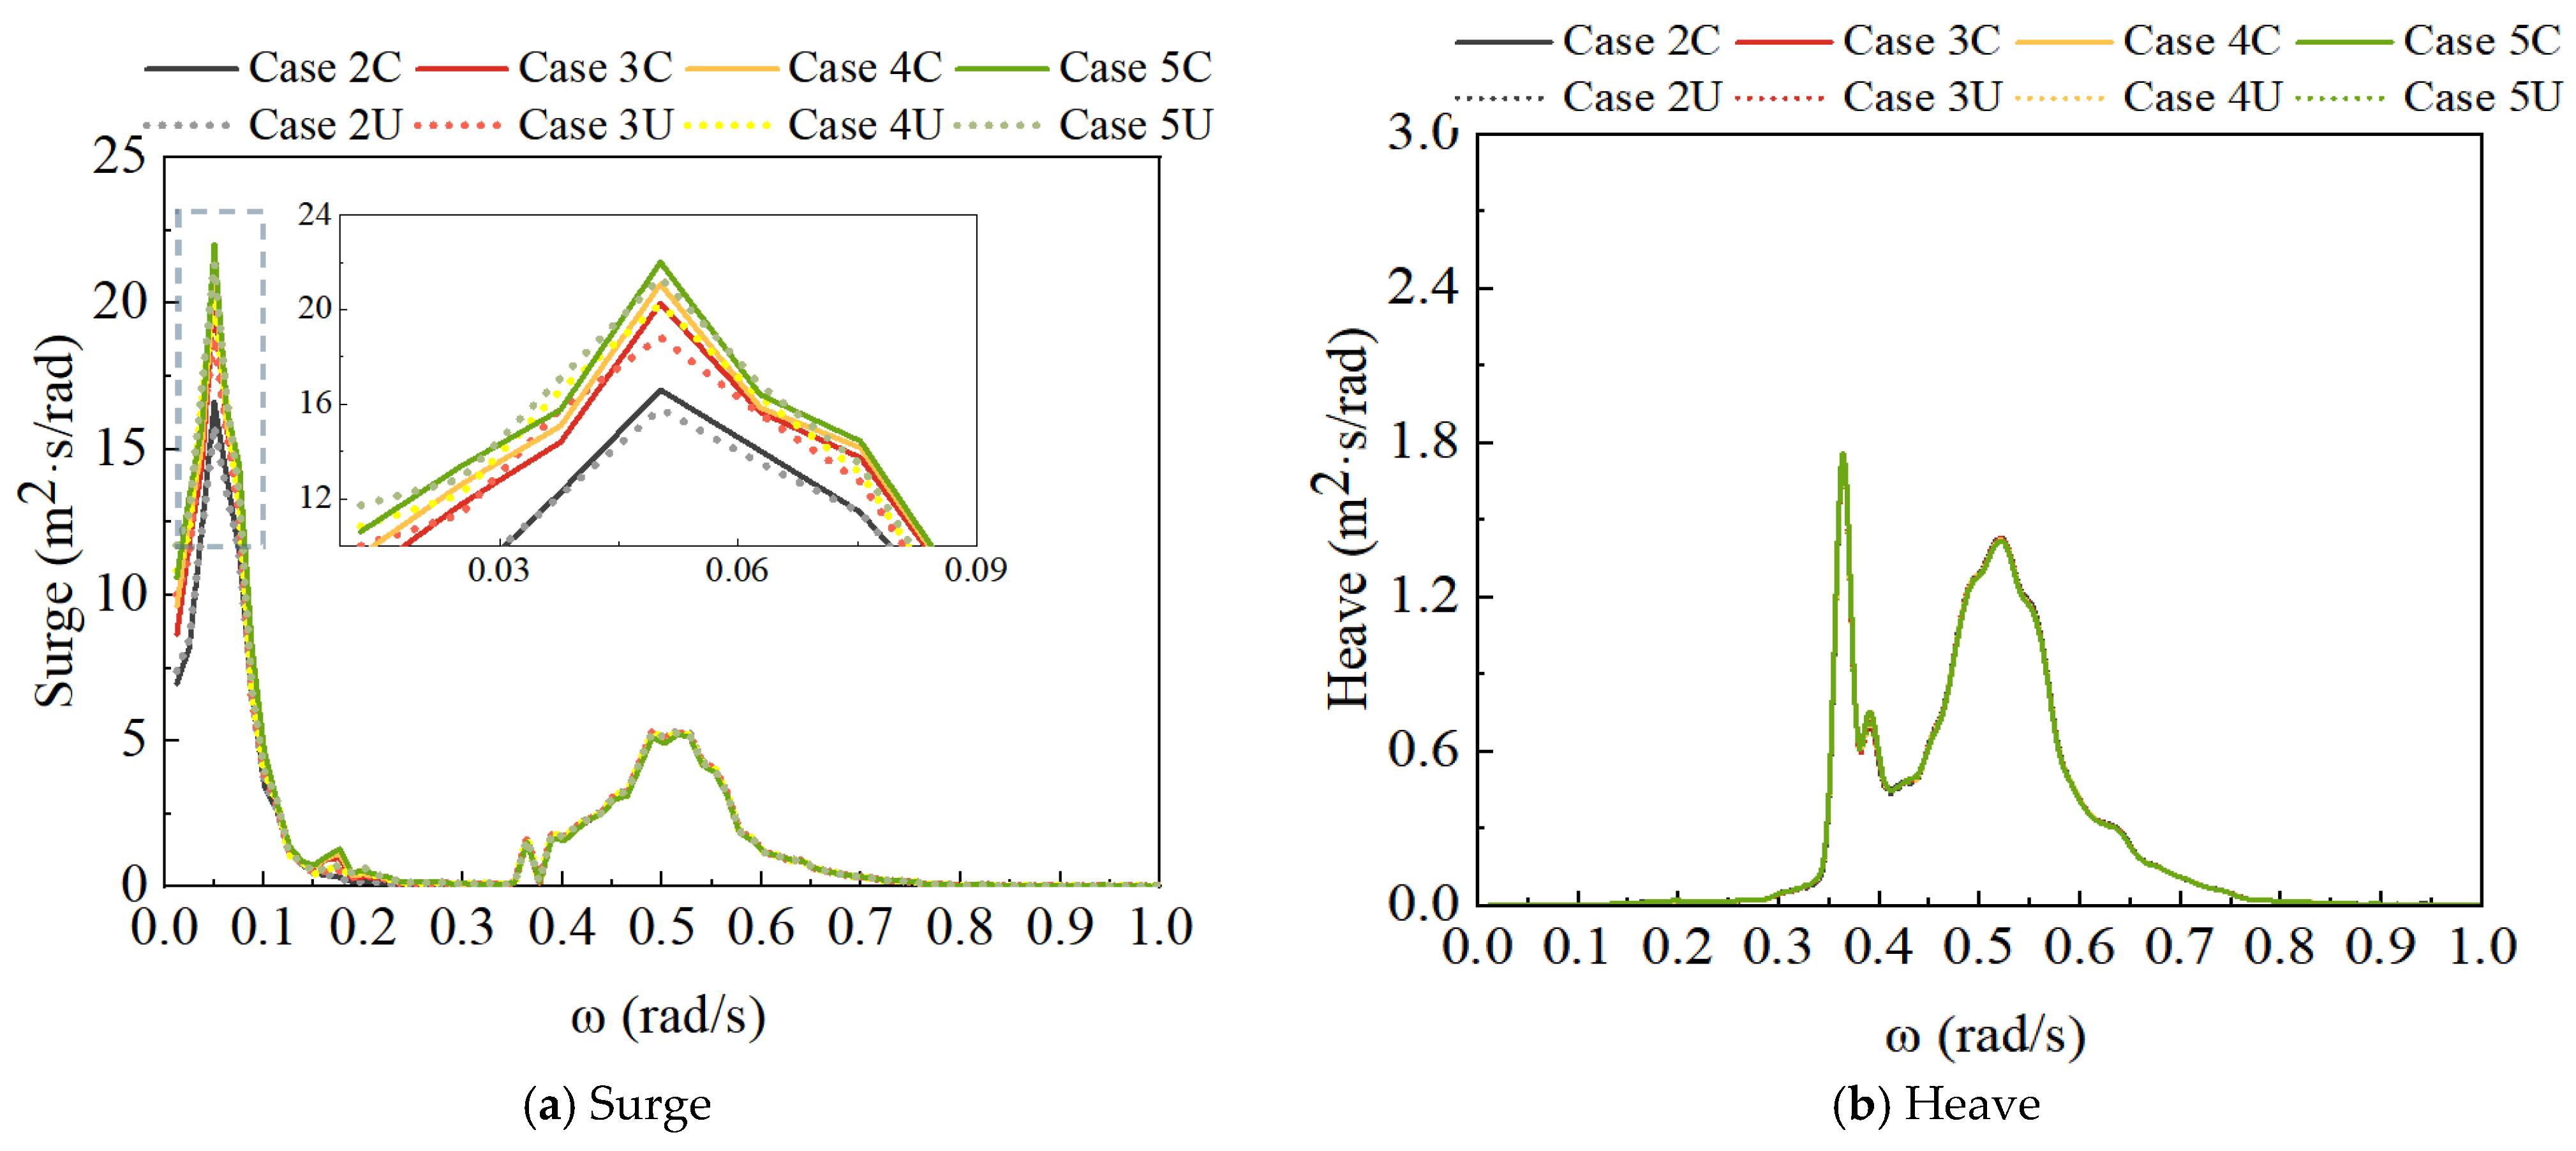
- Under the wave-only condition, there is no significant difference in the response results between the fully coupled and decoupled numerical models. However, under the combined wave-wind condition, the results of the FOWT motion and mooring line tension responses calculated by the fully coupled and decoupled numerical analysis methods show significant differences in the low-frequency range. Specifically, the response spectrum peak of surge and pitch in the decoupled numerical analysis is greater than that in the fully coupled analysis. The response results of the two coupled analysis methods are basically consistent in the wave frequency range.
- Turbulence intensity does not influence the motion response within the wave frequency range; it primarily affects the response outcomes in the low-frequency range. As the turbulence intensity increases, the peak of the low-frequency response rises. This indicates that the wind load primarily affects the low-frequency motion response of the FOWT. The response peak values of surge and pitch under turbulent wind conditions at the natural frequency are significantly greater than those under steady wind conditions, and the difference in pitch responses of the FOWT under turbulent wind conditions between the fully coupled and decoupled models is more pronounced. Different coupled analysis methods and turbulence intensities have minimal effects on the heave response.
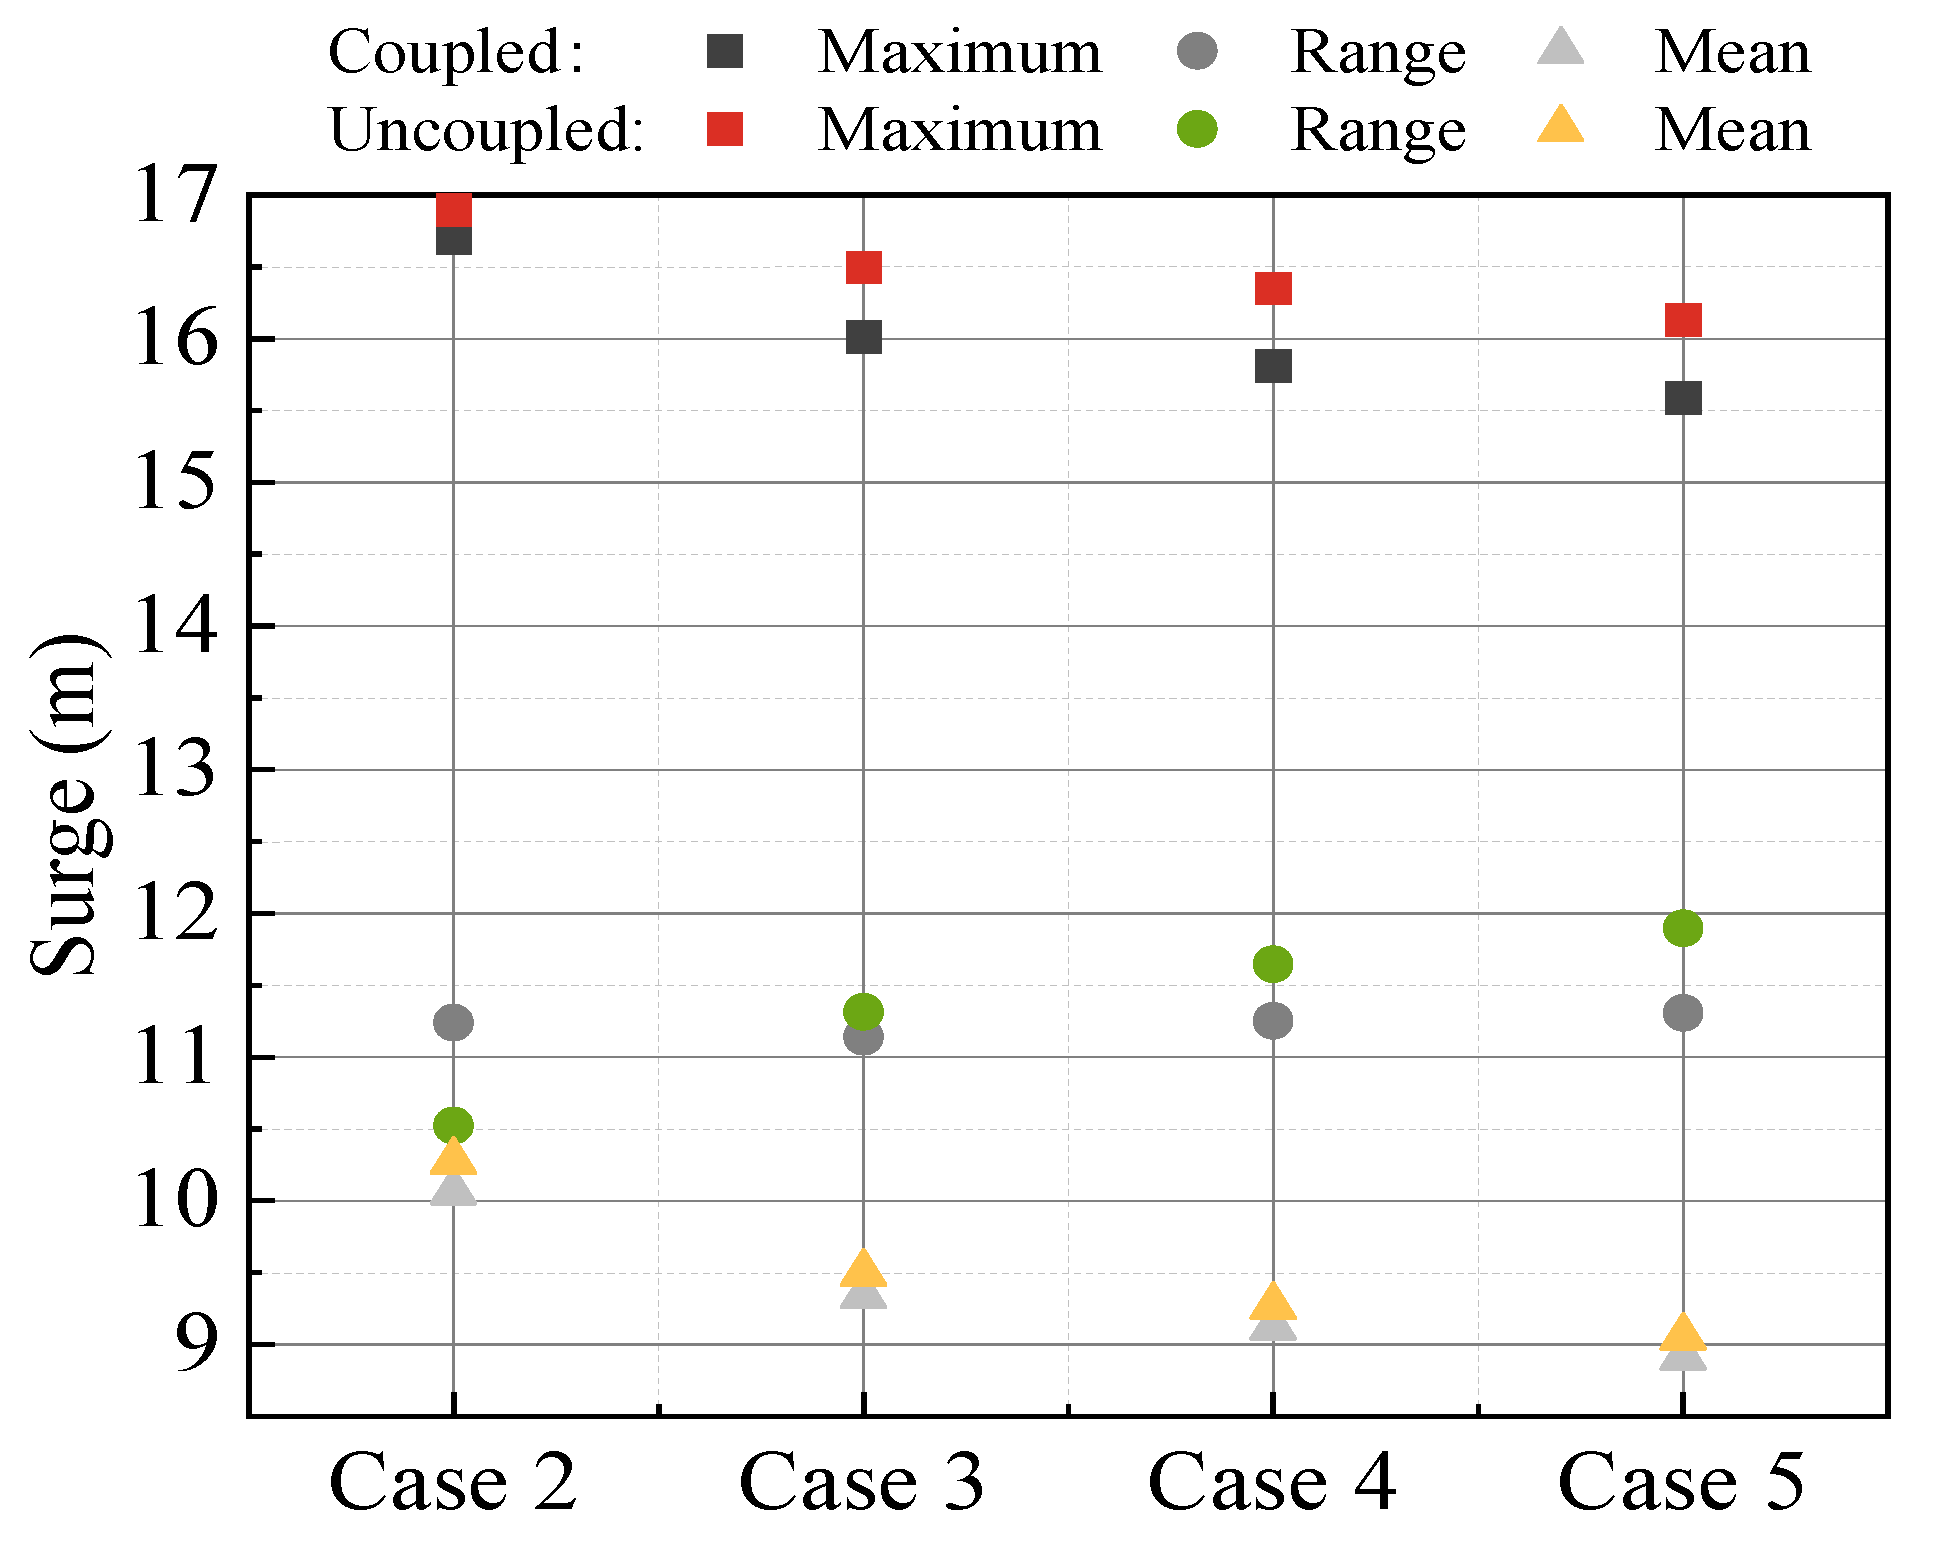
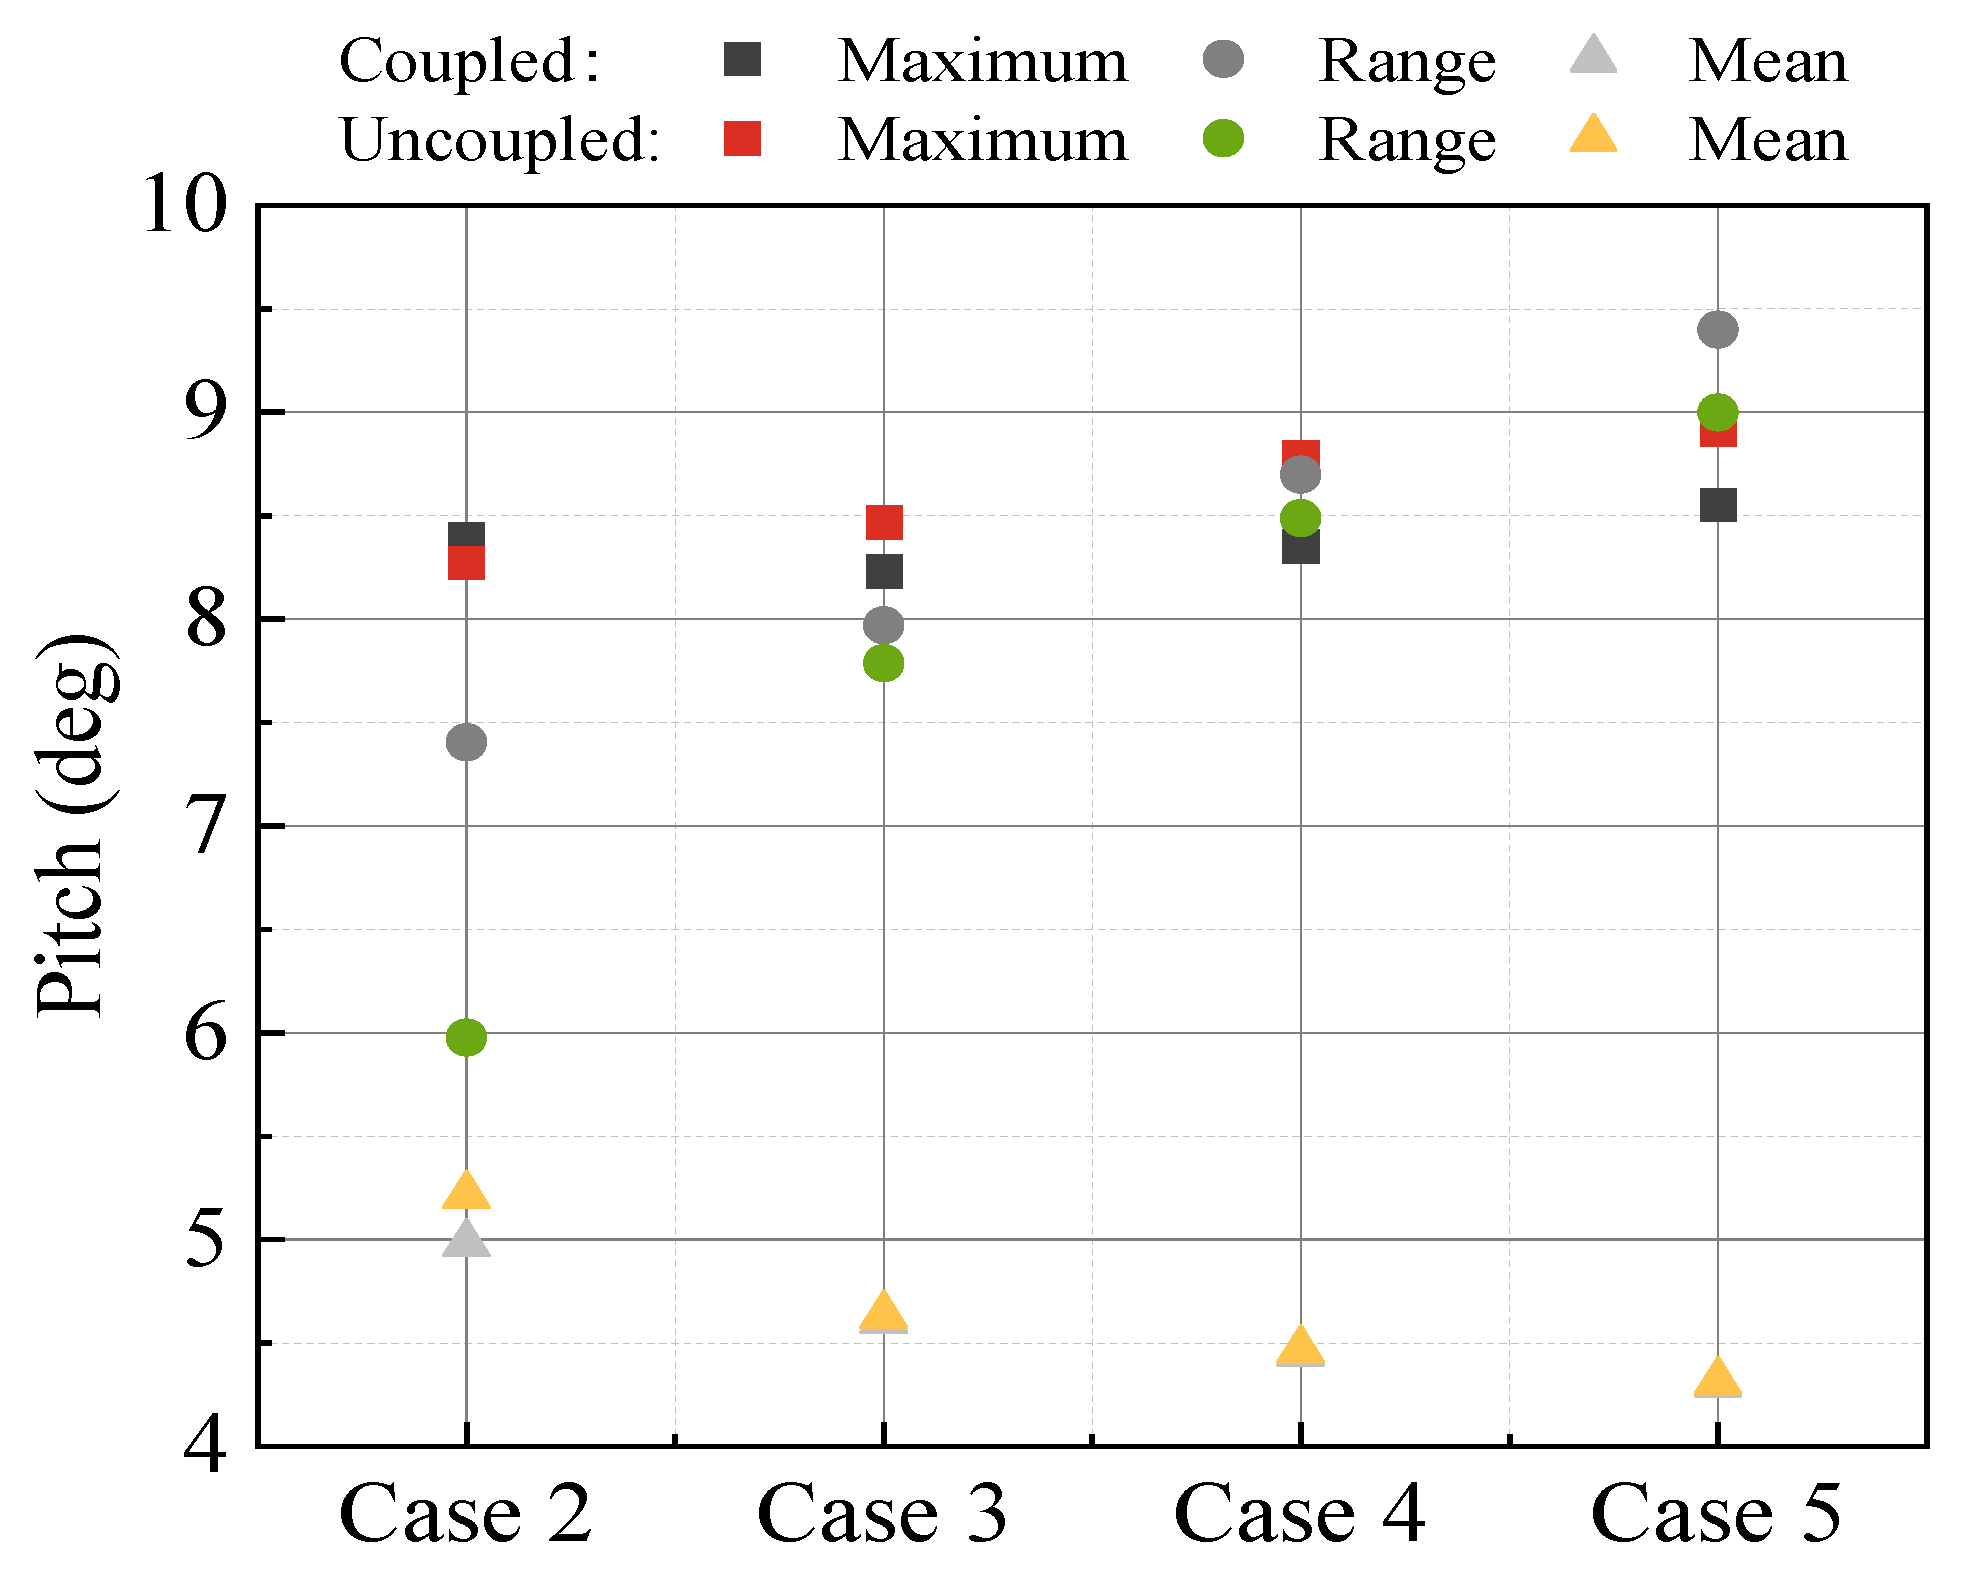
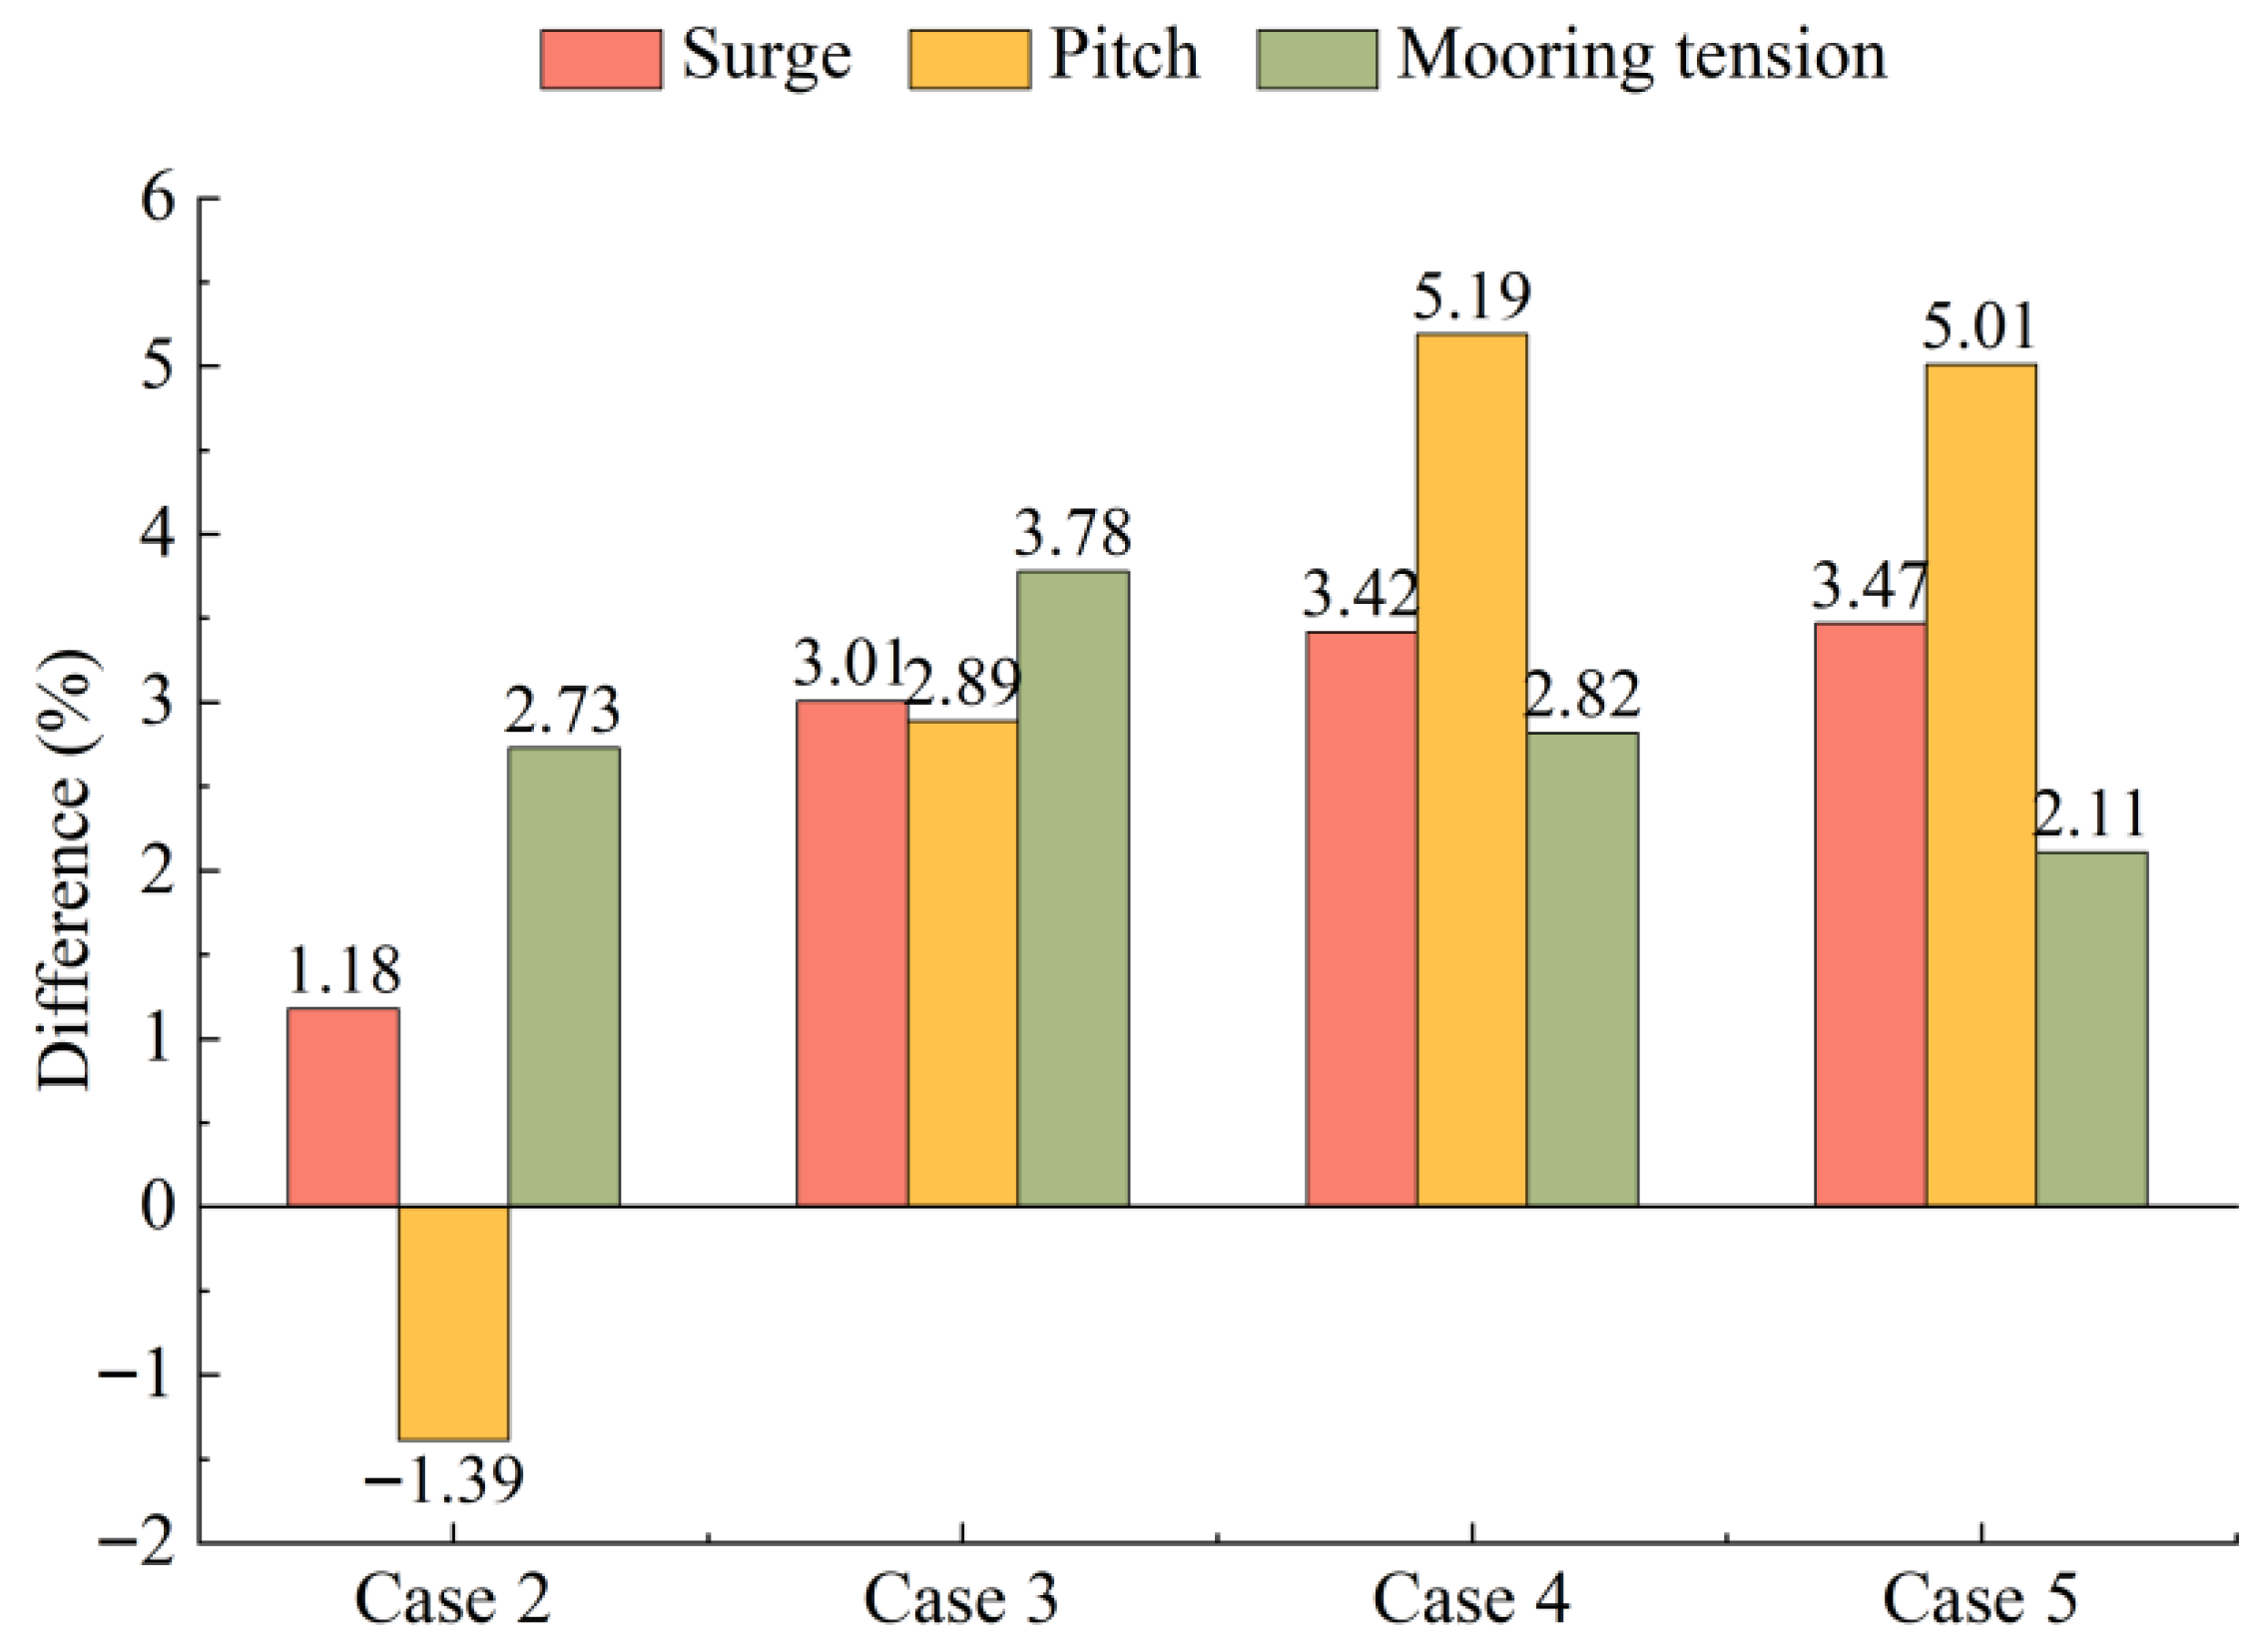
- Compared with the response results of fully coupled analysis, the maximal values of surge and pitch calculated by the decoupled method are larger, and the percentage of increase becomes more pronounced as the turbulence intensity increases. When the turbulence intensity is 0.2, the maximal values of surge and pitch of the decoupled numerical model are 3.47% and 5.01% larger than the results of the fully coupled numerical model, respectively. Additionally, at the rated wind speed, the maximum and mean values of surge decrease as the turbulence intensity increases. This is due to the effect of the wind turbine control module, where the wind thrust is at its greatest when the wind speed remains constant at the rated value; when the wind speed is greater or less than the rated value, the wind thrust decreases. Thus, the greater the deviation of wind speed from its rated value over time, the more it reduces the extreme values of wind loads, consequently decreasing the extreme values of surge motion as well. As the turbulence intensity increases, the range of variation and standard deviation of surge also increase.
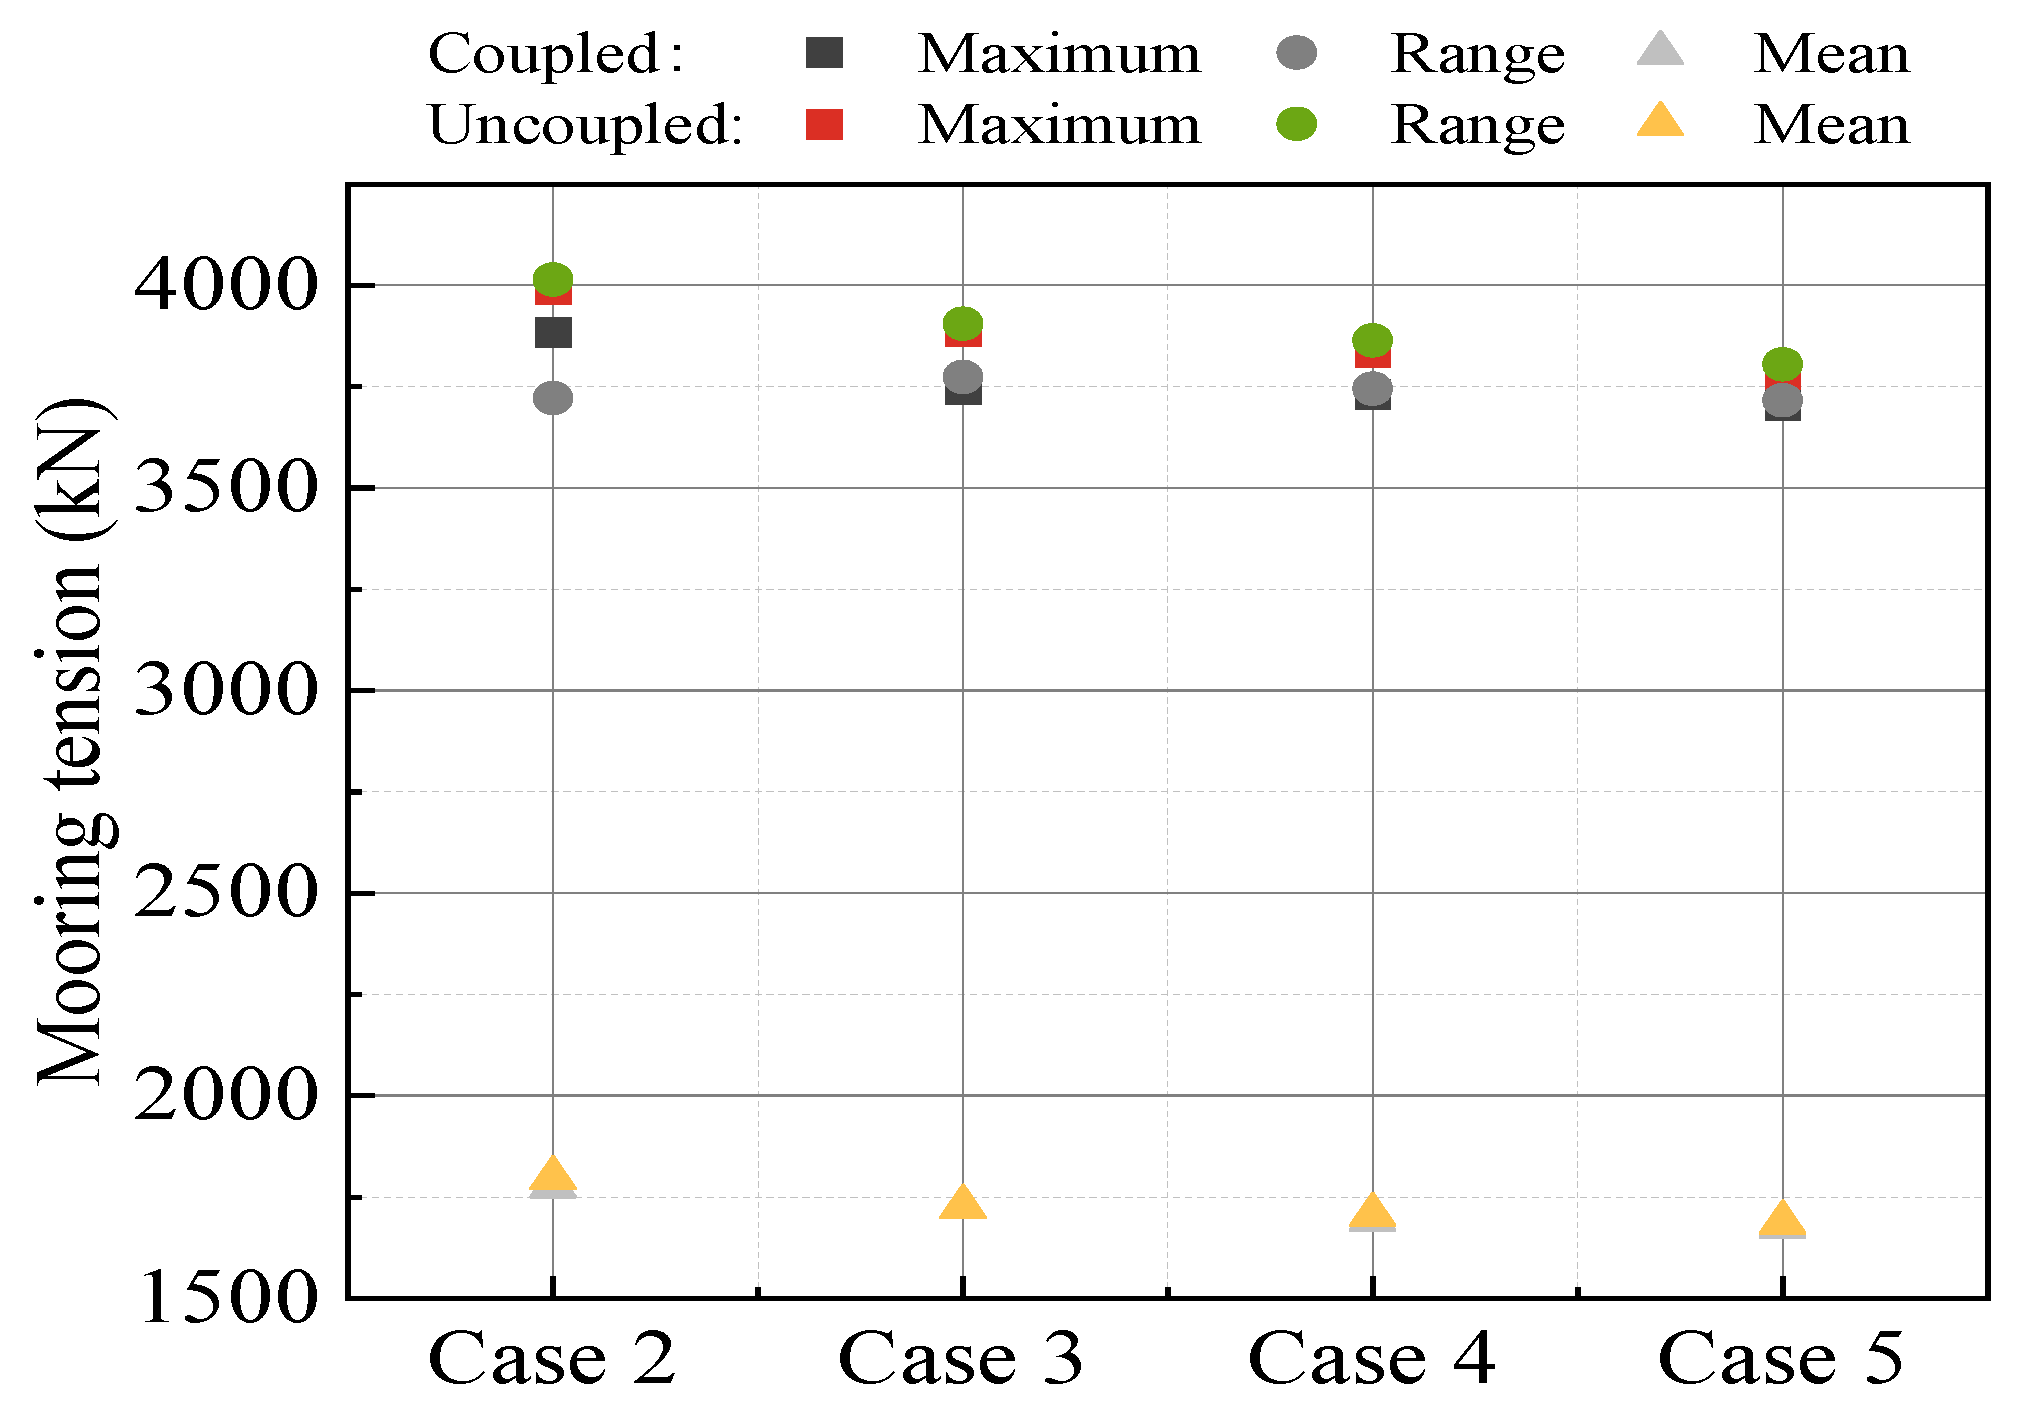
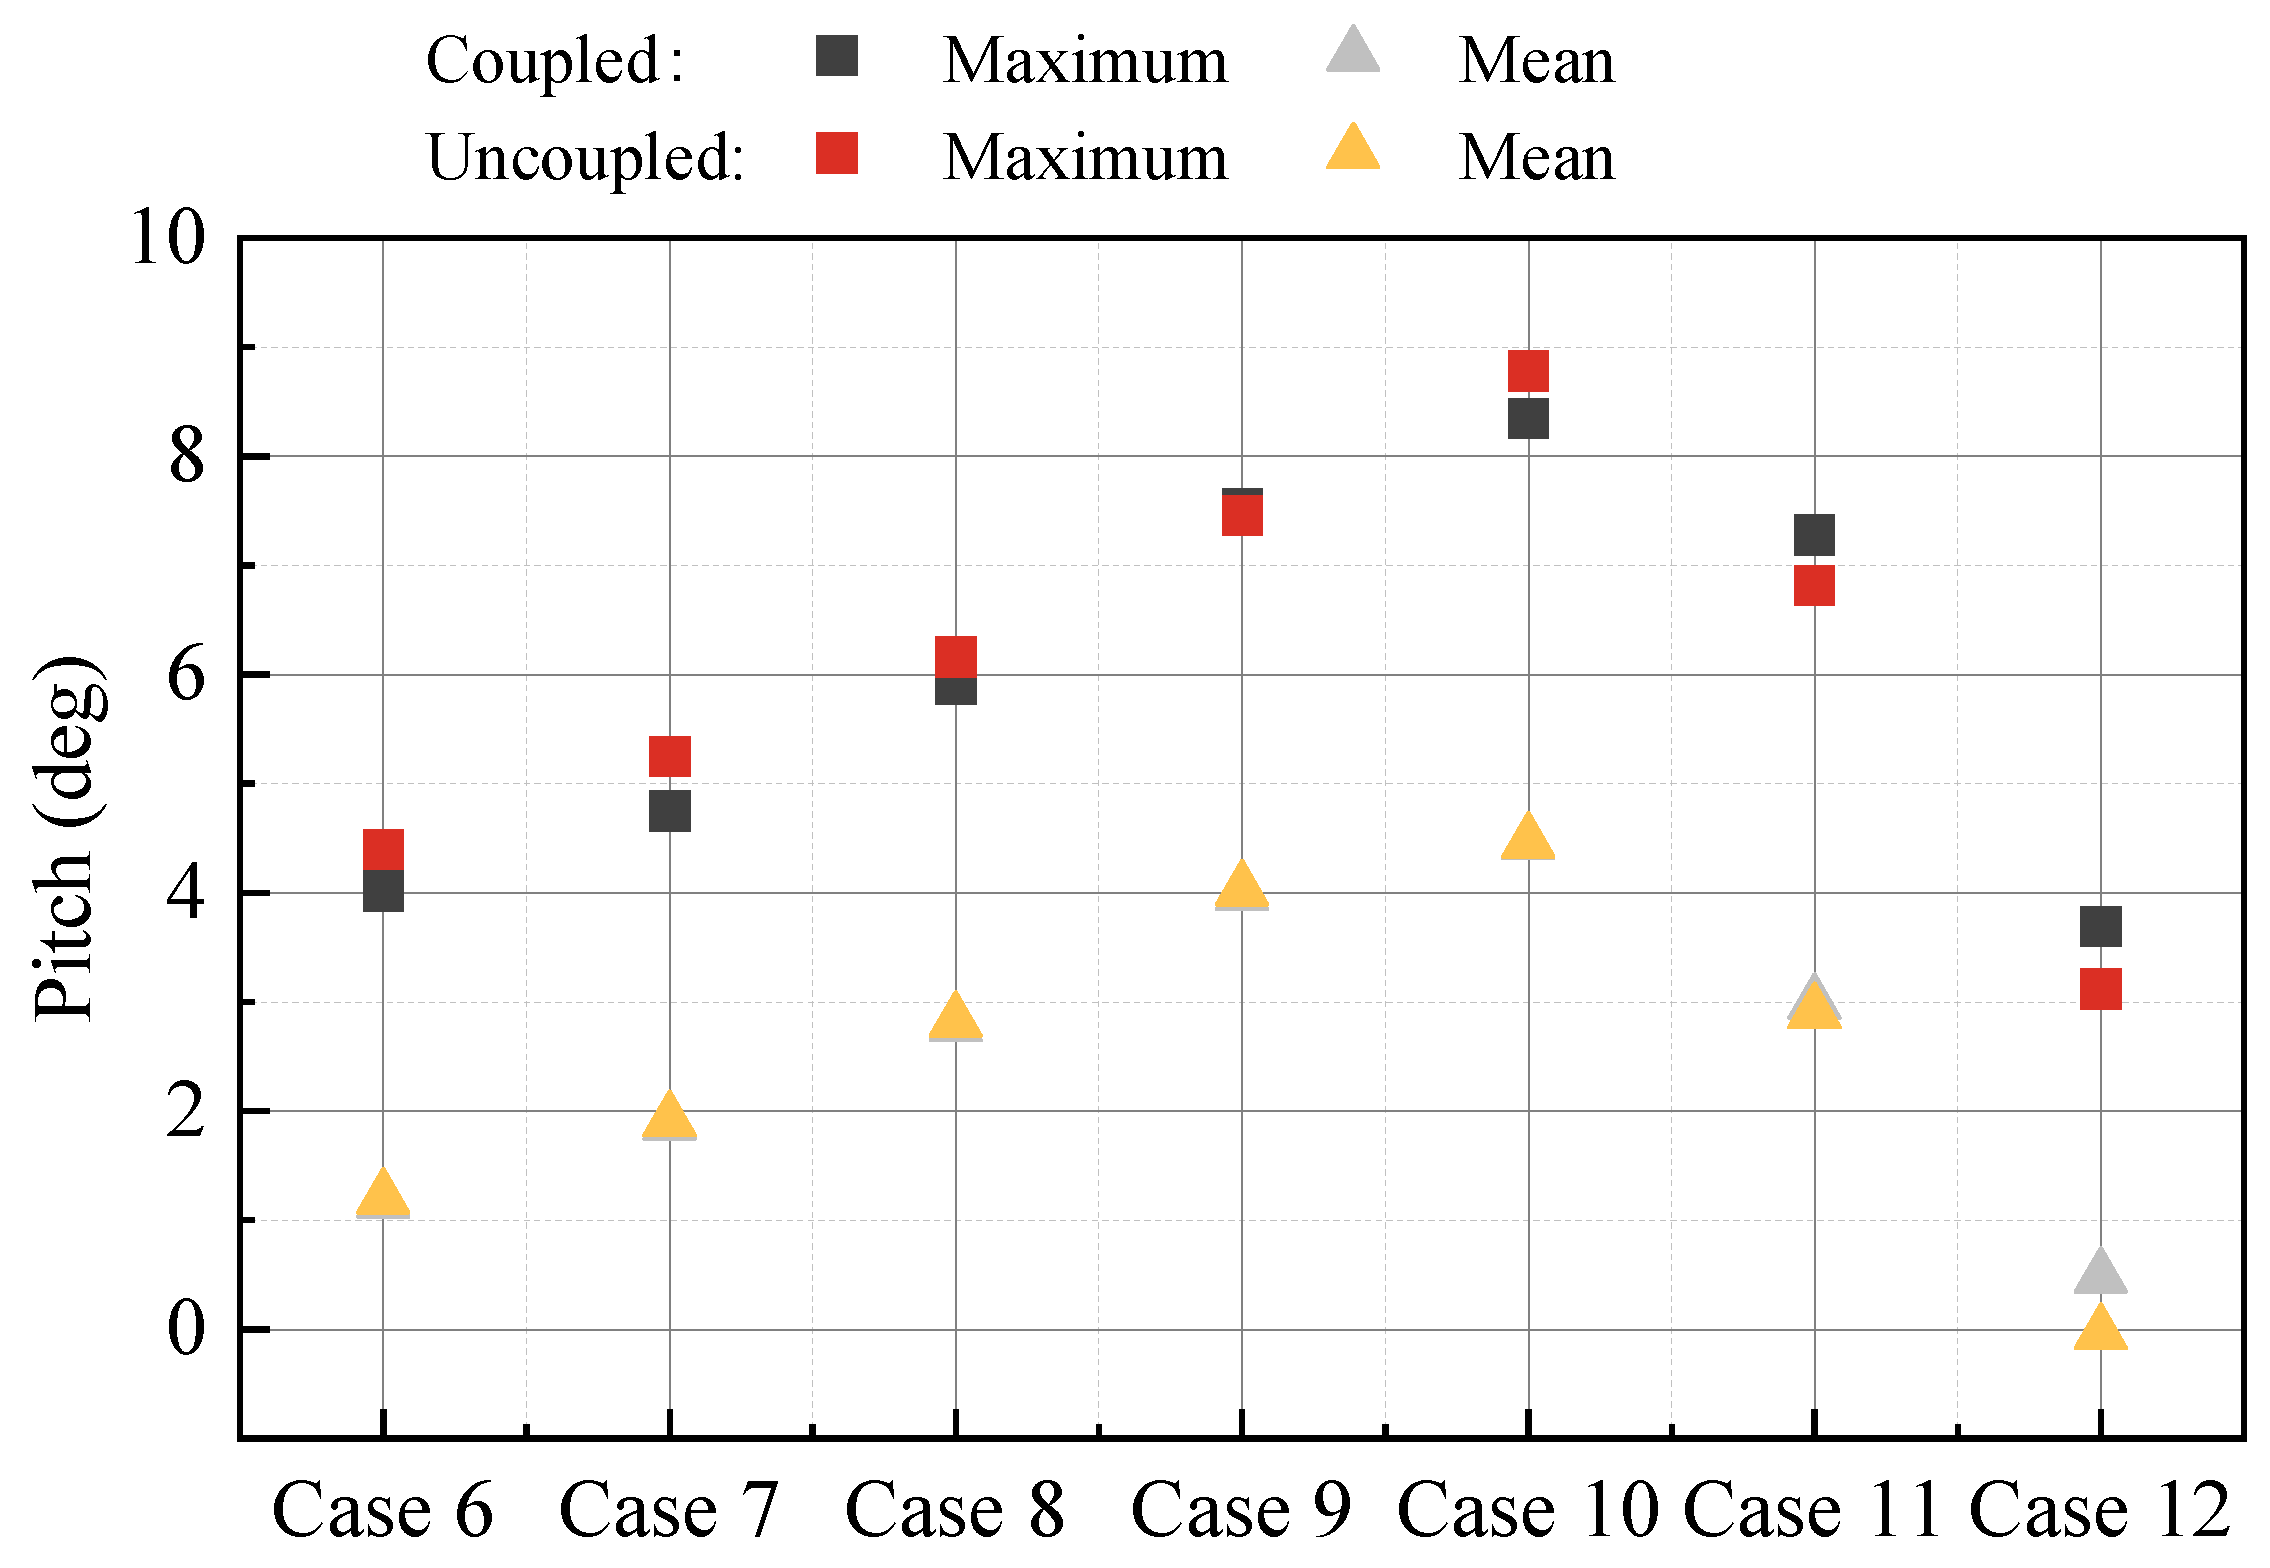
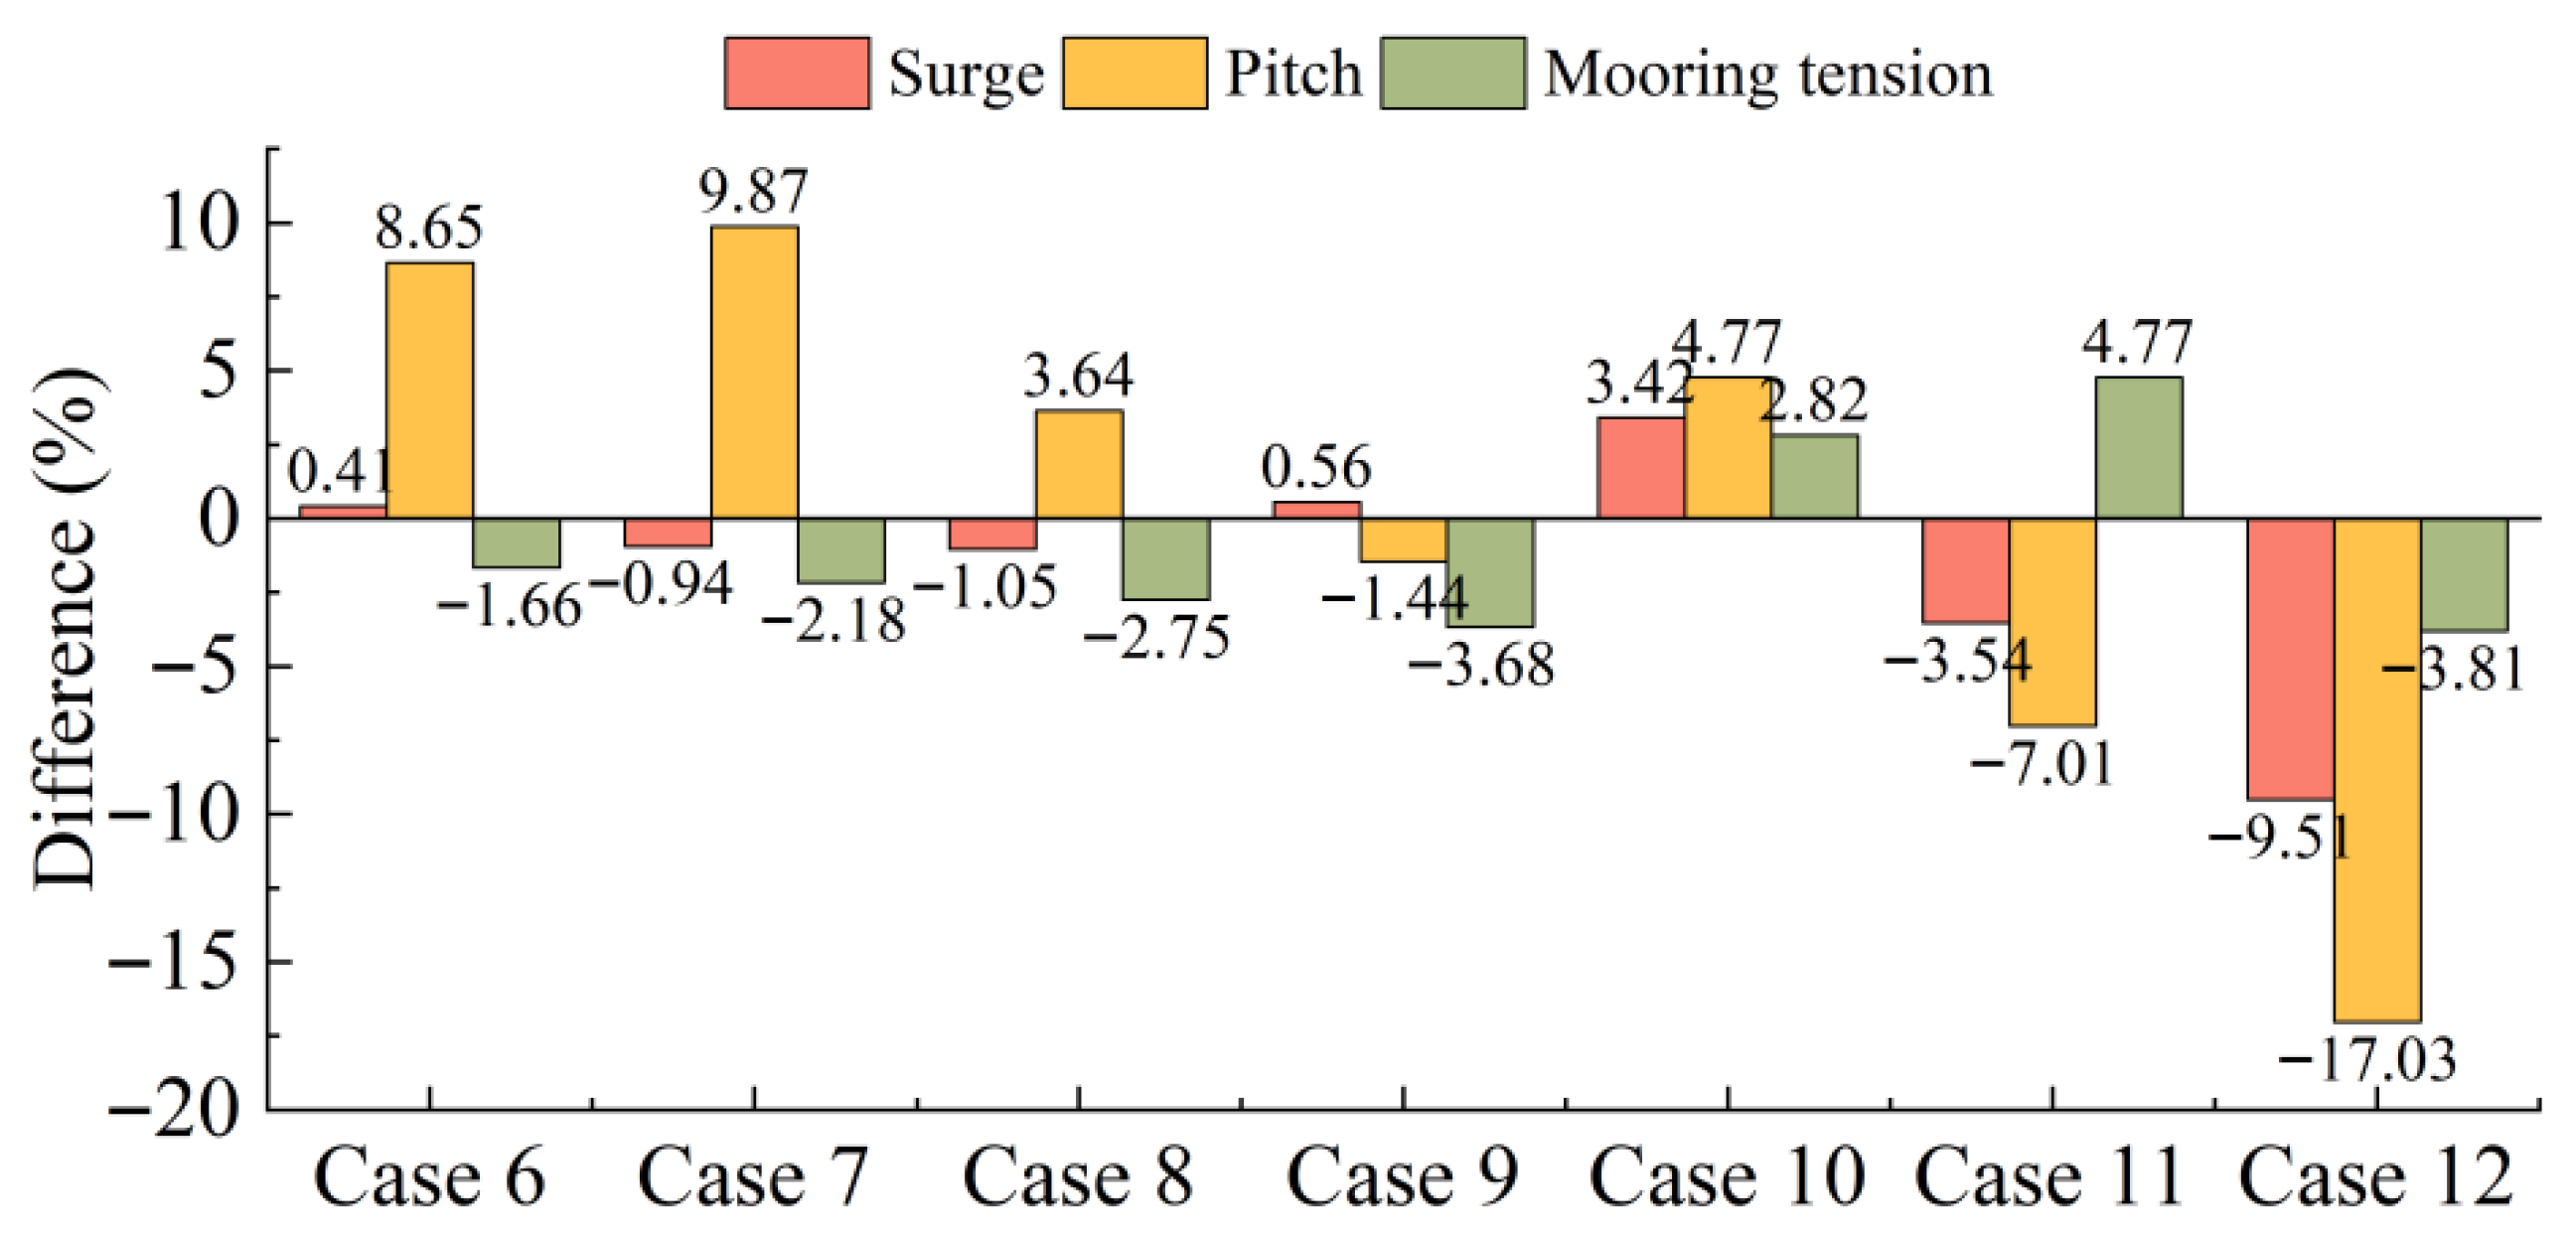
- The statistical values of mooring tension under various wind speeds for both fully coupled and decoupled analysis methods do not differ significantly, with the maximal difference in extreme values being 4.77% in this study. Thus, during the preliminary analysis and optimization design phase, the decoupled method can be utilized, enhancing computational efficiency while maintaining accuracy.
Author Contributions
Funding
Data Availability Statement
Conflicts of Interest
References
- Haselbach, P.; Natarajan, A.; Jiwinangun, R.G.; Branner, K. Comparison of coupled and decoupled load simulations on a jacket support structure. Energy Procedia 2013, 35, 244–252. [Google Scholar] [CrossRef]
- Plodpradit, P.; Dinh, V.-N.; Kim, K.-D. Coupled analysis of offshore wind turbine jacket structures with pile-soil-structure interaction using FAST v8 and X-SEA. Appl. Sci. 2019, 9, 1633. [Google Scholar] [CrossRef]
- Bae, Y.; Kim, M. Rotor-floater-mooring coupled dynamic analysis of mini TLP-type offshore floating wind turbines. In Proceedings of the 29th ASME International Conference on Ocean, Offshore and Arctic Engineering, Shanghai, China, 6–11 June 2010; pp. 491–498. [Google Scholar]
- Bae, Y.; Kim, M.; Yu, Q.; Heo, J. Aero-elastic floater-mooring coupled dynamic analysis of FOWT (floating offshore wind turbine) in maximum operation and survival conditions. In Proceedings of the 31st ASME International Conference on Ocean, Offshore and Arctic Engineering, American Society of Mechanical Engineers, Rio de Janeiro, Brazil, 1–6 July 2012; pp. 529–537. [Google Scholar]
- Xu, X.; Srinil, N. Dynamic response analysis of spar-type floating wind turbines and mooring lines with decoupled vs coupled models. In Proceedings of the 34th ASME International Conference on Ocean, Offshore and Arctic Engineering, Busan, Republic of Korea, 31 May–5 June 2015. [Google Scholar]
- Kim, H.; Boo, S.Y. Coupled and decoupled analysis of Y-Wind semi Wind Turbine Foundation. In Proceedings of the 23rd Offshore Symposium, SNAME, Houston, TX, USA, 14 February 2018. [Google Scholar]
- Yu, Z.; Wang, K.; Sun, P.; Li, C.; Sun, D.; Sun, B. Fully-Coupled and Decoupled Analysis Comparisons of Dynamic Characteristics of Floating Offshore Wind Turbine Drivetrain. Energies 2022, 15, 110639. [Google Scholar] [CrossRef]
- Hassan, H.A.; Mahmoud, M.; ElSherif, I.A.; El-latif, M.A.; Shaheen, M.M.; Elmesalamy, A.S.; Mahmoud, H. A Comprehensive Review of Numerical Simulation Techniques for Wind Turbines: From Computational Fluid Dynamics and Finite Element Analysis to Advanced Turbulence Modeling. Beni-Suef Univ. J. Basic Appl. Sci. 2025, 14, 92. [Google Scholar] [CrossRef]
- Huang, Y.; Cheng, P.; Wan, D.C. Numerical analysis of a floating offshore wind turbine by coupled aero-hydrodynamic simulation. J. Mar. Sci. Appl. 2019, 18, 82–92. [Google Scholar] [CrossRef]
- Huang, Y.; Wan, D. Investigation of interference effects between wind turbine and spar-type floating platform under combined wind-wave excitation. Sustainability 2020, 12, 246. [Google Scholar] [CrossRef]
- Xu, S.; Xue, Y.; Zhao, W.; Wan, D. A Review of High-Fidelity Computational Fluid Dynamics for Floating Offshore Wind Turbines. J. Mar. Sci. Eng. 2022, 10, 1357. [Google Scholar] [CrossRef]
- Zhang, W.; Calderon-Sanchez, J.; Duque, D.; Souto-Iglesias, A. Computational Fluid Dynamics (CFD) Applications in Floating Offshore Wind Turbine (FOWT) Dynamics: A Review. Appl. Ocean Res. 2024, 150, 104075. [Google Scholar] [CrossRef]
- Haider, R.; Li, X.; Shi, W.; Lin, Z.; Xiao, Q.; Zhao, H. Review of Computational Fluid Dynamics in the Design of Floating Offshore Wind Turbines. Energies 2024, 17, 4269. [Google Scholar] [CrossRef]
- Jonkman, J.; Butterfield, S.; Musial, W.; Scott, G. Definition of a 5-MW Reference Wind Turbine for Offshore System Development; NREL/TP-500-38060; National Renewable Energy Laboratory: Golden, CO, USA, 2009. [Google Scholar]
- de Ridder, E.-J.; Otto, W.; Zondervan, G.-J.; Huijs, F.; Vaz, G. Development of a scaled-down floating wind turbine for offshore basin testing. In Proceedings of the ASME 2014 33rd International Conference on Ocean, Offshore and Arctic Engineering, San Francisco, CA, USA, 8–13 June 2014. [Google Scholar]
- Orcina. OrcaFlex Validation. 2015. Available online: http://www.orcina.com/SoftwareProducts/OrcaFlex/Validation/ (accessed on 19 January 2016).
- National Wind Technology Center. FAST-OrcaFlex Interface. 2017. Available online: https://nwtc.nrel.gov/OrcaFlexInterface (accessed on 10 March 2017).
- Xu, K. Design and Analysis of Mooring System for Semisubmersible Floating Wind Turbines in Shallow Water. Ph.D. Thesis, Norwegian University of Science and Technology, Trondheim, Norway, 2020. [Google Scholar]
- Goupee, A.J.; Fowler, M.J.; Kimball, R.W.; Helder, J.; de Ridder, E.-J. Additional wind/wave basin testing of the DeepCwind semi-submersible with a performance-matched wind turbine. In Proceedings of the 33rd International Conference on Ocean, Offshore and Arctic Engineering, San Francisco, CA, USA, 8–13 June 2014. [Google Scholar]
- Robertson, A. OC5 project phase II: Validation of global loads of the DeepCwind floating semisubmersible wind turbine. In Proceedings of the 14th Deep Sea Offshore Wind R&D Conference, Trondheim, Norway, 18–20 January 2017. [Google Scholar]
- Tumewu, Y.; Petrone, C. Numerical simulation of the influence of platform pitch motion on power generation steadiness in floating offshore wind turbines. Environ. Sci. Sustain. Dev. 2017, 1, 92–101. [Google Scholar] [CrossRef]
- Wendt, F.; Andersen, M.; Robertson, A.; Jonkman, J. Verification and validation of the new dynamic mooring modules available in FAST v8. In Proceedings of the 26th International Ocean and Polar Engineering Conference, Rhodes, Greece, 26 June 2016. [Google Scholar]
- Robertson, A.; Jonkman, J.; Masciola, M.; Song, H.; Goupee, A.; Coulling, A.; Luan, C. Definition of the Semisubmersible Floating System for Phase II of OC4; National Renewable Energy Laboratory: Golden, CO, USA, 2014. [Google Scholar]
- Gueydon, S. Aerodynamic Damping on a Semisubmersible Floating Foundation for Wind Turbines. Energy Procedia 2016, 94, 367–378. [Google Scholar] [CrossRef]
- Yan, X.; Chen, C.; Yin, G.; Ong, M.C.; Ma, Y.; Fan, T.H. Numerical Investigations on Nonlinear Effects of Catenary Mooring Systems for a 10-MW FOWT in Shallow Water. Ocean Eng. 2023, 276, 114207. [Google Scholar] [CrossRef]
- Robertson, A. Uncertainty analysis of OC5-DeepCwind floating semisubmersible offshore wind test campaign. In Proceedings of the International Society of Offshore and Polar Engineers Conference, San Francisco, CA, USA, 25–30 June 2017. [Google Scholar]







| Water depth (m) | 200 |
| Total mass (kg) | 1.3958 × 10⁷ |
| Displacement (m3) | 1.3917 × 10⁴ |
| Draft (m) | 20 |
| CM location below SWL (m) | 8.07 |
| System roll inertia (kg·m2) | 1.3947 × 10¹⁰ |
| System pitch inertia (kg·m2) | 1.5552 × 10¹⁰ |
| System yaw inertia (kg·m2) | 1.3692 × 10¹⁰ |
| DOFs | Natural Period (s) | ||
|---|---|---|---|
| Experiment | Numerical Simulation (Fully Coupled) | Difference (%) | |
| Surge | 106.72 | 107.97 | 1.17 |
| Heave | 17.51 | 17.35 | −0.91 |
| Pitch | 32.47 | 32.76 | 0.89 |
| Items | Wind | Wave |
|---|---|---|
| Case R1 | - | JONSWAP, HS = 7.1 m, |
| Case R2 | Steady, Vhub = 13 m/s, Tmean = 719 kN |
| Maximum | Minimum | Range | Mean | Std. | |
|---|---|---|---|---|---|
| Surge (m) | |||||
| Experiment | 10.21 | −2.27 | 12.48 | 2.66 | 1.70 |
| Numerical simulation | 9.20 | −2.78 | 11.98 | 2.19 | 1.61 |
| Difference (%) | −9.892 | 22.467 | −4.006 | −17.669 | −5.294 |
| Pitch (deg) | |||||
| Experiment | 3.75 | −3.49 | 7.24 | 0.02 | 0.91 |
| Numerical simulation | 3.31 | −2.60 | 5.91 | 0.09 | 0.68 |
| Difference (%) | −11.733 | −25.501 | −18.370 | 350.000 | −25.275 |
| Mooring tension (kN) | |||||
| Experiment | 2685 | 187 | 2498 | 1234 | 189 |
| Numerical simulation | 2703 | 203 | 2500 | 1222 | 179 |
| Difference (%) | 0.670 | 8.556 | 0.080 | −0.972 | −5.291 |
| Maximum | Minimum | Range | Mean | Std. | |
|---|---|---|---|---|---|
| Surge (m) | |||||
| Experiment | 16.24 | 5.39 | 10.85 | 9.56 | 1.42 |
| Numerical simulation | 15.96 | 5.31 | 10.65 | 9.31 | 1.42 |
| Difference (%) | −1.72 | −1.48 | −1.84 | −2.62 | −0.02 |
| Pitch (deg) | |||||
| Experiment | 7.78 | 1.79 | 5.99 | 4.74 | 0.78 |
| Numerical simulation | 7.38 | 1.45 | 5.93 | 4.43 | 0.63 |
| Difference (%) | −5.14 | −18.99 | −1.00 | −6.54 | −19.23 |
| Mooring tension (kN) | |||||
| Experiment | 4086 | 308 | 3778 | 1779 | 303 |
| Numerical simulation | 3791 | 257 | 3534 | 1708 | 305 |
| Difference (%) | −7.22 | −16.56 | −6.46 | −3.99 | 0.66 |
| Maximum | Minimum | Range | Mean | Std. | |
|---|---|---|---|---|---|
| Surge (m) | |||||
| Case R1C | 9.20 | −2.78 | 11.98 | 2.19 | 1.61 |
| Case R1U | 9.19 | −2.77 | 11.98 | 2.19 | 1.61 |
| Different R1 (%) | −0.01 | −0.25 | 0.025 | 0.09 | −0.06 |
| Case R2C | 15.96 | 5.31 | 10.65 | 9.31 | 1.42 |
| Case R2U | 16.17 | 5.47 | 10.70 | 9.43 | 1.42 |
| Different R2 (%) | 1.32 | 3.01 | 0.47 | 1.33 | 0.25 |
| Pitch (deg) | |||||
| Case R1C | 3.31 | −2.60 | 5.91 | 0.09 | 0.68 |
| Case R1U | 3.36 | −2.57 | 5.93 | 0.13 | 0.68 |
| Different R1 (%) | 1.51 | −1.15 | 0.34 | 44.44 | 0.45 |
| Case R2C | 7.38 | 1.45 | 5.93 | 4.43 | 0.63 |
| Case R2U | 7.67 | 1.70 | 5.97 | 4.60 | 0.68 |
| Different R2 (%) | 3.95 | 17.09 | 0.73 | 3.77 | 7.36 |
| Mooring tension (kN) | |||||
| Case R1C | 2703 | 203 | 2500 | 1221 | 179 |
| Case R1U | 2672 | 238 | 2501 | 1222 | 179 |
| Different R1 (%) | −1.15 | 17.24 | 0.04 | 0.08 | 0.23 |
| Case R2C | 3791 | 257 | 3534 | 1708 | 305 |
| Case R2U | 3831 | 197 | 3813 | 1720 | 310 |
| Different R2 (%) | 1.06 | −23.35 | 7.89 | 0.69 | 1.55 |
| Items | Wind | Wave | |||
|---|---|---|---|---|---|
| Vhub (m/s) | TI | Hs (m) | Tp (s) | Gamma | |
| Case 2C/Case 2U | 11.4 | - | 7.1 | 12.1 | 2.2 |
| Case 3C/Case 3U | 11.4 | 0.12 | 7.1 | 12.1 | 2.2 |
| Case 4C/Case 4U | 11.4 | 0.16 | 7.1 | 12.1 | 2.2 |
| Case 5C/Case 5U | 11.4 | 0.20 | 7.1 | 12.1 | 2.2 |
Disclaimer/Publisher’s Note: The statements, opinions and data contained in all publications are solely those of the individual author(s) and contributor(s) and not of MDPI and/or the editor(s). MDPI and/or the editor(s) disclaim responsibility for any injury to people or property resulting from any ideas, methods, instructions or products referred to in the content. |
© 2025 by the authors. Licensee MDPI, Basel, Switzerland. This article is an open access article distributed under the terms and conditions of the Creative Commons Attribution (CC BY) license (https://creativecommons.org/licenses/by/4.0/).
Share and Cite
Liu, S.; Yang, Y.; Tao, T.; Huang, Z.; Jiang, W.; Chen, C.; Yan, X. Numerical Analysis of FOWT Dynamics with Fully Coupled and Decoupled Methods: A Comparative Study. Energies 2025, 18, 5817. https://doi.org/10.3390/en18215817
Liu S, Yang Y, Tao T, Huang Z, Jiang W, Chen C, Yan X. Numerical Analysis of FOWT Dynamics with Fully Coupled and Decoupled Methods: A Comparative Study. Energies. 2025; 18(21):5817. https://doi.org/10.3390/en18215817
Chicago/Turabian StyleLiu, Shi, Yi Yang, Tao Tao, Zheng Huang, Wei Jiang, Chaohe Chen, and Xinkuan Yan. 2025. "Numerical Analysis of FOWT Dynamics with Fully Coupled and Decoupled Methods: A Comparative Study" Energies 18, no. 21: 5817. https://doi.org/10.3390/en18215817
APA StyleLiu, S., Yang, Y., Tao, T., Huang, Z., Jiang, W., Chen, C., & Yan, X. (2025). Numerical Analysis of FOWT Dynamics with Fully Coupled and Decoupled Methods: A Comparative Study. Energies, 18(21), 5817. https://doi.org/10.3390/en18215817


