This section is focused on the analysis of energy conservation in liquid-solid mixtures at thermodynamic equilibrium. First, the equation of motion for the interface that results from the LEB and TEB will be solved by applying homogeneous Neumann boundary conditions. Additionally, these equations will be solved in thermally isolated systems, where the liquid-solid mixture will evolve to a pseudothermodynamic equilibrium state.
3.2.1. Thermodynamic Equilibrium: Homogeneous Neumann Boundary Conditions
Adiabatic boundary conditions have been previously applied through homogeneous Neumann boundary conditions to verify energy conservation in liquid-solid mixtures with a sharp planar interface at thermodynamic equilibrium [
7,
8,
29]. The homogeneous Neumann boundary conditions represent a mathematical device to emulate perfect thermal insulation. The thermal flux at the boundaries in contact with the surroundings was set to zero through the following boundary conditions:
Here,
is the radius of the copper-PCM interface, and
R is the radius of the insulator-PCM interface. The boundary conditions shown above represent a liquid-solid mixture without heat exchange with its surroundings. The balance of thermal energy applied to the entire system was simplified to the following equation of motion for the interface in this case:
The above equation of motion can be obtained by applying the energy balance described in
Section 2.1 with the boundary conditions shown in Equation (
42). Alternatively, Equation (
43) can be obtained through Equation (
16) by replacing
, since there was no heat exchange with the surroundings in this case. The resulting equation for the liquid-solid interface can be written in the following form:
where
and
is a dimensionless variable equal to the ratio between the solid and liquid densities. Equation (
44) has the same form as the equation of motion resulting from the local energy balance and given by Equation (
33) but with a lower latent heat
, which depends on the relative difference between the liquid and solid densities
. The resulting latent heat
can be interpreted as an apparent latent heat [
8], which will be shown to give the correct liquid-solid coexistence state at thermodynamic equilibrium.
The examples that will be shown were designed through an initial state far from equilibrium, where the exchange of thermal energy was only realized between the liquid and solid phases. The enthalpy of the initial state was chosen so that both phases coexisted at thermodynamic equilibrium and after the system evolved for a large period of time. The homogeneous Neumann boundary conditions were used to artificially isolate the liquid-solid mixture from its surroundings and guarantee that thermal energy exchange was only realized between the liquid and solid phases. The focus of this section is to demonstrate or at least illustrate that TEB applied to this type of boundary condition may reveal the inconsistency of LEB by using energy conservation in isolated systems.
The initial state of the examples shown below consisted of a liquid-solid mixture with an initial arbitrary temperature profile in the liquid and solid phases. The initial temperature distribution was chosen so that the initial enthalpy
of the PCM was equal to the enthalpy
of a saturated mixture at thermodynamic equilibrium as shown schematically in
Figure 8. Three such initial states were designed, and they are shown in
Figure 9a, where the enthalpy of the initial state intersects the coexistence curve at thermodynamic equilibrium. The examples were designed so that the radius of the liquid phase at equilibrium
was within the physical domain of the PCM
. The exact analytical expression for
could be found by using energy conservation. The enthalpy
of the initial state with arbitrary temperature profiles in the liquid and solid phase is given by
where
is the initial enthalpy per unit length of the cylindrical container with a height
L. The system was artificially isolated from its surroundings through the adiabatic boundary conditions shown in Equation (
42).
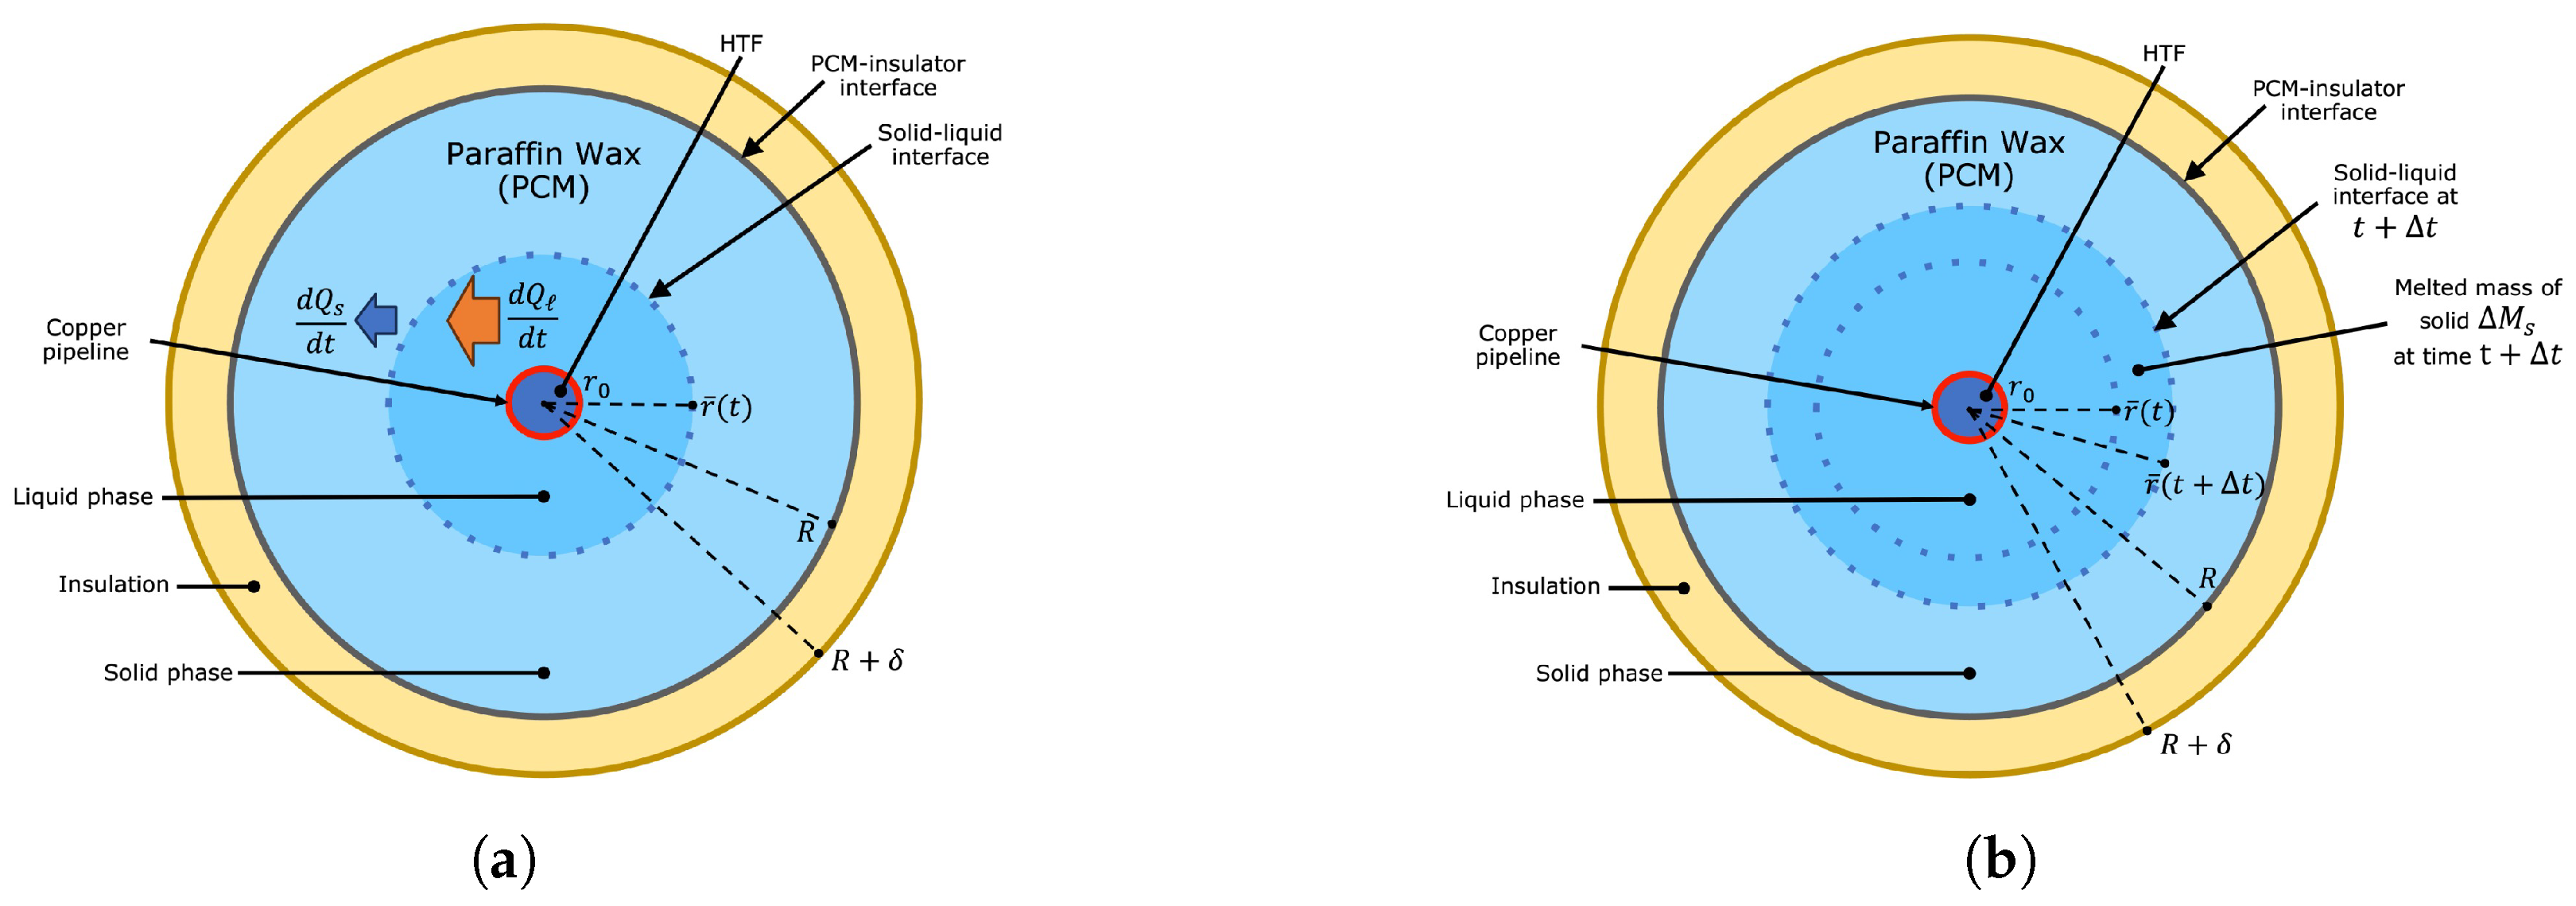
Figure 8a shows an initial state constituted by a liquid-solid mixture far from thermodynamic equilibrium. Initially, the liquid’s temperature was above the saturation point
of the PCM. Similarly, the temperature of the solid phase was below the melting point of the PCM. The mixture was perfectly insulated from the surroundings; therefore, thermal energy exchange only occurred between the liquid and solid phases. The latter implies that thermal energy is constant over time, and the system will evolve to a thermodynamic state where both phases coexist at thermodynamic equilibrium with a uniform temperature distribution equal to
, as shown schematically in
Figure 8b. Consequently, the enthalpy of the PCM in this steady state
should be equal to the initial enthalpy
given by Equation (
45). The saturated mixture illustrated in
Figure 8b represents a system at thermodynamic equilibrium where the excess volume of liquid is also at the saturation temperature
.
Figure 8b represents a scenario where the excess volume produced by the melting of solid phase is not removed. The excess volume is dispersed throughout the top surface in reality. Consequently, the thermal energy and total mass of the PCM illustrated in
Figure 8b are conserved.
The expression for the enthalpy of the liquid-solid mixture shown in
Figure 8b and obtained for a coexistence state with a uniform temperature
is described in
Appendix A and given by
where
is related to the excess volume of liquid at thermodynamic equilibrium, shown schematically in
Figure 8b. The perfect insulation from the surroundings implies that energy was conserved, and
. The result constitutes an equation for the radial position of the liquid-solid interface
and the excess volume of liquid at thermodynamic equilibrium. Although thermal energy was conserved, the liquid-solid mixture shown in
Figure 8b had the same mass as the initial state. The total mass of the PCM was constant, since the excess volume of liquid was not removed. Consequently, total mass conservation was applied to the PCM shown in
Figure 8a,b. The process is described with more detail in
Appendix A, where the following expression for the height of the excess volume of liquid at thermodynamic equilibrium is obtained:
Through substitution of Equation (
47) into Equation (
46) and applying energy conservation such that
, the following expression for the radius of the liquid phase at thermodynamic equilibrium is obtained:
where the expression for
given by the last equation represents the radial position of the interface
shown in
Figure 8b. The upper index represents the radial position at thermodynamic equilibrium in a scenario where the total energy and total mass are conserved. Additionally,
(
) represents the energy density of the saturated liquid (solid) phase. Alternatively, the saturated state shown in
Figure 8c is the result of a system that evolved from the initial state shown in
Figure 8a, where the excess volume was constantly removed until the saturated state was reached. The final state was formed by a saturated mixture with less mass. The scenario just described corresponds to a non-conservative case where thermal energy is conserved, but a fraction of the total mass is lost. The radial position of the liquid-solid front at thermodynamic equilibrium is greater than
, since the initial energy
is distributed throughout a final state with a lower mass. The removed mass of the liquid phase does not absorb thermal energy; therefore, energy conservation leads to a saturated mixture with a larger concentric shell of saturated liquid, as shown in
Figure 8.
The TEB model presented in
Section 2.1 does not preserve the total mass, since the excess volume of liquid is not considered in this approximation. The model loses mass during melting, and when the system reaches thermodynamic equilibrium, thermal energy is distributed in a system with a lower mass. The exact value at thermodynamic equilibrium of the proposed model in this work
can be obtained by removing the excess volume of liquid or making
while imposing energy conservation such that
. The process comes down to replacing
in Equation (
48) as described in
Appendix A. Consequently, the expression for the non-conservative radial position of the interface
, illustrated in
Figure 8c, is given by
Here, the difference between energy densities is related to the apparent latent heat that results from applying the TEB proposed in this work.
Table 4 shows the parameters used to elaborate the initial states illustrated in
Figure 9a. The liquid-solid coexistence curve shown in
Figure 9a was obtained by sweeping the physical domain of the PCM with values of
within the range
. The corresponding enthalpy at thermodynamic equilibrium for each possible value of
was obtained by substituting
in Equation (
46). Each filled symbol in
Figure 9a represents the expected saturated mixture for the initial states with the enthalpy
considered. The initial temperature profiles were quadratic functions of the form
, where
represents the phase. The initial radius of the liquid phase
that represents the radial position of the liquid-solid interface was set to 4 cm in all cases. The initial temperature profiles obeyed the isothermal boundary condition at the liquid-solid interface. The constants
and
were obtained through the initial temperature values at
and
and the corresponding boundary conditions given by Equation (
42). Initially, the highest temperature in the liquid phase was
, and the lowest temperature value in the solid phase was
. Sharp temperature changes at the interface were avoided through quadratic profiles, as opposed to constant profiles, in order to start with an initial state not that far from thermodynamic equilibrium and avoid ultrafast heating of the solid phase. Nevertheless, the analysis would also be valid for sharp profiles if superheating effects were neglected. Three initial states were prepared with different temperature values of
and
at the corresponding boundaries
and
. The initial enthalpy values
are shown in
Table 4 and drawn as horizontal lines in
Figure 9a.
Figure 9b–d shows the time evolution of the liquid-solid front radius
according to the TEB, given by Equation (
44), and the LEB, given by Equation (
33). The only difference between these equations of motion is the value of the latent heat when applying the homogeneous Neumann boundary conditions. The numerical solutions that show the time evolution of
were obtained by solving the heat equation in each phase, along with the equation of motion for
and under the adiabatic boundary conditions given by Equation (
42). The explicit finite difference was used, applying a forward first-order approximation to the time derivatives. The spacial derivatives in the heat equations were calculated through a second-order approximation in
. Additionally, first and fourth order approximations of the spacial derivatives in Equations (
42), (
44) and (
33), were used at each boundary. The precision of the approximation to the derivatives in Equation (
42) is incredibly important because they represent perfectly insulated systems.
Figure 9b–d represents an illustration of the inconsistencies revealed when applying the LEB at the interface, which can be amplified through the analysis of liquid-solid coexistence at thermodynamic equilibrium.
Figure 9 shows the time evolution of the interface
obtained through the TEB and LEB. The maximum simulation time was
in all cases, and
represents a dimensionless time used in
Figure 9b–d. The order of approximation in the spacial derivatives is labeled in each case. First- and fourth-order approximations were used when applying the TEB solution to illustrate improvements with the order of approximation. Additionally, the value of
was greatly underestimated through the LEB at the interface in all cases. Although in all cases shown in
Figure 9, the asymptotic behavior of
was closest to
when using a fourth-order approximation, the effect is clearer in
Figure 9b. The difference between
and
given by Equation (
49) is shown in
Table 5 for the three cases. The relative percent difference (RPD) between
and
, shown in
Table 5, had its lowest value, according to the TEB model, when using a fourth-order approximation. The difference was quite small in all cases, and it can be attributed to numerical errors.
The RPDs shown in
Table 5 for the radius of the liquid phase
was obtained as follows:
Here,
is given by Equation (
49) and represents the interface position at thermodynamic equilibrium.
Table 5 also shows the deficiencies of each model and type of approximation.
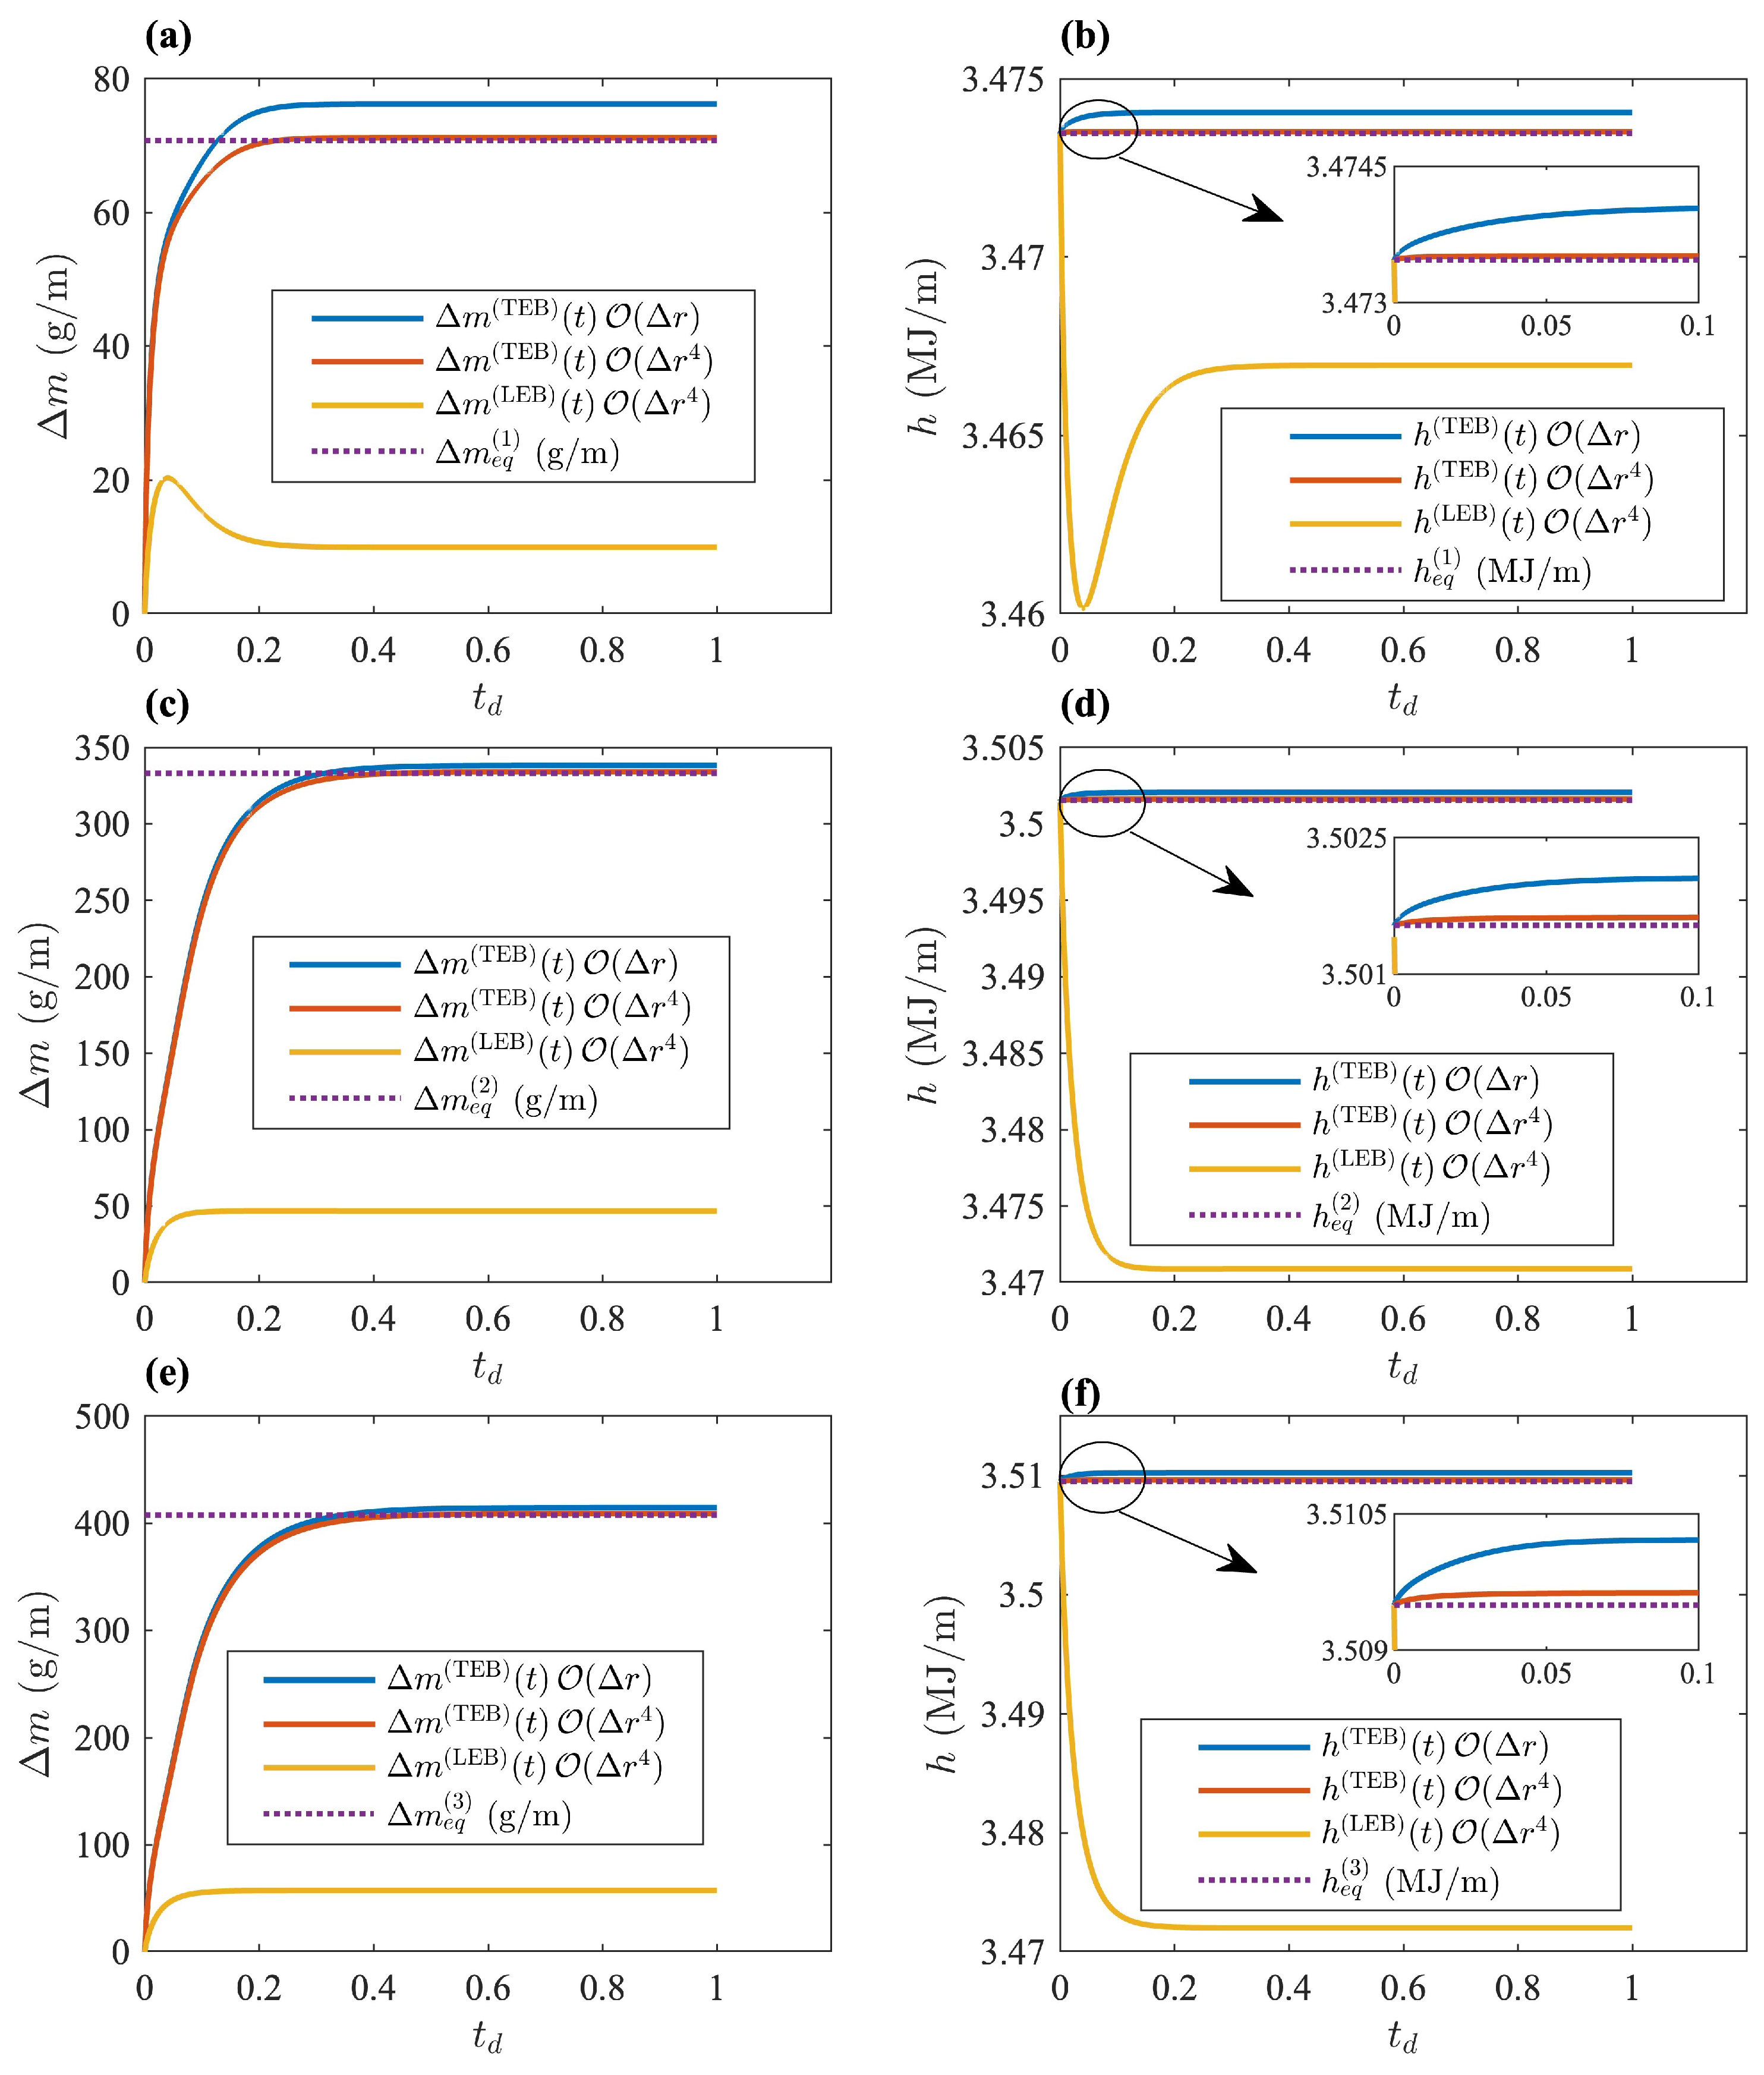
Figure 10 shows the time evolution of the total enthalpy
and the lost mass of liquid
. Here,
represents the lost mass per unit length and is defined as
, where
is the mass in kilograms at some time
t between the initial state and the steady state at thermodynamic equilibrium. The enthalpy is extremely important because this state variable allows verifying energy conservation. The total enthalpy was obtained through numerical integration of the temperature profiles as follows:
Tracking changes in this variable allowed verifying the following aspects: energy conservation, the effectiveness of artificial insulation given through the boundary conditions and order of approximation, the model’s performance, and the consistency of the temperature profiles. The TEB approach was consistent with energy conservation, as observed in
Figure 10b,d,f. The order of approximation was also consistent with energy conservation in all cases, since
was closer to the initial enthalpy of the system when using a fourth-order approximation.
Figure 10b,d,f also helps realize that when applying an LEB at the interface, energy was not conserved.
Finally, the time evolution of the lost mass
is shown in
Figure 10a,c,e. The exact value at thermodynamic equilibrium was obtained by subtracting the total mass at any time
t from the initial mass of the liquid-solid system
, where
is the initial mass per unit length
. The exact expression for
at equilibrium is given by
where
is given by Equation (
49). The LEB at the interface was observed to underestimate the value of
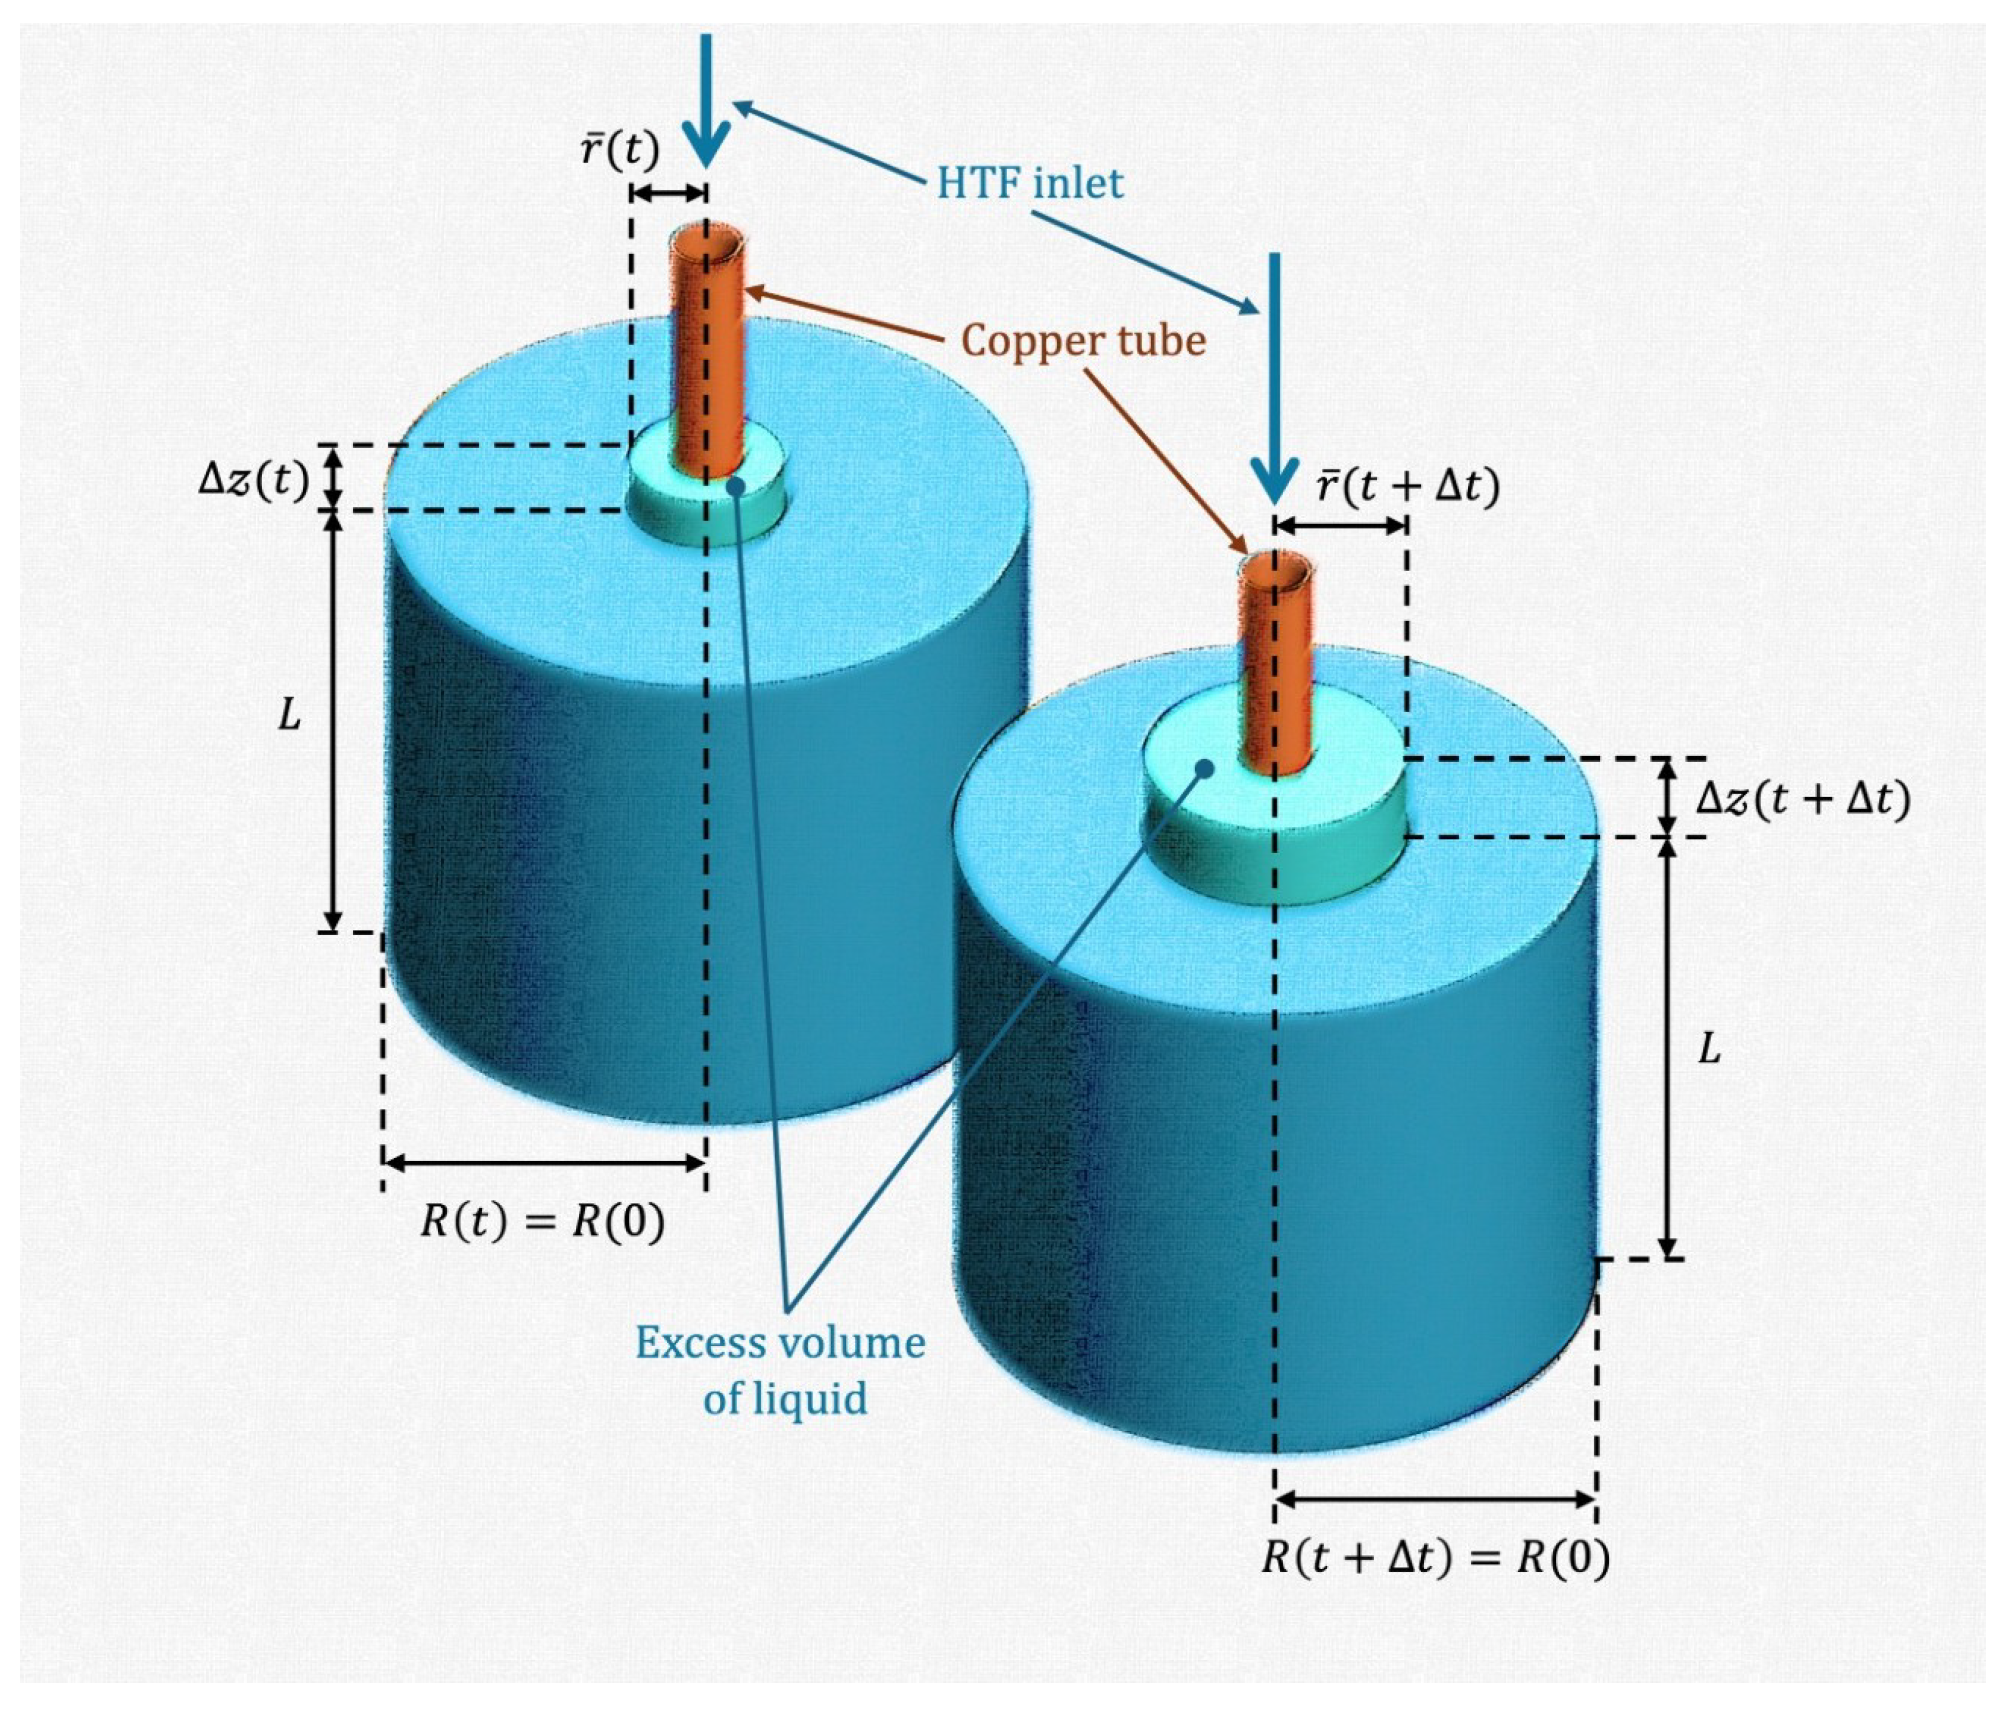
in all cases, as expected. Additionally, it is important to mention that both models (TEB and LEB) are non-conservative. Volume changes during the melting process were observed as excess volume of liquid and illustrated schematically in
Figure 1. The LEB and TEB models assume that excess volume is being removed continuously during the melting process. Consequently, neither approximation conserves mass. The difference relies on energy conservation, as illustrated in
Figure 10a,c,e.
3.2.2. Pseudothermodynamic Equilibrium: Thermal Insulation
The homogeneous Neumann boundary conditions constitute an artificial method for emulating perfectly insulated systems, where thermal energy exchange between the system and its surroundings is not present. In reality, such conditions do not exist. In this section, the adiabatic boundary conditions will be replaced by introducing an insulating material. The thermal conductivity of the insulator will be reduced in a series of numerical experiments to produce a liquid-solid mixture as close as possible to a saturated state close to equilibrium. Liquid-solid coexistence close to thermodynamic equilibrium is extremely difficult to reproduce experimentally, as mentioned in
Section 1. Open and closed systems in nature are generally far from thermodynamic equilibrium. In this work, we create a closed system with thermal insulation that helps create a simple picture of how coexistence close to equilibrium might be realized. Additionally, the radius of the liquid-solid front close to equilibrium in a coexistence state is a unique solution and does not depend on the type of heat transfer mechanism (e.g., conduction, natural convection, or radiation) present during the transition from an initial state far from equilibrium to the final state close to equilibrium. Consequently, pseudothermodynamic equilibrium becomes a key concept for validating the TEB model proposed in this work. The pseudothermodynamic equilibrium state will also be used as another way to validate the following aspects:
The performance of the TEB and LEB models;
Behavior close to equilibrium and shown through Equation (
49);
The validity of the contact condition at the insulator-PCM interface, which is incredibly important for comparison with the experimental results;
Comparisons with the solutions obtained when using the adiabatic boundary conditions just discussed.
The TEB model proposed in this work must be adapted to this problem by performing energy balancing in a system consisting of insulator-liquid, liquid-solid, and solid-insulator interfaces. The heat storage unit constitutes an air void with a radius
, an inner layer of insulating material with a thickness
, the PCM confined between
and
, and an outer layer of insulating material with the same thickness
. The inner layer of insulating material was placed between the air void and the PCM. In this case, the exchange of thermal energy with the surroundings should be considered. The energy balance must be performed as discussed in
Section 2.1 but while adding the energy change of the inner layer just mentioned. The change in thermal energy at the inner layer is given by
Here,
represents the temperature distribution of the inner insulator. By performing the time derivative of this energy in the same manner as that discussed in
Section 2.1, the change in thermal energy at the inner layer is given by
Similarly, the thermal energy change at the outer layer of insulating material is given by
where
, represents the temperature profile within the outer layer of insulating material. The total change in thermal energy in this case was obtained by adding Equations (
5), (
7), (
54) and (
55). The result must be equal to the net amount of heat exchanged between the insulating layers and the surroundings as follows:
The first term on the right-hand side of the last equation represents the thermal energy released by the liquid phase through the inner layer to the air void. Similarly, the second term on the right-hand side represents the thermal energy released by the solid phase through the outer layer and to the surroundings. The energy balance in this case was obtained as
, and this is given by the following equation of motion for the liquid-solid interface:
with
Furthermore, the net thermal fluxes at the liquid-solid interface
and at the solid-insulator interface
have been defined through Equations (
9) and (
14), respectively. Note that the temperature profile of the insulator in Equation (
14) should be replaced by
. Following the same procedure discussed in
Section 2.1, the contact condition at the insulator-liquid interface must be added. The extra contact condition is quite similar to Equation (
23), and in its finite difference form, it is given by
Here,
is the number of spacial nodes within the inner layer of the insulating material. Additionally, during the melting process, the shell of PCM surrounding this layer will be in its liquid form. Similarly, the PCM surrounded by the outer layer of the insulating material, shown in Equation (
23), will be in its solid state. Equations (
23) and (
59) represent a set of equations that describe how the temperature must change at the solid-insulator and liquid-insulator interfaces. The contact conditions in the special case of
are necessary aspects of the model to reproduce states close to thermodynamic equilibrium. Consequently, it is important to analyze the solutions in this type of pseudothermodynamic equilibrium scenario to validate the contact conditions proposed in this work.
The example to be analyzed was initially far from thermodynamic equilibrium and consisted of a liquid-solid mixture with arbitrary quadratic temperature profiles. Initially, the temperature profiles were of the same type previously discussed. The system also consisted of an outer and inner layer of insulating material where the thermal conductivity
was fine-tuned. The thickness of each layer was set to
. The initial temperature profiles of each insulating layer were linear. The ambient temperature was constant and set to
°C. The ambient temperature represents the temperature of the air void surrounded by the inner layer and the temperature of the surrounding air in contact with the outer layer. The inner and outer surfaces at
and
would be subjected to the following isothermal boundary conditions:
The values of
and
were also used in this case. The initial temperature values at the insulator-liquid interface and at the solid-insulator interface were
°C and
°C, respectively. Furthermore, the initial position of the liquid-solid interface was
. Consequently, using the quadratic temperature profiles described previously, the initial enthalpy of the liquid-solid mixture obtained from Equation (
45) was
. The value of
just mentioned corresponded only to the enthalpy of the PCM. The thermal energy of the insulating layers was not considered in
because for sufficiently low values of
, the total enthalpy of the system should be close to
. The reason for this is that when
, heat transfer within the insulating layers is negligible, and the enthalpy changes in the insulating material
.
The numerical examples shown in
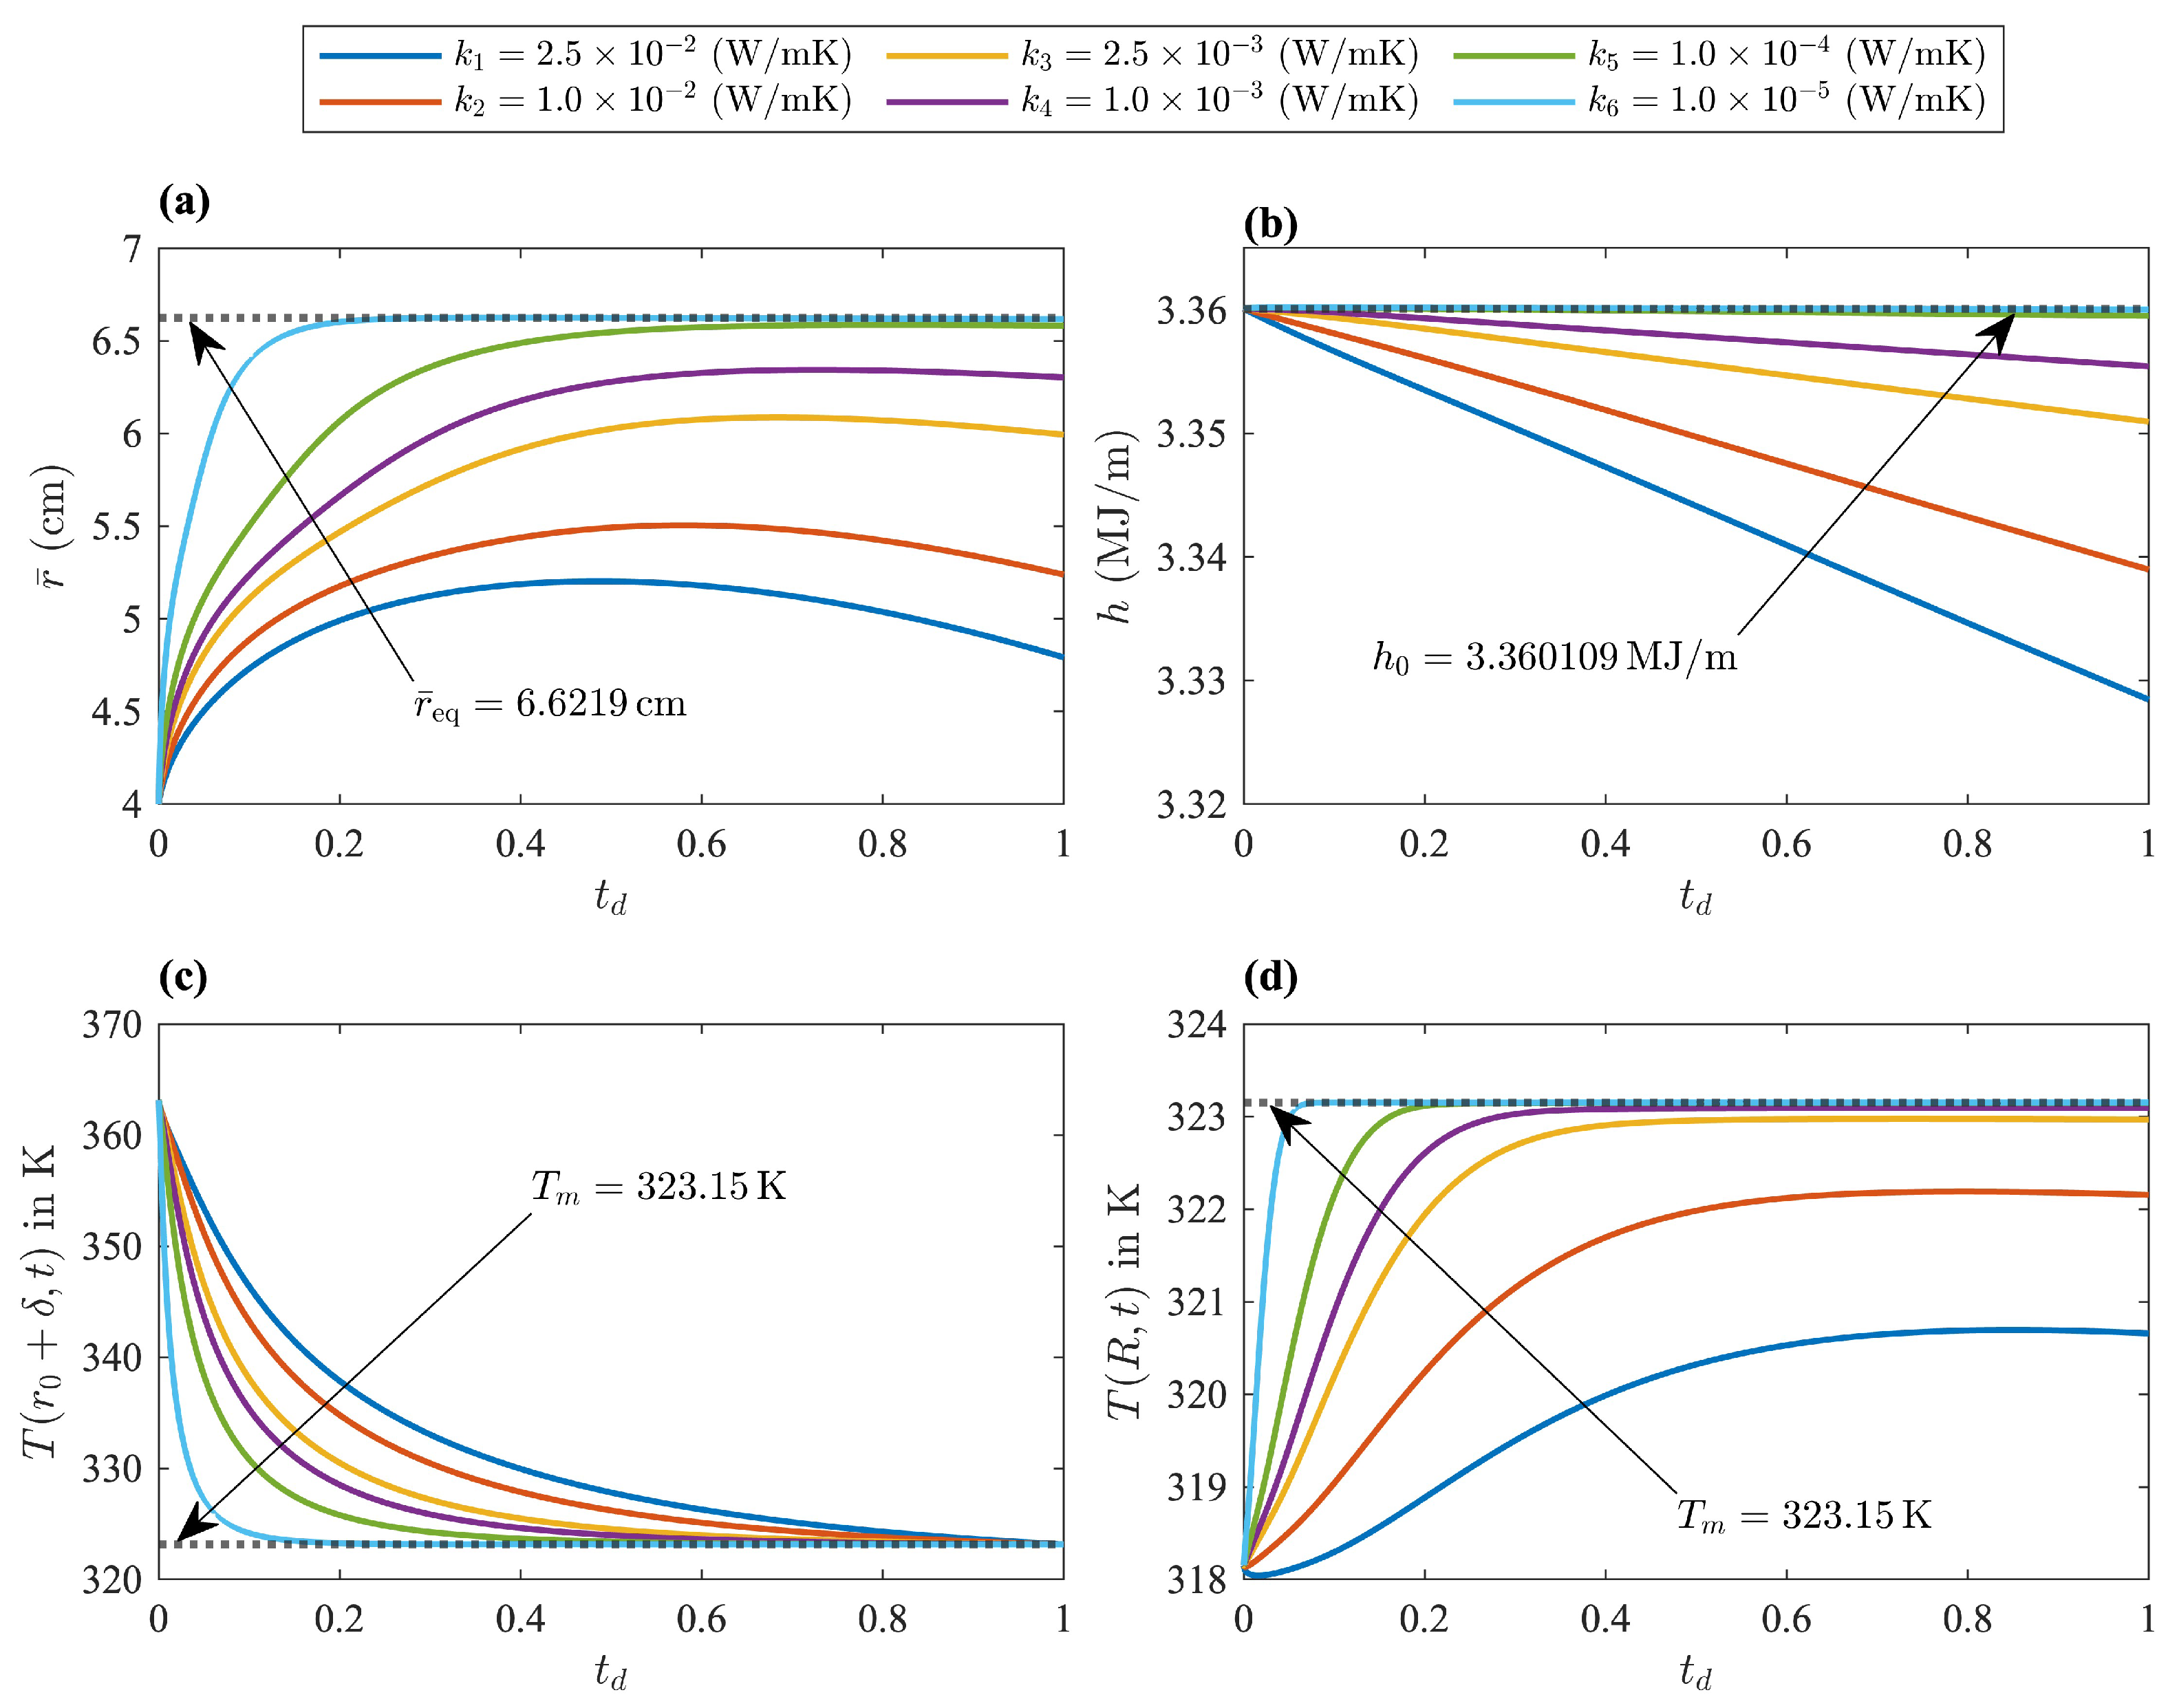
Figure 11 represent a system where the liquid and solid phases were initially far from equilibrium, and the initial enthalpy was the same in all cases. The thermal conductivity of the insulating layers was the only parameter modified in these examples. The real thermodynamic state in all of these examples was the PCM in its solid state at ambient temperature. However, an intermediate state rather close to a saturated mixture at equilibrium could be achieved with sufficiently low values of
. Starting with a relatively high conductivity value of
, it is evident that heat exchange with the surroundings was significant. The PCM was losing too much heat through the inner and outer layers. The maximum amount of liquid phase was quite far from its equilibrium value, which can be appreciated through the maximum displacement of
in
Figure 11a. The loss of thermal energy is also evident in
Figure 11b. In this case, liquid-solid coexistence close to thermodynamic equilibrium could not be realized. Furthermore, the temperature at the insulator-liquid interface
was not asymptotically approaching the saturation temperature of
, as observed in
Figure 11c. The process was stopped at
when the liquid at this interface reached the saturation temperature
. Consequently, beyond this time value, the liquid in contact with the inner layer would transition to its solid phase. The new scenario would be a PCM with an additional solid-liquid interface close to the inner layer and moving outward. Eventually, the system would evolve to its true equilibrium state with the surroundings.
The dimensionless time shown in
Figure 11, was obtained as
, where
represents the time when the insulator-liquid interface was cooled down to the saturation temperature of the PCM. Lower values of
, translate to larger values of
as the PCM closes in on the desired state, with a saturated mixture at thermodynamic equilibrium, where
is given by Equation (
49).
Figure 11c illustrates how the temperature of the insulator-liquid interface developed a stronger asymptotic-like behavior with decreasing values of
. Additionally,
Figure 11b shows a mixture getting closer to its saturated state, which is revealed by decreasing enthalpy changes. Finally, the validity of the contact conditions and the TEB model proposed in this work can be established through the value of
given by Equation (
49) and for sufficiently low values of
. Nevertheless, even with extremely low values for
, the saturated state obtained in this example does not represent the true equilibrium.
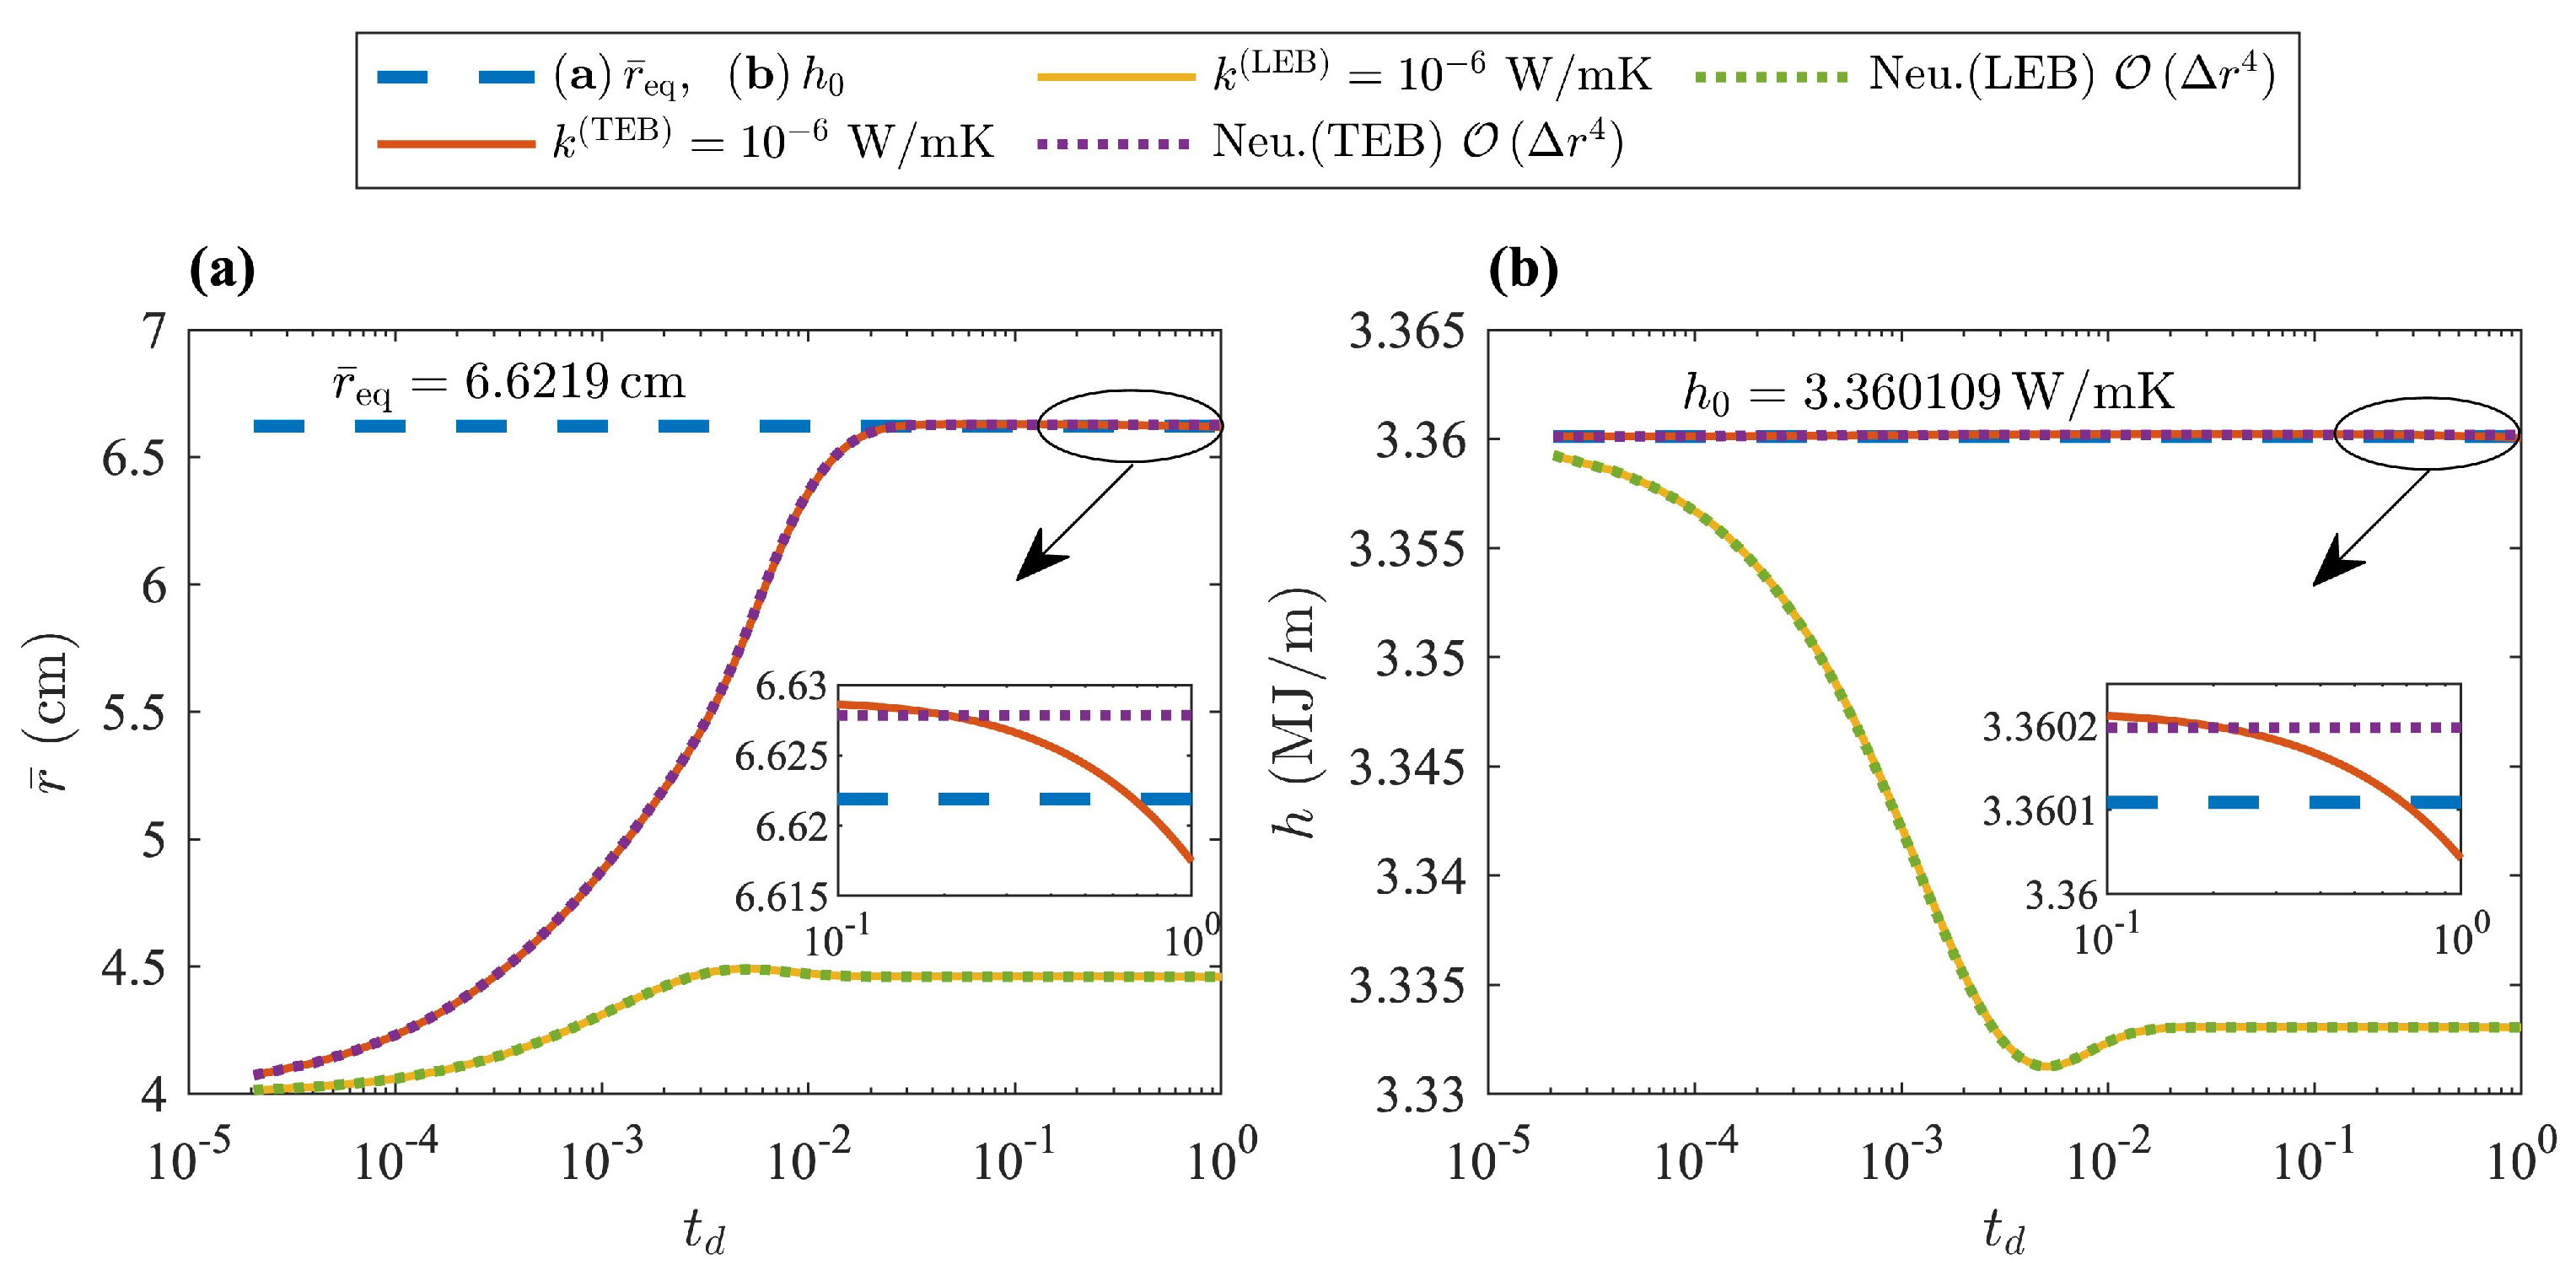
Figure 12 is an illustration of the TEB and LEB solutions applied to insulated systems and using the lowest thermal conductivity
considered in this work. The figure is used to illustrate that in these types of systems as well, the deficiencies of the LEB were amplified. Although the system would eventually evolve to its true equilibrium state, the behavior was quite similar to the system with adiabatic boundary conditions previously discussed. The behavior was not identical for two reasons:
Table 6 shows the relative percent difference between the values of
and
, as well as the exact values at thermodynamic equilibrium for each thermal conductivity
considered in these examples. The data shown in
Table 6 were obtained from the solutions of the TEB model applied to an insulated system and given by Equations (
57), (
59) and (
23). The equation of motion for the liquid-solid interface and contact conditions were solved through an explicit finite difference scheme and using a fourth-order approximation of the spacial derivatives. The enthalpy change
represents the thermal energy lost by the PCM.
Table 6 also helps illustrate the concept of pseudo-thermodynamic equilibrium in this problem through the asymptotic growth in
with decreasing values for
. Furthermore, it is evident that the temperature at the solid-insulator interface
shown in
Table 6 would never reach the saturation temperature of the PCM for
. The system released some thermal energy to the surroundings even if
, since the real thermodynamic equilibrium in this example consisted of a PCM in its solid phase at ambient temperature and below
.
Figure 13 provides a visual representation of the temperature profiles in insulated systems with (a)
, (b)
, and (c)
. In this example, the initial temperature distribution in each layer was changed from a linear profile to a constant value of
°C.
Figure 13 helps qualitatively appreciate the expected behavior of the temperature field with decreasing values for
. Additionally, the temperature distribution in the PCM unit offers some insight on how thermal energy is lost to the surroundings during the cooling process. Specifically, during the first
of the cooling process, the effect of improved insulation was clearer, as observed in the first column of the temperature profiles shown in
Figure 13. Finally, the effect of the contact conditions when
can be clearly appreciated in the last row of
Figure 13. Here, the deep navy blue color observed across the entire thickness of both layers shows how
was practically constant and equal to 40 °C when
. In contrast, the boundaries between the layers and the PCM became blurred and hotter (light blue) as time progressed.

