Article

Electromagnetic Modeling Framework of Thermal Systems for Real-Time Hardware-in-the-Loop Simulations

by
Giambattista Gruosso
* and
Enrico Spateri
Dipartimento di Elettronica Informazione e Bioingegneria, Politecnico di Milano, 20133 Milan, Italy
*
Author to whom correspondence should be addressed.
Energies 2025, 18(21), 5752; https://doi.org/10.3390/en18215752 (registering DOI)
Submission received: 16 September 2025 / Revised: 24 October 2025 / Accepted: 29 October 2025 / Published: 31 October 2025
(This article belongs to the Special Issue Progress in Electromagnetic Analysis and Modeling of Heating Systems)

Abstract

This paper presents a methodology for embedding coupled electromagnetic–thermal finite element (FE) models into a hardware-in-the-loop (HIL) platform to enable real-time prototyping of control strategies for advanced heating systems. The framework combines frequency-domain electromagnetic modeling and time-domain thermal simulation within a physics-based digital twin executed on real-time hardware. Electromagnetic simulations generate impedance maps as functions of coil–workpiece positions, which are parameterized into equivalent lumped circuit models for efficient converter-level simulation. In parallel, the thermal FE solver operates directly on the hardware simulator, accelerating the computation of the heated object’s energy transfer and thermal dynamics. The approach is validated through an induction-heating case study, demonstrating that integrating finite element modeling into a real-time simulator enables the realistic evaluation of energy conversion, control algorithms, and detection logic in complex electrothermal systems.

1. Introduction

Electro-thermal behavior plays a crucial role in many industrial and manufacturing processes, where temperature dynamics strongly influence product quality, material properties, and overall efficiency. Accurate thermal control is especially important for systems with significant thermal inertia, as temperature overshoot or uneven heating can lead to defects or wasted energy. Hardware-in-the-Loop (HIL) platforms have emerged as an essential tool for studying and validating control strategies under realistic operating conditions, enabling researchers to test algorithms on real hardware while interfacing with high-fidelity simulations of electro-thermal systems. This approach has been applied across a range of domains, from manufacturing and processing to power electronics and building thermal management. For instance, induction-heated molds for polymer foaming have been examined using reduced-order models in real-time HIL to evaluate discrete PID control strategies under high-inertia conditions [1], illustrating how such platforms can accelerate the development of robust thermal control solutions. Similar approaches have shortened development cycles and improved control design for temperature regulation in supercritical plastic extrusion [2] and thermoforming applications [3]; Beyond polymer processing, HIL methods have been widely adopted in other energy and thermal management fields: heat pumps and combined heat and power systems have been validated in testbeds to assess dynamic behavior and optimize control for smart-grid integration [4]; electric-thermal photovoltaic cell models have been integrated into power-HIL simulations to emulate PV systems under varying conditions [5]; real time platforms have refined air-to-water heat pump controls using virtual building models and real weather data, supporting more efficient HVAC system development [6]; and FPGA-based real time simulator have enabled accurate, real-time verification of high-power inverter performance, highlighting the versatility of HIL techniques across diverse electro-thermal applications [7].
Given this broad adoption of hardware simulators for electro-thermal applications, its relevance becomes particularly evident in the development of induction heating (IH) systems [8], where precise thermal and electromagnetic behavior must be understood before implementation. During the design phase, an induction heating (IH) system is evaluated from multiple perspectives [9,10]. The coil’s electromagnetic–thermal behavior is analyzed and optimized using numerical methods [11,12,13,14]. Then, circuit simulations with constant parameters help to select the converter, control strategy, and sensing approach. After a preliminary analysis, the realized IH system undergoes trials and experimental tests; however, resonant converters in IH systems can behave unpredictably under undesired conditions. Premature experimental testing may lead to failure. A fast and accurate emulation method can help predict converter behavior under the designed control strategy before real-world deployment. Single coils are outdated, and multiple coils can improve the uniformity of heat distribution in cookware [15,16]. The most advanced cooktops are made with flexible coils that cover the entire cooking surface [17], as presented in Figure 1. The presence of multiple coils requires improved converter topologies, control algorithms, and load identification techniques. Several challenges arise when defining a control algorithm. Primarily, the regulation strategy must ensure safe operational switching of the converter across different cooktop positions. Moreover, the control strategy must be robust even when the coupling between the cookware and the cooktop is subjected to rapid transitions (i.e., when a pan is removed from the cooking surface) [18]. The control algorithm must ensure zero-voltage switching (ZVS) during the switching period to avoid spike currents that increase the risk of IGBT failure. Finally, device efficiency involves accurately detecting the position of the cookware [19]. For each condition, the sensing strategy must correctly coordinate coil activation. For these reasons, the control strategies should be evaluated on a physics-based real-time digital twin before the experiments.
This paper investigates a methodology for modeling and emulating an IH system in real-time simulators for hardware-in-the-loop testing and rapid control prototyping [20]. As a starting point, the IH system is fully modeled using the finite element method. Then, a methodology is proposed to integrate the electromagnetic and thermal dynamic behavior using two different approaches. The thermal behavior is computed by solving the finite element problem in real-time hardware. The integration of the electromagnetic behavior is more cumbersome. Some significant electromagnetic results obtained under different load conditions are extracted from numerical electromagnetic simulations and incorporated into the real-time simulation as equivalent electrical lumped parameters. The electromagnetic frequency-domain results are integrated into fast lumped parameter simulations to analyze the electrical time transient of the IH system. Some lookup tables store the lumped parameters, interpolating the equivalent inductance and resistance for each position of the cookware over the cooktop. The equivalent lumped parameters for a multi-coil cooking surface (Figure 1) significantly depend on the presence of the pot and its position on the cooking surface. The variable electromagnetic lumped parameters are employed in a multi-output resonant converter implemented in a Hardware-In-the-Loop (HIL) environment. The HIL is used for prototyping the control strategy and for tuning the pot presence-sensing system. The proposed setup can be used for developing new converter topologies, assessing the converter safety, and developing new control and sensing strategies.
The Section 2 introduces the principles of eddy current-based heating; the Section 3 discusses how the equivalent lumped parameters are extracted, integrated and exploited in the real-time simulation, with a particular emphasis on the resulting impedance maps; the Section 4 analyzes how the thermal problem is embedded and solved in the real-time simulator; the Section 5 presents the experimental setup and the control algorithm tested with the hardware in the loop, while the results of the oscilloscope are dealt with in the Section 6.

2. The Eddy Current-Based Heating

In static induction heating systems, an alternating current flowing through a coil produces a changing magnetic field. By Faraday–Neumann’s law, variations in this magnetic field create a circulating electric field linked to the changing magnetic flux. When this flux passes through a conductive material, the induced electric field drives swirling eddy currents. As these currents flow through the material’s electrical resistance, heat is generated. This process is called induction heating. If the material’s characteristics strengthen the induced fields, the heating effect is amplified.
The Maxwell equations govern the electromagnetic behavior of IH systems
× H = J × E = δ B δ t · B = 0 · E = ρ ϵ 0 ,
where J denotes the current density responsible for producing the magnetic field, while E represents the electric field, H is the magnetic field and B is the induced field. ρ and ϵ 0 are, respectively, the resistivity of the considered region and the permittivity of free space. The Ampere term has been omitted, as it is negligible for this specific (low to medium) frequency application (50 Hz–30 kHz). The induction field B is associated with the magnetic field H through a nonlinear constitutive relation for magnetic permeability μ ( · ) that varies with the temperature
B = f ( | | H | | , T ) H | | H | | = μ ( H , T ) H = 1 ν ( H , T ) H .
A formulation suitable to solve the electromagnetic problem in the finite element domain is the A J formulation, based on the prescribed current density J 0 and the magnetic potential A defined as × A = B .
The electrical field is related to the magnetic potential through the Faraday–Neumann–Lenz equation
× E = δ δ t × A .
Considering an invariant scalar field Φ , the current density is related to the magnetic potential via its constitutive relation
J = σ ( T ) E = σ ( T ) δ A δ t σ ( T ) Φ .
Here, Φ corresponds to the prescribed current density and J 0 and σ ( T ) represent the electrical conductivity of the workpiece. It is important to note that the material’s resistivity varies with the workpiece temperature. Within the range 0 °C–500 °C, this behavior can be accurately approximated using the linear relationship
σ ( T ) = σ r o o m 1 ( 1 + α T T α T T r o o m ) ,
where σ r o o m denotes the resistivity at room temperature, while α T is the thermoelectric coefficient. In addition, the current density is required to be divergence-free,
· σ ( T ) Φ = 0 .
Equation (4) can be inserted into Ampere’s law. To obtain the electromagnetic behavior for a given coil geometry and excitation current, the following system of partial differential equations is solved for the magnetic potential (using Cartesian coordinates array r ),
× ( ν ( | H ( r ) | , T ) ) × A ( r , t ) ) + J 0 ( r s , t ) + σ δ A ( r , t ) δ t = 0 ρ c c s δ T ( r , t ) δ t = · ( k c T ( r , t ) ) + P ( r s , r , t ) .
Here, J 0 ( r s ) defines the imposed current density applied to the windings at location r s , while A ( r , t ) denotes the resulting magnetic vector potential in the whole space defined by r . The expression σ δ A ( r , t ) δ t corresponds to the eddy currents generated within the material. The workpiece is heated due to Ohmic losses produced by these induced eddy currents. The Fourier equation solves the thermal dynamics in the volume of the heated object with density ρ c , specific heat c s and thermal conduction coefficient k c .The active power generated within the volume of the system is
P ( r s , r , t ) = V 1 σ J · J * d V ,
where ( · * ) represents the complex conjugate. The total generated power is split between the two regions, Ω s and Ω w p . It is important to remember that the prescribed current density is defined exclusively within the source domain
P ( r s , r , t ) = Ω s 1 σ Ω s J 0 ( r s ) · J 0 * ( r s ) d V + Ω w p σ Ω w p d A ( r , t ) d t · d A * ( r , t ) d t d V .
Note that the mixed terms in the workpiece volume are zero because the prescribed current density is null, while the sum of the mixed terms in the source volume is also zero and can therefore be excluded. The first term in Equation (9) represents the power losses of the prescribed current in the coil. In contrast, the second term corresponds to the power dissipated in the material by eddy currents. Both the eddy current density and the heat power density P ( r s , r , t ) typically decrease exponentially with material depth, following the skin depth δ = 1 / π σ ( T ) f μ 0 μ r .

3. The Electromagnetic Real-Time Modeling

The integration of the electromagnetic physics in real-time hardware for HIL simulations passes through an alternative, faster strategy using lookup tables. Lookup tables defining the nonlinear dependence of resistance and inductance on pan position were generated from a COMSOL 6.3 Multiphysics finite-element analysis. Although this analysis considered thermal effects, the resulting data were used to construct a position-dependent lumped-parameter network, in which the extracted parameters vary exclusively with displacement. Consequently, the final lumped model explicitly neglects temperature as a state variable in the electrical simulation. The model is validated in previous works [3,21].

3.1. The FEM Simulation

A frequency-stationary FEA of the coil–workpiece system is conducted with parametric variations to determine the equivalent average parameters. Due to the eddy-current skin effect, a boundary-layer parameter. In the studied induction heating system, the key variable is the relative spatial position between the coil and the workpiece. A sweep analysis can then be carried out to obtain the equivalent parameters for each possible configuration.
In the frequency-domain analysis, the electromagnetic Equation (7) is solved for the magnetic vector potential using harmonic quantities
E = δ A δ t = i ω A .
The resulting equation can be solved using harmonic balancing to enhance convergence. Because of the eddy current skin effect, a boundary layer mesh is typically applied on the heated surface to improve solution accuracy. For the boundary conditions, the external surface is treated as a magnetic insulator, i.e., n × A = 0 , where n is the normal to the external surface.

3.2. Parameters Extraction

The equivalent lumped parameters are obtained from the finite element simulation for each combination of operating conditions, including prescribed current amplitude, frequency, and workpiece temperature.
The inductance is determined from the ratio of flux linkage to current
L e q = Φ I 0 .
An alternative approach calculates the inductance using the real part of the total energy stored in the magnetic field
L e q = Re Ω B ( | H | ) · H I 0 2 δ V .
Equation (12) can be derived from Equation (11) by applying Ampère’s law. An equivalent expression can also be obtained using the definition of the magnetic vector potential. By applying Stokes’ theorem to the curl, the result is separated into two terms, which are directly used in the A ˘ J formulation
L e q = Re Ω s A · J 0 I 0 2 δ V + Ω w p A · σ ( T ) δ A δ t I 0 2 δ V .
The flux linkage method is favored because it accounts for the energy stored beyond the boundaries, which would otherwise be neglected in conventional energy-based calculations.
The resistance is determined using the Joule power relation from Equation (9),
R e q = P ( x + , t ) I 0 2 .
The resistance is also associated with the second term of Equation (13). This term represents the imaginary part of the reactance and, therefore, manifests as a resistive element in the equivalent circuit.

3.3. Look-Up Table Integration

The values derived from the RL circuit can be integrated into electrical simulations by modeling the coil–workpiece system as a time-varying equivalent circuit using two n-dimensional lookup tables. In simulations with a stationary workpiece, these tables are defined based on inputs such as the RMS current, the observed current frequency in the RL branch, and the temperature predicted by an equivalent thermal model. For simulations involving a moving workpiece—such as in a multi-coil cooktop—the lookup tables can account for different pan positions, represented by a boolean pan-presence input and the pan’s location along the surface Cartesian axes. The interpolated resistance is applied to a variable resistance element, while the inductance is implemented via a controlled current source to replicate inductive behavior. To integrate these lumped parameters into time-domain converter simulations, it is assumed that the current waveform is nearly harmonic, with negligible subharmonic components.

3.4. Numerical Electromagnetic Results

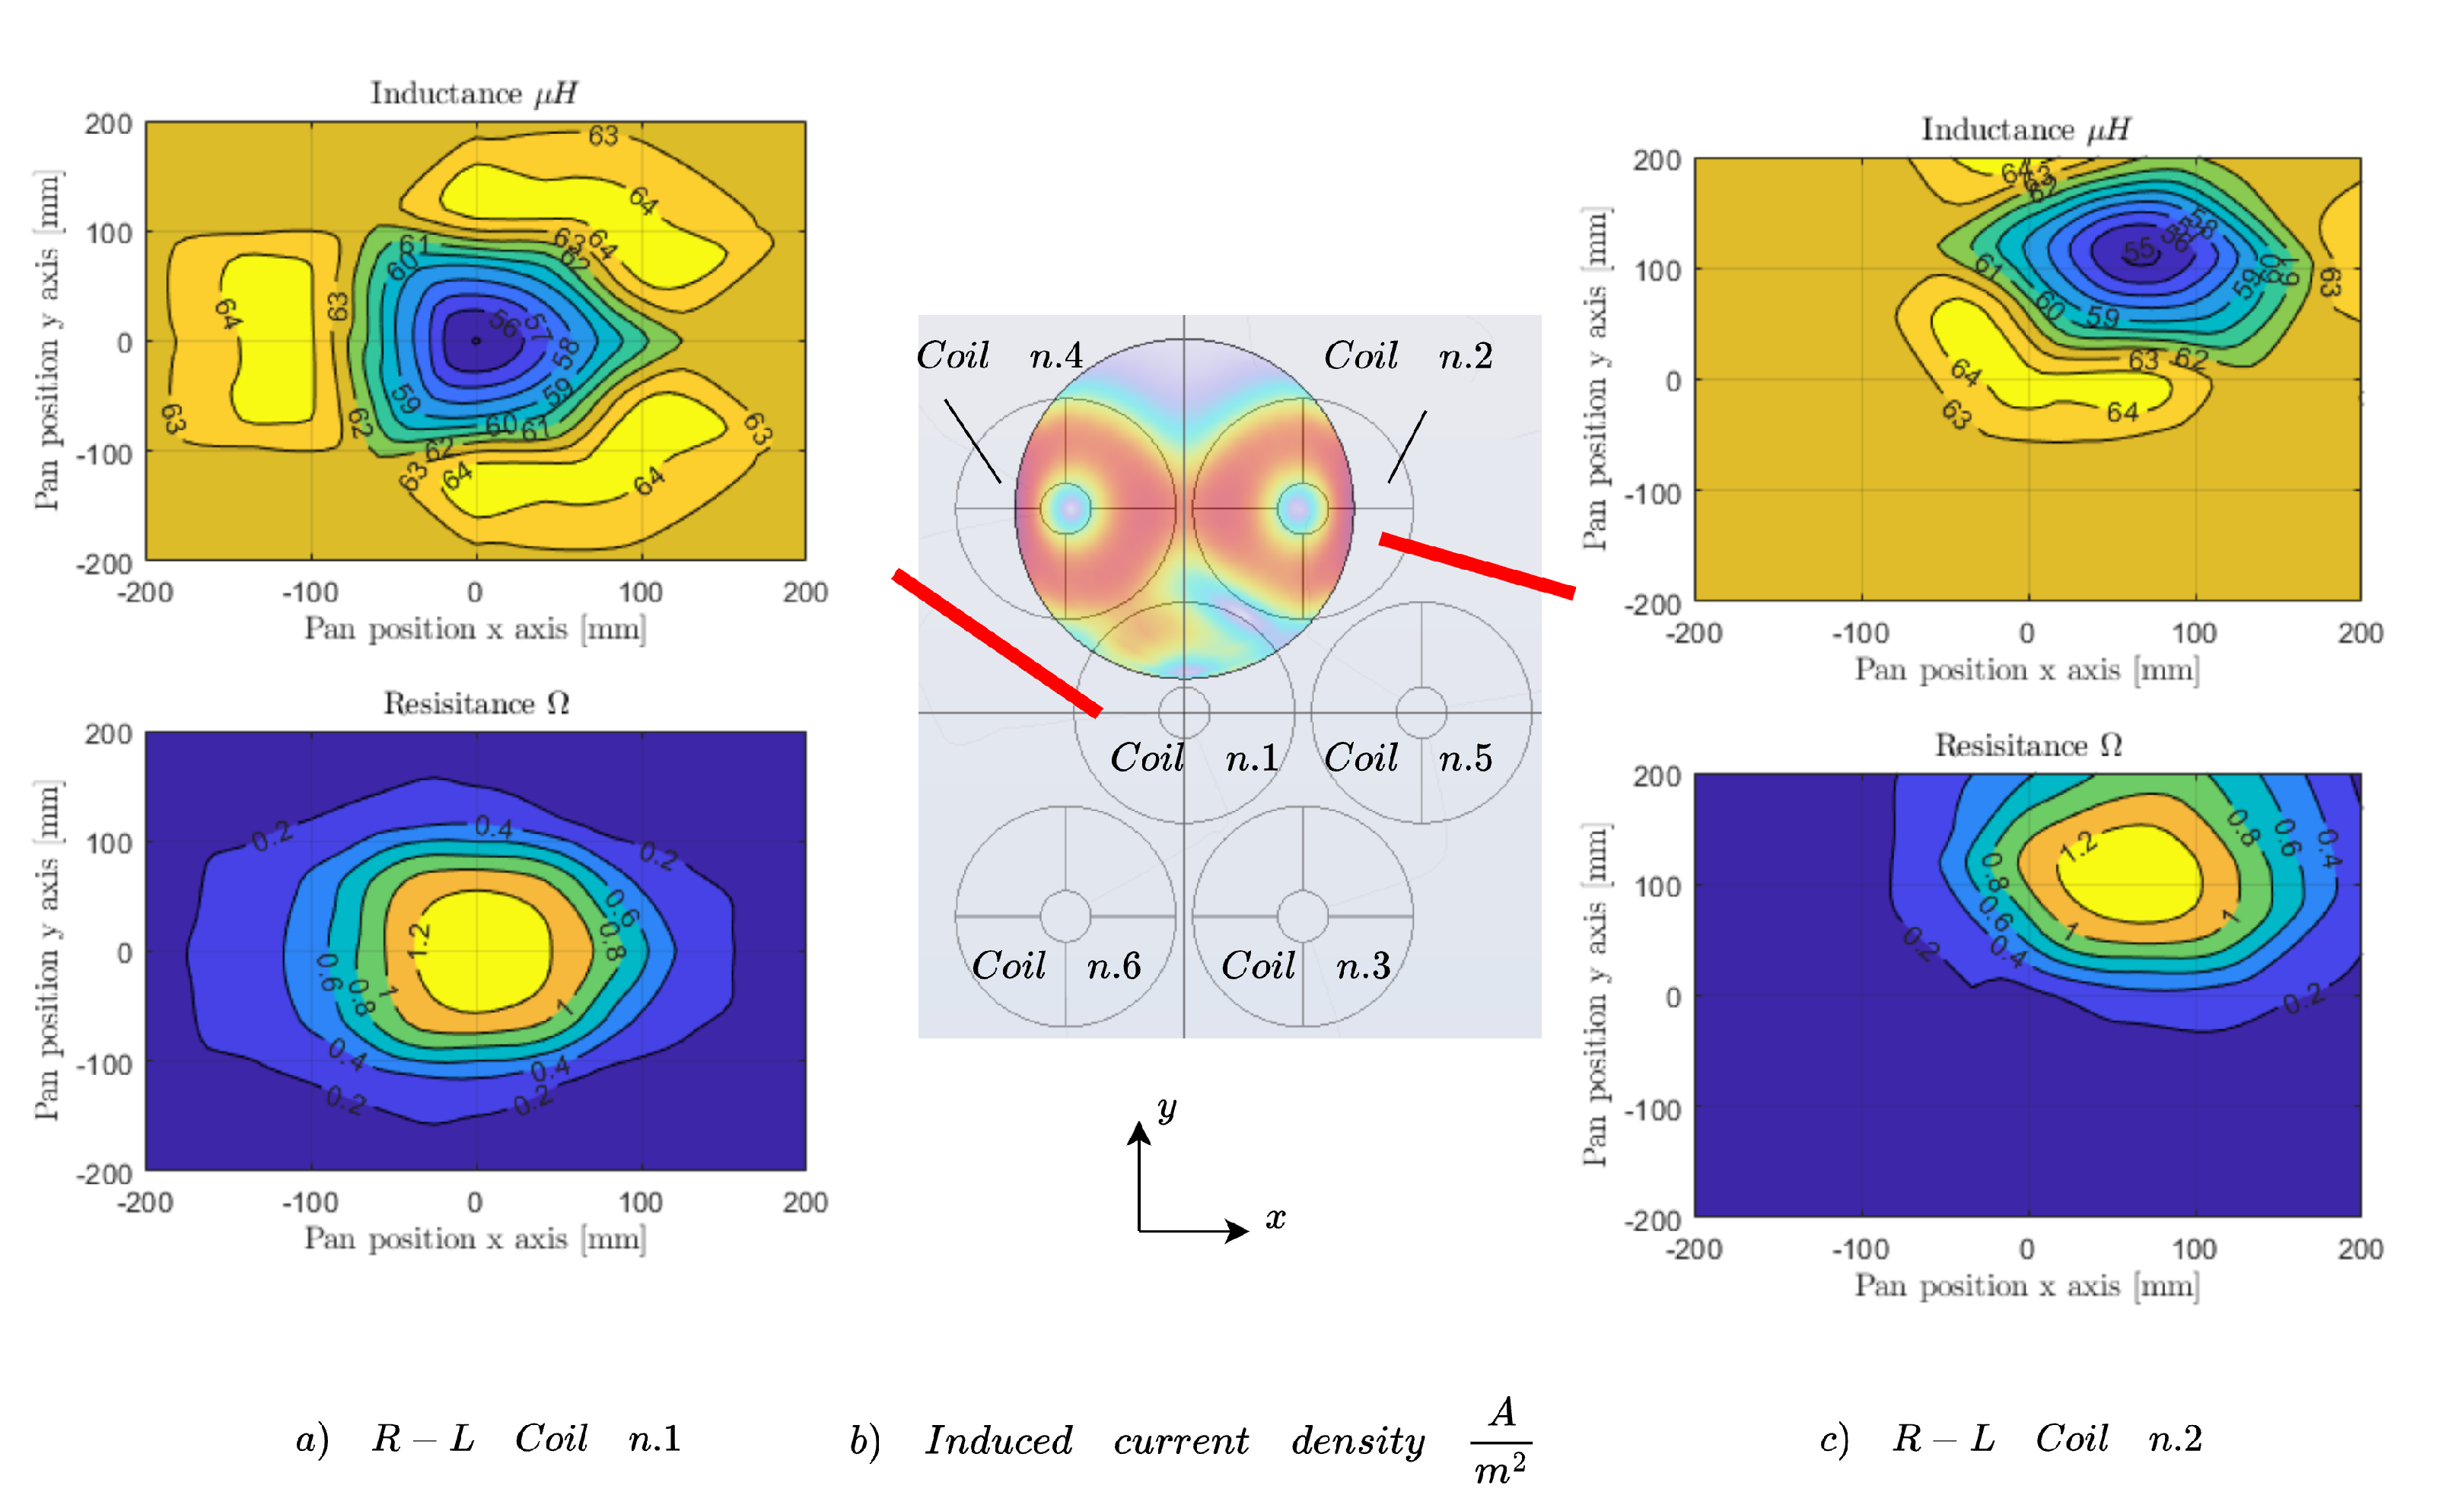
The equivalent lumped-parameter maps are extracted for the configuration shown in Figure 2b (Figure 1, red square) using COMSOL Multiphysics. Considering the average dimensions of cookware, each coil has a diameter of 15 cm, while the pot has a diameter of 20 cm. The parameters are extracted for each coil for 40 different positions of the disk on the x-y plane in an available range (−200 mm, 200 mm). For each equivalent parameter, a surface is interpolated with cubic splines. The equivalent resistance and inductance for each ith coil ( R i , e q , L i , e q ) are represented as functions dependent on the pot position ( R i ( x , y ) , L i ( x , y ) ) in Figure 2a,c for the first and the second coil.
The resistance increases and reaches its maximum when the pan overlaps with the considered coil. When the pan moves away from the coil, the resistance drops to the coil resistance. In order to improve the heating efficiency, the coils n. 1, 2 and 3 share the same clockwise current direction, while the other three have anticlockwise currents as represented with different gray intensities in Figure 1. Due to the eddy currents, the heating has the same distribution of the induced field in the pot surface, and the behavior of the induced field depends on the direction of the current prescribed in the coils. The induced field crosses the pan only between adjacent coils with opposite current direction, as presented in Figure 2b. This behavior affects the inductance maps, showing a higher equivalent inductance when the pan overlaps two coils with the same current direction and a lower inductance when the pan lies between coils with opposite currents.

4. The Thermal Real-Time Modeling

The thermal modeling is addressed by solving the finite element matrices directly on the real time simulator. The damping and stiffness matrices describe the thermal system and a forcing term
[ D ] θ ˙ ( t ) + [ K ] θ ( t ) = L ( t ) ,
where the matrix [ D ] represents the damping term representing the thermal accumulation, the matrix [ K ] represents the conduction term and L ( t ) represents the input power term for each node of the mesh. The solution is the time-domain temperatures θ ( t ) at the mesh nodes.
The system in Equation (15) is iteratively solved using the finite difference with the sparse implicit Euler method for the discretized time step Δ t ,
θ ( k + 1 ) = ( 1 Δ t [ D ] + [ K ] ) 1 ( 1 Δ t [ D ] θ ( k ) + L ( t ) ) .
The matrix resulting from the calculation of ( 1 Δ t [ D ] + [ K ] ) is symmetric and positive definite; therefore, a Cholesky factorization is exploited to obtain more accurate and faster calculations during the single time step in the real-time hardware
( 1 Δ t [ D ] + [ K ] ) = [ R ] T · [ R ] .
Since [ R ] is upper triangular, the calculation is easily implemented in two steps using the forward and the backwards substitution.

Numerical Thermal Results

The system is solved using a real-time simulator with a time step of 0.1 s. The timestep is chosen as a trade-off. Lower time steps are necessary to represent thermal shocks accurately; however, they require more computational resources. In this case, a timestep of 0.1 s is sufficient for accurate thermal-shock calculations while maintaining determinism and conserving computational resources on the real-time hardware. The volume is meshed with 8523 nodes. A finite element simulation software extracts the mesh nodes [22] used to discretize the model using the proposed method. From the nodes, we calculate a lumped-parameter equivalent circuit model for simulation in the real-time simulator [20]. The mesh is a superficial triangular mesh enhanced with an internal boundary layer to capture acceptable thermal variations in the depth of the pan (Figure 3). The resulting thermal distribution over the pan measured during a real-time simulation test is presented in Figure 4. Notice that the heat is limited to the zone where the induced field crosses the pan, similar to the one represented in Figure 2, but for a different positioning of the pot.

5. Resonant Converter and Control Algorithm

The physics, introduced in the previous sections in the real-time hardware, is combined in simulation with the converter. The whole physics and the converter are implemented in the HIL real-time simulation. The following subsections discuss in order the setup, the resonant converter and the control scheme.

5.1. Setup and Scheme

Figure 5 illustrates the setup used for testing, which includes a 4-core OPAL4512 target machine connected to a PC. The model is developed using Simulink, which converts the model-based design into C code. This code is divided into different subsystems, with each subsystem uploaded to a single CPU core. The distribution of tasks across the four cores is as follows:
  • Main Core: Acts as a bridge to simulate the resonant converter in an FPGA module, enhancing computational speed.
  • Second Core: Implements the regulation scheme and provides switching signals in parallel to an external Microcontroller Unit (MCU).
  • Third Core: Analyzes thermal dynamics.
  • Last Core: Serves as a bridge between the real-time simulation and an external user interface.
Users interact with the system through a SCADA GUI module. This GUI allows the FPGA to use an oscilloscope with a sampling time of 500 ns. The SCADA GUI is connected to 3D dynamic lookup tables that deploy the equivalent inductance ( L i ) and resistance ( R i ) values into the variable load located inside the FPGA. Internal temperatures, used to determine the values of the model’s inductors and resistors, are not monitored.
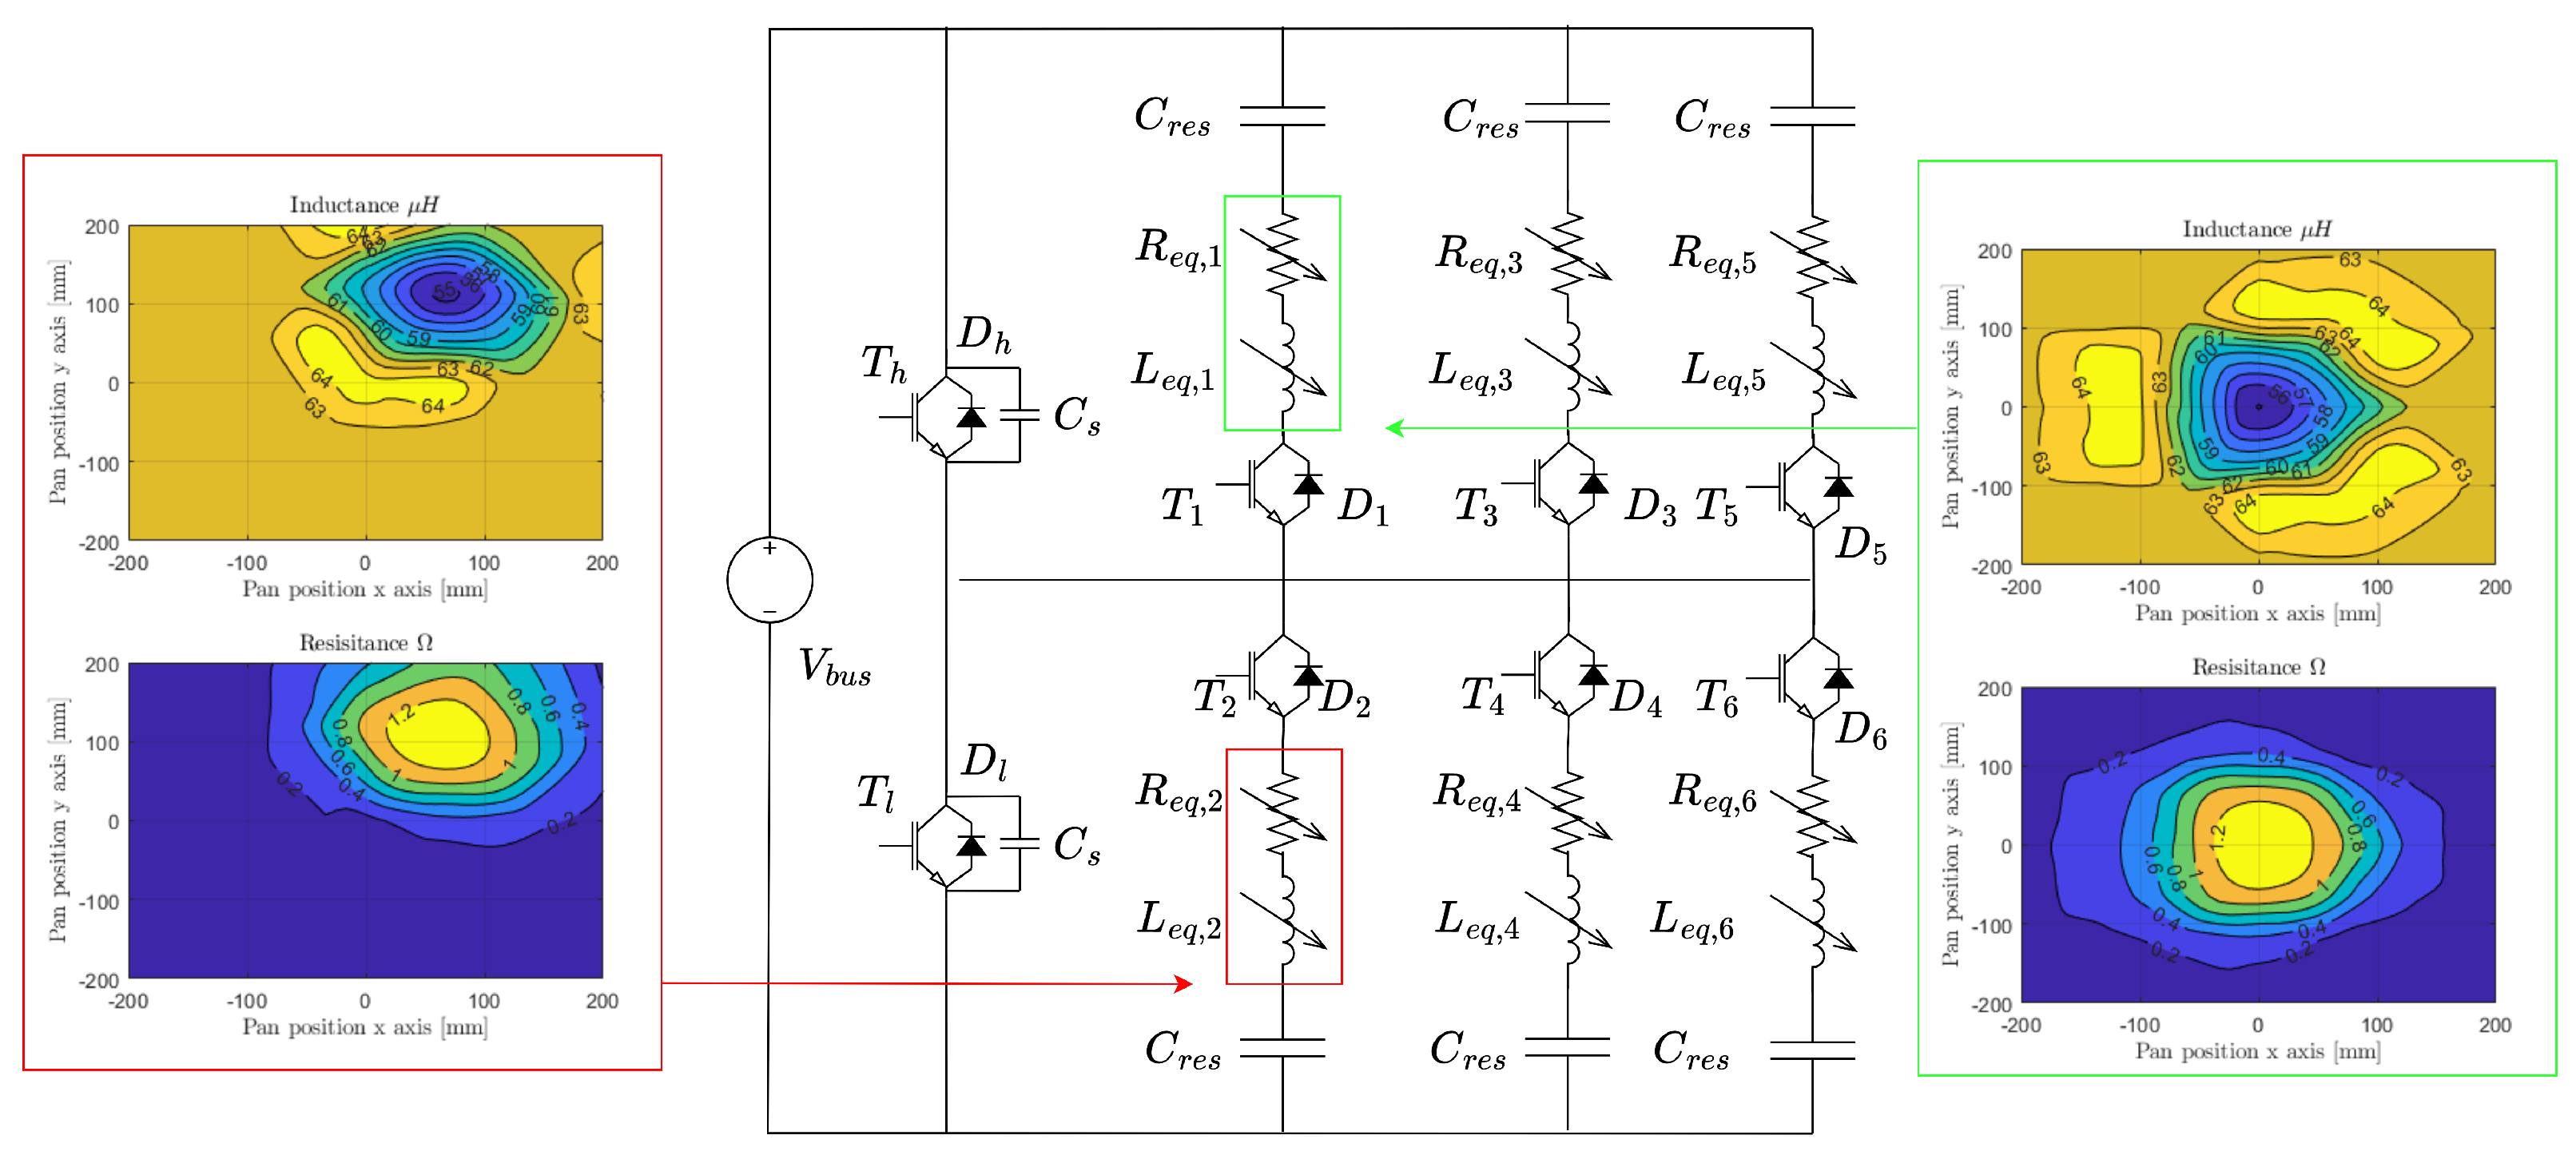
The user manages the pan and its position in real time in the SCADA GUI module. The SCADA GUI is connected to the 3D dynamic lookup tables that deploy the ( R i , L i ) values into the FPGA’s variable load, as shown in Figure 6. The user manages the power reference used to set the S T h and S T l switching frequency through VFDC control and the duty cycle of each inductor. From SCADA, the user can measure the temperatures, the estimated active power delivered to the pan, the converter efficiency, and the active coils on a dashboard. The voltages and currents inside the converter are measured directly by the FPGA using an oscilloscope with a sampling time of 500 ns. All the quantities are stored in the internal memory with a sampling of 5 μ s.

5.2. The Resonant Converter

The resonant converter is a multi-output series of RLC tanks as represented in Figure 6 and developed in [17]. Two fast high-frequency IGBTs, T l and T h , are controlled to regulate the total power over the RLC arms, while the IGBTs connected in series to the resonant tank ( T 1 T N ) are used to disconnect the coil and are controlled using a low-frequency logic. These are used as actuators of the load identification algorithm.

5.3. The Control Algorithm

A variable frequency duty cycle (VFDC) control [23] is tested for the regulation of T h and T l . A load identification technique based on the capacitors’ voltages in each arm is used to regulate the activation of the IGBTs T i with a fixed duty cycle of 35%.

5.3.1. Variable Frequency Duty Cycle

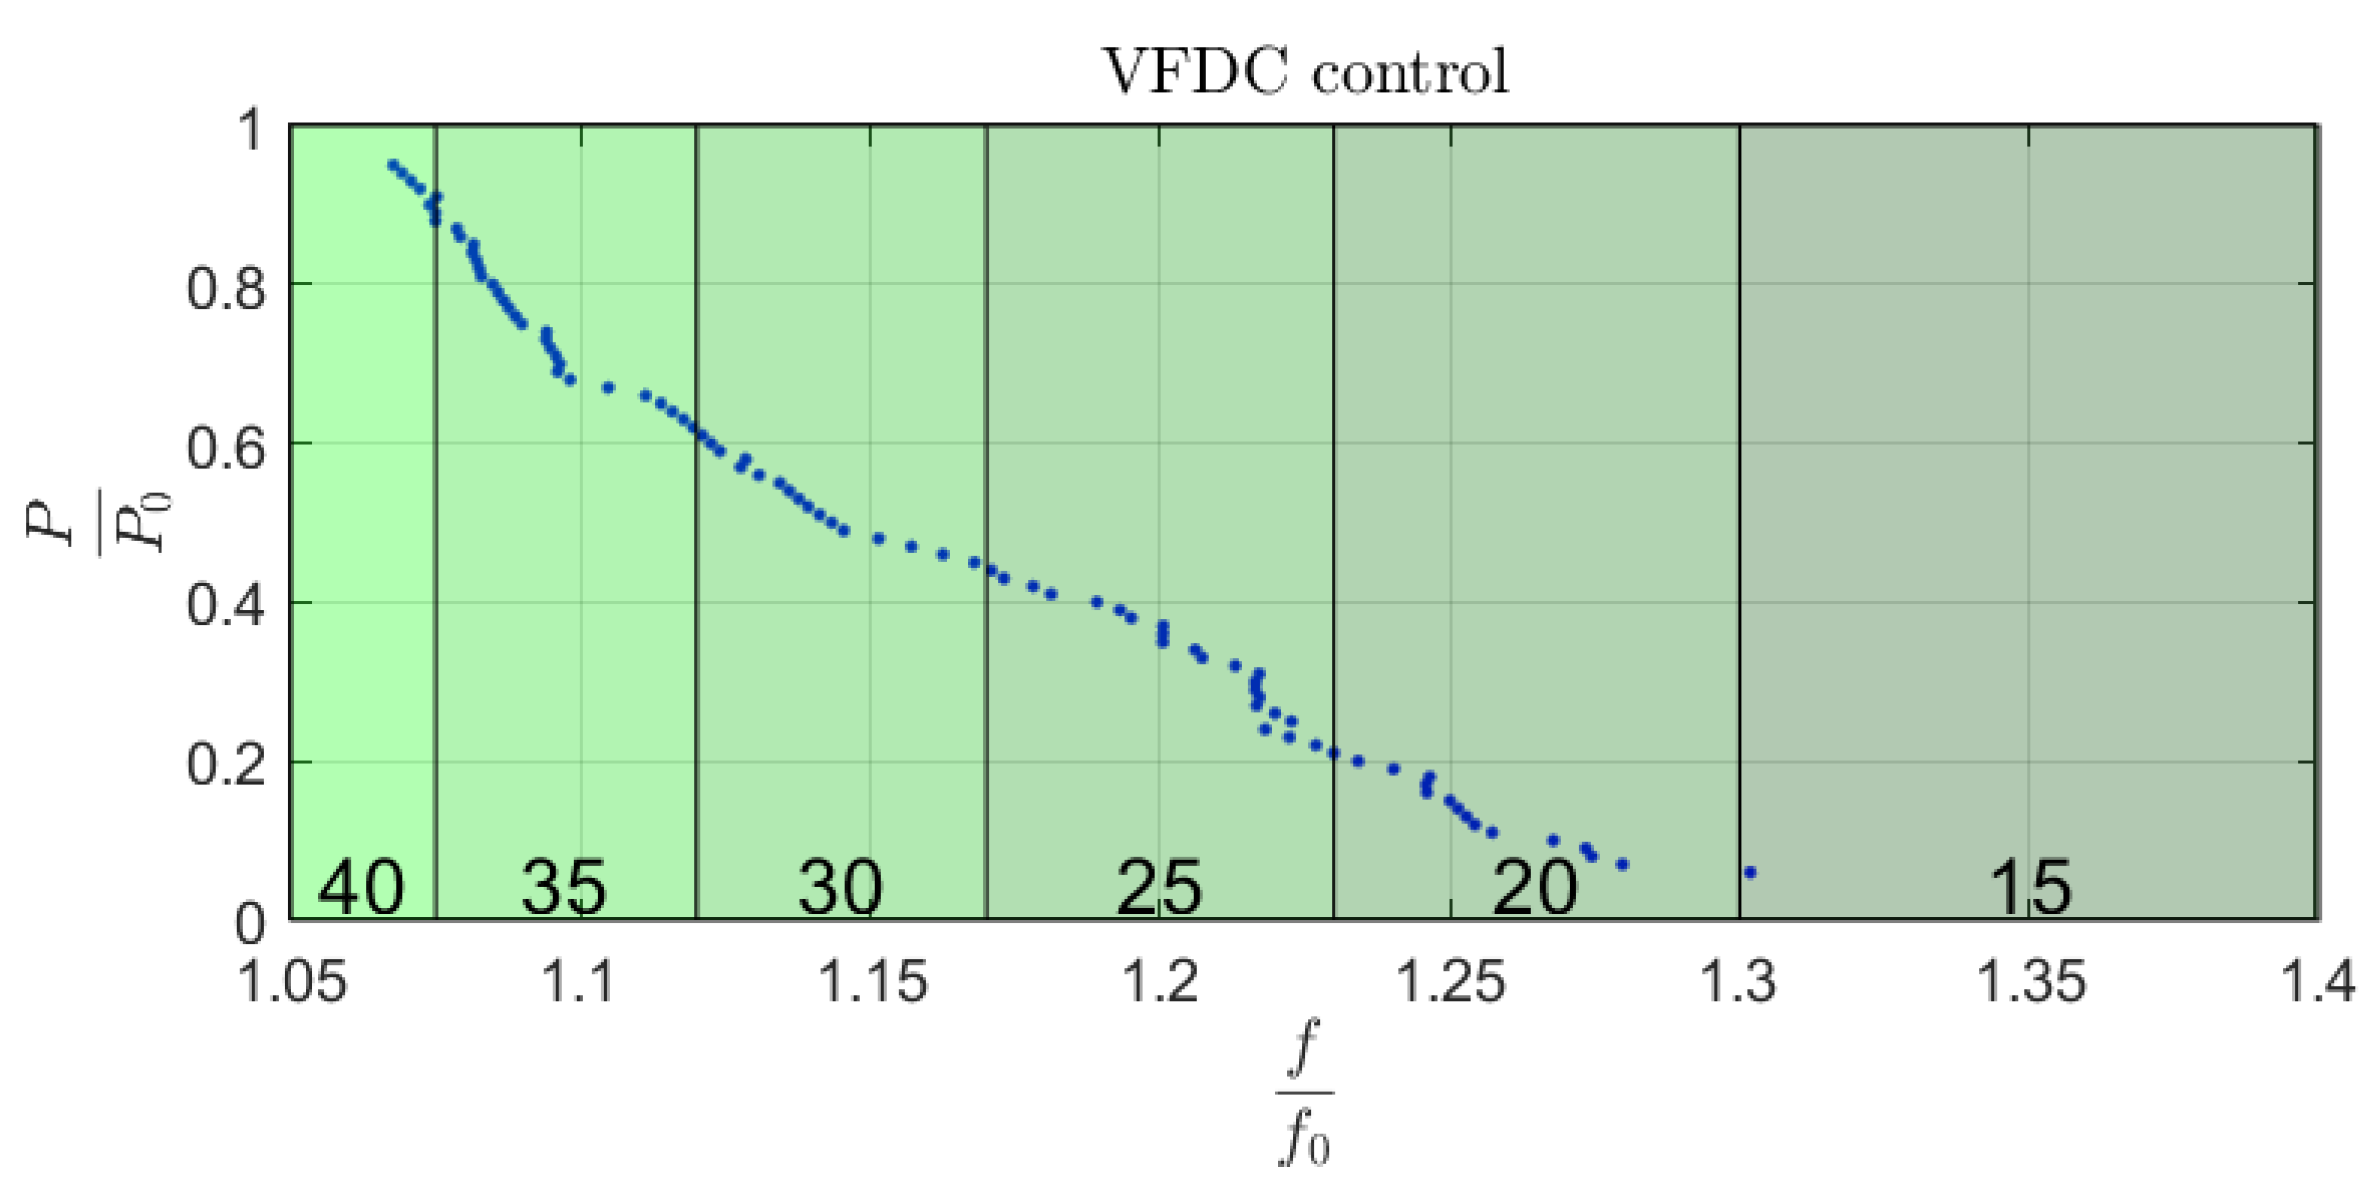
The VFDC regulates both the duty cycle and the frequency of the signal that controls T h and T l . The regulation strategy is based on a table derived from the analysis of the power delivered to a single-series RLC circuit with a resonant frequency f 0 when using a full-bridge resonant converter. The active power of the converter is related to the switching frequency, reaching its maximum value at the resonant frequency f 0 = 20 kHz and the duty cycle 50%. When the frequency ratio is f / f 0 1 , the load exhibits an inductive behavior and the active power decreases. The VFDC regulates active power by controlling the switching frequency; however, higher switching frequencies are not recommended due to IGBT switching losses. A simultaneous reduction in the duty cycle is a practical alternative to limit switching losses. The regulation of power through the switching frequency and the duty cycle must ensure the ZVS. In Figure 7, a VFDC lookup table is implemented and modified during the HIL testing to ensure ZVS and obtain the desired active power.
In [17], the VFDC control has been improved with an HF-PDM modulation. HF-PDM modulation manages the power by optimally regulating the T i for each desired power level. This control strategy reduces the power without increasing the switching frequency.

5.3.2. Load Identification

A standard load identification technique is developed by analyzing the maximum capacitor voltage for each branch. The identification is performed on the resonant frequency. A period T i d is defined, and the converter is supplied at the maximum power ( f = f 0 , D C = 50 % ) for a time of 0.01 s. The voltage on the capacitor is measured, and if it exceeds a threshold, the corresponding IGBT is turned off until the subsequent detection.

6. Results

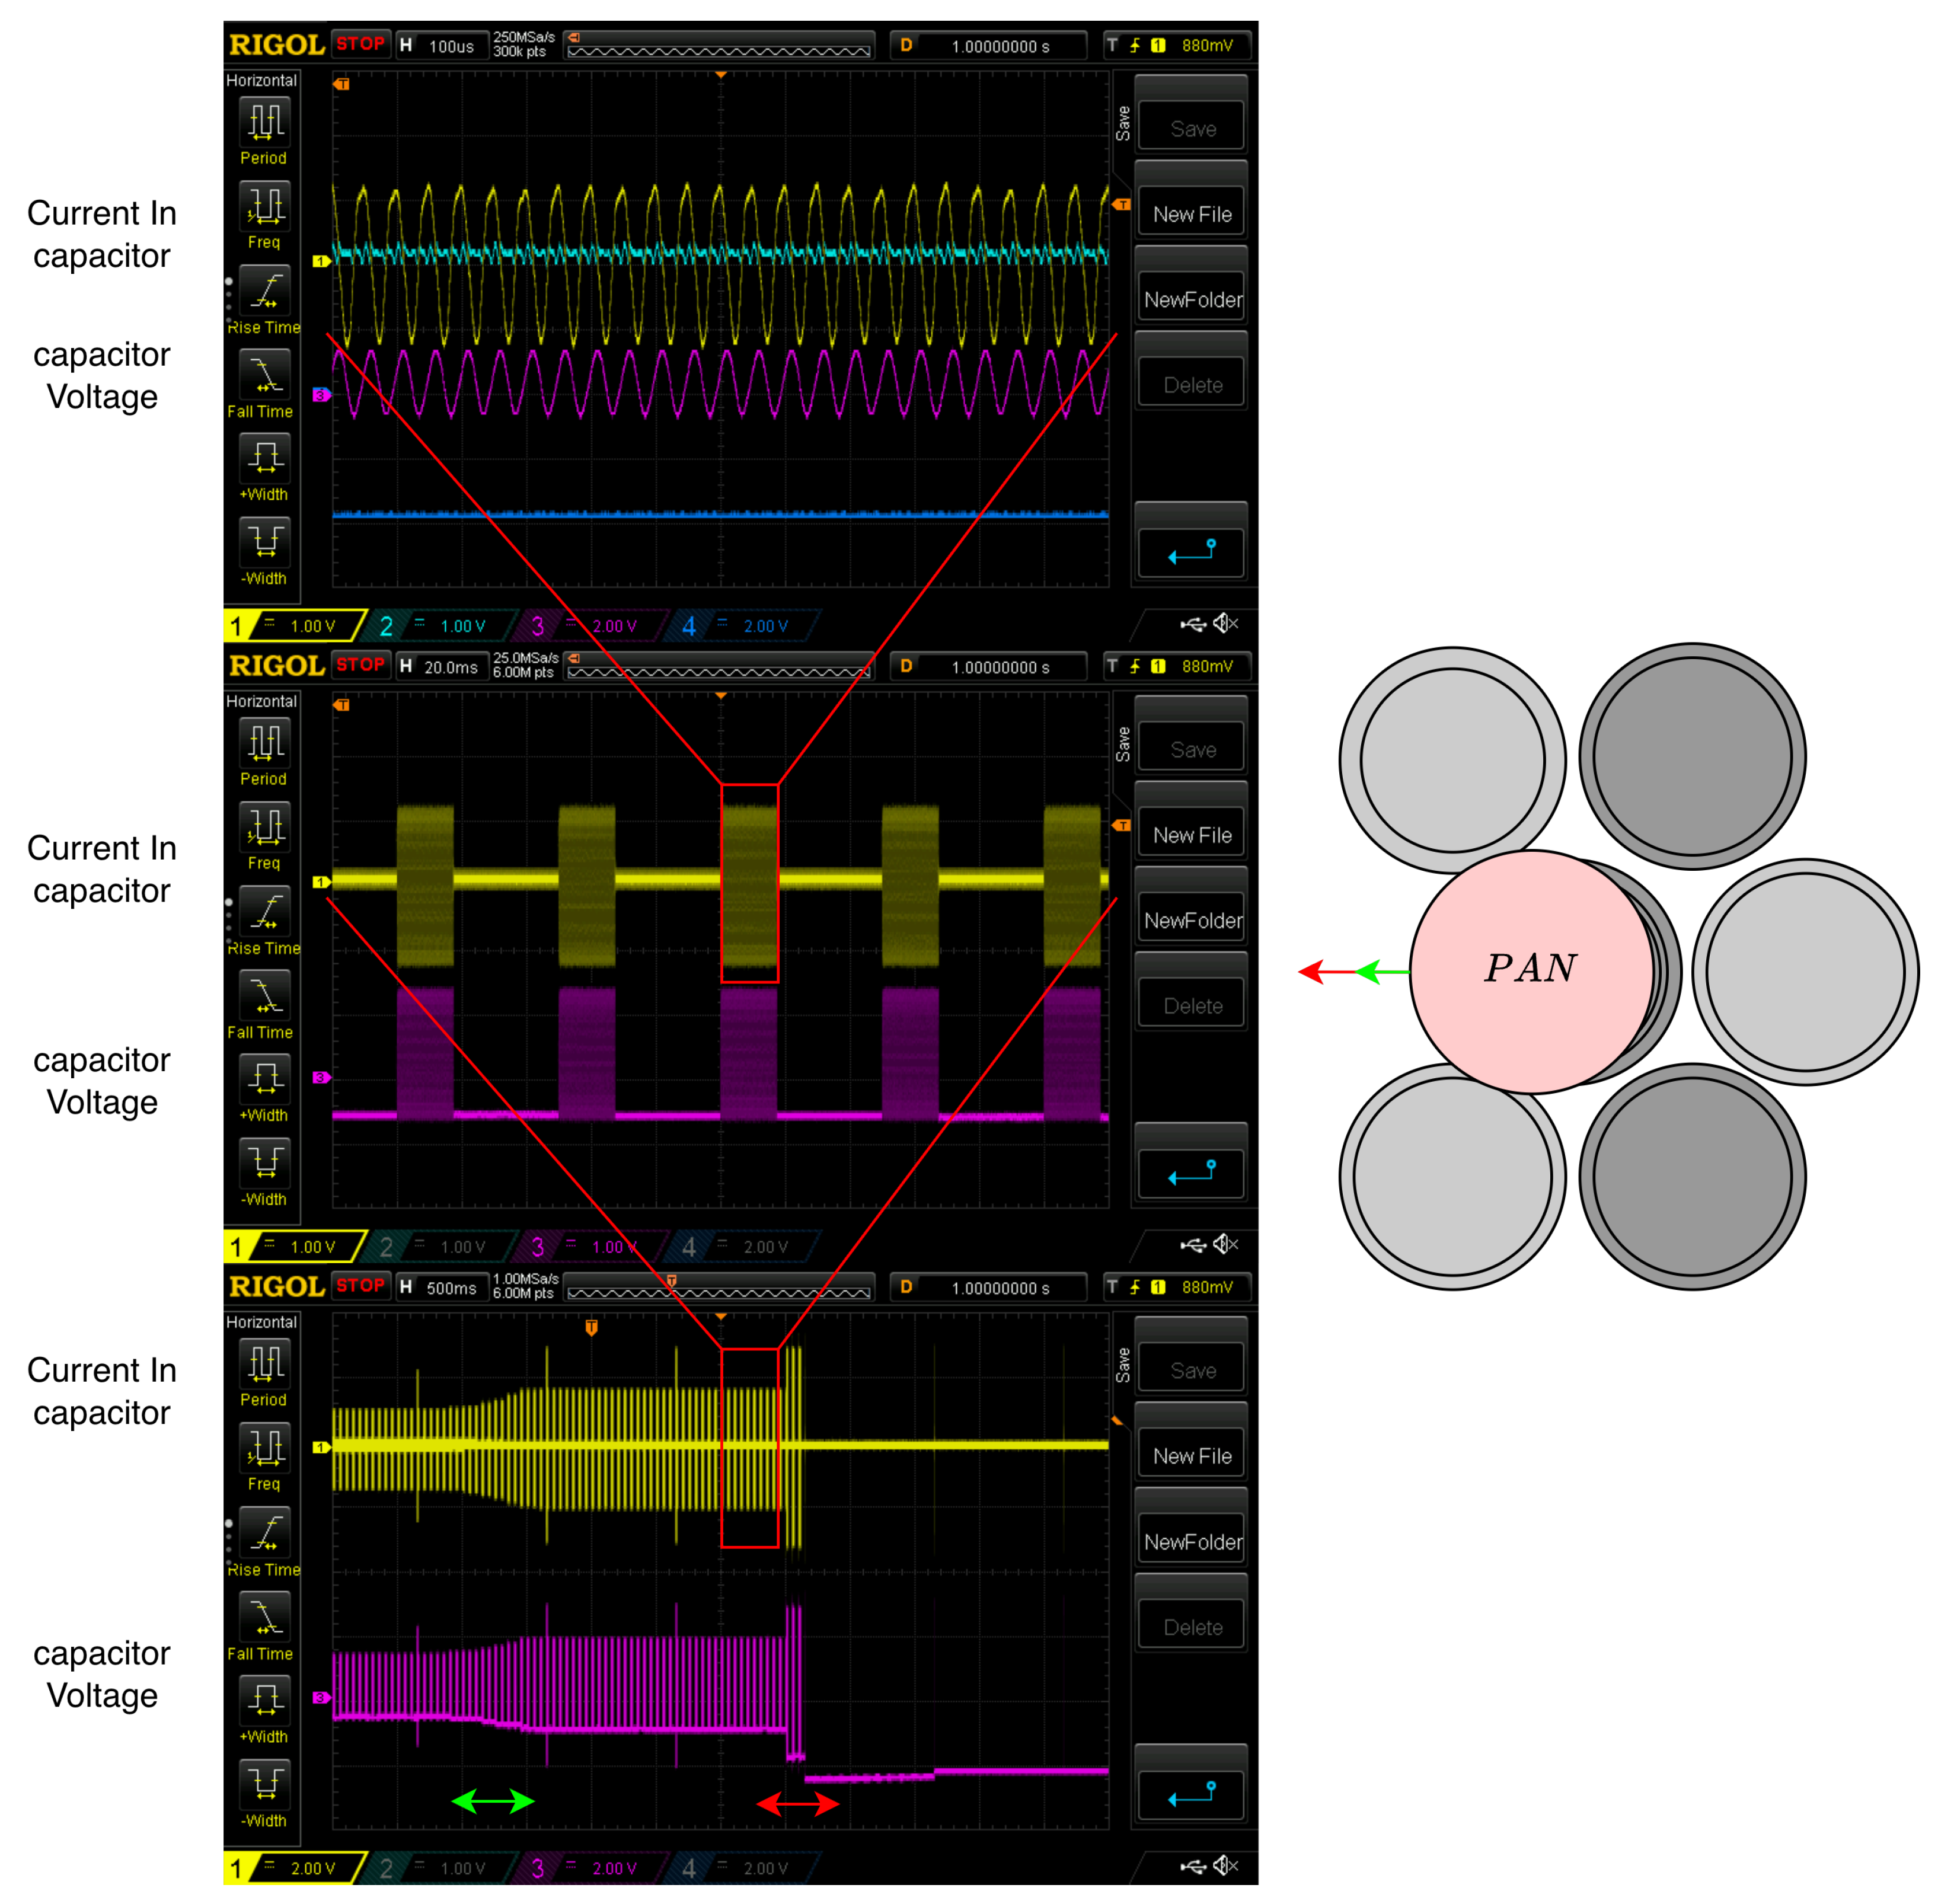
The behavior of the resonant converter is tested, and the control and load detection systems are tuned within a single real-time simulation. During the tests, the currents in the first (yellow, 20 A/Div) and the second (cyan, 20 A/Div) coil and the voltages measured over the resonant capacitors (in order, purple and blue, 400 V/Div) are monitored to check whether the system is sensible to the movements of the cookware on the induction heating system. In this perspective, the first test was carried out simulating a movement of the pan on the IH cooktop towards an empty region as shown in Figure 8. Here, the signal is acquired and captured at different time scales to highlight the converter’s working principle. The first capture shows the harmonic behavior of the coil’s current and the capacitor’s voltage. The second capture shows the 35% duty cycle used to reduce the average power. The third capture shows the response of the converter, the power regulation system and the load detector during the removal of the cookware. When the cookware is not positioned on the cooktop, the coil equivalent resistance drops to the wire resistance and the voltage across the capacitors exceeds the threshold of 550 V, entering in a no load state. This keeps the switches open until the next load detection period. When the pot is on the cooktop, the probe detects a voltage across the capacitors that is below the threshold. As a result, the switches are no longer inhibited.
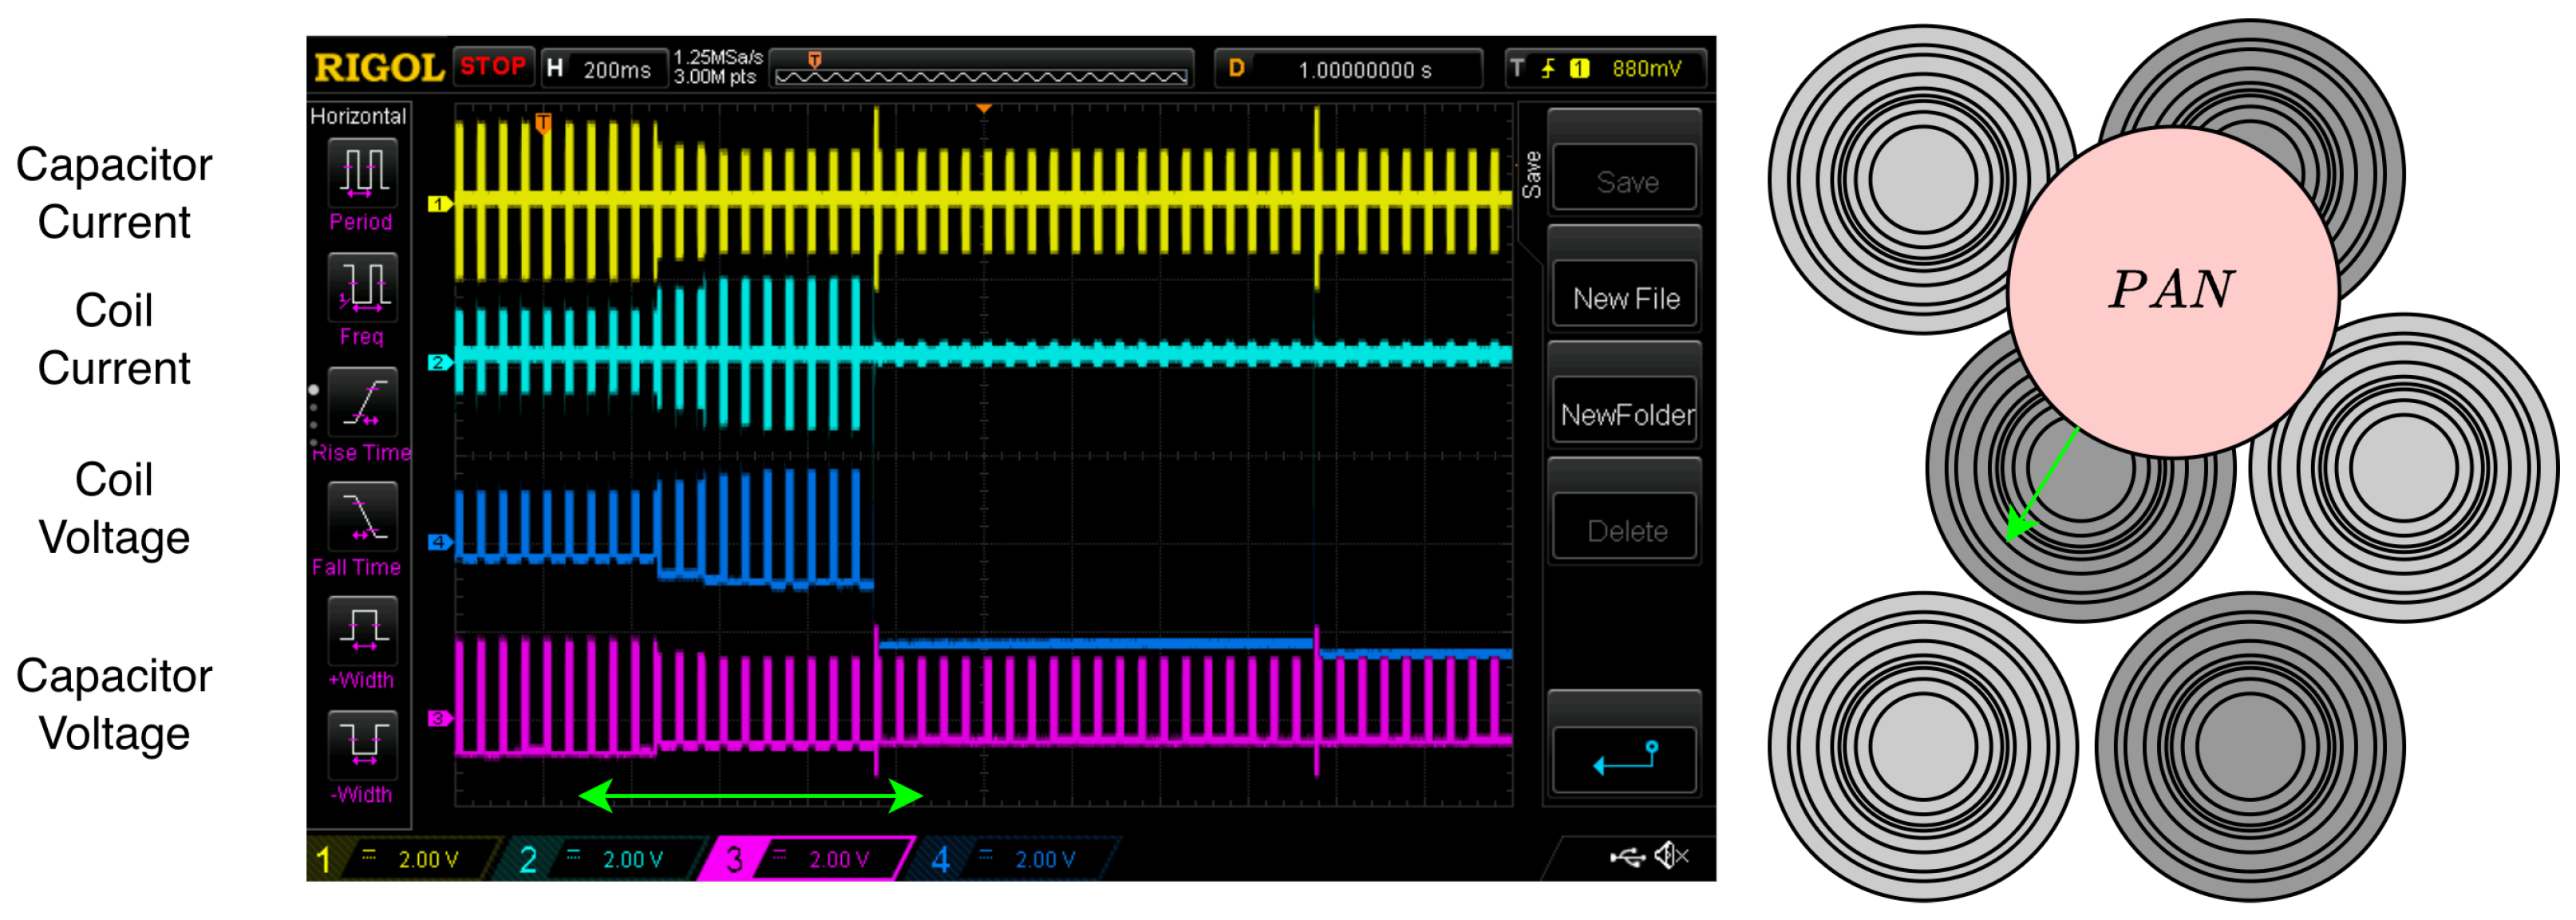
The cookware is moved between the first and the second coil as presented in Figure 9. By moving the pot towards the first coil, the capacitor voltage exceeds the threshold, and the detection system disconnects the load. Along with the movement, the equivalent resistance of the first coil R e q , 1 increases, and the current (yellow) decreases accordingly.
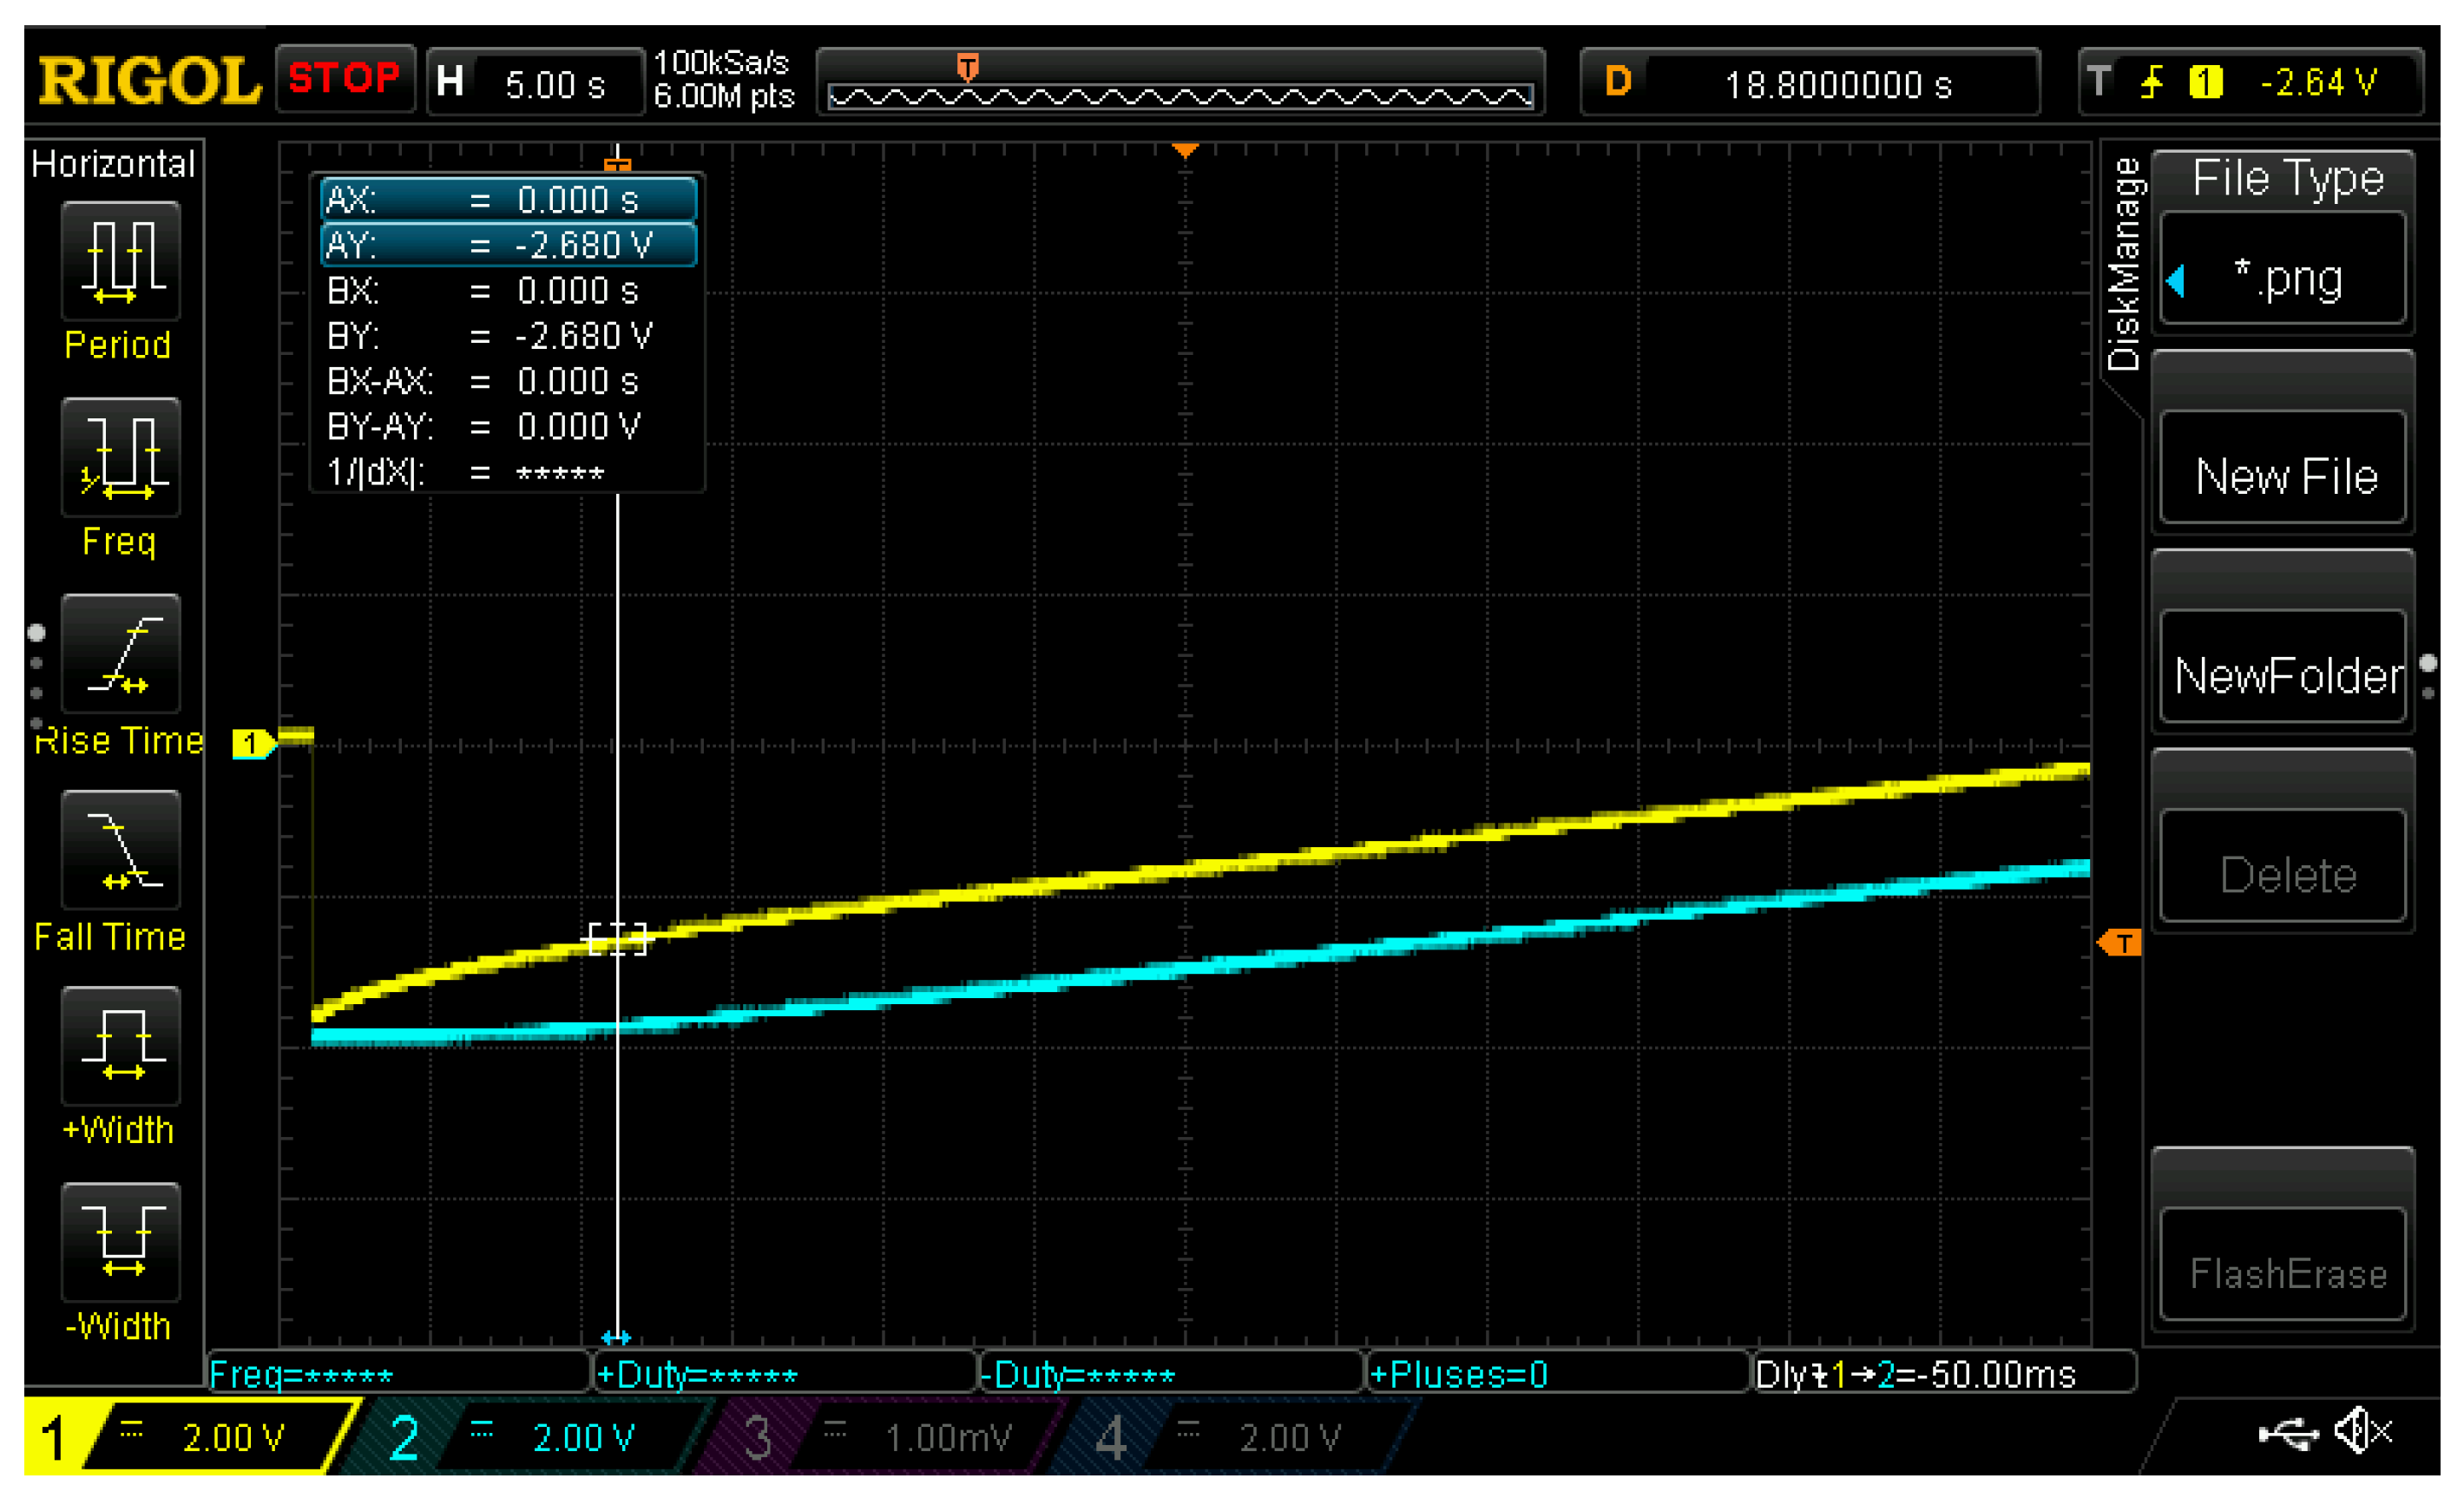
The temperature dynamics at two points on the mesh are shown in Figure 10, highlighting differences in the thermal dynamics between a virtual measurement on the heated surface (yellow) and the pan bulk (blue). At the beginning, the point on the surface heats up faster, then the heat is transferred via internal conduction to the bulk (cyan), reaching the thermal equilibrium.

7. Conclusions and Future Works

The framework adopted in this paper enabled emulating a real multi-coil cooker using a real-time hardware-in-the-loop simulator, serving as an electro-thermal replica of a real IH cooktop. The proposed novel methodology, which integrates finite element method problems and solutions into real-time systems, enables testing converters and monitoring the correct operation of the coils under different conditions, such as changing the pot position on the panel or the desired power level. A series-resonant inverter configuration and its control and detection systems have been rapidly developed using the HIL setup and then the control strategy has been deployed in an external controller. The real-time HIL simulations across different load positions and power requirements demonstrate the correct behavior of the IH cooktop under the proposed control scheme. In the future, a prototype will be created to be used to validate the results, and the application of the methodology for diagnostic purposes will also be evaluated [24].

Author Contributions

Conceptualization, E.S. and G.G.; methodology, E.S.; software, E.S.; validation, E.S.; formal analysis, E.S. and G.G.; investigation, E.S.; resources, E.S. and G.G.; data curation, E.S.; writing—original draft preparation, E.S.; writing—review and editing, E.S. and G.G.; visualization, E.S.; supervision, E.S. and G.G.; project administration, E.S. and G.G.; funding acquisition, G.G. All authors have read and agreed to the published version of the manuscript.

Funding

This research received no external funding.

Institutional Review Board Statement

Not applicable.

Informed Consent Statement

Not applicable.

Data Availability Statement

The data presented in this study are available on request from the corresponding author due to licensing limitations.

Acknowledgments

This study was carried out within the MICS (Made in Italy—Circular and Sustainable) Extended Partnership and received funding from Next-Generation EU (Italian PNRR—M4 C2, Invest 1.3—D.D. 1551.11-10-2022, PE00000004). CUP MICS D43C22003120001.

Conflicts of Interest

The authors declare no conflicts of interest.

References

  1. Prist, M.; Pallotta, E.; Cicconi, P.; Monteriù, A.; Germani, M.; Longhi, S. Induction Mold Heating: Modelling and Hardware-in-the-Loop Simulation for Temperature Control. In Proceedings of the 2018 IEEE International Conference on Environment and Electrical Engineering and 2018 IEEE Industrial and Commercial Power Systems Europe (EEEIC/ICPS Europe), Palermo, Italy, 12–15 June 2018; pp. 1–6. [Google Scholar] [CrossRef]
  2. Xu, J.; Zuo, G.; Chen, J.; Wan, M. A rapid control prototyping system design for temperature control of plastic extruder based on labview. In Proceedings of the 2011 International Conference on Electronics, Communications and Control (ICECC), Ningbo, China, 9–11 September 2011; pp. 2471–2474. [Google Scholar] [CrossRef]
  3. Spateri, E.; Gruosso, G. Validation through HIL of an MPC regulator for thermoforming applications. In Proceedings of the IECON 2024—50th Annual Conference of the IEEE Industrial Electronics Society, Chicago, IL, USA, 3–6 November 2024; pp. 1–6. [Google Scholar] [CrossRef]
  4. El-Baz, W.; Mayerhofer, L.; Tzscheutschler, P.; Wagner, U. Hardware in the Loop Real-Time Simulation for Heating Systems: Model Validation and Dynamics Analysis. Energies 2018, 11, 3159. [Google Scholar] [CrossRef]
  5. Mai, X.H.; Kwak, S.K.; Jung, J.H.; Kim, K.A. Comprehensive Electric-Thermal Photovoltaic Modeling for Power-Hardware-in-the-Loop Simulation (PHILS) Applications. IEEE Trans. Ind. Electron. 2017, 64, 6255–6264. [Google Scholar] [CrossRef]
  6. Tejeda De La Cruz, A.; Riviere, P.; Marchio, D.; Cauret, O.; Milu, A. Hardware in the loop test bench using Modelica: A platform to test and improve the control of heating systems. Appl. Energy 2017, 188, 107–120. [Google Scholar] [CrossRef]
  7. Gao, J.; Zhan, P.; Wang, S.; Wang, N.; Wang, J.; Liu, Y. Hardware-in-the-loop Real-time Simulation of High-power Inverter Based on Electro-thermal Coupling Effect. In Proceedings of the 2020 IEEE 9th International Power Electronics and Motion Control Conference (IPEMC2020-ECCE Asia), Nanjing, China, 29 November–2 December 2020; pp. 3531–3535. [Google Scholar] [CrossRef]
  8. Lupi, S. Fundamentals of Electroheat: Electrical Technologies for Process Heating; Springer: Cham, Switzerland, 2017. [Google Scholar] [CrossRef]
  9. Plumed, E.; Acero, J.; Lope, I.; Burdío, J.M. Design methodology of high performance domestic induction heating systems under worktop. IET Power Electron. 2020, 13, 300–306. [Google Scholar] [CrossRef]
  10. Khazaal, M.H.; Abdulbaqi, I.M.; Thejel, R.H. Modeling, design and analysis of an induction heating coil for brazing process using FEM. In Proceedings of the 2016 Al-Sadeq International Conference on Multidisciplinary in IT and Communication Science and Applications (AIC-MITCSA), Baghdad, Iraq, 9–10 May 2016; pp. 1–6. [Google Scholar] [CrossRef]
  11. Boadi, A.; Tsuchida, Y.; Todaka, T.; Enokizono, M. Designing of suitable construction of high-frequency induction heating coil by using finite-element method. IEEE Trans. Magn. 2005, 41, 4048–4050. [Google Scholar] [CrossRef]
  12. Byun, J.K.; Choi, K.; Roh, H.S.; Hahn, S.Y. Optimal design procedure for a practical induction heating cooker. IEEE Trans. Magn. 2000, 36, 1390–1393. [Google Scholar] [CrossRef]
  13. Chaboudez, C.; Clain, S.; Glardon, R.; Mari, D.; Rappaz, J.; Swierkosz, M. Numerical modeling in induction heating for axisymmetric geometries. IEEE Trans. Magn. 1997, 33, 739–745. [Google Scholar] [CrossRef]
  14. Spateri, E.; Sabug, L.; Ruiz, F.; Gruosso, G. Efficient Multiobjective Optimization Framework for Induction Heating Systems Design. IEEE Access 2024, 12, 95347–95355. [Google Scholar] [CrossRef]
  15. Plumed, E.; Lope, I.; Acero, J. Induction Heating Adaptation of a Different-Sized Load With Matching Secondary Inductor to Achieve Uniform Heating and Enhance Vertical Displacement. IEEE Trans. Power Electron. 2021, 36, 6929–6942. [Google Scholar] [CrossRef]
  16. Serrano, J.; Lope, I.; Acero, J. Nonplanar Overlapped Inductors Applied to Domestic Induction Heating Appliances. IEEE Trans. Ind. Electron. 2019, 66, 6916–6924. [Google Scholar] [CrossRef]
  17. Lucia, O.; Burdio, J.M.; Barragan, L.A.; Acero, J.; Millan, I. Series-Resonant Multiinverter for Multiple Induction Heaters. IEEE Trans. Power Electron. 2010, 25, 2860–2868. [Google Scholar] [CrossRef]
  18. Ozturk, M.; Aslan, S.; Altintas, N.; Sinirlioglu, S. Comparison of Induction Cooker Power Converters. In Proceedings of the 2018 6th International Conference on Control Engineering and Information Technology (CEIT), Istanbul, Turkey, 25–27 October 2018; pp. 1–6. [Google Scholar] [CrossRef]
  19. Ozturk, M.; Zungor, F.; Emre, B.; Oz, B. Quasi Resonant Inverter Load Recognition Method. IEEE Access 2022, 10, 89376–89386. [Google Scholar] [CrossRef]
  20. OPAL-RT Technologies. OPAL-RT OP4500 Real-Time Power Grid Digital Simulator. 2014. Available online: https://www.opal-rt.com/hardware/simulators/ (accessed on 16 October 2025).
  21. Spateri, E.; Ruiz, F.; Gruosso, G. Modelling and Simulation of Quasi-Resonant Inverter for Induction Heating under Variable Load. Electronics 2023, 12, 753. [Google Scholar] [CrossRef]
  22. COMSOL AB. COMSOL Multiphysics; COMSOL AB: Stockholm, Sweden, 2024. [Google Scholar]
  23. Lucia, O.; Burdio, J.M.; Millan, I.; Acero, J.; Barragan, L.A. Efficiency-Oriented Design of ZVS Half-Bridge Series Resonant Inverter With Variable Frequency Duty Cycle Control. IEEE Trans. Power Electron. 2010, 25, 1671–1674. [Google Scholar] [CrossRef]
  24. Wu, X.; Yang, X.; Ye, J.; Liu, G. Novel Prognostics for IGBTs Using Wire-Bond Contact Degradation Model Considering On-Chip Temperature Distribution. IEEE Trans. Power Electron. 2025, 40, 4411–4424. [Google Scholar] [CrossRef]
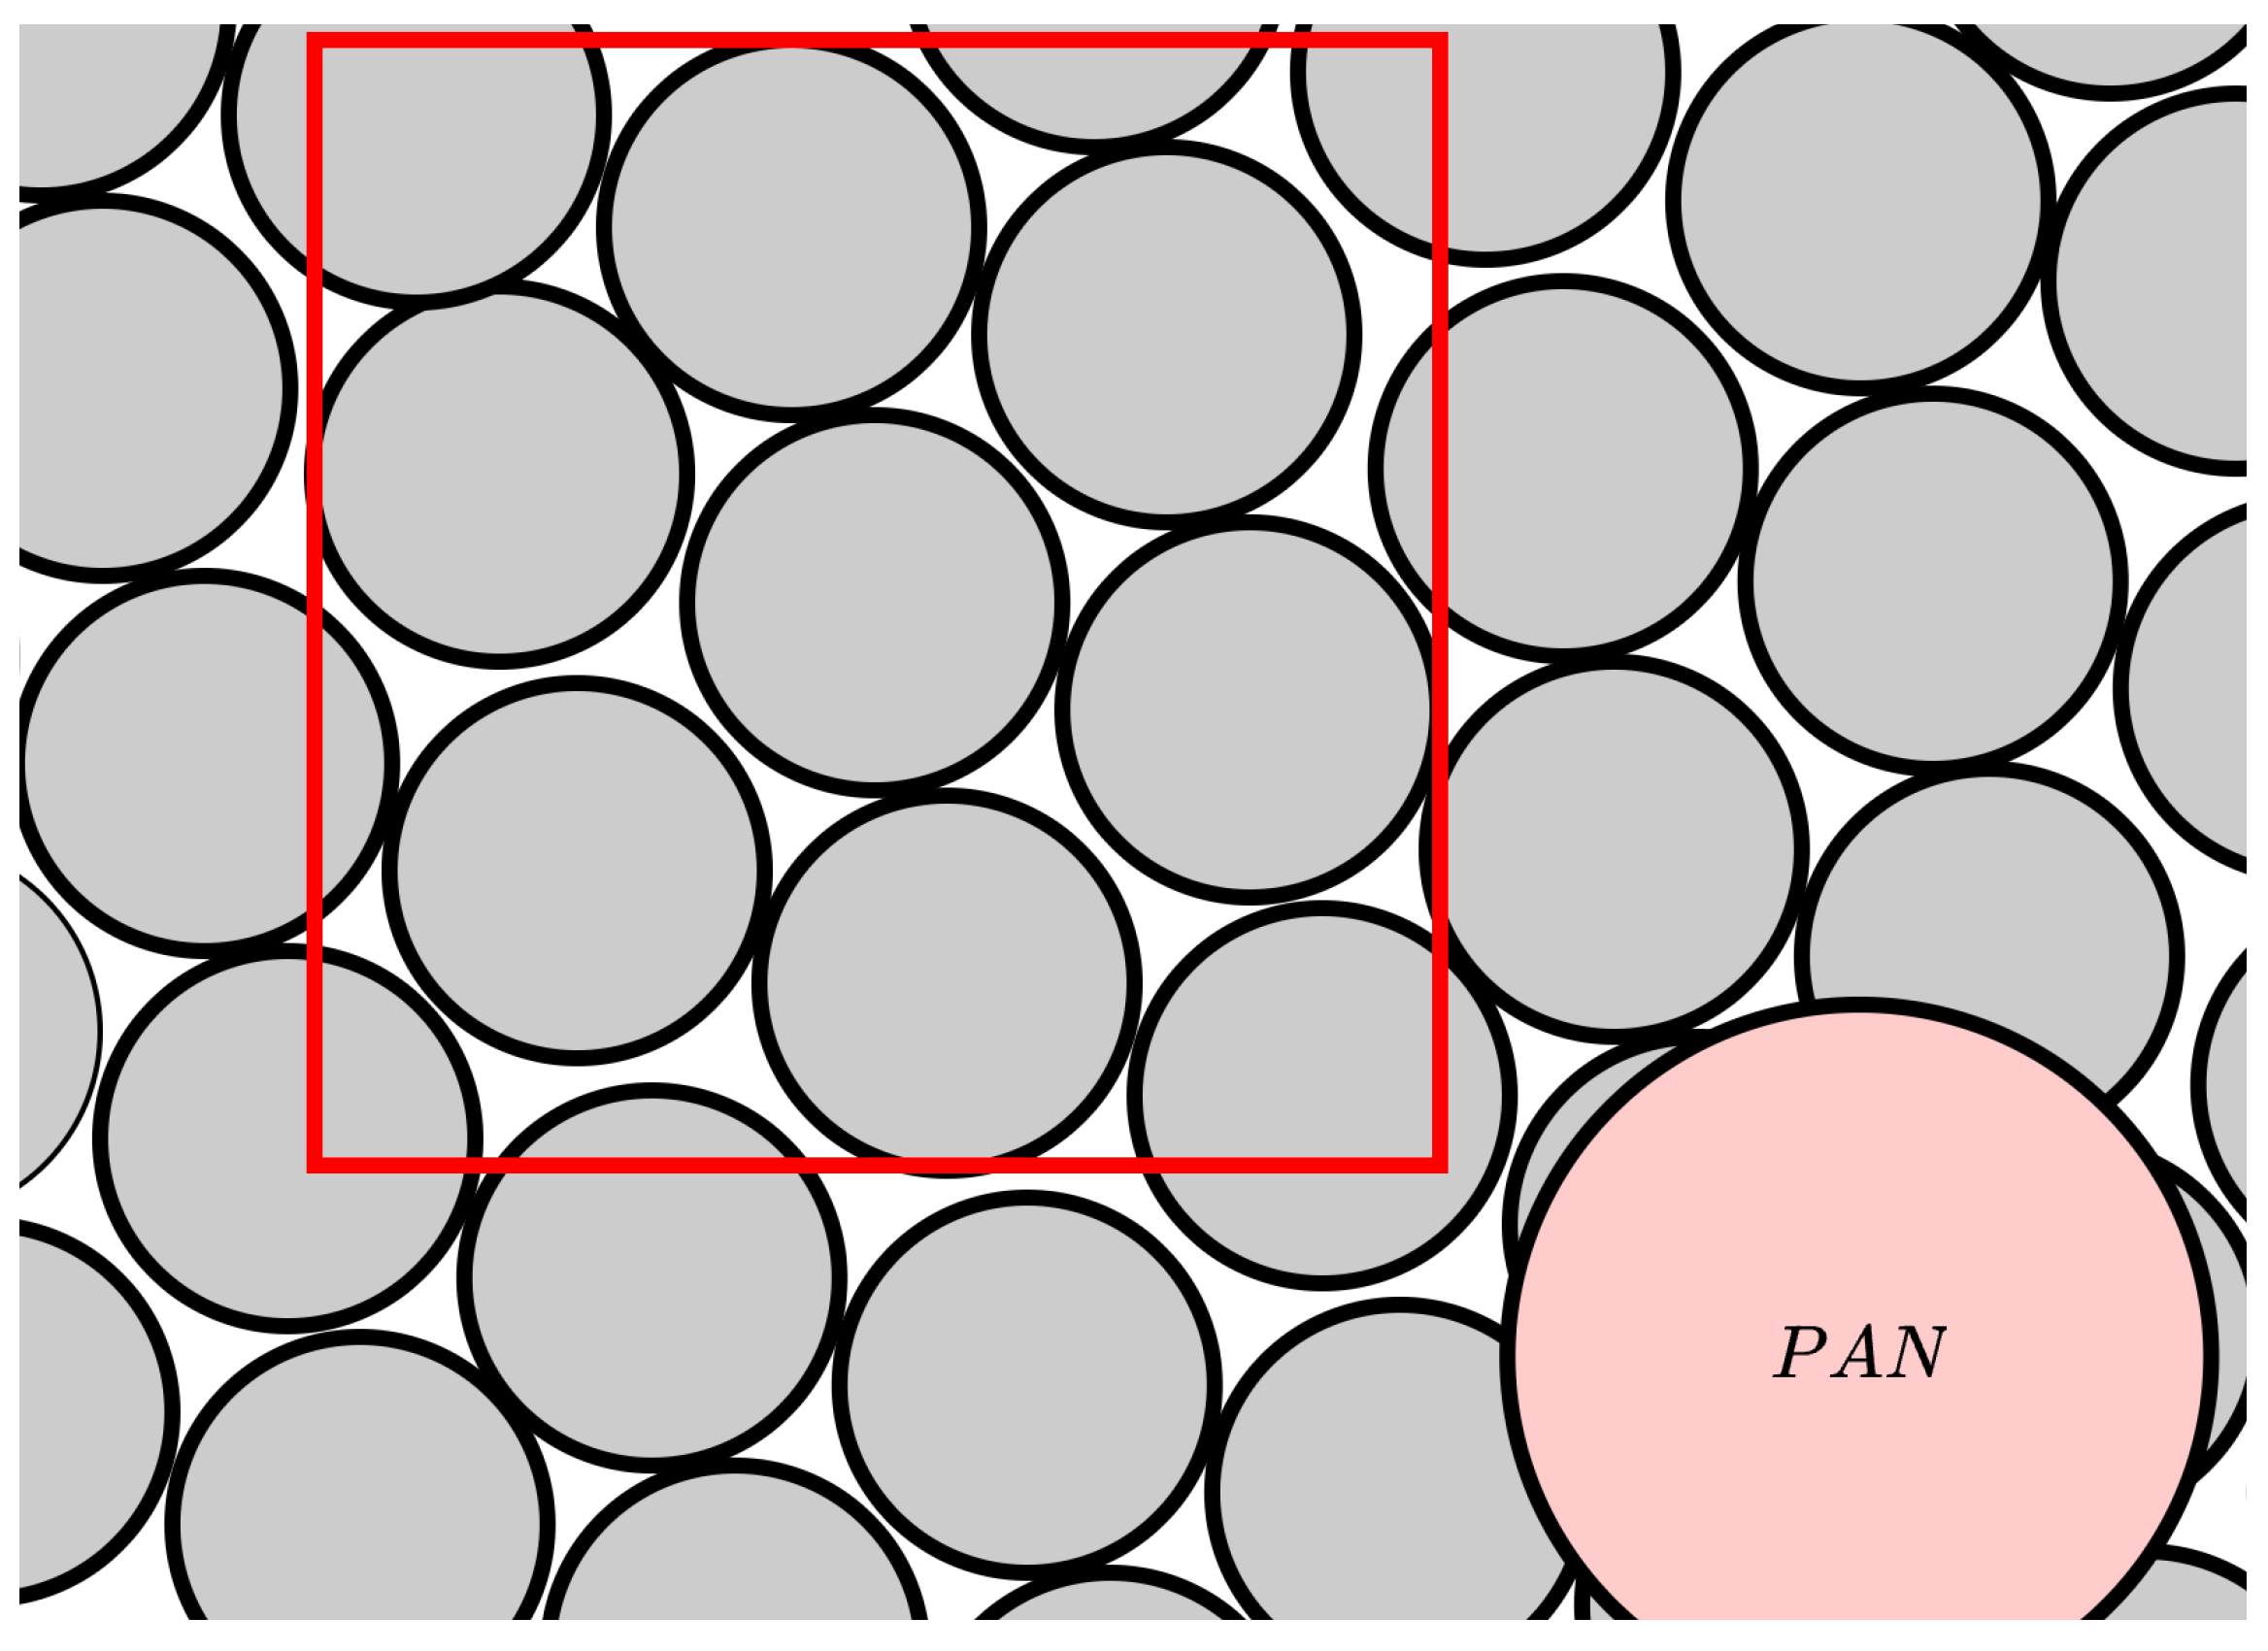
Figure 1. The diagram illustrates the area of the induction plane influenced by the coils (red box) and the position of the object (pan) that is to be heated.
Energies 18 05752 g001
Figure 2. Coil disposition and induced field in the cookware represented as an heat map (b). The resistance and inductance maps are plotted as a function of the pan position on the cooking panel and for the two coils considered are reported as (a) and (c). The origin ( 0 ,   0 ) is fixed with the center of the first coil.
Energies 18 05752 g002
Figure 3. Mesh extracted for the pan in the finite element method software.
Energies 18 05752 g003
Figure 4. Pan temperature measured real time using the real time hardware at 10 s, 30 s and 50 s delivering a power of 830 W.
Energies 18 05752 g004
Figure 5. Boxchart of the simulation and photo of the setup.
Energies 18 05752 g005
Figure 6. Scheme of a series resonant multi-inverter and load emulation with an example for two inductance maps.
Energies 18 05752 g006
Figure 7. Normalized output power obtained as a function of the normalized switching frequency and the duty cycles for the transistor T h and T l .
Energies 18 05752 g007
Figure 8. Current (yellow) and capacitor voltage (purple) measured over different time scales. The current is scaled by 1 / 20 from the FPGA, while the voltage is scaled by 1 / 200 . The captures highlight (from above) the 20 kHz waveforms (100 μ s/Div), the 35 % duty cycle set for the power reduction (20 ms/Div), the long-range (500 ms/Div) measurement and the corresponding pan movement that causes the turn-off of the first coil. The load is detected at a frequency of 1 Hz, corresponding to the peaks visible in the last capture.
Energies 18 05752 g008
Figure 9. The pan initially positioned between the first and the second coil is moved towards the central coil. The impedance for the central coil increases, reducing the current amplitude (yellow, 40 A/Div) and the voltage over the capacitor (purple, 400 V/Div). The equivalent resistance of the second coil decreases, its current increases (cyan, 40 A/Div) and the coil is turned off in correspondence to a load detection period when the voltage (blue, 400 V/Div) is higher than the threshold.
Energies 18 05752 g009
Figure 10. The temperature of the pan is measured at two points: the heated surface (yellow, 40 C/Div) has a faster dynamics than the bulk (cyan, 40 C/Div).
Energies 18 05752 g010
Disclaimer/Publisher’s Note: The statements, opinions and data contained in all publications are solely those of the individual author(s) and contributor(s) and not of MDPI and/or the editor(s). MDPI and/or the editor(s) disclaim responsibility for any injury to people or property resulting from any ideas, methods, instructions or products referred to in the content.