Abstract
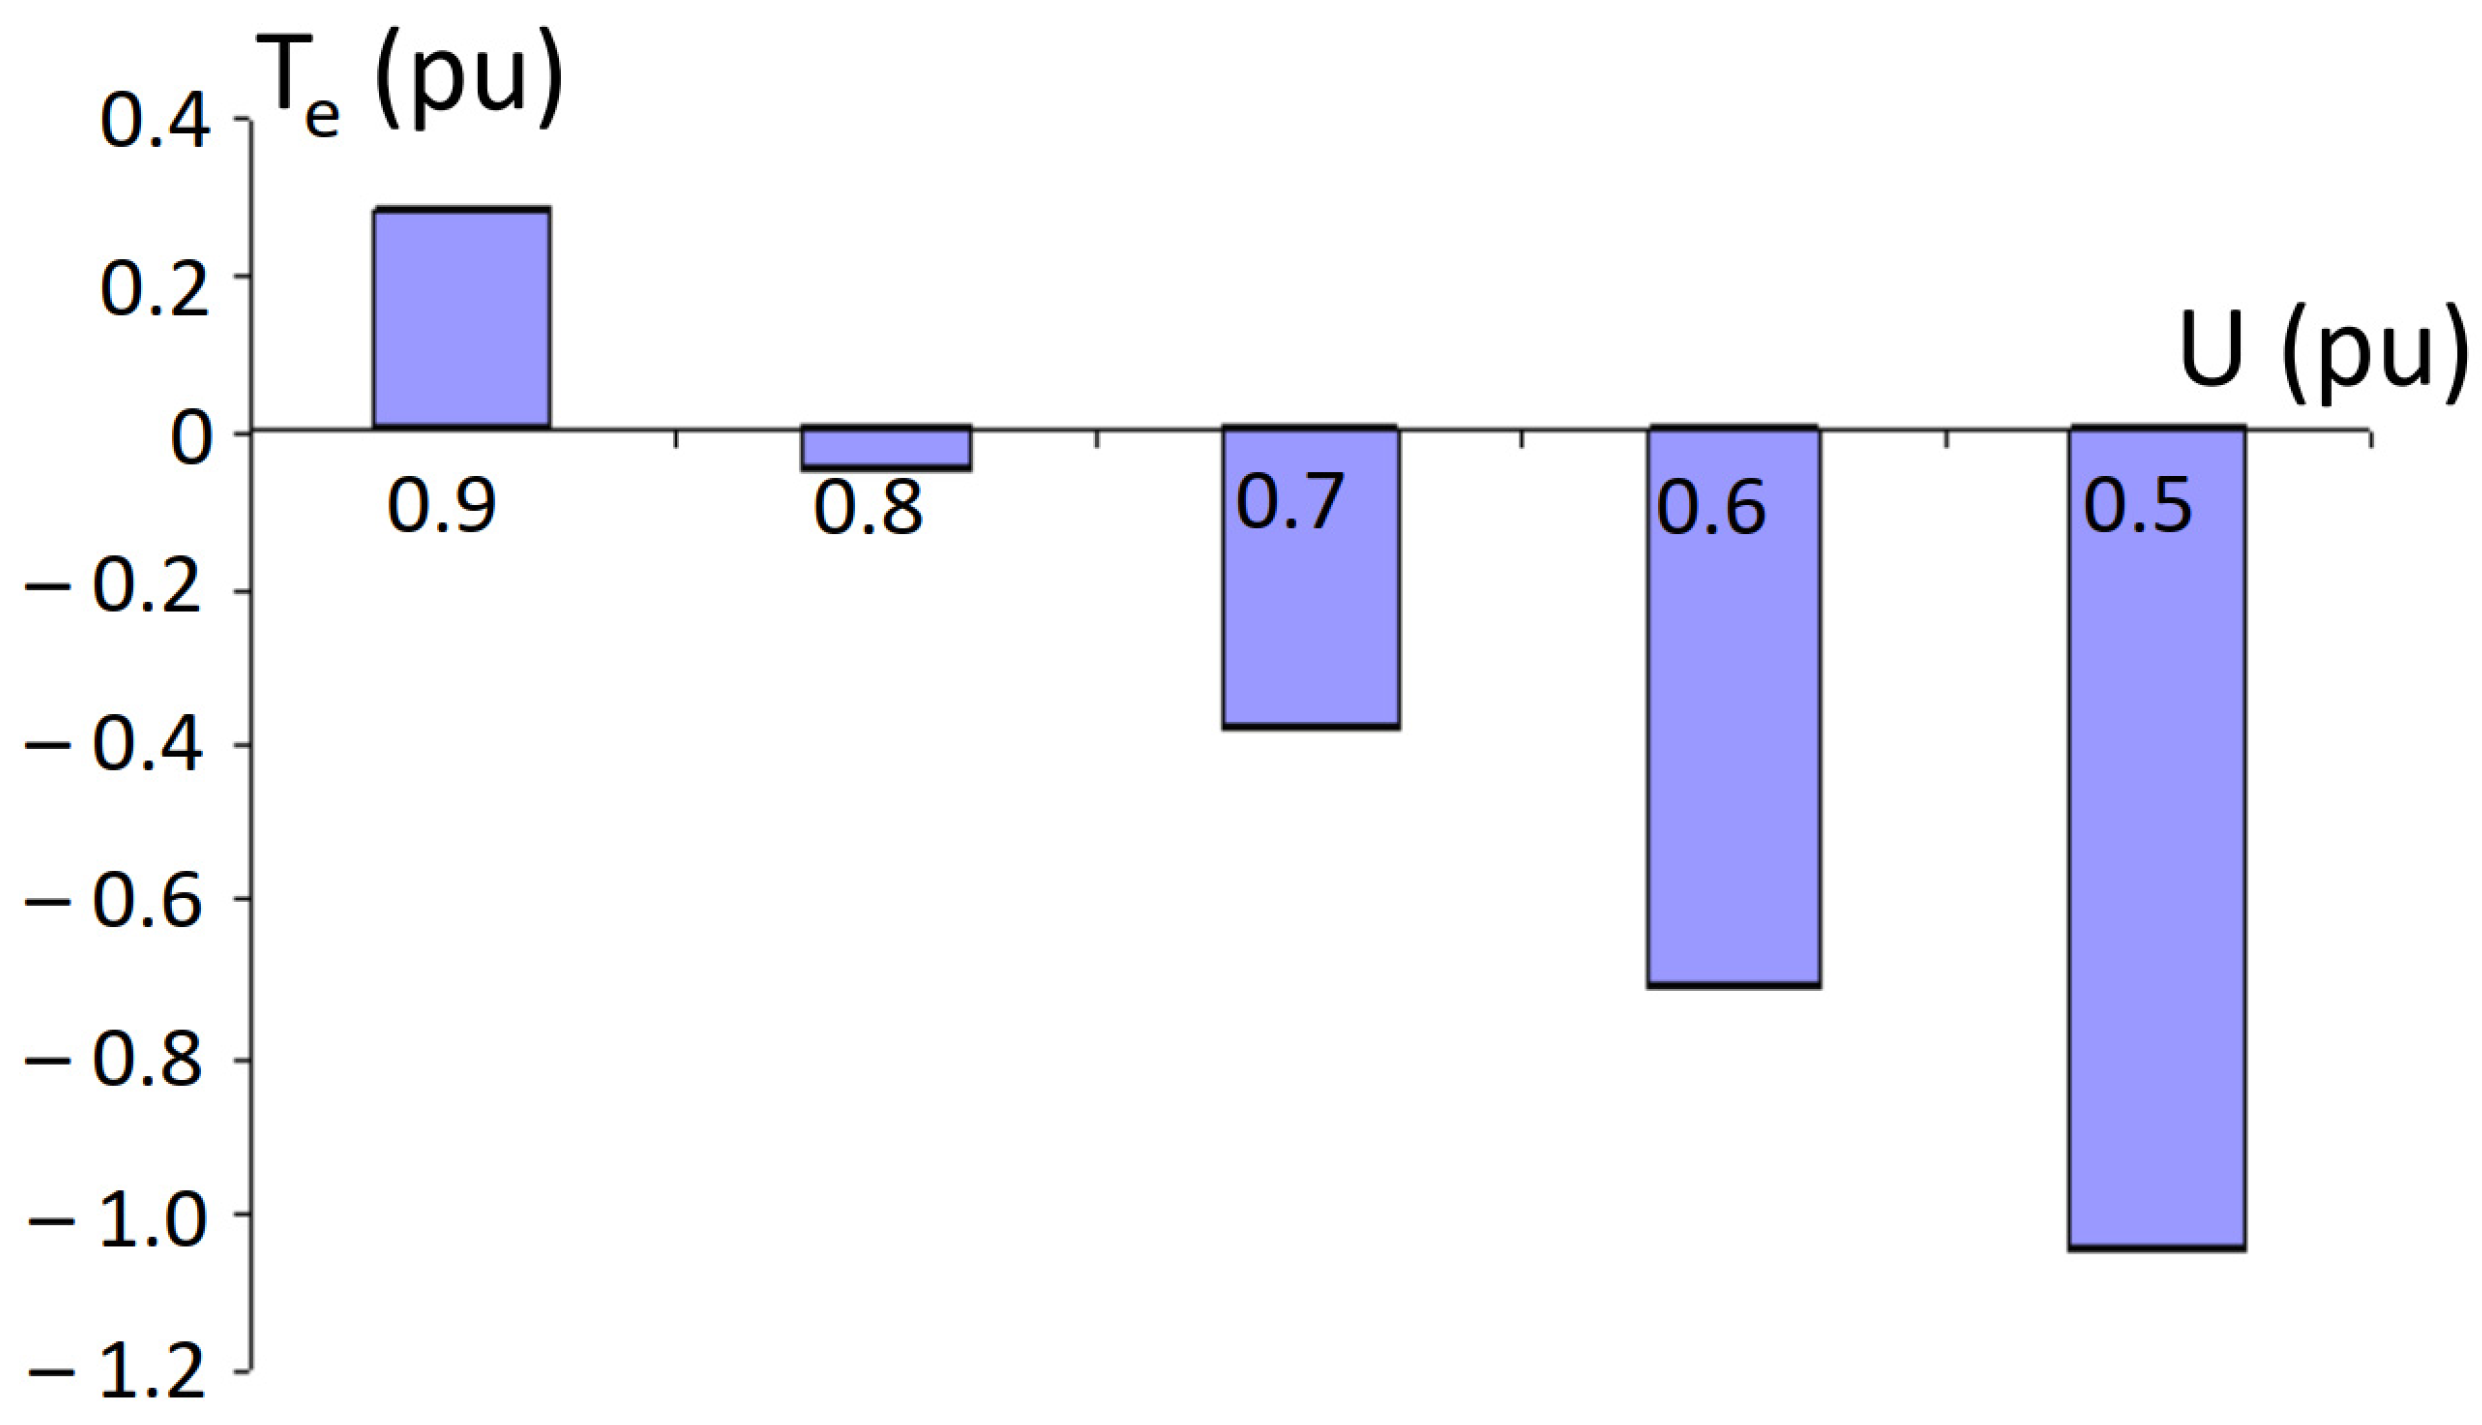
This paper analyzes the behavior of a three-phase induction motor (IM) during voltage sags in the supply network and its subsequent re-acceleration following voltage recovery. A dynamic mathematical model based on the two-axis (d,q) representation of the IM is developed, taking into account variations in supply voltage, electromagnetic torque, and stator currents over time. The model enables a detailed assessment of motor stability and transient behavior when the supply voltage falls below nominal levels. The analysis covers sag depths of 0.9–0.5 and interruption durations of 0.14 s and 1.14 s, quantifying stator currents and electromagnetic torque both at the instant of the dip and within the first cycles after recovery. Particular attention is given to identifying the conditions under which the IM may fail to re-accelerate or transition into generator mode, depending on the depth and duration of the voltage sag and the type of mechanical load. The study includes simulations for a 0.75 kW IM under both constant and variable torque conditions, as well as different types and durations of short-circuit faults in the supply system. Results show that sag duration has little effect at sag onset but strongly influences recovery inrush and torque oscillations; shorter interruptions yield lower recovery currents. The findings provide practical insights for the design of more robust power supply infrastructures and the refinement of motor control and protection strategies.
1. Introduction
An IM is an electrical machine that converts electrical energy into mechanical energy [1]. An IM consists of two main parts: the stator, which includes the frame, cooling fan, and windings, and the rotor, which is mechanically coupled to the load and produces torque to perform mechanical work. The most common type is the squirrel-cage rotor, made of cast aluminum bars short-circuited by end rings, providing reliable operation in standard industrial applications [2].
According to a recent global market analysis, electric motors—particularly three-phase IMs—continue to dominate industrial applications due to their simplicity, robustness, and energy efficiency. The global electric motor market, valued at USD 134.2 billion in 2023, is projected to reach USD 259.1 billion by 2033, with a compound annual growth rate (CAGR) of 6.8% [3]. Three-phase IMs are widely used in applications such as pumps, compressors, conveyor systems, and fans [4,5,6,7,8]. Their simple construction and low maintenance requirements make them indispensable in key sectors, including manufacturing, transportation, and energy [9,10,11,12,13].
A deep understanding of the operating modes of three-phase IM is essential not only for their optimal design and control but also for ensuring reliable performance and timely diagnostics in industrial environments [14,15,16]. Engineers and technicians must analyze both steady-state and transient processes to design systems resilient to electrical disturbances, particularly voltage sags, which are frequently observed in real-world power networks. This necessity is supported by a growing body of research focusing on voltage sag detection, modeling, and mitigation techniques [17,18,19,20]. For example, Hao and Jin [21] developed a waveform clustering method to classify voltage sags and better understand disturbance patterns affecting motor performance. More recently, Varetsky and Gajdzica [22] examined the behavior of IMs in grids containing synchronous generators, highlighting their sensitivity to voltage dips and the resulting impact on power quality and operational stability. Additionally, Petronijević et al. [23] proposed an enhanced override control strategy for IMs using Direct Torque Control, aimed at maintaining performance during voltage sag conditions.
The ability of electric motors to re-accelerate plays a crucial role in maintaining the continuity of industrial processes [24,25]. Re-acceleration (self-start after voltage sag) refers to the phenomenon in which, during a short-term voltage sag in the power supply network, the motor control circuits remain energized, and following voltage restoration, the motor accelerates back to its nominal speed—effectively performing a self-start without external intervention [26].
Voltage sags, typically caused by faults, motor starts, or switching operations, can significantly impact IM performance even when the motor is running in the steady state. A precise analysis of motor dynamics under such disturbances is essential for designing effective protection strategies and enhancing the overall reliability of electrical systems [27,28].
Among various power quality disturbances, voltage sags represent one of the most frequent and potentially disruptive phenomena in industrial networks. According to reports by IEEE and CIGRÉ, voltage sags account for up to 80% of all short-duration power quality disturbances [29].
The primary causes of voltage sags include starting large electrical loads (such as compressors and transformers), short circuits in distribution networks, emergency switching operations, circuit breaker activity, as well as external factors such as lightning strikes and thunderstorms [30,31,32,33].
The adverse effects of voltage sags on three-phase IMs have been extensively studied due to their critical impact on industrial operations. These disturbances can cause inrush currents, a sharp drop in electromagnetic torque, unintentional motor stoppage, overheating, insulation degradation, protection device tripping, and significant production and downtime losses—particularly in the textile, food-processing, and manufacturing sectors [34,35].
Multiple studies confirm these risks. Elgammal et al. [36] demonstrated that voltage sags induce excessive current and torque oscillations in IMs, increasing the likelihood of thermal damage and reduced system performance. ElShennawy et al. [37] reported that sag-induced disturbances can interrupt refinery operations, underscoring the importance of voltage quality in continuous-process industries. Motoki et al. [38] quantified the economic consequences of sag-related shutdowns in industrial systems, showing that even short-duration voltage sags can result in substantial financial losses. Hardi et al. [39] analyzed various sag profiles and their respective impacts on motor performance, highlighting how certain voltage patterns pose a higher risk for operational disruption.
In the context of reliability assessment, Živković et al. [40] introduced a stress-testing methodology based on mission profiles for electric motor drives, emphasizing the need to incorporate voltage sag scenarios into long-term durability evaluations.
In many industrial installations, three-phase IMs are directly connected to the power supply network without intermediate disconnecting devices [41,42]. This configuration is justified by their high reliability, resilience to short-term voltage sags, and the operational requirement for uninterrupted equipment functionality. Disconnecting the motor during brief voltage disturbances—such as those caused by the startup of large loads or temporary faults—can lead to process interruptions, loss of synchronization, and significant delays. Therefore, unless the voltage sag is severe, IMs are typically left connected and allowed to operate through the disturbance, albeit with a temporary reduction in torque [43,44]. Another advantage of this approach is the motor’s ability to re-accelerate once the voltage is restored [45,46,47].
From a system stability perspective, maintaining the connection of IMs to the power supply during voltage sags and short-term interruptions—rather than disconnecting the unit—is advantageous. This approach minimizes current surges during re-acceleration and contributes to smoother system operation. However, it also introduces a quasi-start condition, which can result in transient effects comparable to, or even more severe than, those observed during conventional direct starting [48].
A clear understanding of IM behavior under voltage sag and recovery conditions is essential for the design of reliable and energy-efficient power systems. Such disturbances may lead to motor stalling, inrush currents, and delays in system restoration, while also altering key operating parameters such as electromagnetic torque, winding temperature, and re-acceleration dynamics [36,49,50,51].
Accurate modeling of both steady-state and transient processes under these conditions enables the assessment of self-starting feasibility, optimization of protection and transfer schemes, and development of more resilient power infrastructures—particularly in critical industrial settings.
In this study, the re-acceleration behavior of a three-phase IM is examined through dynamic mathematical modeling. The analysis includes a theoretical overview of the reacceleration process, the formulation of a two-axis (d,q) motor model, and time-domain simulations under voltage sag conditions. Special attention is given to the influence of mechanical load type, sag depth, and sag duration on the motor’s ability to self-start. In the simulations, the supply voltage is reduced during the sag and restored after fault clearing in accordance with relay protection and circuit breaker operation; cases include constant- and variable-torque loads, and shaft speed, stator current, and electromagnetic torque are evaluated at sag onset and in the initial period after recovery.
Additionally, the study identifies and classifies typical fault scenarios in power supply networks—especially those involving directly connected motors—that commonly lead to voltage sags. These include short circuits at various points within the grid, such as transmission lines, transformer terminals, and busbars. For each fault case, the expected sag depth and duration are estimated based on the fault location and circuit breaker clearing time. This fault-based sag profiling is essential for evaluating re-acceleration feasibility under realistic industrial conditions.
2. Nature of Voltage Sags and Their Impact on IMs
One of the most common disturbances in the operation of IMs is a loss of power supply, typically resulting from faults in the supply network. Such disturbances interrupt or significantly limit the transfer of active power from the source to the motor, rendering it insufficient to maintain the proper and continuous functioning of the motor–mechanical load system [52].
The fault-induced nature of these power disturbances defines the specific way they affect IMs connected to the network. Depending on the fault location and type, the electrical connection between the power source and the motor may be either completely severed for a short duration or preserved, albeit with a significantly reduced voltage level at the motor terminals. Based on this, two main categories of disturbances are typically distinguished: complete interruptions of power supply and deep voltage sags [53].
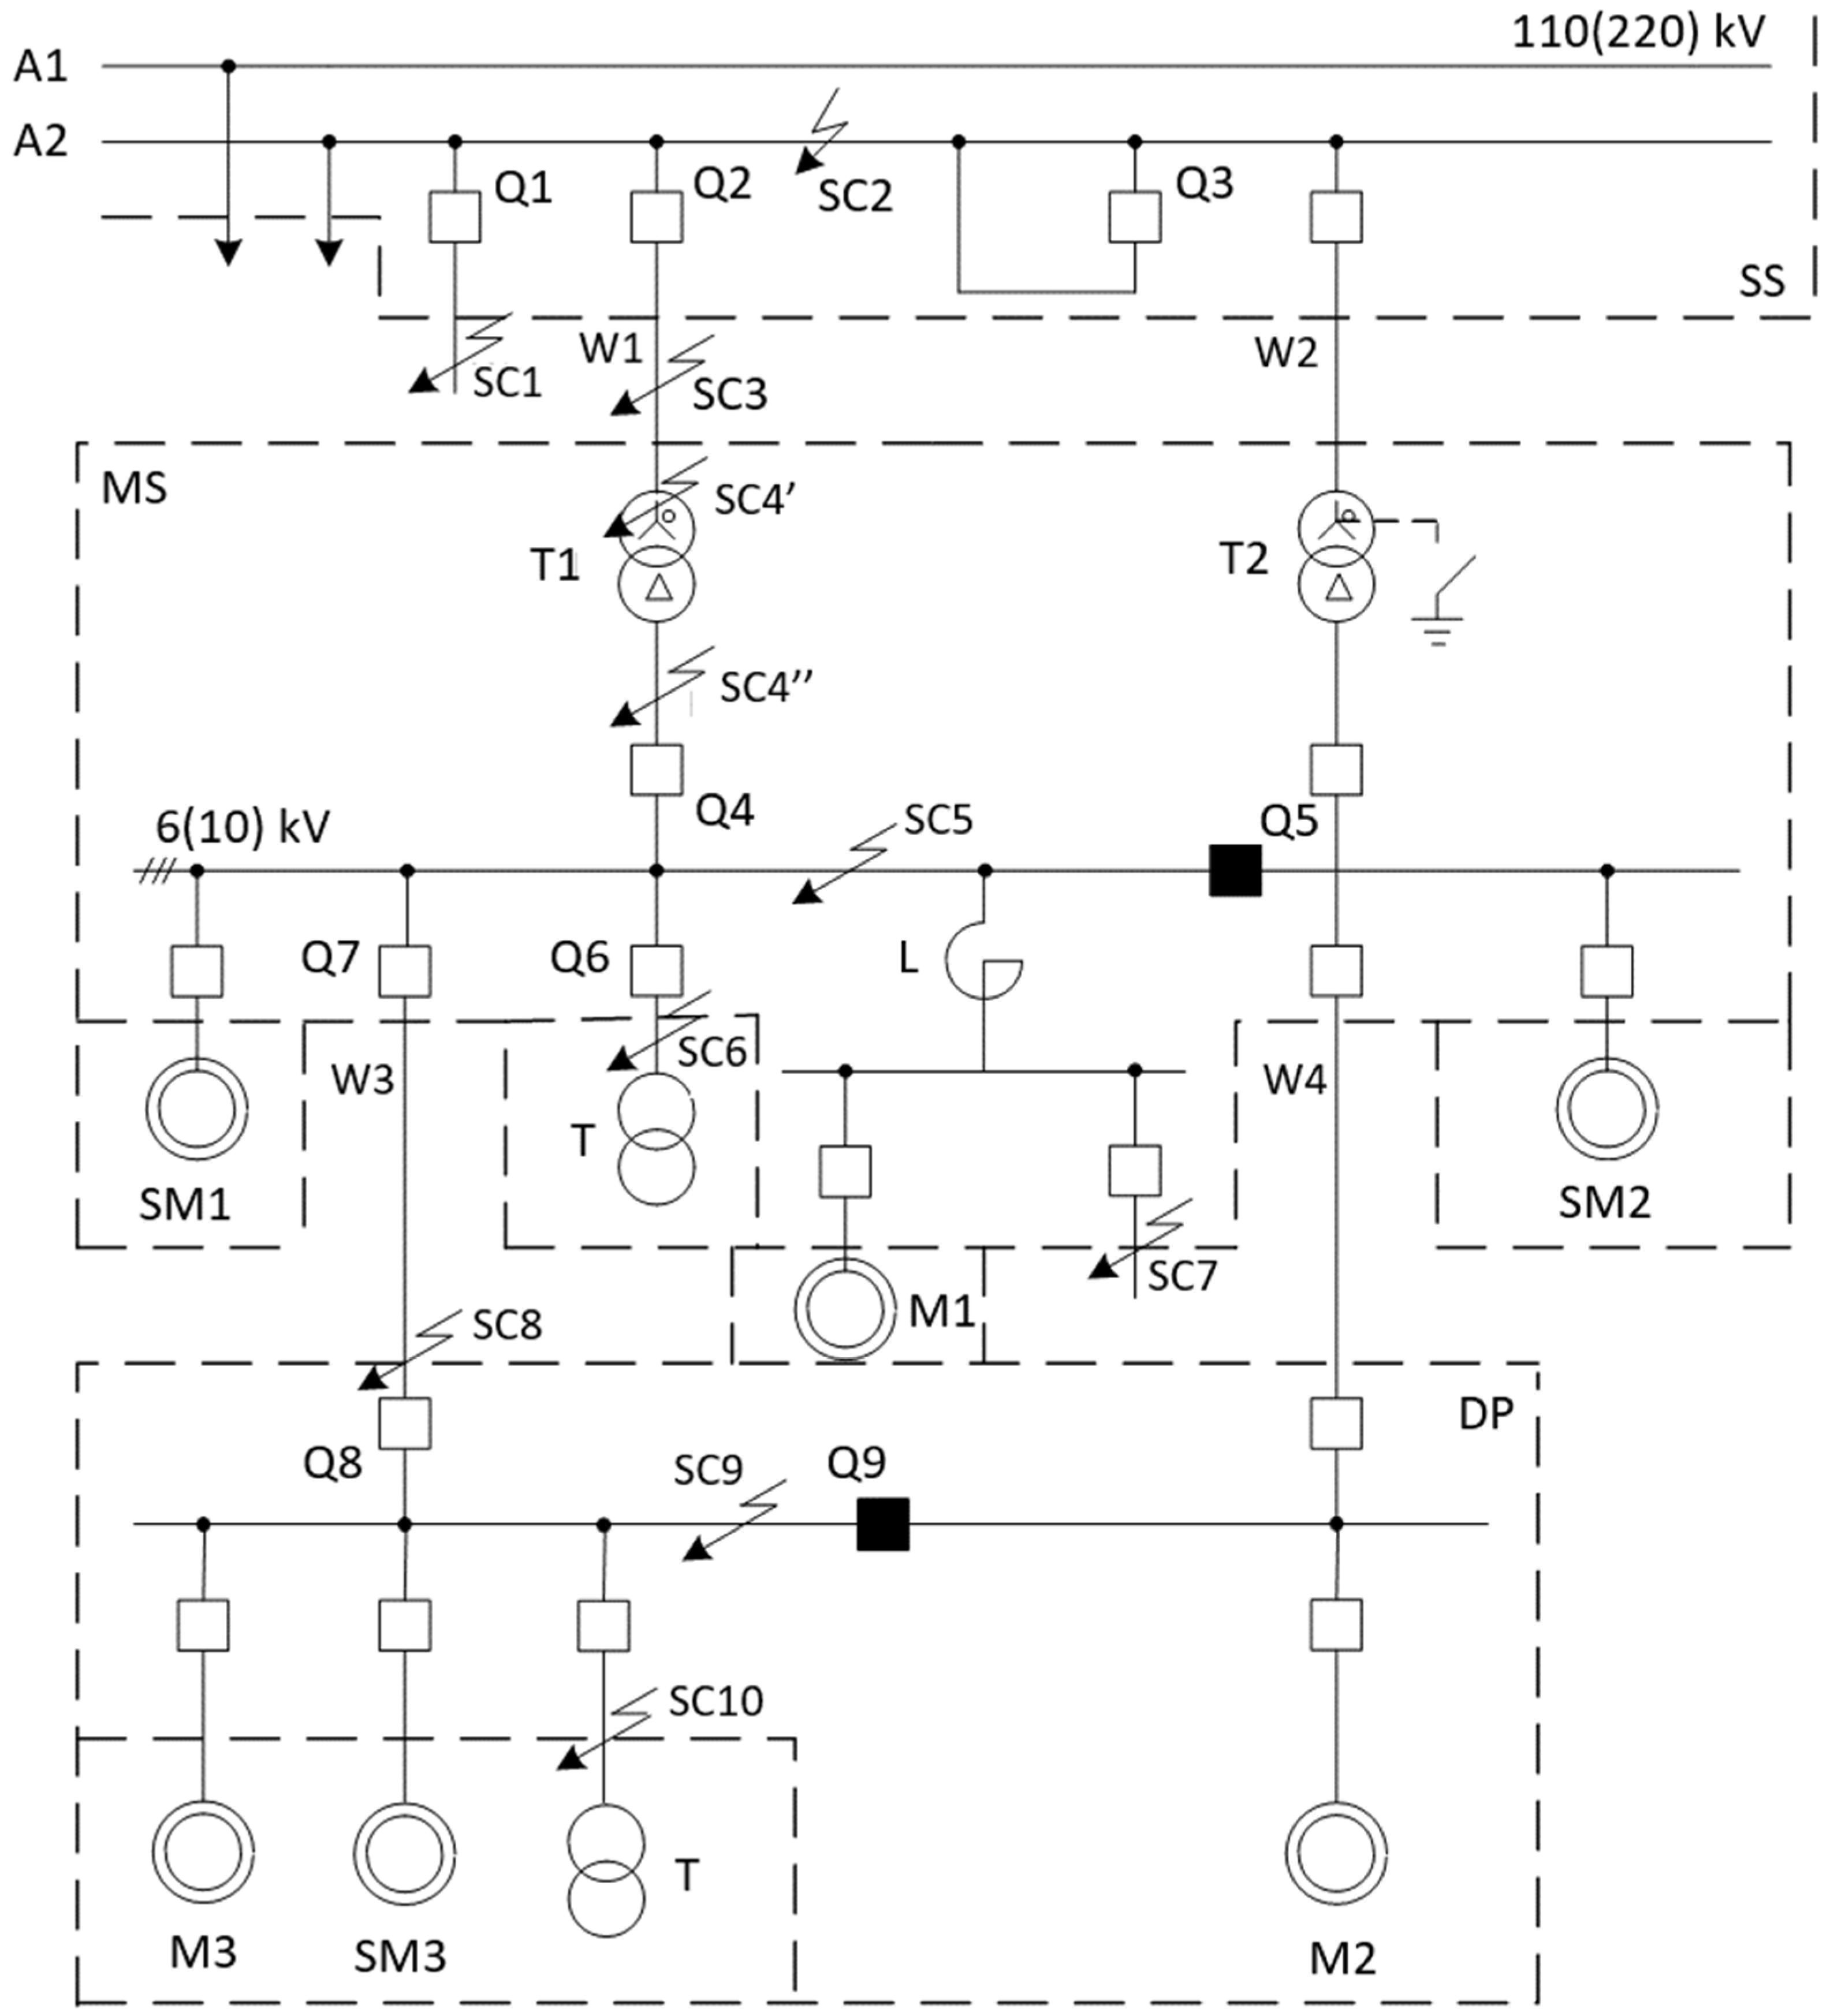
The power supply diagram in Figure 1 shows that short-circuit faults at locations SC1, SC6, SC7, and SC10 do not break the electrical connection between the IM and the substation (SS) busbars. However, the transfer of active power from the source is either completely interrupted or severely limited. Voltage recovery begins immediately after the fault is cleared—specifically, following the operation of the protection system [54], and can be expressed as follows:
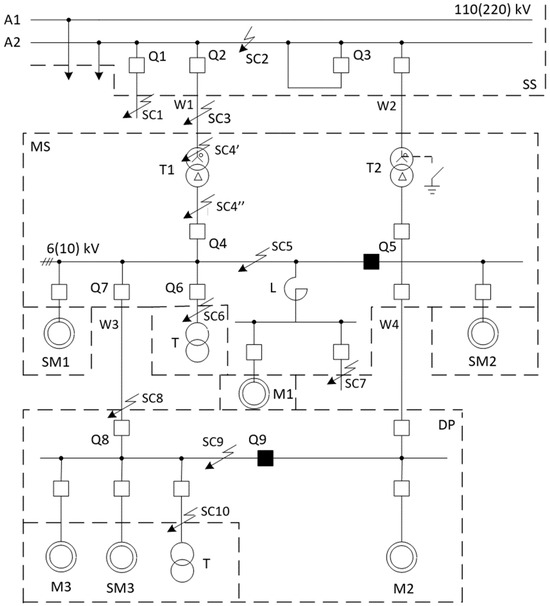
Figure 1.
Schematic diagram of an industrial power supply system illustrating possible fault locations (SC1–SC10) that may lead to voltage loss at motor terminals. The system includes high-voltage lines (A1, A2), a substation (SS), a main step-down substation (MS), and a distribution point (DP). Transformers (T1, T2), synchronous motors (SM1–SM3), IMs (M1–M3), circuit breakers (Q1–Q10), and feeder lines (W1–W4) are shown. L denotes a reactor.
—moment of voltage recovery,
—relay protection response time,
—circuit breaker opening time.
If a component of the upstream power system—such as busbars, a feeder line (W1 or W2), or power transformer T1—is disconnected, voltage restoration at the motor terminals occurs through the closing of a circuit breaker, which reconnects the motor to the unaffected part of the supply network.
When this switching is performed automatically—for example, by means of an automatic transfer switch (ATS) or automatic reclosing (AR)—the total power interruption time can be expressed as follows:
where
—parameter deviation time, i.e., the interval during which electrical parameters deviate from nominal values until reaching the protection threshold, thereby initiating the automatic switching process,
—response time of the automatic transfer system (e.g., ATS or AR),
—circuit breaker closing time.
The main step-down substation (MS) is supplied by two overhead transmission lines rated at 110–220 kV, which are connected to a double-busbar system at the utility transmission substation (TS). Power transformers T1 and T2 in the MS operate independently, each feeding a separate section of the 6–10 kV busbars. These busbar sections are linked by a sectional circuit breaker Q5, which remains open under normal operating conditions.
Consumer loads are connected to the main substation (MS) busbars via cable feeders. These feeders can be either reactor-compensated—equipped with a current-limiting reactor connected directly to the busbar without a circuit breaker—or non-compensated. In certain configurations, electric motors are connected directly to the 6–10 kV MS busbars; however, more commonly, they are supplied via distribution switchboards (DS), which are located either near the workshop or installed directly within it.
In addition to supplying IMs and SMs, the distribution switchboards also feed power transformers (T), which deliver low-voltage electricity (0.4–0.66 kV) to end users.
The majority of short-circuit (SC) faults in 110–220 kV networks are single-phase faults, accounting for approximately 75–85% of all cases. Analytical studies indicate that during such voltage sags, two of the line-to-line voltages generally remain stable—with fluctuations of about 10%—while the third line voltage can experience a significant drop of 50–70% [55,56]. If SMs are connected to the MS busbars, voltage levels tend to remain close to nominal—or may even increase slightly—due to excitation system boosting [57].
In contrast, three-phase and two-phase short circuits occurring at the same locations cause significantly deeper voltage sags at the terminals of all motors supplied by the MS [58].
The clearing time for such faults—during which the positive-sequence voltage at the transmission substation (TS) busbars drops below 0.6 —is typically less than 0.15–0.2 s. These faults fall within the protection zones of high-speed relay protection stages operating in 110–220 kV networks.
A short circuit at location SC1 generally has a negligible effect on motor operation. In contrast, faults at SC2 and SC3 disrupt the power supply to all consumers fed by transformer T1, effectively isolating them from the upstream power source.
Voltage restoration at the TS busbars or along feeder line W1 is typically performed via automatic reclosing (AR), which operates with a typical delay of no less than s.
Therefore, the minimum duration of power loss experienced by the IMs can be estimated as follows:
Short circuits occurring inside the tank of power transformer T1 are rarely multiphase, and three-phase faults are virtually excluded [59,60]. However, such faults are more likely to occur at the transformer’s low-voltage terminals or in their immediate vicinity (designated as fault location SC4″). In these cases, the voltage in the 6–10 kV network drops sharply.
These faults are typically cleared within the combined response time of the transformer’s primary protection system and the mechanical opening time of the associated circuit breaker, amounting to approximately 0.15 s [61,62].
Busbar faults in the metal-clad switchgear, as well as short circuits on equipment located within the switchgear (fault location SC5), have more severe consequences and are therefore cleared by high-speed relay protection devices within 0.2–0.25 s. In this scenario, the fault is cleared by circuit breaker Q4, and simultaneously, the circuit breakers of the motors and feeder line W3 are tripped. ATS is typically not employed for faults at point SC5. As a result, IM M1 and SM1, which are connected to this section of the 6–10 kV busbars at the main substation (MS), experience a prolonged power outage until the damaged switchgear is fully repaired.
For motors M3 and SM3, power supply restoration is achieved by the automatic operation of circuit breaker Q9, following the prior disconnection of circuit breaker Q8. In this scenario, the total power interruption duration can be expressed as follows:
where —operating time of the automatic transfer system controlling sectional circuit breaker Q9.
Short circuits at fault locations SC6 and SC10, while associated with a significant voltage drop at the motor terminals, are typically cleared quickly—within approximately 0.14 s—since they generally fall within the protection zone of the overcurrent relays installed on the power transformers.
For faults occurring outside this protection zone, the voltage level at the busbars usually remains above .
3. IM Behavior During Voltage Sags and Re-Acceleration
3.1. Re-Acceleration Scenarios and Practical Relevance
Re-acceleration refers to the automatic restarting of motors following unintentional deceleration caused by voltage disturbances in the power system, such as voltage sags, outages, or bus transfers. Depending on the connected load and the minimum available fault current, re-acceleration can occur either instantaneously or in a staged manner, which is designed to ensure that the bus voltage remains within acceptable limits during the restart process [63].
This approach is particularly valuable for maintaining process continuity during voltage sags. Re-acceleration is considered successful if, following voltage recovery, the motor returns to its nominal speed and sustains long-term stable operation, delivering the required torque and maintaining the load without triggering protection devices [64].
The re-acceleration capability of electric motors plays a key role in the effective functioning of power system automation. When a power outage or severe voltage sag is promptly cleared by relay protection and automatic switching, and the motor successfully re-accelerates, the event is typically not classified as a fault-induced shutdown, and no equipment damage is observed [63]. However, if re-acceleration fails, the motor may stall, resulting in process interruptions—particularly in continuous or safety-critical industrial operations such as those in the chemical or petrochemical sectors [65,66].
Re-acceleration of IMs typically occurs under two main scenarios:
- During severe voltage sags caused by nearby short circuits, where motors remain connected to the supply network and experience temporary deceleration before re-accelerating once the voltage is restored [35,67];
- Following short-duration power interruptions, during which motors are completely disconnected and then automatically reconnected via ATS or AR systems [68].
While re-acceleration is effective in many industrial settings, automatic motor restarts may be inappropriate for specific applications—such as compressors handling flammable substances or overhead cranes—where uncoordinated restarts may introduce safety hazards.
The success of motor restart depends heavily on the duration of the power interruption. Two outcomes are typically observed:
- If the interruption is brief, the motor retains some residual rotational speed at the time of voltage recovery, facilitating a smoother re-acceleration.
- If the interruption is extended, the motor comes to a complete stop, requiring full re-acceleration from standstill.
In standard industrial practice, re-acceleration is typically performed in a single stage, where all motors are reconnected to the supply simultaneously [67]. However, in systems with limited capacity to support concurrent restarts, a staggered (multi-stage) re-acceleration strategy may be employed [35]. In such cases, non-critical motors are either temporarily excluded or reconnected only after essential loads complete their acceleration phase, thereby avoiding overloading the power supply system [24].
3.2. Differences Between Re-Acceleration and Controlled Motor Starting
Re-acceleration of electric motors has the following key differences from conventional motor starting:
- 1.
- At the time of voltage recovery, most motors retain some residual angular speed. This remaining rotation contributes to a higher initial electromagnetic torque during reacceleration compared to starting from standstill—assuming an identical supply voltage.
- 2.
- Upon disconnection from the power supply, a motor or group of motors may generate a residual electromotive force (EMF) at the substation busbars. When reconnected to the power source, the vector of the transient (periodic) current component is equal to [69]:
—supply voltage vector;
—residual EMF vector at the motor terminals;
—total equivalent impedance of the network and motor circuit.
- 3.
- Re-acceleration typically occurs when the driven mechanisms are under load, which may result in a longer acceleration time and increased motor winding temperatures due to elevated currents compared to nominal values.
- 4.
- Simultaneous restart of multiple motors imposes a significant load on the power network, resulting in voltage dips at motor terminals and a corresponding decrease in developed torque, which may compromise re-acceleration stability.
3.3. Main Transient Processes During Re-Acceleration
Stage 1—IM Run-Down (Single or Grouped):
Single motor run-down refers to a scenario where an IM is disconnected from the power supply and decelerates independently—either fully isolated from other motors or electrically connected in a way that prevents significant mutual interaction.
This typically occurs when a reactor or transformer is installed between the motor and the rest of the network [70].
An independent run-down describes the natural deceleration of a single motor after disconnection from the supply. If strong electromagnetic coupling exists between disconnected motors, the process is referred to as group run-down [71]. In general, the run-down behavior is governed by the mechanical characteristics of the driven load.
When a nearby short circuit causes reverse feeding through the motor terminals, the run-down follows a steeper trajectory due to the development of additional braking torque.
During a run-down, every disconnected motor generates a residual EMF in its stator winding. For IMs, this EMF is relatively small, while for SMs, it can be significant [72]. The higher the residual EMF, the larger the transient inrush current upon voltage recovery—particularly if the reconnection occurs during an unfavorable phase angle.
From this standpoint, it is often advisable to introduce a sufficiently long delay before voltage restoration (i.e., by adjusting the timing of the ATS or AR) to allow the residual EMF to decay, ensuring that the resulting current (Equation (5)) remains within acceptable limits.
Stage 2—Re-acceleration and Restoration of Steady-State Operation:
Re-acceleration occurs at a reduced voltage, the level of which depends on the network parameters, the motors involved in the restart, and the other connected loads. The electromagnetic torque developed by IMs during re-acceleration is proportional to the square of the supply voltage [69].
Re-acceleration is considered successful if, under reduced voltage, the motor delivers sufficient excess torque to accelerate the mechanism to its nominal speed, without the winding temperature exceeding the permissible limit during this process. From this standpoint, the power outage duration should be as short as possible to minimize motor heating and ensure a reliable restart.
Depending on specific operating conditions, two main types of automatic motor restart can be distinguished:
- In the first case, the motor restarts with the mechanical load still applied, which may increase the re-acceleration time and thermal stress on the windings.
- In the second case, the restart occurs with temporary unloading of the mechanism, reducing the torque required during acceleration and improving the chances of a successful restart under reduced voltage.
The choice between these approaches depends on system design, process requirements, and the capabilities of the automation and protection systems.
3.4. Speed Characteristics During IM Run-Down
In re-acceleration calculations, it is essential to first determine the motor speed or slip at the moment of power restoration (i.e., the residual speed) [63].
The value of the residual speed at any given time after a power supply disturbance is primarily determined by the moment of inertia (flywheel effect), the mechanical load on the system, and the type of mechanical characteristic of the driven equipment.
The speed-time relationship after disconnection is most easily determined in the case of free run-down. In this case, the equation of motion takes the following form [73]:
where
—load torque, ;
—rotor angular speed, rad/s;
—equivalent moment of inertia of the system, kg·m2.
The equivalent moment of inertia is equal to the sum of the motor’s own moment of inertia and the moment of inertia of the driven mechanism (load) referred to the motor shaft:
where
—nominal angular speed of the mechanism (load);
—nominal angular speed of the IM;
—moment of inertia of the IM;
—moment of inertia of the load.
If torque and angular frequency are expressed in per unit values, taking as base the rated torque and synchronous motor frequency, Equation (6) can be rewritten as follows [69]:
where
—machine acceleration (or deceleration) time at constant load equal to rated, s.
It can be determined by
where
and —synchronous and rated angular speed, rad/s;
—rated torque of the motor, ;
—rated power of the motor, W.
The angular speed may be expressed via rotational speed n (min−1):
Different machines load torques are generally expressed by the following equation:
or, when expressed in per unit values
where
—initial torque at s = 1 or , usually defined by friction forces;
—motor load factor at synchronous speed (load torque at , expressed as a fraction of rated motor torque);
—exponent characterizing the driven mechanism (load).
From (7) and (12), the following relation is obtained:
For machines with practically constant load torque (conveyers, crushers, ball crushers, piston compressors, etc.) index . Substituting into (13) gives the dependence of speed on run-down time:
where
—initial angular speed (at ), ;
—deceleration time of the drive system under a constant load torque equal to :
For machines with load torque, this is proportional to speed (e.g., DC generators, or when overcoming constant resistance), . In this case, (14) yields
where ;
If friction torque and we may ignore it, Equation (16) reduces to
For machines with a “fan-type” mechanical characteristic—where the load torque is proportional to the square of the speed (e.g., fans, smoke exhausters, gas blowers, centrifugal pumps, marine propellers)— . In this case, from (13) the following expression is obtained:
where
If the friction torque is small and can be neglected, Equation (19) takes the form
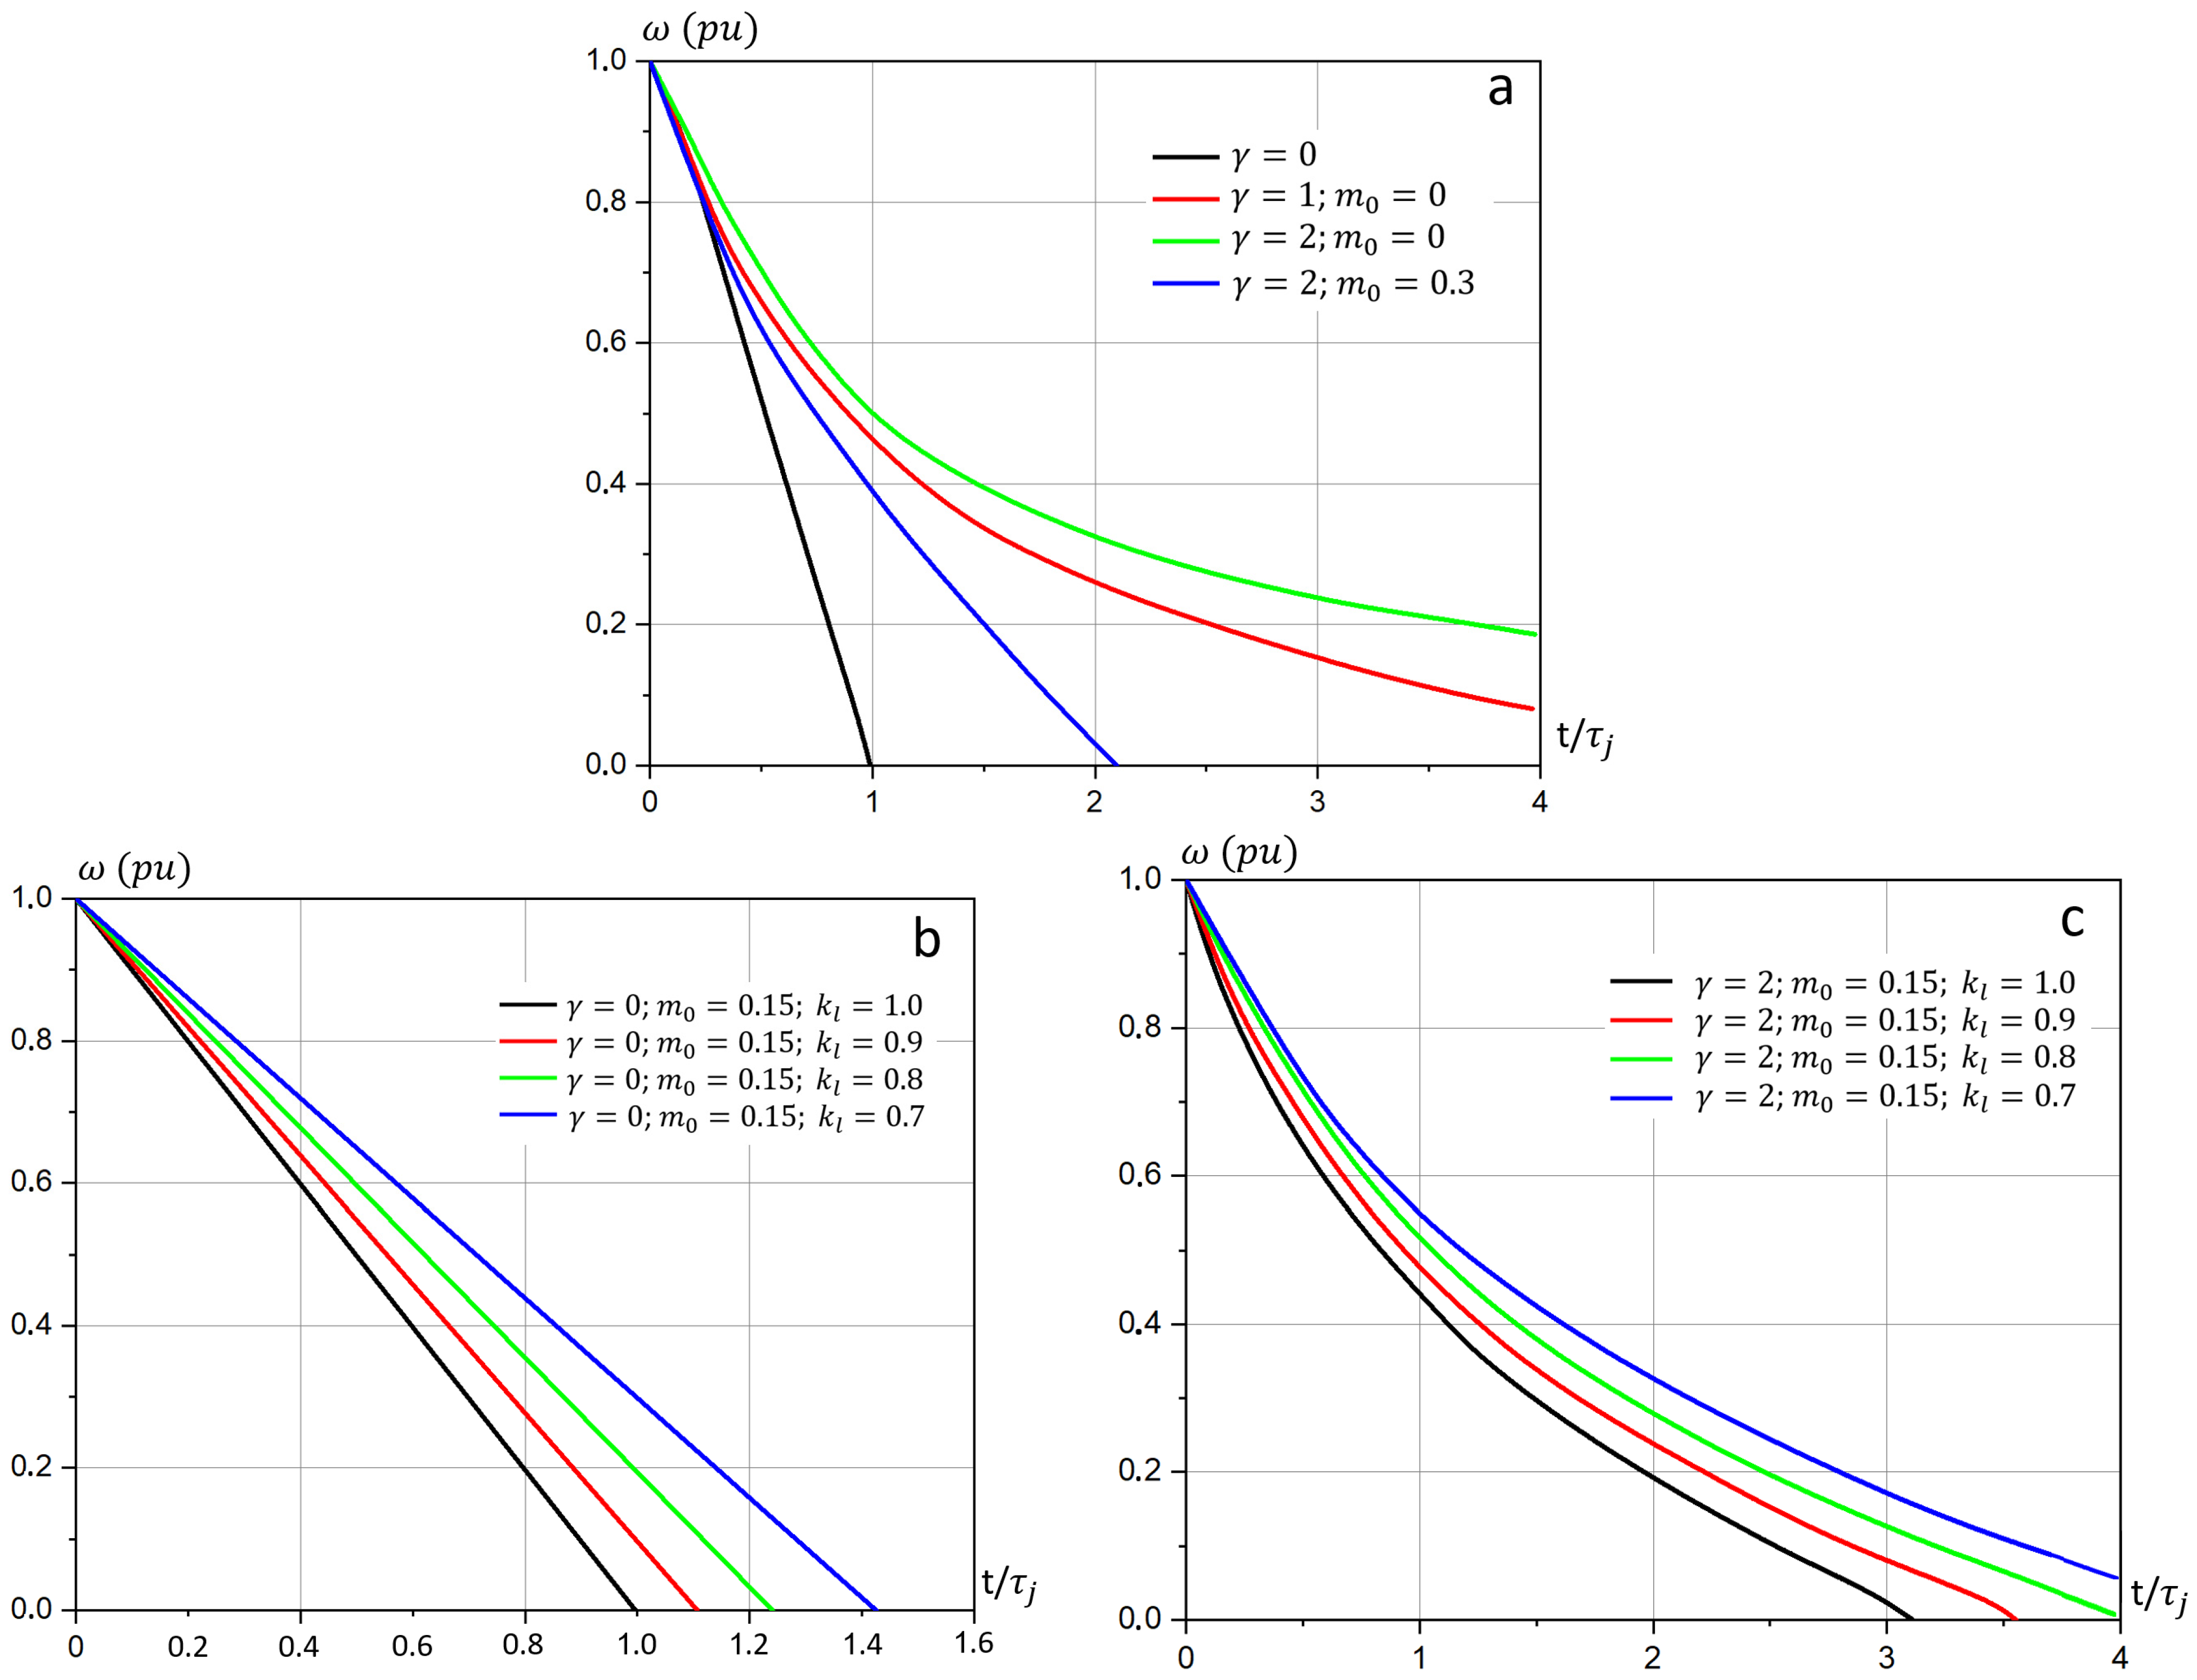
Figure 2 shows the angular speed decay of an IM during run-down under various mechanical load characteristics and operating conditions.
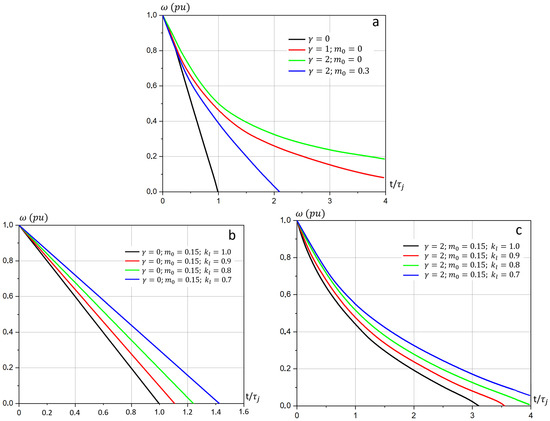
Figure 2.
Angular speed variation during run-down of IMs with different mechanical characteristics and load factors: (a) Machines with various mechanical characteristics at identical time constant ; (b) Constant load torque () at different motor load factors; (c) Fan-type mechanical characteristic () at different load factors.
As illustrated in Figure 2a, in the initial stage following supply voltage interruption, motors with different mechanical characteristics demonstrate similar deceleration behavior, provided they share the same mechanical time constant This observation implies that, for short-duration voltage interruptions (significantly shorter than ), the change in angular speed can be reliably estimated using unified analytical expressions (14)–(18), regardless of the specific load type.
As the run-down progresses, differences in mechanical characteristics become more apparent. In particular, motors with a “fan-type” load (where the torque is proportional to the square of the speed, ) exhibit a slower deceleration rate due to the reduced braking torque at lower speeds, especially in the absence of significant friction.
Figure 2b illustrates the effect of the load factor on the run-down characteristics in the case of constant load torque (). The curves show how a higher load level prior to disconnection leads to faster deceleration. These results are based on expression (14). In contrast, Figure 2c displays deceleration curves for a “fan-type” load (), with the initial torque set at , calculated using (18).
The results confirm that both the mechanical characteristic of the driven load and the motor load factor significantly influence the shape and duration of the deceleration process.
These curves can be used to determine the residual angular speed of the IM by means of a graphical method. During run-down, the angular speed decreases more slowly (in per-unit terms) for IMs with higher moment of inertia, higher initial angular speed, higher exponent , and lower load levels in the operating regime.
4. Mathematical Model of IM Re-Acceleration
To simulate the IM start-up, voltage sag (run-down), and subsequent re-acceleration processes, an IM model formulated in the d,q coordinate system and expressed in terms of flux linkage derivatives is used. The system of equations can be written as follows [74]:
The torque balance equation is expressed as
The electromagnetic torque is given by
and the load torque is expressed as
where , , , —stator and rotor flux linkage components in the d,q coordinate system,
, , , —stator and rotor current components in the d,q coordinate system,
, , , , —IM parameters expressed in per-unit values,
, —stator applied voltage components,
, —coordinate system and rotor angular speed,
, —load and electromagnetic torques, respectively,
—the motor’s moment of inertia,
, —variable and constant torque coefficients of the motor.
Equation (21) can be transformed into matrix form as follows:
The algebraic equations linking flux linkages to currents can be expressed as
Denoting the matrices in (25) and (26) as
the IM model can be represented as
where
Substituting (28) into (27) gives
Since , (29) reduces to
Solving (30) for the current derivatives yields
where —is the inverse of matrix .
Thus, the mathematical model of the IM consists of the matrix Equation (31), which describe the transient electromagnetic processes, and the rotor motion Equation (22), which describes the mechanical transients. For a squirrel-cage IM, the rotor voltages and are assumed to be zero.
5. Simulation Results and Analysis
Using the model described in the previous section, the process of IM start-up, voltage sag (run-down), and subsequent re-acceleration is simulated. After the motor accelerates and reaches steady-state operation under a given load, a short circuit occurs at a certain point in the system (see Figure 1). As a result, the voltage at the busbars to which the IM is connected drops.
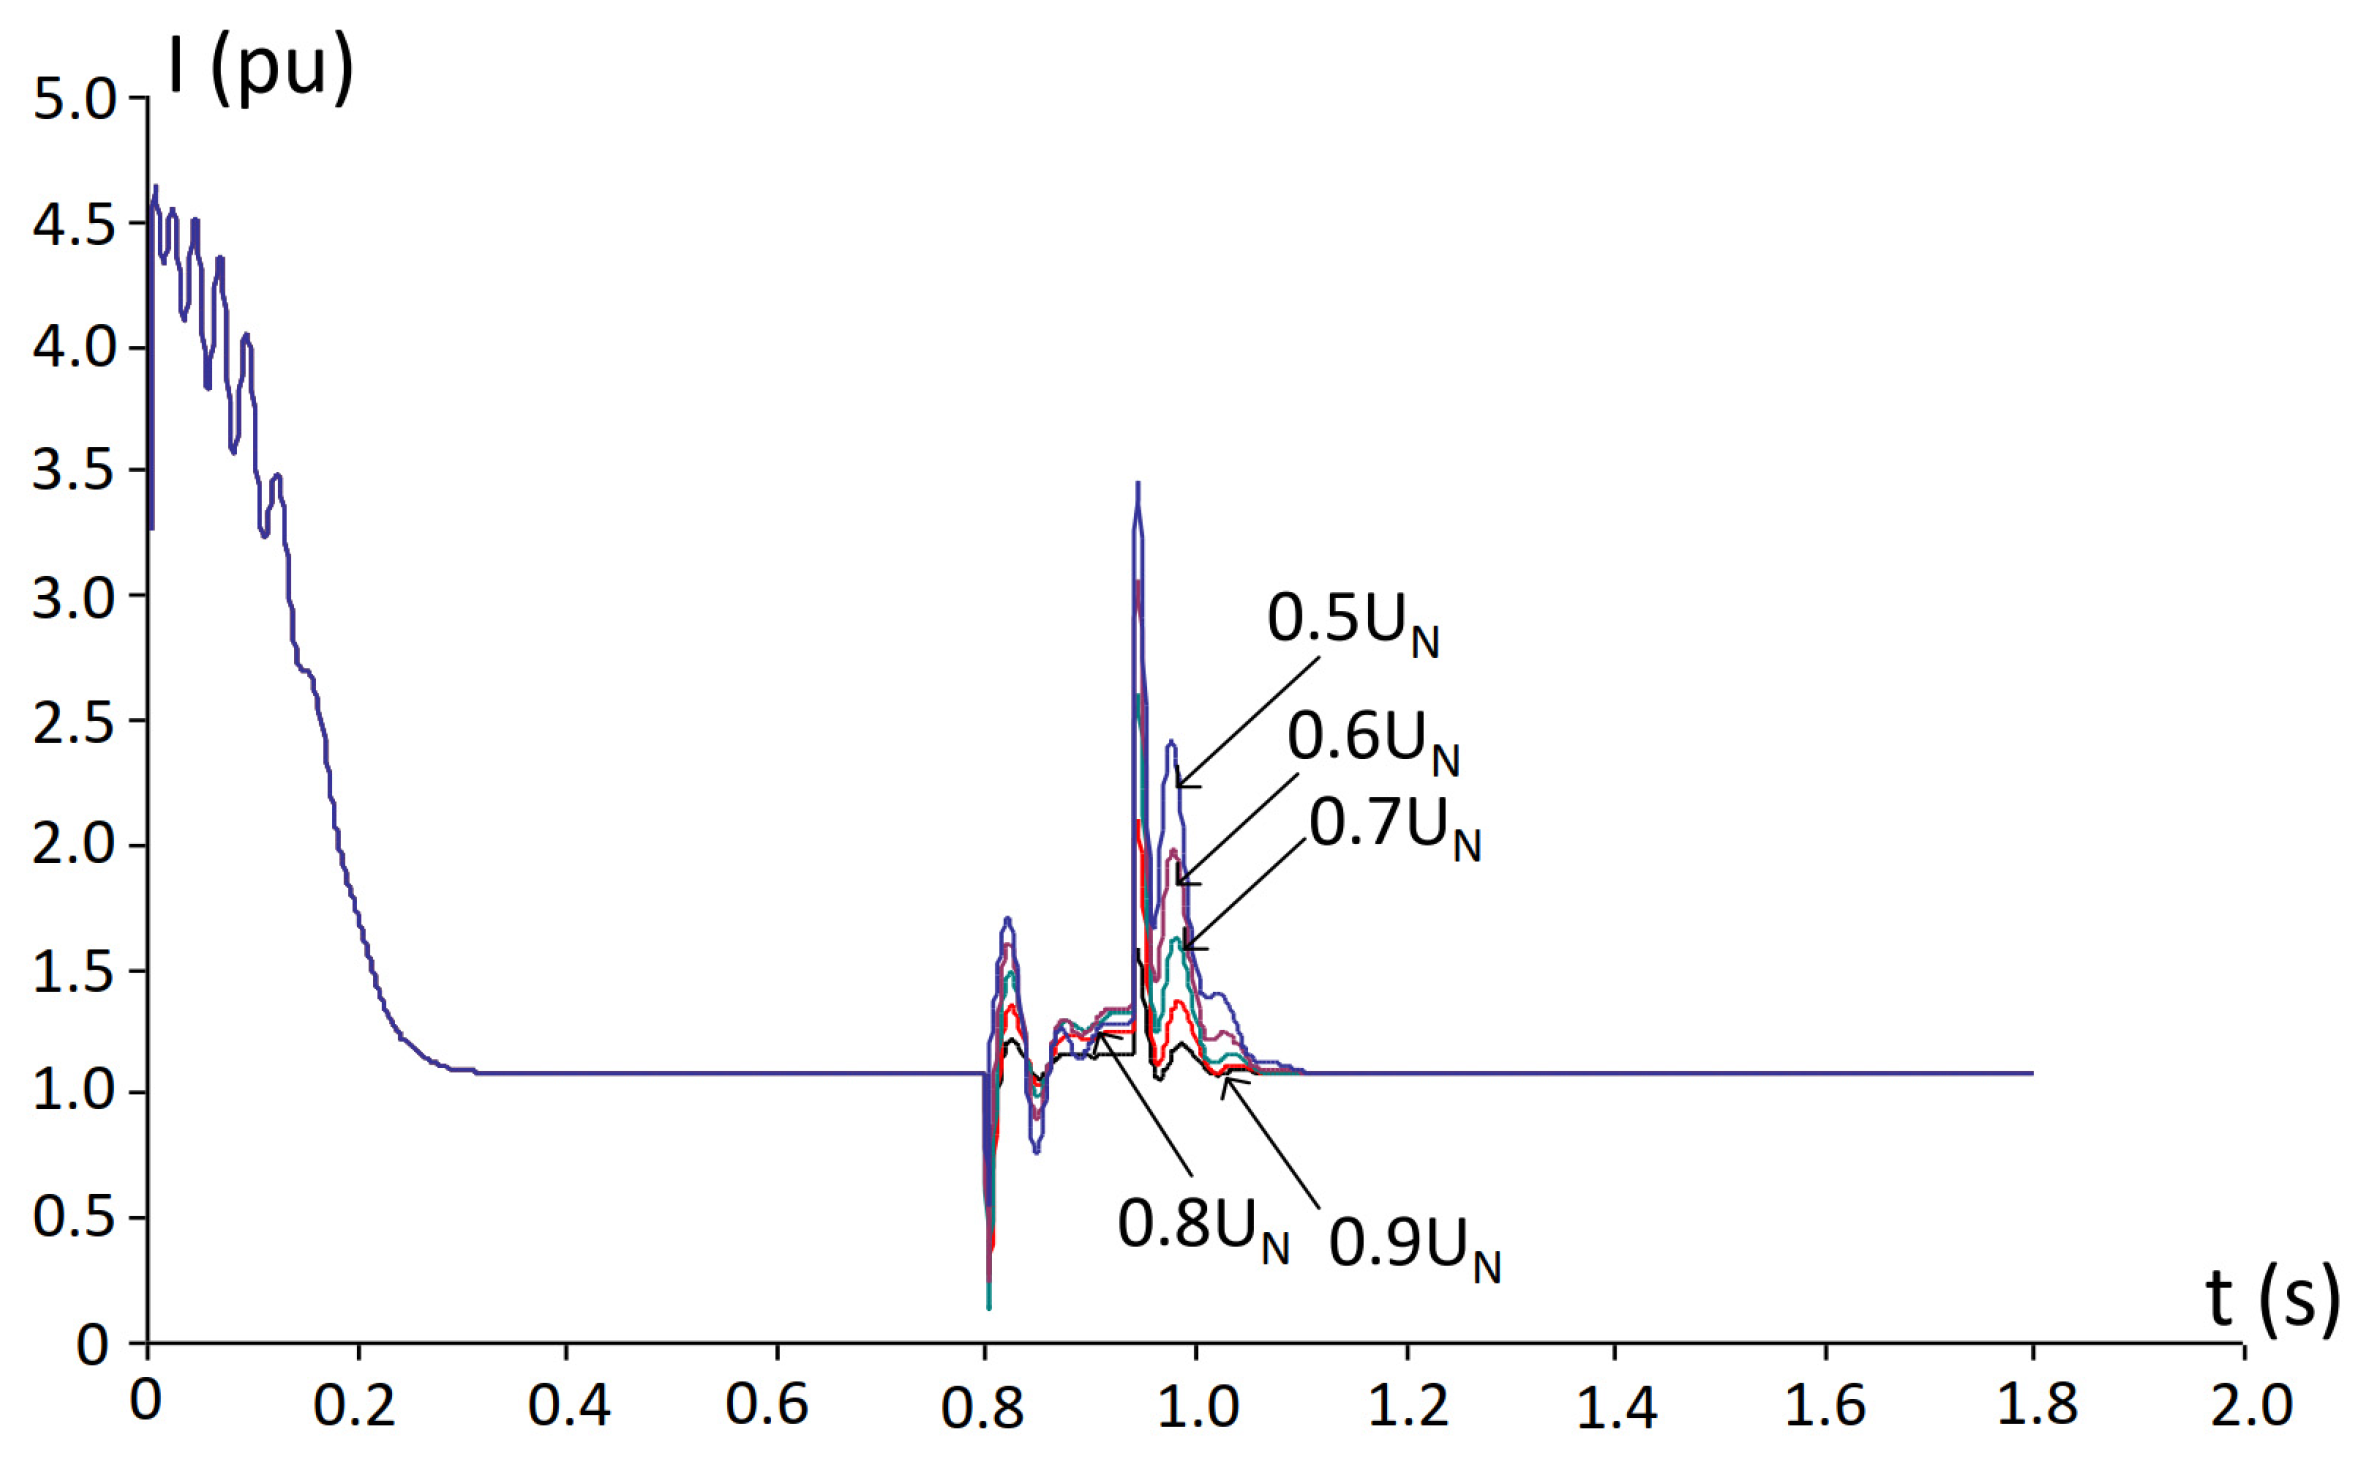
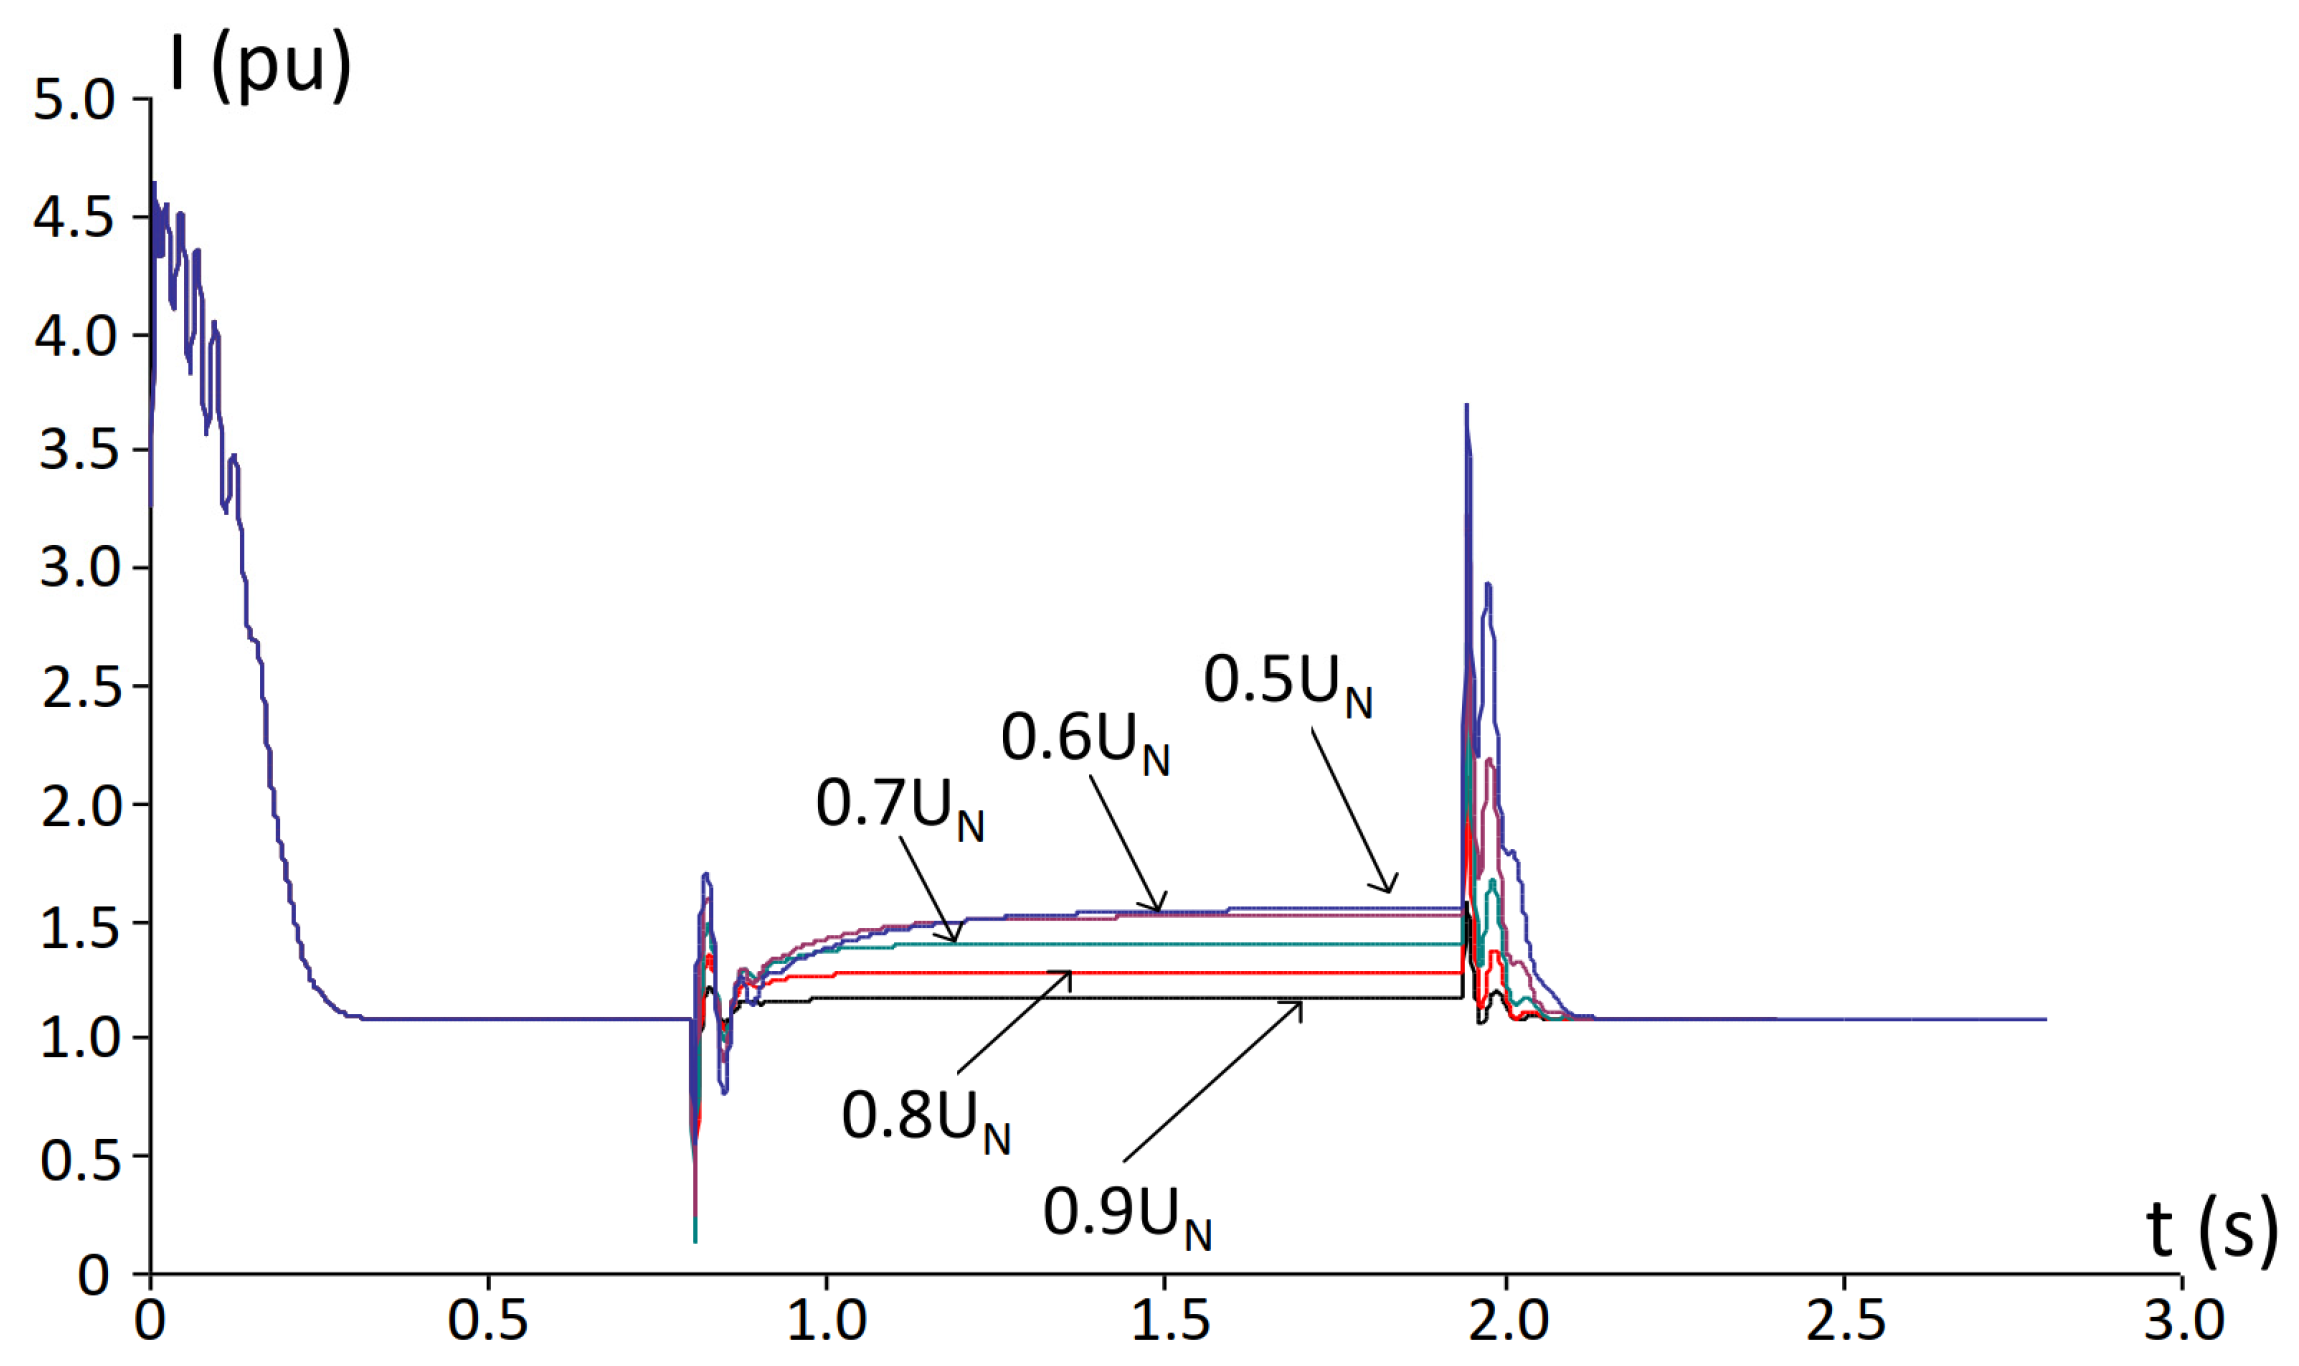
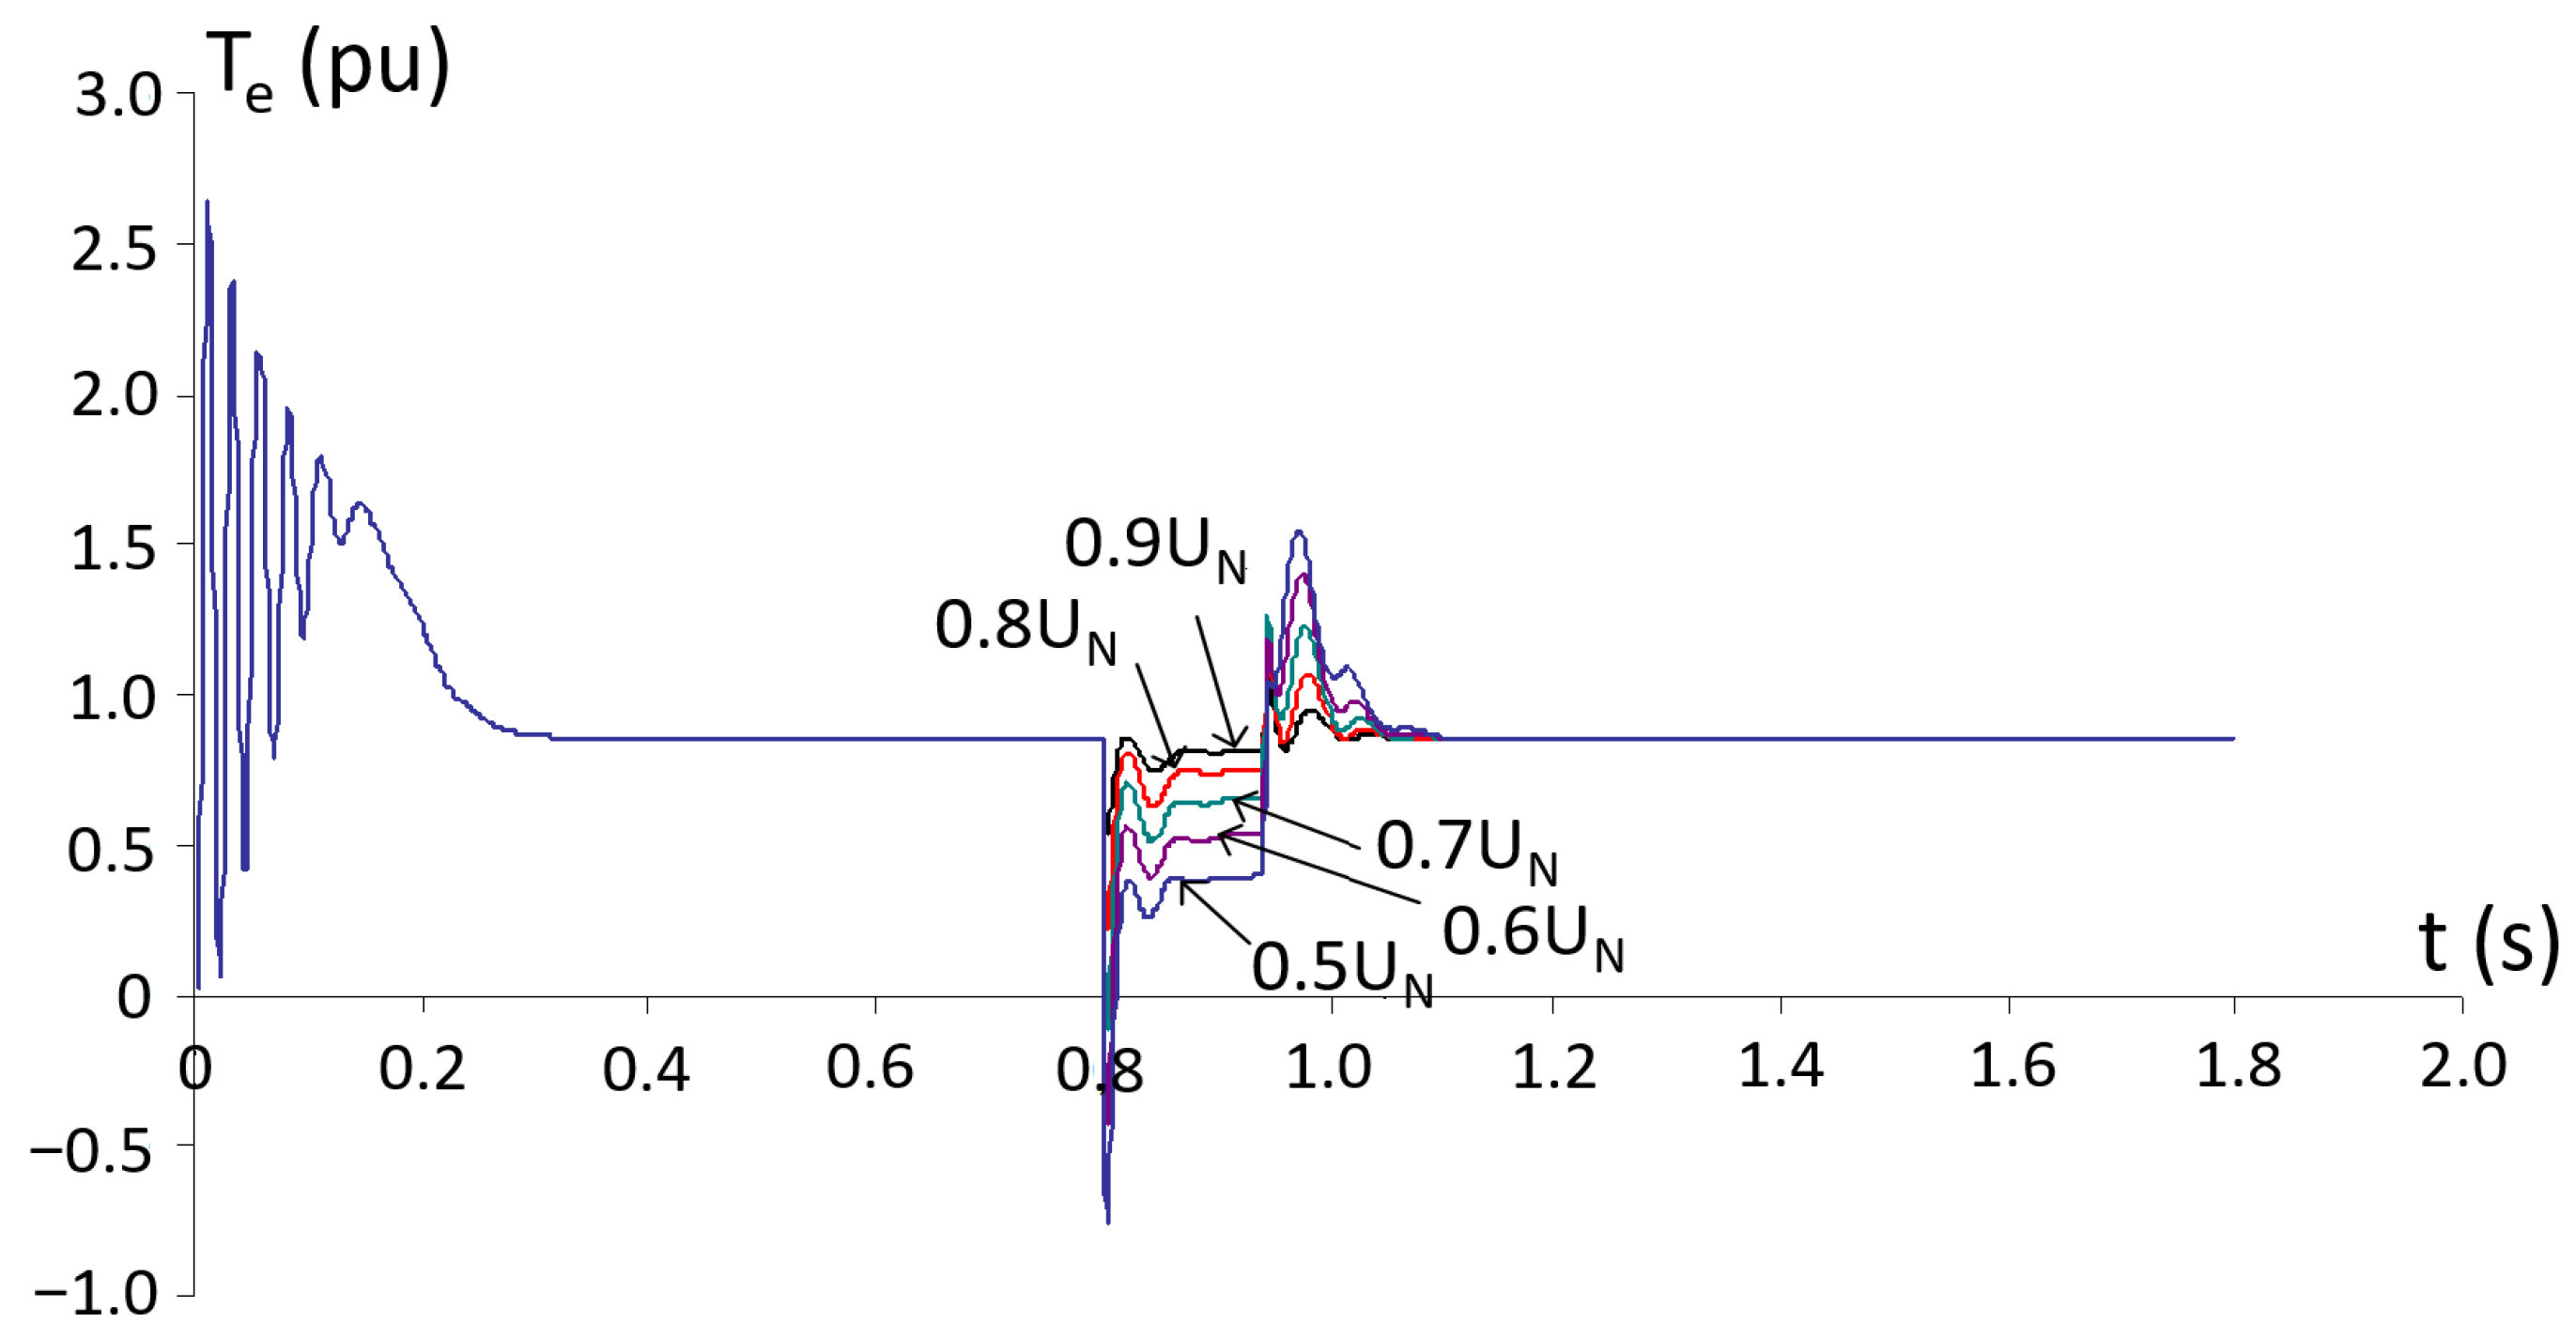
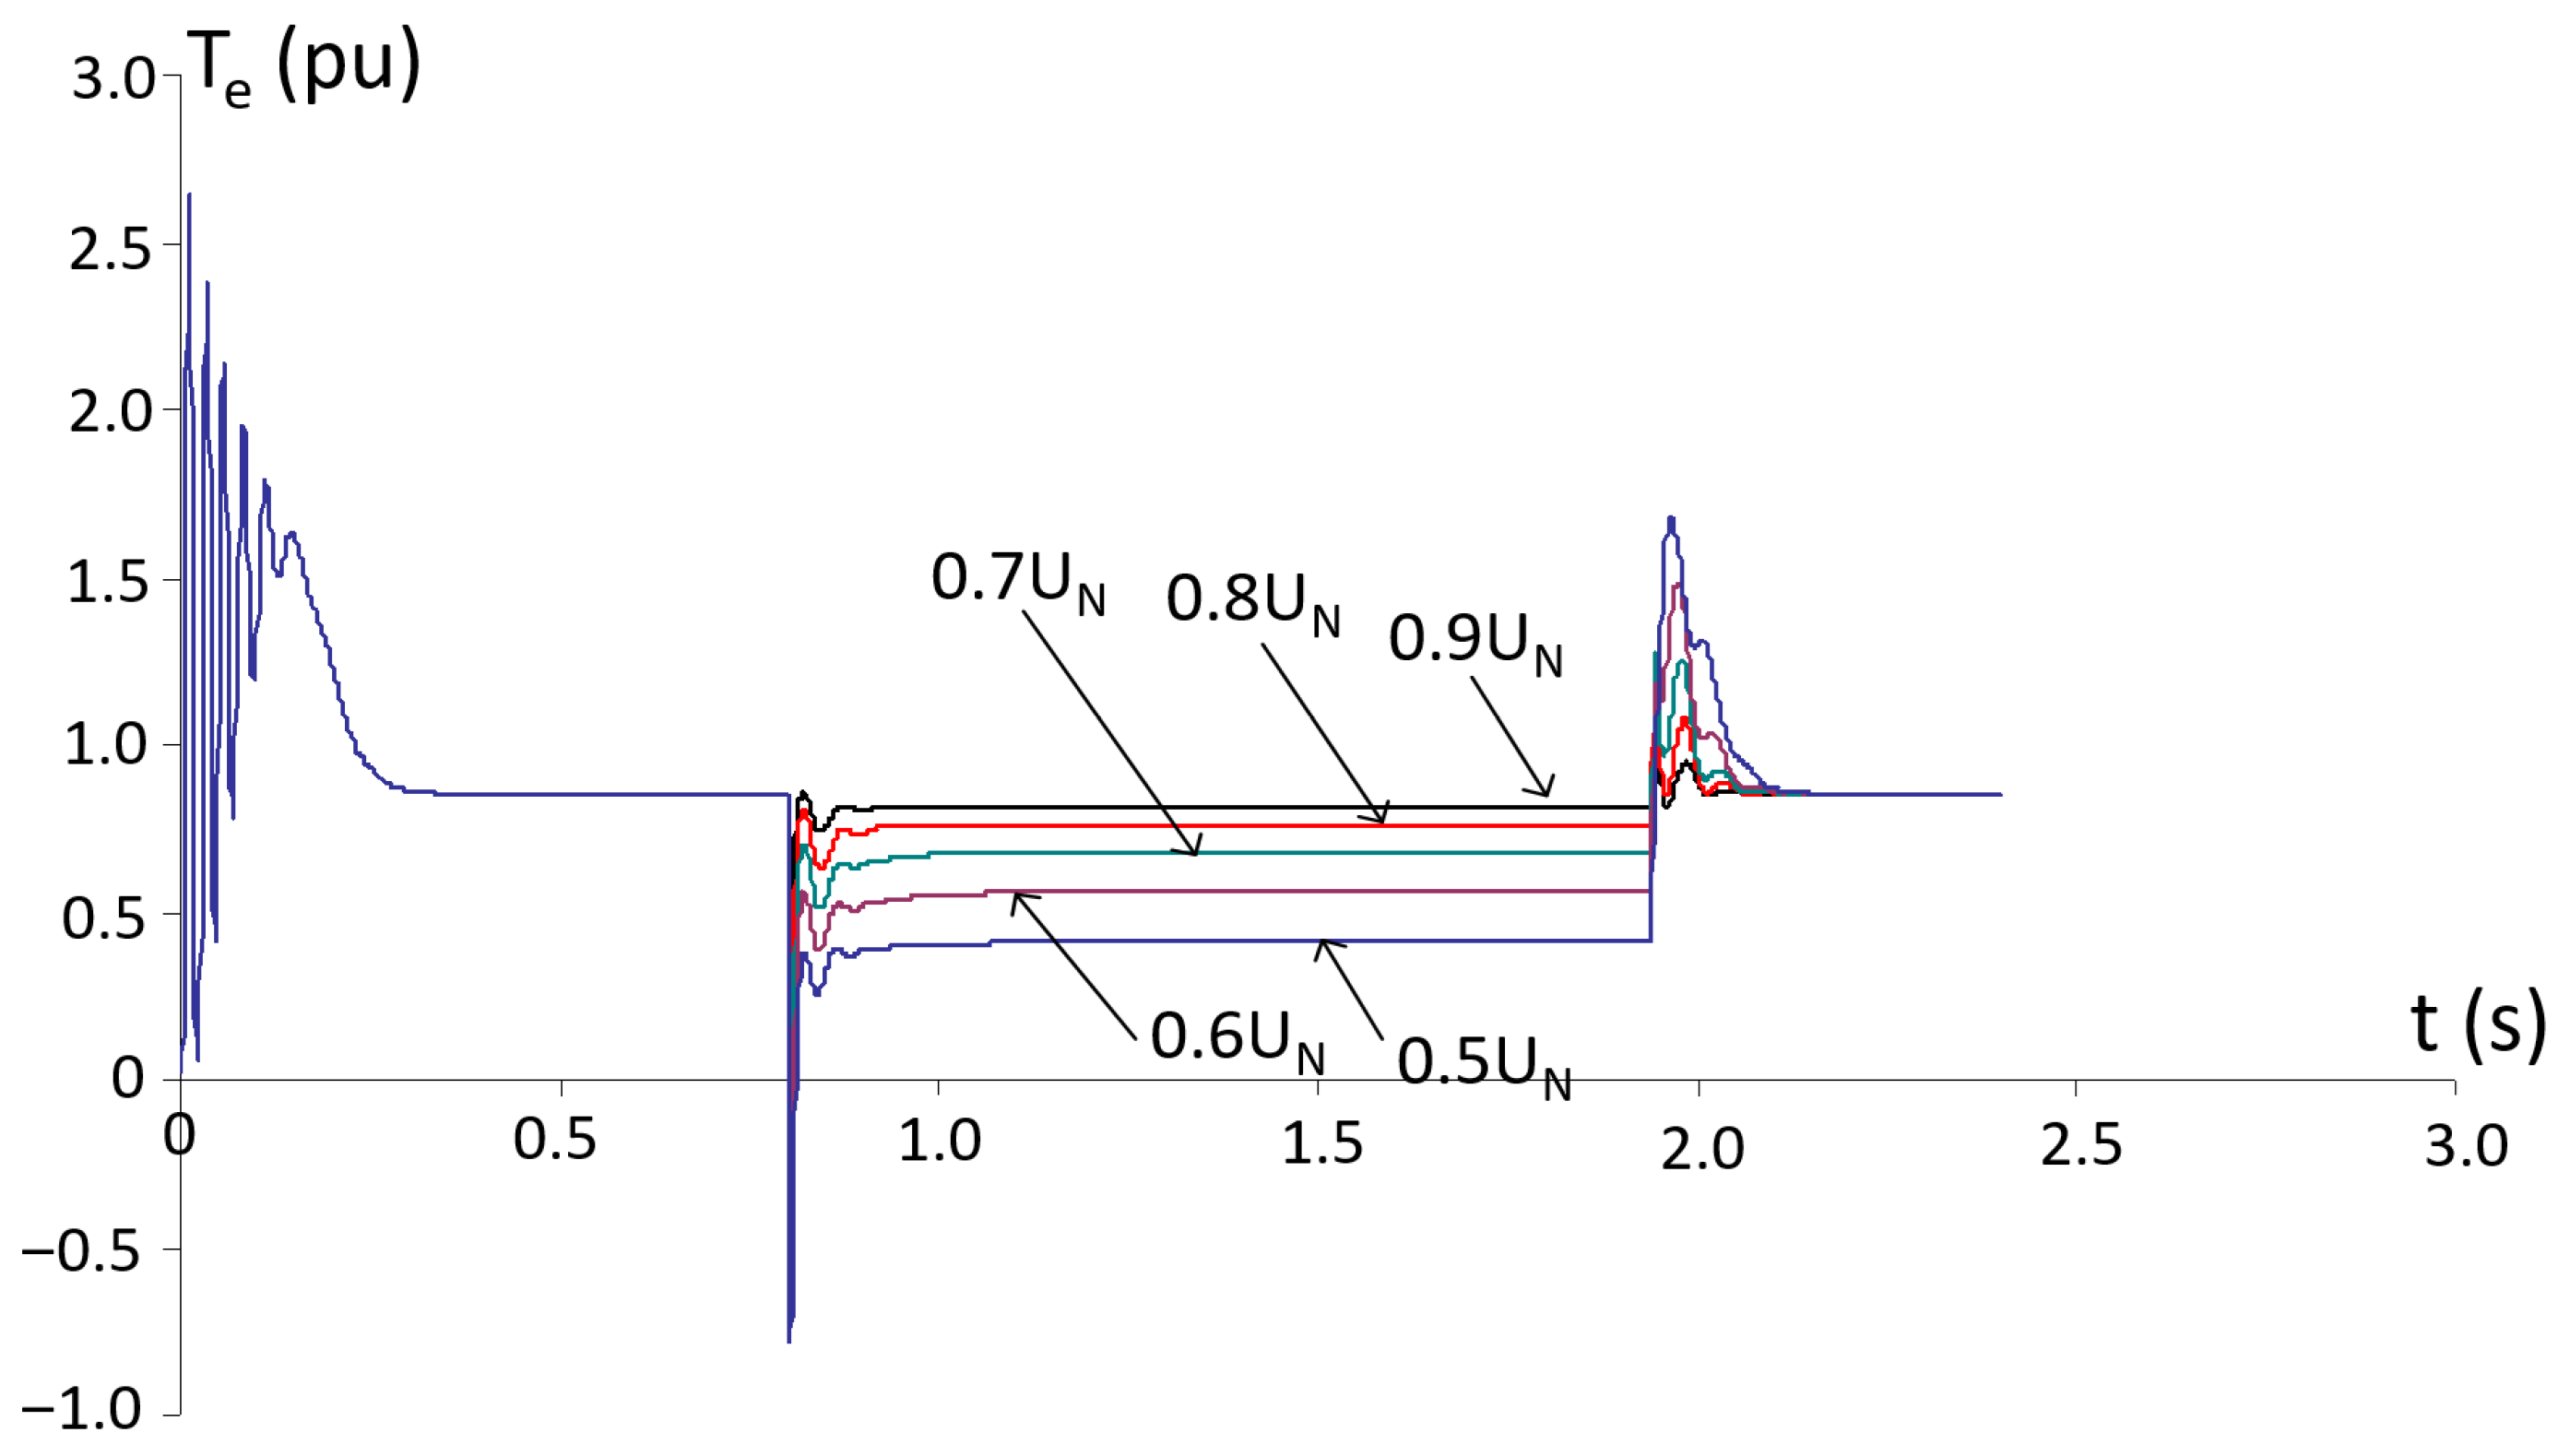
Depending on the fault location (see Figure 1), the voltage reduction at the busbars may range from 0.9 to 0.5 . Based on this, several scenarios are considered in which the bus voltage during the short circuit is reduced to the following values: , , , and .
To analyze the possibility of IM re-acceleration, it is necessary to know the duration of the voltage sag before it is fully restored. Section 2 already provided the estimated minimum and maximum voltage sag durations at the motor terminals depending on the short circuit location, which were found to be 0.14 s and 1.14 s, respectively. These durations are used in the simulation of the voltage sag process.
To simulate the start-up—voltage sag—re-acceleration process of an IM, a 0.75 kW motor was selected, with the following parameters [75]: = 0.052 pu, = 2.6 pu, = 0.077 pu, = 0.12 pu, = 0.064 pu. More detailed technical specifications of the IM are provided in Appendix A. The choice of a 0.75 kW IM for simulation is motivated by its relatively low mechanical inertia, which results in faster dynamic responses during both the run-down and re-acceleration phases. This enables clearer visualization and interpretation of characteristic transient processes, such as voltage sag onset, deceleration, residual EMF generation, and self-re-acceleration.
While the absolute values of current, torque, and acceleration time are dependent on motor size, the fundamental physical processes—such as the influence of residual speed, the voltage recovery level, and the load characteristics—are preserved across different motor ratings. Therefore, the selected low-power motor provides an effective and illustrative basis for analyzing the essential dynamics of IM re-acceleration following power disturbances.
The graphs shown in Figure 3, Figure 4, Figure 5, Figure 6, Figure 7, Figure 8, Figure 9, Figure 10 and Figure 11 illustrate the variations in current, electromagnetic torque, and rotational speed of the IM during start-up, voltage sag, and subsequent re-acceleration, for different levels of voltage reduction from the nominal value: , , , and . The graphs also show the influence of voltage sag duration at the busbars to which the IM is directly connected. Overall, the figures demonstrate the dependence of rotational speed, electromagnetic torque, and current on both the magnitude and duration of the voltage sag, as well as on the subsequent re-acceleration of the motor. All results are reported in the motor per-unit system (machine base).
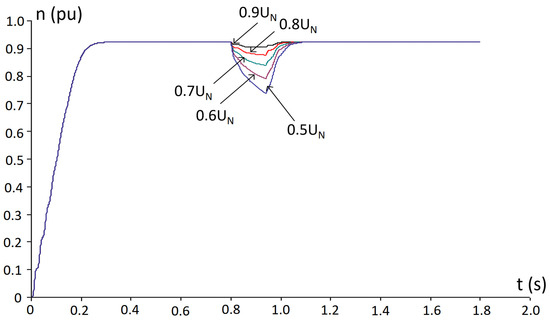
Figure 3.
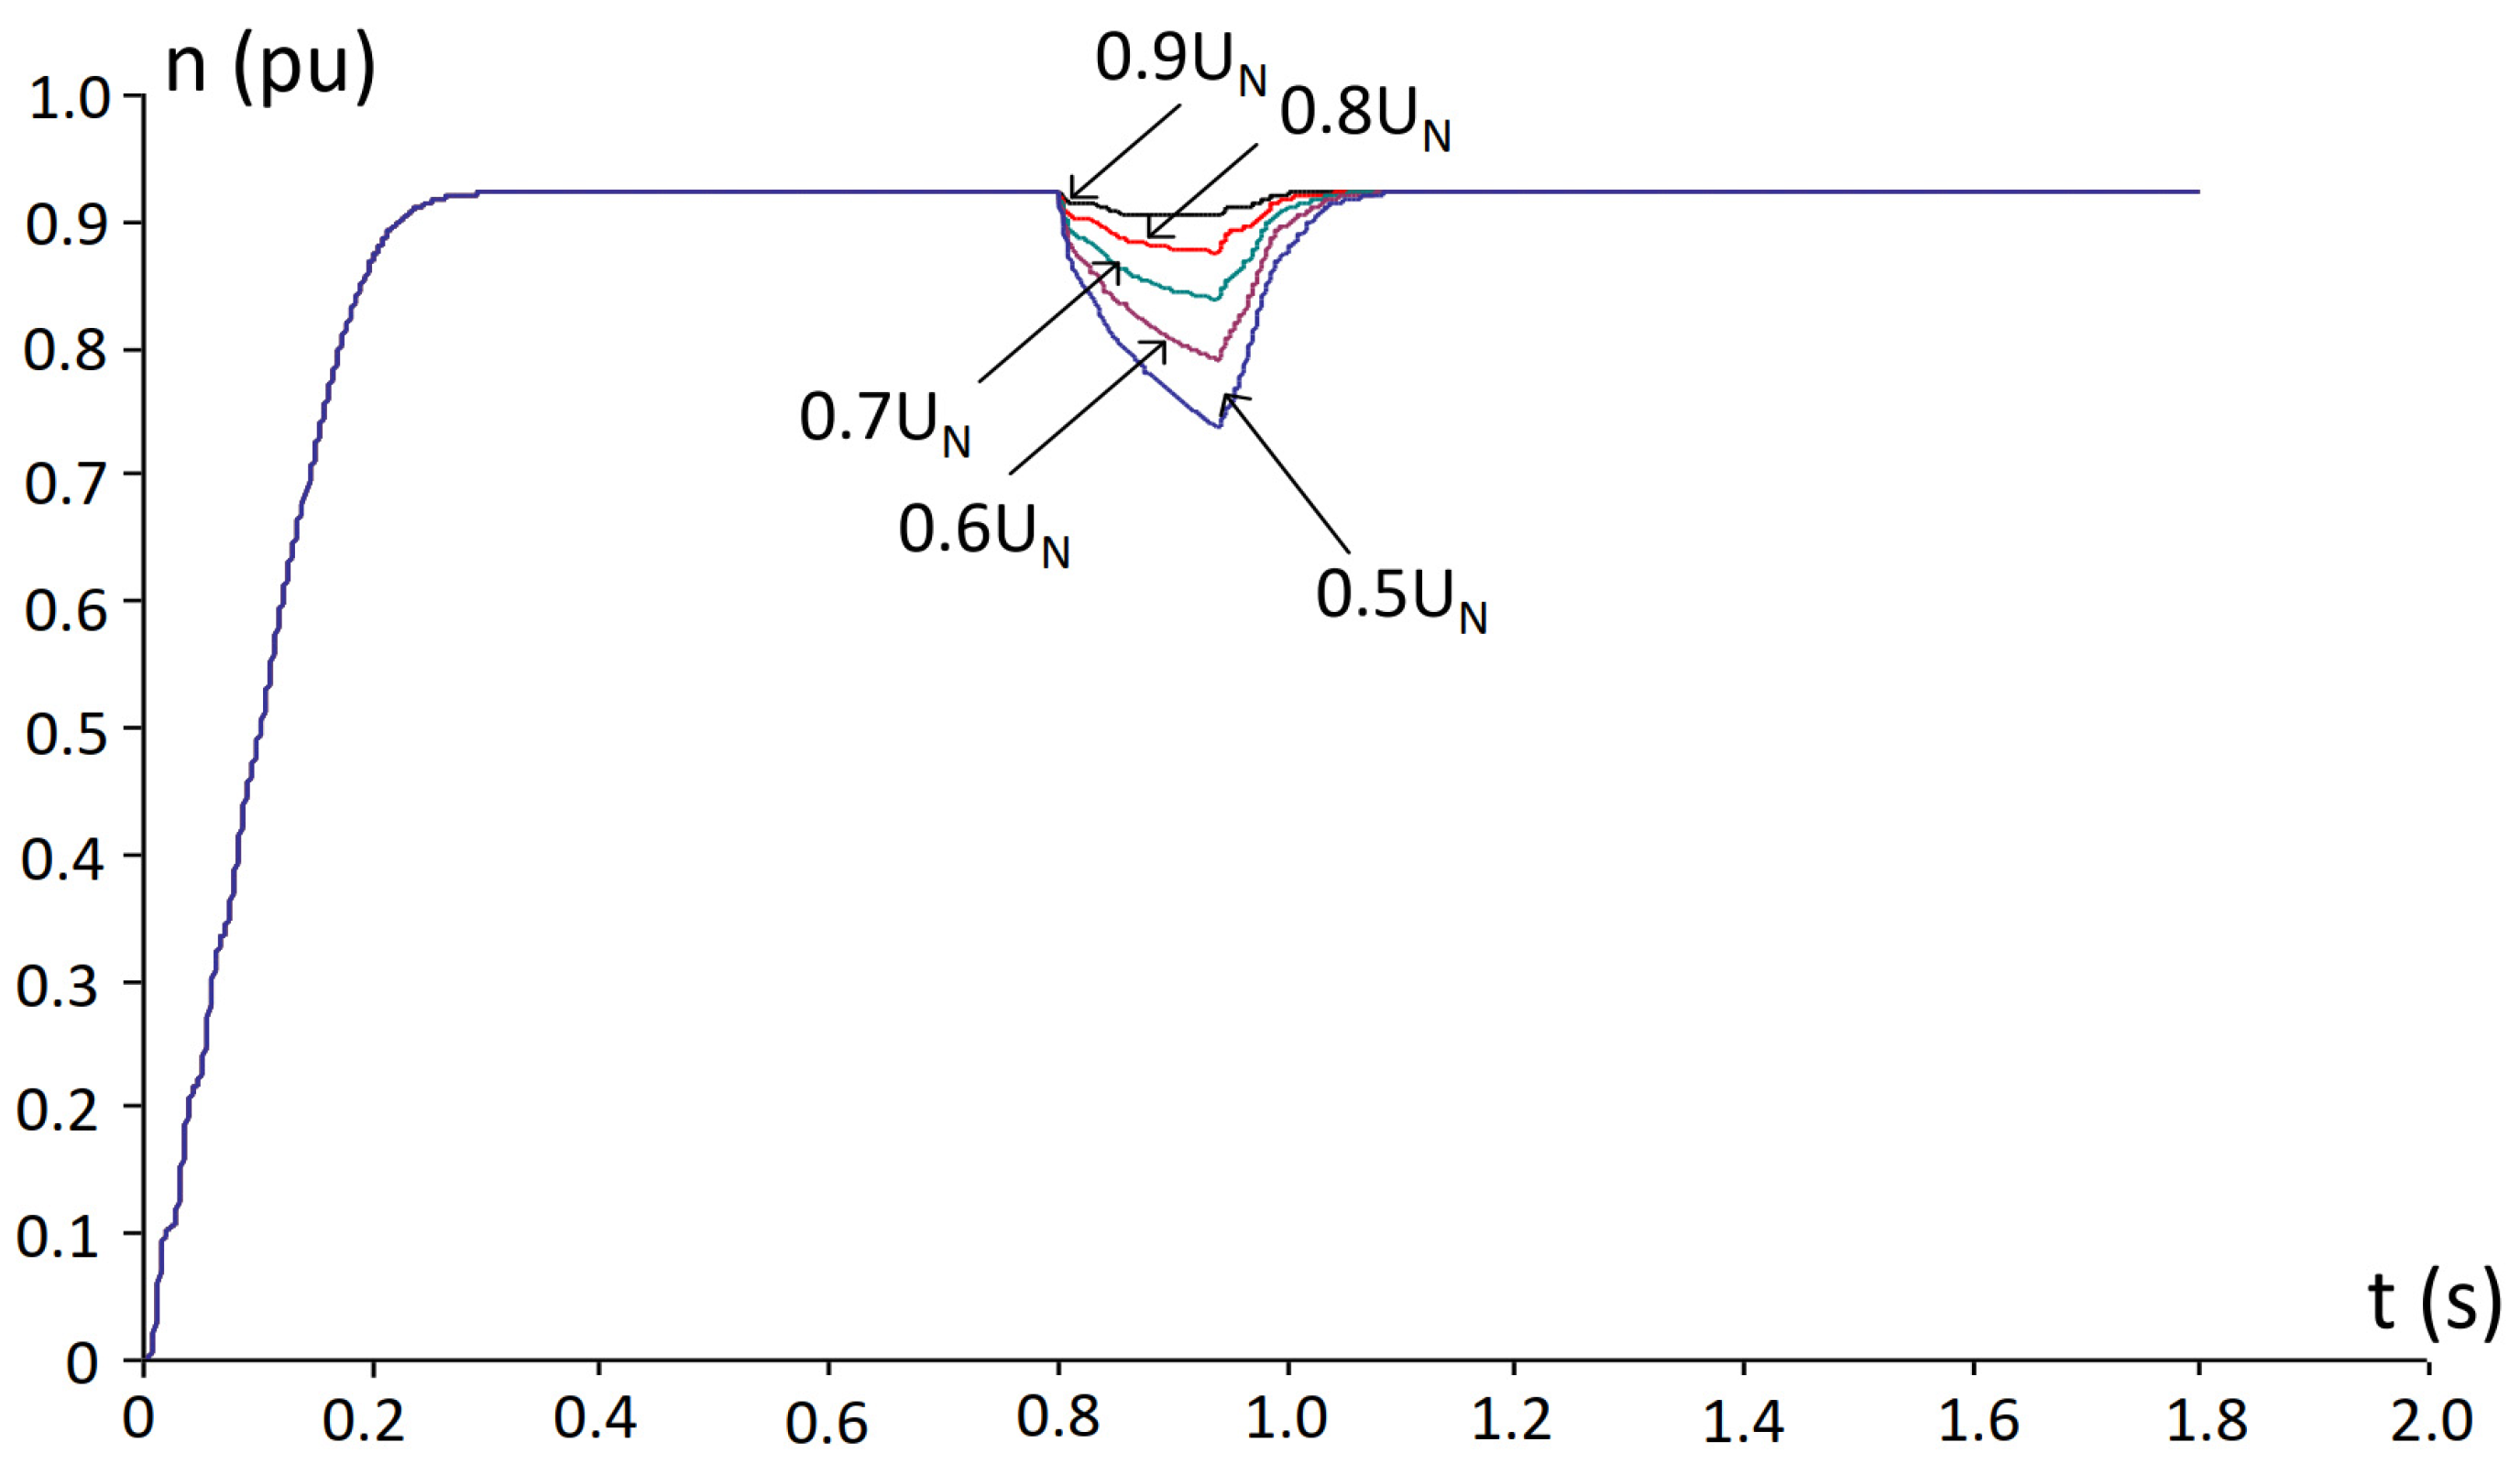
IM speed variation during a voltage sag caused by a short circuit, followed by voltage recovery. The voltage drops to 0.9, 0.8, 0.7, 0.6, and 0.5 , with a sag duration of 0.14 s. Motor rated power: 0.75 kW. Load torque: variable.
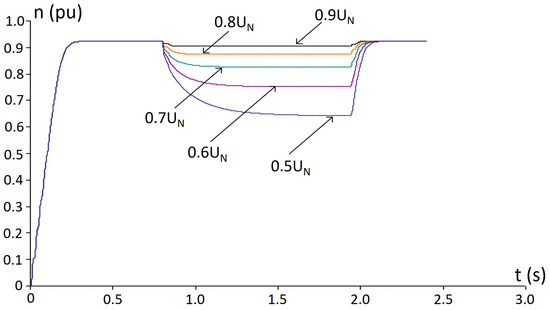
Figure 4.
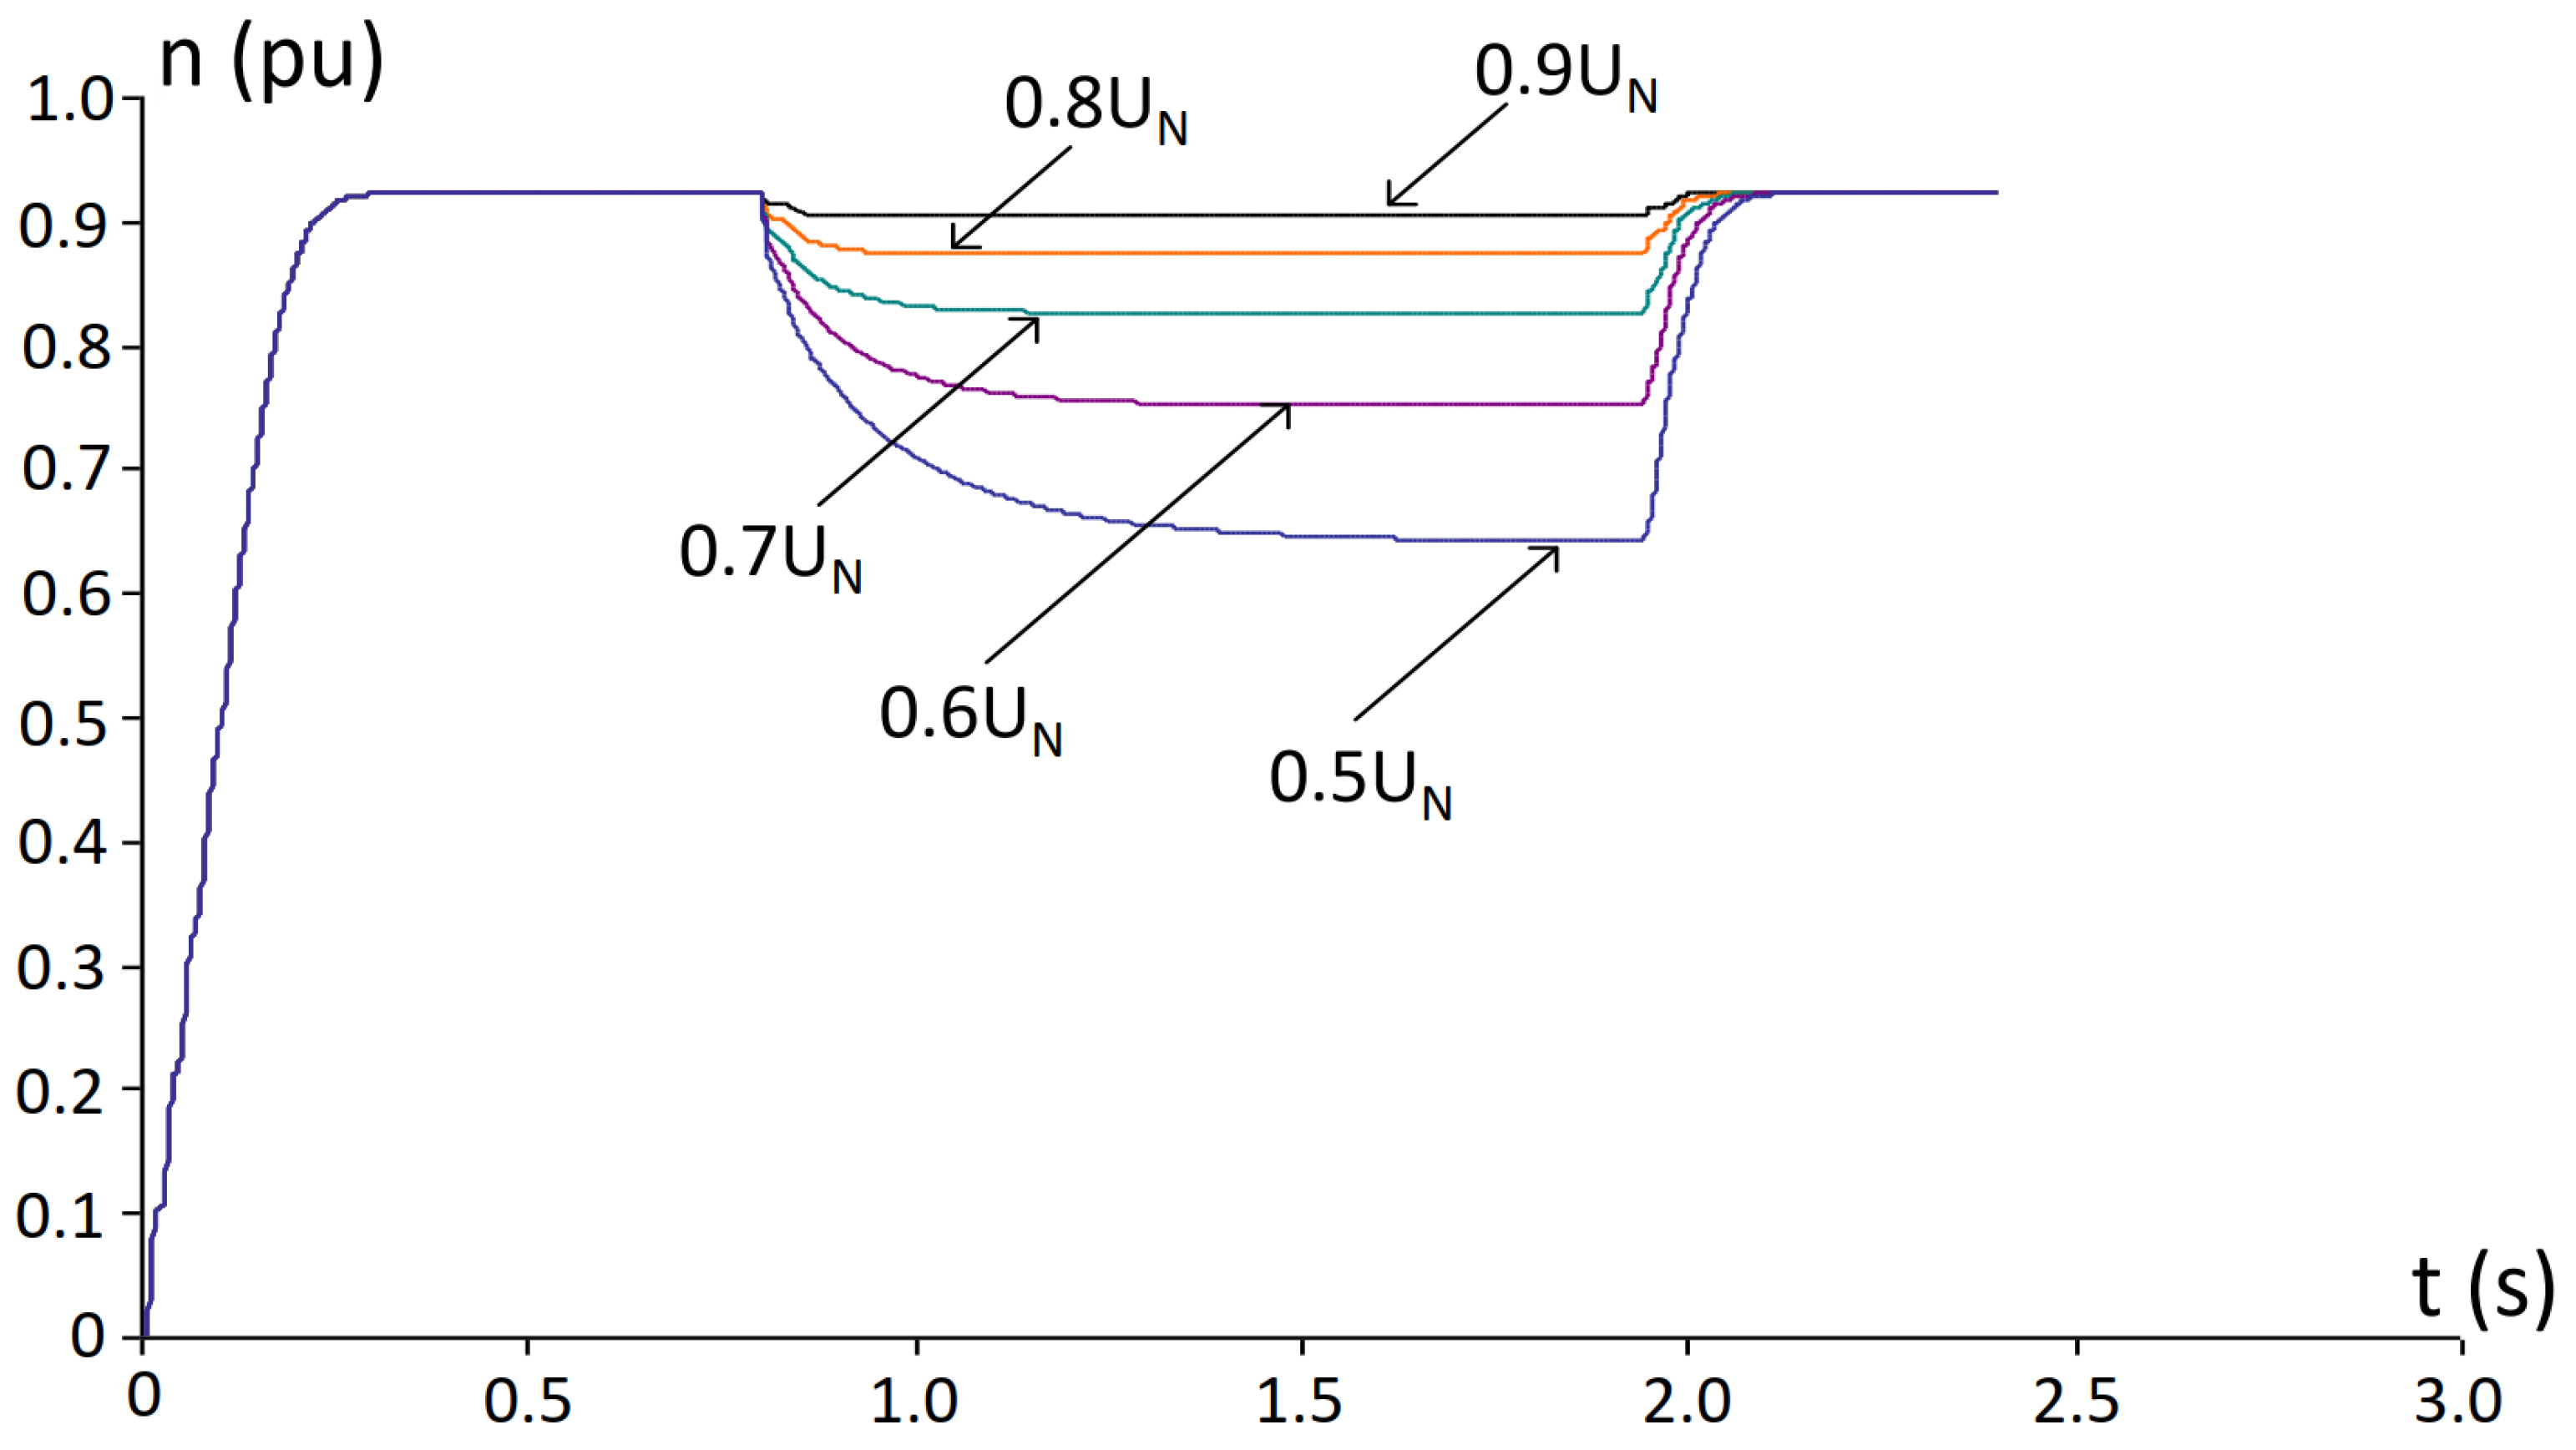
IM speed variation during a voltage sag caused by a short circuit, followed by voltage recovery. The voltage drops to 0.9, 0.8, 0.7, 0.6, and 0.5, with a sag duration of 1.14 s. Motor rated power: 0.75 kW. Load torque: variable.
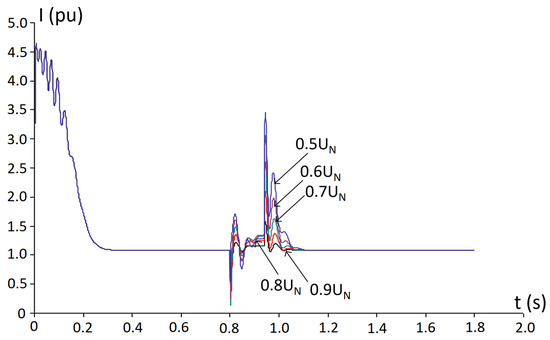
Figure 5.
IM current variation during a voltage sag caused by a short circuit, followed by voltage recovery. The voltage drops to 0.9, 0.8, 0.7, 0.6, and 0.5 , with a sag duration of 0.14 s. Motor rated power: 0.75 kW. Load torque: variable.
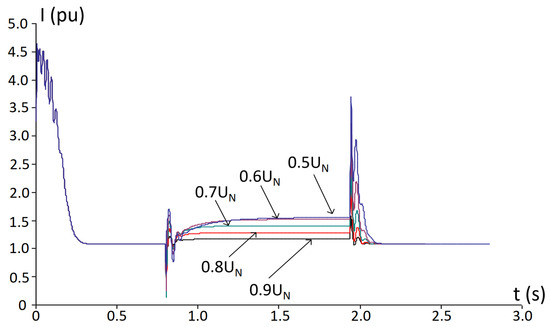
Figure 6.
IM current variation during a voltage sag caused by a short circuit, followed by voltage recovery. The voltage drops to 0.9, 0.8, 0.7, 0.6, and 0.5 , with a sag duration of 1.14 s. Motor rated power: 0.75 kW. Load torque: variable.
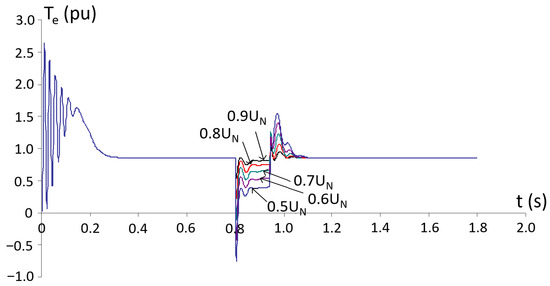
Figure 7.
IM electromagnetic torque variation during a voltage sag caused by a short circuit, followed by voltage recovery. The voltage drops to 0.9, 0.8, 0.7, 0.6, and 0.5 , with a sag duration of 0.14 s. Motor rated power: 0.75 kW. Load torque: variable.
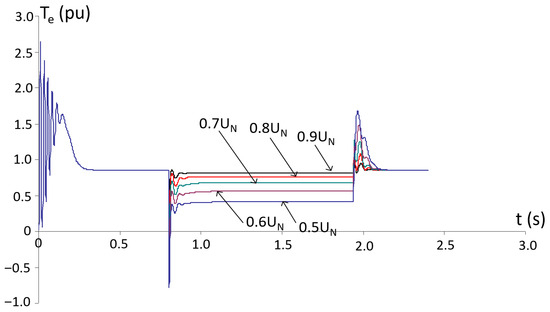
Figure 8.
IM electromagnetic torque variation during a voltage sag caused by a short circuit, followed by voltage recovery. The voltage drops to 0.9, 0.8, 0.7, 0.6, and 0.5 , with a sag duration of 1.14 s. Motor rated power: 0.75 kW. Load torque: variable.
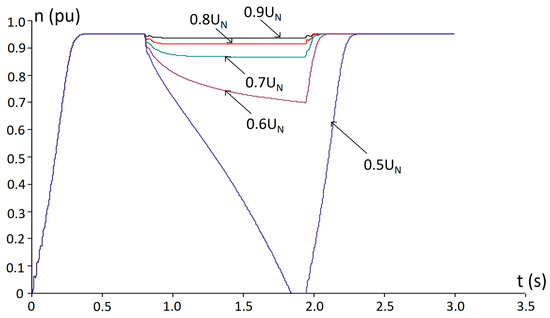
Figure 9.
IM speed variation during a voltage sag caused by a short circuit, followed by voltage recovery. The voltage drops to 0.9, 0.8, 0.7, 0.6, and 0.5, with a sag duration of 1.14 s. Motor rated power: 0.75 kW. Load torque: constant.
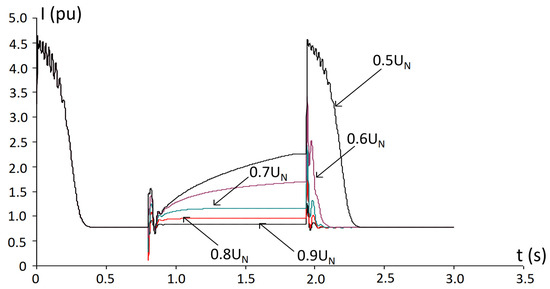
Figure 10.
IM current variation during a voltage sag caused by a short circuit, followed by voltage recovery. The voltage drops to 0.9, 0.8, 0.7, 0.6, and 0.5 , with a sag duration of 1.14 s. Motor rated power: 0.75 kW. Load torque: constant.
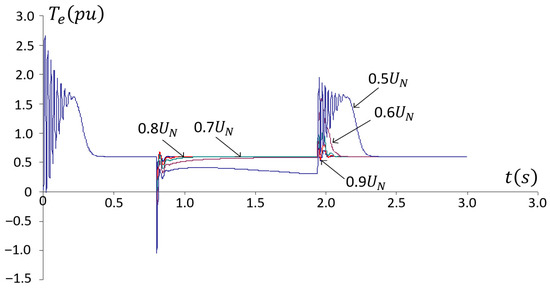
Figure 11.
IM electromagnetic torque variation during a voltage sag caused by a short circuit, followed by voltage recovery. The voltage drops to 0.9, 0.8, 0.7, 0.6, and 0.5 , with a sag duration of 1.14 s. Motor rated power: 0.75 kW. Load torque: constant.
Figure 3 shows the change in speed of the IM during a voltage sag lasting 0.14 s, while Figure 4 illustrates the case for a sag duration of 1.14 s. In both scenarios, the IM operated under the same variable load torque, with pu. For example, Figure 4 demonstrates that when the supply voltage drops to over a period of 1.14 s, the motor speed decreases from 1.0 to 0.63 pu. In contrast, for a voltage sag lasting only 0.14 s, the speed decreases from 1 to 0.72 pu. This indicates that the shorter the duration of the voltage sag, the smaller the reduction in the motor’s speed. A similar trend is observed in the remaining figures, where the motor speed is plotted for various voltage sag durations.
Figure 5 and Figure 6 illustrate the current response of the IM during voltage sags lasting 0.14 s and 1.14 s, respectively, under a variable load torque of in pu.
A voltage sag leads to an increase in stator current due to reduced torque-producing capability, with the effect becoming more pronounced at deeper dips. Upon voltage recovery, a transient inrush current occurs as the motor re-accelerates to synchronous speed. In some cases with significant residual speed and deep sags, the IM may temporarily operate in generator mode, which is visible in the current waveforms as a polarity reversal caused by the release of stored kinetic energy.
A direct comparison of Figure 5 and Figure 6 highlights the role of short-circuit clearance time. Rapid fault clearing (Figure 5) results in lower peak currents and faster voltage recovery, facilitating efficient re-acceleration. By contrast, delayed clearance (Figure 6) leads to greater speed reduction and lower residual voltage, which increases re-acceleration currents and, in some cases, may prevent successful re-acceleration.
Figure 7 and Figure 8 illustrate the electromagnetic torque dynamics of the IM under voltage sags of varying depth. A reduction in voltage leads to a noticeable decrease in torque, approximately proportional to the square of the voltage level. In some cases—particularly at deep sags of 0.5–0.6—the torque falls below the load demand, thereby hindering or even preventing re-acceleration under load. At low residual speeds combined with deep sags, the torque may become negative, which indicates a temporary generator mode in which the motor feeds energy back into the system. After voltage recovery, a transient torque overshoot occurs, assisting the motor’s re-acceleration. The curves allow the identification of critical sag thresholds at which torque reversal and generator behavior appear.
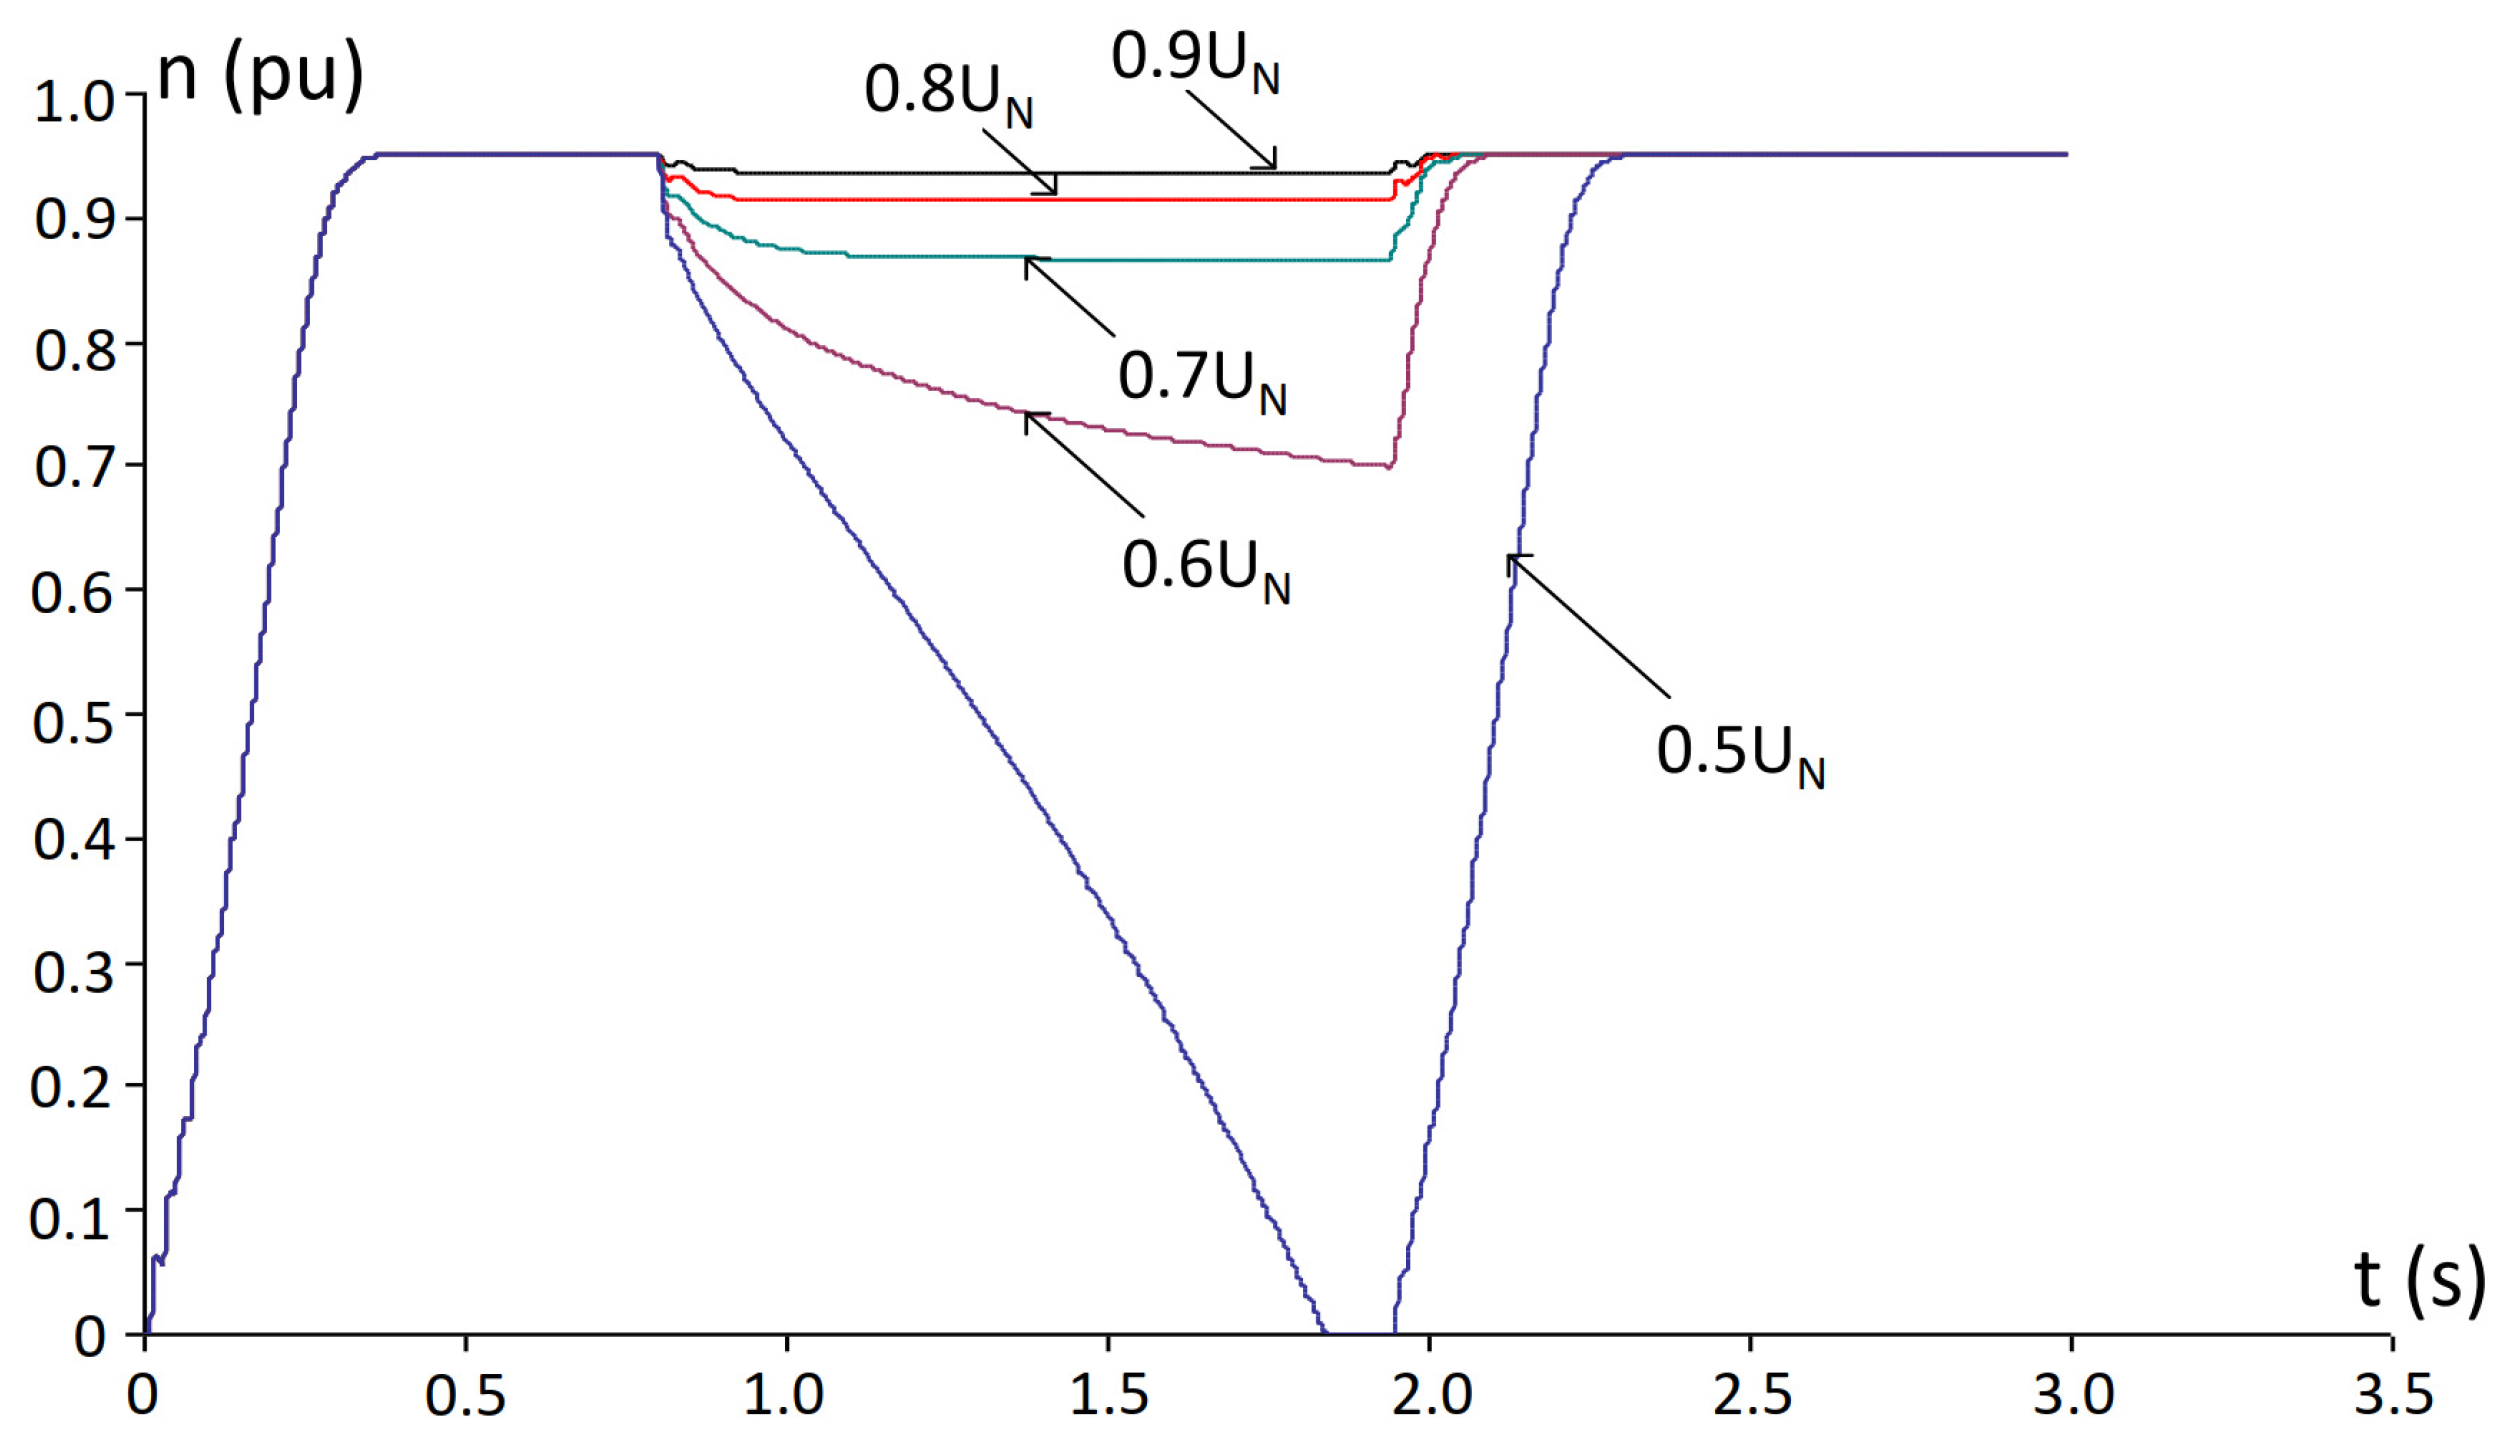
Figure 9, Figure 10 and Figure 11 present the curves of rotational speed, current, and electromagnetic torque for the same 0.75 kW IM, this time operating under a constant load torque of 0.5 pu. Figure 9 shows the variation in motor speed during voltage dips. At 0.9–0.8 , the rotational speed remains nearly unchanged, indicating that the motor develops sufficient torque to sustain motion. At 0.7 , a moderate decrease in speed is observed, although the motor continues running. More pronounced speed reduction occurs at 0.6 and 0.5 , with complete motor stoppage at 0.5 . After voltage recovery, the motor successfully re-accelerates, demonstrating its self-starting capability.
In contrast to Figure 4, where the same voltage sag duration of 1.14 s was applied under a variable load, the IM in this case operates under a constant load torque. This comparison highlights that the deceleration behavior of the IM is strongly affected by the load torque characteristics.
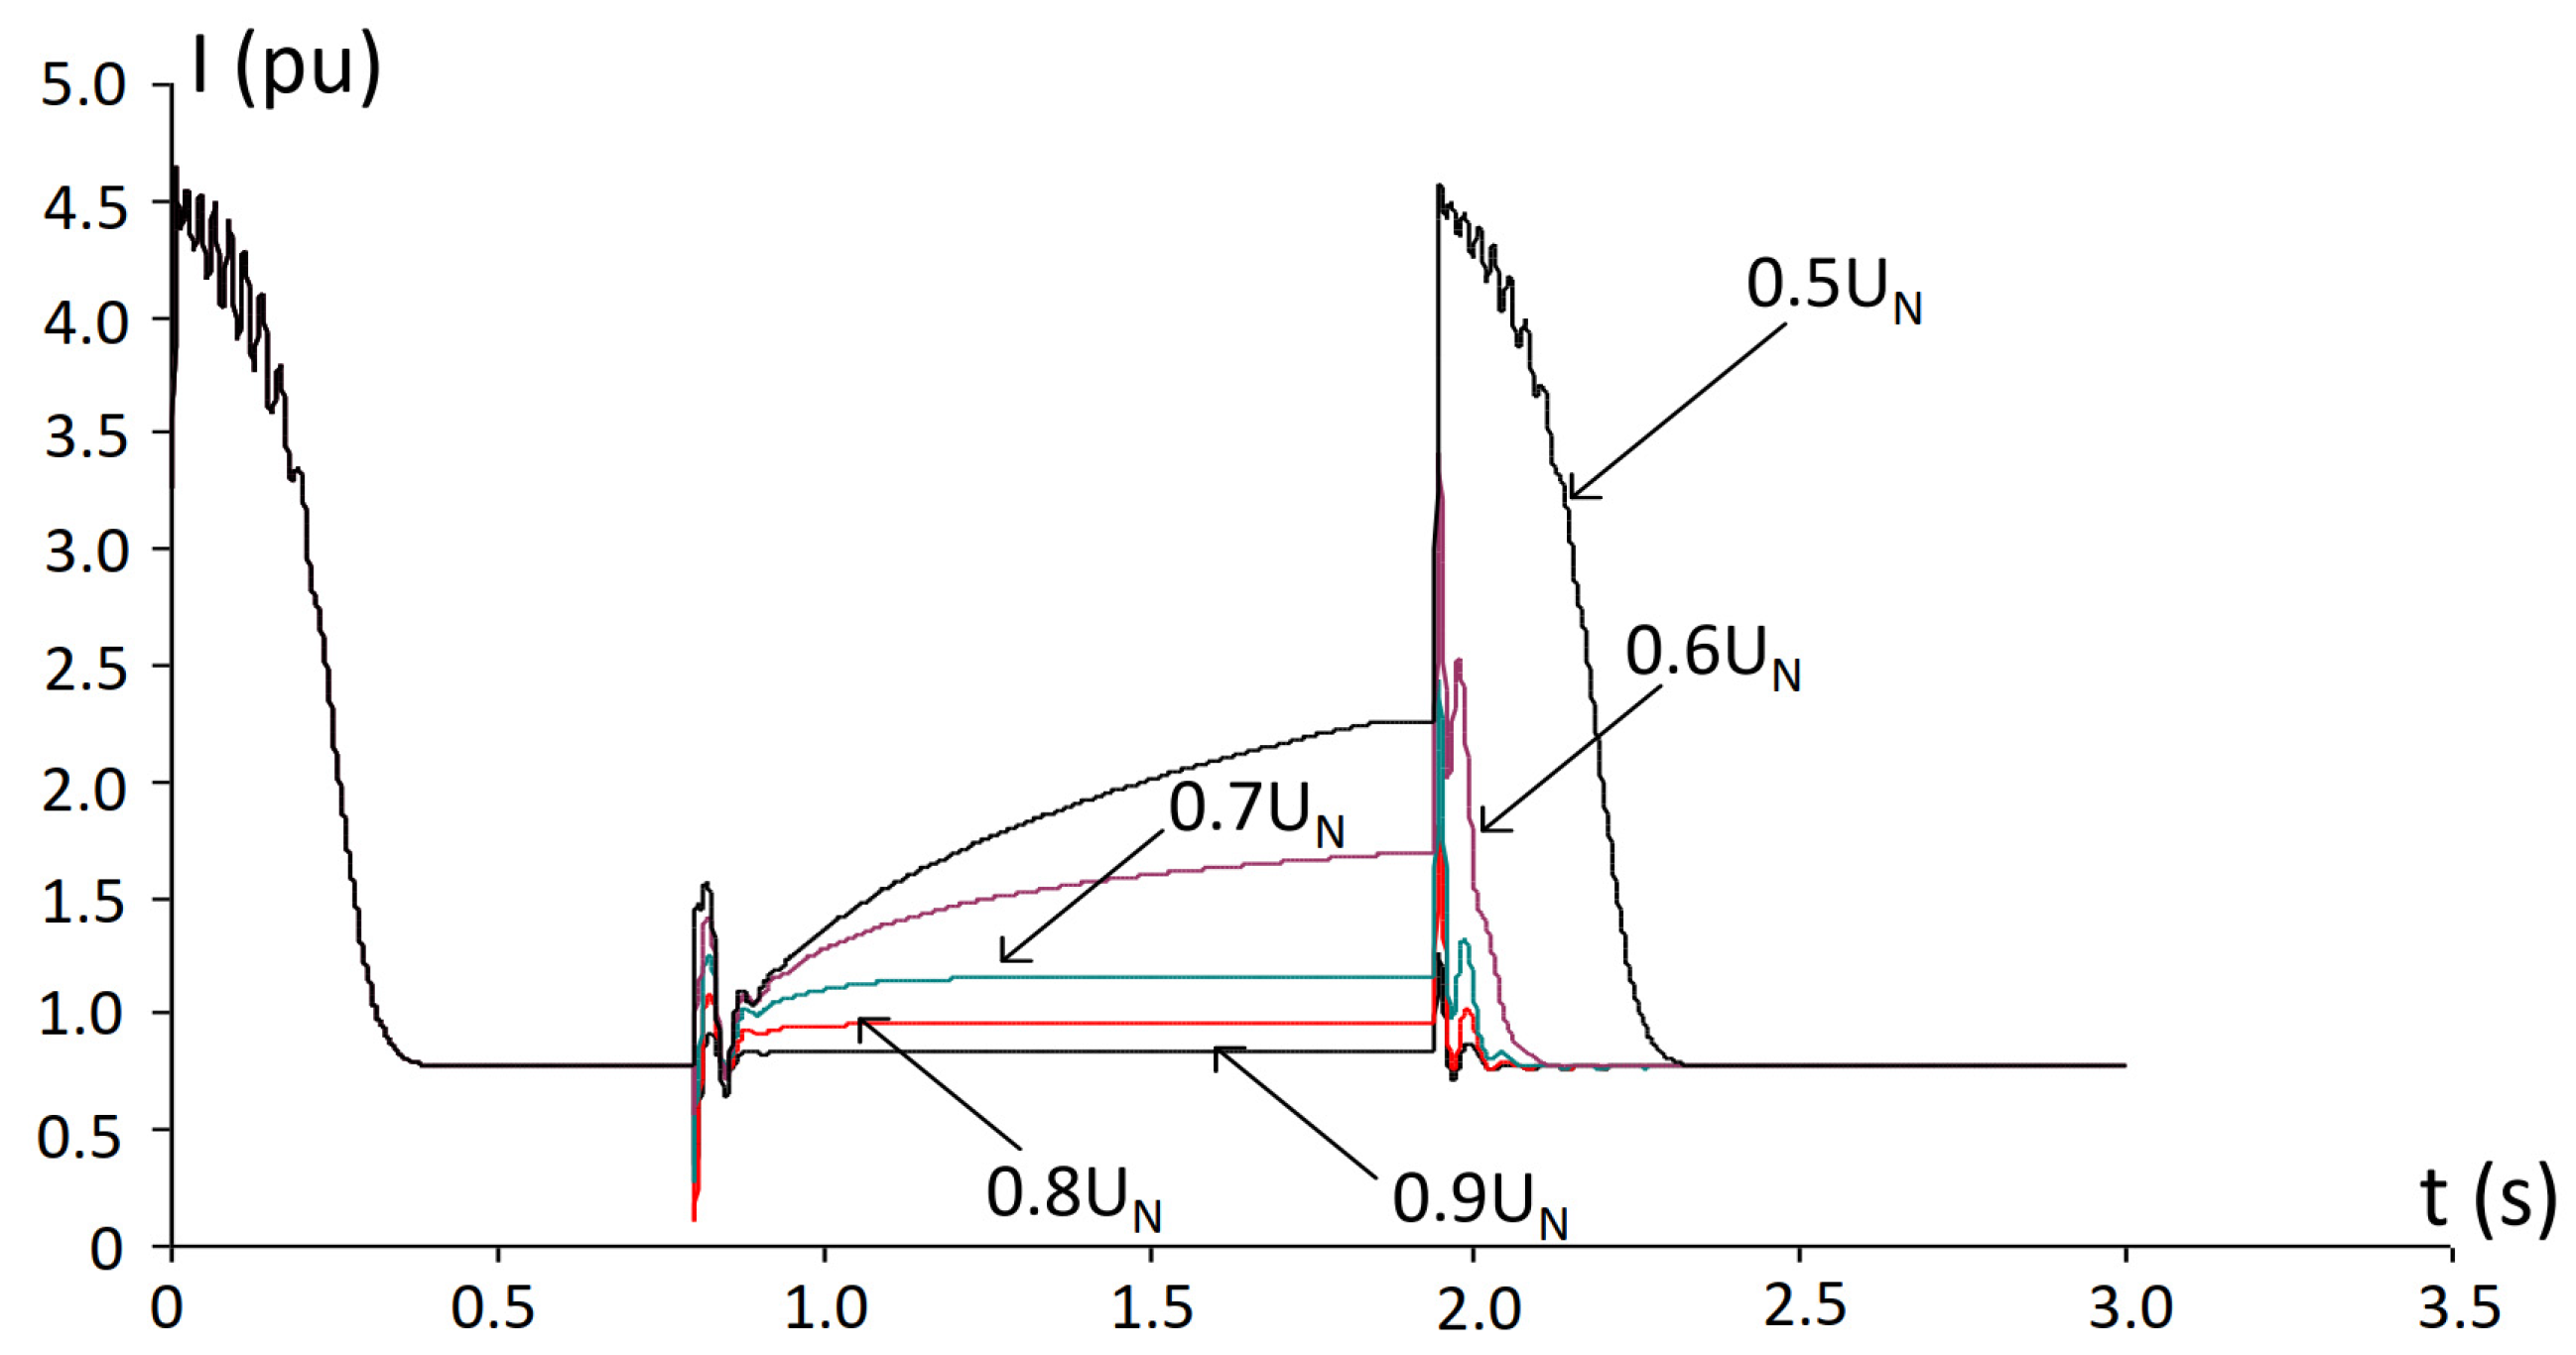
Figure 10 illustrates the current response of the IM during start-up, voltage sag, and subsequent recovery under a constant load torque. At moderate voltage dips (0.8–0.9 ), the IM continues to operate with only a slight increase in current. At 0.7 , the current rises more noticeably, reflecting the motor’s attempt to compensate for the reduced electromagnetic torque. For deeper voltage sags (0.5–0.6 ), a significant increase in current is observed, accompanied by a complete motor shutdown.
After voltage recovery, the IM undergoes re-acceleration with high inrush currents reaching up to 5 pu. Such behavior must be considered in the design of motor protection systems.
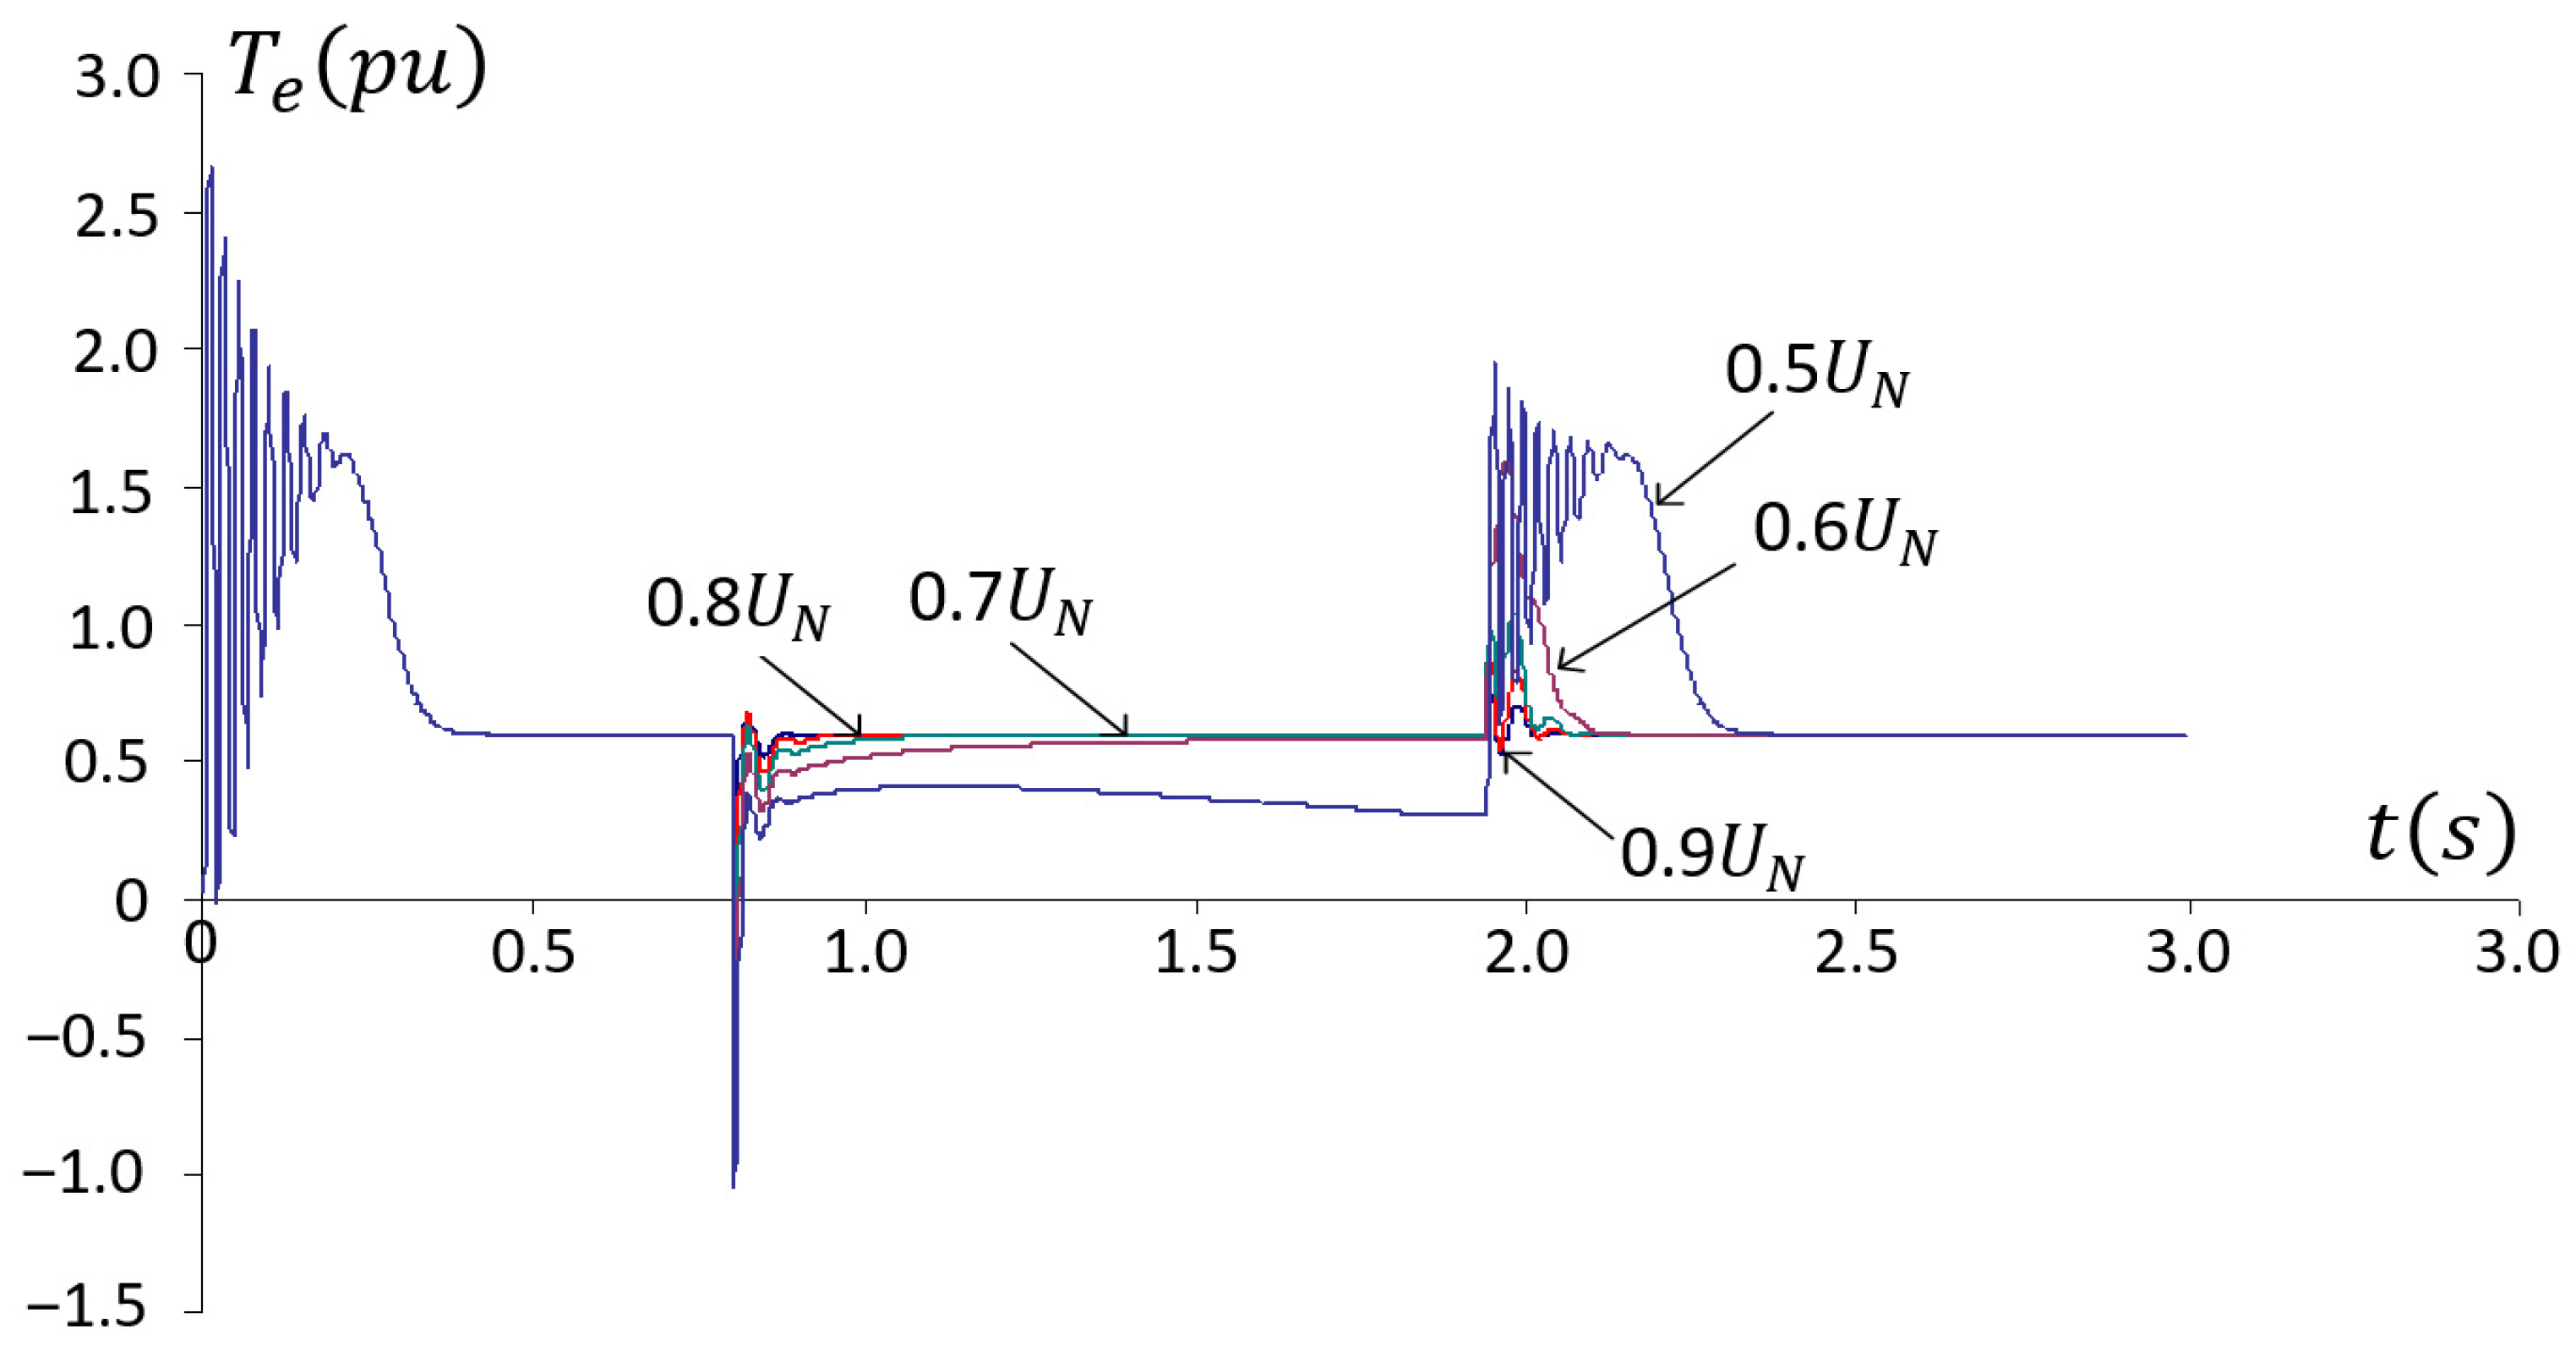
Figure 11 illustrates the electromagnetic torque response of the IM during re-acceleration under a constant load torque. At voltage levels of 0.8–0.9 , the developed torque remains above the load torque, ensuring stable operation. Under deeper voltage sags (0.6–0.5 ); however, the electromagnetic torque becomes insufficient to balance the mechanical load, leading to motor deceleration. After voltage recovery, a sharp torque surge occurs during re-acceleration, accompanied by oscillations and increased thermal stress on the stator windings [76].
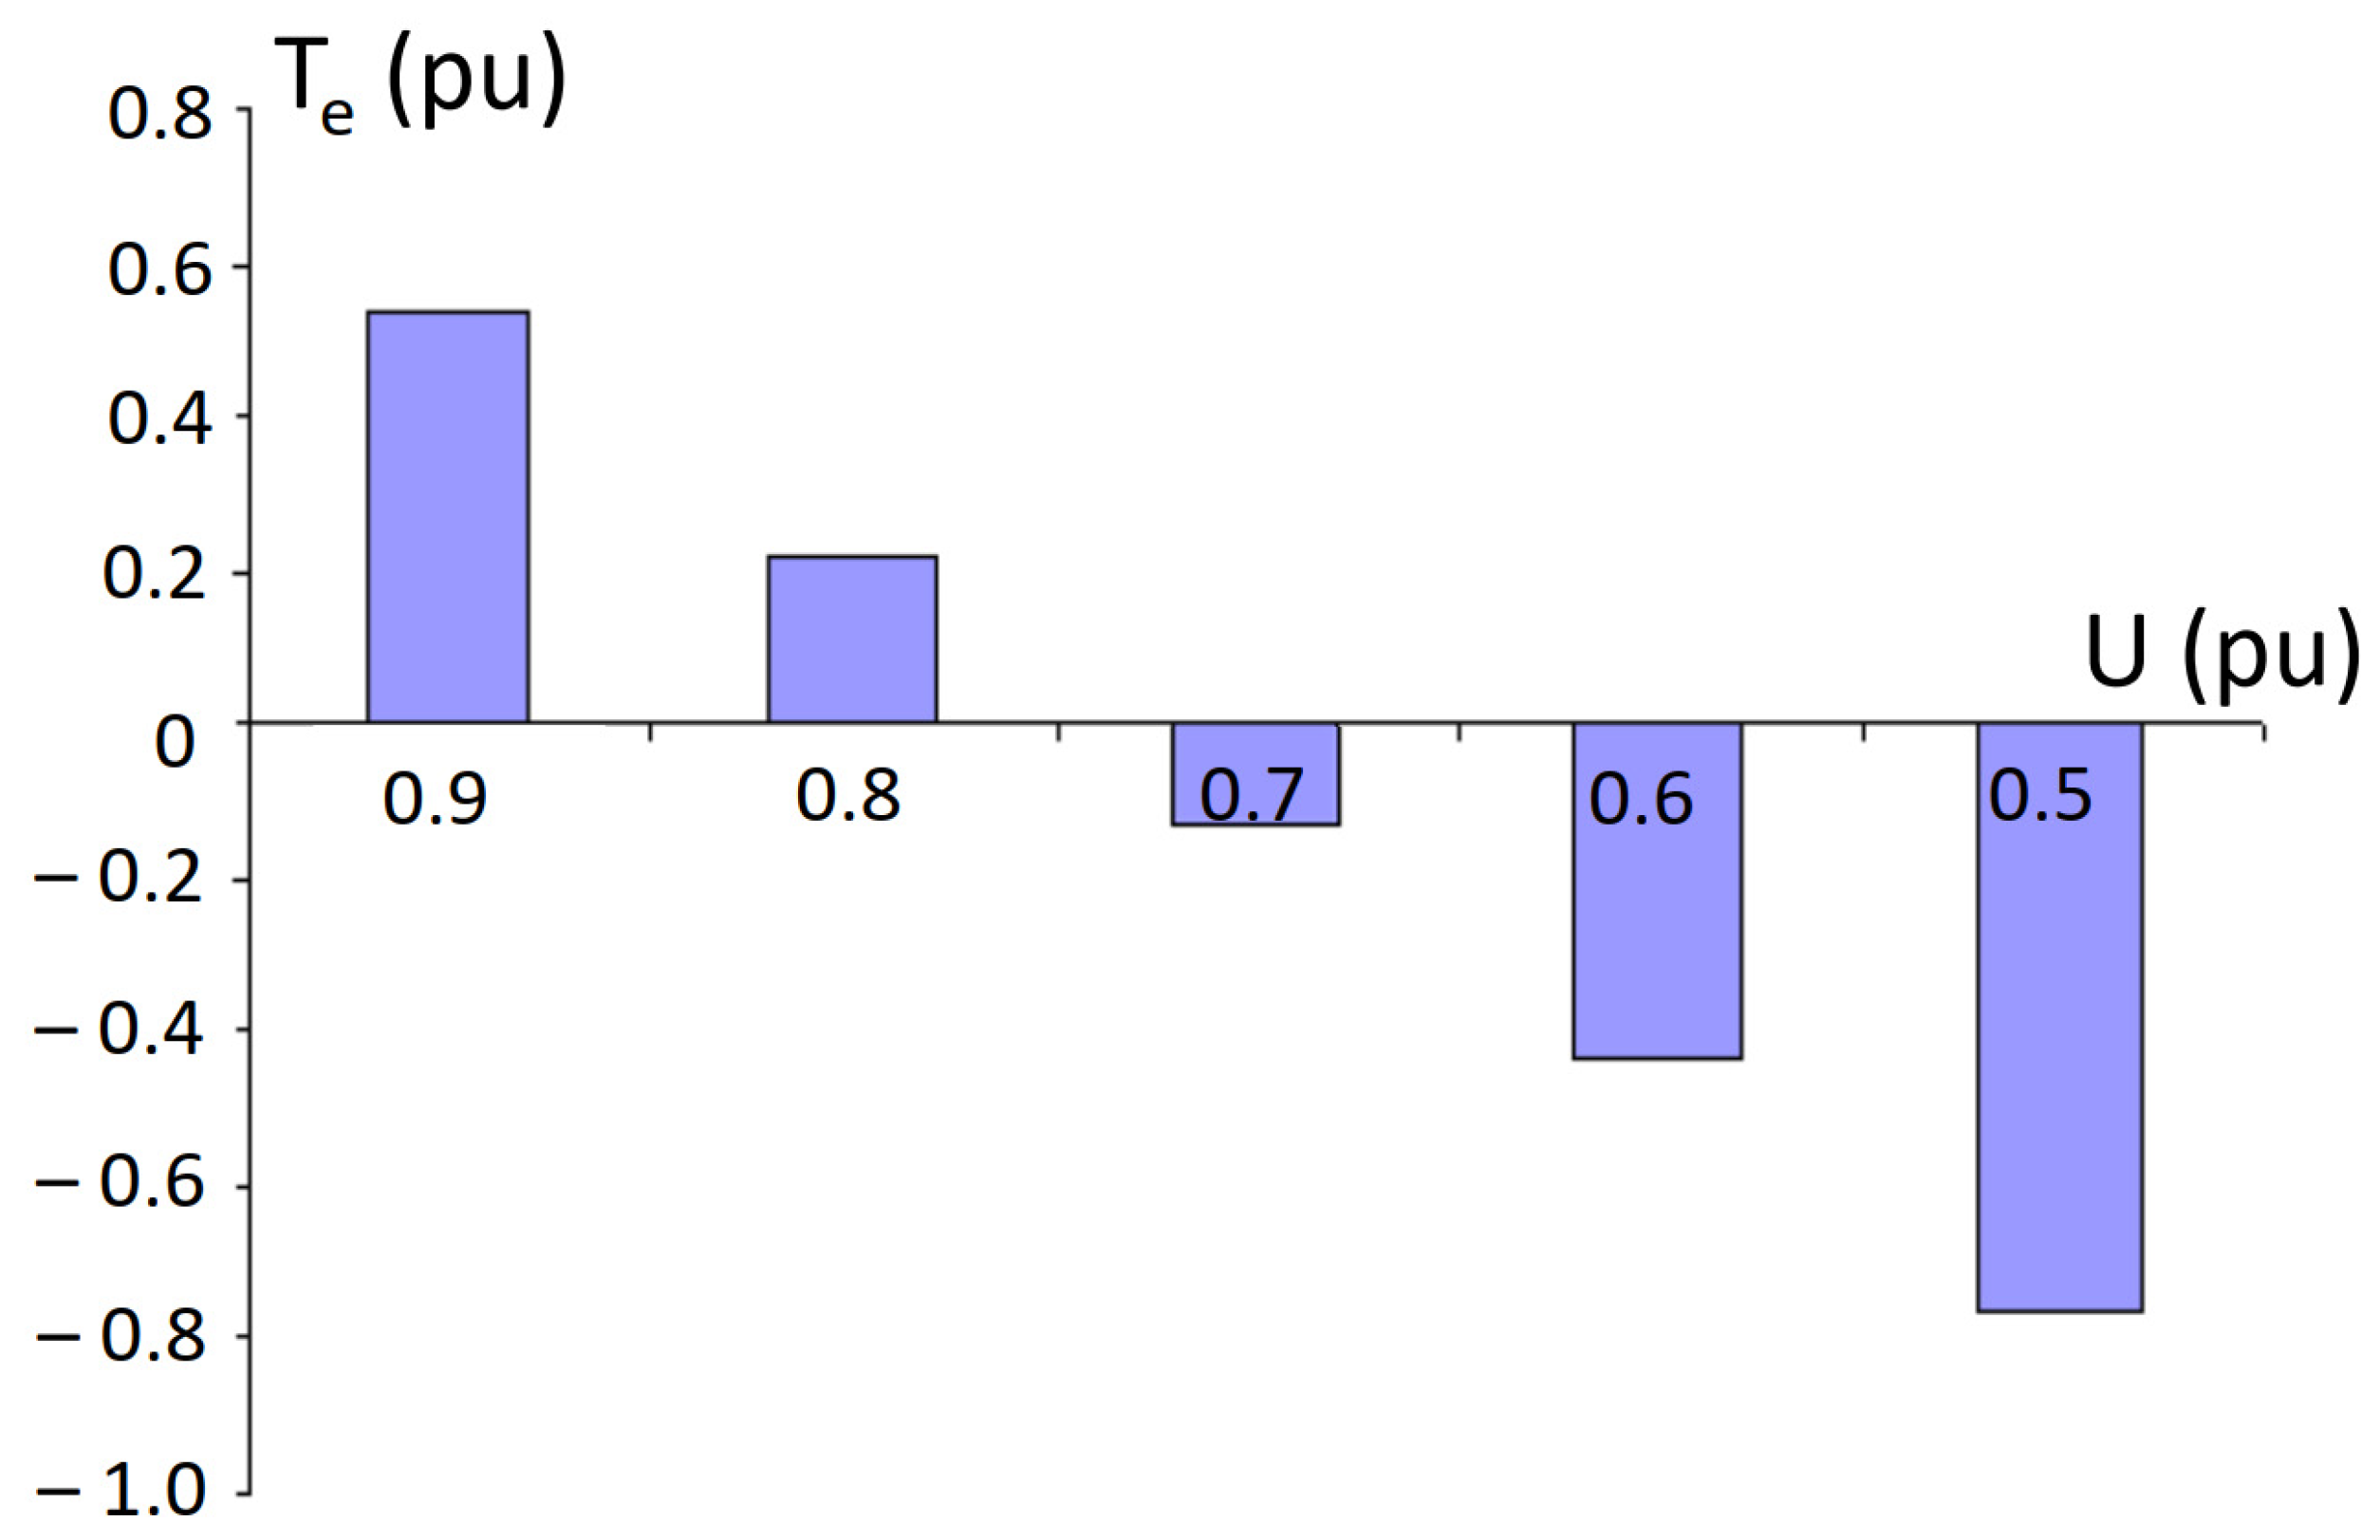
During severe voltage sags, the rotor continues to rotate due to the kinetic energy stored in the mechanical system. In this phase, the combined effect of residual EMF and reduced supply voltage can produce a negative electromagnetic torque, which corresponds to a brief period of regenerative braking. This phenomenon is particularly evident when the IM operates under a constant load torque and the developed torque falls below the torque required to sustain rotation. It is typically accompanied by current and torque oscillations and potential instability in rotor speed. This behavior is commonly referred to in the literature as negative torque resulting from voltage sags in the presence of residual kinetic energy [77,78].
During the simulation of the self-starting process of an IM, two types of load torque were considered: a variable load ( var) and a constant load ( const). Figure 12 and Figure 13 present the time-dependent electromagnetic torque profiles of the motor for supply voltage levels reduced to 0.9, 0.8, 0.7, 0.6, and 0.5 . The graphs indicate the threshold voltages at which the electromagnetic torque becomes negative, marking the transition of the motor into generator mode and the feeding of power back to the fault point. When the IM changes from generator mode back to motor mode during voltage recovery, torque reversal can produce high transient peak-to-peak values. Such oscillations may induce stress and fatigue in the shaft and coupling, potentially causing mechanical damage [72]. Following voltage restoration at the terminals, the IM undergoes a sharp re-acceleration (self-starting) under load, accompanied by significant transient processes.
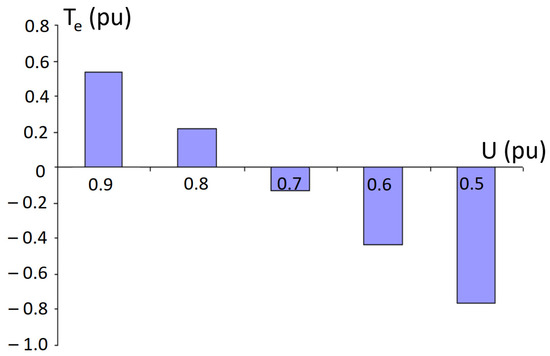
Figure 12.
Variation in the electromagnetic torque of the IM under variable load conditions depending on the reduced voltage level. Rated power = 0.75 kW.
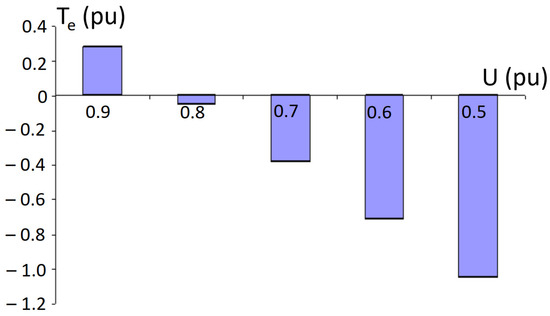
Figure 13.
Variation in the electromagnetic torque of the IM under constant load conditions depending on the reduced voltage level. Rated power = 0.75 kW.
The peak values of the electromagnetic torque and stator currents observed during voltage sag and subsequent voltage recovery at the busbars connected to the IM are summarized in Table A2 and Table A3 of Appendix A.
It should be noted that the mathematical model of the IM applied in this work to analyze self-starting modes was previously compared with several alternative models, as described in [74]. All four considered models, including the d,q formulation, demonstrated identical results when simulating transient start-up processes, thereby confirming their internal consistency and adequacy. Furthermore, one of these models (in the α,β coordinate system), which is structurally equivalent to the model used in the present study, was experimentally validated using a three-phase IM rated at 3 kW. A comparison between the simulation results and experimental measurements showed a high degree of correlation, as reported in [79]. Therefore, the model employed in this article can be considered accurate, reliable, and thoroughly validated—both through theoretical consistency and experimental verification.
6. Conclusions
This study provides an in-depth investigation of the dynamic behavior of a three-phase IM during voltage sags and the subsequent self-starting process under load conditions. The simulation results, based on a validated mathematical model, demonstrate the critical influence of voltage dip parameters and load torque characteristics on motor performance, torque oscillations, and thermal stress during re-acceleration.
Based on the analysis of the obtained results, the following conclusions can be drawn:
- The duration of the voltage dip does not significantly affect either the electromagnetic torque or the stator current at the instant of voltage reduction.
- The dip duration has a major impact on the stator current during voltage recovery: shorter interruptions result in lower recovery currents, whereas longer interruptions lead to higher recovery currents.
- An IM operating under constant load torque enters generator mode at a higher remaining voltage level compared to an IM under variable load conditions.
- Threshold conditions for failed re-acceleration and transition into generator mode are identified as functions of voltage dip depth, interruption duration, and load torque characteristics (constant load torque vs. variable load conditions).
These observations are in line with earlier studies that report speed loss during voltage sags and increased inrush/torque at recovery; at the same time, the present study extends prior work by explicitly separating constant- and variable-torque cases, systematically isolating the effect of interruption duration on recovery behavior, and identifying threshold conditions for failed re-acceleration and generator-mode operation under realistic supply disturbance scenarios.
The use of a previously verified model—consistent with both theoretical frameworks and experimental validation—ensures the credibility and applicability of the obtained results. The reported peak values of stator current and electromagnetic torque at the dip and within the first cycles after recovery make the results directly applicable to protection settings, restart coordination, and the tuning of automation strategies in industrial applications where voltage disturbances are frequent.
Further research is needed to investigate the behavior of IMs during rapid breaker reclosing, particularly when the residual electromotive force (EMF) may be out of phase with the reapplied voltage, potentially causing severe transients. In addition, the impact of supply voltage asymmetry on motor operation and stability requires further examination.
Funding
This research received no external funding.
Data Availability Statement
The data and Fortran code supporting the findings of this study are available from the corresponding author upon reasonable request.
Acknowledgments
M.K. thanks Anatoli Popov for fruitful discussion.
Conflicts of Interest
The author declares no conflicts of interest.
Appendix A
Table A1 presents the technical specifications of the IM 4A71A2U3, rated at 0.75 kW.
Table A2 shows the per-unit (pu) values of stator current and electromagnetic torque at the instant of voltage dip for the IM 4A71A2U3 (0.75 kW).
Table A3 shows the per-unit (pu) values of stator current and electromagnetic torque at the instant of voltage recovery for the IM 4A71A2U3 (0.75 kW).

Table A1.
Technical specifications of the IM 4A71A2U3 (0.75 kW).
Table A1.
Technical specifications of the IM 4A71A2U3 (0.75 kW).
| Parameter | Symbol | Value | Unit |
|---|---|---|---|
| Rated power | 0.75 | kW | |
| Main inductive reactance | 2.6 | pu | |
| Stator winding resistance (active) | 0.12 | pu | |
| Stator winding reactance | 0.052 | pu | |
| Rotor resistance referred to the stator winding (active) | 0.064 | pu | |
| Rotor reactance referred to the stator winding | 0.077 | pu | |
| Synchronous speed | n | 3000 | min−1 |
| Short-circuit resistance (active) | 0.19 | pu | |
| Short-circuit reactance | 0.11 | pu | |
| Starting current | 5.5 | pu | |
| Dynamic moment of inertia | 0.00097 | ||
| Rated torque | 2.4 | ||
| Motor time constant | 39.87 | s | |
| Time constant including the referred mechanism | 82 | s |

Table A2.
Maximum values of stator current and electromagnetic torque during the voltage-sag interval for the IM 4A71A2U3 (0.75 kW), in motor-base per-unit (pu).
Table A2.
Maximum values of stator current and electromagnetic torque during the voltage-sag interval for the IM 4A71A2U3 (0.75 kW), in motor-base per-unit (pu).
| IM Type and Rated Power (kW) | [pu] | s Imax, Te,max (pu) | s Imax, Te,max (pu) | Load Type, |
|---|---|---|---|---|
| 4A71A2U3 (0.75) | variable | |||
| variable | ||||
| variable | ||||
| variable | ||||
| variable | ||||
| constant | ||||
| constant | ||||
| constant | ||||
| constant | ||||
| constant |

Table A3.
Maximum values of stator current and electromagnetic torque within the first three fundamental periods after voltage recovery for the IM 4A71A2U3 (0.75 kW), in motor-base per-unit (pu).
Table A3.
Maximum values of stator current and electromagnetic torque within the first three fundamental periods after voltage recovery for the IM 4A71A2U3 (0.75 kW), in motor-base per-unit (pu).
| IM Type and (kW) | [pu] | s Imax, Te,max (pu) | s Imax, Te,max (pu) | Load Type, |
|---|---|---|---|---|
| 4A71A2U3 (0.75) | variable | |||
| ; | ; | variable | ||
| variable | ||||
| variable | ||||
| variable | ||||
| constant | ||||
| constant | ||||
| constant | ||||
| constant | ||||
| constant |
References
- Guru, B.S.; Hiziroglu, H.R. Electric Machinery and Transformers; Oxford University Press: New York, NY, USA, 2001; Volume 726. [Google Scholar]
- Sauvey, C.; Schutz, J.; Gillet, Y. Practical Work of Three-Phased Induction Motor Modeling in a Classical Spreadsheet Software. Appl. Sci. 2025, 15, 1015. [Google Scholar] [CrossRef]
- Market.us. Electric Motors Market Size, Share and Growth Report 2024–2033. Available online: https://market.us/report/electric-motors-market/ (accessed on 22 September 2025).
- Paramasivam, A.; Kalaiyarasi, D.; Raja, M.S.; Pavaiyarkarasi, R. An efficient COA approach-based open-end winding induction motor with direct torque control for minimize the power loss. Electr. Eng. 2025, 107, 2073–2087. [Google Scholar] [CrossRef]
- Sheikh, M.A.; Bakhsh, S.T.; Irfan, M.; Nor, N.B.M.; Nowakowski, G. A review to diagnose faults related to three-phase industrial induction motors. J. Fail. Anal. Prev. 2022, 22, 1546–1557. [Google Scholar] [CrossRef]
- Azab, M. A Review of Recent Trends in High-Efficiency Induction Motor Drives. Vehicles 2025, 7, 15. [Google Scholar] [CrossRef]
- Eseosa, O.; Christian, A. Energy Efficiency Optimization of Three Phase Induction Motor Drives for Industrial Applications. Int. J. Eng. Appl. Sci. 2018, 5, 42–49. [Google Scholar] [CrossRef]
- Kumar, P. Transfer Learning for Induction Motor Health Monitoring: A Brief Review. Energies 2025, 18, 3823. [Google Scholar] [CrossRef]
- Sengamalai, U.; Anbazhagan, G.; Thamizh Thentral, T.M.; Vishnuram, P.; Khurshaid, T.; Kamel, S. Three Phase Induction Motor Drive: A Systematic Review on Dynamic Modeling, Parameter Estimation, and Control Schemes. Energies 2022, 15, 8260. [Google Scholar] [CrossRef]
- Konuhova, M.; Bezrukovs, V.; Bezrukovs, V.; Bezrukovs, D.; Buryi, M.; Gorbunovs, N.; Popov, A.I. Numerical Simulations of Scaling of the Chamber Dimensions of the Liquid Piston Compressor for Hydrogen Applications. Technologies 2025, 13, 226. [Google Scholar] [CrossRef]
- Anthony, Z.; Nazir, R.; Hamid, M.I. A Review of Strategies for Improving 3-Phase Induction Motor Performance. Andalasian Int. J. Appl. Sci. Eng. Technol. 2024, 4, 1–12. [Google Scholar] [CrossRef]
- Abdo, A.; Siam, J.; Abdou, A.; Shehadeh, H.; Mustafa, R. Practical Test on the Operation of the Three-Phase Induction Motor under Single-Phasing Fault. Appl. Sci. 2024, 14, 4690. [Google Scholar] [CrossRef]
- Kobayashi, A.; Nakamura, K.; Ono, T. Measuring the Operating Condition of Induction Motor Using High-Sensitivity Magnetic Sensor. Sensors 2025, 25, 4471. [Google Scholar] [CrossRef]
- Aires, F.L.; Galeno, G.D.; Belchior, F.N.; Oliveira, A.M.; Hunt, J.D. Enhancing three-phase induction motor reliability with health index and artificial intelligence-driven predictive maintenance. R. Soc. Open Sci. 2025, 12, 241946. [Google Scholar] [CrossRef] [PubMed]
- Bahgat, B.H.; Elhay, E.A.; Elkholy, M.M. Advanced fault detection technique of three phase induction motor: Comprehensive review. Discov. Electron. 2024, 1, 9. [Google Scholar] [CrossRef]
- Mamchur, D.; Husach, S. An analysis on induction motor reliability and lifetime estimation methods. Prz. Elektrotechniczny 2020, 96, 218–221. [Google Scholar] [CrossRef]
- Cureño-Osornio, J.; Alvarez-Ugalde, C.A.; Zamudio-Ramirez, I.; Osornio-Rios, R.A.; Dunai, L.; Turcanu, D.; Antonino-Daviu, J.A. Start-Up and Steady-State Regimes Automatic Separation in Induction Motors by Means of Short-Time Statistics. Electronics 2024, 13, 3850. [Google Scholar] [CrossRef]
- Paramo-Balsa, P.; Roldan-Fernandez, J.M.; Semião, J.; Burgos-Payan, M. Estimation of Power Output and Efficiency of Induction Motors: A New Non-Intrusive Approach. Sensors 2025, 25, 754. [Google Scholar] [CrossRef]
- Saribulut, L.; Ameen, A. Voltage Sag Detection and Compensation Signal Extraction for Power Quality Mitigation Devices. Energies 2023, 16, 5999. [Google Scholar] [CrossRef]
- Patra, J.; Pal, N. A Mathematical Approach of Voltage Sag Analysis Incorporating Bivariate Probability Distribution in a Meshed System. Energies 2022, 15, 7592. [Google Scholar] [CrossRef]
- Hao, C.; Jin, J. Clustering Analysis of Voltage Sag Events Based on Waveform Matching. Processes 2022, 10, 1337. [Google Scholar] [CrossRef]
- Varetsky, Y.; Gajdzica, M. Power Compatibility of Induction Motors in Industrial Grids Containing Synchronous Generators. Energies 2024, 17, 1066. [Google Scholar] [CrossRef]
- Petronijević, M.; Mitrović, N.; Kostić, V.; Banković, B. An Improved Scheme for Voltage Sag Override in Direct Torque Controlled Induction Motor Drives. Energies 2017, 10, 663. [Google Scholar] [CrossRef]
- Küçük, S.; Fernandez, L.F.; Bayrak, M.; Yılmaz, A.S. Restarting scheme of electrical motors after supply voltage outages in heavily loaded industrial facilities. In Proceedings of the 9th International Conference on Electrical and Electronics Engineering (ELECO), Bursa, Turkey, 26–28 November 2015; pp. 599–603. [Google Scholar] [CrossRef]
- Dinolova, P.; Ruseva, V.; Dinolov, O. Software-based methodology for investigating the performance of an adapted model for improving the energy efficiency of induction motor drives. In E3S Web of Conferences; EDP Sciences: Les Ulis, France, 2025; Volume 638, p. 01007. [Google Scholar] [CrossRef]
- Bollen, M. The influence of motor reacceleration on voltage sags. IEEE Trans. Ind. Appl. 1995, 31, 667–674. [Google Scholar] [CrossRef]
- Nikolaidis, V.C.; Ioannidis, K.Z.; Prousalidis, J.M. Identifying weaknesses in AC shipboard power systems operation during motor starts and reacceleration. Electr. Power Syst. Res. 2021, 197, 107328. [Google Scholar] [CrossRef]
- Wang, Z.; Wang, X. Induction motor interactions after voltage sags. In Proceedings of the 2013 IEEE Electrical Power & Energy Conference, Halifax, NS, Canada, 21–23 August 2013; pp. 1–5. [Google Scholar] [CrossRef]
- Mali, V.P.; Chakrasali, R.L.; Aprameya, K.S. A technical investigation of voltage sag. Am. J. Eng. Res. (AJER) 2015, 4, 60–68. Available online: https://www.ajer.org/papers/v4(10)/J041060068.pdf (accessed on 25 October 2025).
- Han, Y.; Feng, Y.; Yang, P.; Xu, L.; Xu, Y.; Blaabjerg, F. Cause, Classification of Voltage Sag, and Voltage Sag Emulators and Applications: A Comprehensive Overview. IEEE Access 2020, 8, 1922–1934. [Google Scholar] [CrossRef]
- Raghavan, S.; Hall, B.J.; Jagaduri, R.T. Simulation and analysis of voltage sag during transformer energization on an offshore platform. In Proceedings of the 2016 Petroleum and Chemical Industry Technical Conference (PCIC), Philadelphia, PA, USA, 19–22 September 2016; pp. 1–7. [Google Scholar] [CrossRef]
- Veizaga, M.; Delpha, C.; Diallo, D.; Bercu, S.; Bertin, L. Classification of voltage sags causes in industrial power networks using multivariate time-series. IET Gener. Transm. Distrib. 2023, 17, 1568–1584. [Google Scholar] [CrossRef]
- Ma, L.; Li, Y.; Tian, D.; Lou, J.; Chen, Y.; Liu, X. Assessment of voltage sag/swell in the distribution network based on energy index and influence degree function. Electr. Power Syst. Res. 2023, 216, 109072. [Google Scholar] [CrossRef]
- Pires, V.F.; Monteiro, J.; Silva, J.F. Dual 3-Phase Bridge Multilevel Inverters for AC Drives with Voltage Sag Ride-through Capability. Energies 2019, 12, 2324. [Google Scholar] [CrossRef]
- Gonzalez-Abreu, A.-D.; Osornio-Rios, R.-A.; Jaen-Cuellar, A.-Y.; Delgado-Prieto, M.; Antonino-Daviu, J.-A.; Karlis, A. Advances in Power Quality Analysis Techniques for Electrical Machines and Drives: A Review. Energies 2022, 15, 1909. [Google Scholar] [CrossRef]
- Elgammal, M.A.; Abou-Ghazala, A.Y.; Elshennaway, T.I. Effects of Voltage Sags on Induction Motors. Acta Electroteh. 2009, 50, 245–252. Available online: https://ie.utcluj.ro/files/acta/2009/Number4/Paper04_ElGammal.pdf (accessed on 25 October 2025).
- ElShennawy, T.I.; El-Gammal, M.A.; Abou-Ghazala, A.Y. Voltage sag effects on the process continuity of a refinery with induction motors loads. Am. J. Appl. Sci. 2009, 6, 1626–1632. [Google Scholar] [CrossRef]
- Motoki, É.M.; Filho, J.M.d.C.; da Silveira, P.M.; Pereira, N.B.; de Souza, P.V.G. Cost of Industrial Process Shutdowns Due to Voltage Sag and Short Interruption. Energies 2021, 14, 2874. [Google Scholar] [CrossRef]
- Hardi, S.; Hafizi, M.; Isa, M.; Masri, S.; bin Ruslan, M.A.; Hasan, S.; Nisja, I. Effects of Different Voltage Sag Types on Induction Motor. Appl. Mech. Mater. 2015, 793, 262–266. [Google Scholar] [CrossRef]
- Živković, L.; Benšić, T.; Barukčić, M.; Kurtović, G. A Survey on Mission-Profile-Based Stress Testing of Electric Motor Drives. Appl. Sci. 2025, 15, 5082. [Google Scholar] [CrossRef]
- Siregar, Y.; Siahaan, Y.R.O.; Mohamed, N.N.B.; Riawan, D.C.; Yuhendri, M. Design of starting a three phase induction motor using direct on-line, variable frequency drive, soft starting, and auto transformer methods. Indones. J. Electr. Eng. Comput. Sci. 2025, 37, 700–714. [Google Scholar] [CrossRef]
- Knezevic, I.; Calasan, M.; Dlabac, T.; Filipovic, F.; Mitrovic, N. Exact Analytical Solutions for Modelling the Speed-Time Characteristics of Direct-Start Induction Machines under Various Operational Conditions on Ships: Review and Experimental Validation. Elektron. Ir Elektrotechnika 2024, 30, 4–12. [Google Scholar] [CrossRef]
- Mallick, N.; Shiva, C.K.; Sen, S.; Basetti, V.; Mukherjee, V.; Reddy, C.S. Adaptive fuzzy-PI controlled dynamic voltage restorer for mitigating voltage sags. Sci. Rep. 2025, 15, 16817. [Google Scholar] [CrossRef]
- Wang, G.; Xu, Z.; Zhang, Z. Research on Applicability of the Practical Transient Voltage Stability Criterion Based on Voltage Magnitude and Sag Duration. Appl. Sci. 2021, 11, 4569. [Google Scholar] [CrossRef]
- Liubčuk, V.; Radziukynas, V.; Kairaitis, G.; Naujokaitis, D. Power Quality Impact and Its Assessment: A Review and a Survey of Lithuanian Industrial Companies. Inventions 2025, 10, 30. [Google Scholar] [CrossRef]
- Majidov, A.; Hafizov, S.; Zokirov, M.; Abdullozoda, S.; Azimov, A.; Naimov, S. Analysis of the Influence of Electricity Quality Indicators on the Operating Modes of Asynchronous Motors. In Proceedings of the 2022 4th International Youth Conference on Radio Electronics, Electrical and Power Engineering (REEPE), Moscow, Russia, 17–19 March 2022; pp. 1–6. [Google Scholar] [CrossRef]
- Majidov, A.; Kayumov, A.G.; Hafizov, S. Investigation of the Self-Starting Process of a Low-Power Asynchronous Motor. In Proceedings of the 2021 IEEE Conference of Russian Young Researchers in Electrical and Electronic Engineering (ElConRus), St. Petersburg, Moscow, Russia, 26–28 January 2021; pp. 1462–1468. [Google Scholar] [CrossRef]
- Gomez, J.; Morcos, M.; Reineri, C.; Campetelli, G. Behavior of induction motor due to voltage sags and short interruptions. IEEE Trans. Power Deliv. 2002, 17, 434–440. [Google Scholar] [CrossRef]
- Leiria, A.; Nunes, P.; Morched, A.; Correia de Barros, M.T. Induction motor response to voltage dips. Electr. Power Syst. Res. 2006, 76, 676–680. [Google Scholar] [CrossRef]
- Hardi, S.; Sugito, B.; Arif, A.; Sinaga, D.J.; Solihin, M.D.; Isa, M. Induction Motor Performance Under Voltage Sag Type I, Type II, and Type III: Experimental Study. In Proceedings of the 2024 8th International Conference on Electrical, Telecommunication and Computer Engineering (ELTICOM), Medan, Indonesia, 21–22 November 2024; pp. 292–297. [Google Scholar] [CrossRef]
- Alghamdi, B. Distributed consensus-based voltage and frequency control for isolated microgrids with fault-induced delayed voltage recovery mitigation. Front. Energy Res. 2025, 12, 1468496. [Google Scholar] [CrossRef]
- Ferreira, F.J.T.E.; Baoming, G.; de Almeida, A.T. Reliability and Operation of High-Efficiency Induction Motors. IEEE Trans. Ind. Appl. 2016, 52, 4628–4637. [Google Scholar] [CrossRef]
- Beaty, H.W.; Fink, D.G. Standard Handbook for Electrical Engineers; McGraw-Hill: New York, NY, USA, 2013. [Google Scholar]
- Gurevich, Y.E. Calculations of Stability and Emergency Automation in Power Systems; Gurevich, Y.E., Libova, L.E., Okin, A.A., Eds.; Energoatomizdat: Moscow, Russia, 1990; p. 391. [Google Scholar]
- Wang, X.; Du, H.; Liang, Z.; Guo, L.; Gao, J.; Kheshti, M.; Liu, W. Single phase to ground fault location method of overhead line based on magnetic field detection and multi-criteria fusion. Int. J. Electr. Power Energy Syst. 2023, 145, 108699. [Google Scholar] [CrossRef]
- Toader, D.; Vintan, M. Mathematical Models of the Phase Voltages of High-, Medium- and Low-Voltage Busbars in a Substation during a Phase-to-Ground Fault on High-Voltage Busbars. Mathematics 2023, 11, 3032. [Google Scholar] [CrossRef]
- Alipoor, J.; Doroudi, A.; Ghaseminezhad, M. Detection of the critical duration of different types of voltage sags for synchronous machine torque oscillation. Energy Power Eng. 2012, 4, 117–124. [Google Scholar] [CrossRef]
- Kamble, S.; Thorat, C. Voltage sag characterization in a distribution systems: A case study. J. Power Energy Eng. 2014, 2, 546–553. [Google Scholar] [CrossRef]
- Faiz, J.; Heydarabadi, R. Diagnosing power transformers faults. Russ. Electr. Eng. 2014, 85, 785–793. [Google Scholar] [CrossRef]
- Bai, P.; Jia, Y. Simulation analysis of internal and external faults in transformer area. In MATEC Web of Conferences; EDP Sciences: Les Ulis, France, 2023; Volume 382, p. 01041. [Google Scholar] [CrossRef]
- European Network of Transmission System Operators for Electricity. Best Protection Practices for HV and EHV AC-Transmission Systems of ENTSO-E Electrical Grids. Available online: https://eepublicdownloads.entsoe.eu/clean-documents/SOC%20documents/Best_protection_practices_for_HV_EHV_AC_transmission_system.pdf (accessed on 22 September 2025).
- ABB Instrument Transformers | Application Guide, ABB. 2020, p. 55. Available online: https://es.dcsmodule.com/js/htmledit/kindeditor/attached/20210823/20210823153632_48474.pdf (accessed on 22 September 2025).
- Sevov, L.; Allcock, D.; Luna, R.; Bowen, J. Motor Reacceleration to Improve Process Uptime. IEEE Trans. Ind. Appl. 2016, 52, 684–691. [Google Scholar] [CrossRef]
- Gardell, J.; Fredrickson, D. Motor Bus Transfer Applications: Issues and Considerations. J9 Working Group Report to the Rotating Machinery Protection Subcommittee of the IEEE-Power System Relay Committee. May 2012. Available online: https://www.pes-psrc.org/kb/report/025.pdf (accessed on 25 October 2025).
- Bonnett, A.H. Root Cause Failure Analysis for AC Induction Motors in the Petroleum and Chemical Industry. In Proceedings of the 2010 IEEE Industry Applications Society 57th Annual Petroleum and Chemical Industry Conference (PCIC), San Antonio, TX, USA, 20–22 September 2010; pp. 1–13. [Google Scholar]
- Serrano-Fontova, A.; Casals Torrens, P.; Bosch, R. Power Quality Disturbances Assessment during Unintentional Islanding Scenarios. A Contribution to Voltage Sag Studies. Energies 2019, 12, 3198. [Google Scholar] [CrossRef]
- Loaiza-Estrada, S.; Mesa-Beleño, J.P.; Lemmel-Vélez, K.; Estrada-Mesa, S.A.; Valencia-Hernandez, C.A.; Velasco-Méndez, J.R.; Monsalve-Cadavid, M.A. Transient Analysis of Fault-Induced Delayed Voltage Recovery by Mathematical Modeling of a Three-Phase Induction Motor. Electricity 2025, 6, 8. [Google Scholar] [CrossRef]
- Araújo, V.G.d.; Bissiriou, A.O.-S.; Villanueva, J.M.M.; Villarreal, E.R.L.; Salazar, A.O.; Teixeira, R.d.A.; Fonsêca, D.A.d.M. Monitoring and Diagnosing Faults in Induction Motors’ Three-Phase Systems Using NARX Neural Network. Energies 2024, 17, 4609. [Google Scholar] [CrossRef]
- Golodnov, Y.M. Automatic Restart of Electric Motors, 2nd ed.; revised and supplemented; Energoatomizdat: Moscow, Russia, 1985. [Google Scholar]
- Laramore, R.D. An Introduction to Electrical Machines and Transformers; Wiley: Hoboken, NJ, USA, 1990. [Google Scholar]
- Pavlov, V.E.; Peregudova, I.G. Study of Conditions for Group Self- Starting High-Voltage Electric Drives in Turbo Mechanisms. In Proceedings of the 2020 International Ural Conference on Electrical Power Engineering (UralCon), Chelyabinsk, Russia, 22–24 September 2020; pp. 147–152. [Google Scholar] [CrossRef]
- Yalla, M.V.V.S.; Vakili, A.; Beckwith, T.R. Calculation of Transient Torques on Motors During a Residual Voltage Motor Bus Transfer. IEEE Trans. Ind. Appl. 2020, 56, 6104–6116. [Google Scholar] [CrossRef]
- Sattarov, R.R.; Morozov, P.V. Physical approach to analysis of induction motor braking under machinery load. J. Phys. Conf. Ser. 2020, 1661, 012151. [Google Scholar] [CrossRef]
- Konuhova, M. Induction Motor Dynamics Regimes: A Comprehensive Study of Mathematical Models and Validation. Appl. Sci. 2025, 15, 1527. [Google Scholar] [CrossRef]
- Sobolevskaya, A.E.; Shlaf, M.M.; Afonin, V.I.; Sobolevskaya, E.A. Asynchronous Motors of the 4A Series: Handbook; Energoizdat: Moscow, Russia, 1982. [Google Scholar]
- Josiah, C.; Enefiok, E.; Christopher, I. Fault Resistance and Adaptive Analysis of Induction Motors under Voltage Variations in Industrial Applications. J. Eng. Res. Rep. 2024, 26, 231–248. [Google Scholar] [CrossRef]
- Karady, G.G.; Saksena, S.; Shi, B.Z. Effects of Voltage Sags on House Hold Loads. In Proceedings of the IEEE Power Engineering Society General Meeting, San Francisco, CA, USA, 16 June 2005; Volume 3, p. 24562461. [Google Scholar]
- Huchche, V.; Patne, N. Analytical assessment of torque and stator currents of an induction motor due to voltage sags. Int. J. Electr. Comput. Eng. 2023, 13, 3613–3621. Available online: https://ijece.iaescore.com/index.php/IJECE/article/view/28760 (accessed on 25 October 2025). [CrossRef]
- Konuhova, M. Modeling of Induction Motor Direct Starting with and without Considering Current Displacement in Slot. Appl. Sci. 2024, 14, 9230. [Google Scholar] [CrossRef]
Disclaimer/Publisher’s Note: The statements, opinions and data contained in all publications are solely those of the individual author(s) and contributor(s) and not of MDPI and/or the editor(s). MDPI and/or the editor(s) disclaim responsibility for any injury to people or property resulting from any ideas, methods, instructions or products referred to in the content. |
© 2025 by the author. Licensee MDPI, Basel, Switzerland. This article is an open access article distributed under the terms and conditions of the Creative Commons Attribution (CC BY) license (https://creativecommons.org/licenses/by/4.0/).

