Abstract
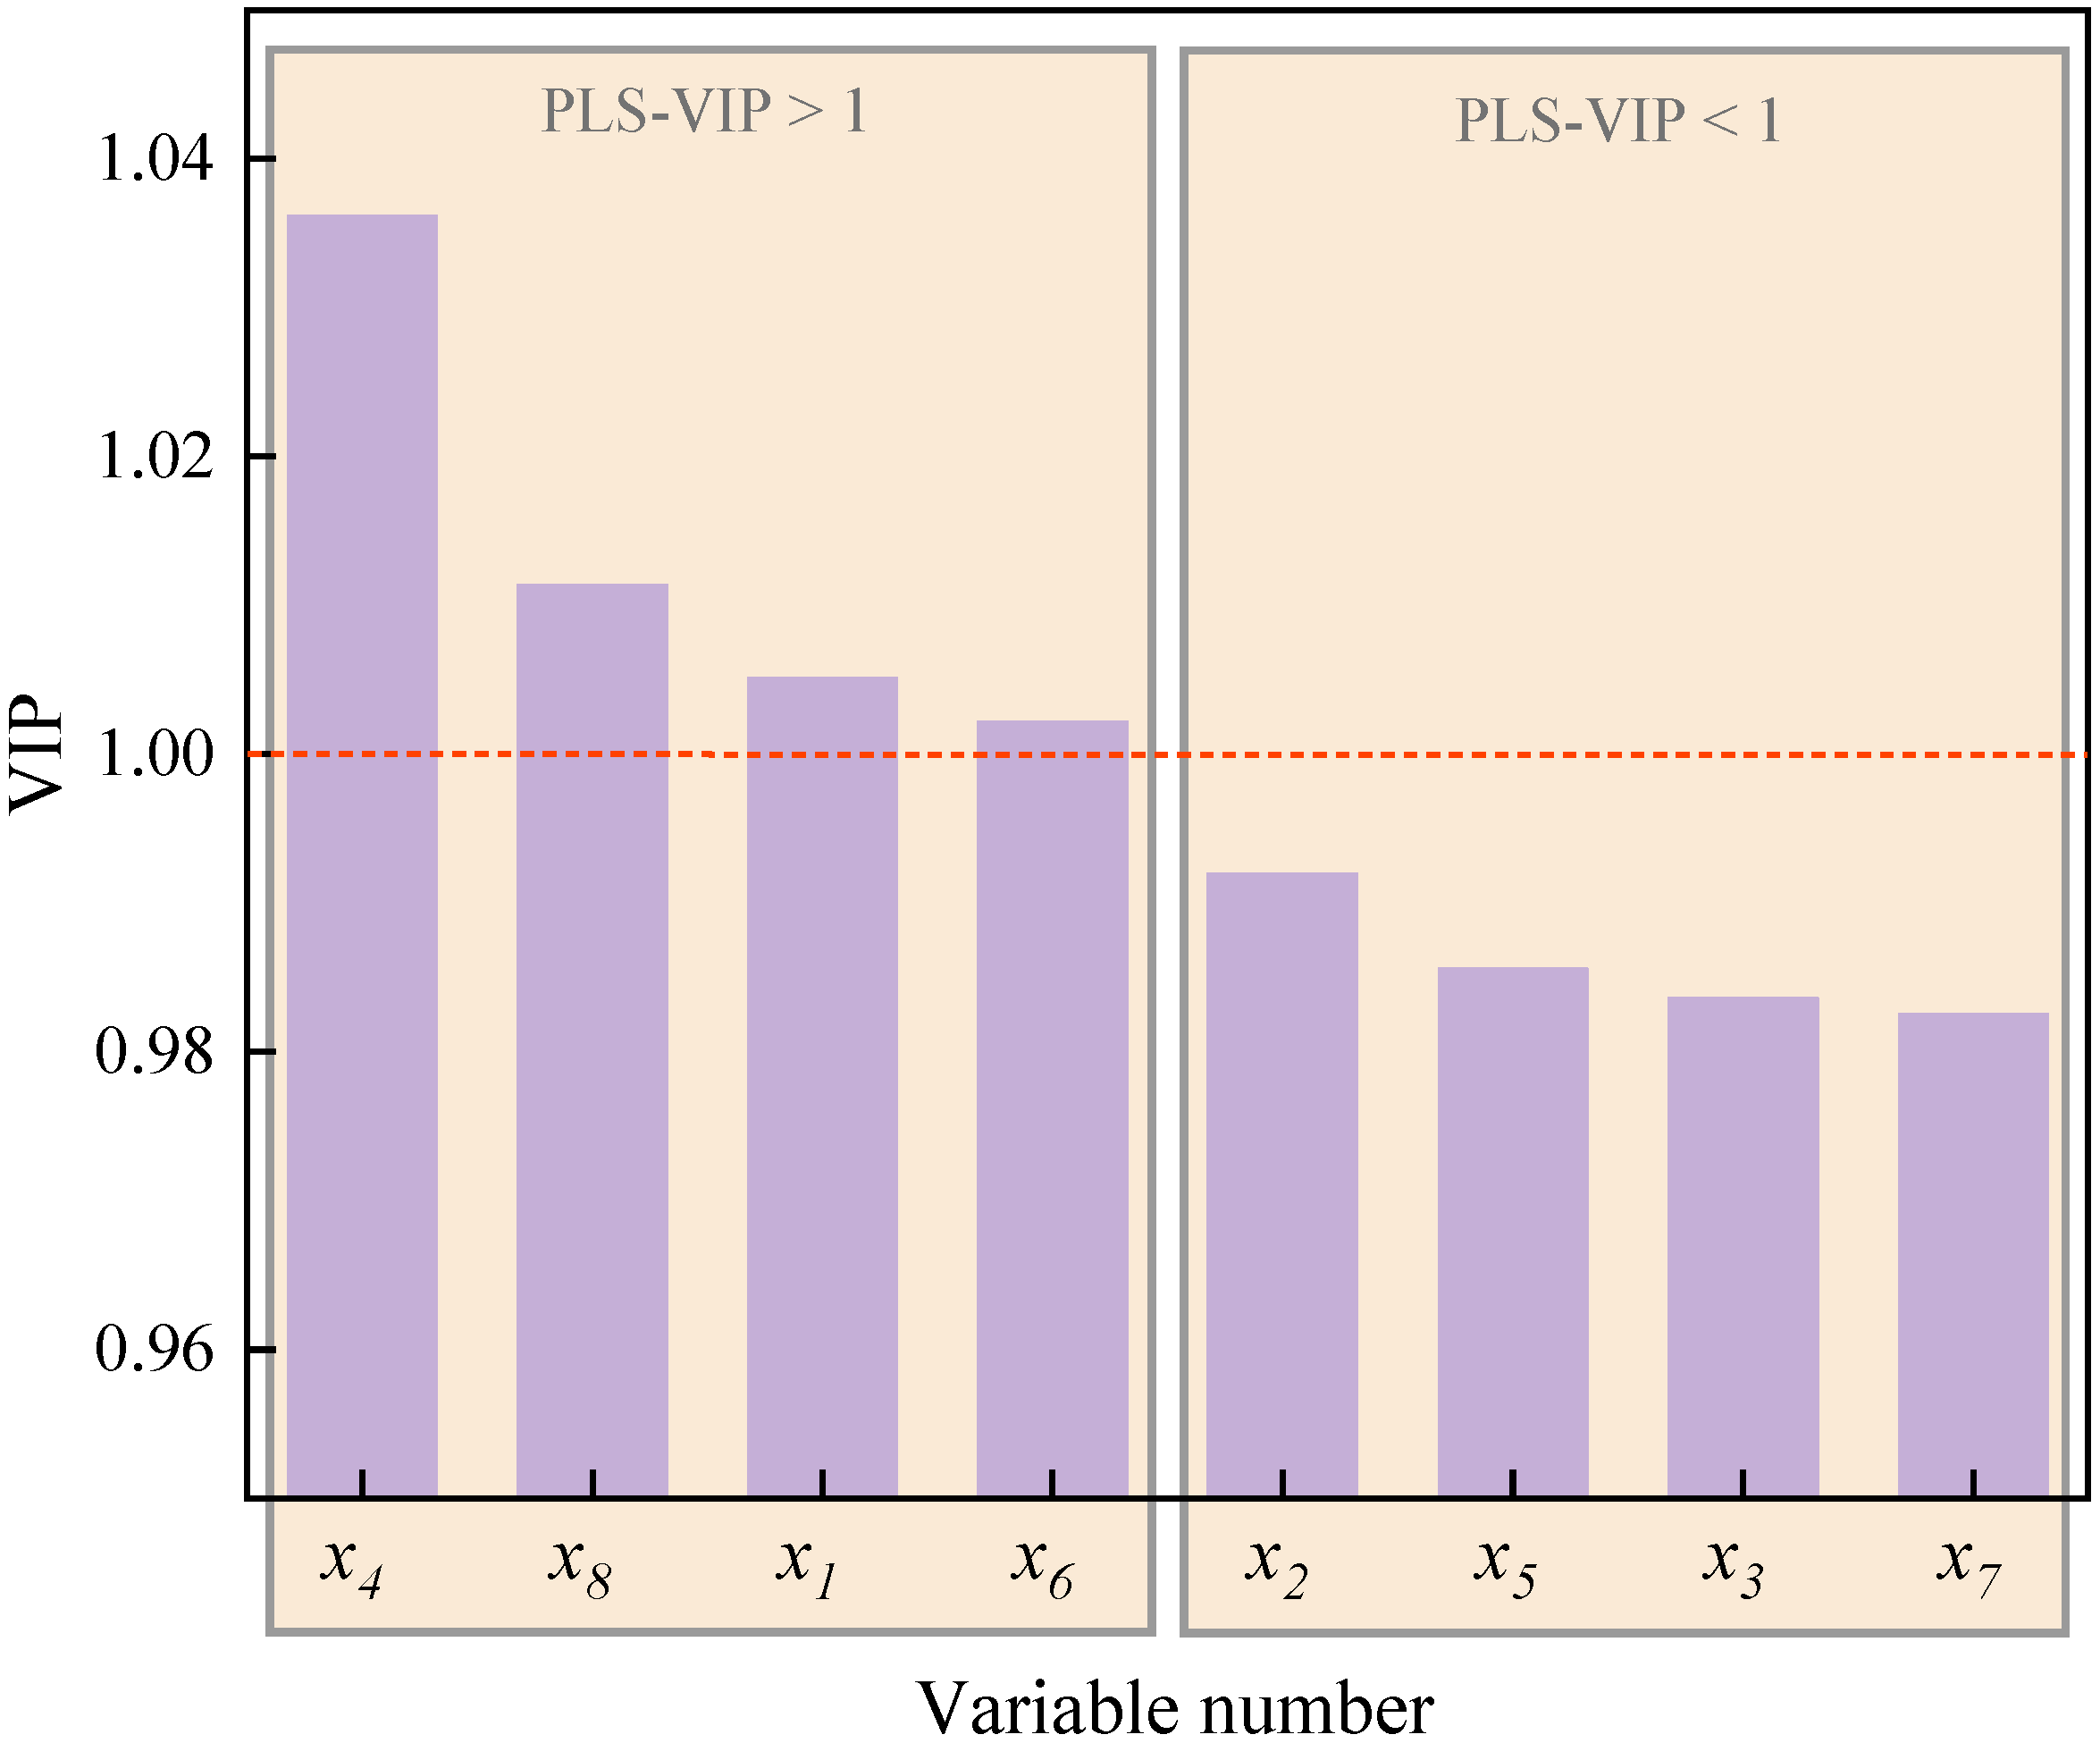
In this study, the exhaust particulates of a diesel engine burning methanol/F-T diesel blends were collected. The nanostructure and oxidation reactivity of the particulates were explored using the Brunauer–Emmett–Teller (BET) method, high-resolution transmission electron microscope (HRTEM), and thermogravimetric analysis (TGA), and the relationship between them was assessed via the partial least squares (PLS) and variable importance in the projection (PLS-VIP). The results showed that particulates from methanol/F-T diesel combustion were aggregates composed of several primary particles, and the distribution range of particulate half pore width () was 8~76 nm. As the methanol mixture ratio increased, the mean of particulates decreased, and the particulates′ total pore volume (), specific surface area (), and the fractal dimension () increased. Compared with F-T diesel, methanol/F-T diesel blends particulates showed more disordered structure with a smaller diameter () of primary particles, a shorter fringe length (), a wider separation distance (), and a larger tortuosity (). With increasing the methanol mixture ratio, it was also found that the amount of soluble organic fraction (SOF) of particulates increased, while oxidation characteristic temperature and the apparent activation energy () reduced. The correlation coefficients of with and were 0.99 and 0.98, respectively, by the linear fitting, illustrating that they showed the strongest linear relationship with the reactivity among the discussed nanostructure parameters. The VIP values of , , , and d, with obtained by the PLS and PLS-VIP, were greater than 1, indicating that they were the chief factors influencing particulate reactivity.
1. Introduction
The diesel engine is the main power source of transportation, consuming a lot of oil resources. In the background of global energy shortage and environmental protection, it has become an important issue to find high-quality alternative fuels for diesel engines. F-T diesel is a liquid fuel derived from solid coal, and has excellent properties, including extremely low sulfur and aromatic content, and high cetane number, which make it attractive as an alternative to diesel [1]. It has been demonstrated that the F-T diesel engine can significantly reduce regulated and unregulated pollutant emissions [2,3]. At present, F-T diesel has achieved commercial-scale production in China, South Africa, Malaysia, and other countries [4]. Methanol can also be produced from coal, and both it and F-T diesel can be called coal-based fuels. Methanol is a high-oxygen-content fuel, and its properties, such as low boiling point and high latent heat of vaporization, are good for the improvement of combustion characteristics, and reduce NOx and PM emissions effectively. In addition, methanol also has the advantages of mature preparation technology and low cost [5], which has been widely used in diesel engines as a promising alternative fuel. Mixing methanol with F-T diesel helps enhance fuel ignition properties and promotes more efficient coal utilization [6].
Exhaust particulates are the main pollutant of the diesel engine, and they have a negative impact on human health and the ecological environment [7,8]. They exhibit a high degree of geometric complexity and consist of spherical or approximately spherical primary particles [9]. A diesel particulate filter (DPF) has a honeycomb structure [10], which can effectively remove particulate matter (PM) from diesel exhaust ports [11] and can meet strict emission regulations. Nevertheless, prolonged operation leads to the accumulation of particulate matter in the DPF, which may impair the performance of diesel engines [12,13]. Hence, it is necessary to eliminate these deposits through either active or passive regeneration processes [14]. The oxidation reactivity of particulates is related to regeneration efficiency and is a key issue in the regeneration process of DPF.
Different alternative fuels present different combustion reaction kinetics in diesel engines, changing the formation process of particulates, resulting in exhaust particulates with different physical properties and oxidation reactivity. Many scholars have previously conducted research on the content. Zhang et al. [15] carried out a structural analysis of soot sampled from ultra-low sulfur diesel fuel (ULSD) and Fischer–Tropsch diesel fuel synthesized from coal (CFT), and reported that the soot generated by FT had a more ordered structure than ULSD soot due to the almost zero aromatic and sulfur content, high H/C ratio, low viscosity, and distillation temperature of CFT. Wang et al. [16] evaluated the nanostructure and oxidation reactivity of n-pentanol/diesel particulates, and they found that an increase in soot oxidation reactivity was observed with the increase in the n-pentanol concentration in diesel/n-pentanol mixtures. In addition, particulates of blends exhibited smaller primary particle diameter, shorter fringe length, but larger tortuosity and separation distance. Arora et al. [17] reported the difference in nanostructure of diesel/diesel-dioctyl phthalate (DOP)-blend particles. It was investigated that the presence of oxygen molecules accelerates the oxidation process of particles and inhibits the formation of initial smoke precursors, resulting in a decrease in the size of primary particles. They also found that the inclusion of the DOP fuel increases the availability of molecules of oxygen on the outermost layers of the primary particles, resulting in enhanced soot oxidation. Verma et al. [18] collected particulates from diesel engines burning fuels with different oxygen functional groups, and found that the lower fringe length, higher fringe tortuosity, and increased inter-planar spacing of fringes for particles from oxygenated fuels meant that the particles have a more disordered structure and are easier to oxidize than diesel. Wei et al. [19] discussed the physical properties and oxidation reactivity of dimethyl carbonate (DMC)/diesel blends particulates under different brake mean effective pressures (BMEPs). It was shown that with the increase in DMC blending amount, the soot particles showed more disordered nanostructure with shorter fringe lengths, wider separation distance, and greater tortuosity, and the oxidation reactivity of soot particles presented an increasing trend when the DMC blending amount increases. Du et al. [20] compared the pore structure and oxidation reactivity of different fuel particulates. It was found that biodiesel particulates have a more open pore structure and a rougher surface than diesel particulates, and the biodiesel soot exhibited higher oxidation activity. The summary of the influence of fuel on the particulate physical and chemical properties in their findings is available in Table 1.

Table 1.
The summary of the influence of fuel on the particulate physical and chemical properties.
Thus, it can be seen that the nanostructure of particulates has a great influence on their reactivity. In other studies, Chen et al. [21] theorized that particulates with a lower graphitization degree exhibit stronger oxidation reactivity, which was characterized by wider , shorter , and higher . Wei et al. [19] specifically pointed out that among the physical properties, including the fractal dimension () and primary particle size, the nanostructure of primary particles was more important for the control of the oxidation reactivity. It was further suggested that, compared to the length and tortuosity of the fringe, the separation distance exhibits a stronger correlation with the oxidation reactivity of particulates among various nanostructural parameters. According to the fitting results of the linear regression method, Liang et al. [22] considered that the graphitization degree of particulates had a great relationship with oxidation reactivity, and the relationship was not completely linear due to the influence of parameters such as nanostructure and particle size. Zhang et al. [16] used the same method and found that compared with the separation distance of fringes, the fringe length and tortuosity had a clearer correlation with oxidation reactivity of particulates, which was different from the research results of Wei et al. [19].
At present, there have been many studies on the application of coal-based fuels in diesel engines [23,24], while few studies have highlighted the physicochemical properties of particulates in diesel exhaust when methanol/F-T diesel is used. Additionally, most of the current results on the relationship between the structural characteristics and oxidation reactivity of particulates are presented in a qualitative way, and qualitative analysis is still controversial, lacking quantitative evaluation of particulate oxidation reactivity. In this research, particulate matter produced by various blends of methanol and Fischer–Tropsch (F-T) diesel was collected and analyzed. The pore structure of the particulates and the nanostructure of primary particles were characterized using Brunauer–Emmett–Teller (BET) analysis and high-resolution transmission electron microscopy (HRTEM), respectively. Thermogravimetric analysis (TGA) was employed to investigate the mass loss behavior and key oxidation characteristics of the particles. Furthermore, linear regression and partial least squares (PLS) methods were applied to explore the correlation between nanostructural features and oxidative reactivity. The influence of individual nanostructure parameters on oxidation reactivity was assessed through variable importance in projection (PLS-VIP) analysis. This work aims to support the optimization of exhaust after-treatment systems and lay a foundation for the broader application of coal-based fuels.
2. Experimental Apparatus and Methods
2.1. Test Fuels
Normally, for directly mixed fuels, the maximum proportion of methanol should not exceed 15%. It is found that the diesel engine cannot run smoothly in tests when the mixture ratio of methanol is greater than 15%, which is consistent with the research results [25]. Therefore, the mixture ratio of 5%, 10% and 15% was selected in this study, which were named as FM0, FM5, FM10, and FM15, respectively. F-T diesel and methanol were provided by Inner MongoliYitai Co., Ltd. (Inner Mongoli, China) and Zhenjiang Dewei Chemicals Co., Ltd. (Zhenjiang, China), respectively. To avoid phase separation of the mixtures, 1% dodecanol was added to each mixture following the recommendations of Murayama et al. [26]. The kinematic viscosity of the test fuel was determined using a rotational viscometer (NDJ-5S) manufactured by Shanghai Changji Geological Instrument Co., Ltd. (Shanghai, China), while the fuel density was assessed with a density meter (SYD-1884) produced by Wuhan Gelaimo Testing Equipment Co., Ltd. (Wuhan, China). The cetane number and lower heating value of the fuel were estimated based on Kay’s mixing rule [27] and Mendeleev’s formula [28], respectively.
Table 2 presents the key properties of the test fuels. Compared with F-T diesel (FM0), it could be seen that the blends with different mixture ratios of methanol, such as FM5, FM10, and FM15, show a lower cetane number, lower heating value and viscosity, and higher density and oxygen content. Compared with diesel, whose cetane number is 52, F-T diesel has a higher cetane number. An excessive cetane number will cause the fuel to pyrolyze rapidly at a lower temperature, which makes it easy to produce soot. The addition of methanol to the fuel blend lowers its cetane number, leading to an extended ignition delay and enhanced combustion efficiency. Due to methanol’s high oxygen content, the concentration of oxygen-containing free radicals in the combustion chamber rises, promoting more complete combustion and reducing the formation of pollutants.

Table 2.
The main properties of the test fuels.
2.2. Particle Sample Collection
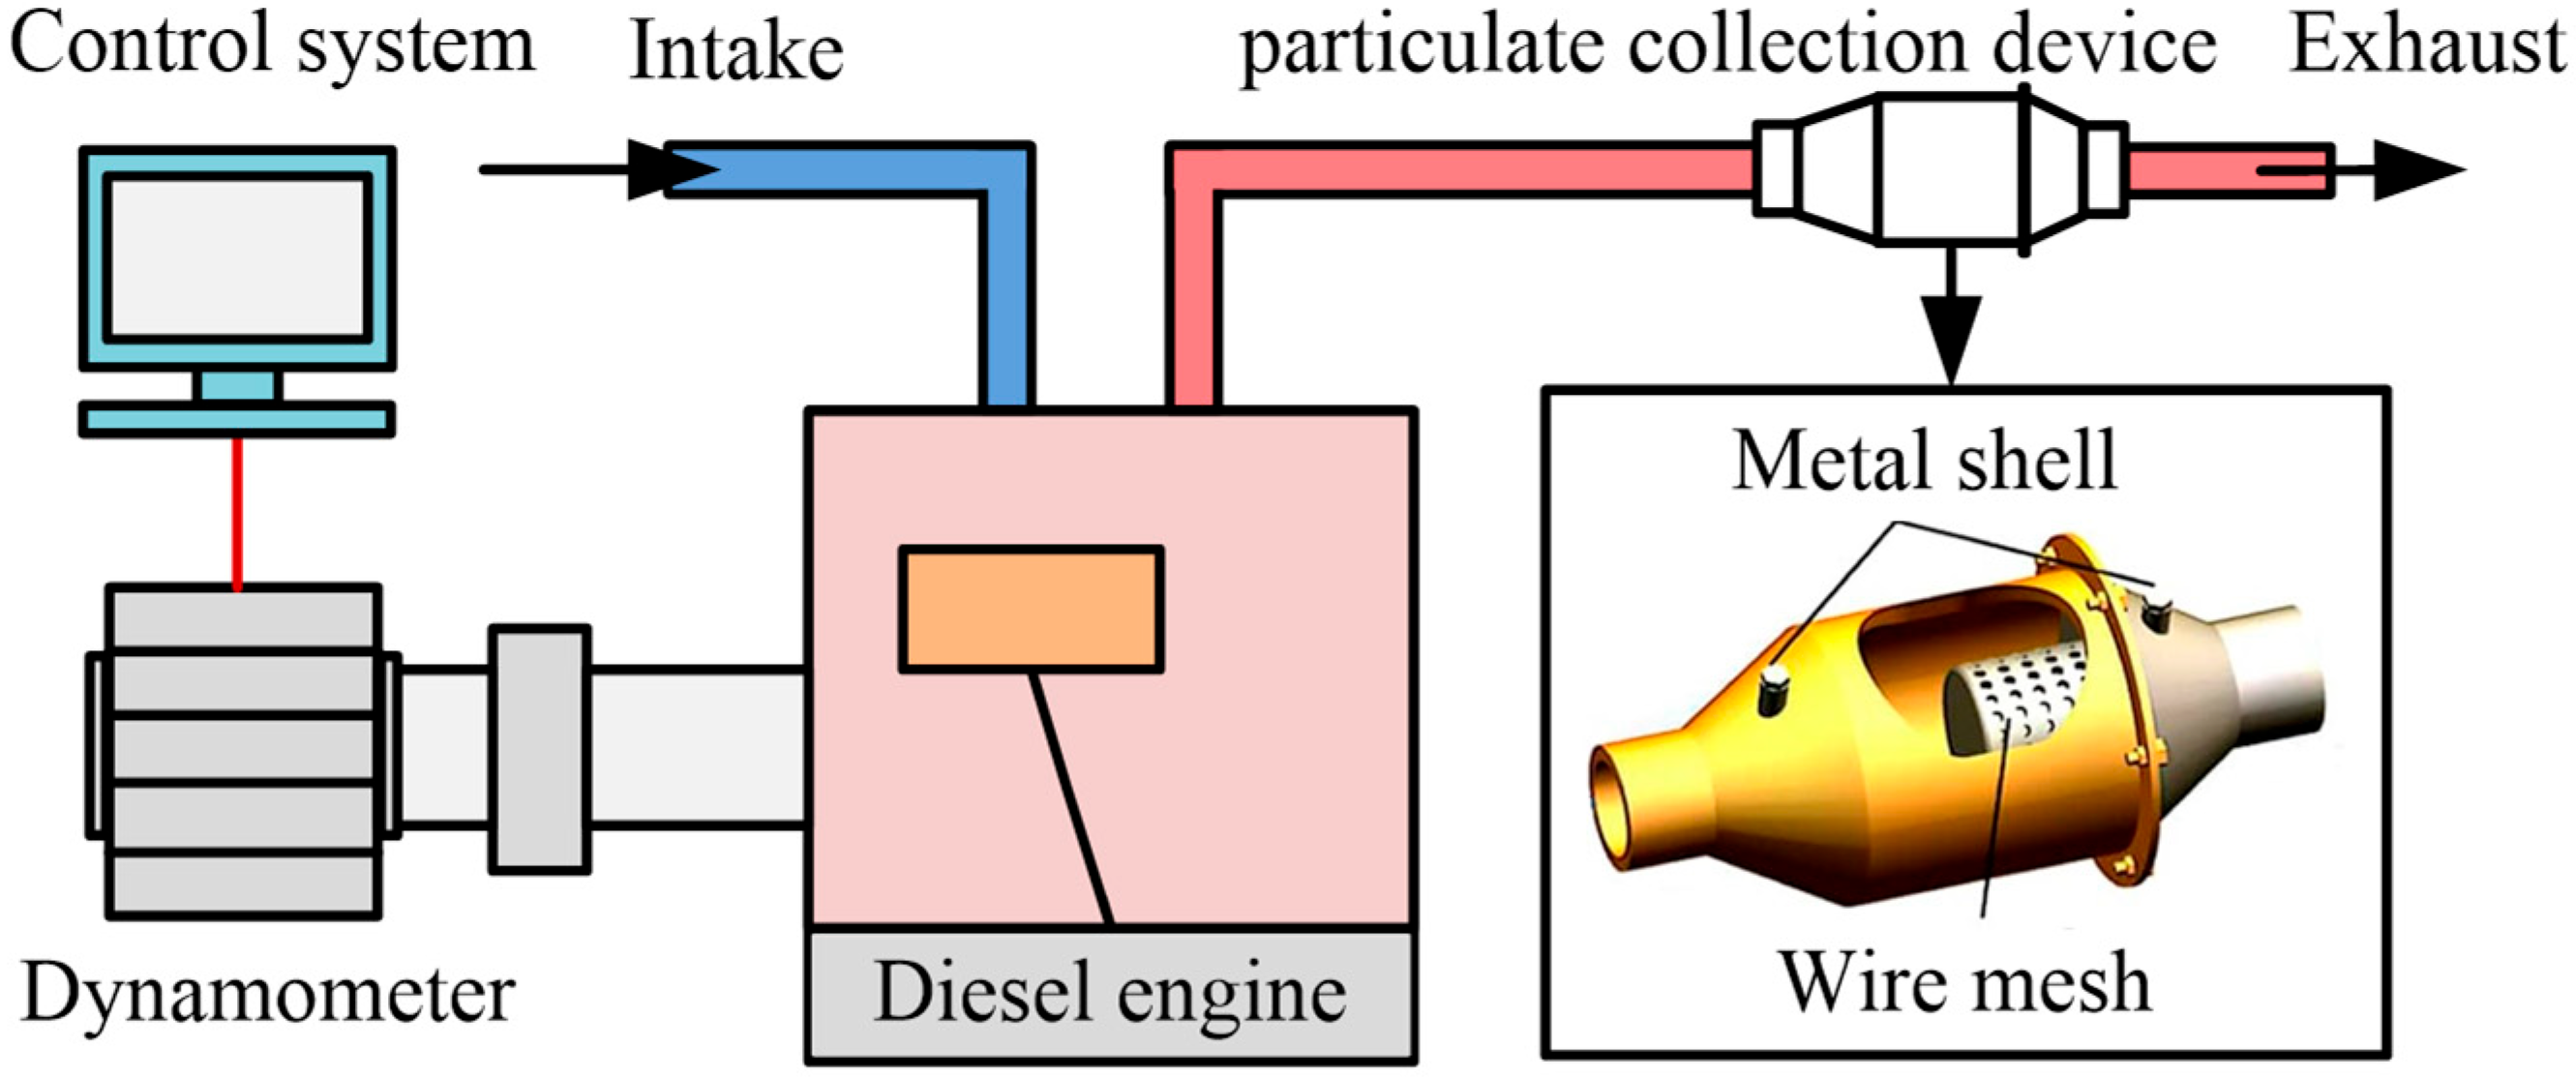
The diesel engine test was carried out on a single-cylinder four-stroke diesel engine model 186FA. In this study, the test was carried out at the rated speed and the full load condition (3600 r/min, 6.2 kW) of the diesel engine. The main specifications of the diesel engine are available in our prior published study [29]. The schematic diagram of the diesel engine exhaust particulate matter sampling test device is shown in Figure 1. The built test bench was equipped with an eddy current dynamometer (model CWF-25D, Shanghai Anguang Mechanical and Electrical Equipment Co., Ltd., Shanghai, China), an internal combustion engine measurement and control system (model EBT-II, Wuxi Langdi Measurement & Control Technology Co., Ltd., Wuxi, China), and a particulate matter collection device. The collection time of each particulate sample should be up to 60 min. After each collection is finished, the particulate collection device needs to be thoroughly cleaned. More details of the particulate collection device can be found elsewhere [30].
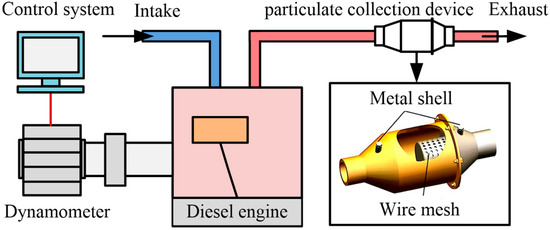
Figure 1.
The schematic diagram of the diesel engine exhaust particulate matter sampling test device.
2.3. Analytical Method
2.3.1. Brunauer–Emmett–Teller (BET)
The pore structure of methanol/F-T diesel particulates is measured by the adsorption method. Since N2 is stable and can avoid the interaction between multi-component gases, pure N2 was selected as the adsorbent in the study. The Brunauer–Emmett–Teller (BET) model used in this study is usually used to explain the multi-layer adsorption phenomenon of porous materials. The expression of BET model is as follows [31]:
where is the ratio of steam pressure and saturated steam pressure of N2 at a certain temperature (), is the amount of N2 adsorbed when the monolayer is covered (cm3), is the total amount of N2 adsorbed (cm3), and is the adsorption constant related to the adsorption energy and liquefaction heat.
Density functional theory (DFT) is often used to describe the adsorption behavior of heterogeneous fluids limited by porous materials, which is an effective means to extract the size distribution and half-width of pores in particulate. The expression of the DFT theoretical model is as follows [32]:
where is the average monomer density, is the wall potential of particle pores, and is the chemical potential applied to the system.
The fractal dimension () is a characteristic parameter for evaluating surface roughness. Based on the isothermal adsorption test, the Frenkel–Halsey–Hill (FHH) model is used to calculate the of particulates. The expression of the FHH model is as follows [20]:
where is a constant; can be obtained by formula fitting. The conversion relationship between and is .
In this study, a specific surface area and pore size distribution instrument (model NOVA3000e) produced by Quantachrome company (Boynton Beach, FL, USA) was used, and the adsorption and desorption isotherms of N2 to particulates were measured at a constant temperature of 77 K. In addition, the mass of particulate samples should exceed 100 mg to meet the requirements of instrument test accuracy. In order to remove the water (H2O) and soluble organic fraction (SOF) from the components in the particulates, the samples shall be degassed before the test. During degassing, the process is conducted under vacuum conditions at a temperature of 300 °C for a duration of 3 h. The N2 adsorption experiment was repeated three times for each type of particulate sample, which was performed to reduce errors arising from factors such as particulate agglomeration and uneven composition of particulates. Each time the experiment was carried out, it was ensured that the experimental conditions were as consistent as possible.
2.3.2. High-Resolution Transmission Electron Microscope (HRTEM)
The fundamental components of particulate matter primarily consist of microcrystalline fringes with varying lengths and degrees of curvature. The nanostructure characteristic parameters of the primary particles can be obtained from the TEM and HRTEM images of the particulate matter. , La and reflect the distance between adjacent layer planes, the length of the fringe, and the tortuosity of the fringe, which are parameters that can be used to characterize the nanostructure of particles. La can be obtained by
where is the distance between two consecutive pixels on the microcrystalline stripe and can be calculated by:
where is the linear distance between the pixels at both ends of the fringe for primary particles.
HRTEM is used to measure the nanostructure parameters of the particulate in this study, which is specifically the Tecnai G2 F30 model, manufactured by FEI Company s(Hillsboro, OR, USA). The instrument operates at an accelerating voltage of 300 kV with a point resolution of 0.2 nm. Before conducting formal observations on the samples, absolute ethanol was added to the particle samples, followed by ultrasonication for 15 min; the resulting suspension was then deposited onto a TEM grid. A similar preprocessing method has also been applied in other studies [31]. The Digital Micrograph 3.5 version was employed to measure and analyze the TEM and HRTEM images of the particulate matter obtained. For each parameter, samples were selected from multiple images captured in different areas for measurement. The samples were chosen to cover the primary particles of the particulate matter with different morphologies and positions as much as possible, and the number was no less than 200, thereby reducing the measurement error caused by factors such as changes in the sample aggregates.
2.3.3. Thermogravimetric Analysis (TGA)
The reduction in particulate mass during oxidation occurs in two phases: the evaporation of H2O and SOF, followed by the combustion of soot. is the temperature associated with a 10% decrease in particulate, x is the temperature at which particulate conversion reaches the peak, and refers to the temperature corresponding to 95% mass loss of particulates, which serve as indicators to assess the oxidative reactivity of particulate matter. Additionally, apparent reactive energy () is also a key factor to describe the oxidation process [33]. The higher the value, the more challenging it becomes for the particulate to participate in chemical reactions. According to Arrhenius′ theorem [34], the of particles can be obtained by the Coats–Redfern method. The oxidation rate equation of particles is as follows:
where is the reaction conversion rate, indicating the percentage of mass loss in the thermogravimetric analysis (%), is the reaction rate constant of the sample, is the reactionfunction related to , where , and represents the reaction order. By combining the heating rate expression with Equation (6), the following relationship can be derived:
where represents the frequency factor (s∙m∙mol−1), denotes the activation energy of particulates (J∙mol−1), is the constant of molecular gas (J∙mol−1∙K−1), and stands for thermodynamic temperature (K).
For diesel emissions, the reaction order value equals 1 [35]. Take the logarithm after integrating the left and right sides of Equation (7) to obtain the following equation:
The thermogravimetric analyzer (TGA, model TGA/DSC1) manufactured by Mettler-Toledo company (Zurich, Switzerland) was employed to measure the thermogravimetric (TG) curves, which reflect mass loss, and the derivative thermogravimetric (DTG) curves, representing the rate of mass loss, for the particulate samples. Each sample was initially weighed to approximately 5 mg. The testing temperature was increased from 40 °C to 800 °C at a constant heating rate of 10 °C/min. Throughout the experiment, a steady flow of 50 mL/min was maintained for both the protective nitrogen gas and the reactive oxygen gas. By analyzing the obtained TG and DTG curves, the composition and key oxidation characteristic parameters of the particulates were determined. To reduce the error in thermogravimetric analysis, each particulate sample was tested three times, and the mass of the tested sample, temperature rise rate, and gas flow rate were kept consistent in each test.
3. Results and Discussion
3.1. Pore Structure of Particulates
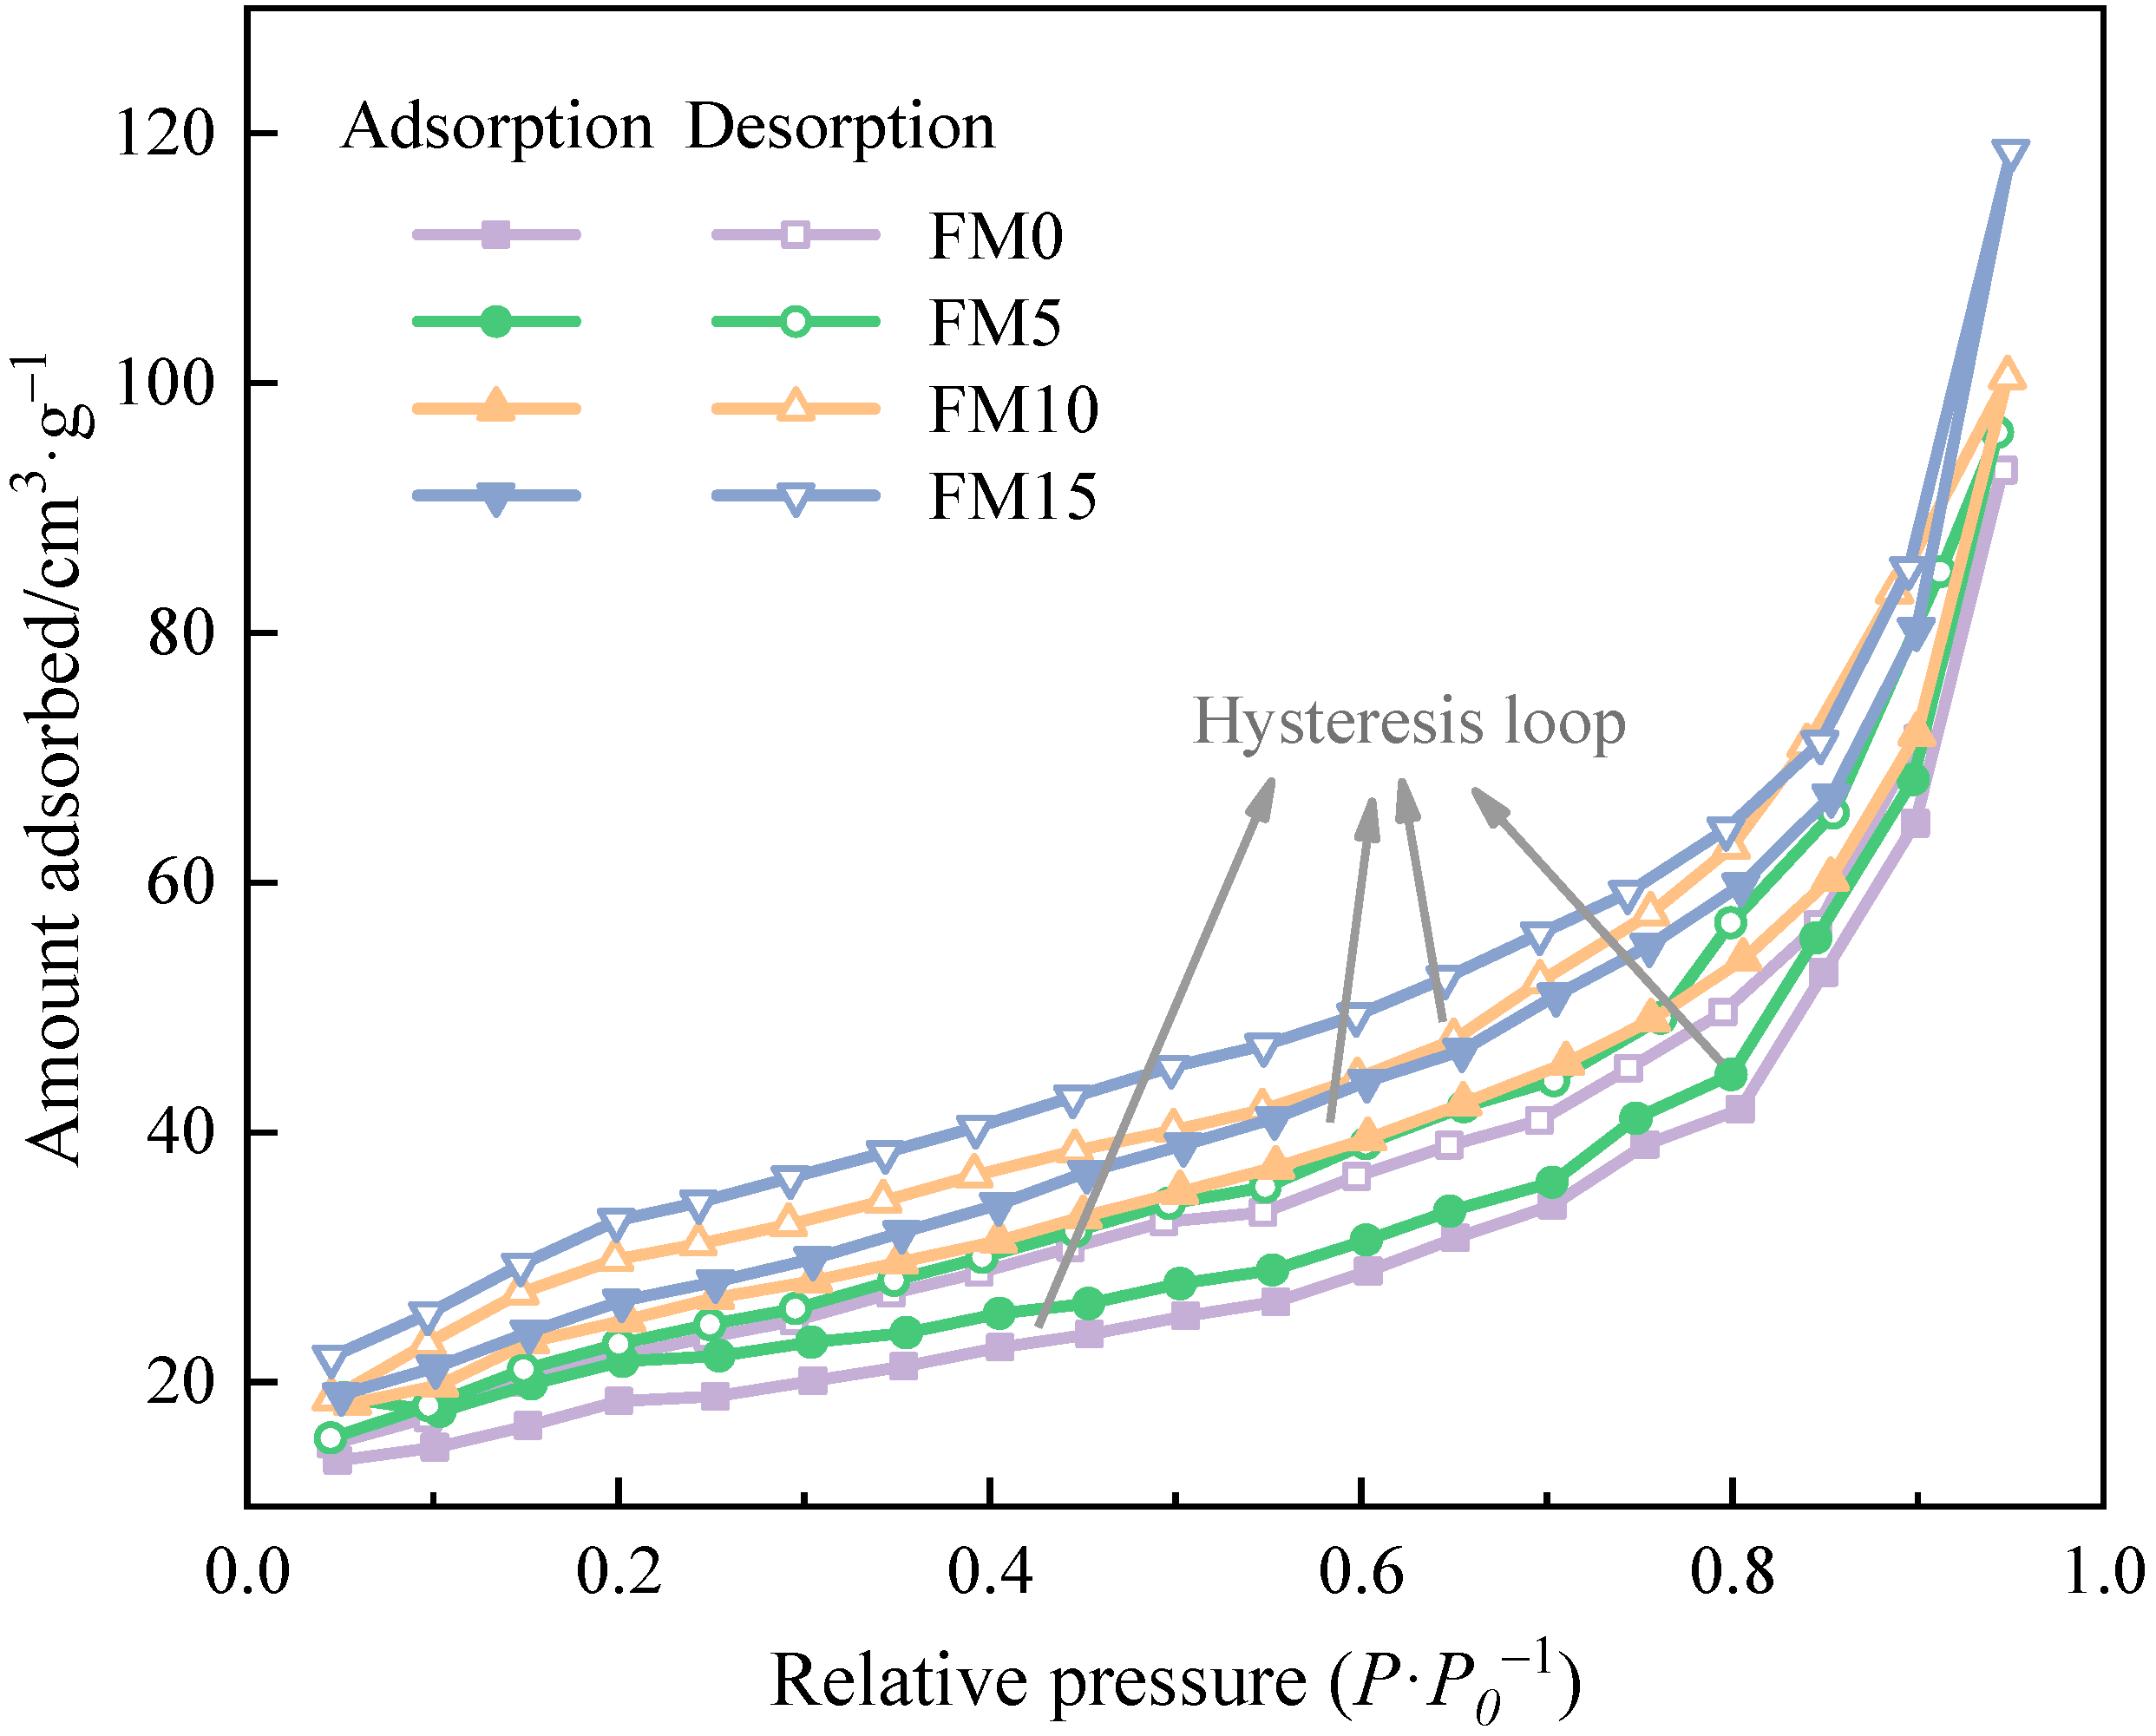
Figure 2 presents the N2 adsorption/desorption isotherms of methanol/F-T diesel particulates. It can be seen that the adsorption capacity of particulates increases with the increase in relative pressure. When the value of relative pressure approaches 1, the adsorption capacity increases sharply, and the isotherm has no platform. At the same relative pressure, the amount absorbed of N2 by particulates increases with the increase in the methanol mixture ratio; that is to say, the addition of methanol enhances the adsorption capacity of particulates. According to the definition of adsorption isotherm [36] provided by the International Union of Pure and Applied Chemistry (IUPAC), particulates from the combustion of methanol/F-T diesel show the characteristics of multi-layer adsorption, belonging to type II isotherm, which is caused by capillary condensation of N2 under certain pressure. In addition, the adsorption and desorption curves of the four particulate samples deviate, and obvious hysteresis loops appear. The shape of the adsorption hysteresis loop is related to the pore shape of the adsorbent [37]. After comparison, it is found that the isotherms in Figure 2 have H3 hysteresis ring defined by IUPAC, indicating that methanol/F-T diesel particulates have aggregates of plant particles or contain narrow slit shaped pores. Fan et al. [38] investigated that the adsorption density of the open-side pore was greater than that of the closed-end pore. For a slit pore with a similar size, the hysteresis loop of the open-end pore is larger than that of the closed-end pore. It is not difficult to see from the figure that the hysteresis loop of the isotherm narrows with the increase in the methanol mixture ratio. Therefore, it can be inferred that F-T diesel particulates contain more through-holes with openings at both ends, while the particulates with methanol have a higher degree of agglomeration and fewer open-end pores.
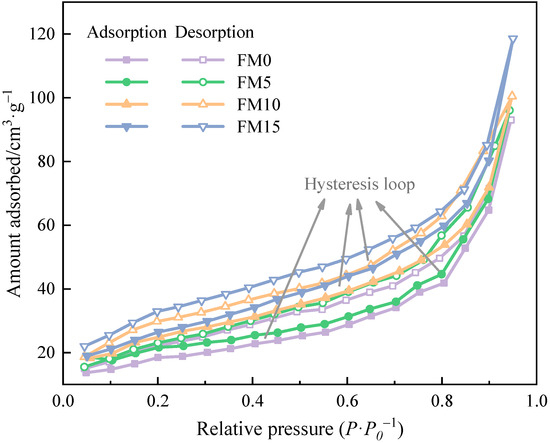
Figure 2.
The N2 adsorption/desorption isotherms of methanol/F-T diesel particulates.
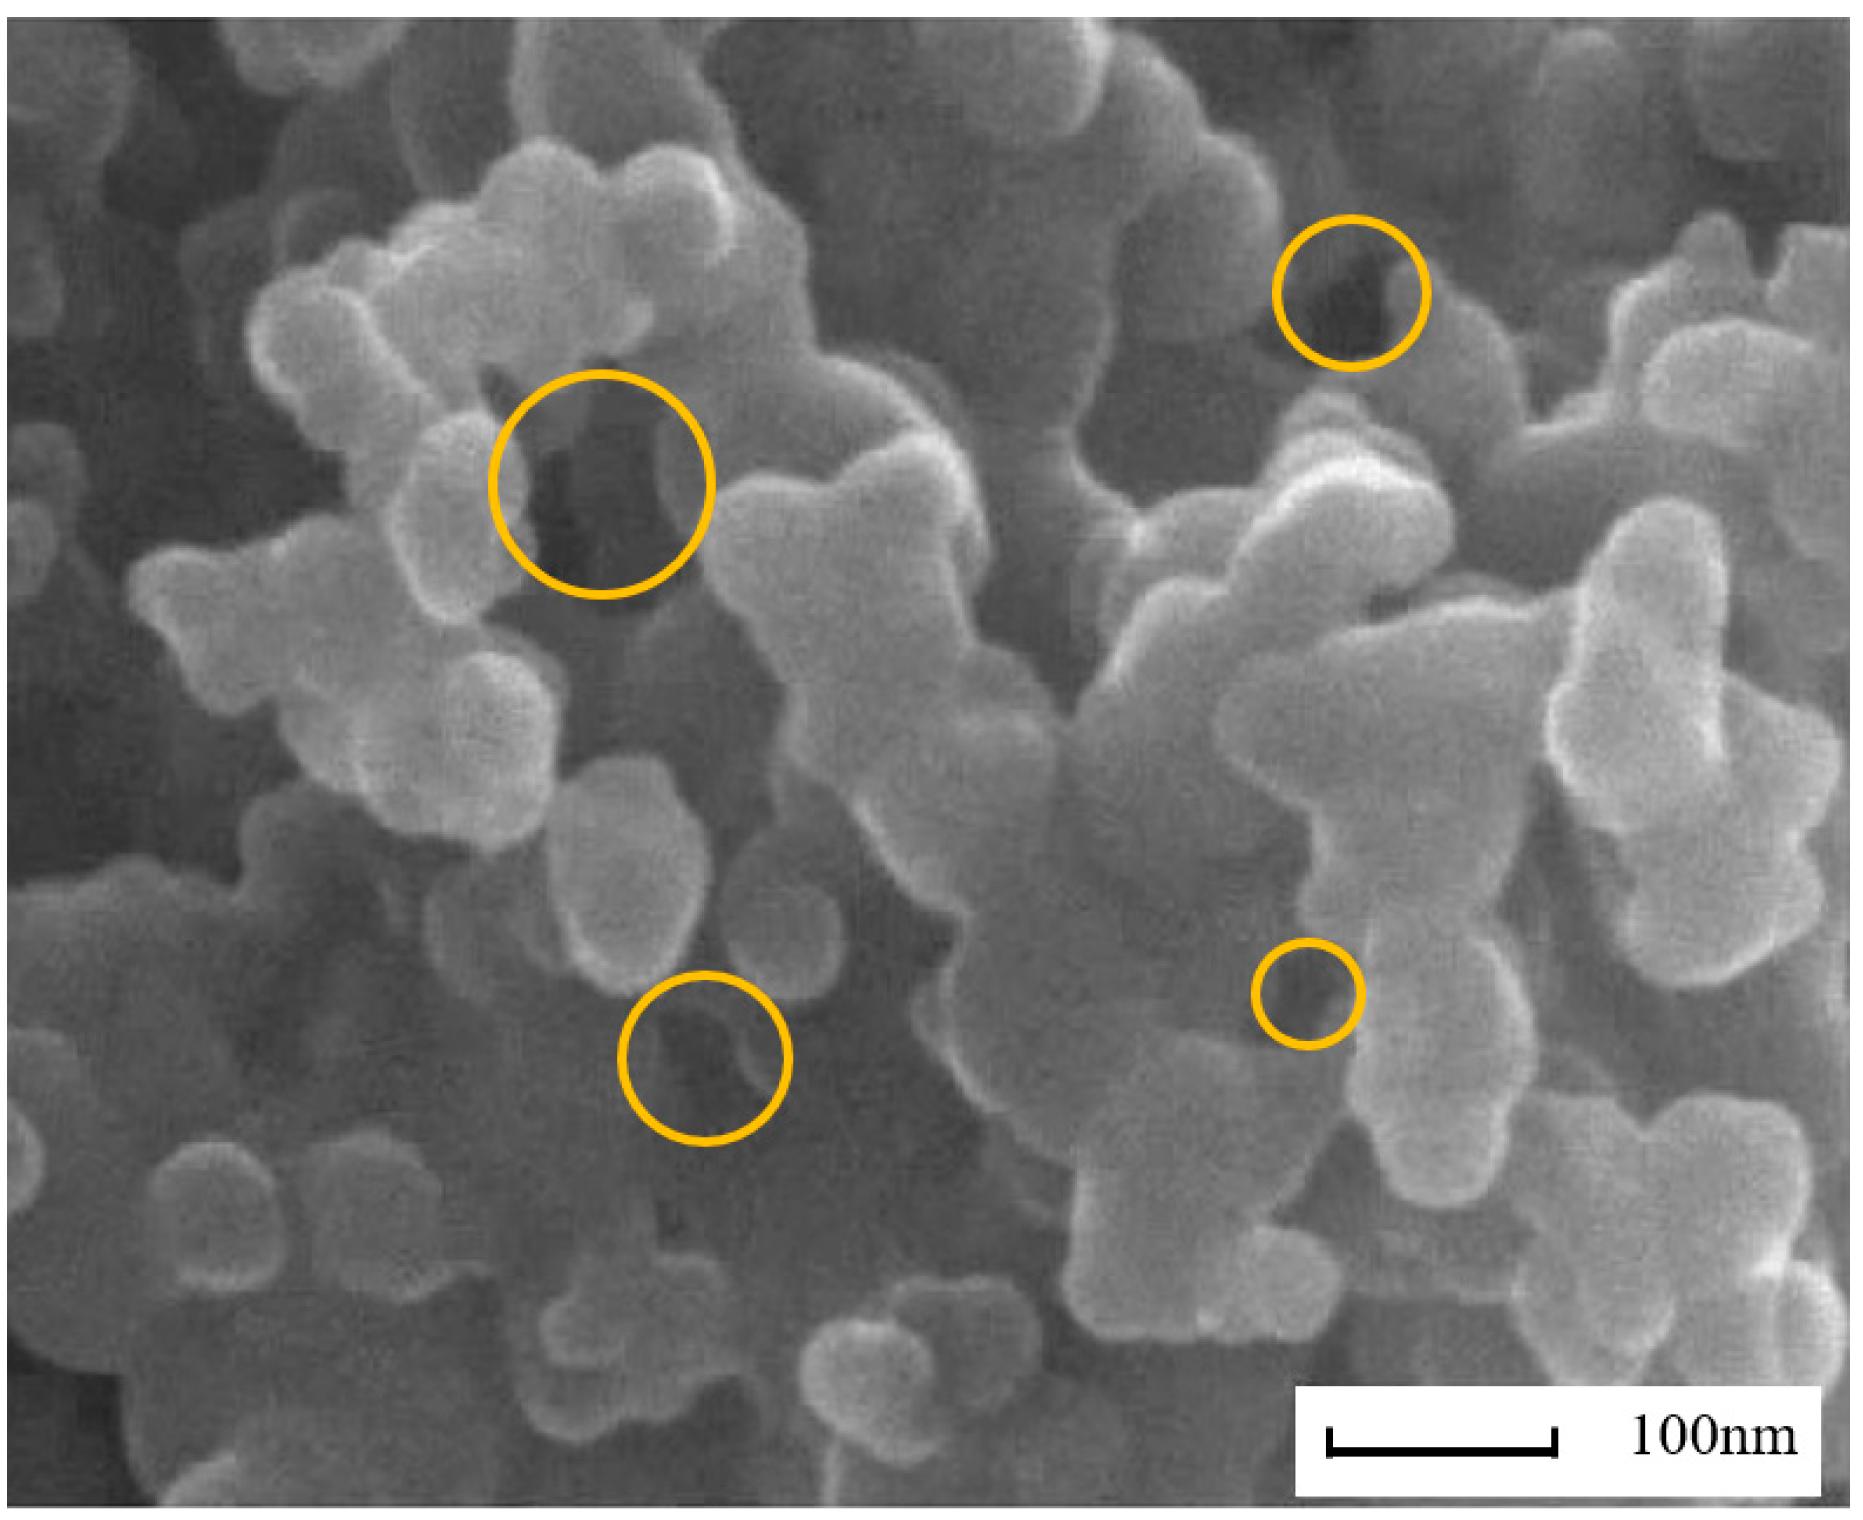
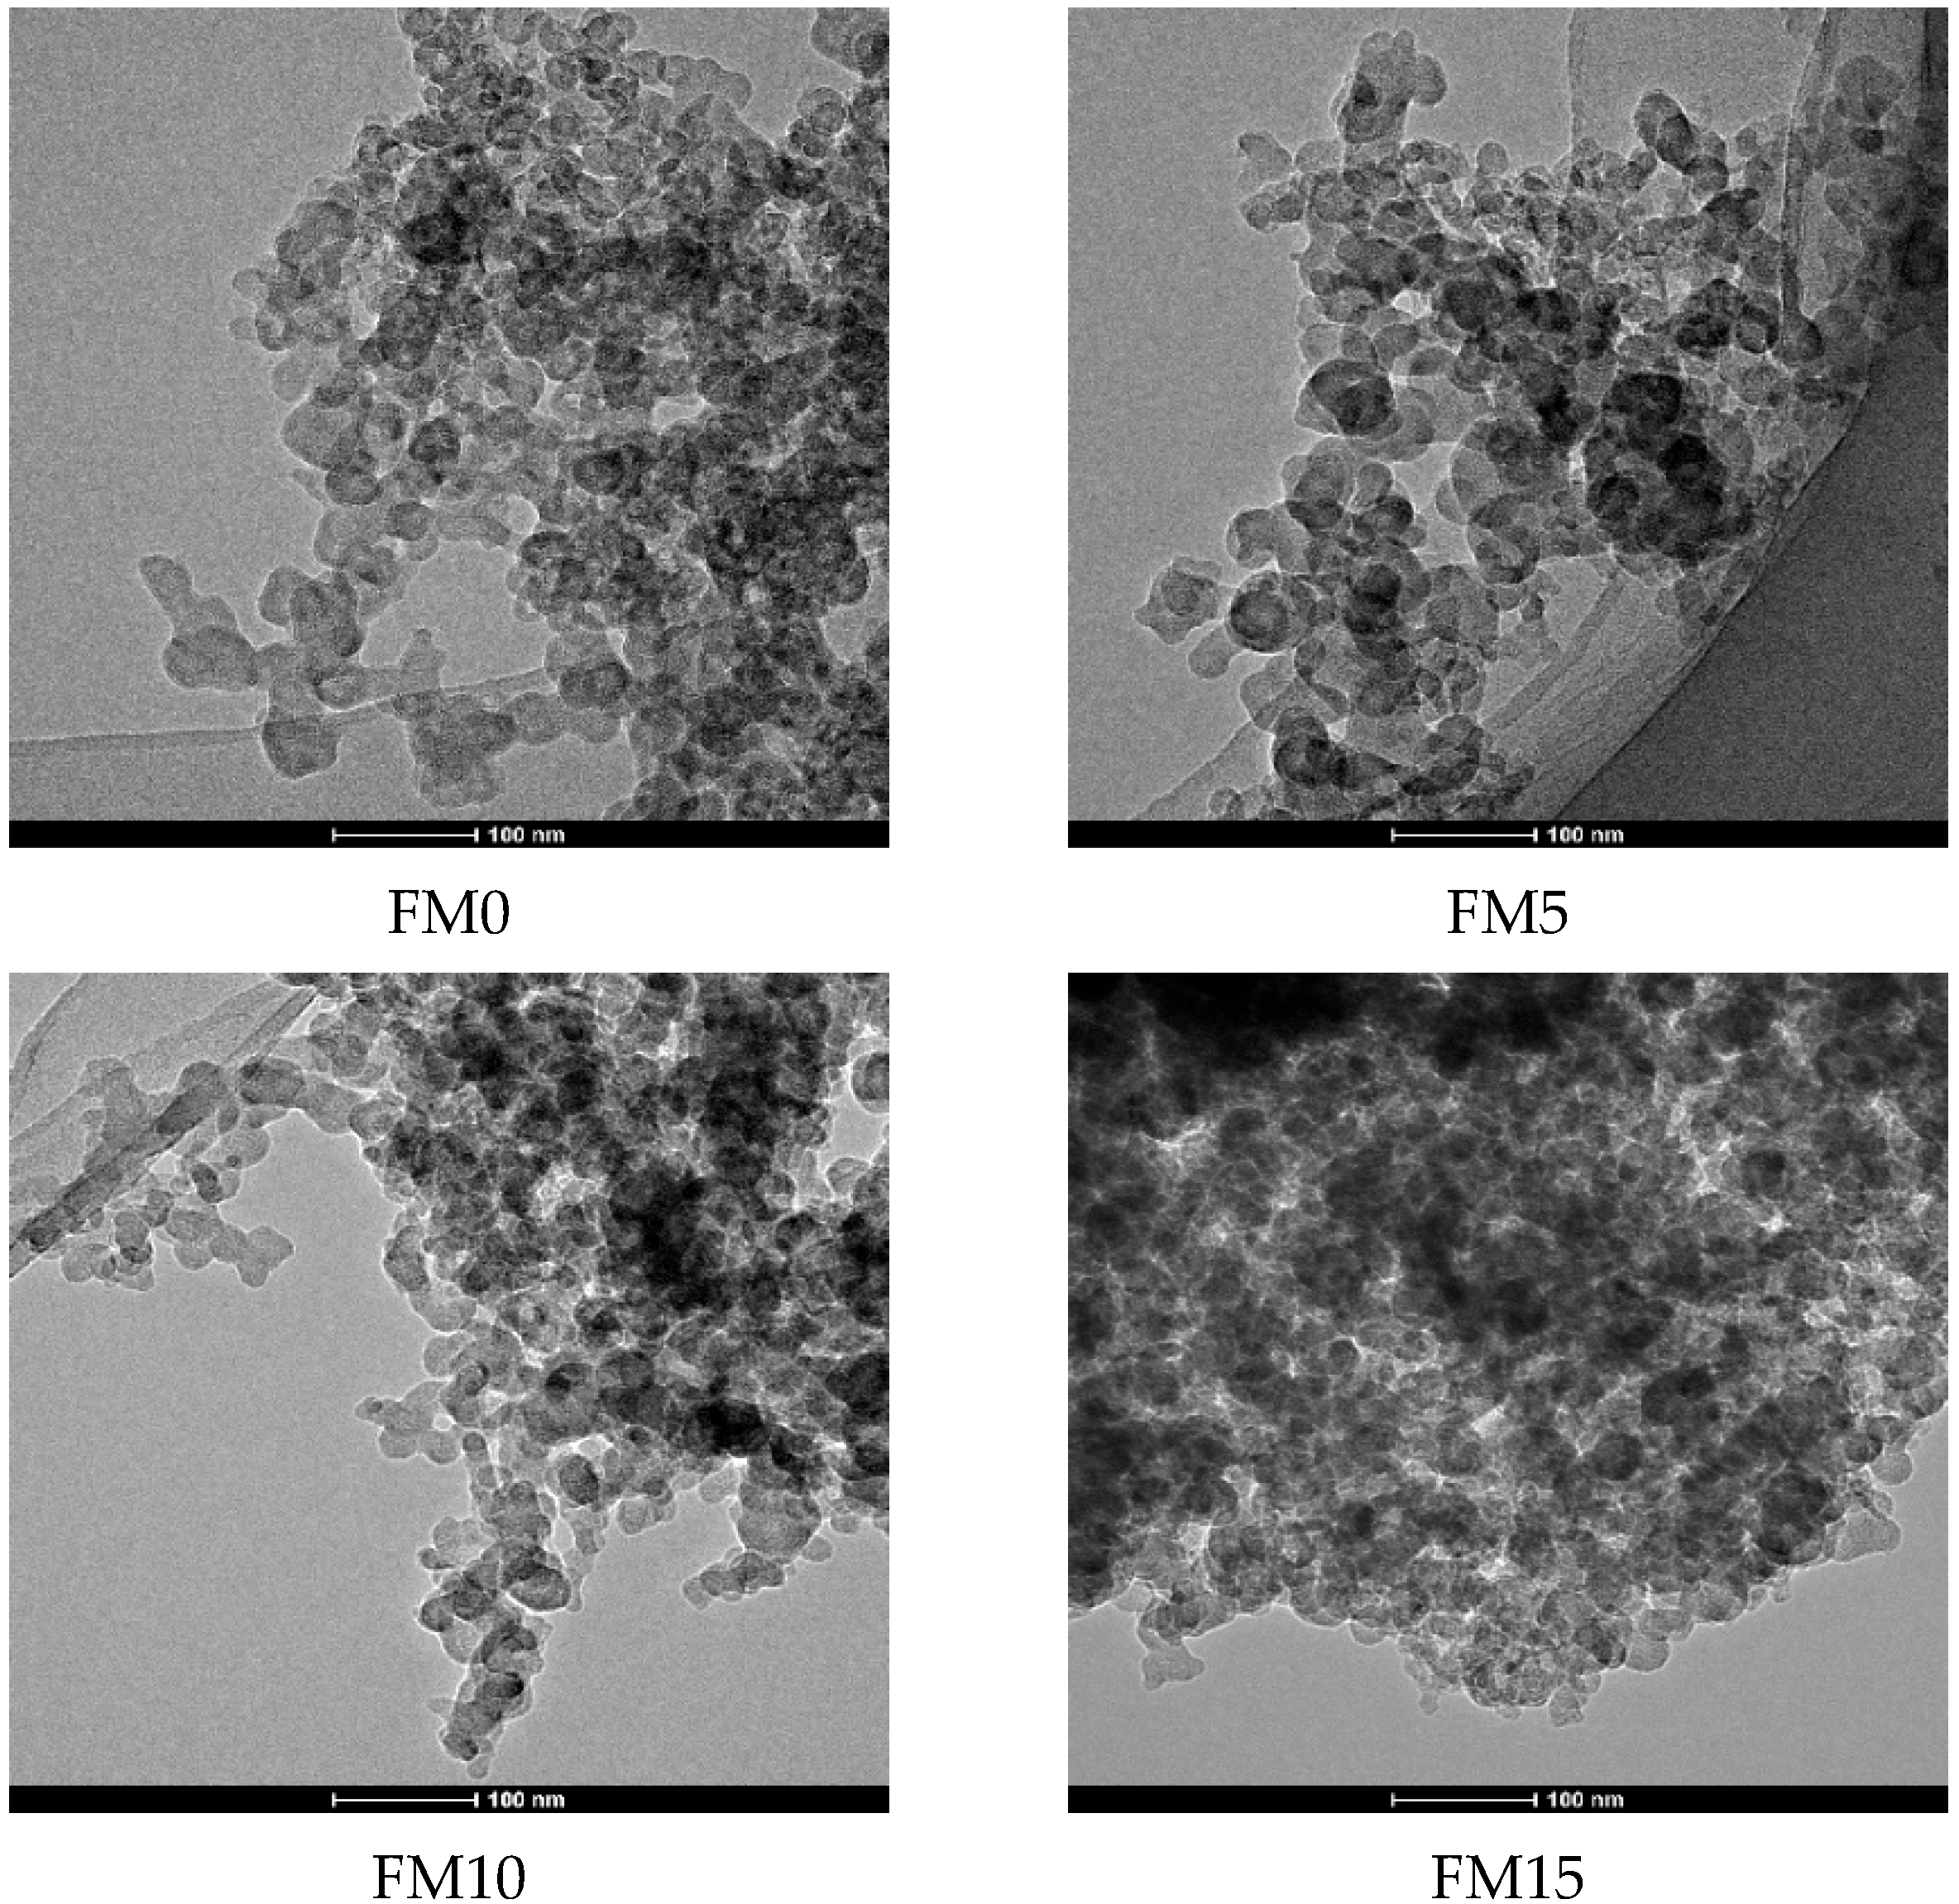
Figure 3 shows the agglomerated morphology of F-T diesel (FM0) particulates. From the scanning electron microscope (SEM) image, it can be seen that the particulates have various pore shapes with different pore diameters. Figure 4 presents the TEM image of methanol/F-T diesel combustion particulates, which also shows that the pore size and shape of the particulate matter are diverse. Additionally, it is shown in the figure that as the methanol blending ratio increases, the agglomerates of particulates produced by the combustion of methanol/F-T diesel gradually transform into more compact spherical and cluster-like structures. Moreover, the overlapping areas in the TEM images are blurry, presenting more irregular shapes. This might be due to the blending of methanol, which increases the content of soluble organic matter on the surface of particulate matter. The increased soluble organic matter covers the contours of the particulate matter, making it difficult to distinguish the boundaries of multiple particles in the overlapping areas. To further analyze the physical structure characteristics of methanol/F-T diesel particulates, the BET and DFT models were used to calculate the pore structure characteristic parameters of the particulate matter.
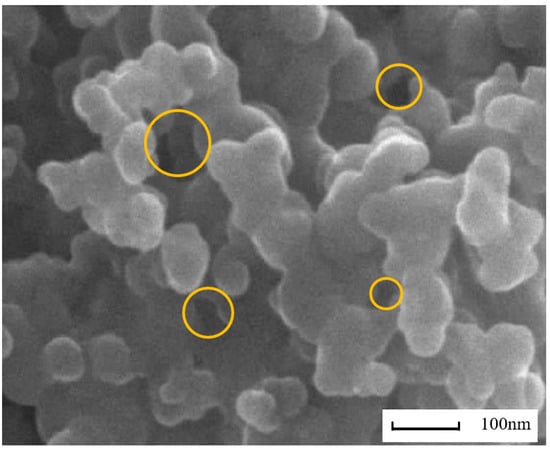
Figure 3.
The agglomerated morphology of F-T diesel particulates.
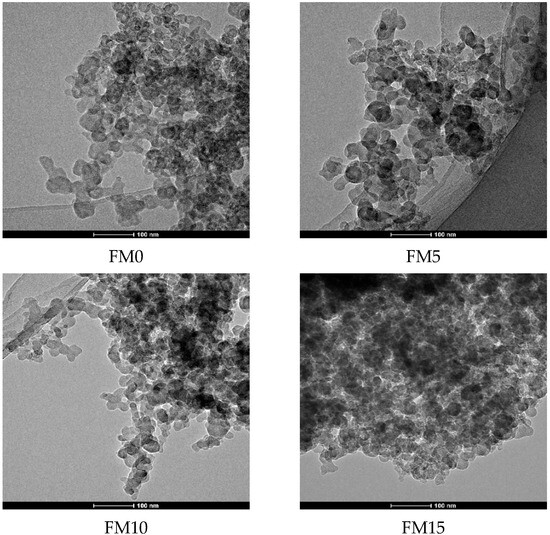
Figure 4.
TEM images of particulates from methanol/Fischer–Tropsch diesel blends.
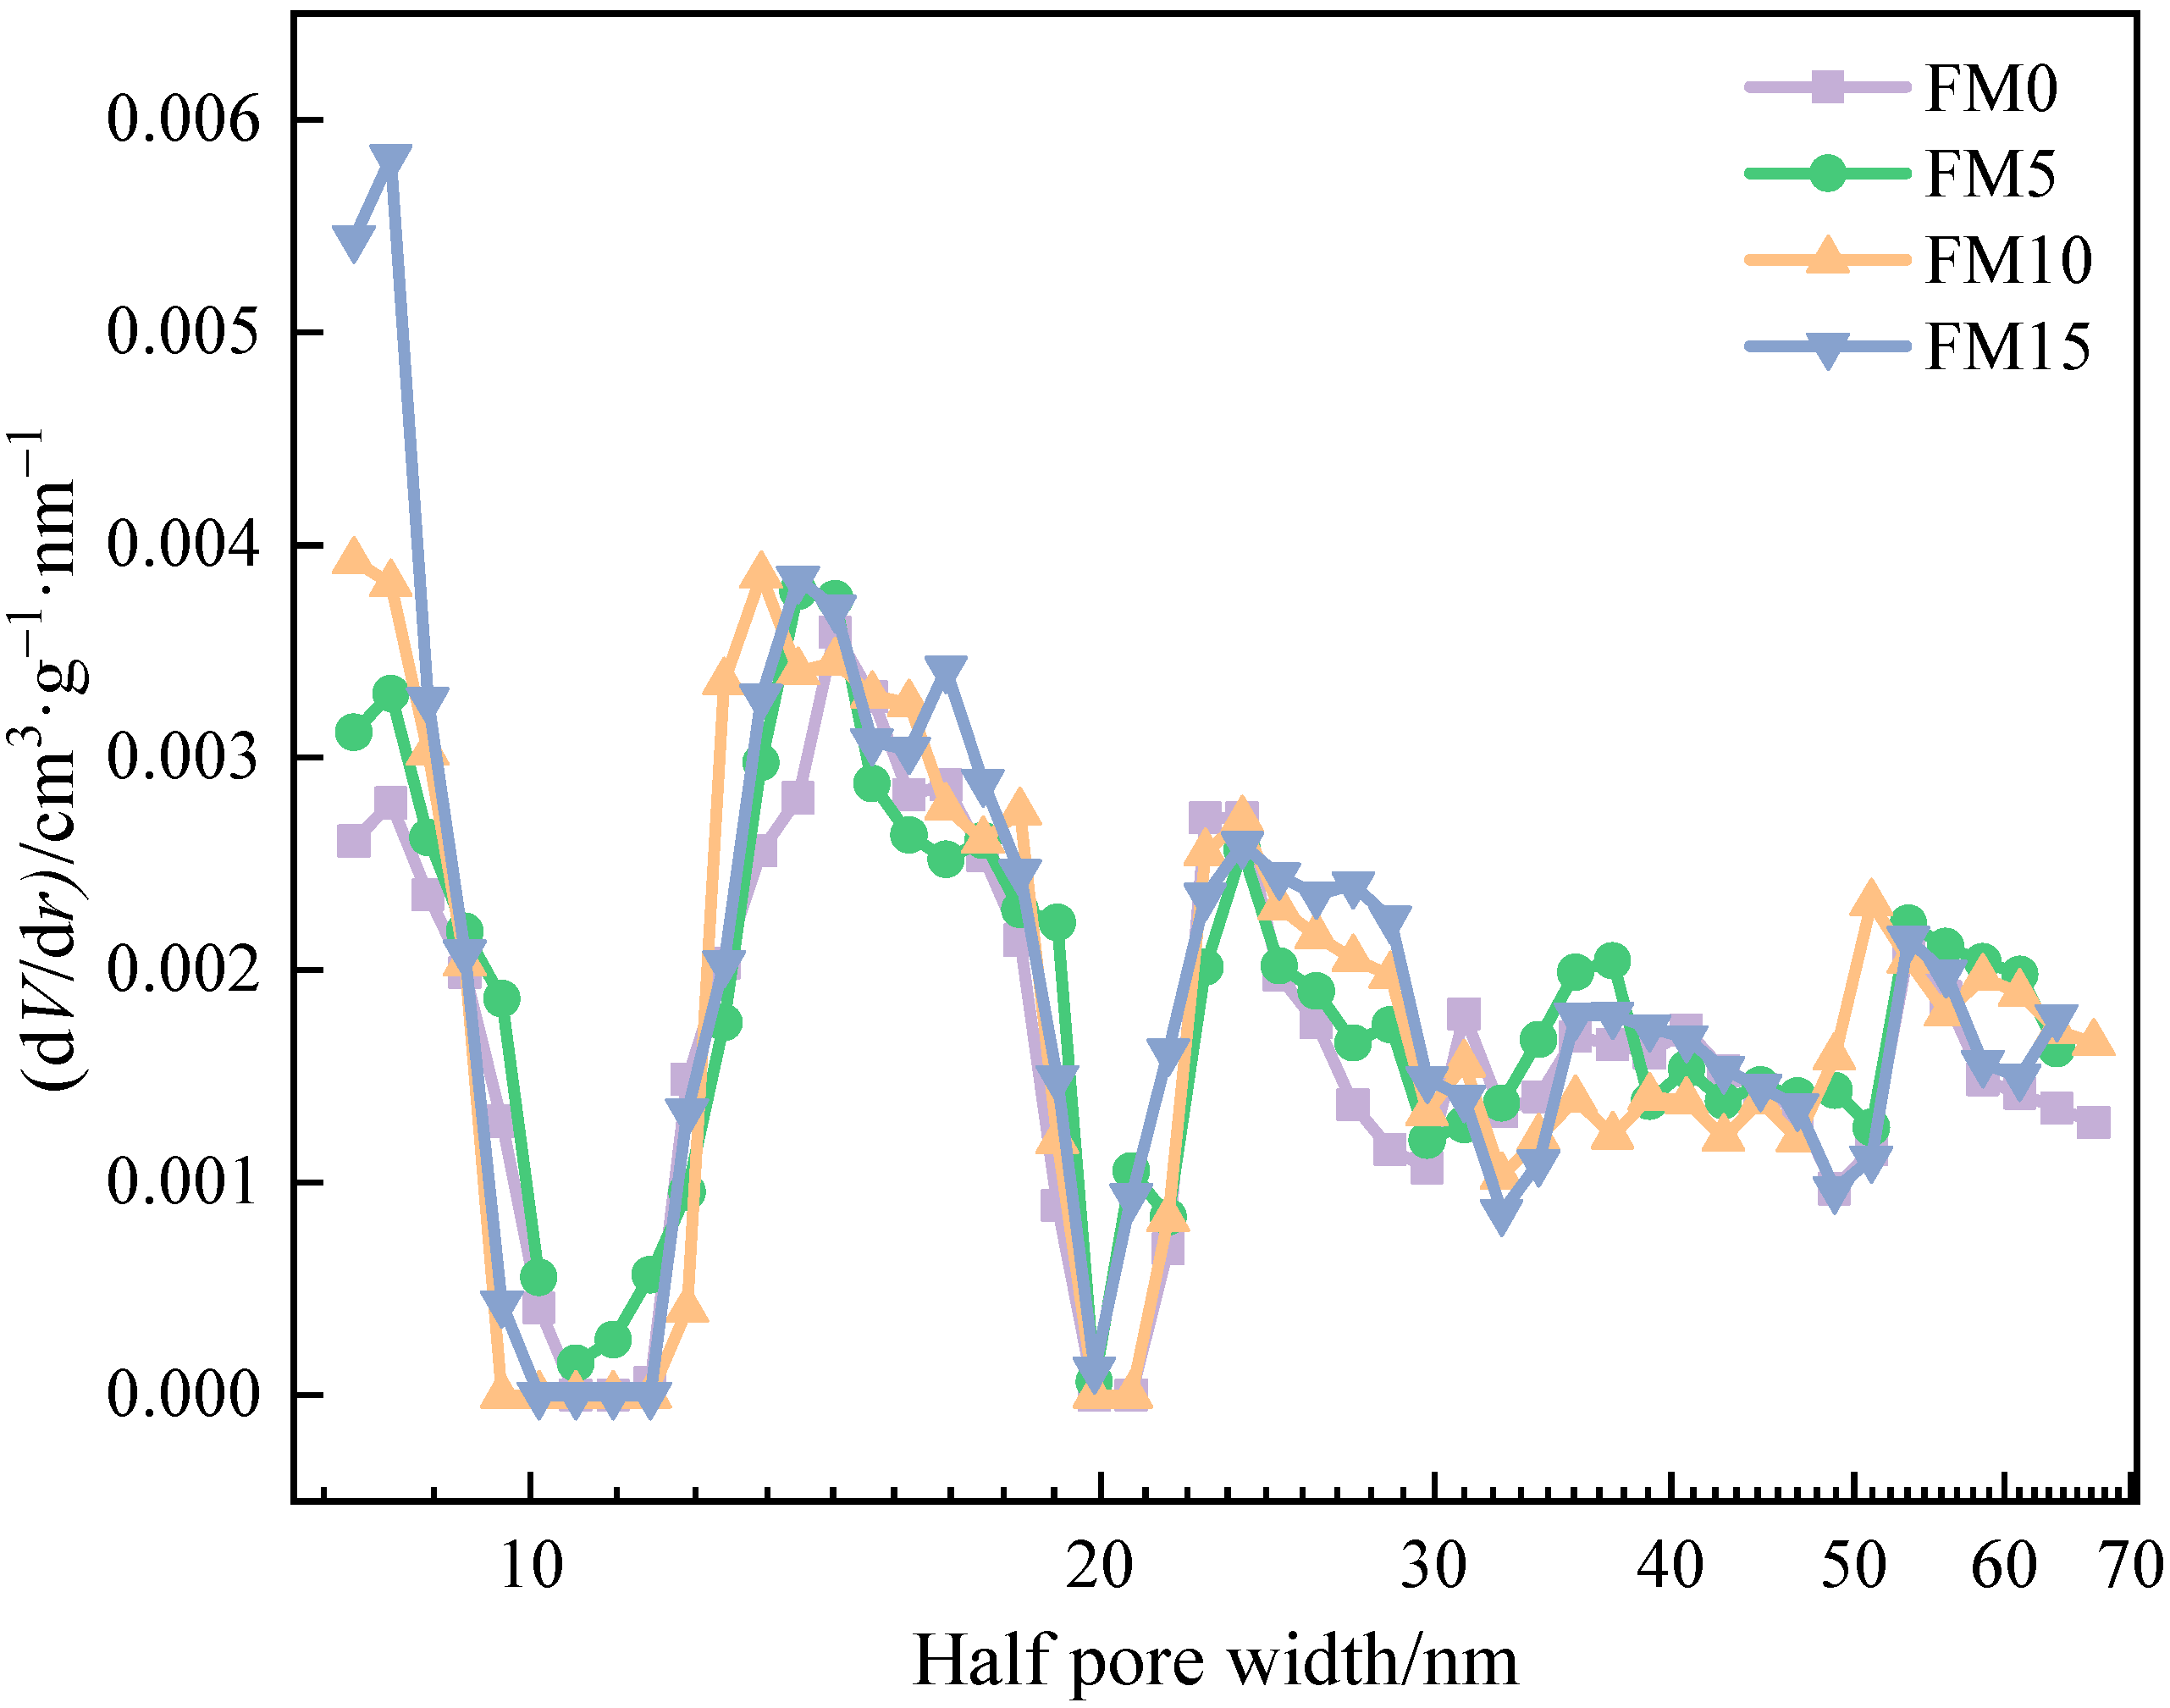
Figure 5 shows the pore size distribution of methanol/F-T diesel particulates. The isotherm data of FM0, FM5, FM10, and FM15 particulates were fitted by the DFT method, and the fitting errors were 0.755%, 0.682%, 0.713% and 0.648%, respectively. The pore size distribution results reveal a highly developed pore structure in the particulates, characterized by a continuous multi-peak distribution pattern. And it is obvious that the proportion of pores with being less than 10 nm in diesel engine exhaust particulates increases after blending methanol. The half pore width () of particulate samples ranges from 8 nm to 67 nm, including two pore types: mesopore and macropore, which is similar to the pore size distribution characteristics of biodiesel particulates reported by Du et al. [20].
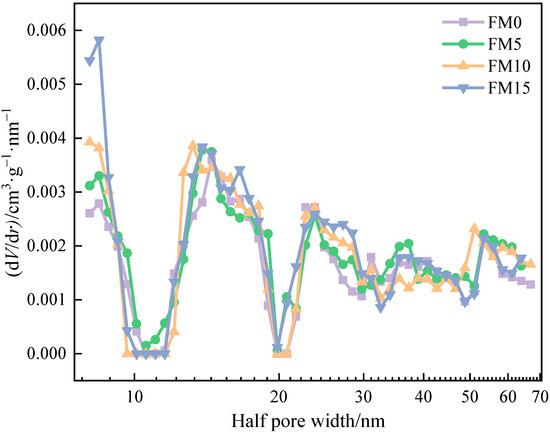
Figure 5.
The pore size distribution of methanol/F-T diesel particulates.
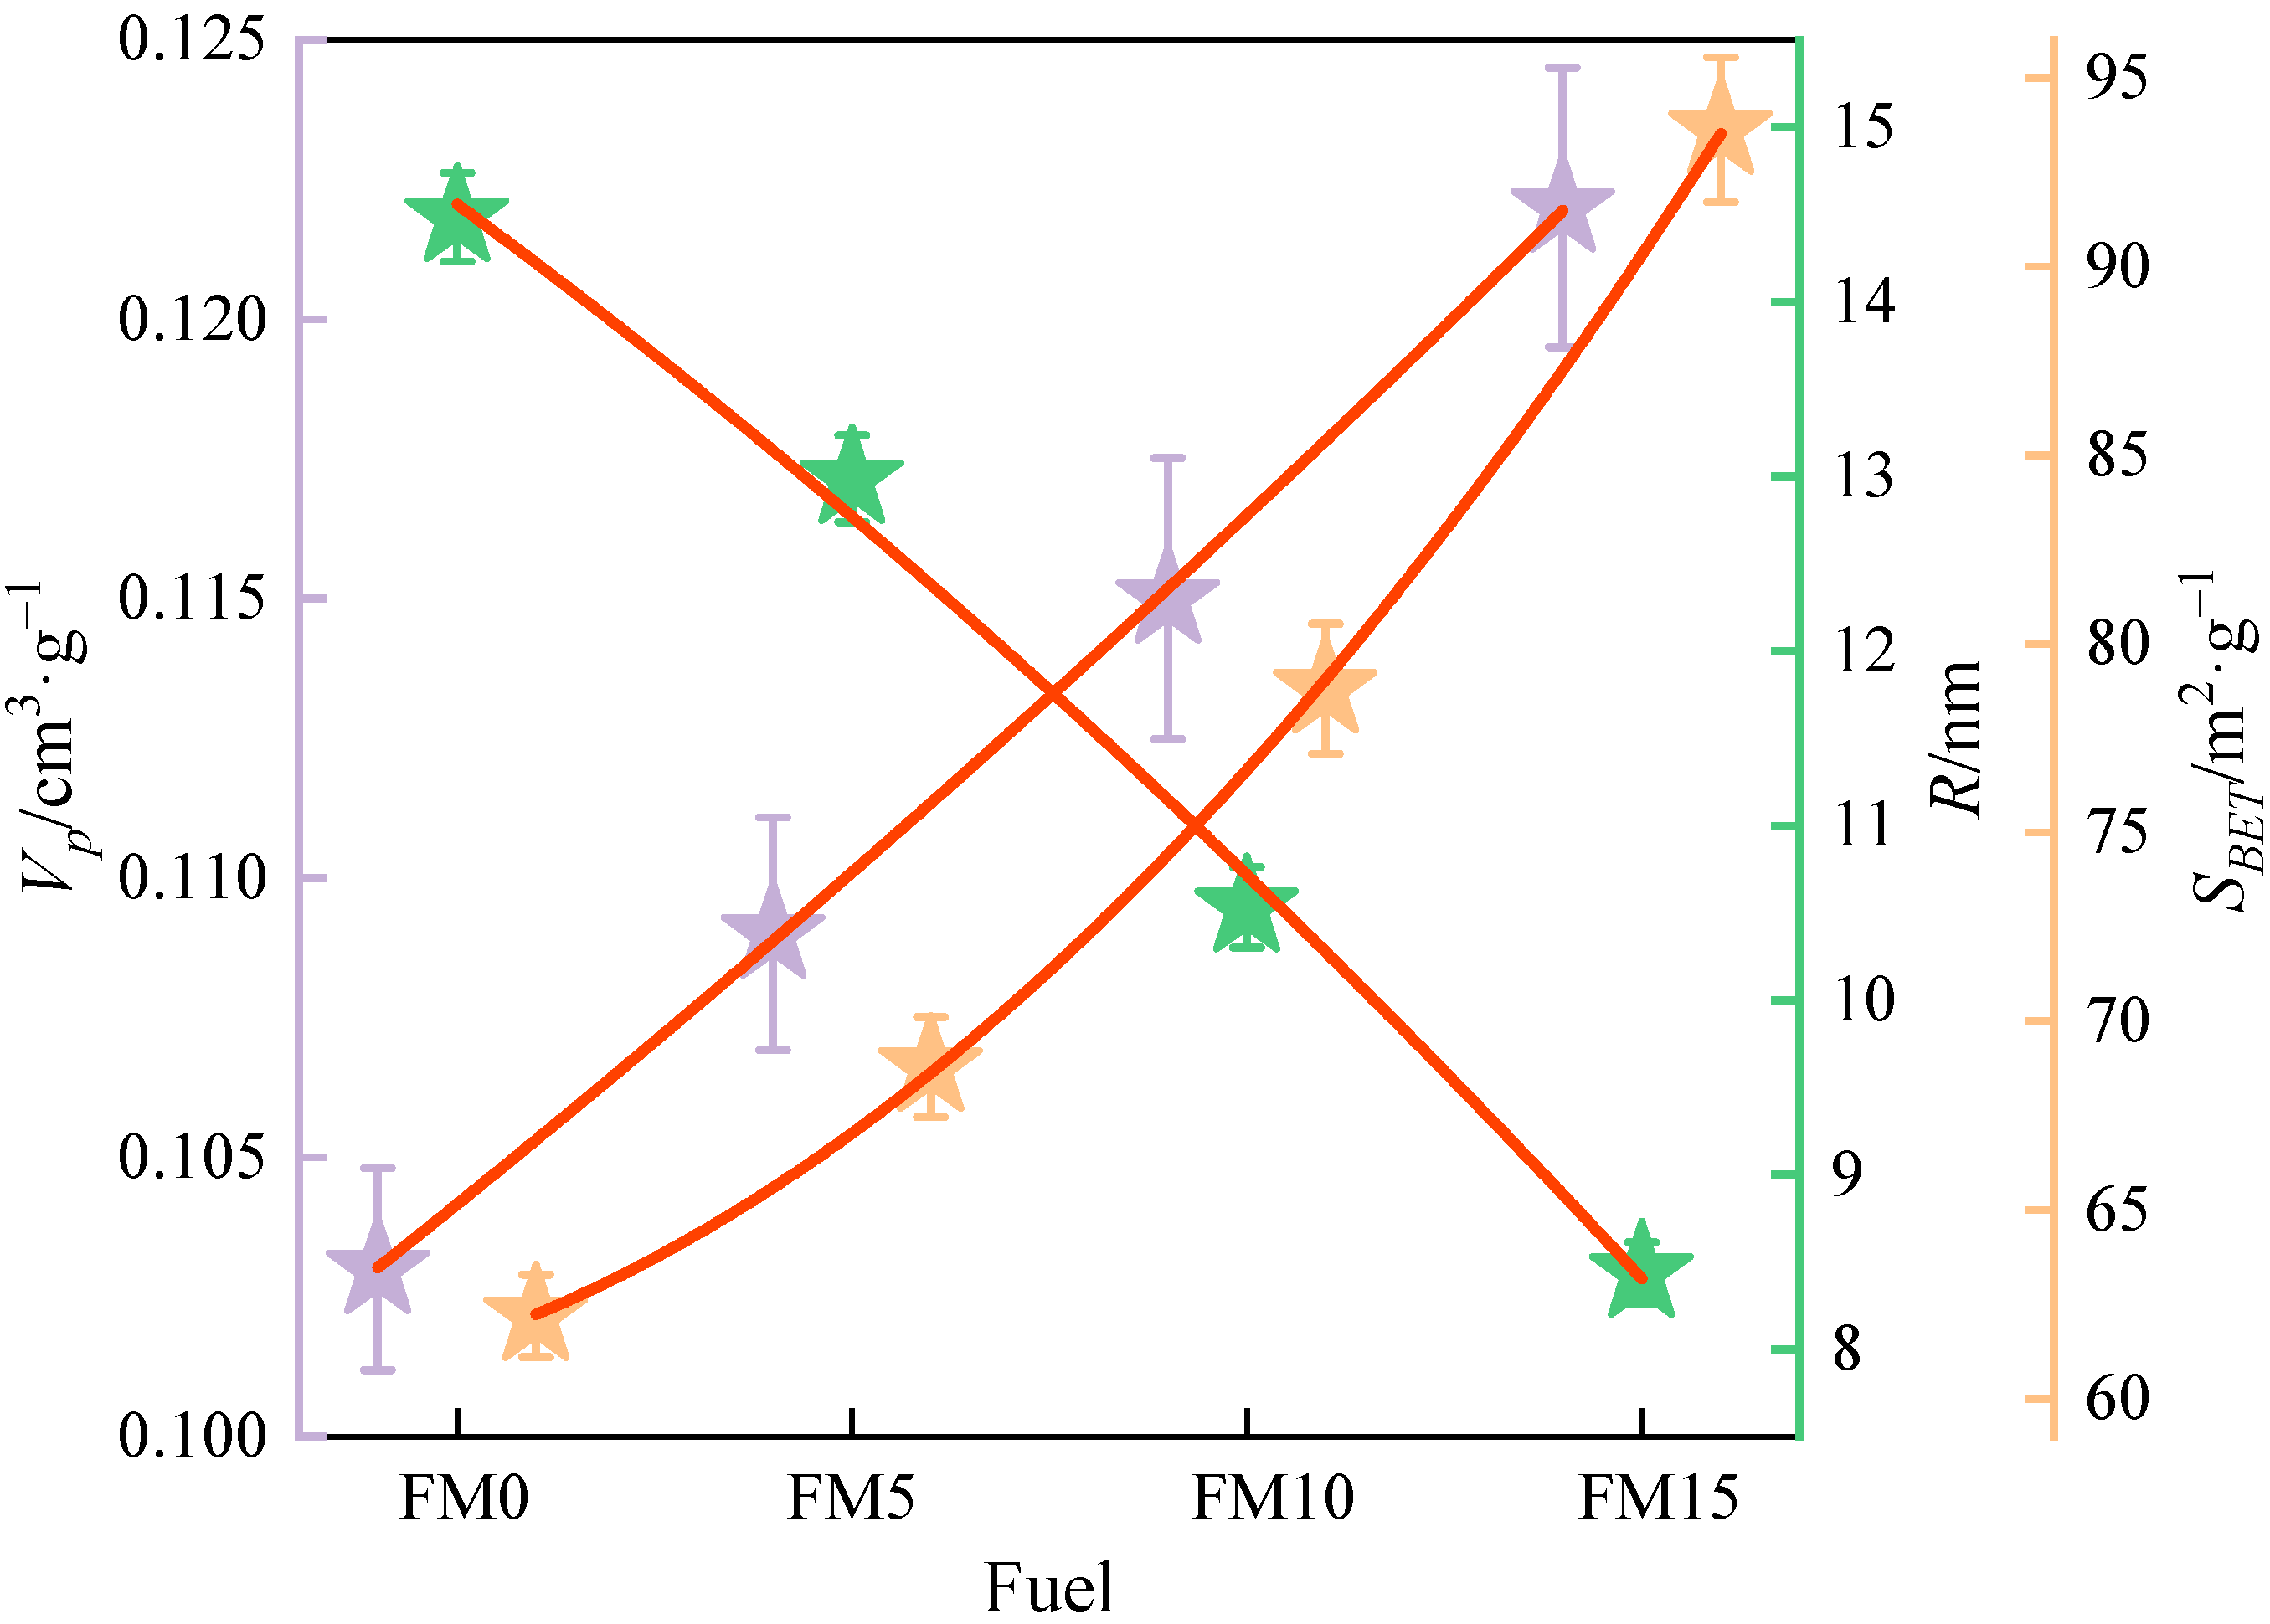
The BET equation was utilized to fit the isothermal adsorption data of N2 on the particulates, and the specific surface area of the particulate matter from methanol/F-T diesel combustion was obtained. Then, the total pore volume and mean half pore width of the particulates were calculated by fitting the adsorption isotherm curve with the DFT model. The BET equation and DFT model are listed in Section 2.3.1. Figure 6 and Table 3 show the total pore volume (), mean half pore width (), and specific surface area () of methanol/F-T diesel particulates. It can be obtained with the increase in the methanol volume ratio; the mean and mean of particulates increase, and the respective mean decreases. The mean value of in F-T diesel particulates was 0.103 cm3·g−1. Compared with FM0 particulates, the mean of FM5 particulates, FM10, and FM15 particulates increased by 5.8%, 11.7% and 18.4%. The increase in value may be attributed to the higher disorder degree of primary particles formed by the combustion of oxygenated fuel, which is more prone to oxidation reaction, and the formation of more pore structures in the aggregate. The mean of F-T diesel particulates is 14.5 nm. Compared with FM0 particulates, the mean of FM5 particulates, FM10, and FM15 particulates is reduced by 10.3%, 27.3% and 41.7%, respectively. This is because the diameter of the mixed fuel primary particle is smaller than the F-T primary particle, and it is easier for particles to stack closely under the action of mechanical characteristics such as the van der Waals force and adhesion force, which makes the pore width decrease. The mean of FT diesel particulates is 62.2 m2·g−1. The mean S values of FM5, FM10, and FM15 particulates increased by 10.6%, 26.7%, and 50.5%, respectively, relative to those of FM0 particulates. The mean values of FM5, FM10, and FM15 particulates increased by 10.6%, 26.7%, and 50.5%, respectively, relative to those of FM0 particulates. As illustrated in Figure 4, the primary particles composing diesel engine exhaust are nearly spherical in shape. For spherical solids, the external specific surface area increases with the decrease in radius. After blending methanol, the of the particulates increased, which is consistent with the change in the primary particle diameter. This finding indicates that diesel engine particulate emissions blended with methanol exhibit a higher adsorption capacity compared to those from pure F-T diesel.
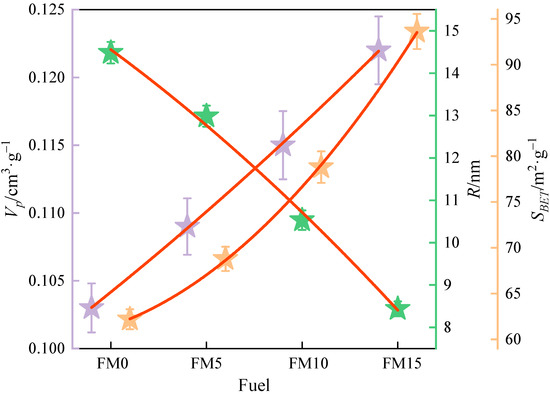
Figure 6.
The total pore volume, mean half pore width, and specific surface area of methanol/F-T diesel particulates (the error bars represent standard errors, the red lines represent the polynomial fitting curves).

Table 3.
Characteristic parameters of the pore structure of methanol/F-T diesel blends particulates.
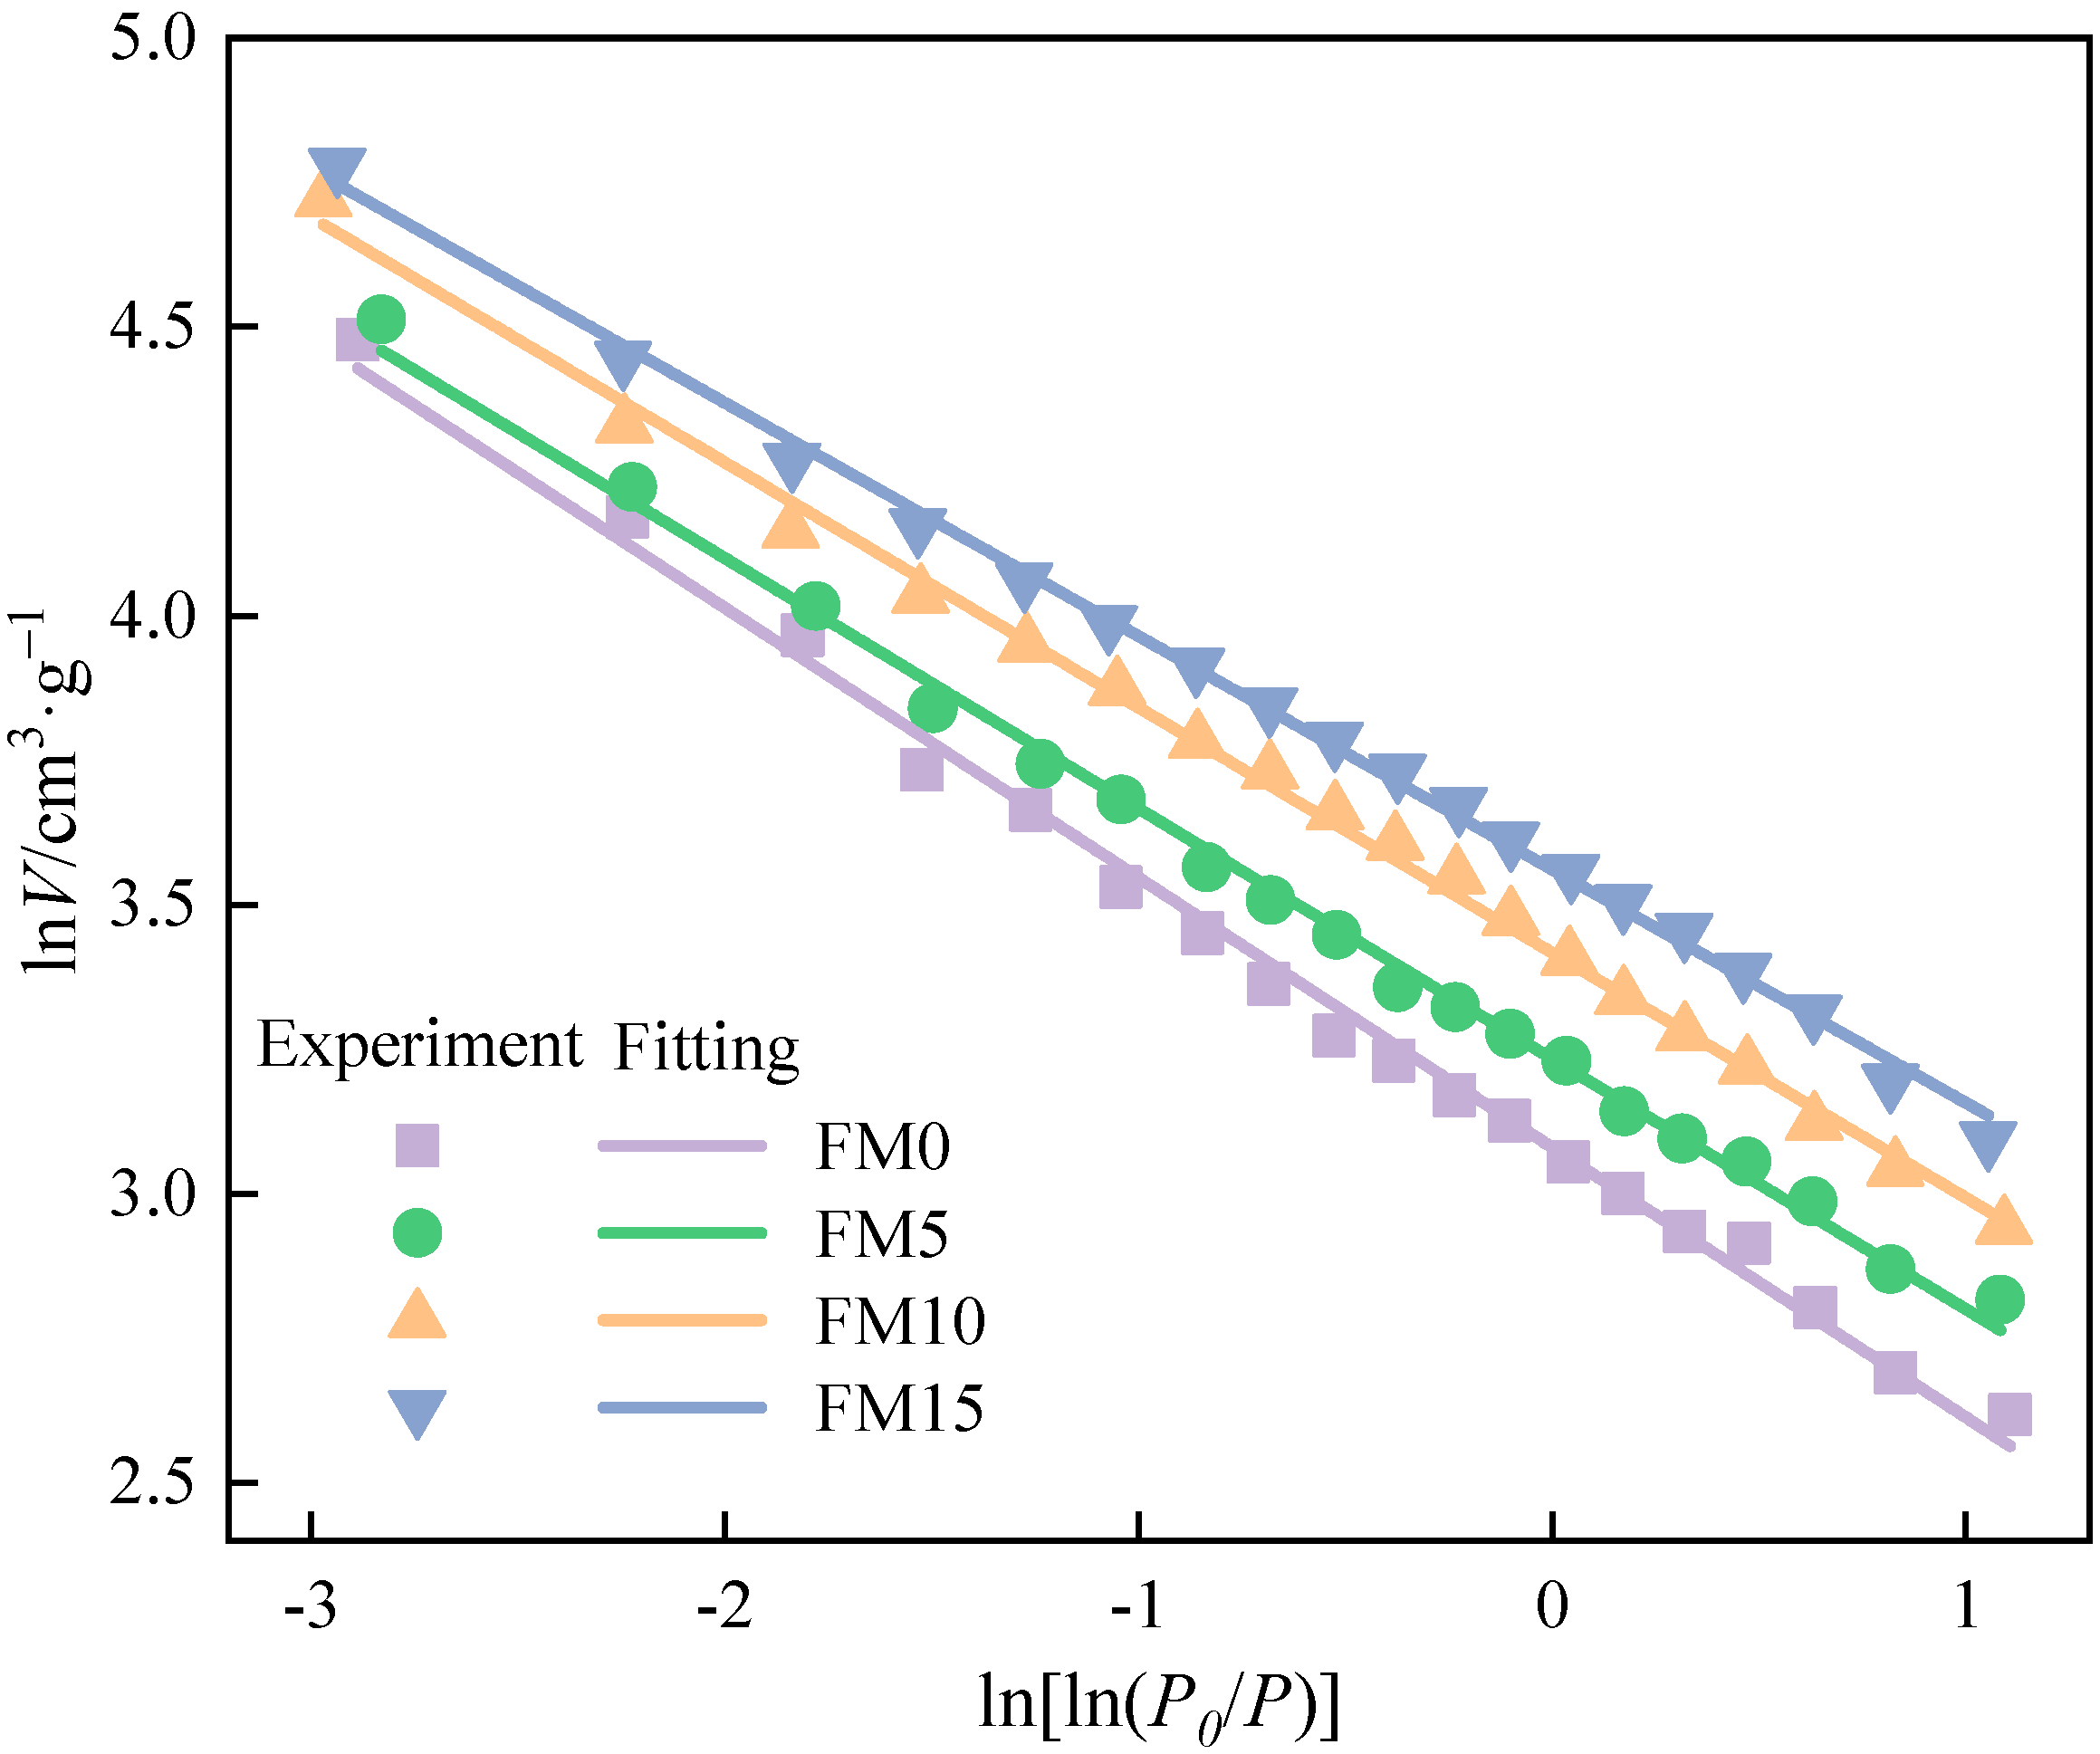
Figure 7 shows the fitting line of the FHH equation for isothermal adsorption data of particulates. The fitting results are listed in Table 4. All four fitting equations have correlation coefficients (R2) exceeding 0.99, confirming the strong reliability and accuracy of the model fit. It can be illustrated that the fractal dimension () of exhaust particulates mixed with methanol is higher, which indicates that the surface of oxygenated fuel particulates is rougher. There may be two reasons for this phenomenon. One is that the combustion of oxygenated fuel will produce more SOF adsorbed in the particulate; however, the pretreatment before the test makes the SOF adsorbed volatilize, resulting in increasing the vacancies in the particulates and the surface roughness of the particulates. The other is that the blending of methanol makes the mean smaller, brings the agglomeration degree of particles closer, and causes the pore structure to be more intensive. The values of FM5, FM10, and FM15 particulates increased by 1.3%, 1.7%, and 2.5%, respectively, in comparison to those of FM0 particulates.
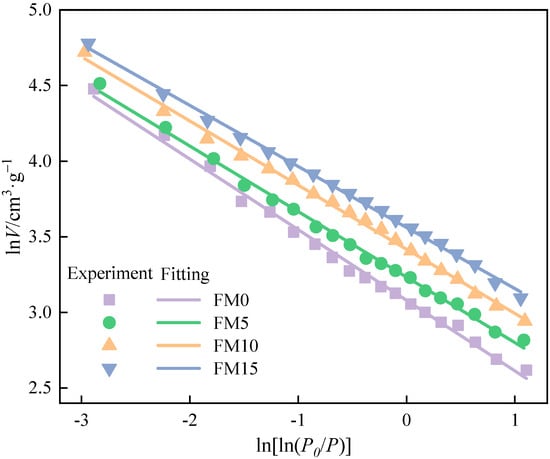
Figure 7.
The fitting lines in FHH equation of methanol/F-T diesel particulates.

Table 4.
The fitting results of the fractal dimension by the FHH equation.
3.2. Nanostructure Characteristics of Primary Particles
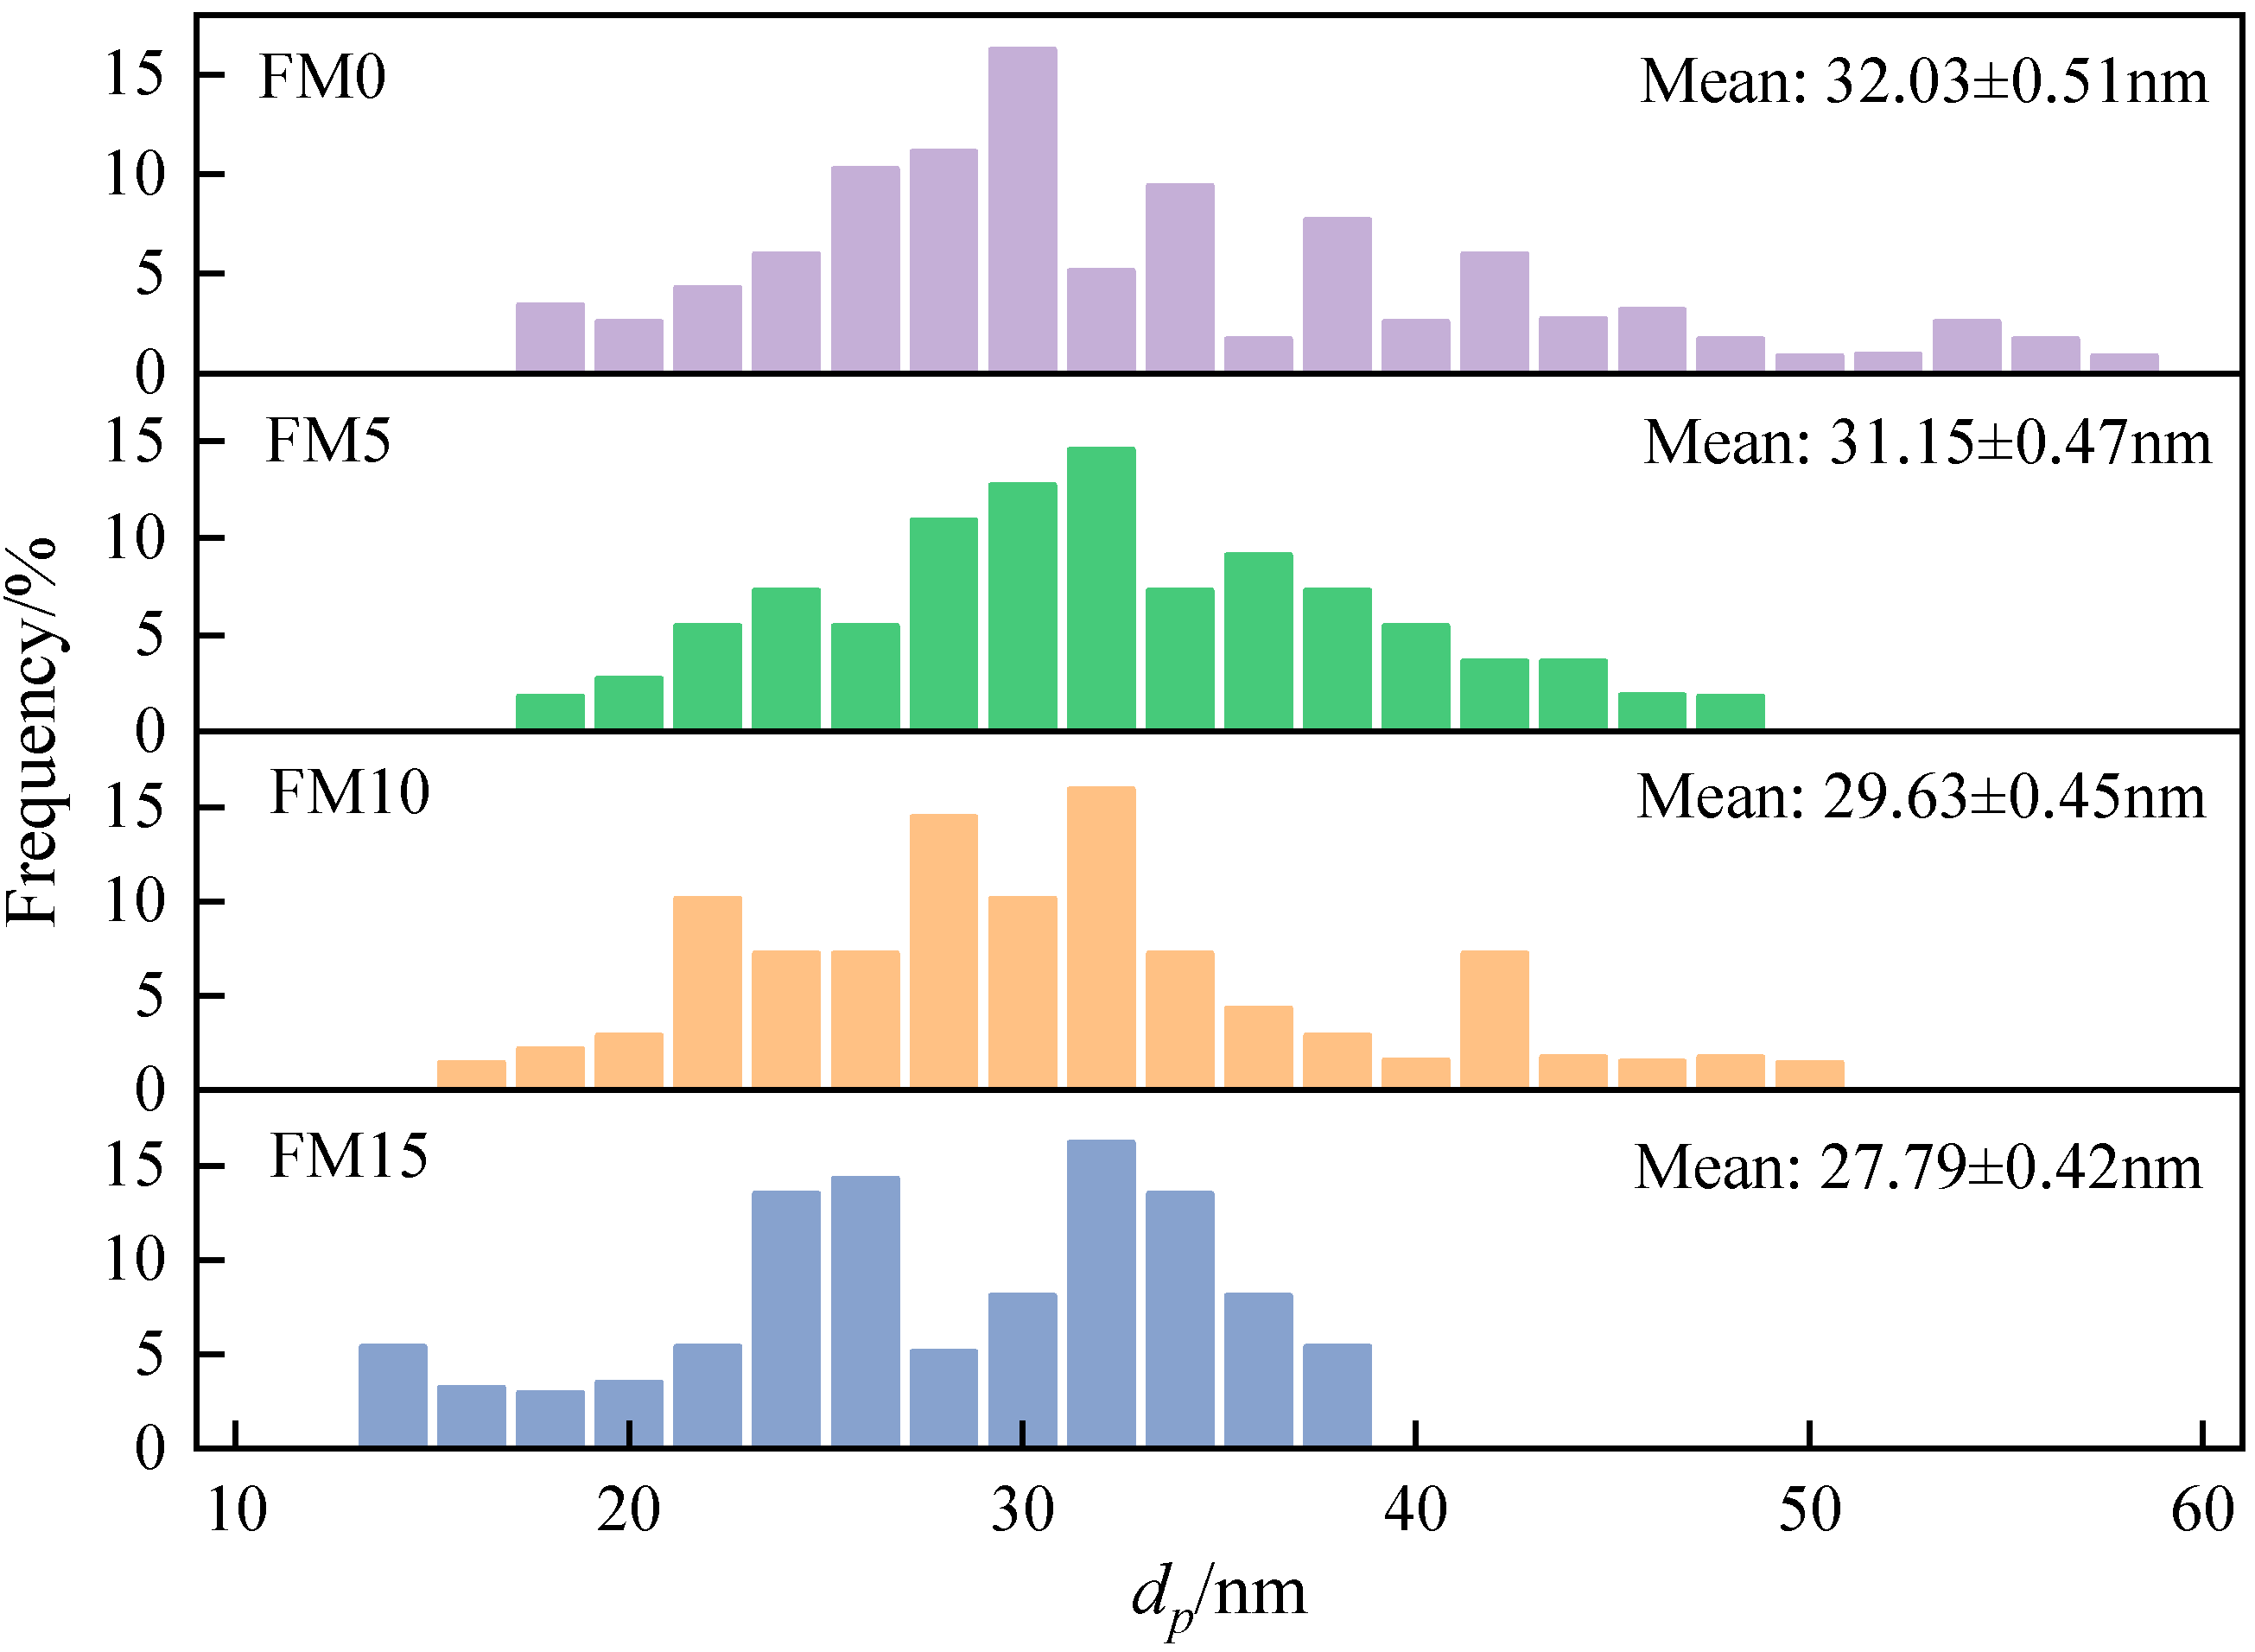
For each particle sample, 1500 primary particles belonging to different aggregates were randomly selected from multiple TEM images to determine the particle size distribution, thereby generating sufficient, reliable statistical data. The Digital Micrograph software was used to measure the particle size of the selected primary particles. After statistical analysis of the measurement data, the histogram of the particle size distribution of the particles was plotted. Figure 8 displays the distribution of the primary particle diameter (). As can be seen, the diameter of the primary particle ranges from 10 nm to 60 nm, and is mainly concentrated between 20 nm and 40 nm. With the increase in the methanol mixture ratio, the primary particle distribution curve gradually moves to the small size direction, and the value of mean decreased. Compared with FM0 primary particles, the mean of FM5, FM10, and FM15 primary particles decreased by 2.8%, 7.5% and 13.3%, respectively. Verma et al. [18] reported that the oxygen content of fuel plays a key role in the size of primary particles, and pointed out that the higher the oxygen content of fuel, the smaller the mean value of . In addition, Li et al. [39] researched that the increase in primary particle mainly depends on surface growth in the early stage of combustion, while the gradually decreases due to the oxidation process in the later stage of combustion. The blending of oxygenated fuel reduces the amount of polycyclic aromatic hydrocarbons in the cylinder and slows down the surface growth process of particles. Moreover, methanol combustion will release more oxygen-containing groups, accelerating the oxidation of primary particles.
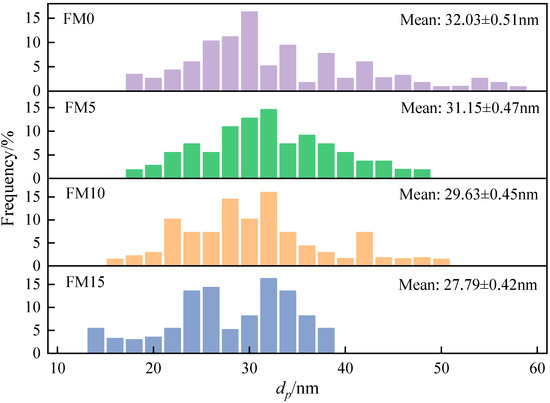
Figure 8.
The distribution of primary particle diameter () (the error represents standard errors).
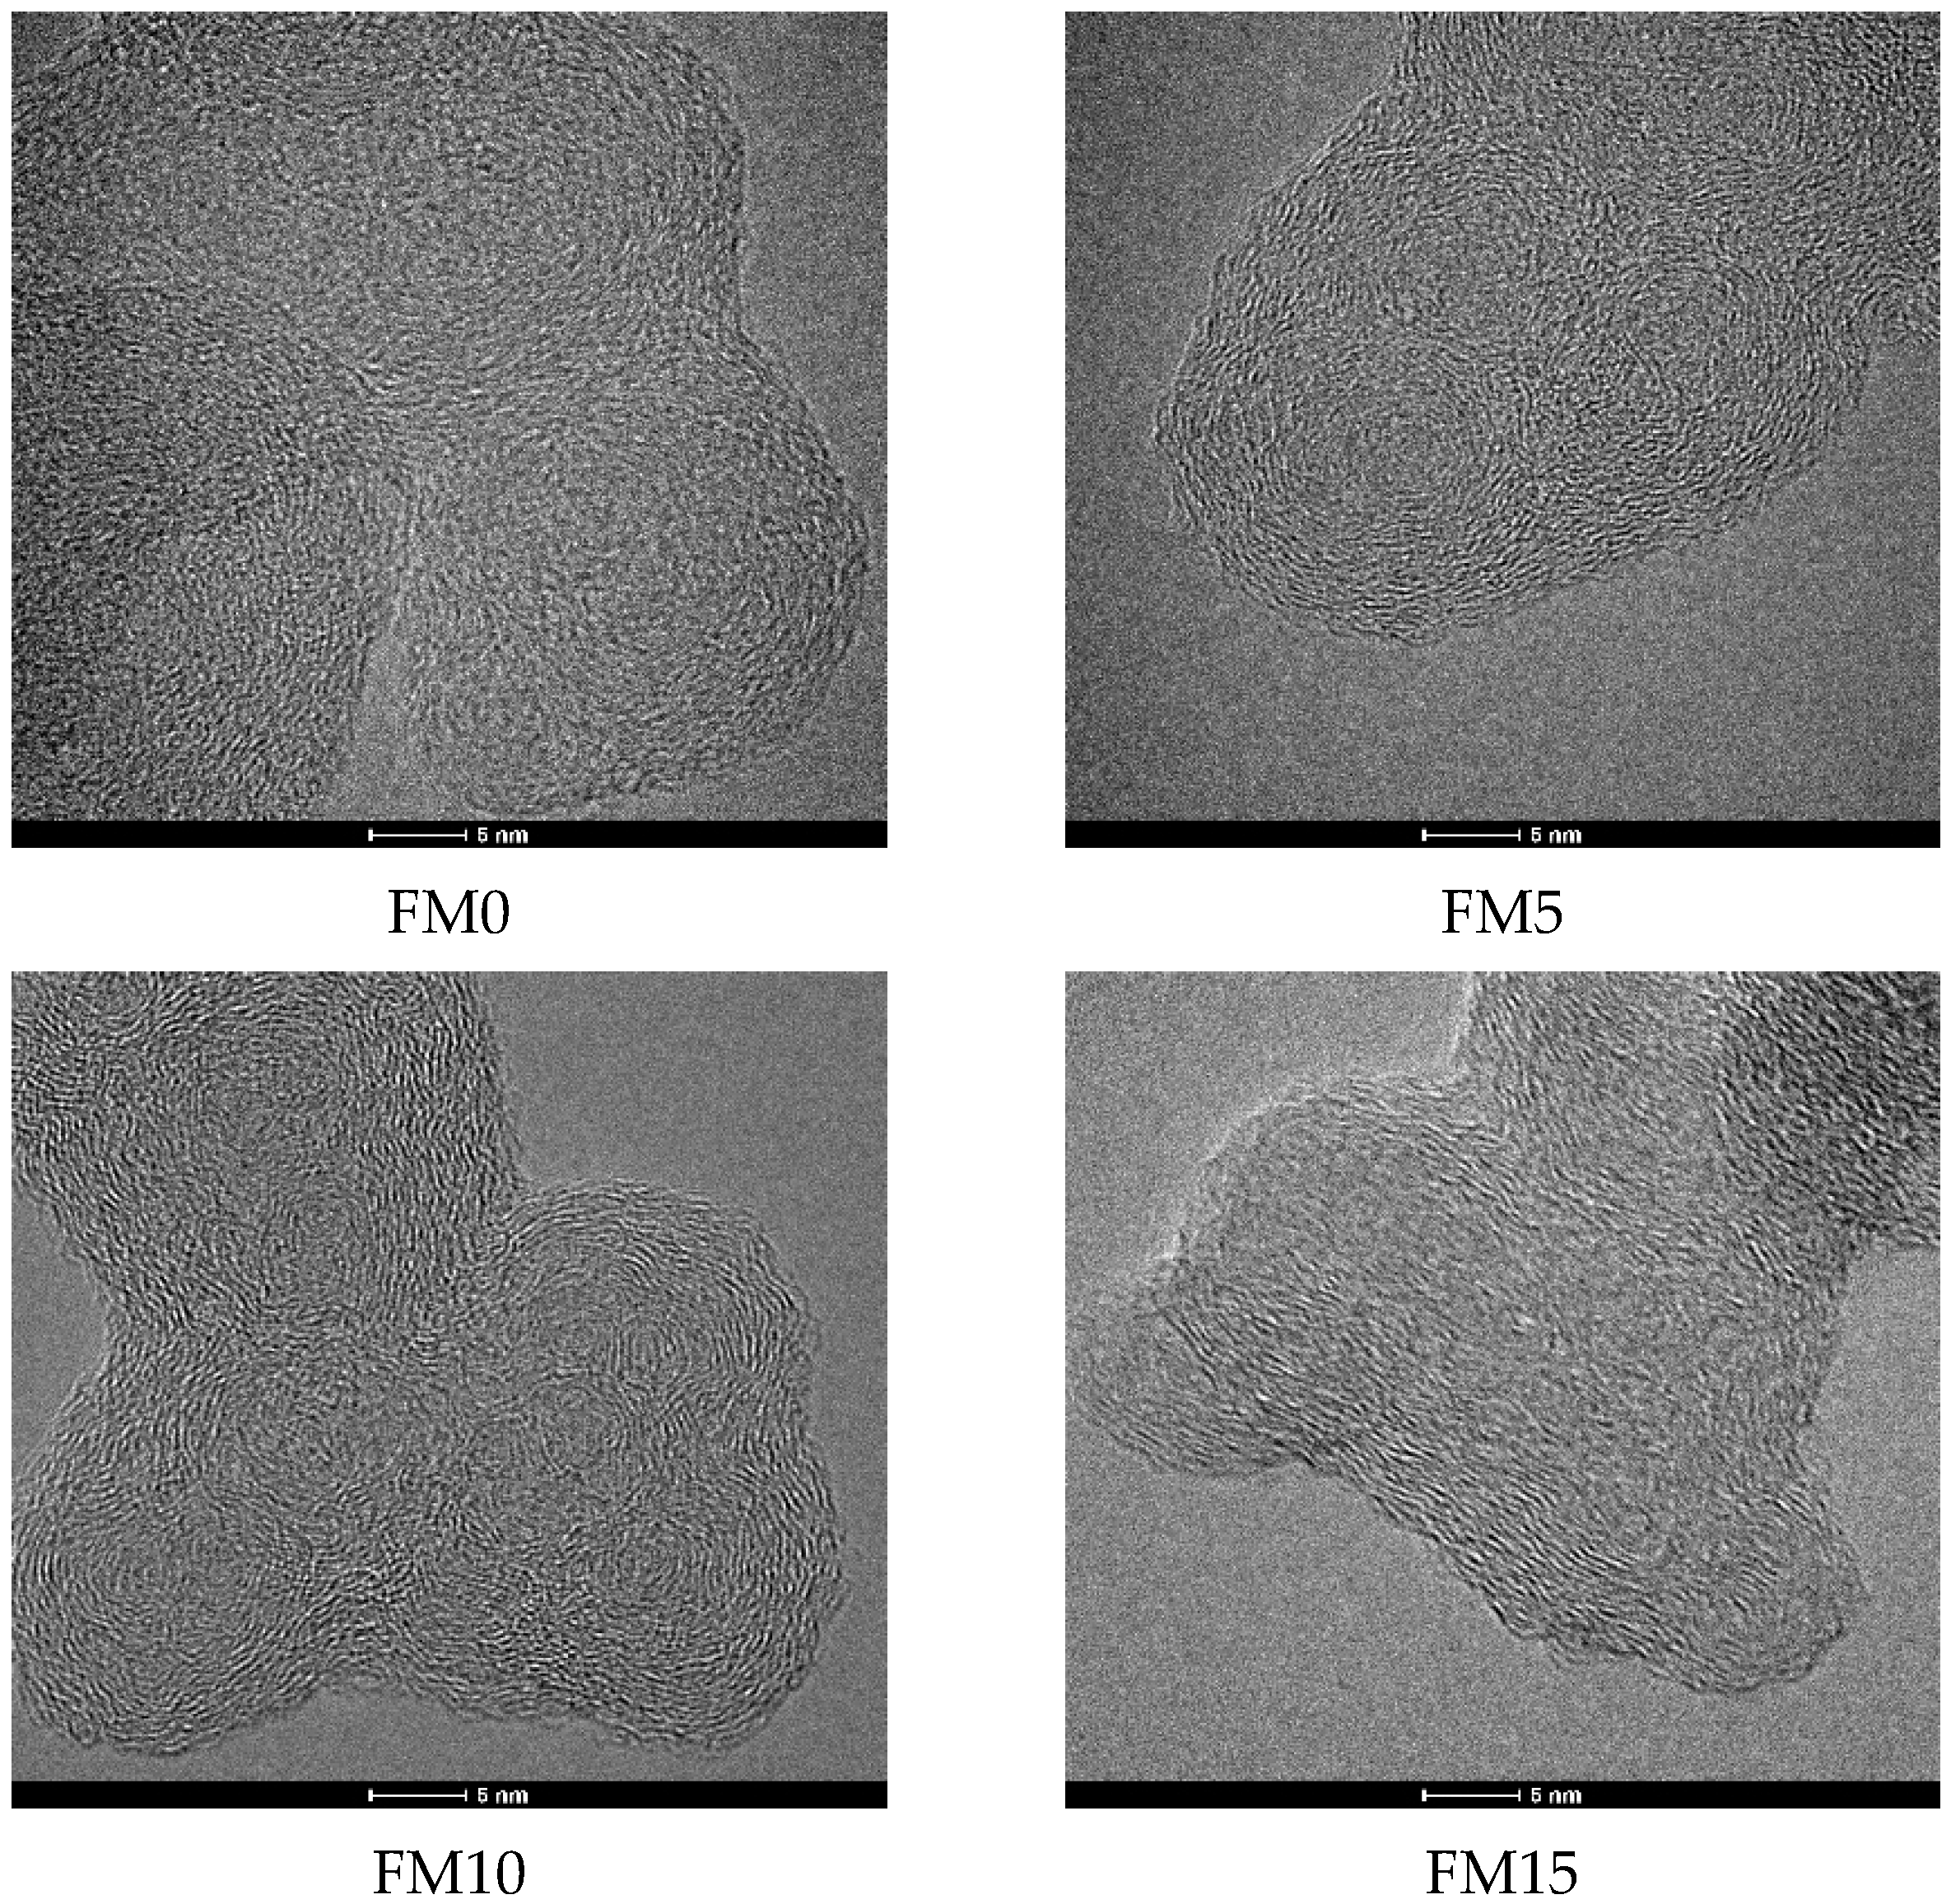
The HRTEM images of methanol/F-T diesel particulates are shown in Figure 9. It can be seen that the primary particle presents a “shell-core” structure with one or more cores inside. To further analyze the effect of methanol blending on the nanostructure of diesel engine exhaust particulates, at least 200 different primary particles were randomly selected from each particulate sample to ensure that the data had sufficient statistical representativeness. All images were collected at different positions on the TEM grid to minimize the influence of local inhomogeneities in each sample. When measuring the fringe separation distance (), fringe length (), and fringe tortuosity () of the primary particles using Digital Micrograph software, complete microcrystal fringes were selected as much as possible, and broken, overlapping, and blurred microcrystal fringes were excluded.
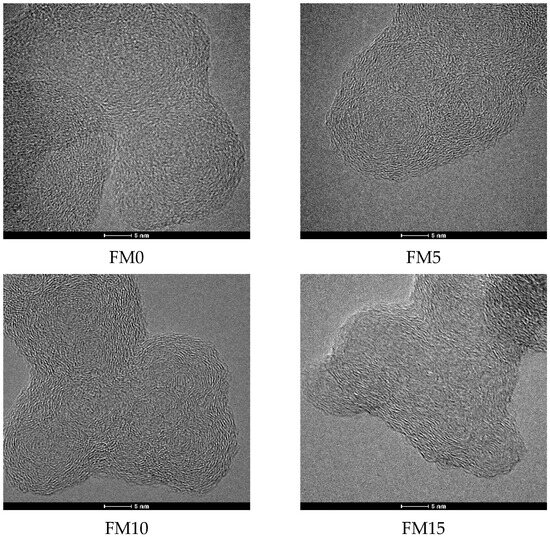
Figure 9.
The HRTEM images of methanol/F-T diesel particulates.
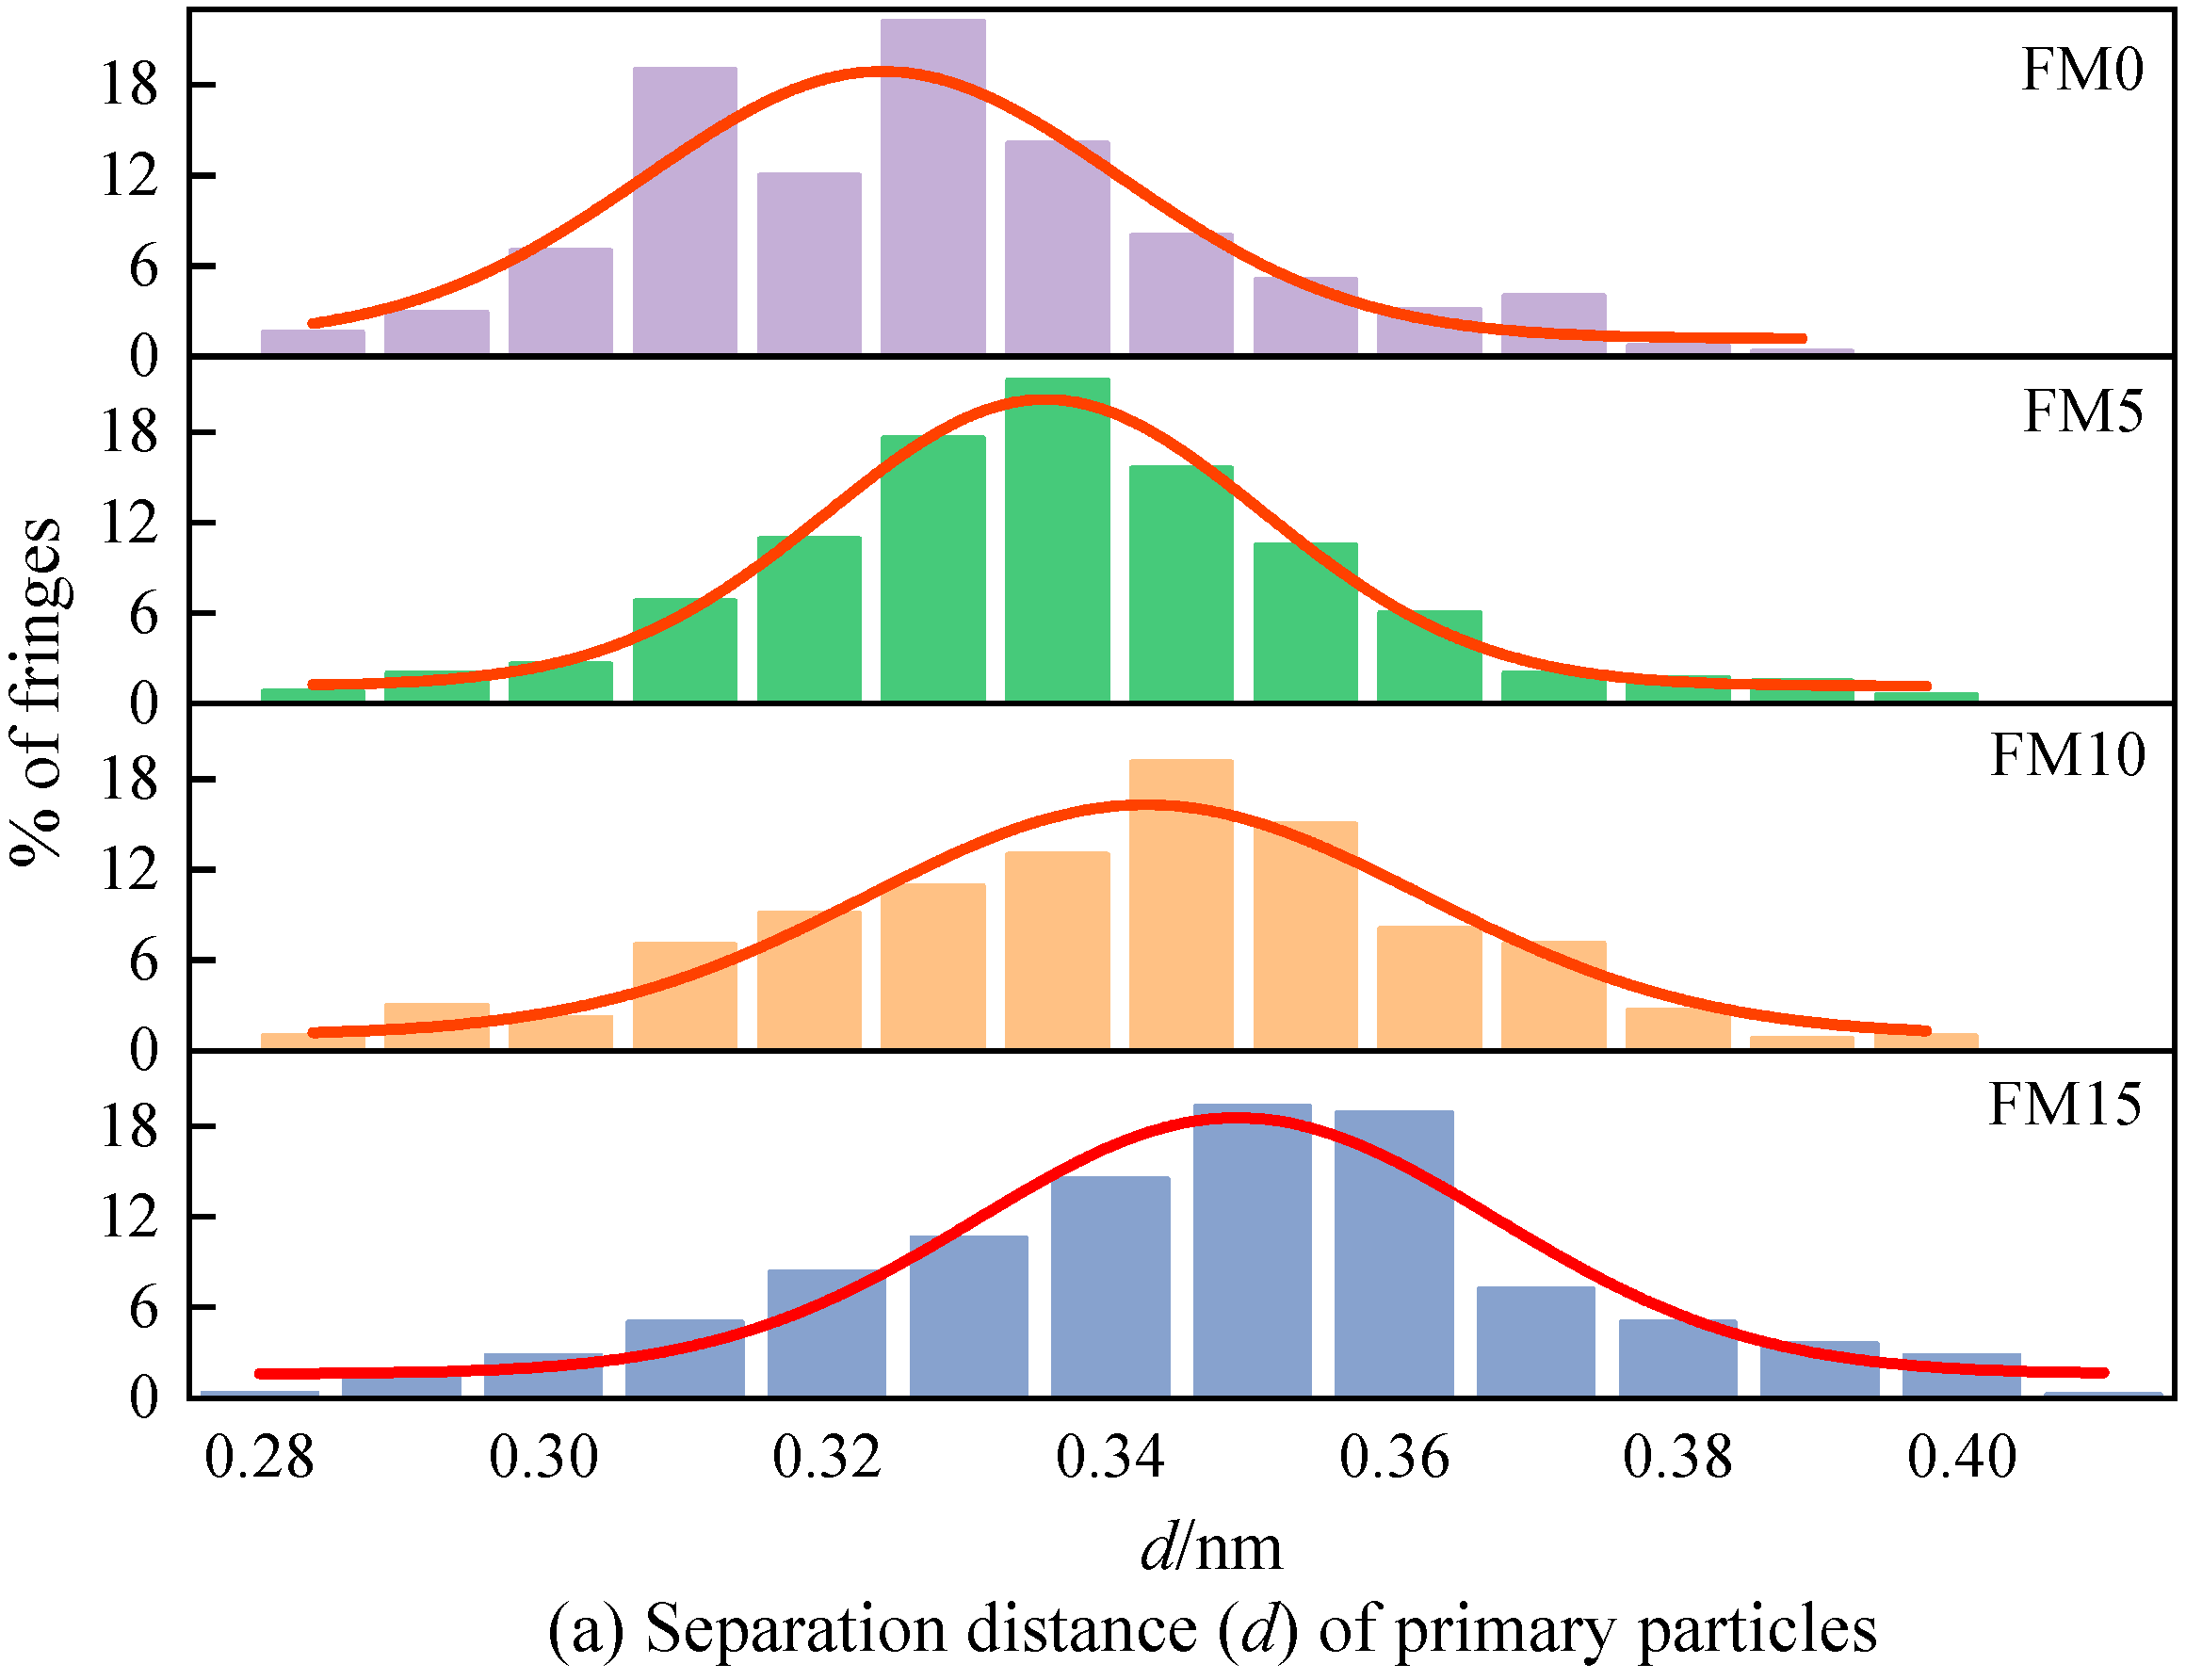
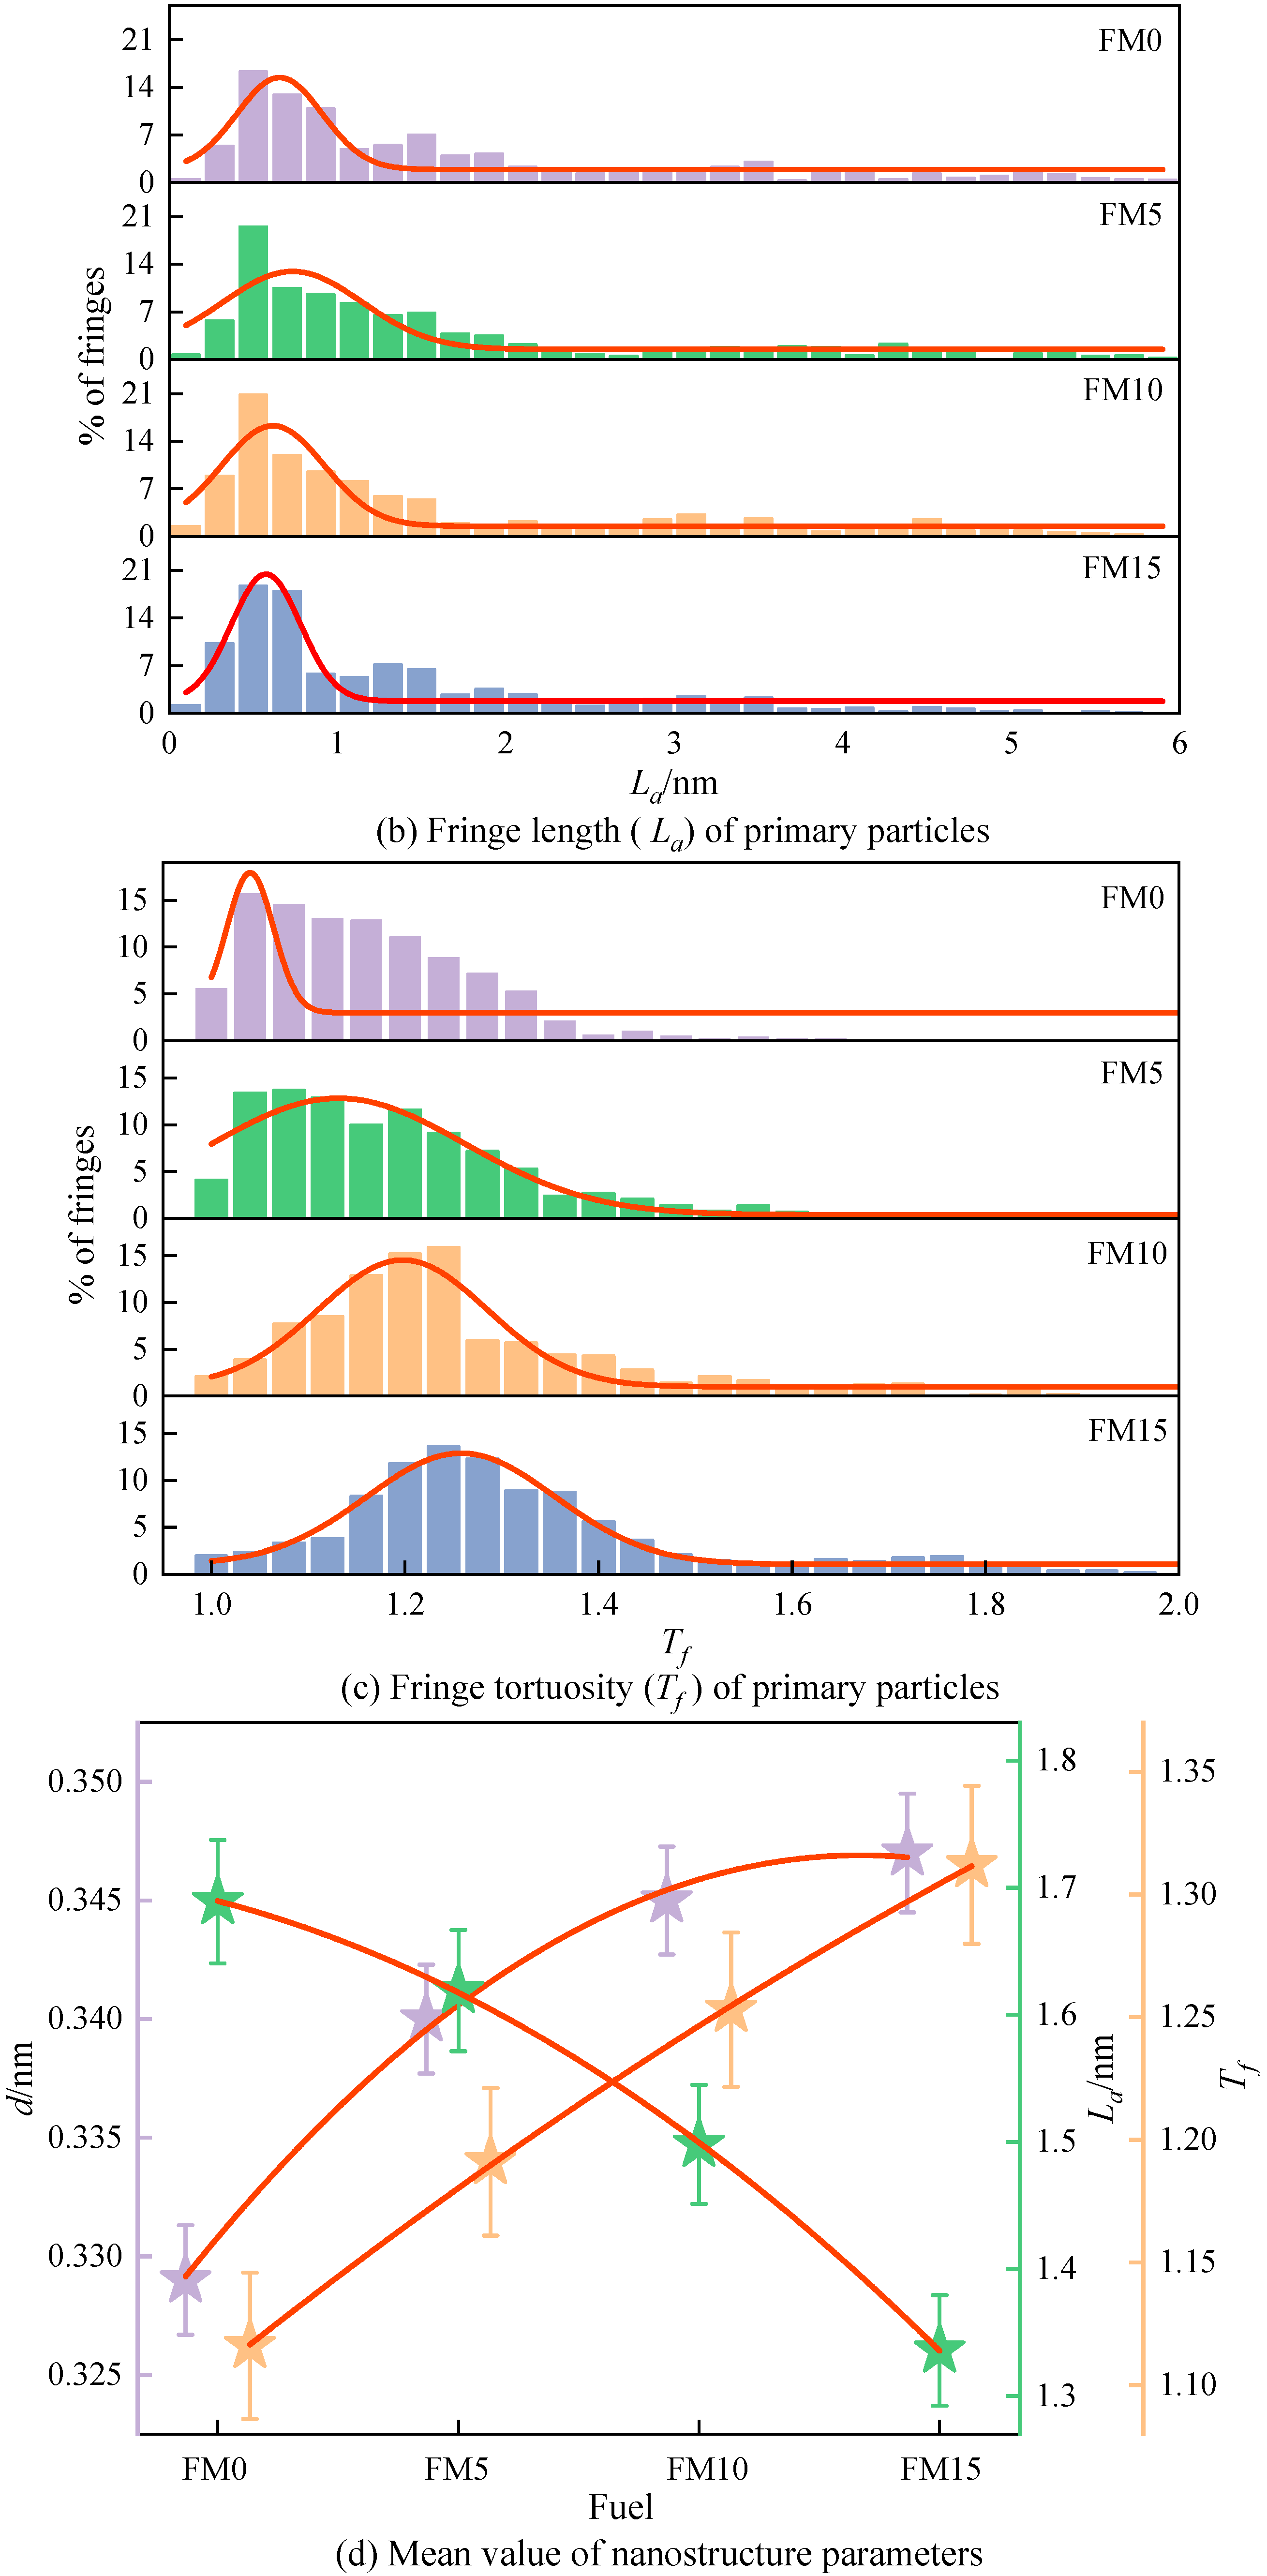
Figure 10a displays the distribution of the fringe separation distance () of the primary particles. The of the primary particles is mainly distributed in 0.31 nm~0.36 nm, representing 52% to 79% of the total fringe count, as clearly demonstrated by the figure. As the amount of methanol increases, the normal distribution curve obtained by fitting gradually shifts to the right, indicating that the primary particles contained more widely spaced fringes. Figure 10b shows the fringe length () distribution of the primary particles. As can be seen, the lengths of fringes are mostly concentrated within 2 nm, accounting for 74%~82% of the total number of fringes. The blending of methanol reduces the percentage of large-sized fringes and increases the percentage of fringes with a length of less than 1 nm. Figure 10c is the fringe tortuosity () distribution of the primary particles. It can be found that with the increase in the methanol mixture ratio, the tortuosity of the fringe shows an increasing trend, which means that the blending of methanol causes the particles to have a more disordered nanostructure. The proportion of fringes with a tortuosity exceeding 1.2 in FM0 primary particles reaches 26%, and when FM15 is used, this proportion reaches 67%, which is more than twice that of FM0. Figure 10d plots the mean value trend of nanostructure parameters for primary particles. As could be observed, when the amount of methanol increases, both the distance between fringes and the degree of fringe irregularity become greater, while the rule of fringe length is opposite. In general, higher tortuosity inhibits the extension of graphene layers, increasing the spacing between adjacent fringes, leading to the disordering of the carbon skeleton [40]. Compared with FM0 primary particles, the mean separation distance of FM5, FM10, and FM15 primary particles widens by 4% by 3.3%, 4.9%, and 5.5%, the mean length of fringes reduces by 4.1%, 11.3%, and 20.9%, and the mean tortuosity of fringes increases by 3.6%, 9.7% and 15.3%, respectively. This indicates that when methanol is blended with coal-based fuel, the particles tend to exhibit a more disordered nanostructure, potentially due to the higher oxygen content in the fuel mixture. Oxygen-enriched fuels promote the generation of additional oxygen-containing radicals during combustion. Furthermore, such conditions suppress the formation of soot precursors, reduce the growth rate of graphene layers, and make the lattice fringes within primary particles more susceptible to oxidation.
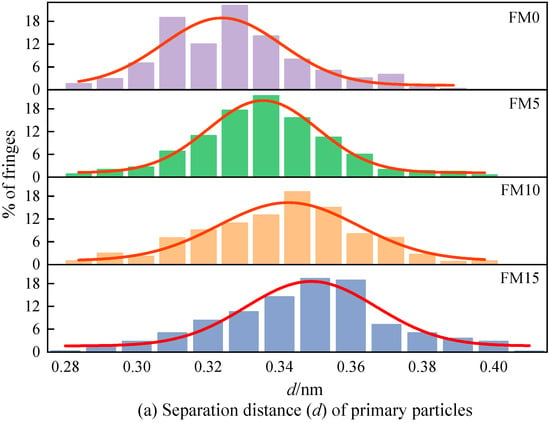
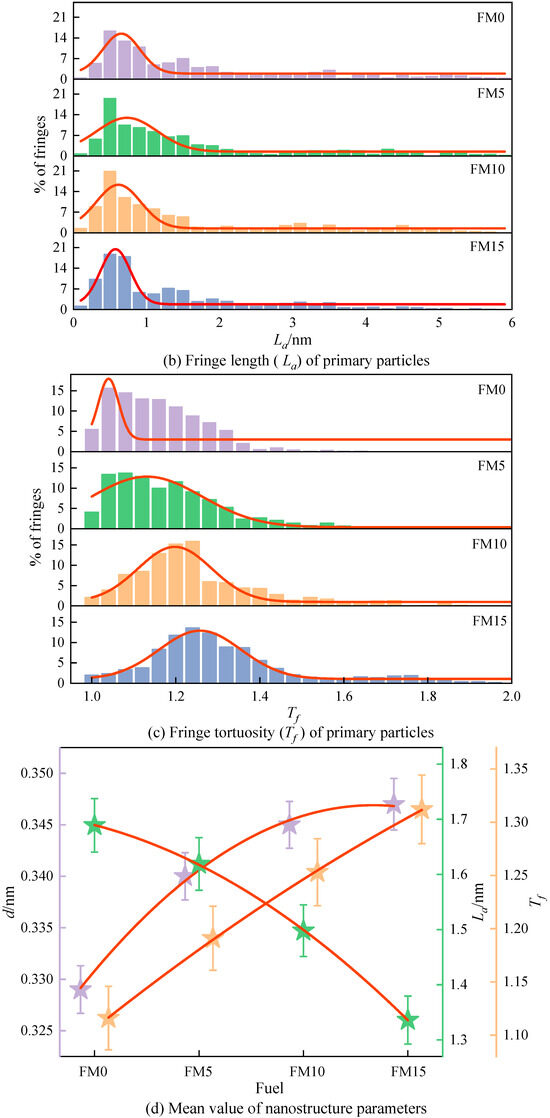
Figure 10.
The nanostructure characteristic parameters (, , and ) of primary particles (the error bars represent standard errors, the red lines in (a–c) represent the normal distribution fitting curve, the red lines in (d) represent the polynomial fitting curves).
3.3. Oxidation Reactivity of Particulates
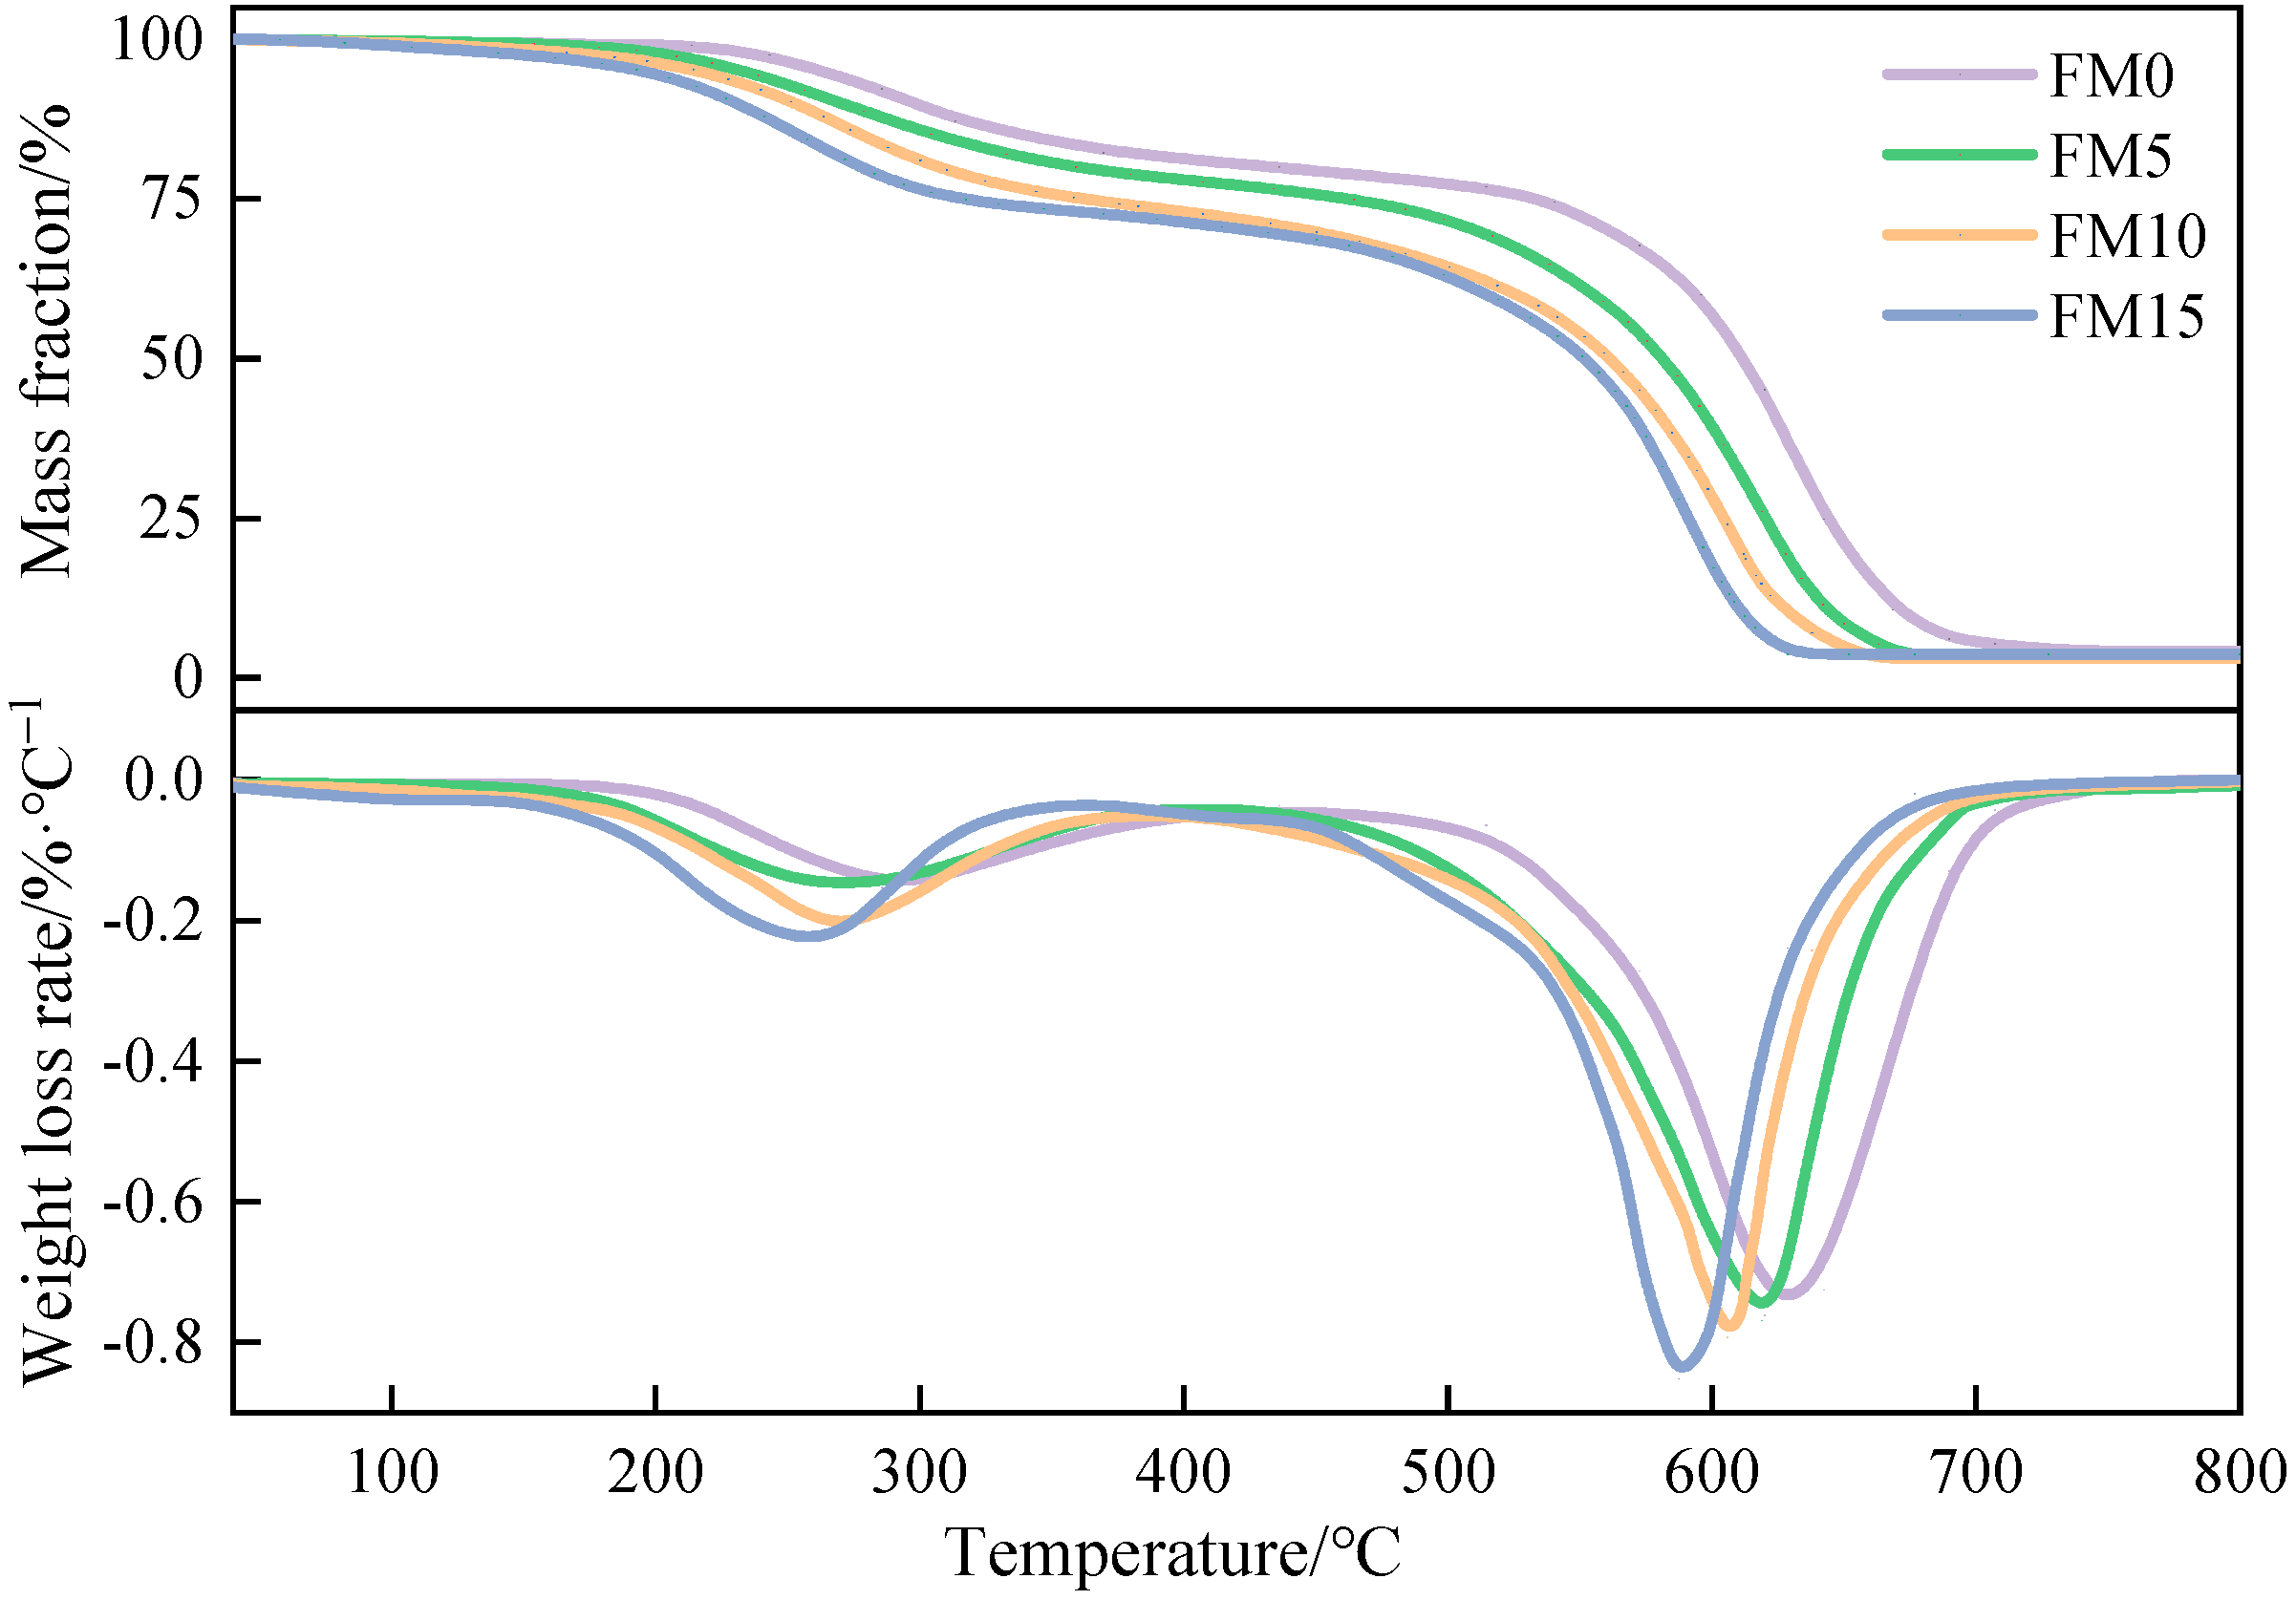
The TG-DTG curves of methanol/F-T diesel particulates are presented in Figure 11. It is not difficult to find that, under the test conditions, the change rules of the particulate TG-DTG curves are basically similar. The low-boiling SOF adsorbed in particulates is oxidized in the first stage, and the soot, which constitutes the primary element of particulates, is oxidized in the second stage. It can be observed that, at the same temperature, the mass loss of FM0 particulates is the smallest among all particulate samples, indicating that the oxidation reactivity of pure F-T diesel particulates is weaker than that of oxygenated coal-based fuel. Further, from 200 °C to 400 °C, the mass loss of FM0 particulates is significantly lower than that of the other three blends particulates, which means that the blending of methanol leads to an increase in the SOF content in particulates. The higher the methanol mixture ratio, the higher the SOF mass fraction. The DTG curve indicates that, in comparison to the first stage, the peak weight loss rate during the second stage of decomposition is more pronounced. Based on the magnitude of the weight loss rate, the particulates follow the sequence FM15 > FM10 > FM5 > FM0.
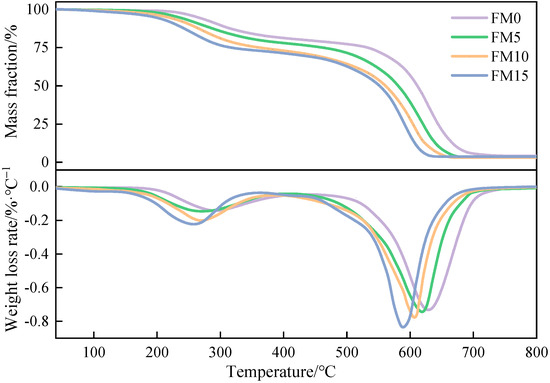
Figure 11.
The TG-DTG curves of methanol/F-T diesel particulates.
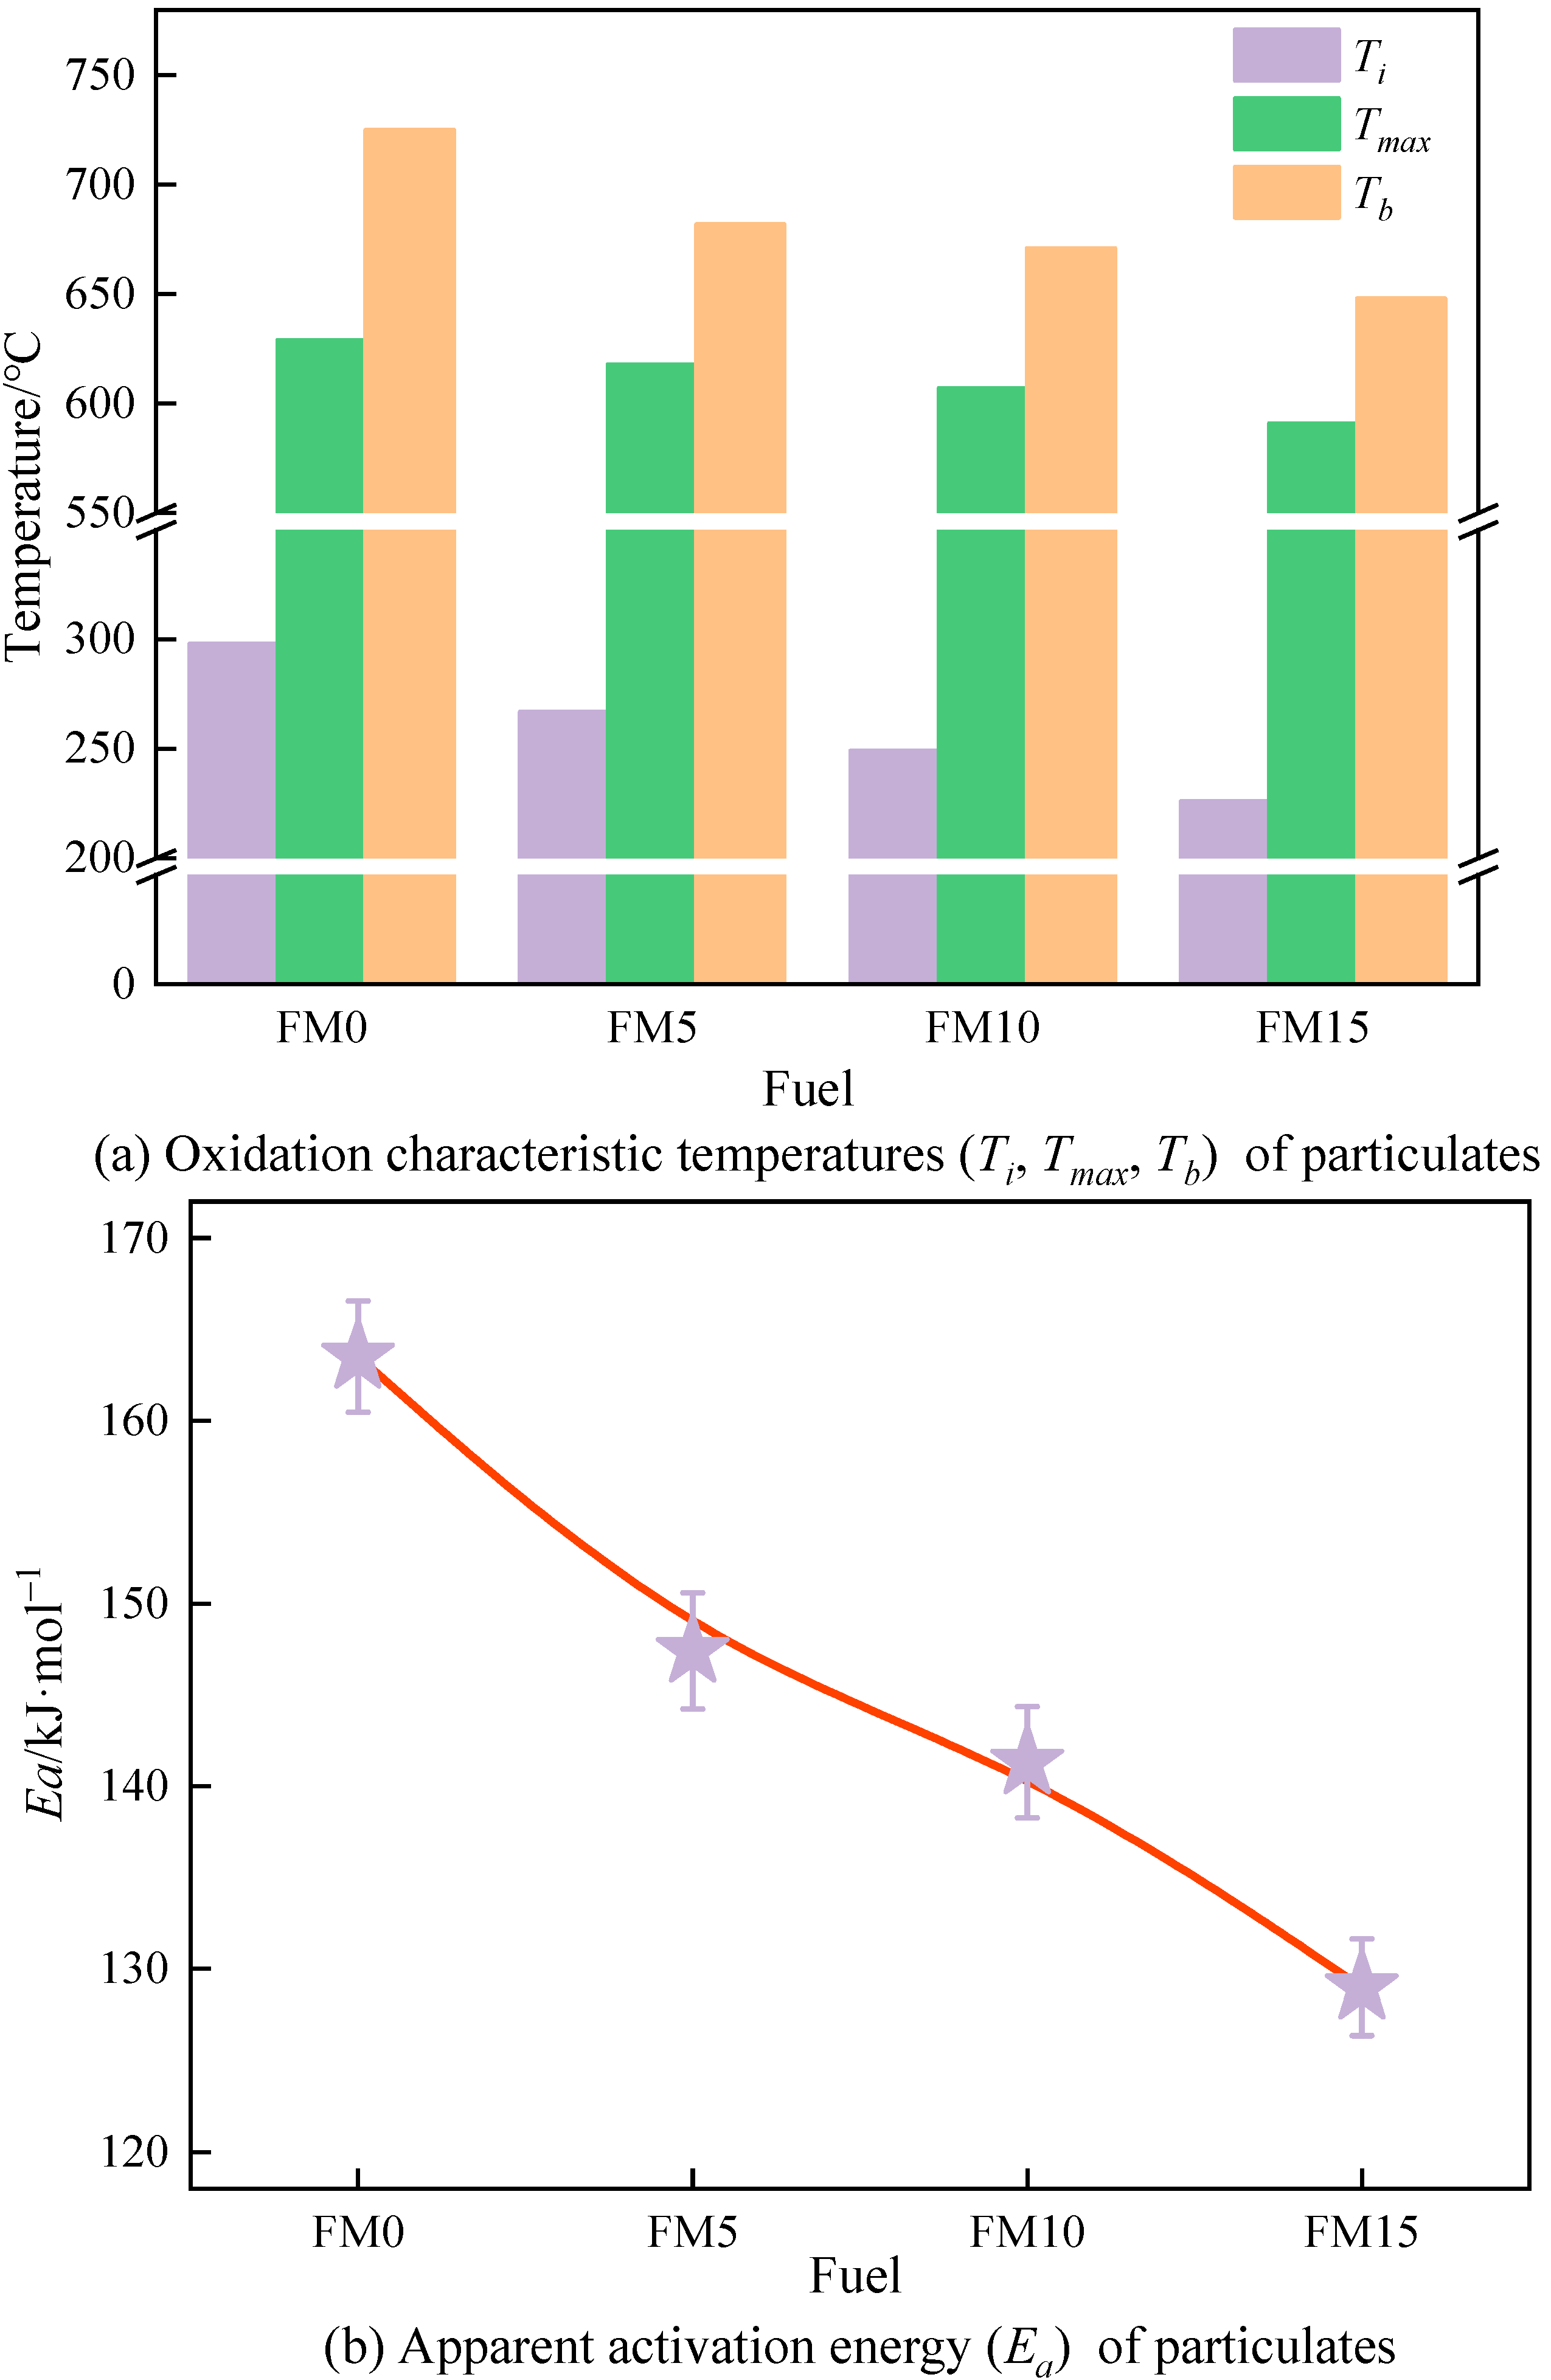
Figure 12 shows the oxidation characteristic temperatures along with the apparent activation energy () of methanol/F-T diesel particulates. It is easy to see from Figure 12a that among the particulates produced by the four coal-based fuels, FM0 particulates have the highest characteristic temperature. And on the contrary, FM15 has the lowest characteristic temperature. Compared with FM0 particulates, the , , and of FM15 particulates are reduced by 31.9, 6.4%, and 11.9%, respectively, which indicates that the blending of methanol makes the particulates more easily oxidized, and the same result is also reflected in Figure 12b. Figure 12b shows that the of the methanol/F-T diesel particulates is in the range of 128~163 kJ·mol−1. Compared with FM0 particulates, the Ea of FM5, FM10, and FM15 particulates are reduced by 9.8%, 13.6%, and 21.1%, respectively. In the range of 0%~15% methanol mixture ratio, the oxidation reactivity of particulates is proportional to the methanol mixture ratio.
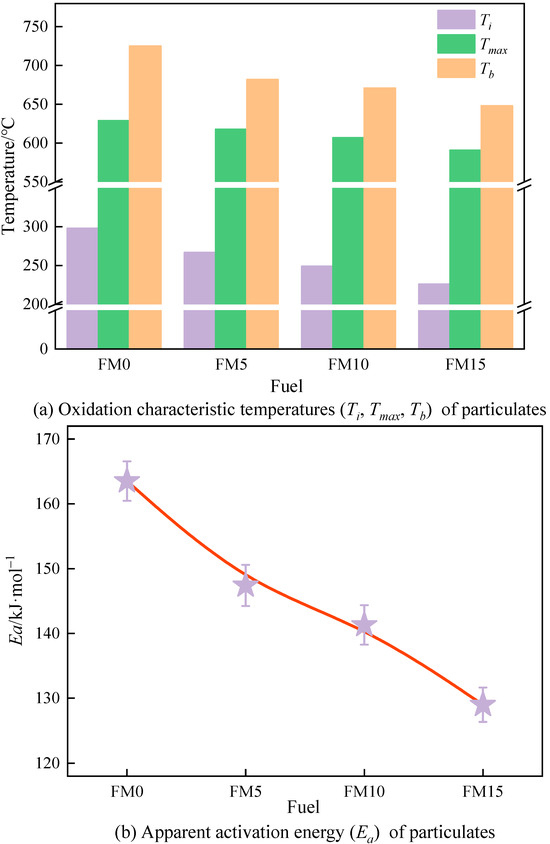
Figure 12.
The oxidation reactivity temperatures and apparent activation energy of particulates (the error bars represent standard errors, the red lines represent the polynomial fitting curves).
3.4. Correlations Between Nanostructure Characteristics and Oxidation Reactivity of Particulates
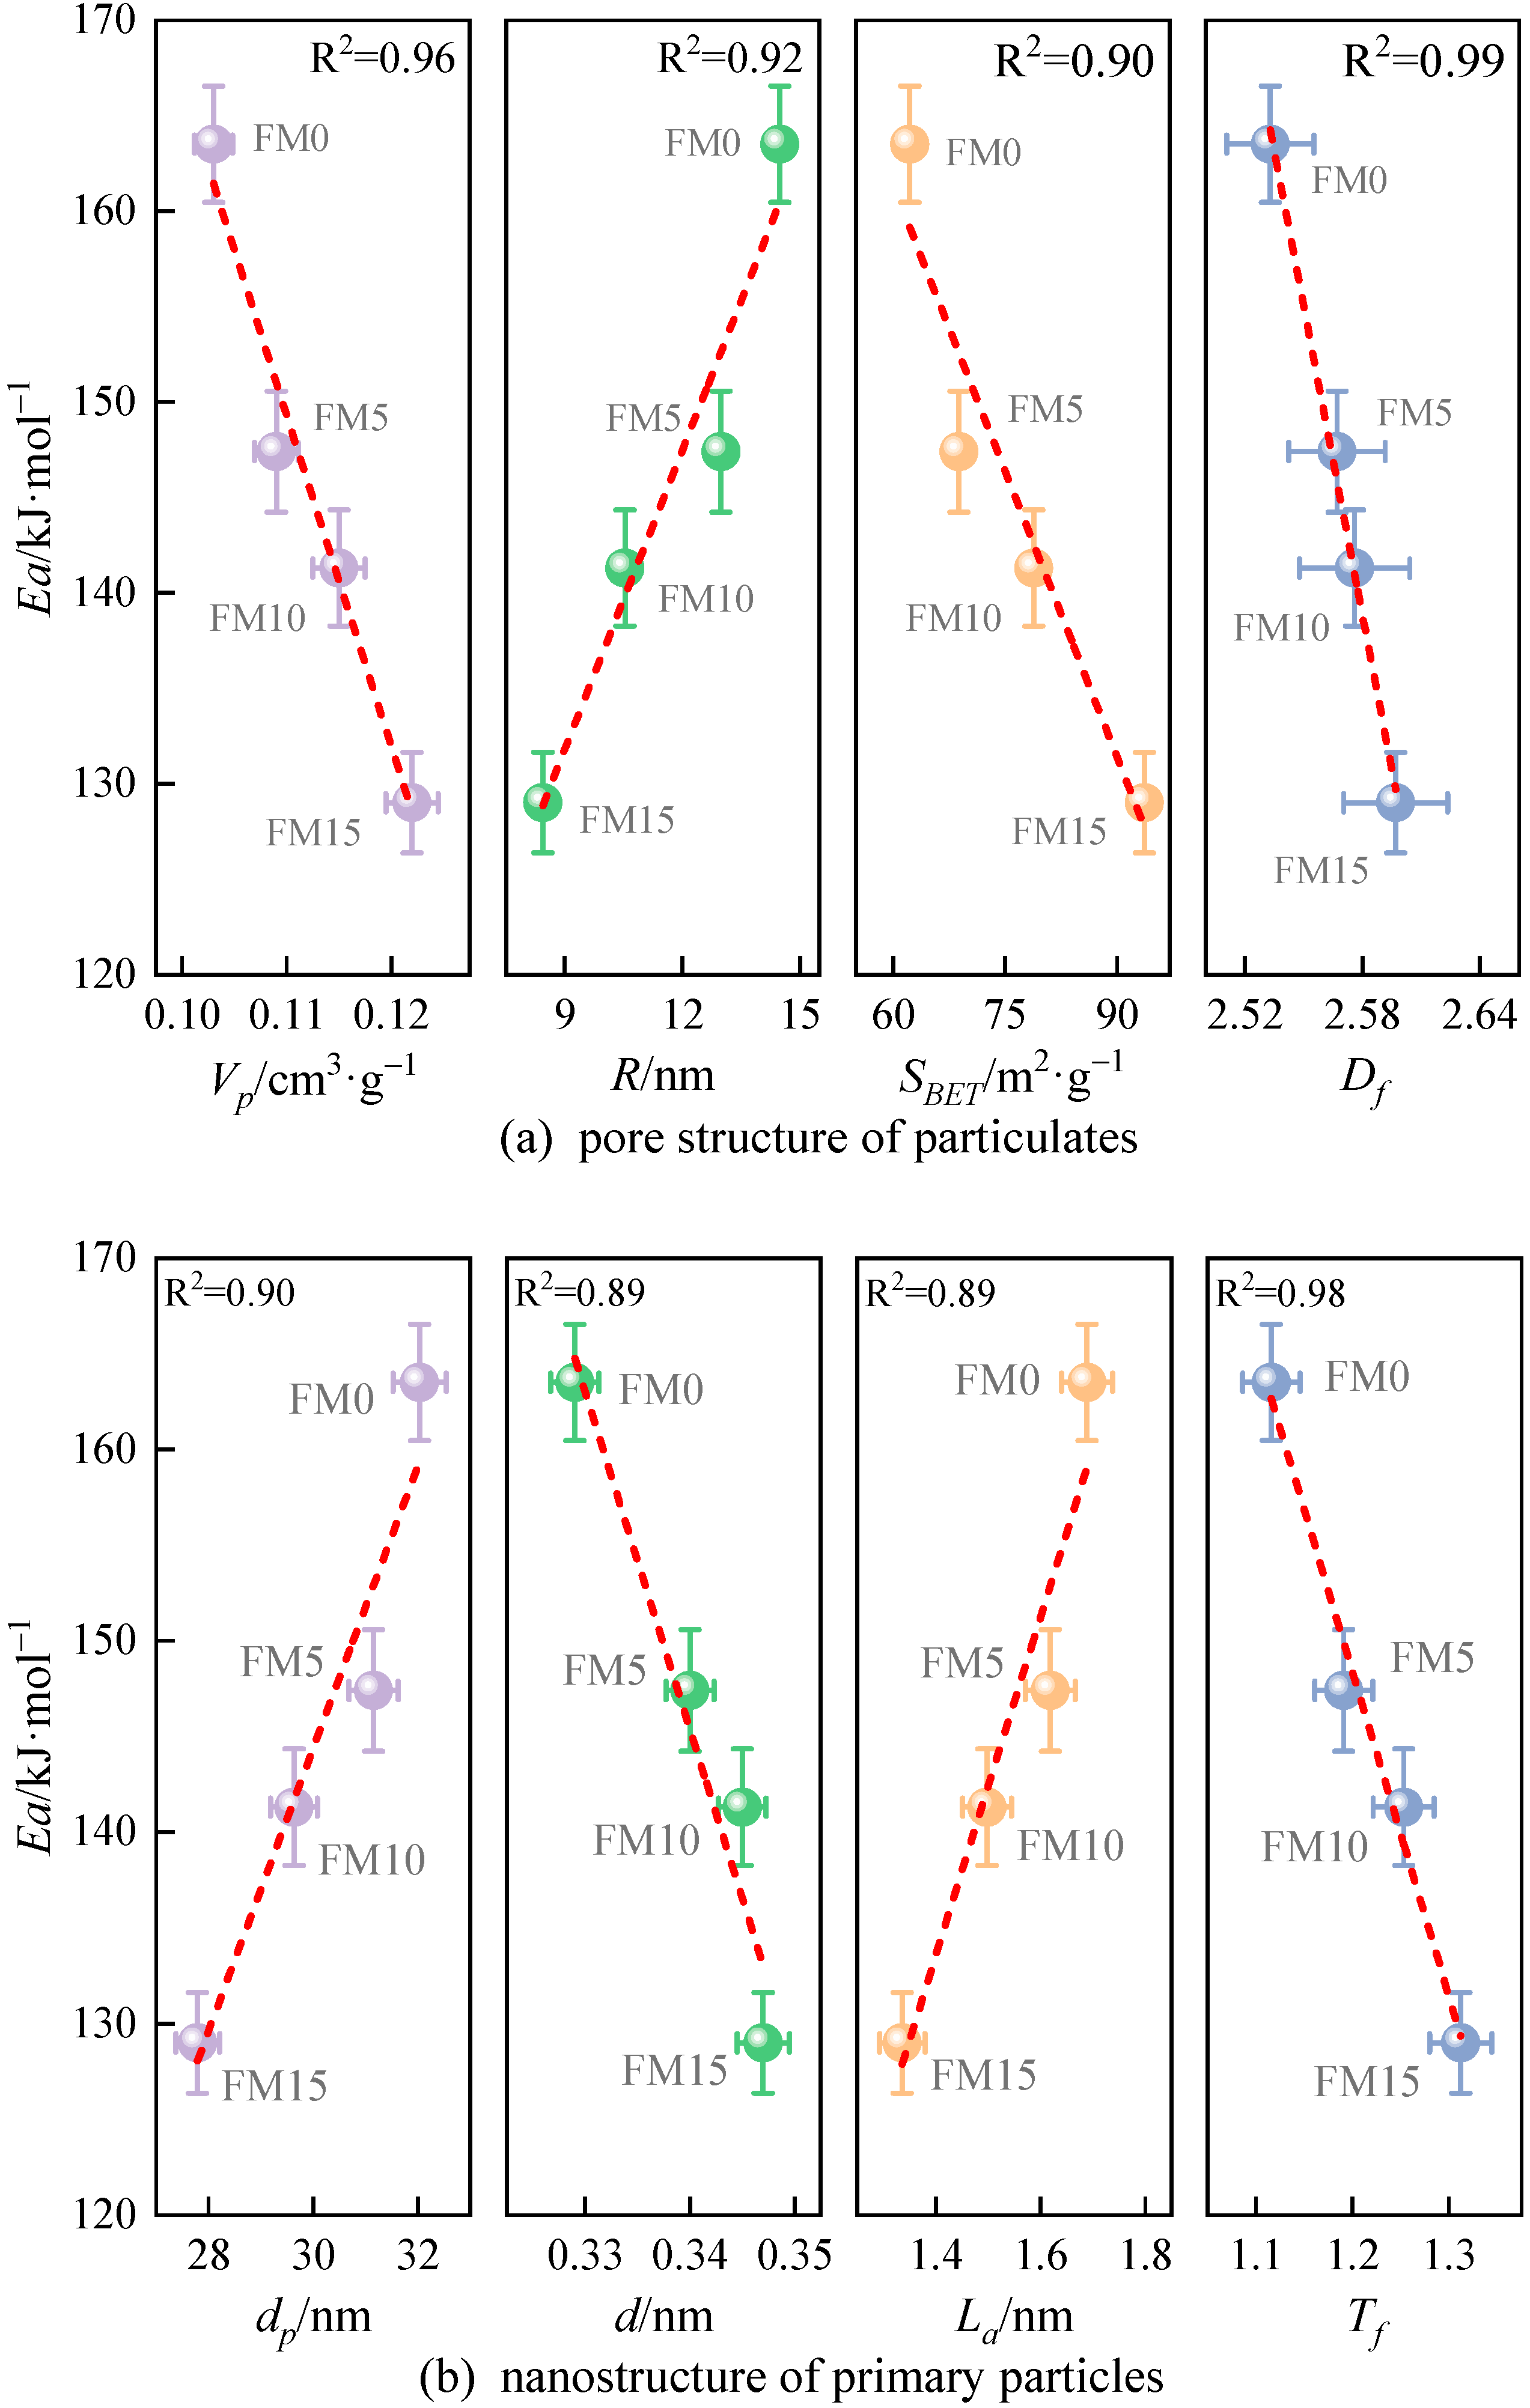
Figure 13 illustrates the correlation between nanostructure characteristic parameters and the apparent activation energy () of particulates. Obviously, there is a close correlation between them. Among the discussed eight nanostructure characteristic parameters, the linear relationship between the Ea of particulates and two characteristic parameters is the strongest, including the fringe tortuosity () and fractal dimension (), and the value of R2 obtained by linear fitting is 0.98 and 0.99, respectively. As can be seen from Figure 13a, when the of particulates is larger, the Ea of particulates is lower. In addition, when and of particulates are larger and of particulates is smaller, the oxidation reactivity of particles is weaker, which reaffirms the research results of Du et al. [20]. In Figure 13b, it is observed that particulates with a wider separation distance, shorter length of fringe, and larger tortuosity of fringe have lower and stronger oxidation reactivity. This occurs because a wider of primary particles enhances the likelihood of oxygen accessing the carbon layer edges. Given that a longer indicates a larger carbon layer surface, and considering that carbon atoms on the basal plane exhibit significantly lower oxidation reactivity compared to those at the edges, an increased number of less reactive carbon atoms contributes to greater particulate stability. A higher value indicates a greater number of odd-membered rings within the carbon layer, which leads to an increased SP2/SP3 hybridization ratio and reduced electron resonance stability, making the particles more susceptible to oxidation. Additionally, Liati et al. [41] believed that the oxidation reactivity of particulates depends on their size; the smaller primary particle diameter () is more prone to cause an oxidation reaction due to the particulate’s high specific surface area ().
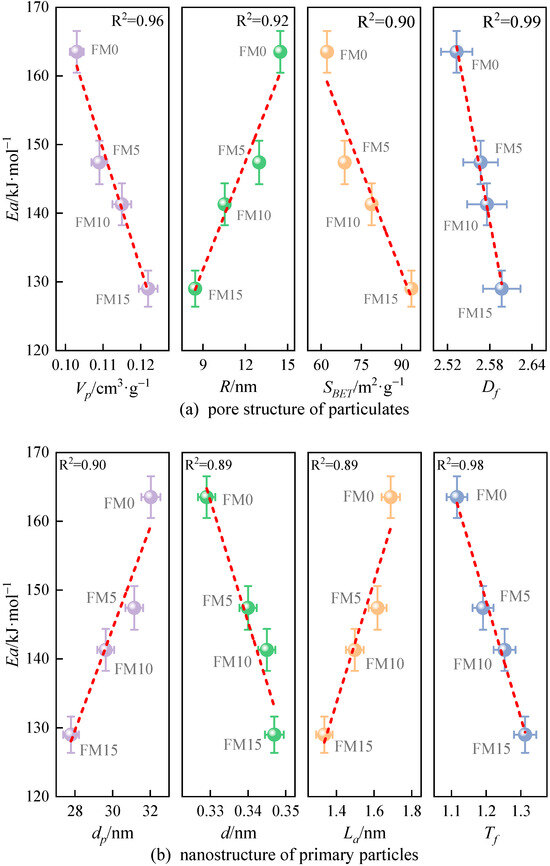
Figure 13.
The relationship between nanostructure characteristic parameters and the apparent reactive energy () of particulates (the red lines represent the result of linear fittings).
Partial least squares (PLS), combined with the variable importance in projection (PLS-VIP) criterion, has become a key method for identifying variables with the strongest associations. [42]. They can be used to evaluate the importance of the eight nanostructure parameters for oxidation reactivity of particulates, which are discussed in this study. PLS-VIP is capable of assessing the contribution of every predictor variable to the PLS model, and the threshold criterion “VIP > 1” is commonly adopted to identify significant variables. The importance of the jth predictor variable can be calculated by Equation (9) shown below:
where is the number of predictor variables, and is the kth column of and , respectively, .
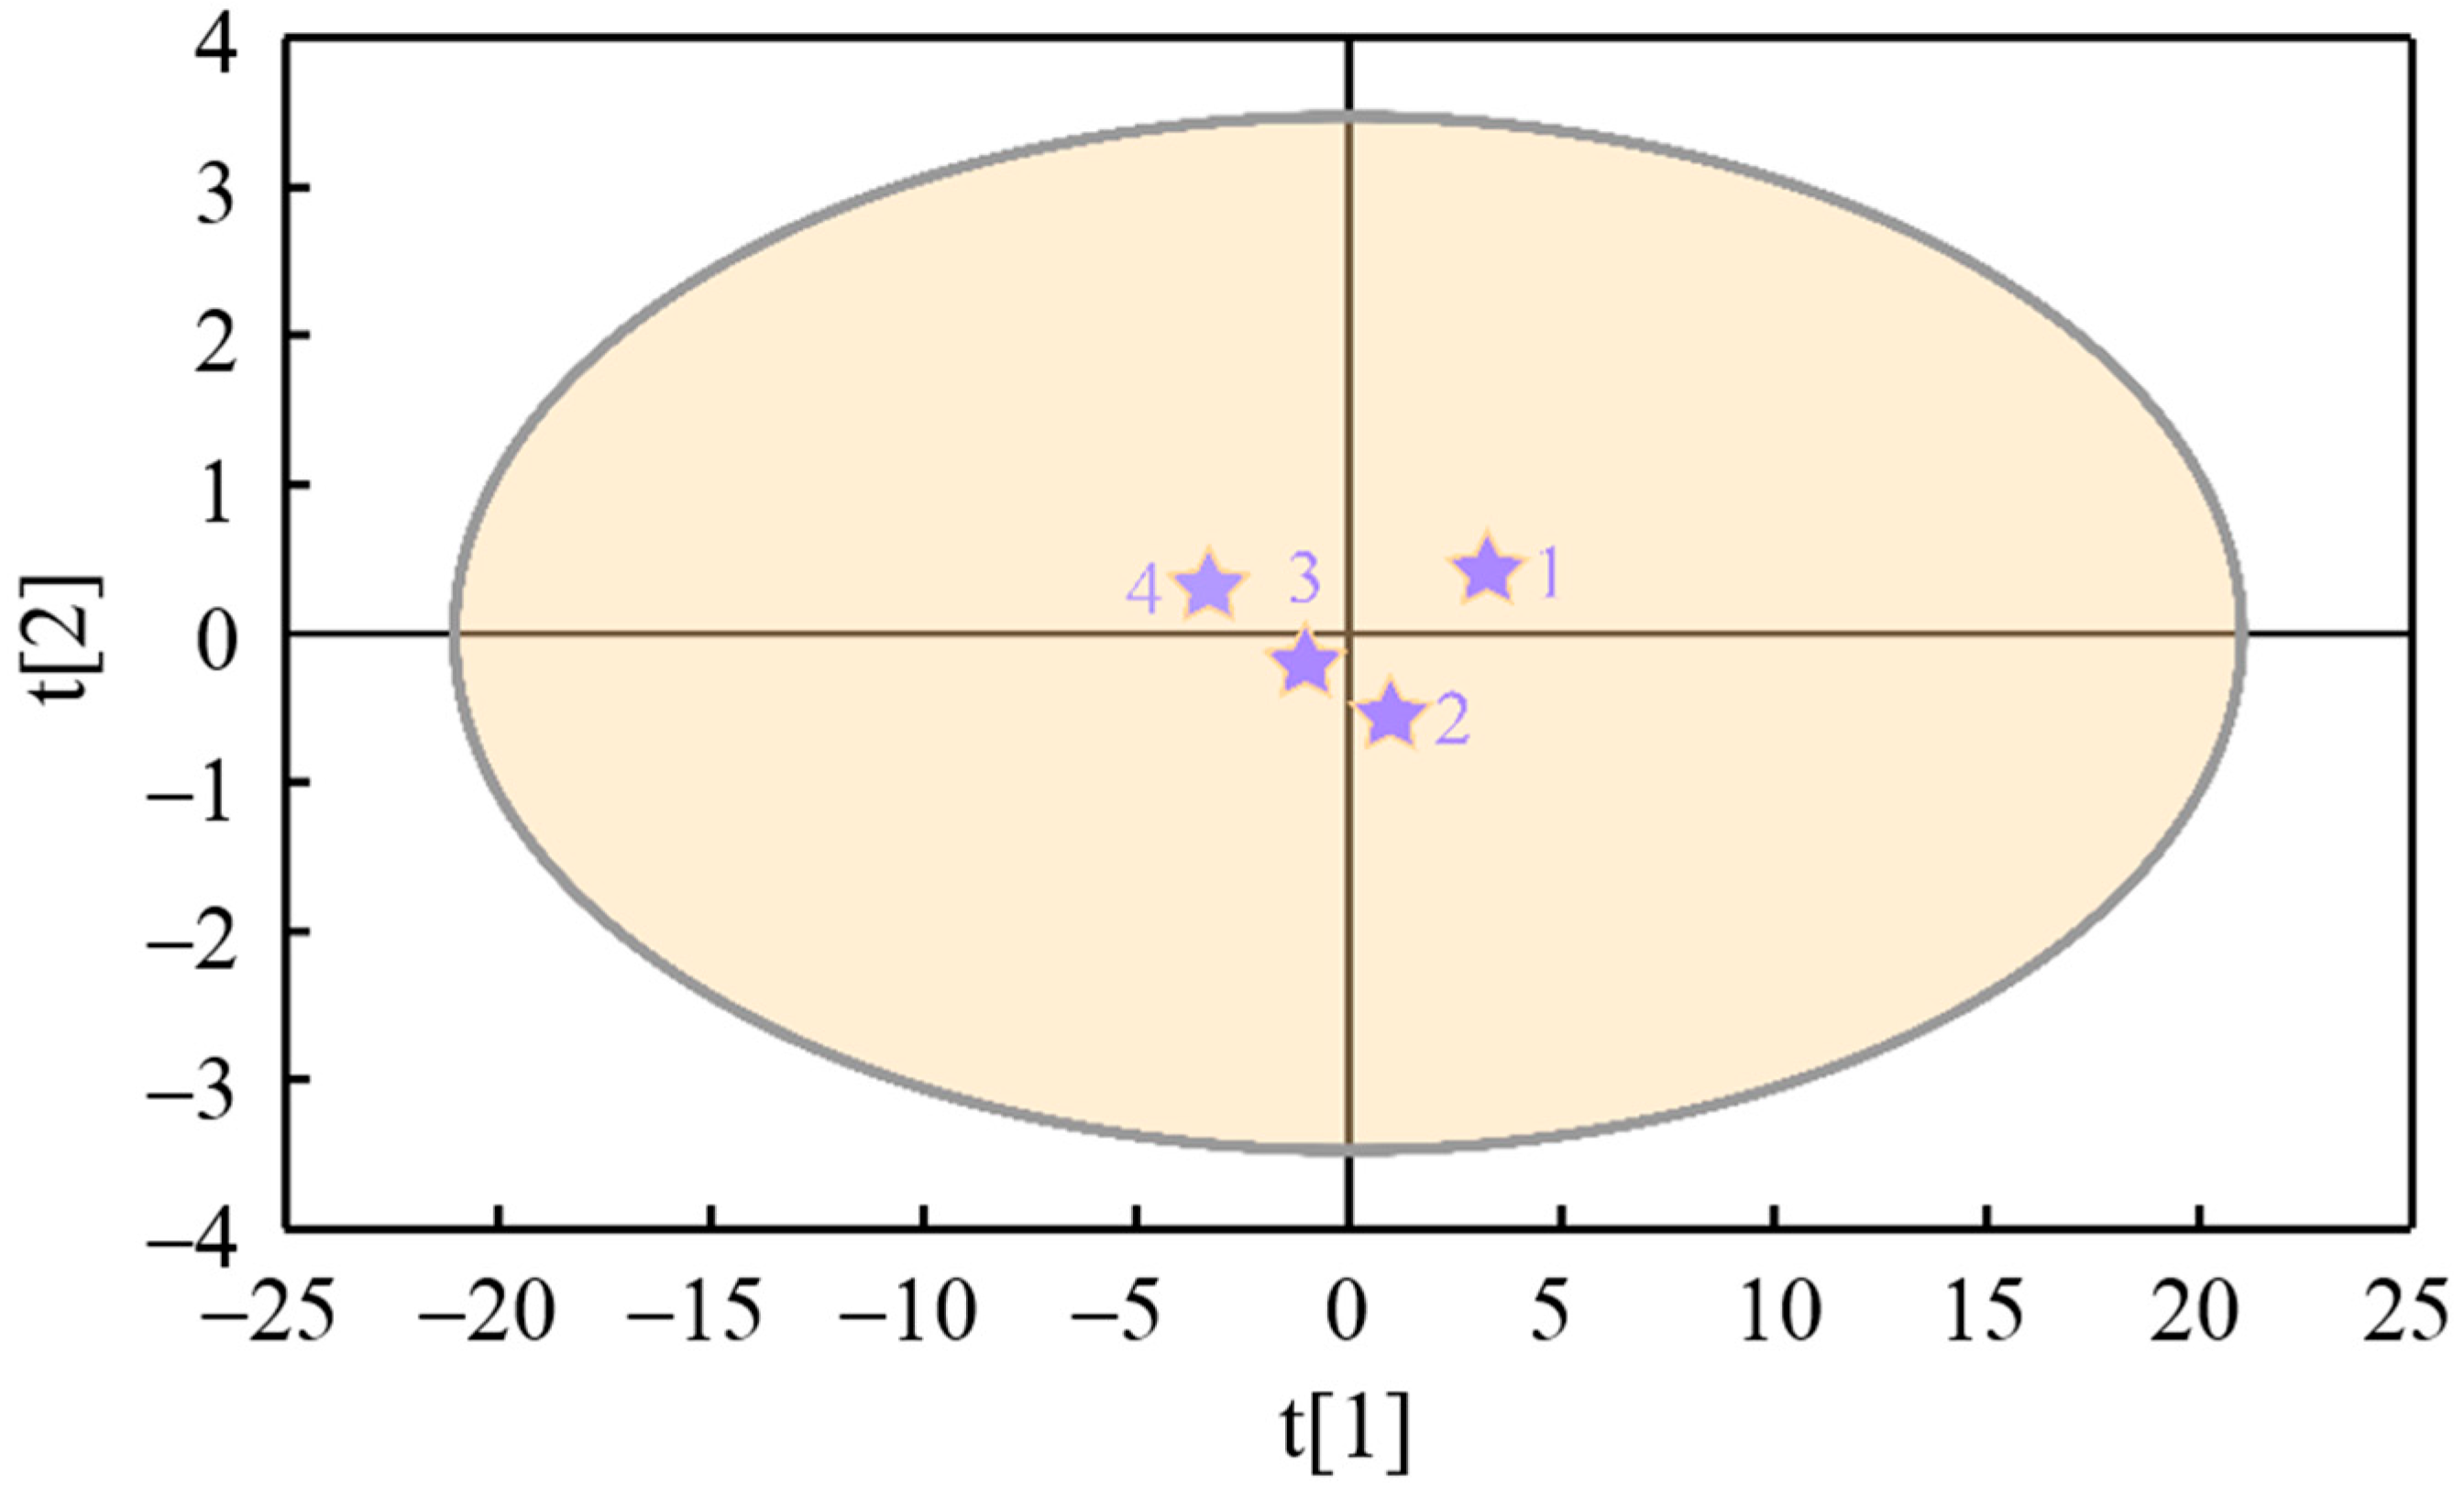
The of particulates is taken as the response variable of the PLS model and recorded as Y; the nanostructure characteristic parameters , , , , , , , and are taken as the latent variables of the model and recorded as (, , , , , , , and ). The cumulative variance contribution rate (R2) and cross-validation (Q2) are the main parameters that verify the prediction ability of the PLS model. When the number of model groups reaches two, the cumulative variance contribution rate R2X (cum) of all principal components to latent variable X equals 0.997, the cumulative variance contribution rate R2Y (cum) of that to response variable Y equals 0.992, and the cross-validity Q2 (cum) of latent variable equals 0.976, which indicates that the model has a high prediction ability. Figure 13 displays the tolerance ellipse plot of nanostructure characteristic parameters of particles (X-variables) drawn based on Hotelling’s T2, where R2X[1] is 0.969 and R2X[2] is 0.0281. The variables t[1] and t[2] represent transformed scores that capture the essential information from the X-variables, with t[1] accounting for the greatest proportion of variance in the X space, followed by t[2]. The scatter plot of t[1] against t[2] reveals potential outliers, clusters, similarities, and other underlying patterns within the dataset. It can be seen from Figure 14 that the scatters of t[1] vs. t[2] fall outside the ellipse, indicating that there is no specific point, and the model has a good fitting effect.
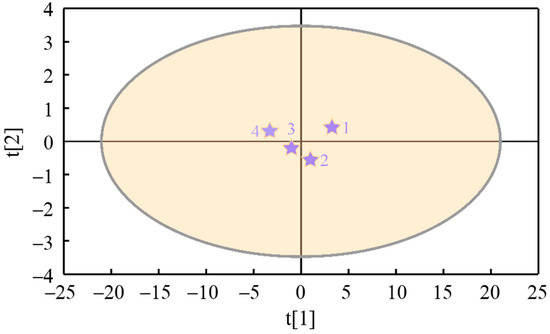
Figure 14.
The tolerance ellipse plot of nanostructure characteristic parameters of particulates (X-variables, The numbers 1, 2, 3, and 4 correspond to the samples FM0, FM5, FM10, and FM15, respectively).
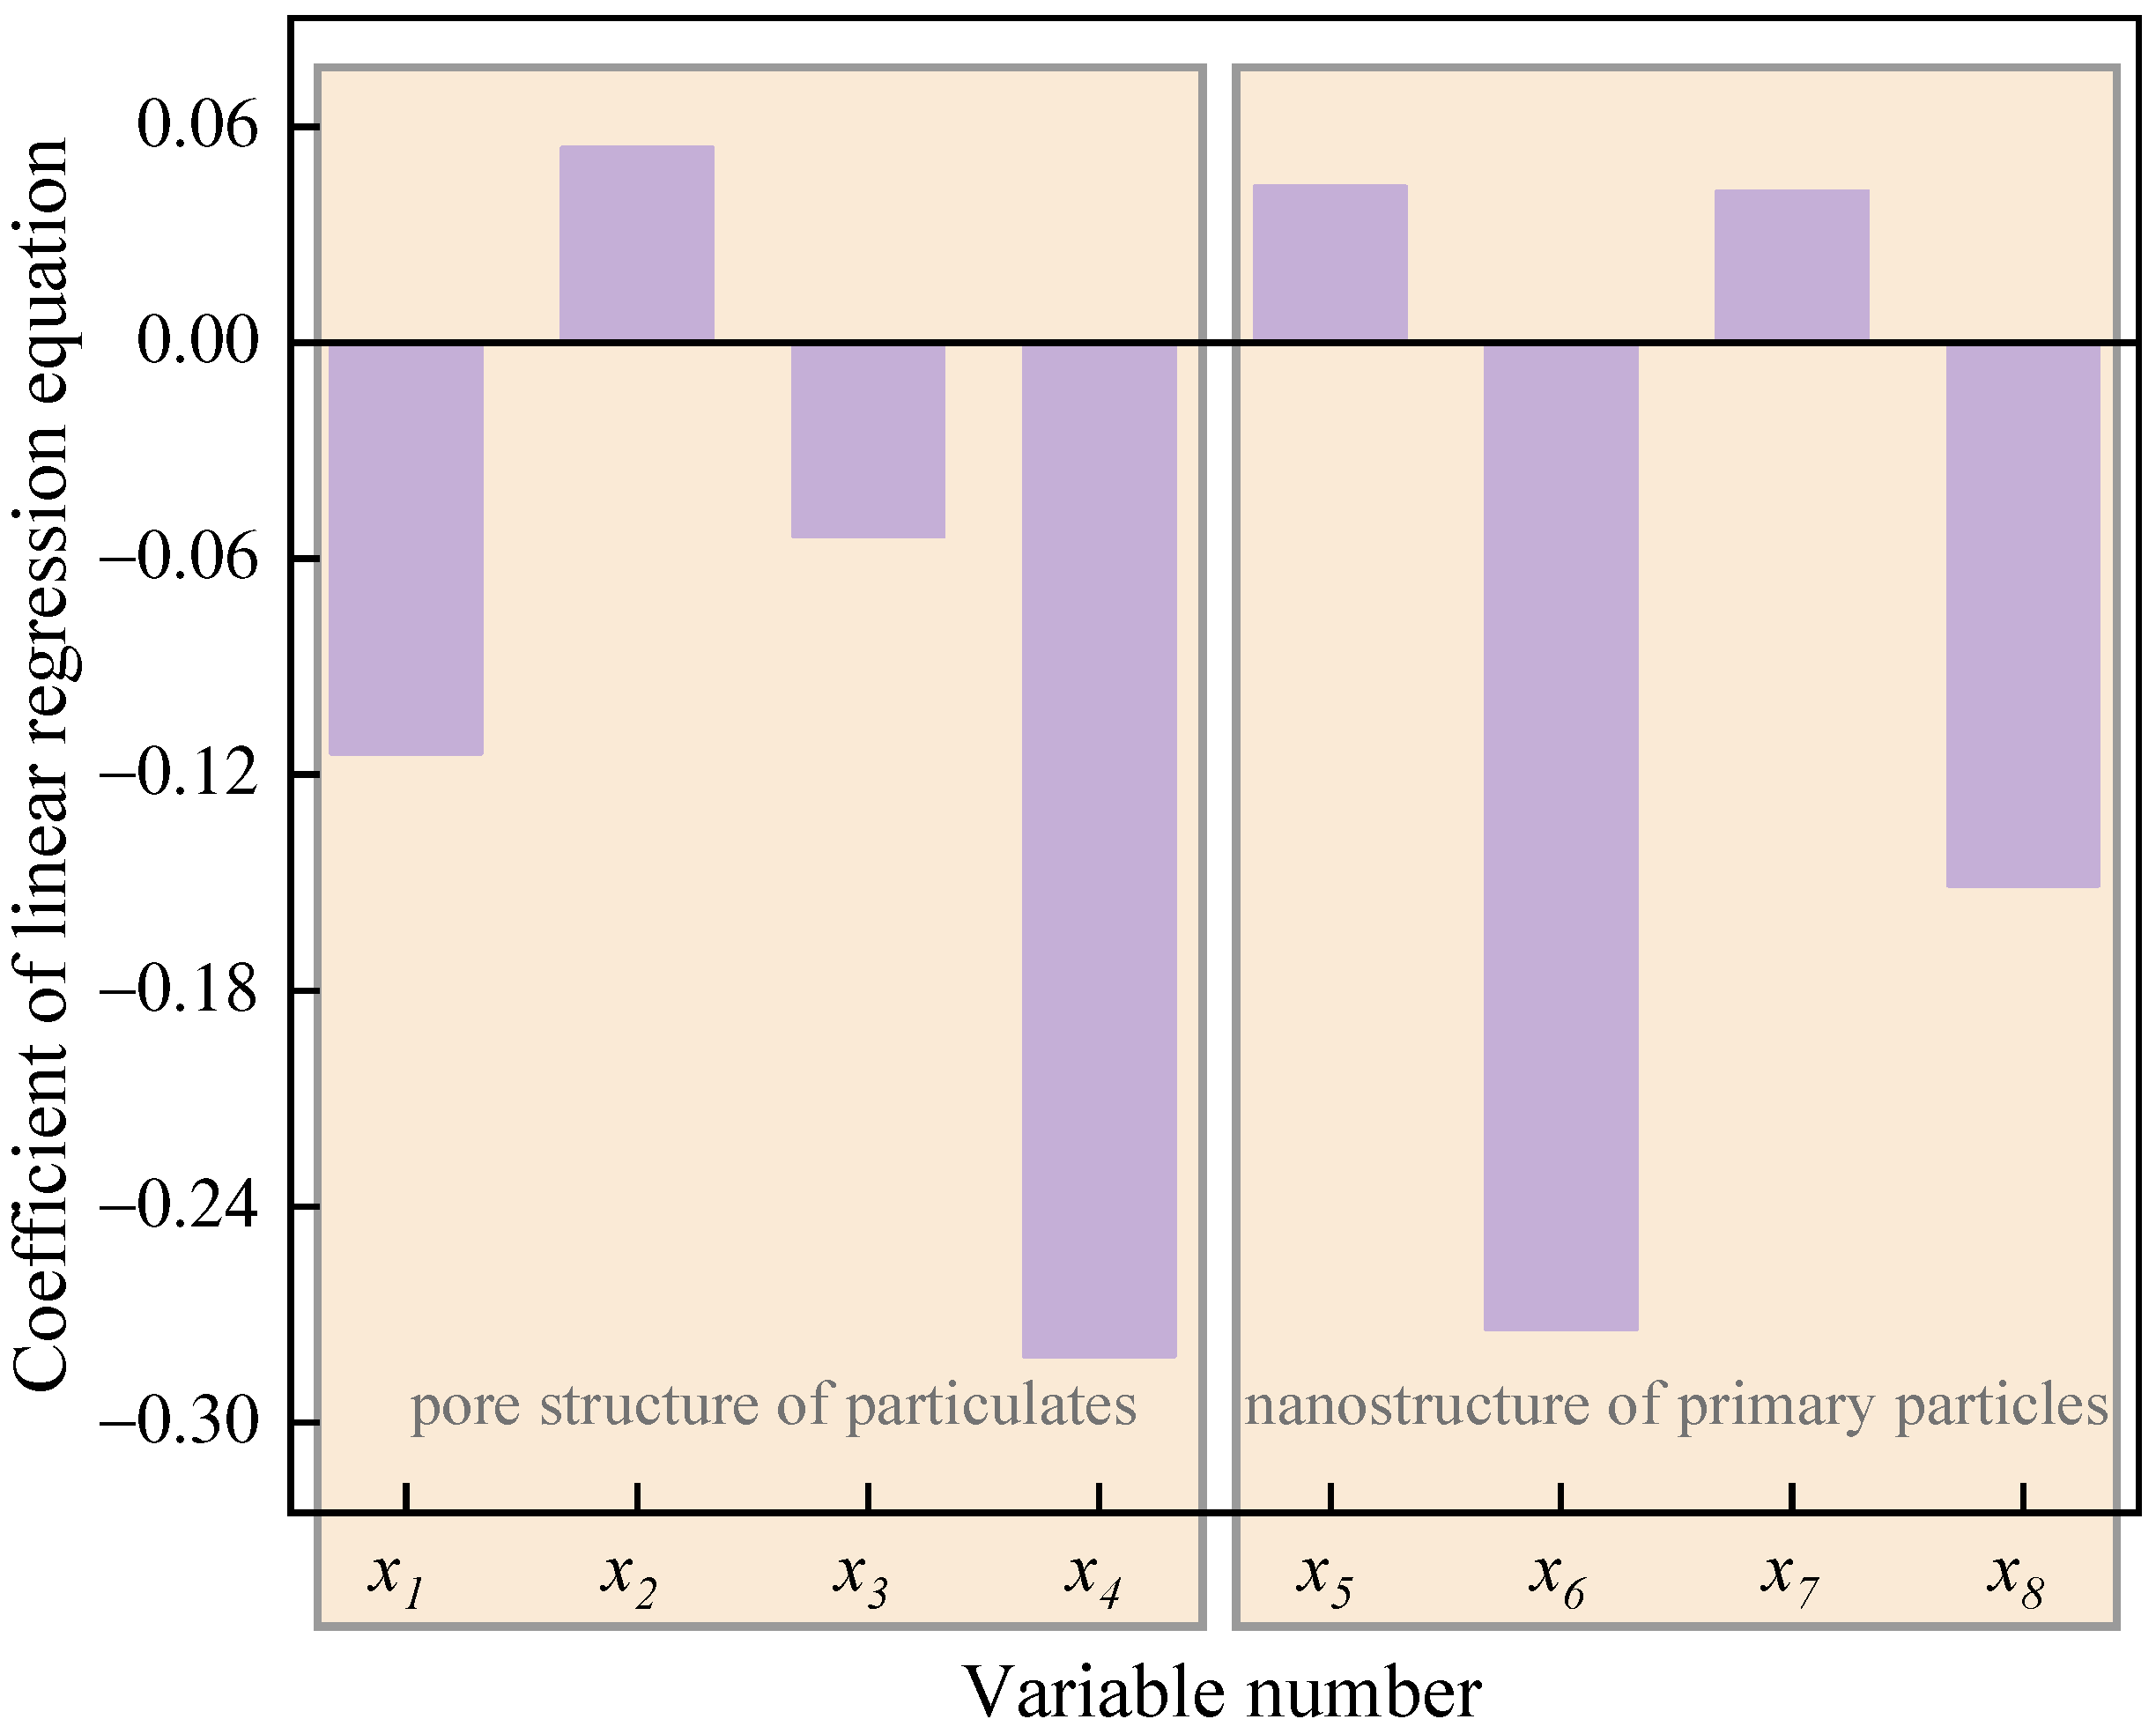
Figure 15 displays the coefficient of the linear regression equation between the apparent activation energy () and the nanostructure characteristic parameters of particulates. Consistent with the results in Figure 12, it can be seen from Figure 14 that the coefficient of the latent variables , , and is positive, while that of latent variables , , , and is negative, which means that the Ea increases with the increase in the of particulates and and of the primary particles. Moreover, when and of primary particles and , , and of particulates increase, the Ea of particles decreases. Hence, the regression equation between the (Y-variable) and the nanostructure characteristic parameters (X-variables) of particulates is as follows:
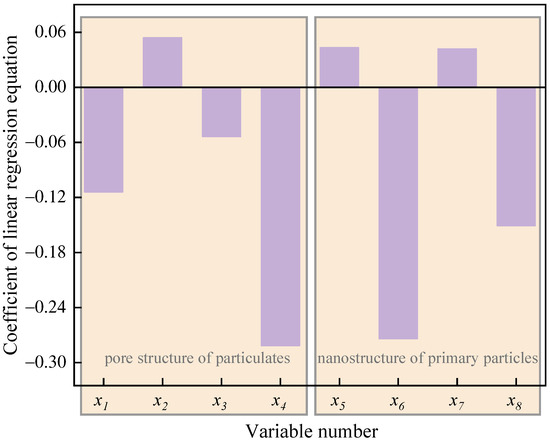
Figure 15.
The coefficient of the linear regression equation between the apparent activation energy () and the nanostructure characteristic parameters of particulates (X-variables).
Figure 16 shows the VIP of X-variables in the PLS model of particle apparent activation energy (Ea). As can be observed, the VIP of variables , , , and exceed 1, which are 1.03618, 1.01142, 1.00514, and 1.00223, indicating that the roughness () and total pore volume () of particulates, together with the tortuosity () and separation distance () of primary particles, are the chief factors affecting the oxidation reactivity of particles. In addition, the half-width of pores (), primary particle size (), the specific surface area of particulates (), and fringe length () are the secondary factors, and the influence decreases in the sequence of > > > .
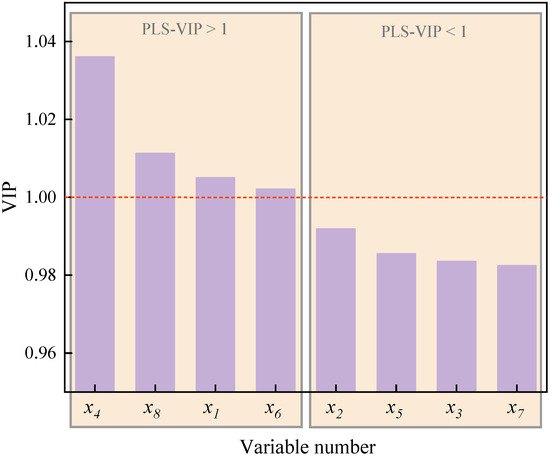
Figure 16.
The VIP of particulate nanostructure characteristic parameters (X-variables) in the PLS model of particulate apparent activation energy ().
4. Conclusions
In this study, the exhaust particulates of a diesel engine burning methanol/F-T diesel blends with different proportions were collected by bench test. The Brunauer–Emmett–Teller (BET) method, high-resolution transmission electron microscope (HRTEM), and thermogravimetric analysis (TGA) were used to discuss the characteristic parameters of nanostructure and oxidation reactivity. Partial least squares (PLS) and variable importance in the projection (PLS-VIP) theories were used to explore the relationship between nanostructure and oxidation reactivity. Based on this study, the following conclusions can be drawn.
- (1)
- There are many pore structures in particulate aggregates, with the mean half pore width () ranging from 8 to 76 nm, including two types of pores: mesopore and macropore. As the methanol mixture ratio increases, the pore structure of particulates becomes more abundant, and the roughness of particulates increases. Compared with FM0 particulates, the total pore volume () and specific surface area () of FM15 particulates increased by 18.4% and 50.5%, and the respective and fractal dimension () decreased by 41.7% and 2.5%.
- (2)
- With the increase in the methanol mixture ratio, both the fringe separation distance () and fringe tortuosity () of primary particles increase, while the fringe length () and primary particle diameter () decrease. Compared with the FM0 primary particles, the mean value of and La of FM15 primary particles decreased by 13.3% and 20.9%, and the mean and La increased by 5.5% and 15.3%. It is indicated that the blend of methanol makes the carbon structure of primary particles more disordered.
- (3)
- When the methanol mixture ratio was within 0%~15%, more methanol blended, more of the soluble organic fraction (SOF) attached to the particulates, and there were lower oxidation characteristic temperatures and apparent activation energy (). Compared with FM0 particulates, , , , and Ea of FM15 particulates decreased by 31.9%, 6.4%, 11.9% and 21.1%. The blend of methanol enhances the oxidation reactivity of particulates; that is, oxygenated coal-based fuel particulates are easier to oxidize.
- (4)
- There are two nanostructure parameters that have the strongest linear relationship with the Ea, which are the roughness of particles and the tortuosity of primary particles, with R2 equal 0.99 and 0. 98. The Ea of particulates is positively correlated with , , and , and negatively correlated with , , , , and . Among these parameters, , , , and are the chief factors affecting the oxidation reactivity of particulates, whose VIP > 1, and the others are secondary.
Author Contributions
Writing—original draft preparation, and writing—review and editing, Y.H.; methodology, conceptualization, and supervision, J.J.; project administration, and data curation, M.Z.; Investigation, J.Z.; funding acquisition, and formal analysis, R.L.; visu-alization, and resources, S.L. All authors have read and agreed to the published version of the manuscript.
Funding
This study was financially supported by the national natural science foundation of China under grant (52406138), the project of natural science foundation of Jiangsu province (BK20200910), the open project of state key laboratory of internal combustion engine combustion, Tianjin university (K2020-12), the natural science research projects in Jiangsu higher education institutions (20KJB470015), and the provincial engineering research center for new energy vehicle intelligent control and simulation test technology of Sichuan (XNYQ2021-003).
Data Availability Statement
The original contributions presented in this study are included in the article. Further inquiries can be directed to the corresponding author.
Conflicts of Interest
Author Ruina Li was employed by the Jiangsu University and was worked as a researcher at the Zhejiang Constant Power Machinery Co., Ltd. The remaining authors declare that the research was conducted in the absence of any commercial or financial relationships that could be construed as a potential conflict of interest.
Nomenclature
| F-T | Fischer–Tropsch |
| HRTEM | high-resolution transmission electron microscope |
| BET | Brunauer–Emmett–Teller |
| TGA | thermal gravimetric analysis |
| PLS | partial least squares |
| PLS-VIP | variable importance in the projection |
| dp | primary particle diameter |
| La | length of fringe |
| d | distance between adjacent layer planes |
| Tf | tortuosity of fringe |
| Vp | total pore volume |
| R | half pore width |
| SBET | specific surface area |
| Df | fractal dimension |
| DFT | density functional theory |
| FHH | Frenkel–Halsey–Hill |
| TG | mass loss |
| DTG | mass loss rate |
| DPF | diesel particulate filter |
| Ea | apparent activation energy |
| TEM | transmission electron microscope |
| SOF | soluble organic fraction |
| Ti | temperature associated with 10% decrease in particulate |
| Tmax | temperature at which particulate conversion reaches peak |
| Tb | temperature at which particulates experience 95% reduction in mass |
References
- Johnson, J.W.; Berlowitz, P.J.; Ryan, D.F.; Wittenbrink, R.J.; Genetti, W.B.; Ansell, L.L.; Kwon, Y.; Rickeard, D.J. Emissions from Fischer-Tropsch diesel fuels. SAE Trans. 2001, 110, 1675–1685. [Google Scholar]
- Alfredas, R.; Justas, Ž.; Paulius, R.; Paulius, S. Research on the combustion, energy and emission parameters of diesel fuel and a biomass-to-liquid (BTL) fuel blend in a compression-ignition engine. Energy Convers. Manag. 2015, 106, 1109–1117. [Google Scholar]
- Hao, B.; Song, C.L.; Lv, G.; Li, B.; Liu, X.F.; Wang, K.; Liu, Y.W. Evaluation of the reduction in carbonyl emissions from a diesel engine using Fischer–Tropsch fuel synthesized from coal. Fuel 2014, 133, 115–122. [Google Scholar] [CrossRef]
- Maurya, R.K.; Agarwal, A.K. Experimental investigations of performance, combustion and emission characteristics of ethanol and methanol fueled HCCI engine. Fuel Process. Technol. 2014, 126, 30–48. [Google Scholar] [CrossRef]
- Chao, M.R.; Lin, T.C.; Chao, H.R.; Chang, F.H.; Chen, C.B. Effects of methanol-containing additive on emission characteristics from a heavy-duty diesel engine. Sci. Total Environ. 2001, 279, 167–179. [Google Scholar] [CrossRef]
- Hua, Y.; Liu, S.; Li, R.N.; Mei, L. Experimental study of regulated and unregulated emissions from a diesel engine using coal-based fuels. Fuel 2020, 280, 118658. [Google Scholar] [CrossRef]
- Chen, H.; He, J.J.; Zhong, X.L. Engine combustion and emission fuelled with natural gas: A review. J. Energy Inst. 2019, 92, 1123–1136. [Google Scholar] [CrossRef]
- Gao, J.; Tian, G.; Sorniotti, A.; Karci, A.E.; Palo, R.D. Review of thermal management of catalytic converters to decrease engine emissions during cold start and warm up. Appl. Therm. Eng. 2019, 147, 177–187. [Google Scholar] [CrossRef]
- Savic, N.; Rahman, M.M.; Miljevic, B.; Saathoff, H.; Naumann, K.H.; Leisner, T.; Riches, J.; Gupta, B.; Motta, N.; Ristovski, Z.D. Influence of biodiesel fuel composition on the morphology and microstructure of particles emitted from diesel engines. Carbon 2016, 104, 179–189. [Google Scholar] [CrossRef]
- Rose, K.; Hamje, H.; Jansen, L.; Fittavolini, C.; Clark, R.; Almena, M.D.C.; Katsaounis, D.; Samaras, C.; Geivanidis, S.; Samaras, Z. Impact of FAME content on the regeneration frequency of diesel particulate filters (DPFs). SAE Int. J. Fuels Lubr. 2014, 7, 563–570. [Google Scholar] [CrossRef][Green Version]
- Man, X.J.; Cheung, C.S.; Ning, Z.; Yung, F. Effect of Waste Cooking Oil Biodiesel on the Properties of Particulate from a DI Diesel Engine. Aerosol Sci. Technol. 2015, 49, 199–209. [Google Scholar] [CrossRef]
- Verma, P.; Pickering, E.; Jafari, M.; Guo, Y.; Stevanovic, S.; Fernando, J.F.S.; Golberg, D.; Brooks, P.; Brown, R.; Ristovski, Z. Influence of Fuel-Oxygen Content on Morphology and Nanostructure of Soot Particles. Combust. Flame 2019, 205, 206–219. [Google Scholar] [CrossRef]
- Wei, J.J.; Fan, C.Y.; Qiu, L.; Qian, Y.J.; Wang, C.F.; Teng, Q.; Pan, M.Z. Impact of Methanol Alternative Fuel on Oxidation Reactivity of Soot Emissions from a Modern CI Engine. Fuel 2020, 268, 117352. [Google Scholar] [CrossRef]
- Kim, Y.H.; Kim, Y.T.; Kim, S.H.; Lee, D. Catalytic oxidation kinetics of iron-containing carbon particles generated by spraying ferrocene-mixed with diesel fuel into a hydrogen–air diffusion flame. Carbon 2010, 48, 2072–2084. [Google Scholar] [CrossRef]
- Zhang, W.; Song, C.L.; Lv, G.; Bi, F.R.; Wang, T.; Liu, Y.; Qiao, Y.H. Petroleum and Fischer–Tropsch Diesel Soot: A Comparison of Morphology, Nanostructure and Oxidation Reactivity. Fuel 2021, 283, 118919. [Google Scholar] [CrossRef]
- Wang, X.C.; Wang, Y.; Bai, Y.Q. Oxidation Behaviors and Nanostructure of Particulate Matter Produced from a Diesel Engine Fueled with N-Pentanol and 2-Ethylhexyl Nitrate Additives. Fuel 2021, 288, 119844. [Google Scholar] [CrossRef]
- Arora, P.; Verma, P.; Zare, A.; Zare, A.; Lodi, F.; Jafari, M.; Stevanovic, S.; Bodisco, T.A.; Brown, R.J.; Ristovski, Z. Morphology and nanostructure of soot particles from diesel engine under transient and steady-state operating conditions with a microalgae fuel component, dioctyl phthalate biofuel. Sustain. Energy Technol. 2023, 60, 103504. [Google Scholar] [CrossRef]
- Verma, P.; Jafari, M.; Rahman, S.M.A.; Pickering, E.; Stevanovic, S.; Dowell, A.; Brown, R.; Ristovski, Z. The impact of chemical composition of oxygenated fuels on morphology and nanostructure of soot particles. Fuel 2020, 259, 116167. [Google Scholar] [CrossRef]
- Wei, J.J.; Lu, W.J.; Pan, M.Z.; Liu, Y.Q.; Cheng, X.Z.; Wang, C. Physical properties of exhaust soot from dimethyl carbonate-diesel blends: Characterizations and impact on soot oxidation behavior. Fuel 2020, 279, 118441. [Google Scholar] [CrossRef]
- Du, J.Y.; Su, L.; Zhang, D.P.; Jia, C.K.; Yuan, Y.N. Experimental investigation into the pore structure and oxidation activity of biodiesel soot. Fuel 2022, 310, 122316. [Google Scholar] [CrossRef]
- Chen, L.F.; Hu, X.H.; Wang, J.; Yu, Y.X. Impacts of Alternative Fuels on Morphological and Nanostructural Characteristics of Soot Emissions from an Aviation Piston Engine. Environ. Sci. Technol. 2019, 53, 4667–4674. [Google Scholar] [CrossRef]
- Liang, X.Y.; Lv, X.; Wang, Y.J.; He, L.J.; Wang, Y.S.; Fu, K.X.; Liu, Q.L.; Wang, K. Experimental investigation of diesel soot oxidation reactivity along the exhaust after-treatment system components. Fuel 2021, 302, 121047. [Google Scholar] [CrossRef]
- Atkinson, C.M.; Thompson, G.J.; Traver, M.L.; Nigel, N.C. In-Cylinder combustion pressure characteristics of Fischer-Tropsch and conventional diesel fuels in a heavy duty CI engine. SAE Int. 1999, 1, 1472–1497. [Google Scholar]
- McMillian, M.H.; Gautam, M. Combustion and emission characteristics of FischerTropsch and standard diesel fuel in a single-cylinder diesel engine. SAE Trans. 2001, 110, 1659–1674. [Google Scholar]
- Bayraktar, H. An experimental study on the performance parameters of an experimental CI engine fueled with diesel–methanol–dodecanol blends. Fuel 2008, 87, 158–164. [Google Scholar] [CrossRef]
- Murayama, T.; Miyamoto, N.; Yamada, T.; Kawashima, J. A method to improve the solubility and combustion characteristics of alcohol-diesel fuel blends. SAE Trans. 1982, 91, 3485–3494. [Google Scholar]
- Benjumea, P.; Agudelo, J.; Agudelo, A. Basic properties of palm oil biodiesel–diesel blends. Fuel 2008, 87, 2069–2075. [Google Scholar] [CrossRef]
- Khovakh, M. Motor Vehicle Engines; MIR Publishers: Moscow, Russia, 1979. [Google Scholar]
- Hua, Y.; Wang, Z.; Li, R.N.; Liu, S.; Zhao, Y.; Qu, L.; Mei, D.Q.; Lv, H. Experimental study on morphology, nanostructure and oxidation reactivity of particles in diesel engine with exhaust gas recirculation (EGR) burned with different alternative fuels. Energy 2022, 261, 125249. [Google Scholar] [CrossRef]
- Liu, J.H.; Wu, P.C.; Sun, P.; Ji, Q.; Zhang, Q.; Wang, P. Effects of iron-based fuel borne catalyst addition on combustion, in-cylinder soot distribution and exhaust emission characteristics in a common-rail diesel engine. Fuel 2021, 290, 120096. [Google Scholar] [CrossRef]
- Rahman, M.M.; Muttakin, M.; Pal, A.; Shafiullah, A.Z.; Saha, B.B. A Statistical Approach to Determine Optimal Models for IUPAC-Classified Adsorption Isotherms. Energies 2019, 12, 4565. [Google Scholar] [CrossRef]
- Olivier, J.P. Modeling physical adsorption on porous and nonporous solids using density functional theory. J. Porous Mater. 1995, 2, 9–17. [Google Scholar] [CrossRef]
- Jaramillo, I.C.; Gaddam, C.K.; Wal, R.L.V.; Huang, C.H.; Levinthal, J.D.; Lighty, J.S. Soot oxidation kinetics under pressurized conditions. Combust. Flame 2014, 161, 2951–2965. [Google Scholar] [CrossRef]
- Agudelo, J.R.; Alvarez, A.; Armas, O. Impact of crude vegetable oils on the oxidation reactivity and nanostructure of diesel particulate matter. Combust. Flame 2014, 161, 2904–2915. [Google Scholar] [CrossRef]
- Qu, L.; Wang, Z.; Zhang, J. Influence of waste cooking oil biodiesel on oxidation reactivity and nanostructure of particulate matter from diesel engine. Fuel 2016, 181, 389–395. [Google Scholar] [CrossRef]
- Muttakin, M.; Mitra, S.; Thu, K.; Kazuhide, I. Theoretical framework to evaluate minimum desorption temperature for IUPAC classified adsorption isotherms. Int. J. Heat Mass Trans. 2018, 122, 795–805. [Google Scholar] [CrossRef]
- Horikawa, T.; Do, D.D.; Nicholson, D. Capillary condensation of adsorbates in porous materials. Adv. Colloid Interface 2011, 169, 40–58. [Google Scholar] [CrossRef] [PubMed]
- Fan, C.Y.; Zeng, Y.H.; Do, D.D.; Nicholson, D. A molecular simulation study of adsorption and desorption in closed end slit pores: Is there a hysteresis loop? Chem. Eng. Sci. 2015, 121, 313–321. [Google Scholar] [CrossRef][Green Version]
- Li, Z.; Song, C.L.; Song, J.O.; Lv, G.; Dong, S.R.; Zhao, Z. Evolution of the nanostructure, fractal dimension and size of in-cylinder soot during diesel combustion process. Combust. Flame 2011, 158, 1624–1630. [Google Scholar] [CrossRef]
- Wal, R.L.V.; Tomasek, A.J.; Pamphlet, M.I.; Taylor, C.D.; Thompson, W.K. Analysis of HRTEM images for carbon nanostructure quantification. J. Nanopart. Res. 2004, 6, 555–568. [Google Scholar]
- Liati, A.; Eggenschwiler, P.D.; Gubler, E.M.; Schreiber, D.; Aguirre, M. Microscopic investigation of soot and ash particulate matter derived from biofuel and diesel: Implications for the reactivity of soot. Atmos. Environ. 2012, 49, 391–402. [Google Scholar] [CrossRef]
- Afanador, N.L.; Tran, T.N.; Buydens, L.M.C. An assessment of the jackknife and bootstrap procedures on uncertainty estimation in the variable importance in the projection metric. Chemom. Intell. Lab. 2014, 137, 162–172. [Google Scholar] [CrossRef]
Disclaimer/Publisher’s Note: The statements, opinions and data contained in all publications are solely those of the individual author(s) and contributor(s) and not of MDPI and/or the editor(s). MDPI and/or the editor(s) disclaim responsibility for any injury to people or property resulting from any ideas, methods, instructions or products referred to in the content. |
© 2025 by the authors. Licensee MDPI, Basel, Switzerland. This article is an open access article distributed under the terms and conditions of the Creative Commons Attribution (CC BY) license (https://creativecommons.org/licenses/by/4.0/).

