Article

An Adaptive Fairness-Based PV Curtailment Strategy: Simulation and Experimental Validation

by
Francis Maina Itote
1,*,
Ryuto Shigenobu
2,
Akiko Takahashi
3,
Masakazu Ito
2 and
Ghjuvan Antone Faggianelli
4
1
Advanced Interdisciplinary Science and Technology, Graduate School of Engineering, University of Fukui, Fukui 910-8507, Japan
2
Department of Electrical and Electronics Engineering, Faculty of Engineering, University of Fukui, Fukui 910-8507, Japan
3
Faculty of Basic and Generic Researches, University of Fukui, Fukui 910-8507, Japan
4
Science for Environment Laboratory, CNRS UMR SPE 6134, University of Corsica, 20000 Ajaccio, France
*
Author to whom correspondence should be addressed.
Energies 2025, 18(21), 5676; https://doi.org/10.3390/en18215676
Submission received: 2 October 2025 / Revised: 27 October 2025 / Accepted: 28 October 2025 / Published: 29 October 2025

Abstract

The rapid growth of PV generation in the distribution grid has necessitated PV curtailment to prevent overvoltage violations, and this has raised fairness issues as some are curtailed disproportionately to others. This paper proposes an adaptive PV curtailment scheme that balances fairness with energy sales using a Curtailment Index (CI) employed to reallocate curtailed energy between PV systems. The CI-based approach dynamically adapts each inverter’s output in real time to provide voltage compliance while ensuring that no individual PV system experiences an overburden of curtailment. The method is evaluated through MATLAB simulations on a three-PV test distribution network and validated experimentally on the PAGLIA ORBA solar microgrid, where its performance is compared to equal-curtailment and unfair strategies. The findings indicate that the adaptive method helps integrate high PV penetration more equitably and efficiently, ensuring stable grid operation while minimizing financial losses for PV owners.

1. Introduction

The increasing adoption of solar photovoltaic (PV) systems into power networks is a vital response to the global need for clean and sustainable energy. Solar PV has emerged as one of the world’s leading renewable energy sources owing to among other factors technological advancements, supportive policy reforms such as Feed-in-Tariffs (FIT), and international climate agreements [1], and significant PV deployment has been implemented in countries such as China, Japan, Germany and Australia with more installations expected in the coming decade [2]. However, while the benefits of widespread PV adoption are undeniable, their high penetration levels pose technical challenges for Distribution System Operators (DSOs) in handling reverse power flows leading to voltage rise in networks and subsequent curtailment of PV energy during high solar generation [3,4,5]. Consequently, these operational challenges have motivated research into energy models aimed at mitigating the economic impact of curtailment, such as optimizing aggregator bids to minimize revenue losses [6,7].
Curtailment of PV energy, while considered effective by DSOs in managing voltage violations in distribution networks [3], may lead to significant economic losses for PV system owners due to revenue lost from unsold electricity [8,9]. These losses can reduce the financial viability of solar investments thereby eroding investor confidence in deploying new solar projects which can hinder the adoption of PV systems [10,11]. To address the economic effects of curtailment, various countries have developed policies and measures that require utilities to compensate for curtailed energy [12,13,14]. While compensation for curtailed energy can help to alleviate immediate economic losses for PV system owners, it does not solve the underlying technical issues that cause curtailment. Given these limitations approaches that will address technical challenges such as grid congestion and bus voltage violations need to be developed.
To minimize PV curtailment, authors have proposed various strategies. To begin with, enhancing grid infrastructure through substation and transmission lines upgrades, as well as introducing smart grid technologies, can manage reverse power flows; however, these upgrades are costly and may encounter regulatory delays [15,16,17,18]. Energy storage options, such as batteries, can store extra PV energy during high generation periods for later usage when demand is high; however, their high costs and limited durability present economic challenges [19,20]. Additionally, demand response programs, which incentivize consumers to adjust their energy usage to match periods of high renewable generation, can assist balance supply and demand but require effective consumer engagement and participation [21,22]. Therefore, although there exist various strategies to reduce PV curtailment, each approach involves considerable financial, technical, and regulatory challenges.
In addition to these broader strategies, specific curtailment methods are employed in distribution networks. These include utilization of inverters with droop control functions, which mitigate overvoltage through active and reactive power adjustments [23,24,25], and fixed export limits that cap the amount of power PV systems can inject into the grid [25,26]. These methods, while being effective in preventing overvoltage, have notable drawbacks. Fixed export limits often result to significant curtailment in robust networks [27,28], whereas inverter droop control operations mostly affect PV systems connected to downstream buses in radial networks due to their higher voltage sensitivity [29,30,31]. This imbalance creates fairness issues among PV owners and alternative solutions that address both grid operational requirements of DSOs and economic benefits for PV systems installed within their networks.
In response to these fairness concerns, recent research has incorporated fairness into PV curtailment strategies. For instance, Liu et al. [3] examined fairness of residential curtailment schemes, and Stringer et al. [4] performed data-driven analysis of consumer outcomes under different curtailment policies. More recently, Mukherjee et al. [32] studied several fairness schemes (proportional, egalitarian, financial) for active-power curtailment, demonstrating improved equity without large efficiency loss. These works show that fairness metrics (e.g., Jain’s index) can guide curtailment allocation. Building on these studies, our previous research [33] proposed a balanced energy sale method utilizing a curtailment index to redistribute curtailed energy across distribution buses considering network voltage constraints and fairness. This method showed favorable simulation results, improving fairness in curtailment and energy sales for downstream bus PV connections; however, the study had several limitations. The results were derived from simulations using specific models and datasets that may not adequately capture the complexities in real-world scenarios. The proposed method was evaluated under static conditions of uniform and variable power generation without fully exploring the impacts of real-time dynamic conditions such as sudden changes in load or generation. Furthermore, the findings lacked experimental validation which reduced their applicability to practical systems.
Building on the above, the present paper makes an incremental but important step forward. It improves on earlier work by operationalizing the curtailment index into a dynamic control parameter, where it is recalculated iteratively in real-time and embedded within a feedback loop that directly adjusts inverter outputs. This shift enables the proposed strategy to respond to dynamic variations in load and generation. The proposed method offers real-time adaptability and a balance between curtailment fairness and energy yield. However, this comes with the disadvantage of added communication and control complexity compared to simpler, non-adaptive methods like fixed export limits. Unlike static or equal-curtailment schemes, this adaptive CI-based strategy can improve sold energy without significantly sacrificing fairness. Compared with fixed export limits (simple but often inefficient in robust conditions) and pure droop control (effective for overvoltage but prone to disproportionately curtail downstream PVs), the proposed method dynamically reallocates curtailment, so no single PV bears an excessive burden while voltage limits are maintained. This positions the approach as a practical trade-off between fairness and energy efficiency.
Therefore, the primary contribution of this study is the development and demonstration of this adaptive CI-based strategy. This work improves on earlier static simulations by incorporating real-time dynamic conditions and validating the proposed method through both simulation and experimentation on a microgrid. This combination of adaptive design and experimental validation improves the method’s robustness, increasing its applicability and reliability in diverse and realistic operational scenarios. Specifically, the contributions of this paper are:
1.
Development of an adaptive fairness-based strategy that dynamically responds to load and generation changes.
2.
Experimental validation of the proposed method using PAGLIA ORBA solar microgrid under realistic conditions.
3.
Quantitative evaluation of fairness and sellable PV energy under equal, unfair, and proposed curtailment methods.
The remainder of this paper is organized as follows: Section 2 describes curtailment methods employed in this study including the proposed fairness-based strategy. Section 3 outlines the simulation and experiment conditions, while Section 4 presents the results and discussion. Finally, Section 5 concludes the paper and highlights potential future work.

2. Curtailment Strategies: Baseline and Proposed Approaches

In this paper, curtailment models developed will be applied to both simulation and experiment. Here the term baseline refers to existing benchmark strategies against which our proposed method is compared. Curtailment models developed are based on the following approaches:
1.
Unfair curtailment (baseline): This approach maximizes the PV energy sold but results in low fairness.
2.
Equal curtailment (baseline): This approach maximizes fairness but results in low PV energy sold.
3.
Proposal curtailment (trade-off strategy): This approach aims to achieve a good level of fairness with minimal revenue loss.

2.1. Unfair Curtailment (Baseline)

Under this method, PV energy systems are sequentially curtailed starting from the most distant PV from the point of common coupling (PCC) whenever the allowable bus voltage limits are violated. Referring to the network model in Figure 1, the PV systems are curtailed starting from PV3, which is furthest from the circuit breaker and metering tool NSX13 located at PCC, followed by PV2, and finally PV1. The curtailment algorithm iteratively reduces the inverter output by decrementing an adjustment factor, f U , that is initially set to 1, until network voltage conditions are met. The goal is to maximize sellable energy while managing overvoltage concerns by reducing the power output in a controlled manner ensuring that the PV closest to PCC is curtailed last. The adjustment factor for each PV system is updated using the following equation:
f U ( i ) = m a x 0 , f U ( i ) ,
where f U ( i ) is the adjustment factor for the i t h PV system, and is the decrement value which is set to 0.01 in this case. The power curtailed for each PV system, P c u r t ( i ) , is given by:
P c u r t ( i ) = m a x ( 0 , P i n i t ( i ) P o u t ( i ) ) ,
where P i n i t ( i ) and P o u t ( i ) represent inverter power outputs before and after curtailment, respectively. From Equation (1), the inverter power output after curtailment (i.e., sellable power) can be computed as follows:
P o u t i = f U i · P i n i t i .
Considering dynamic conditions, especially during periods of increased load, it becomes essential to adjust the curtailment strategy to respond to changing demand effectively. When the load increases, the network voltage levels may drop (i.e., stabilize), allowing for an increase in inverter power output to meet higher demand without violating voltage limits. To account for this, the adjustment factor is incremented iteratively to increase PV output; however, the increased output should not cause the inverter to generate power beyond its rated capacity. The adjustment factor for each PV system in response to a load increase is updated using the following equation:
f U ( i ) = min f U i + , f m a x ( i )
where f m a x ( i ) = P m a x ( i ) P o u t ( i ) denotes the maximum allowable factor, and represents the incremental value set to 0.01. P m a x ( i ) is the maximum power inverter can produce (i.e., rated capacity).

2.2. Equal Curtailment (Baseline)

To maximize fairness, PV systems under this method are curtailed uniformly whenever bus voltage violations occur. This approach ensures that all PV systems share the curtailment burden equally, regardless of their distance from the PCC. To realize this, the curtailment algorithm applies the same adjustment factor, f e q , to reduce inverter outputs of all PV systems. This process of reducing inverter outputs is carried out iteratively by decrementing the adjustment factor from initial value of 1 until the bus voltages are within acceptable limits. The adjustment factor f e q for all the PV systems is updated using the following equation:
f e q = m a x 0 , f e q ,
where is the decrement value set to 0.01. The power curtailed for each PV system is computed using Equation (2), and from Equation (5), the inverter power output of each PV system after curtailment P o u t i is given by:
P o u t i = f e q · P i n i t i ,
where P i n i t ( i ) is the inverter power output before curtailment.
Considering dynamic conditions, such as load increase, the adjustment factor is incremented uniformly across all the PV systems to increase the inverter power output. The increased output should not cause the inverters to generate power beyond their rated capacity. Additionally, the bus voltages must be maintained within the acceptable limits. The adjustment factor f e q for all the PV systems, given a load increase, is updated using the following equation:
f e q = min f e q + , f m a x ( i ) ,
where f m a x ( i ) = P m a x ( i ) P o u t ( i ) denotes the maximum allowable factor, and represents the incremental value set to 0.01. P m a x ( i ) is the rated capacity of the inverter.

2.3. Proposal Curtailment (Trade-Off Strategy)

In response to limitations posed by unfair and equal curtailment methods, the proposed approach applies rule-based sequential adjustments of inverter outputs to strike a trade-off between fairness and economic efficiency, without requiring external optimization toolboxes. Under this method, whenever a voltage violation occurs, the adjustment factor for each PV system is initially computed as f U ( i ) using Equation (1) from the unfair curtailment method. This initial adjustment factor is then modified based on a curtailment index—a metric that quantifies the variation in curtailed power among the PV systems. The modified adjustment factor for each PV system, f P i , is thus given by:
f P i = f ¯ U + f U i f ¯ U · 1 C I ,
where the curtailment index C I is calculated using:
C I = i = 1 3 P c u r t i P ¯ c u r t 2 2 · i = 1 3 P c u r t i 2 ,
with f ¯ U and P ¯ c u r t representing the average adjustment factor and average curtailed power across the PV systems, respectively, under unfair curtailment method. The curtailment process is carried out iteratively. At each iteration, the adjustment factor for each PV system is recalculated based on updated curtailment index to ensure that bus voltages remain within acceptable limits while striving to balance fairness and energy loss. The power curtailed for each PV is computed using Equation (2), and from Equation (8), the power output of each PV system inverter P o u t i after curtailment is calculated using:
P o u t i = f P i · P i n i t i .
Considering an increase in load, the proposal curtailment method increments the adjustment factor to increase the power output of each PV system’s inverter. This increase is carried out iteratively, ensuring that bus voltages are maintained within acceptable limits and the inverters do not generate power beyond their rated capacities. At each iteration, the adjustment factor for each PV system, f P i , is updated to reflect changes in both fairness and power output. This is achieved by applying an adjustment index   A I which accounts for variations in the adjustment factors among the different PV systems and ensuring that the increase in each PV system’s inverter output is proportionate to its rated capacity. This approach aims to balance maximizing energy production while ensuring that all PV systems contribute fairly to the overall power output based on their respective capacities. The adjustment factor for each PV system is updated according to the following equation:
f P i = f ¯ P + f P i f ¯ P · 1 A I · C S ( i ) +
where the adjustment index   A I is determined by:
A I = i = 1 3 ( f P i f ¯ P ) 2 2 · i = 1 3 f P i 2
f ¯ P is the average adjustment factor, and C S ( i ) is the capacity share determined by the ratio of the PV system’s ( i ) rated capacity to the total rated capacity of all PV systems ( C S i = P m a x ( i ) / i = 1 3 P m a x ( i ) ). represents the incremental value which is set to 0.01. Considering that PV systems cannot generate power beyond their rated capacities, the adjustment factor for each PV system, as computed Equation (11), is constrained by maximum allowable factor f m a x   ( i ) , as given by:
f P i = m i n ( f P i , f m a x ( i ) ) ,
where f m a x ( i ) = P m a x ( i ) P o u t ( i ) .

2.4. Jain’s Fairness Index (JFI)

To evaluate the fairness of curtailment distribution among PV systems among three curtailment methods developed for this study, the Jain’s Fairness Index (JFI) is used as a quantitative metric. It is mathematically defined as:
J F I x 1 , , x n = i = 1 n x i 2 n · i = 1 n x i 2 ,
where x 1 represents the sellable power of the i t h PV system, and n is the total number of PV systems. A JFI value of 1 indicates perfect fairness, meaning that curtailment is evenly distributed among all PV systems. A lower JFI value signifies increasing disparity, where certain PV systems are disproportionately curtailed compared to others.

3. Experiment and Simulation Conditions

The network model illustrated in Figure 1 was utilized for both simulation and experimental purposes in this study. The simulations were conducted using MATLAB R2024b (version 24.2), while the experimental work was carried out on a section of the PAGLIA ORBA solar microgrid, operated by the Science for Environment (SPE) Laboratory at the University of Corsica in Ajaccio, France. The experimental test was performed on a section of the microgrid configured to match the network model in Figure 1. In this configuration, the experiment replicated the electrical behavior of the simulation model; therefore, voltage responses reflect the defined model parameters in Table 1 rather than the physical layout of the host microgrid. The network model comprises three PV systems, each containing 56 monocrystalline silicon panels of 327 Wp, totaling 18.312 kWp, and connected to three 17 kW inverters. The PV systems are connected to SMA STP 17000TL-10 inverters [34], which provide the necessary communication interface and active-power limitation required to implement the curtailment strategies. In addition, the system includes a controllable load with a capacity of up to 34.5 kW. The key parameters of the network model are summarized in Table 1.
At the start of both the simulation and the experiment, the initial power output for each inverter was set to 10,000 W. For the experiment, this value was a preset limit, fixed below the available generation potential on 8 July 2024, to ensure consistent and reproducible testing conditions by isolating the effects of the curtailment strategy from natural solar irradiance variations. Power was thus limited from the inverter through Modbus protocol. A single controllable resistive load, connected at the end of the feeder, was used to focus on voltage variations caused by active power flow. Load sequences of 4000 W, 2000 W, and 5000 W were applied as stepped changes in defined intervals to simulate dynamic demand variations. These load changes allowed for comprehensive testing of curtailment strategies in response to fluctuating network conditions.
In this study, although the PAGLIA ORBA microgrid includes energy storage systems, the network model used for both the experiments and simulations did not incorporate them. This omission ensures that the results analysis focusses solely on the effectiveness of PV curtailment strategies, eliminating influence of stored energy and providing a clearer assessment of the proposed method’s impact on grid stability and energy management.

Process Flow for Simulation and Experiment Validation

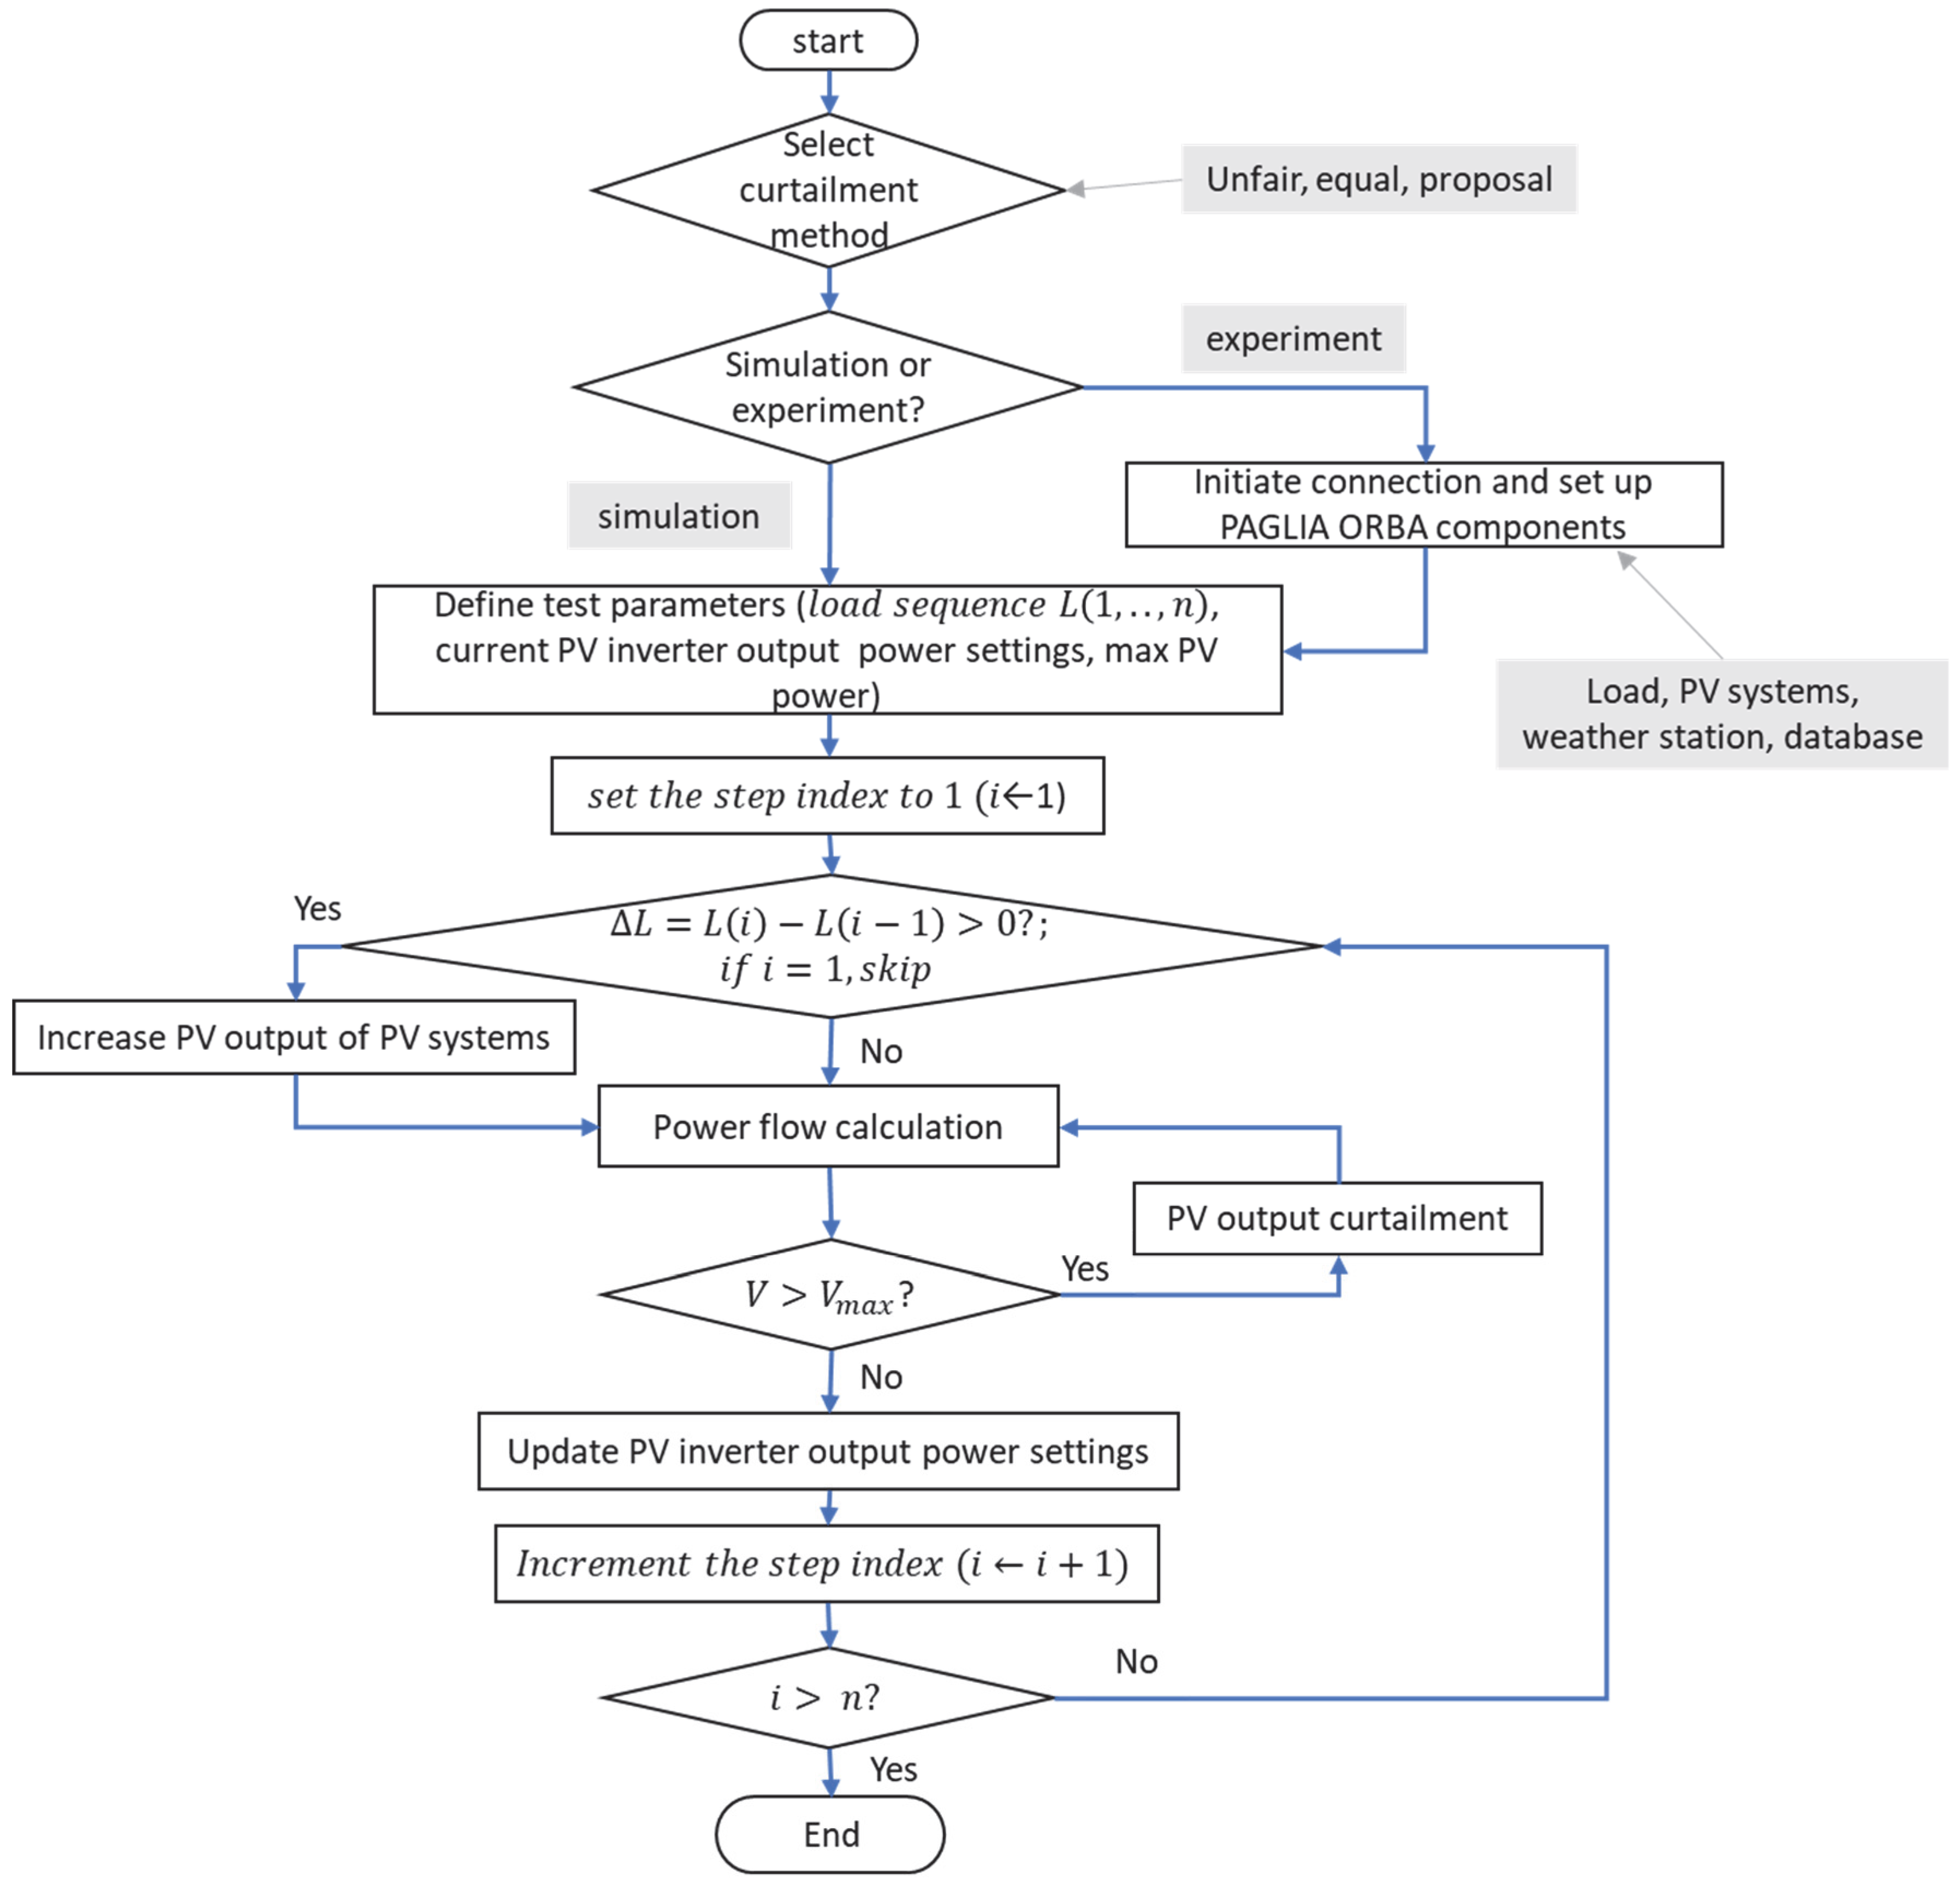
The flowchart adapted for experimental and simulation processes is illustrated in Figure 2. The process begins by selecting the curtailment method (unfair, equal, or proposal). In the experiment, a connection is established to the PAGLIA ORBA microgrid components, including the weather station, database, PV systems and the load.
In both cases, the same sequence of load changes is applied. For each load change, power flow calculations are performed to monitor voltage levels. If a load increase is detected, the PV inverter outputs are incrementally adjusted within their rated capacities. Conversely, if the load decreases, PV outputs are curtailed to prevent voltage violations by adjusting the inverter settings, as illustrated in Figure 2. The timestep used in the experiment process is 3 s. The computational performance was validated through simulation timing measurements on a standard desktop PC (Intel Core i7-12700, 2.10 GHz). The total wall clock time for the three load steps (4 kW, 2 kW, and 5 kW) was 1.907 s, with the curtailment algorithm requiring an average of 308.742 milliseconds per process call. The maximum observed time was 651.139 milliseconds. These results demonstrate the method’s suitability for real-time applications, as the computation time remains within the 3 s experimental timestep, accounting for system overheads in practical implementation.

4. Results and Discussion

4.1. Simulation Results

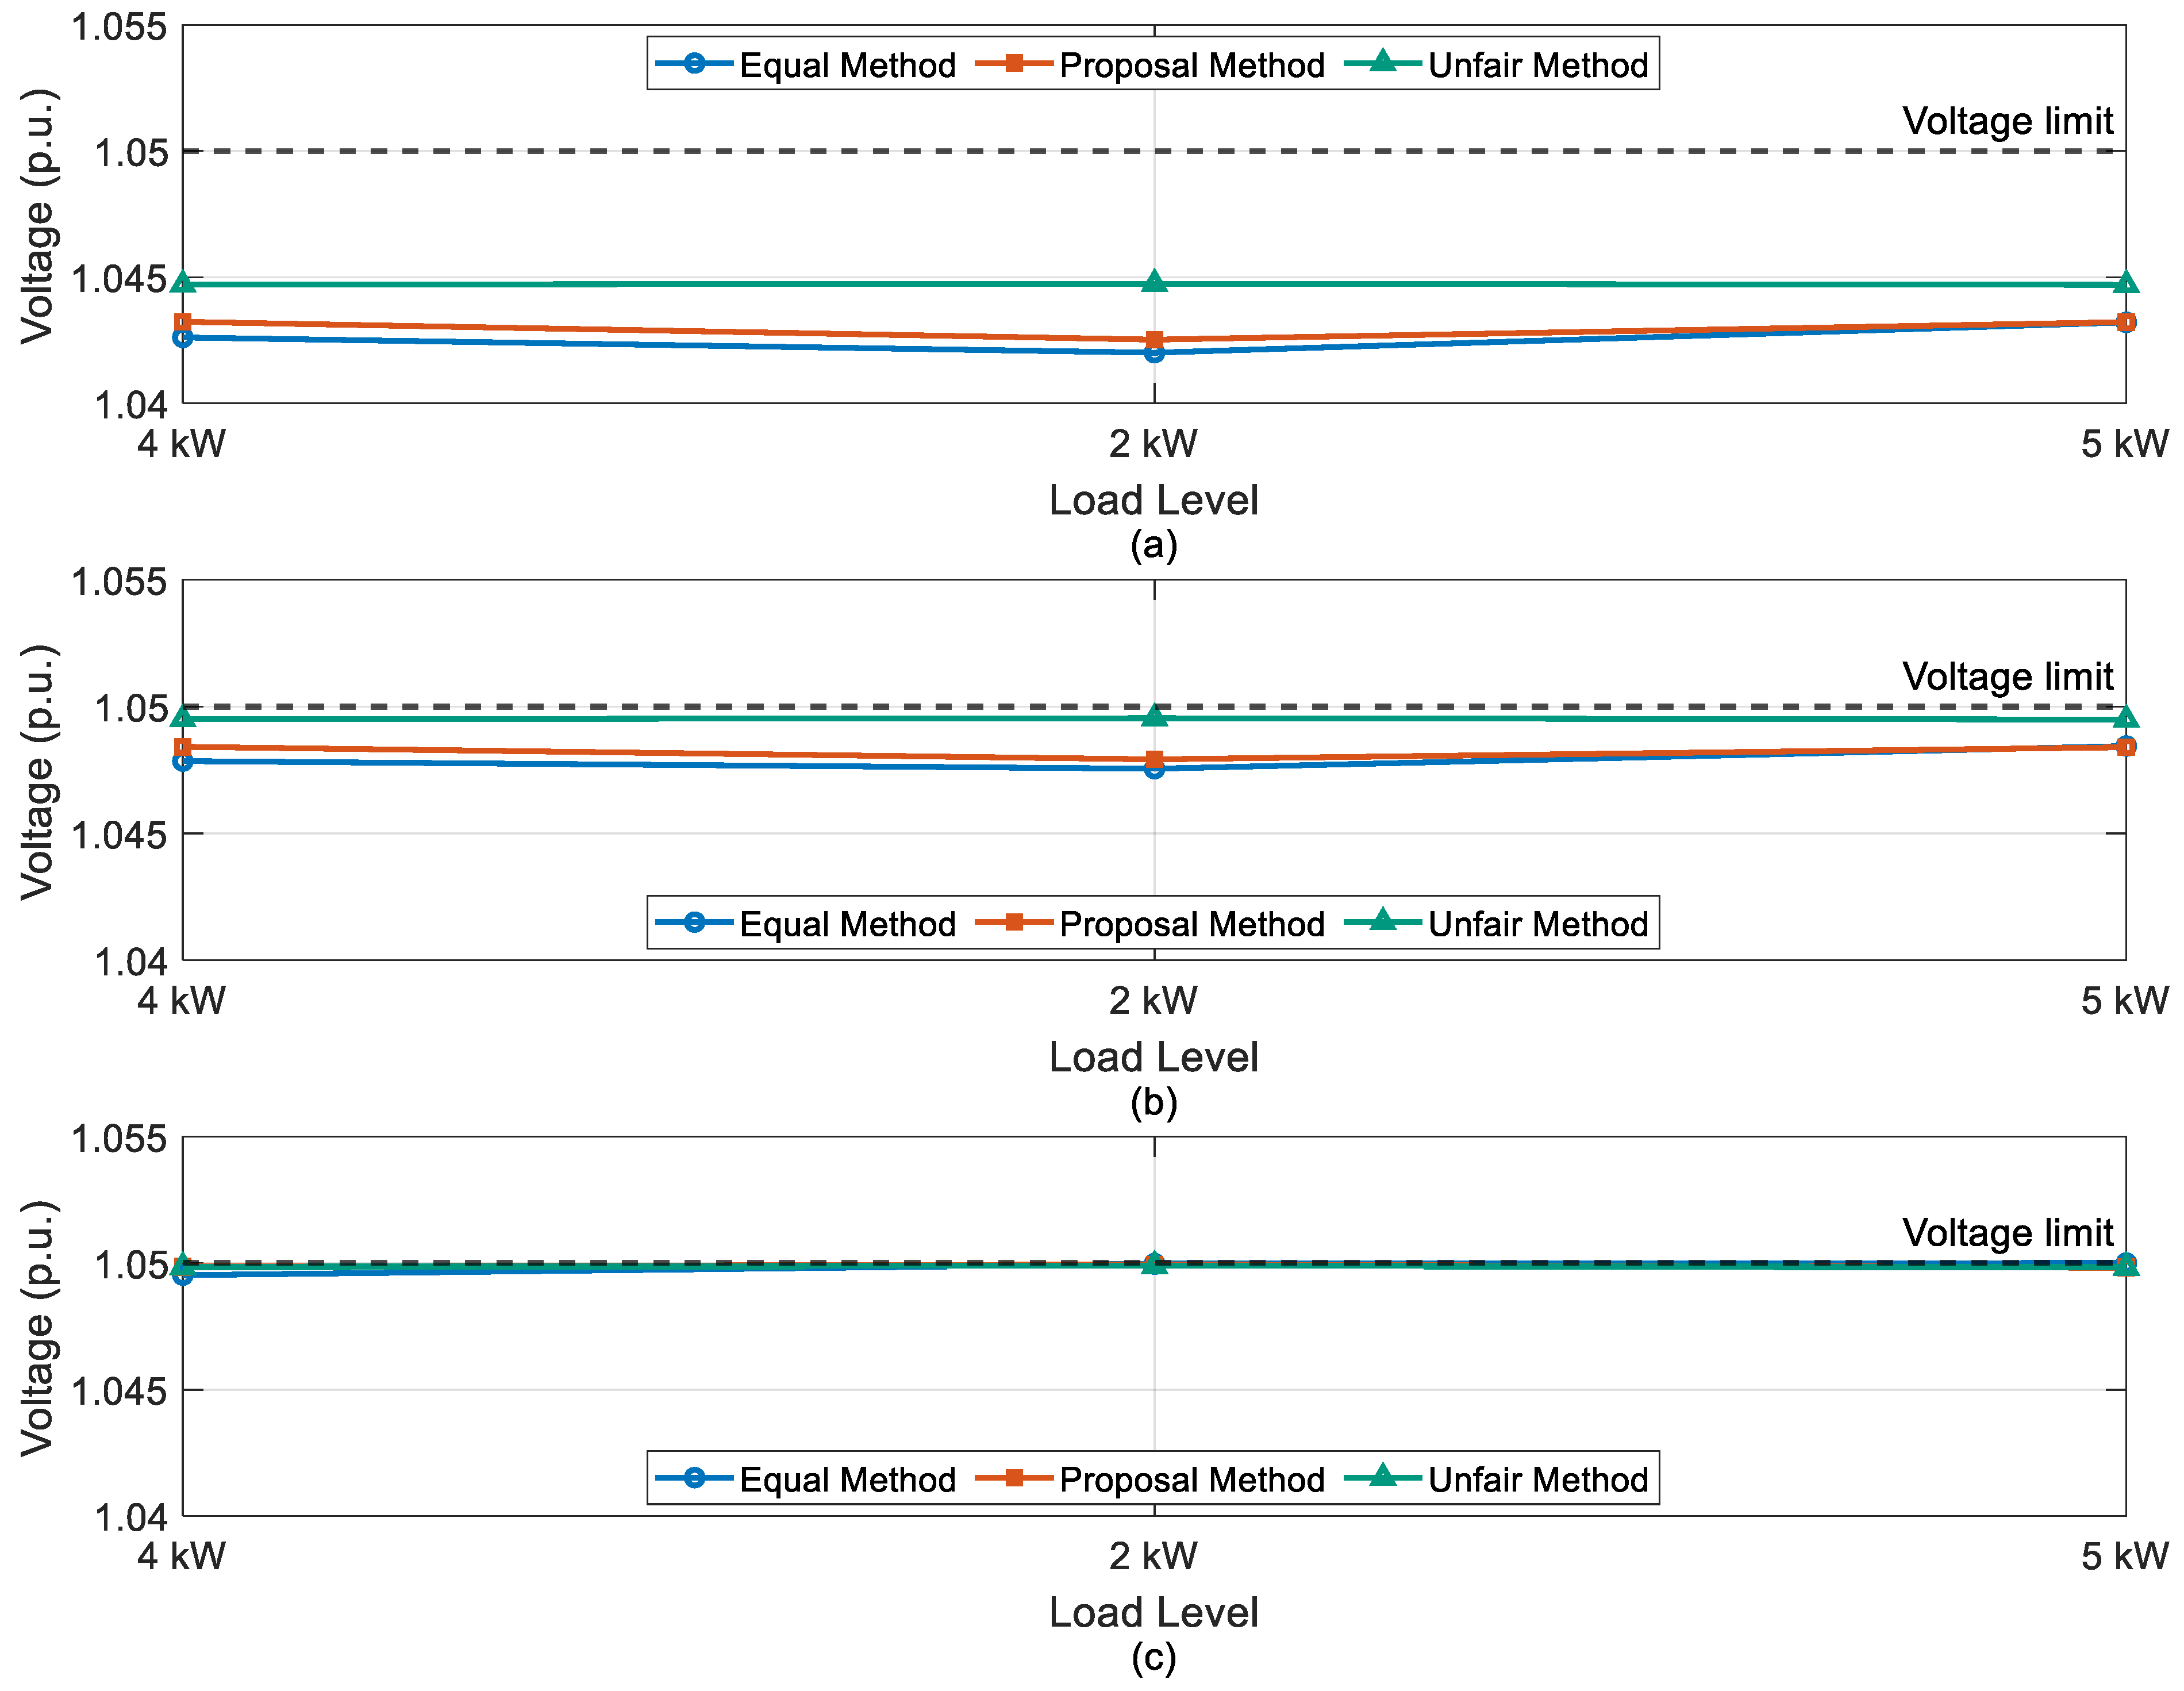
The sellable and curtailed power outputs of the three PV systems under each curtailment method were first examined in simulation. Figure 3 depicts the power output (sellable vs. curtailed) for each PV system at successive load levels (4 kW → 2 kW → 5 kW), and Figure 4 shows the corresponding voltage profiles for each load change. As illustrated in Figure 3a–c, under the unfair curtailment method the curtailment burden falls entirely on the PV farthest from the point of common coupling (PV3). At the start of the simulation, when a 4 kW load is applied, PV1 and PV2 operate without any curtailment (their sellable power remains at the initial 10 kW setpoint), whereas PV3 is substantially curtailed due to a local overvoltage violation. This results in PV3’s sellable output dropping to about 5 kW. When the load is then decreased to 2 kW, PV1 and PV2 still remain unaffected (continuing at 10 kW each) since their voltages stay within allowable limits, but PV3 undergoes further curtailment—its output is reduced to approximately 2.4 kW to resolve the continued overvoltage at its location. Finally, when the load is increased to 5 kW, PV1’s and PV2’s sellable outputs remained at 10kW while PV3’s output increased to about 5.5 kW. The increased generation from PV3 at the 5 kW load was enabled by the higher feeder load, which reduced the local bus voltage and increased voltage headroom at PV3, whereas PV1 and PV2 were already at their 10 kW export caps and thus could not increase further. This unfair curtailment strategy maximizes total energy by letting PV1 and PV2 run freely, but it does so at the expense of PV3, which is heavily curtailed whenever overvoltage occurs. Correspondingly, as shown in Table 2, the Jain’s fairness index under unfair curtailment method is lower than the other two methods, reflecting the disproportionate curtailment borne by PV3.
Under the equal curtailment method, all three PV systems share the curtailment equally at any given time, regardless of location. At the 4 kW initial load, each PV’s output is reduced uniformly—Figure 3 shows sellable power around 8 kW per PV, meaning all three experienced the same curtailment to keep voltages in bounds. When the load drops to 2 kW (a higher overvoltage condition), further equal curtailment is applied: each inverter’s output decreases to roughly 7.04 kW. As the load is then raised to 5 kW, the voltage constraint relaxes, and the PV outputs uniformly recover. At this highest load, the sellable output of PV1, PV2, and PV3 increases to about 8.3 kW each, with essentially no curtailed power remaining (since the heavier load absorbs more PV generation). This behavior illustrates the perfect fairness of equal curtailment—every PV is curtailed and subsequently allowed to increase output in unison. As shown in Table 2, the Jain’s index stays at 1.0 for all load levels, indicating completely equal treatment. However, this fairness comes at a cost: at the 4 kW and 2 kW load steps, even PVs that could have generated more (e.g., PV1 and PV2) were held back to match PV3’s limit, resulting in the lowest total sellable power among the methods. In other words, equal curtailment forgoes some potential energy sales to ensure that no PV is advantaged over others.
For the proposal curtailment method, the curtailment burden is distributed in a balanced manner that prioritizes fairness while still allowing as much energy generation as possible. As shown in Figure 3, at the initial 4 kW load the proposed method curtails each PV to a different extent based on their voltage sensitivities: PV1 and PV2 are curtailed slightly (each inverter outputs about 8.43 kW) while PV3, being more prone to overvoltage, is curtailed more (selling about 7.45 kW). Notably, PV3’s curtailment under the proposal is far less severe than under the unfair method (where PV3 was reduced to 5 kW); the proposed scheme ensures PV3 is not left behind, though it still trims PV3 more than PV1 and PV2 due to its location. When the load decreases to 2 kW, the CI-based control further adjusts outputs dynamically: PV1 and PV2 drop to approximately 7.61 kW each and PV3 to about 6.13 kW. Again, PV3 sees a larger curtailment, but the gap is moderated so that no single system bears an excessive share. Finally, as the load increases back to 5 kW, all PV outputs can rise since the voltage headroom improves. The proposed method at this stage allows PV1 and PV2 to increase their outputs to roughly 8.43 kW each and also permits PV3 to resume generation up to about 8.03 kW. In contrast to equal curtailment (which would have raised all PVs to about 8.3 kW uniformly) or the unfair method (which keeps PV1/PV2 at their 10kW export caps while PV3 recovers to 5.5 kW), the proposed strategy adaptively allocates the available voltage margin: PV3 is allowed a significant increase in output when conditions permit, without fully sacrificing the generation of PV1 and PV2. This adaptive behavior is governed by the Curtailment Index adjustments, which continuously seek a balance between maximizing total sellable power and maintaining fairness. Across the simulated scenario, the proposed method achieves consistently high fairness (Jain’s index is close to 1 at all load levels as illustrated in Table 2) while also delivering more energy than the equal approach.
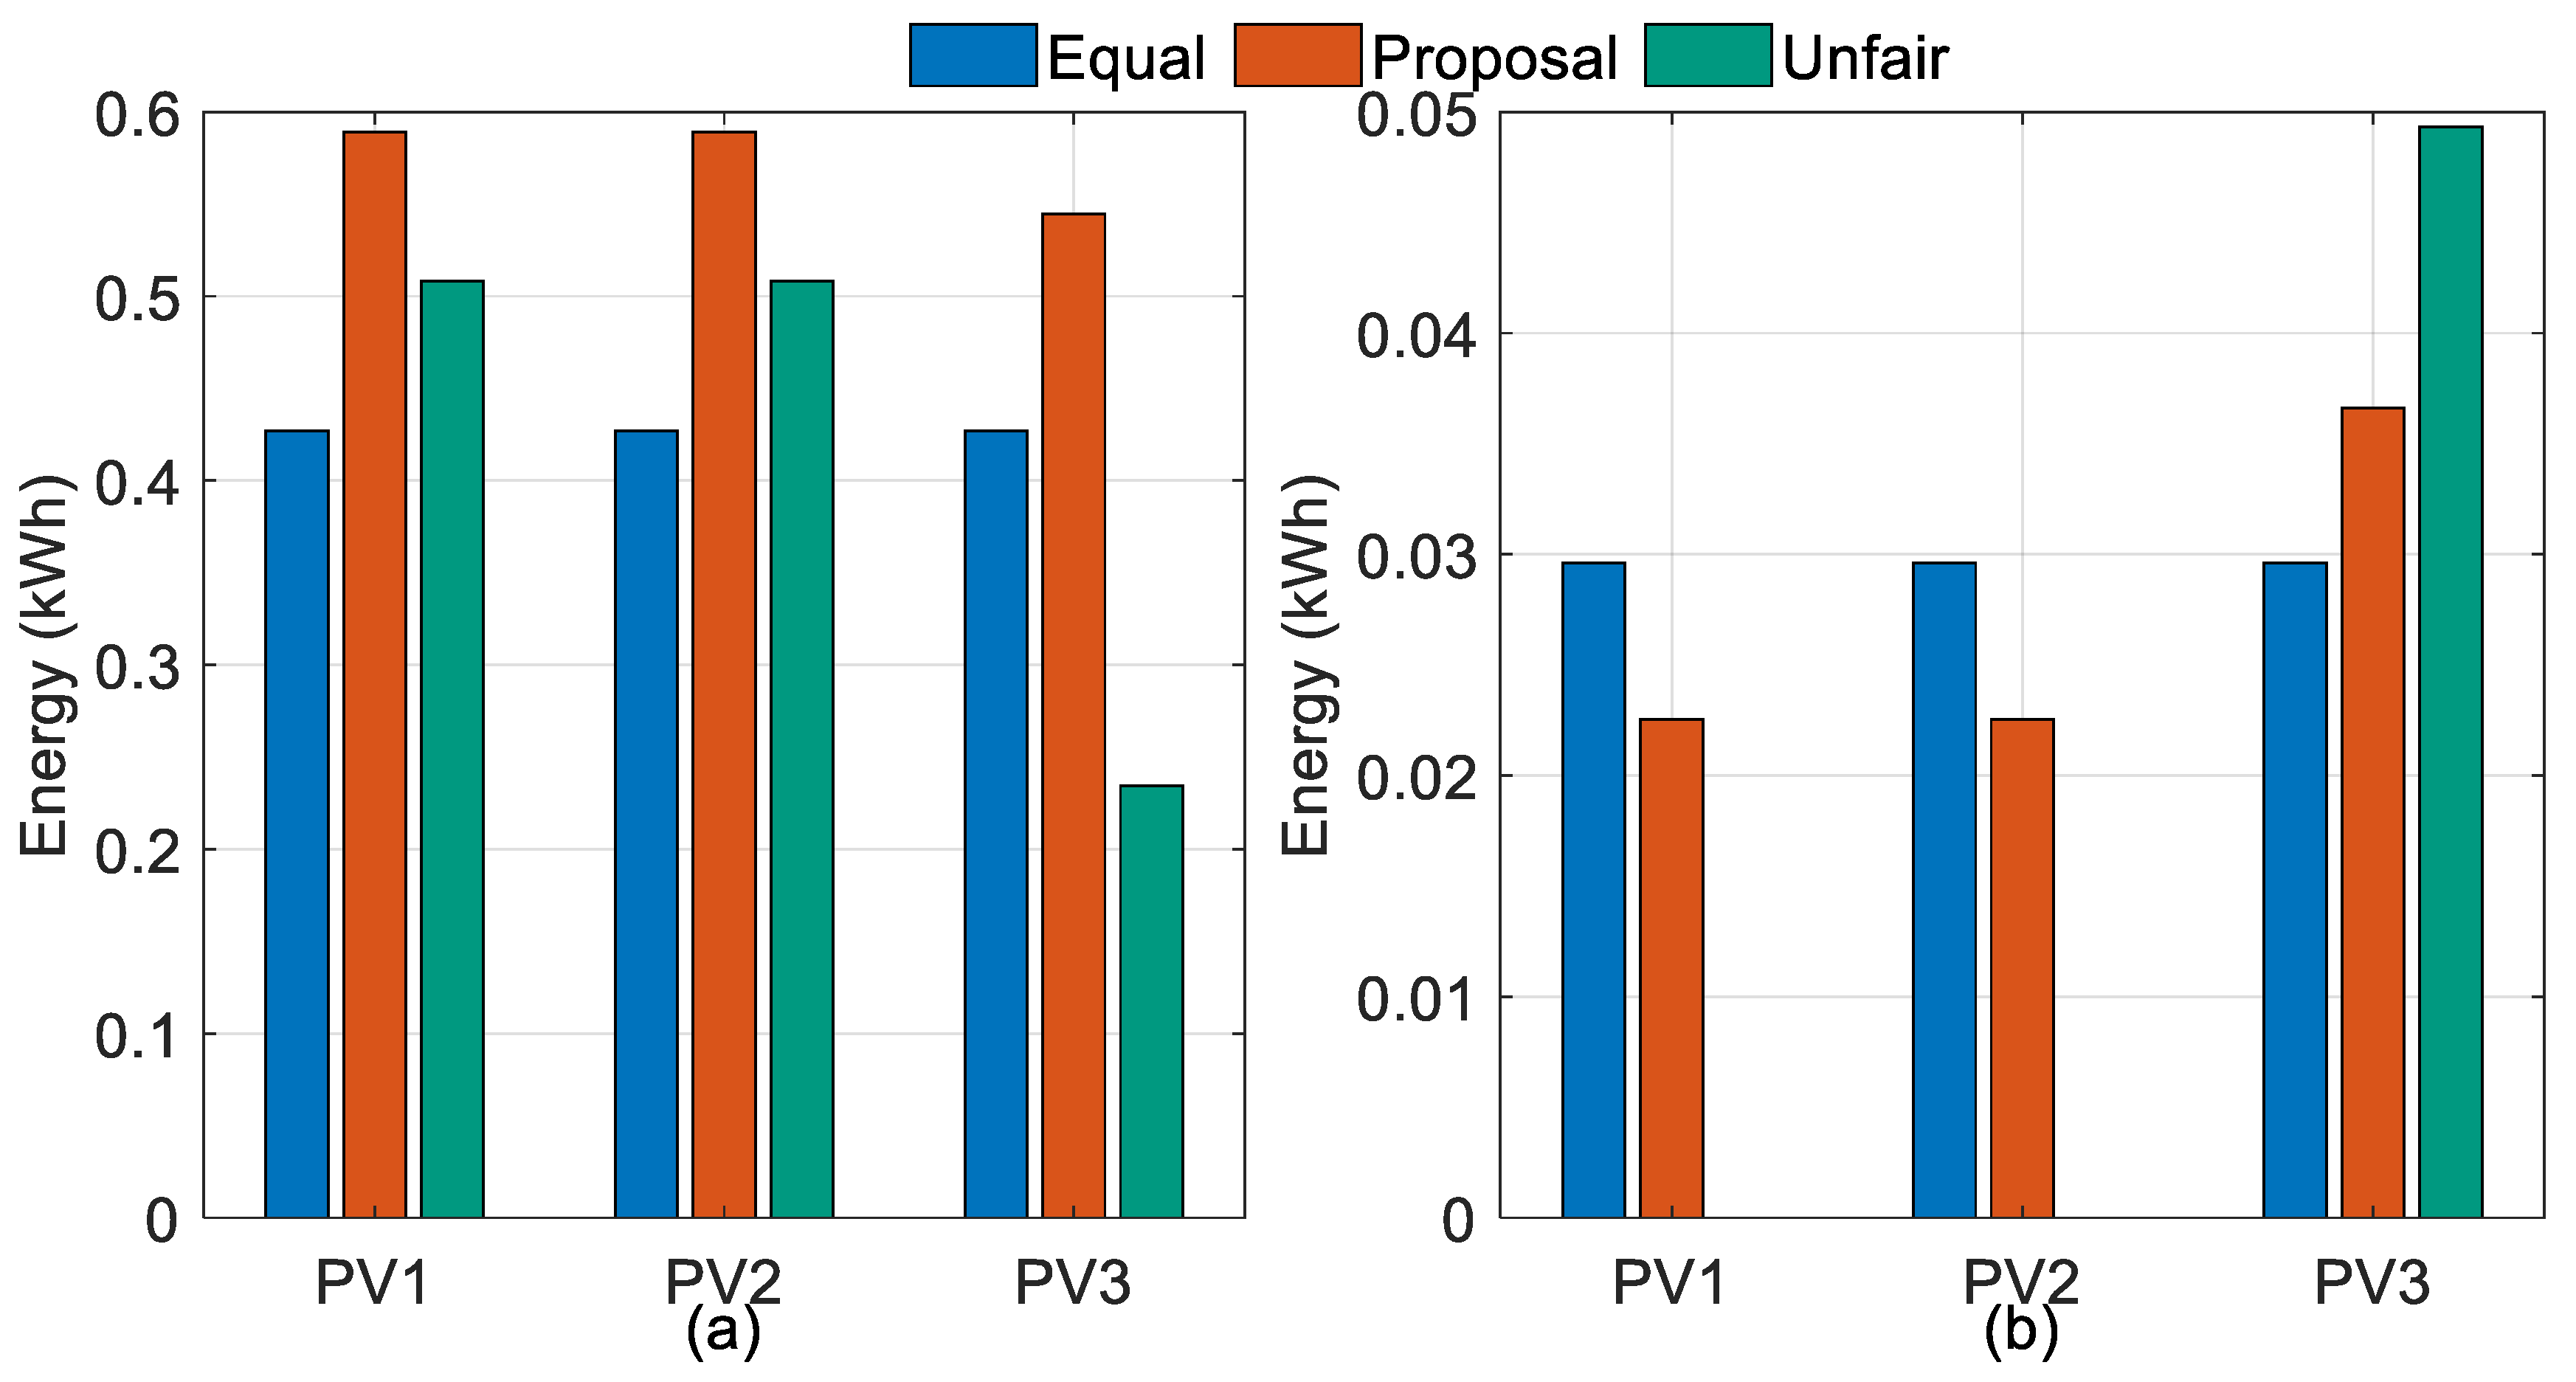
Figure 5 illustrates per-PV energy outcomes in kWh computed using the actual experiment response times at each load step. As shown in Figure 5a, sellable energy is uniform under equal curtailment (0.427 kWh per PV). Under the proposal, PV1 and PV2 are modestly higher (0.589 kWh each), while PV3 remains clearly above its unfair value (0.545 kWh vs. 0.234 kWh). Under unfair, PV1 and PV2 deliver 0.508 kWh each (higher than equal but lower than proposal) and PV3 is suppressed (0.234 kWh). Figure 5b shows curtailed energy. Under equal, the burden is even (0.030 kWh per PV). Under the proposal, PV3 carries more than PV1 and PV2 (0.037 kWh vs. 0.023 kWh), yet far less than in unfair (0.049 kWh). Under unfair, curtailment is concentrated at PV3 (0.049 kWh) with PV1 and PV2 at 0 kWh each. When evaluated using integrated energy based on experimental response times, the proposed scheme demonstrates a 34.5% increase in total energy sold compared to equal curtailment (1.723 kWh vs. 1.281 kWh), while also achieving consistently higher fairness than unfair curtailment than unfair method. This demonstrates that the CI-based strategy effectively mitigates the extreme trade-off seen in the two baseline methods—it recovers most of the energy that equal curtailment leaves unsold, and, when evaluated with the experimental response times, delivers more energy than the unfair strategy while substantially improving fairness. The simulation energy results thus indicate that the proposed curtailment approach can simultaneously maintain near-equal curtailment fairness and improve total energy delivery, compared to the respective benchmark strategies.

4.2. Experimental Results

To validate the simulation findings, the three curtailment strategies were implemented on a real microgrid (PAGLIA ORBA) and the inverter outputs and voltages were recorded as the load was varied. A single experimental trial was conducted for each curtailment method under clear-sky conditions to ensure consistent irradiance. The deterministic nature of the inverter’s active-power limitation function, which reliably follows set-points between 0 and maximum-power-point power ( P m p p ), means that repeating the identical test sequence is not expected to yield significantly different results, as the system response is not random. The data presented are thus representative of the algorithms’ performance under the controlled conditions. Furthermore, the close alignment between the experimental outcomes and the simulation results further supports the method’s reliability.
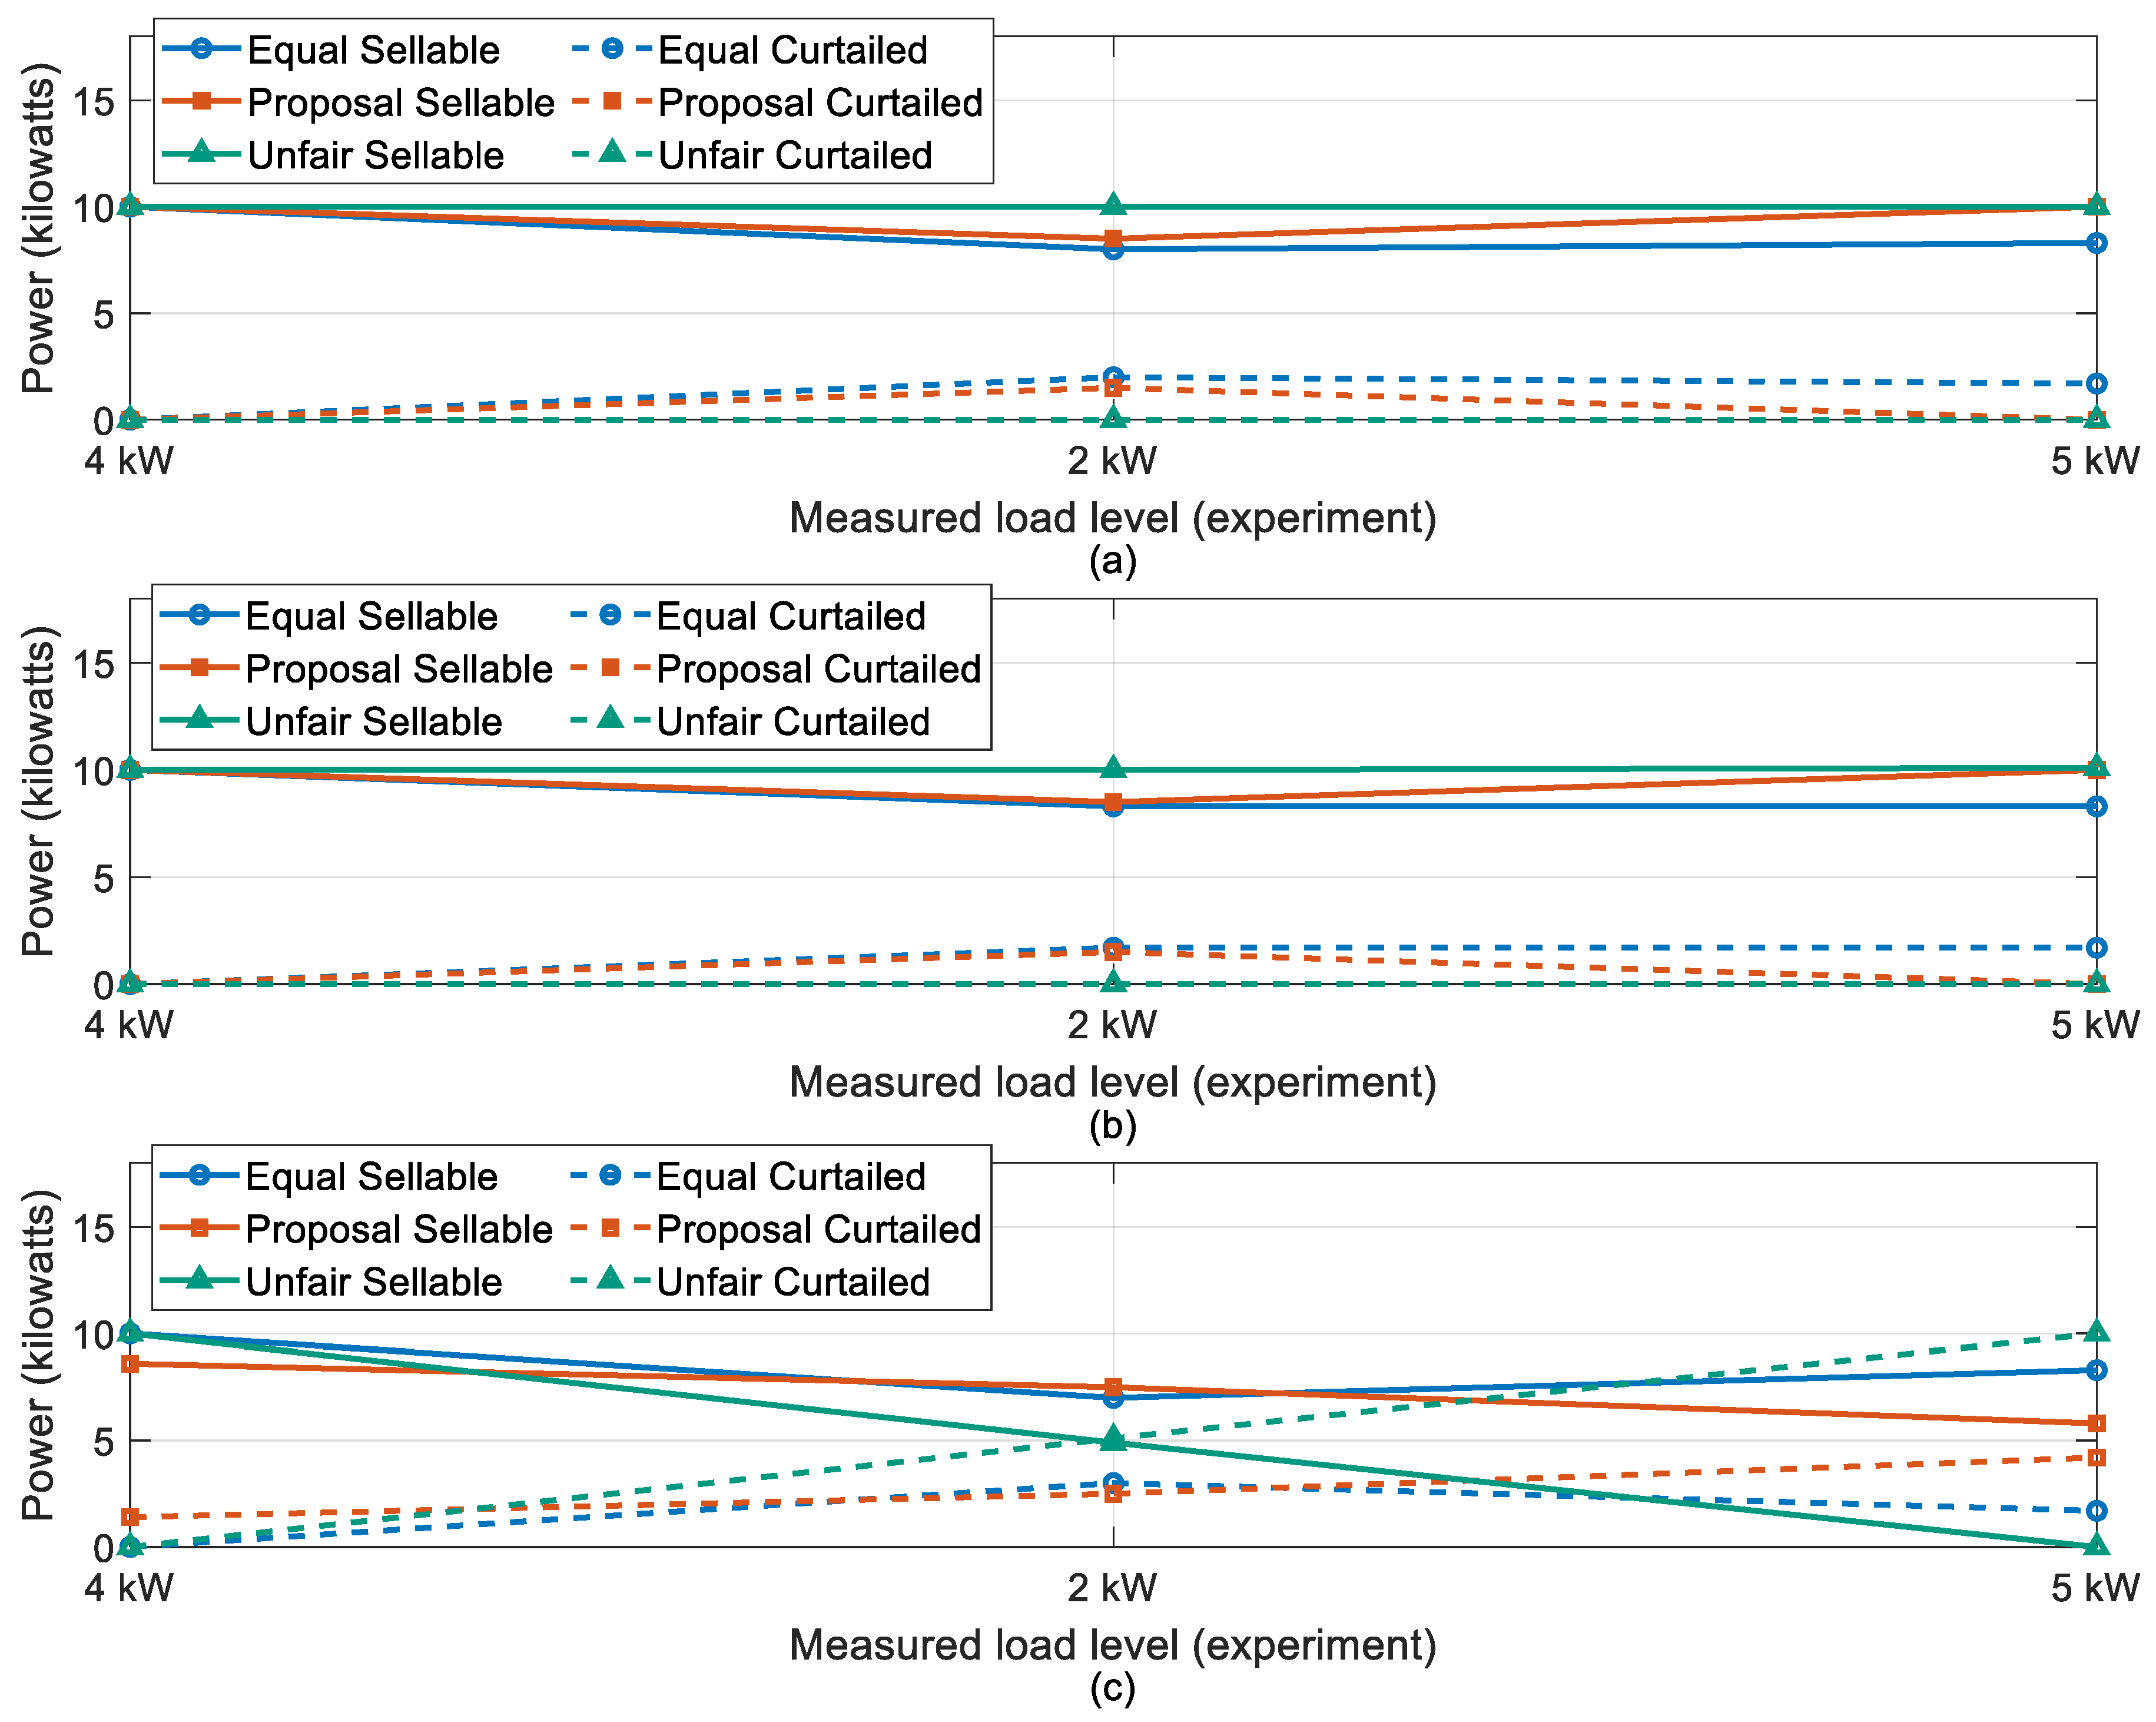
In these experiments, the load was changed in the same sequence (approximately 4 kW → 2 kW → 5 kW), and each step was held for a variable duration (tens of seconds to a few minutes). All measurements were sampled at 3 s intervals. Figure 6 shows the measured sellable power (solid lines) and curtailed power (dashed lines) for PV1, PV2, and PV3 under each curtailment method, plotted against the load level, with corresponding power values at key load steps summarized in Table 3. Figure 7 provides a comparison of the total energy per PV for each curtailment method, partitioned into sellable and curtailed components (obtained by integrating the 3 s interval data for each load step).
Under the equal curtailment method, the experimental results closely matched the expected behavior. At the initial condition (around 4.3 kW load), all three PV inverters operated near 10 kW, indicating no curtailment was needed to maintain voltages within limits. As the load was decreased, each PV system curtailed output by the same amount at the same time, preserving fairness. For instance, at the 1.6 kW load step, PV1, PV2, and PV3 stabilized at approximately 7.0, 7.5 and 7.0 kW, respectively (i.e., nearly equal and within the expected measurement/response tolerance). When the load was later increased to about 4.8 kW, all three PV outputs recovered uniformly, each reaching roughly 8.3 kW. Throughout the experiment, the equal method ensured that curtailment was evenly distributed: all PV units were held to identical output levels at any given moment. Consequently, the Jain’s fairness index remained essentially 1.0 (perfect fairness) for the duration of the test. This demonstrates that the equal curtailment strategy reduces disparity among PV participants, though at the expense of total energy yield.
In contrast, the unfair curtailment method exhibited a highly asymmetric curtailment pattern in the experiment, mirroring the simulation’s general trend but with some notable differences due to real-world conditions. At the initial approximately 4.3 kW load, again no curtailment was needed and all PVs generated about 10 kW (similar to the equal case). However, when the load dropped to about 1.6 kW, PV3’s output was greatly reduced while PV1 and PV2 remained at full output. At that low-load point, PV1 and PV2 continued operating near 10 kW each, whereas PV3’s output was cut down to about 2.7 kW to alleviate the local overvoltage. As the load began to increase toward about 4.7 kW, PV1 and PV2 remained approximately at their 10 kW plateau (representing the preset operational limit below the inverters’ 17 kW nameplate capacity), while PV3 was completely curtailed to 0 kW during this high-demand interval. Despite the rising load that could have accommodated more PV generation, PV3’s voltage was still at the limit, causing the unfair strategy to shut it off entirely. Consequently, curtailing PV3 provided no benefit to the overall system yield, as PV1 and PV2 were already operating at their maximum available capacity. This led to an outcome where the unfair method provided little or no benefit in total power—in fact, as shown by the results in Table 3, it resulted in lower overall power delivered compared to the equal strategy (despite unfair curtailment maximizing PV1/PV2 output at each instant). Meanwhile, the unfair method’s impact on fairness was severe: once curtailment kicked in, the JFI for the unfair approach plummeted from 1.0 initially to below 0.7 during the period when PV3 was completely off (one-third of the PV fleet receiving zero output). This highlights the drawback of the unfair approach—one participant (PV3) is sacrificed to protect the voltage, receiving none of the generation opportunity while the others remain unaffected. The experiment also shows that such an approach can be counterproductive in energy terms if the favored PVs (i.e., those left uncurtailed) are already at their output limits.
The proposal curtailment method’s experimental performance validates its effectiveness in balancing fairness with energy maximization. At the initial approximately 4.3 kW load, all three PVs again operated around 10 kW with no curtailment needed (matching the other methods at the start). Once the load was reduced, the proposed method applied CI-weighted, non-uniform curtailment, distributing reductions across all PVs instead of shutting any single unit off. At roughly 1.6 kW load, PV1 and PV2 each reduced their output to about 7.8 kW, while PV3 dropped to around 6.3 kW. This means all three PVs contributed to voltage support, but PV3 was curtailed a bit more since its local voltage is most sensitive. As the system load was subsequently increased toward 4.8–5 kW, the adaptive scheme allowed PV3 to resume generation significantly. In the final high-load step, PV1 and PV2 stayed near their 10 kW maximum (similar to the unfair case, they were limited by available power), and—importantly—the proposed method also permitted PV3 to continue generating on the order of 5.8–6 kW instead of forcing it to zero. This balanced approach maintained equitable curtailment distribution while simultaneously increasing total energy yield compared to both baseline methods. Throughout the test, the proposed method maintained grid voltages within limits (as did the other strategies), but it did so with a more balanced curtailment profile: it kept PV3 active as much as possible, thus capturing energy that the unfair method would have completely wasted. This outcome is clearly reflected in the aggregated energy results of Figure 7.
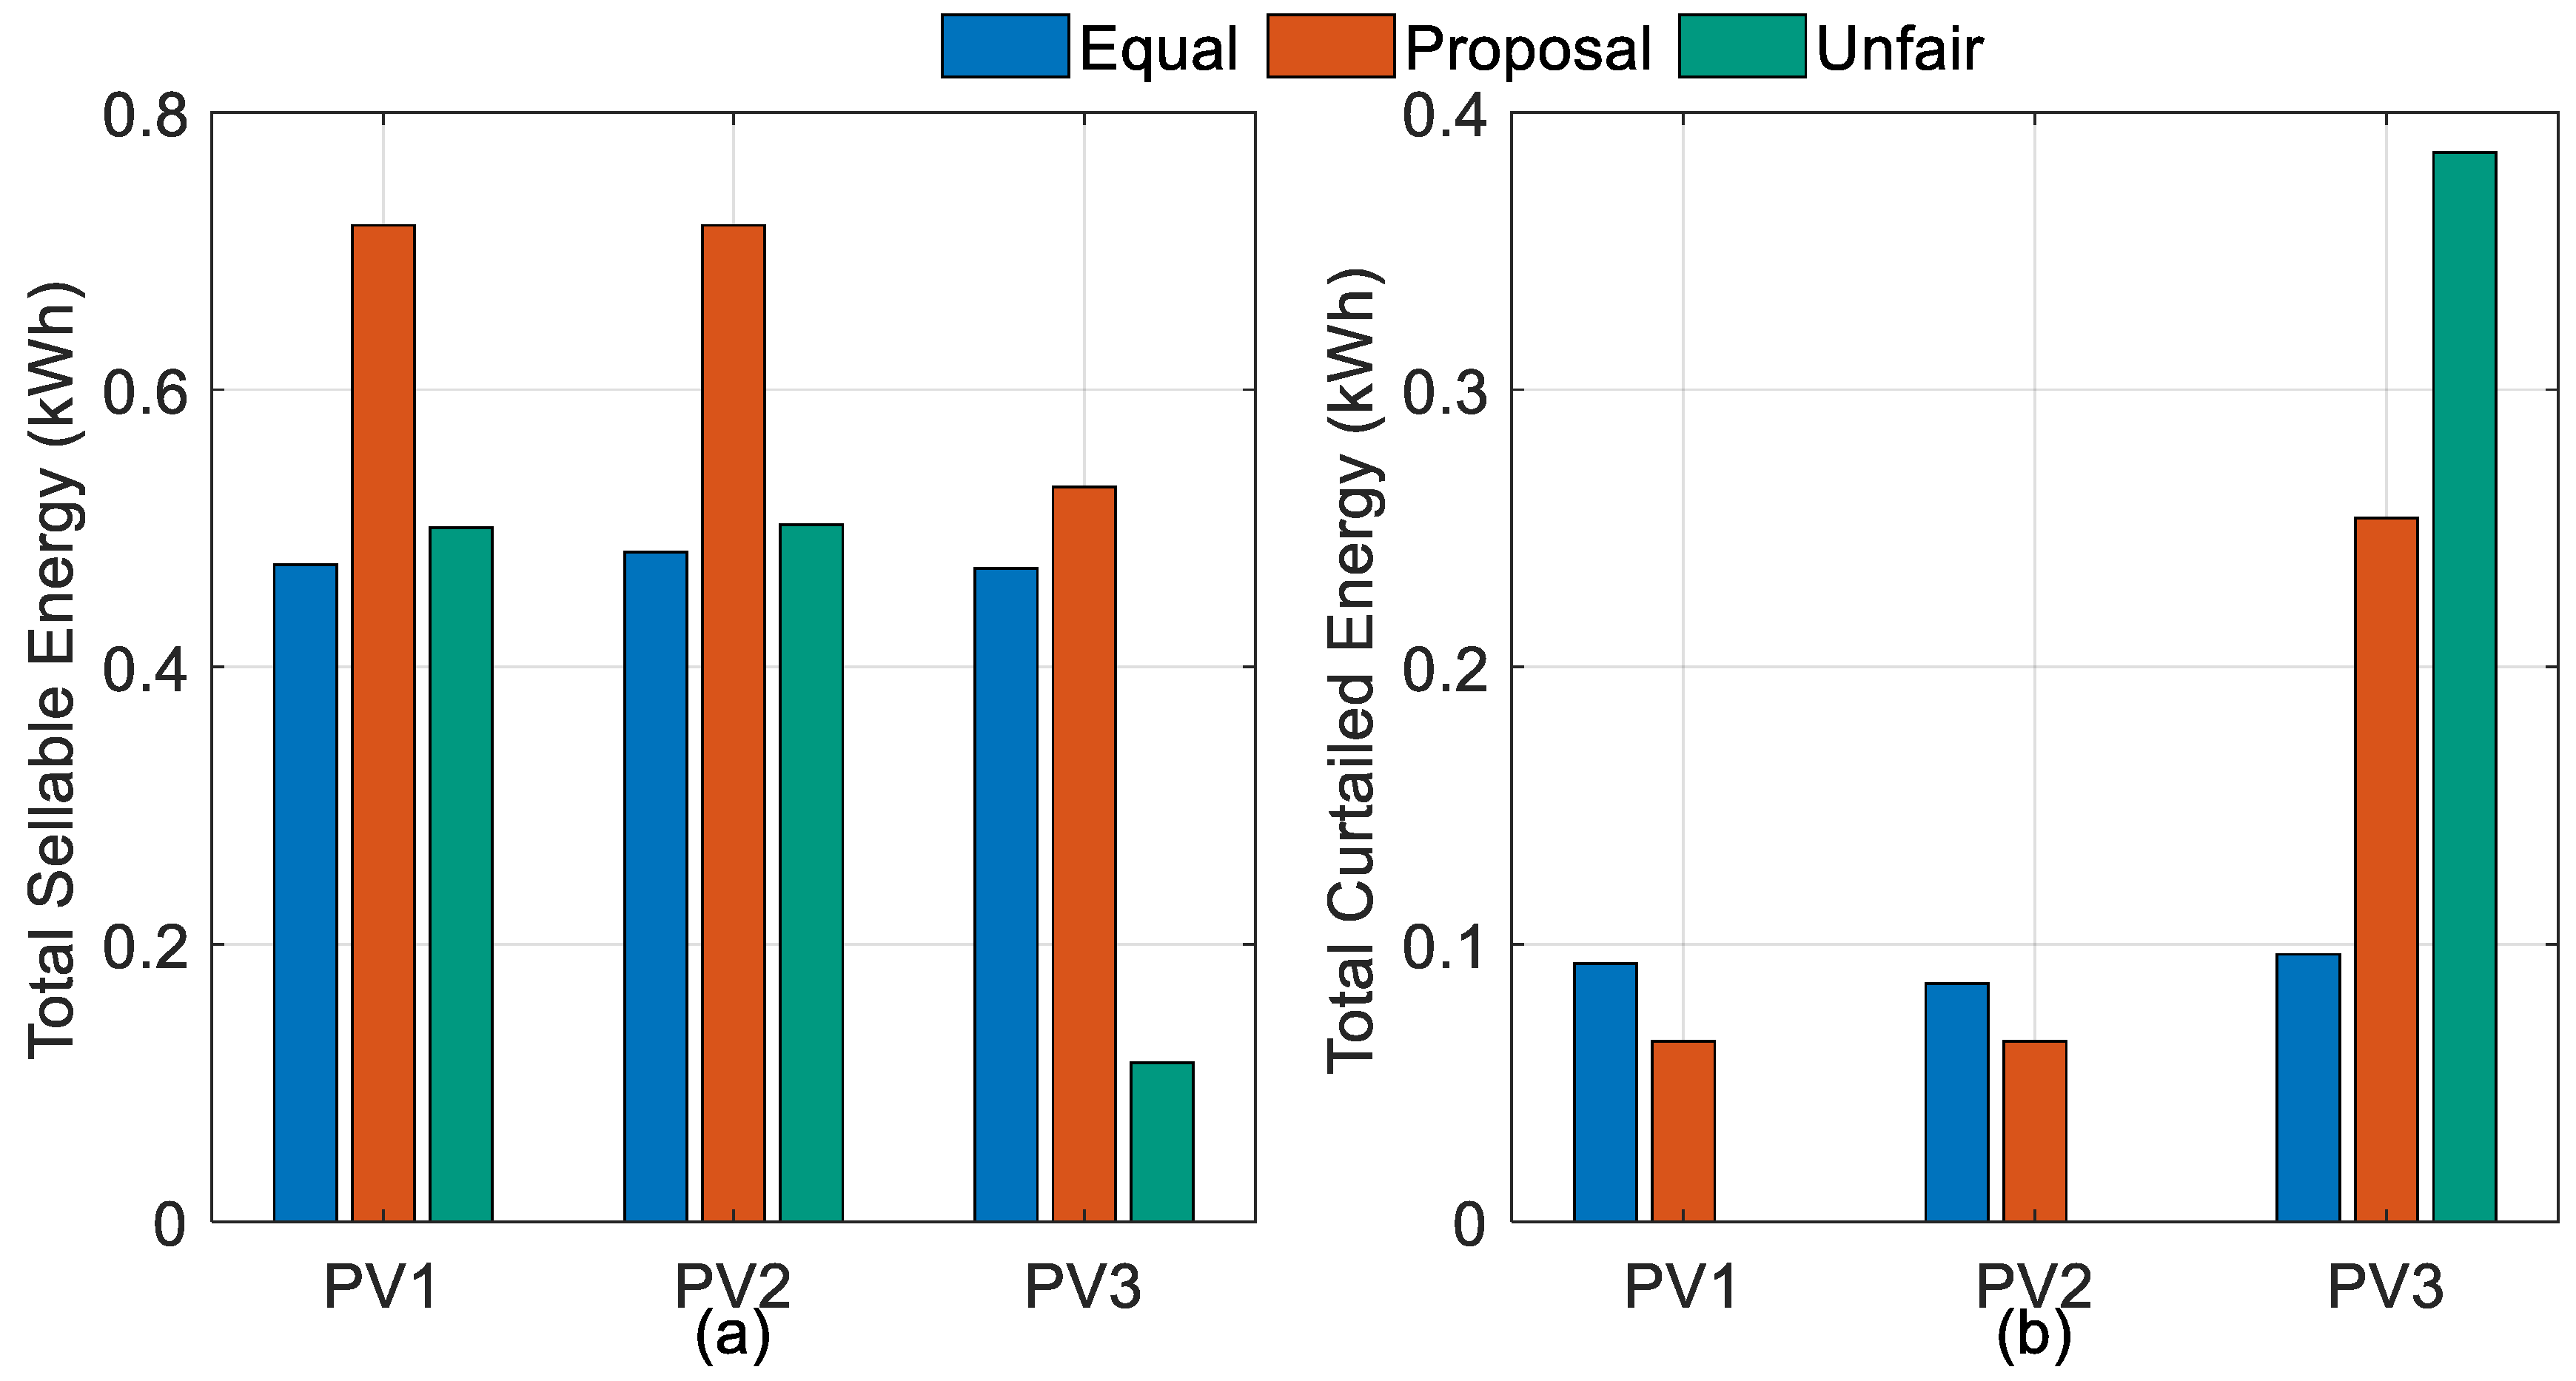
Figure 7a compares the total sellable energy delivered by each PV across the three strategies: under the equal curtailment scheme all three units generated nearly the same amount (PV1 0.474 kWh, PV2 0.483 kWh, PV3 0.471 kWh; consistent with its perfect fairness), whereas under the unfair scheme PV1 and PV2 produced significantly more energy than PV3 (PV1 0.500 kWh, PV2 0.503 kWh vs. PV3 0.114 kWh, whose contribution was minimal). The proposed CI-based strategy achieved an intermediate result—Figure 7a shows that PV3’s total delivered energy was much higher than in the unfair case (0.530 kWh) and closer to the levels of PV1 and PV2 (each 0.718 kWh), though still slightly lower than each of the other two, reflecting a more equitable sharing of generation opportunities. The higher energy values for PV1 and PV2 under the proposed method compared to both baseline methods result from its adaptive nature, which allows upstream PVs to utilize available voltage headroom during load variations while maintaining fairness, rather than maintaining strictly equal curtailment across all units. Figure 7b further highlights the differences in curtailment distribution. In the unfair approach, almost all curtailed energy came from PV3 (PV3 0.386 kWh; PV1 0.000 kWh, PV2 0.000 kWh), whereas the equal method curtailed each PV by an almost identical amount (PV1 0.093 kWh, PV2 0.086 kWh, PV3 0.096 kWh). By contrast, the proposed method spread the curtailment burden across all three units (PV1 0.065 kWh, PV2 0.065 kWh, PV3 0.254 kWh): PV3 still had the largest curtailed portion (as it is most prone to overvoltage), but PV1 and PV2 also curtailed some output, avoiding the extreme imbalance of the unfair method. As a result, the Jain’s fairness index for the proposed strategy remained very high throughout the experiment. It was nearly perfect at the start (0.995) and even during the most challenging low-load condition (0.997), dipping to a still-high value of 0.950 during the final load stage. No sudden drops in fairness occurred (in contrast to the unfair method), indicating that the CI-based proposal dynamically allocates curtailment so that all PV systems share the burden to some degree and none is completely shut off unless absolutely necessary.
These experimental results based on integrated energy measurements demonstrate a major advantage of the proposed curtailment scheme: it achieved better performance on both fronts—nearly equal fairness to the ideal case and a 37.7% higher total energy output than equal curtailment—whereas the unfair approach suffered from unacceptable fairness and was counterproductive in energy terms, yielding 21.8% less energy than equal curtailment under real conditions. These percentages represent the change in total integrated energy sold compared to the equal curtailment baseline. In summary, the experimental validation confirms that the proposed CI-based curtailment method can successfully balance the competing objectives of fairness and energy maximization when mitigating overvoltage, even when subject to practical factors like changing irradiance and non-uniform step durations. The close alignment between simulation and experimental energy outcomes supports the practicality of the proposed curtailment scheme for real-world PV integration.
The proposed CI method accounts for different PV capacities through the C S ( i ) factor in Equation (11), which scales each PV’s contribution by its rated capacity. This allows panels of different sizes or nameplate efficiencies to be accommodated in the curtailment decision. In practice, performance variations due to factors such as aging, degradation, or manufacturing cost (which affect the actual power output) would be reflected in the measured P i n i t i and thus incorporated by the algorithm’s adaptive process. A detailed analysis of the impact of these specific hardware factors on the long-term performance and economics of the curtailment strategy was beyond the scope of this validation study but represents a potential avenue for future work.

5. Conclusions

In this study, an adaptative fairness-based curtailment approach that balanced fair-ness and energy sales dynamically and kept the voltage compliant was proposed. The primary contribution of this work is the development and demonstration of this adaptive CI-based strategy, which improves upon conventional methods such as those using fixed setpoints or those solely focused on fairness by incorporating real-time dynamic response, validated through both simulation and experiment. By utilizing a curtailment index to continuously redistribute curtailment among three PV systems, the scheme prevents any single PV from experiencing a disproportional reduction in output. Simulation results demonstrated that the CI-based strategy achieves near-ideal fairness (Jain’s index > 0.99) while also increasing the total energy sold by 34.5% compared to the equal curtailment baseline, capturing a significant portion of the energy gain available from the unfair strategy while substantially improving the equity of curtailment distribution. These findings were experimentally validated on PAGLIA ORBA microgrid: the proposed CI-based curtailment method kept all PVs actively contributing during low-load periods and thereby slightly surpassed the total energy of the equal curtailment method by 37.7%, all while maintaining a very high fairness index (Jain’s index > 0.95). In contrast, the unfair curtailment strategy in the experiment caused one PV to be fully curtailed without boosting others, since they were already operating at their instantaneous maximum available power, resulting in poor fairness (JFI as low as 0.667) and a net energy loss of 21.8% compared to the equal curtailment baseline. The close alignment between simulation and experimental outcomes supports the practicality of the proposed curtailment scheme for real-world PV integration.
While the results demonstrate the method’s effectiveness, some limitations remain. Variations in actual PV output due to weather conditions constrained the full realization of rated inverter capacities in the experiments. Minor deviations among PV outputs—even under the equal curtailment method—are expected because measurements are noisy and updated every 3 s, and the inverters track setpoints with finite ramp rates and response delays. As a result, the three units cannot maintain exactly identical power simultaneously and their integrated energies differ slightly. Additionally, during the experiment PV1 and PV2 were already at their irradiance-limited maxima, so curtailing another PV could not be offset by increases from the others. Despite these practical constraints, the proposed method performed robustly, indicating tolerance to real-world operating conditions.
This study validated the adaptive fairness algorithm within a fixed network configuration. Strategies such as integration with battery energy storage systems or dynamic distributed generation (DG) placement optimization were not implemented as they were beyond the focus of validating the curtailment strategy. Future work will improve response time (faster sampling/updates, improved filtering) and explore integration with battery energy storage systems and demand-side management to enhance grid flexibility and reduce curtailment losses. Additionally, longer experiments during high and low irradiance periods will be conducted to test robustness using the same three-PV testbed. The strategy will also be evaluated on larger, more complex network structures to assess scalability under realistic grid conditions. A systematic comparison with a wider range of curtailment algorithms will be undertaken to clarify relative performance and identify suitable application scenarios for the proposed method.

Author Contributions

Conceptualization, F.M.I., M.I. and G.A.F.; Methodology, F.M.I. and M.I.; Software, F.M.I.; Validation, R.S., A.T. and G.A.F.; Formal analysis, F.M.I. and R.S.; Investigation, R.S., A.T. and G.A.F.; Resources, M.I.; Data curation, F.M.I.; Writing—original draft, F.M.I.; Writing—review and editing, F.M.I.; Visualization, M.I. and G.A.F.; Supervision, R.S., A.T., M.I. and G.A.F. All authors have read and agreed to the published version of the manuscript.

Funding

This research received no external funding.

Data Availability Statement

The original contributions presented in this study are included in the article. Further inquiries can be directed to the corresponding author.

Conflicts of Interest

The authors declare no conflicts of interest.

References

  1. Hassan, Q.; Viktor, P.; Al-Musawi, T.J.; Mahmood Ali, B.; Algburi, S.; Alzoubi, H.M.; Khudhair Al-Jiboory, A.; Zuhair Sameen, A.; Salman, H.M.; Jaszczur, M. The renewable energy role in the global energy Transformations. Renew. Energy Focus 2024, 48, 100545. [Google Scholar] [CrossRef]
  2. Hossain, M.S.; Wadi Al-Fatlawi, A.; Kumar, L.; Fang, Y.R.; Assad, M.E.H. Solar PV high-penetration scenario: An overview of the global PV power status and future growth. Energy Syst. 2024. [Google Scholar] [CrossRef]
  3. Liu, M.Z.; Procopiou, A.T.; Petrou, K.; Ochoa, L.F.; Langstaff, T.; Harding, J.; Theunissen, J. On the Fairness of PV Curtailment Schemes in Residential Distribution Networks. IEEE Trans. Smart Grid 2020, 11, 4502–4512. [Google Scholar] [CrossRef]
  4. Stringer, N.; Haghdadi, N.; Bruce, A.; MacGill, I. Fair consumer outcomes in the balance: Data driven analysis of distributed PV curtailment. Renew. Energy 2021, 173, 972–986. [Google Scholar] [CrossRef]
  5. Alboaouh, K.A.; Mohagheghi, S. Impact of Rooftop Photovoltaics on the Distribution System. J. Renew. Energy 2020, 2020, 4831434. [Google Scholar] [CrossRef]
  6. Iria, J.; Scott, P.; Attarha, A.; Gordon, D.; Franklin, E. MV-LV network-secure bidding optimisation of an aggregator of prosumers in real-time energy and reserve markets. Energy 2022, 242, 122962. [Google Scholar] [CrossRef]
  7. Iria, J.; Coelho, A.; Soares, F. Network-secure bidding strategy for aggregators under uncertainty. Sustain. Energy Grids Netw. 2022, 30, 100666. [Google Scholar] [CrossRef]
  8. O’Shaughnessy, E.; Cruce, J.R.; Xu, K. Too much of a good thing? Global trends in the curtailment of solar PV. Sol. Energy 2020, 208, 1068–1077. [Google Scholar] [CrossRef] [PubMed]
  9. Sharma, V.; Aziz, S.M.; Haque, M.H.; Kauschke, T. Effects of high solar photovoltaic penetration on distribution feeders and the economic impact. Renew. Sustain. Energy Rev. 2020, 131, 110021. [Google Scholar] [CrossRef]
  10. Golden, R.; Paulos, B. Curtailment of Renewable Energy in California and Beyond. Electr. J. 2015, 28, 36–50. [Google Scholar] [CrossRef]
  11. O’Shaughnessy, E.; Cruce, J.; Xu, K. Rethinking solar PV contracts in a world of increasing curtailment risk. Energy Econ. 2021, 98, 105264. [Google Scholar] [CrossRef]
  12. Fatima, S.; Püvi, V.; Pourakbari-Kasmaei, M.; Lehtonen, M. Photovoltaic hosting capacity improvement based on the economic comparison between curtailment and network upgrade. IET Gener. Transm. Distrib. 2023, 17, 3848–3860. [Google Scholar] [CrossRef]
  13. Midha, A.; Rai, P.; Lamba, G.; Shashank; Tomar, A. Preventing Photovoltaic Curtailment in India: A Brief Analysis. In Proceedings of the Digital Communication and Soft Computing Approaches Towards Sustainable Energy Developments; Panda, G., Ramasamy, T.N., Ben Elghali, S., Affijulla, S., Eds.; Springer: Singapore, 2024; pp. 207–216. [Google Scholar]
  14. Bunagan, J.M.P.; Gonzales, R.C.T.; Pedrasa, M.A.A. Economic Evaluation of PV Generation Curtailment and Voltage Regulation Investment in Distribution Networks with High PV Penetration. In Proceedings of the Sustainable Energy for Smart Cities; Afonso, J.L., Monteiro, V., Pinto, J.G., Eds.; Springe: Cham, Switzerland, 2020; pp. 165–179. [Google Scholar]
  15. Gupta, R.; Pena-Bello, A.; Streicher, K.N.; Roduner, C.; Farhat, Y.; Thöni, D.; Patel, M.K.; Parra, D. Spatial analysis of distribution grid capacity and costs to enable massive deployment of PV, electric mobility and electric heating. Appl. Energy 2021, 287, 116504. [Google Scholar] [CrossRef]
  16. Shayani, R.A.; de Oliveira, M.A.G. Photovoltaic Generation Penetration Limits in Radial Distribution Systems. IEEE Trans. Power Syst. 2011, 26, 1625–1631. [Google Scholar] [CrossRef]
  17. Jenkins, N.; Thornycroft, J. Chapter II-3-A—Grid Connection of Photovoltaic Systems: Technical and Regulatory Issues. In McEvoy’s Handbook of Photovoltaics (Third Edition); Kalogirou, S.A., Ed.; Academic Press: Cambridge, MA, USA, 2018; pp. 847–876. ISBN 978-0-12-809921-6. [Google Scholar]
  18. Khalid, M. Smart grids and renewable energy systems: Perspectives and grid integration challenges. Energy Strategy Rev. 2024, 51, 101299. [Google Scholar] [CrossRef]
  19. Sandelic, M.; Sangwongwanich, A.; Blaabjerg, F. Effects of PV Panel and Battery Degradation on PV-Battery System Performance and Economic Profitability. In Proceedings of the 2020 22nd European Conference on Power Electronics and Applications (EPE’20 ECCE Europe), Lyon, France, 7–11 September 2020; pp. P.1–P.10. [Google Scholar]
  20. Li, J.; Xiong, R.; Mu, H.; Cornélusse, B.; Vanderbemden, P.; Ernst, D.; Yuan, W. Design and real-time test of a hybrid energy storage system in the microgrid with the benefit of improving the battery lifetime. Appl. Energy 2018, 218, 470–478. [Google Scholar] [CrossRef]
  21. Pallonetto, F.; De Rosa, M.; D’Ettorre, F.; Finn, D.P. On the assessment and control optimisation of demand response programs in residential buildings. Renew. Sustain. Energy Rev. 2020, 127, 109861. [Google Scholar] [CrossRef]
  22. Honarmand, M.E.; Hosseinnezhad, V.; Hayes, B.; Shafie-Khah, M.; Siano, P. An Overview of Demand Response: From its Origins to the Smart Energy Community. IEEE Access 2021, 9, 96851–96876. [Google Scholar] [CrossRef]
  23. Vergara, P.P.; Salazar, M.; Mai, T.T.; Nguyen, P.H.; Slootweg, H. A comprehensive assessment of PV inverters operating with droop control for overvoltage mitigation in LV distribution networks. Renew. Energy 2020, 159, 172–183. [Google Scholar] [CrossRef]
  24. Alonso, A.M.S.; Arenas, L.D.O.; Brandao, D.I.; Tedeschi, E.; Marafao, F.P. Integrated Local and Coordinated Overvoltage Control to Increase Energy Feed-In and Expand DER Participation in Low-Voltage Networks. IEEE Trans. Sustain. Energy 2022, 13, 1049–1061. [Google Scholar] [CrossRef]
  25. Currie, G.; Evans, R.; Duffield, C.; Mareels, I. Policy Options to Regulate PV in Low Voltage Grids-Australian Case with International Implications. Technol. Econ. Smart Grids Sustain. Energy 2019, 4, 10. [Google Scholar] [CrossRef]
  26. Petrou, K.; Procopiou, A.T.; Gutierrez-Lagos, L.; Liu, M.Z.; Ochoa, L.F.; Langstaff, T.; Theunissen, J.M. Ensuring Distribution Network Integrity Using Dynamic Operating Limits for Prosumers. IEEE Trans. Smart Grid 2021, 12, 3877–3888. [Google Scholar] [CrossRef]
  27. Lankeshwara, G. A Real-time Control Approach to Maximise the Utilisation of Rooftop PV Using Dynamic Export Limits. In Proceedings of the 2021 IEEE PES Innovative Smart Grid Technologies—Asia (ISGT Asia), Brisbane, Australia, 5–8 December 2021; pp. 1–5. [Google Scholar]
  28. Ricciardi, T.R.; Petrou, K.; Franco, J.F.; Ochoa, L.F. Defining Customer Export Limits in PV-Rich Low Voltage Networks. IEEE Trans. Power Syst. 2019, 34, 87–97. [Google Scholar] [CrossRef]
  29. Poudel, S.; Mukherjee, M.; Reiman, A.P. A Fairness-Based Distributed Energy Coordination for Voltage Regulation in Distribution Systems. In Proceedings of the 2022 IEEE Green Technologies Conference (GreenTech), Huston, TX, USA, 30 March–1 April 2022; pp. 45–50. [Google Scholar]
  30. Procopiou, A.T.; Petrou, K.; Ochoa, L.F.; Langstaff, T.; Theunissen, J. Adaptive Decentralized Control of Residential Storage in PV-Rich MV–LV Networks. IEEE Trans. Power Syst. 2019, 34, 2378–2389. [Google Scholar] [CrossRef]
  31. Yildiz, B.; Stringer, N.; Adams, S.; Samarakoon, S.; Bruce, A.; Macgill, I.; Sproul, A.B. Curtailment and network voltage analysis study. In Proceedings of the 2021 IEEE PES Innovative Smart Grid Technologies—Asia (ISGT Asia), Brisbane, Australia, 5–8 December 2021; pp. 1–5. [Google Scholar]
  32. Mukherjee, M.; Poudel, S.; Sadnan, R.; Slay, T.E.; Reiman, A.P. Enabling Fairness in Distributed PV Curtailment for Voltage Regulation: A Comparative Analysis. In Proceedings of the 2024 IEEE Power & Energy Society Innovative Smart Grid Technologies Conference (ISGT), Washington, DC, USA, 19–22 February 2024; pp. 1–5. [Google Scholar]
  33. Itote, F.M.; Shigenobu, R.; Takahashi, A.; Ito, M. A Balanced Energy Sale Method Considering Network Constraints and Fairness. In Power, Energy and Electrical Engineering; IOS Press: Amsterdam, The Netherlands, 2024; pp. 425–434. [Google Scholar]
  34. SMA Solar Technology AG Technical Data—Sunny Tripower STP 15000TL/17000TL-10. Available online: https://manuals.sma.de/STPTL-10/en-US/43470603.html (accessed on 21 October 2025).
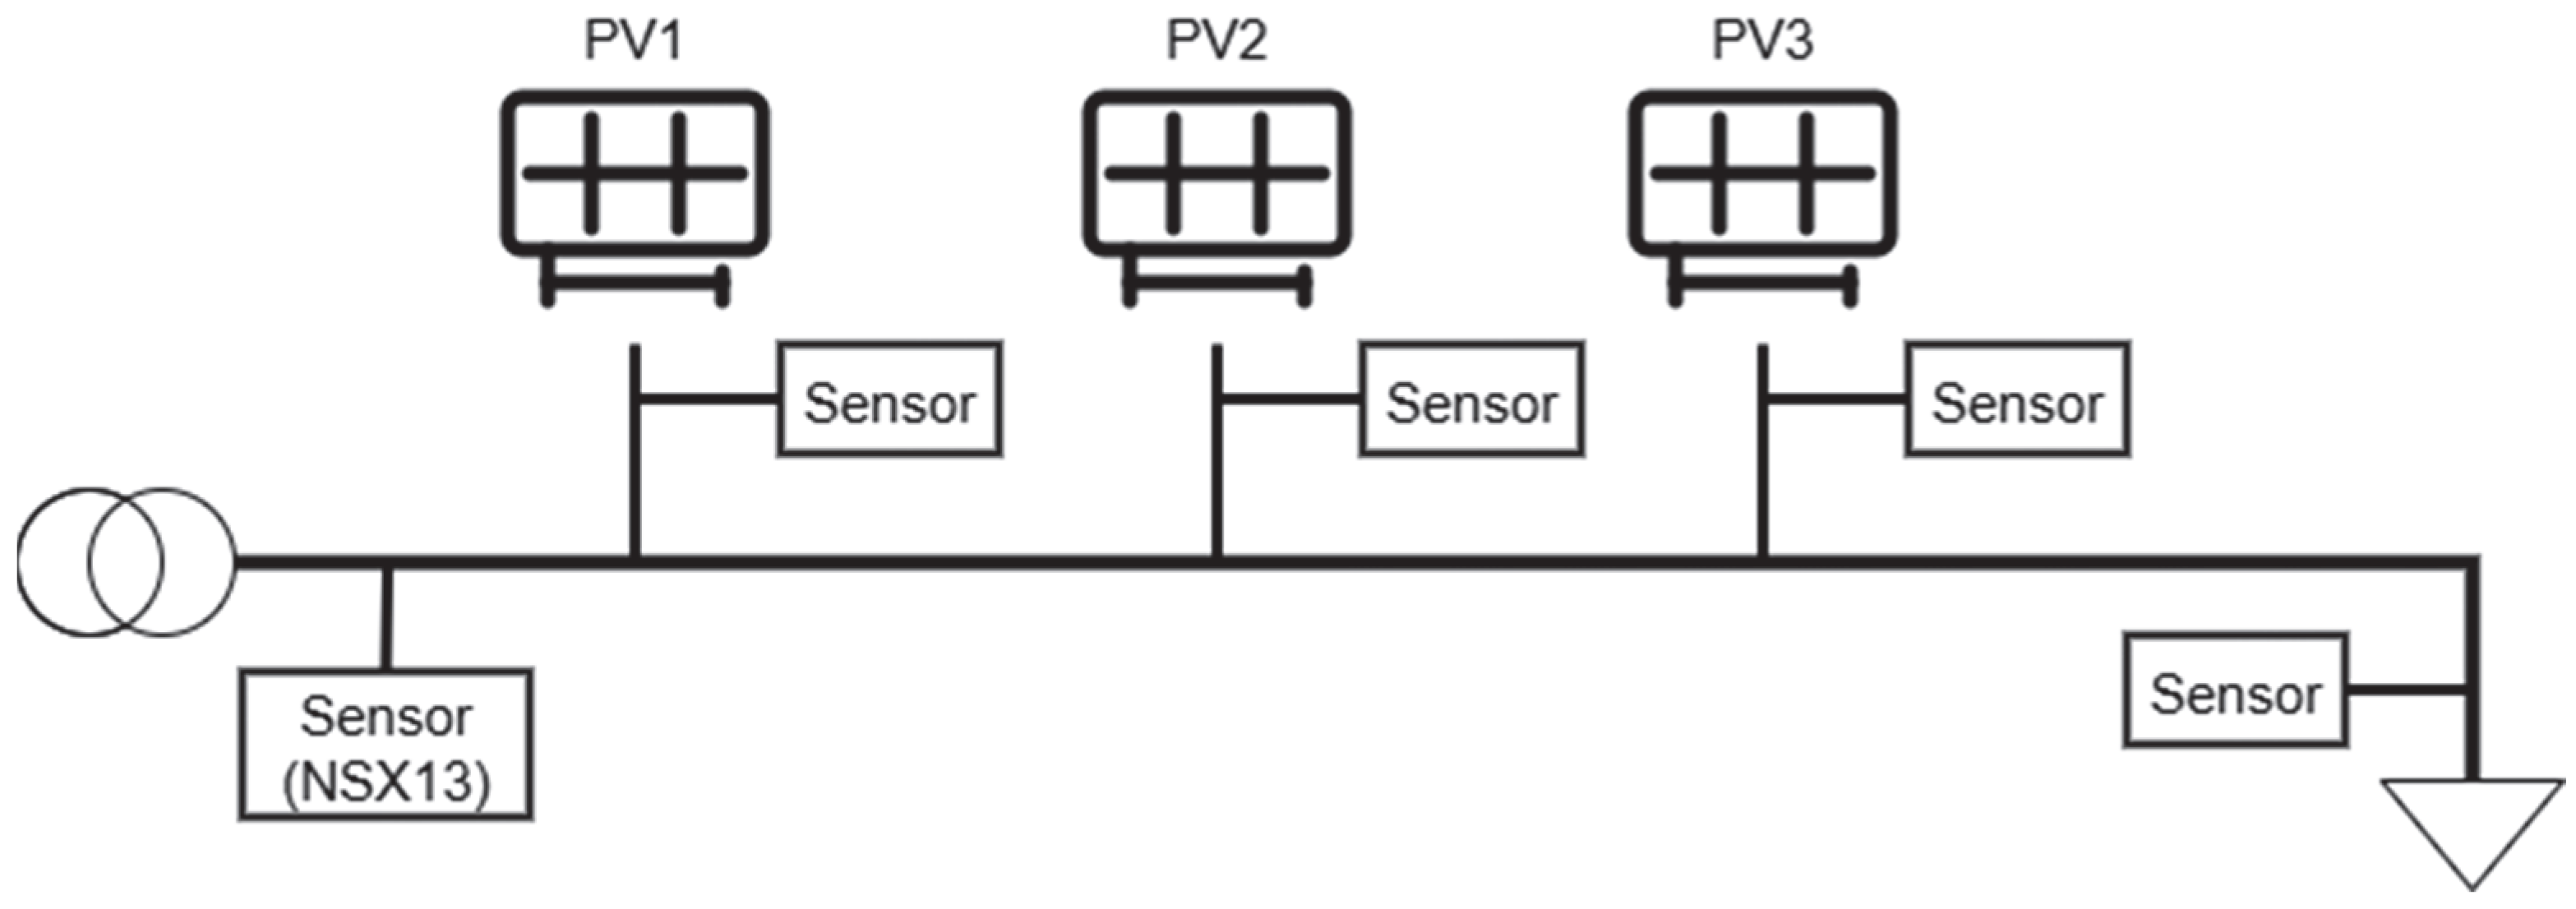
Figure 1. Network model used for simulation and experiment. Sensors at PCC (NSX13), each PV bus (PV1–PV3), and the terminal load bus provide the voltage measurements used by the curtailment algorithms to keep feeder voltages within allowable limits.
Energies 18 05676 g001
Figure 2. Flowchart of the simulation and experimental process for curtailment strategy validation.
Energies 18 05676 g002
Figure 3. Sellable and curtailed power for (a) PV1, (b) PV2, and (c) PV3 systems.
Energies 18 05676 g003
Figure 4. Voltage profiles for (a) PV1, (b) PV2, and (c) PV3 systems.
Energies 18 05676 g004
Figure 5. Total energy per PV by curtailment method using experiment response times: (a) sellable, (b) curtailed. Bars show equal, proposal, and unfair; load steps 4→2→5 kW.
Energies 18 05676 g005
Figure 6. Sellable (solid) and curtailed (dashed) power (W) vs. load level (4→2→5 kW) for PV1–PV3 under Equal, Proposal, and Unfair methods: (a) PV1, (b) PV2, (c) PV3.
Energies 18 05676 g006
Figure 7. Total energy per PV by curtailment method: (a) sellable, (b) curtailed. Bars show Equal, Proposal, and Unfair; energies integrate 3 s power over each method window (load steps 4→2→5 kW).
Energies 18 05676 g007
Table 1. Key parameters of the network model.
ParameterValue
Distance between components300 m
Base voltage400 V
Base power50 kVA
Resistance per km0.25 Ω
Reactance per km0.3063 Ω
Table 2. Simulation results: Total sellable power (W) and Jain’s fairness index (JFI) for Equal, Proposal, and Unfair methods at 4 kW, 2 kW, and 5 kW load steps.
Curtailment Method4 kW Load2 kW Load5 kW Load
Power (kW)JFIPower (kW)JFIPower (kW)JFI
Equal 24.00121.12124.901
Proposal24.30 (+1.25%)0.99721.36 (+1.12%)0.99024.90 (+0.00%)1
Unfair25.00 (+4.17%)0.92622.40 (+6.06%)0.81325.50 (+2.41%)0.941
Notes: Percentages show change from equal curtailment at each load step.
Table 3. Experimental results: Total sellable power (W) and Jain’s Fairness Index (JFI) for Equal, Proposal, and Unfair at 4 kW, 2 kW, and 5 kW load steps.
Curtailment Method4 kW Load2 kW Load5 kW Load
Power (kW)JFIPower (kW)JFIPower (kW)JFI
Equal 30.00123.30124.901
Proposal28.60 (−4.67%)0.99524.50 (+5.15%)0.99725.80 (+3.61%)0.950
Unfair30.00 (+0.00%)124.90 (+6.87%)0.92320.10 (−19.28%)0.667
Note: Percentages show change from equal curtailment at each load step.
Disclaimer/Publisher’s Note: The statements, opinions and data contained in all publications are solely those of the individual author(s) and contributor(s) and not of MDPI and/or the editor(s). MDPI and/or the editor(s) disclaim responsibility for any injury to people or property resulting from any ideas, methods, instructions or products referred to in the content.