1. Introduction
The increasing decentralization of power systems, fueled by technological advances and policy-driven renewable energy targets, has led to a paradigmatic shift in how electricity networks are structured, operated, and planned [
1,
2]. Within this broader transformation, microgrids have emerged as a cornerstone technology for enhancing system flexibility, resilience, and sustainability. Unlike traditional centralized systems, microgrids support localized generation, demand-side management, and often incorporate distributed storage [
3,
4]. They are uniquely positioned to operate in both grid-connected and islanded modes, thereby offering operational autonomy during planned disconnections or in response to severe disruptions such as storms, wildfires, or cyber-attacks [
5]. In particular, islanded microgrids—networks capable of operating in complete isolation from the main utility grid—have become a critical focus area in resilience engineering [
2,
6]. Their importance is magnified in regions that are disaster-prone, infrastructurally vulnerable, or characterized by limited grid access. Yet, sustaining reliable operation during extended periods of islanding is far more complex than in grid-connected conditions [
7,
8]. The absence of a centralized frequency and voltage reference, combined with the intermittency of renewable generation and the variability of local loads, creates a volatile and highly coupled system dynamic [
9]. This renders the conventional dispatch and planning models insufficient, especially when they assume static profiles, neglect transient phenomena, or fail to integrate the active role of power electronics-based resources.
One of the most transformative technological advances in this context is the rise of grid-forming energy storage systems (GFES). Unlike traditional grid-following storage devices, which require an external grid signal to synchronize, grid-forming units establish their own voltage and frequency references through advanced control algorithms and can operate as the de facto grid under islanded conditions [
10]. Through emulation of inertia, voltage ride-through support, and autonomous synchronization capabilities, GFES units provide system-stabilizing services that were previously exclusive to large synchronous generators [
11,
12]. The rapid deployment of these technologies—enabled by improvements in power electronics, control theory, and energy management systems—opens new opportunities for resilient microgrid design. Yet, despite their growing presence in field demonstrations and control studies, the formal inclusion of GFES dynamics into the energy planning process remains limited in both scope and methodological sophistication [
13].
From a modeling standpoint, the vast majority of energy storage planning studies still treat batteries as passive assets, focusing primarily on arbitrage, peak shaving, or time-shifted renewable utilization [
14,
15]. These models tend to be formulated using deterministic or scenario-based stochastic programming, with the main objective being the minimization of total cost or the maximization of expected net benefits over a planning horizon [
16,
17]. While some studies introduce temporal constraints such as SoC continuity or degradation penalties, the overwhelming majority ignore the fact that storage systems in islanded microgrids must simultaneously function as grid stabilizers [
18], not just energy buffers. This omission creates a disconnect between the physical requirements of islanded operation and the planning decisions being made upstream.
Addressing uncertainty in planning models has been a longstanding focus of the energy systems community. Stochastic programming frameworks represent uncertain inputs such as renewable output and load using discrete scenarios or probability distributions [
19,
20]. These models typically optimize for the expected value of cost or performance metrics, sometimes with additional variance-based or chance-constrained robustness enhancements [
21]. While these methods have achieved considerable success in day-ahead markets, reserve scheduling, and generation expansion problems, their application to islanded microgrid planning is challenged by the difficulty of specifying accurate distributions and the high sensitivity to rare but damaging events [
22].
A more recent and theoretically grounded approach is distributionally robust optimization (DRO), where the goal is to minimize the worst-case expected cost over an ambiguity set of probability distributions [
23,
24]. Within this class, Wasserstein-metric DRO has emerged as a particularly attractive formulation due to its mathematical tractability and its capacity to capture uncertainty neighborhoods defined around empirical data [
25]. Unlike moment-based or divergence-based ambiguity sets, Wasserstein DRO constructs a geometric ball around the empirical distribution, offering robust generalization even when sample data is sparse or non-stationary [
26,
27]. It has been successfully applied to energy dispatch, storage scheduling, and market bidding, but it is rarely coupled with control-theoretic modeling of dynamic behavior—especially not in islanded conditions.
Simultaneously, the field of inverter control for grid-forming behavior has matured significantly. Modern GFES systems employ droop control, virtual synchronous machine models, and adaptive inertial emulation techniques to maintain voltage and frequency stability [
28,
29]. Laboratory demonstrations and digital real-time simulations show that such systems can maintain synchronization under high penetration of renewables, resist voltage sags, and support black-start capabilities [
30,
31]. Beyond these technical advances, recent studies on robust optimization further strengthen the operational resilience of GFES-enabled microgrids. For instance, Boroumandfar et al. [
28] developed a single- and multi-objective robust optimization framework that explicitly incorporates risk uncertainty measures and energy loss considerations, thereby improving the planning and operation of renewable-integrated distribution networks. Similarly, Nammouchi et al. [
29] proposed a cardinality-constrained
-Robust Optimization model, enhanced with machine learning for reference value definition, to effectively handle the asymmetrical uncertainties of renewable generation and load in mixed microgrids. Complementing these developments, Yang and Su [
30] introduced a two-stage robust optimization strategy that addresses renewable output and demand uncertainty as critical factors in microgrid design and management. Taken together, these works highlight that the evolution of GFES control not only relies on advanced inverter-side algorithms, but also on the integration of optimization frameworks capable of capturing uncertainty and risk, thus enabling stable, reliable, and economically efficient operation under high renewable penetrations. Yet these capabilities are generally modeled and analyzed in isolation, outside the context of long-term planning or investment optimization. Very few studies incorporate these dynamic behaviors directly into optimization models, and those that do often linearize or approximate the dynamics in ways that disconnect them from actionable planning decisions.
The integration of resilience into microgrid planning has also gained momentum. Recent literature considers not only steady-state reliability but also the ability of systems to maintain operational viability under disruptions. Models incorporating cyber–physical contingencies, network reconfiguration, and multi-stage fault recovery have appeared, particularly for urban microgrids and military installations. However, resilience is often approached in a binary fashion—systems are either “resilient” or not—without quantitatively linking resilience to dynamic metrics such as frequency deviation, voltage recovery time, or black-start reserve sufficiency [
32,
33].
This paper proposes a unified planning framework that overcomes these limitations by jointly addressing energy adequacy, grid-forming dynamic control, and distributional uncertainty. We formulate a multi-period, control-aware sizing model for GFES, structured as a Wasserstein DRO problem with a tractable convex reformulation. Our model embeds not only classical storage constraints but also virtual inertia requirements, voltage ride-through thresholds, and intertemporal black-start feasibility. Rather than relying on assumed distributions, the model leverages empirical data to construct ambiguity sets around renewable and load trajectories. The solution methodology employs a nested column-and-constraint generation algorithm, grounded in duality and convex decomposition, to identify worst-case distributions and robustly optimal sizing strategies. The resulting framework provides a systematic and scalable approach to GFES planning in islanded microgrids. Unlike prior works, it fully internalizes dynamic control functions into planning, moving beyond energy balancing toward holistic system stability under uncertainty. Empirical validations on a modified IEEE 33-bus system show substantial improvements over stochastic and deterministic baselines, and highlight how robust planning can exploit the sensitivity of nodes to frequency and voltage perturbations to guide the strategic siting of storage. This contribution brings together the traditionally siloed fields of robust optimization, dynamic grid control, and long-duration microgrid design into a coherent, actionable, and theoretically grounded decision-making framework.
Table 1 summarizes the main characteristics, strengths, and limitations of three prevailing paradigms for handling uncertainty in energy system planning—stochastic programming, classical robust optimization, and DRO—alongside the proposed Wasserstein DRO framework. The comparison highlights that stochastic programming delivers strong performance when probability distributions are accurately specified but may suffer under distributional misspecification, while classical robust optimization ensures reliability at the expense of potential over-conservatism. DRO offers a balanced trade-off by minimizing worst-case expected cost over an ambiguity set, with the Wasserstein formulation providing geometric interpretability and direct construction from empirical data. The proposed framework builds upon these advantages and integrates control-aware constraints for GFES planning, making it particularly suitable for high-uncertainty, resilience-focused microgrid applications.
2. Mathematical Modeling
This section establishes the mathematical formulation of the proposed planning problem for grid-forming energy storage (GFES) deployment in islanded microgrids [
34]. The objective is to determine the optimal siting, sizing, and operational configuration of GFES units so as to enhance system resilience, minimize economic costs, and ensure robust feasibility under renewable generation and load uncertainty. The microgrid is represented as a distribution network with a set of buses, lines, generation units, and controllable storage devices. The planning horizon is discretized into multiple time periods, during which demand, renewable output, and system states evolve according to network physics and operational constraints. Decision variables describe the installation capacities, dispatch profiles, and state-of-charge trajectories of GFES units, while parameters capture network topology, equipment characteristics, and uncertainty bounds. The model is formulated within a distributionally robust optimization framework to guarantee performance across all probability distributions within a Wasserstein ambiguity set [
35]. We have defined the definitions of the symbols in the Nomenclatures.
Equation (1) formulates the core distributionally robust optimization objective for microgrid planning with grid-forming energy storage. The outer minimization operates over three distinct sets of decision variables:
, representing installation capacity decisions for each node;
, denoting degradation-control settings; and
, comprising time-dependent operational dispatch decisions. The inner supremum is taken over all probability distributions
within the
-Wasserstein ambiguity set
, centered at the empirical joint distribution
of renewable generation
and load demand
, which are model parameters derived from historical or forecasted data. The expected cost term accumulates over the planning horizon
and across all network nodes
and technology configurations
. Within each summation,
denotes the capital cost coefficient for installed capacity
,
represents the unit degradation cost applied to degradation decisions
,
is the penalty rate for curtailed energy
, and
is the penalty rate for unserved demand
. All these coefficients are fixed parameters. This formulation thus captures the worst-case expected total cost—comprising investment, degradation, curtailment, and reliability penalties—over all admissible uncertainty distributions, ensuring robust performance under adverse renewable and demand realizations.
Equation (2) formalizes the capital investment cost associated with installing GFES units in candidate nodes
using a fully valid mathematical optimization formulation. The first summation
represents the linear base cost proportional to the installed capacity
, where
is the cost coefficient per unit capacity. The second summation
introduces discrete scaling penalties linked to configuration
, triggered only when capacity exceeds the predefined threshold
. This trigger is enforced through binary variables
and the linking constraint
. Such a formulation replaces informal indicator functions with integer constraints, ensuring compatibility with standard mixed-integer linear programming (MILP) solvers. It also preserves the original intent of modeling capacity-dependent step costs while maintaining computational tractability and engineering realism in the siting and sizing decisions.
Equation (3) reformulates the degradation cost as a mathematically valid expression separating the definition of accumulated charge/discharge energy from the cost computation. For each GFES unit
,
and
are calculated as the convex sum of charge and discharge power over time, raised to exponents
and
, respectively, to capture non-linear wear mechanisms such as depth-of-discharge effects and rate-dependent thermal stress. The cost coefficient
then scales the total degradation energy to its monetary impact. By structuring the model in this way, the degradation term can be integrated into convex programming frameworks without relying on informal notation, while still reflecting the real-world aging behavior of battery and inverter components.
Equation (4) expresses resilience-related penalties in a valid optimization format. The first term penalizes curtailed renewable generation
with weight
. The second term applies a cost
to unserved load
, capturing blackout severity. The third term quantifies penalties for voltage ride-through (VRT) stability violations, where
is a continuous auxiliary variable linked to the binary/continuous VRT indicator
. The linking constraint ensures that
activates whenever voltage recovery fails, thereby enabling smooth integration into linear or convex models without logical operators. This structure allows the resilience component to jointly address energy adequacy, load service continuity, and transient stability performance under uncertainty, all within a solver-friendly mathematical framework.
This fundamental nodal energy balance constraint ensures that, at every bus
and time step
, the net active power injected by local renewable generators
minus curtailed amounts
, combined with the net GFES discharging
and charging
, must exactly match the net load demand
minus any residual unmet load
. This enforces the critical supply–demand matching required for autonomous operation in islanded mode.
This constraint encodes the temporal evolution of the state-of-charge (SoC) of each GFES unit, reflecting both the efficiency-adjusted charging input and the efficiency-degraded discharging output. The parameters
and
denote the round-trip efficiencies for charging and discharging, respectively. This recursive update ensures intertemporal energy conservation and links operational decisions across the rolling time horizon.
To maintain technical feasibility and battery safety, the SoC must remain within lower and upper bounds
and
. These limits are crucial for both degradation management and ensuring backup reserves for black-start or stability-related services during extended islanded conditions.
Each GFES unit must operate within its technical charging and discharging bounds. The parameters
and
denote the rated power limits. These constraints ensure the physical realizability of dispatch plans and prevent overloading inverters or thermal runaway in batteries.
To ensure that black-start capability is preserved, each GFES must maintain a minimum emergency reserve
sufficient to deliver a predefined power level
over a black-start duration
. This ties storage planning not only to energy adequacy but also to contingency restoration readiness.
This linearized DC power flow constraint relates the net injection at node
to the voltage phase angles
across neighboring buses
, weighted by line resistances
. It captures the internal redistribution of power flows under islanded operation and forms the backbone of the microgrid’s nodal power calculations.
Voltage magnitude at each bus must remain within permissible operational bounds. The limits
and
are determined by inverter standards and end-use voltage requirements, ensuring power quality and protection coordination.
The reformulation replaces the continuous-time swing equation with a discrete-time representation compatible with solvers such as Gurobi 12.0.2. In Equation (12a), the term
approximates the derivative
using a forward difference scheme over the sampling interval
. The right-hand side retains the original physical structure, where
denotes the effective inertia constant,
is the active power discharged by the grid-forming energy storage unit
at time
, and
represents the total load demand. This net accelerating power governs the frequency evolution across time steps. Equation (12
) specifies the initial condition
, ensuring that the frequency trajectory is anchored to a known starting value. The bounds in Equation (12
),
for all
, enforce operational compliance with steady-state frequency limits defined by grid codes. In Equation (12d),
, the rate-of-change-of-frequency (RoCoF) is bounded in both directions to reflect transient stability constraints and to satisfy protection system requirements. By discretizing the original dynamic equation and embedding it within algebraic constraints, the model preserves the essential inertia–power–frequency relationship while enabling direct integration into mixed-integer or continuous optimization frameworks. This transformation allows for coupling with planning and operational decision variables, incorporation of uncertainty, and simultaneous enforcement of dynamic stability limits, all within a formulation that is computationally tractable for large-scale microgrid studies.
Voltage ride-through stability is maintained if the voltage at node
remains within tolerance
around the nominal value
. The binary variable
is activated when the condition holds, and is linked directly to resilience penalties and planning constraints.
Each node’s net injection must lie within the physical and inverter-based limits
, accounting for both safety margins and bidirectional power flows in GFES-equipped microgrids.
Renewable generation
and load demand
at each time step are assumed to be sampled from distributions within Wasserstein ambiguity sets
and
, respectively. This establishes a formal basis for robust decision-making under ambiguity.
The expected value of curtailed renewable generation under worst-case distribution must not exceed a tolerable bound
, ensuring that system design remains efficient even under pessimistic forecast conditions.
System-wide stability is preserved when the total voltage ride-through (VRT) capability, aggregated across all nodes and weighted by criticality scores
, exceeds a global resilience threshold
. This metric guarantees that the GFES portfolio jointly delivers system support during transients.
The optimal storage sizing at each node is influenced by a sensitivity-driven metric combining the partial derivative of frequency with respect to local discharging and a locational penalty term . This highlights how GFES placement is adaptively shifted toward dynamically influential buses.
3. Methodology
To establish the methodological foundation, we first consider a baseline formulation of the GFES planning problem under perfectly known renewable generation and load profiles. In this deterministic setting, system operation is described through standard power balance equations, network flow constraints, and storage charging–discharging dynamics, with the objective of minimizing investment and operational costs alongside service quality penalties. This simplified view clarifies the role of each decision variable and constraint before uncertainty is introduced. The model is then extended to account for variability and forecasting errors in renewable generation and load using the framework of DRO. Here, uncertainty is represented through an ambiguity set defined by the Wasserstein metric, which bounds the deviation between empirical and admissible probability distributions. This ensures robust feasibility across all distributions in the set, allowing the planner to hedge against worst-case operational conditions without requiring exact probabilistic knowledge. Leveraging duality theory and properties of the Wasserstein metric, we transform the inner worst-case expectation into a convex optimization problem that can be solved efficiently using a nested C & CG algorithm. The methodology accommodates empirical uncertainty through sample-based ambiguity sets and enforces robust feasibility across all adversarial distributions.
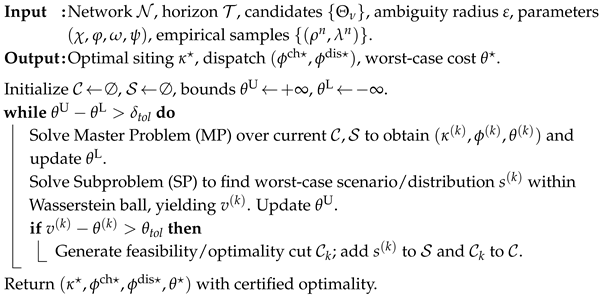
In this work, the C & CG procedure iteratively solves a master problem and a sequence of subproblems, progressively refining the feasible region until convergence is reached. The master problem contains the investment and operation decisions with a restricted set of constraints, while the subproblem—parameterized by the current master solution—identifies worst-case realizations within the ambiguity set that could violate feasibility or degrade objective performance. If such scenarios are found, corresponding feasibility or optimality cuts are generated and added back to the master problem. This process continues until no further cuts are produced, ensuring that the final solution is robust against all admissible uncertainty realizations. By integrating this iterative cut generation framework into the DRO-based GFES planning model, the approach captures the interplay between discrete investment choices, continuous operational dynamics, and stochastic variability. The design of the subproblem ensures computational tractability through convex reformulations, while the cut-management strategy limits problem growth and accelerates convergence. As a result, the proposed methodology is scalable to realistic microgrid systems and provides a transparent, step-by-step pathway for replication and extension in related robust planning contexts.
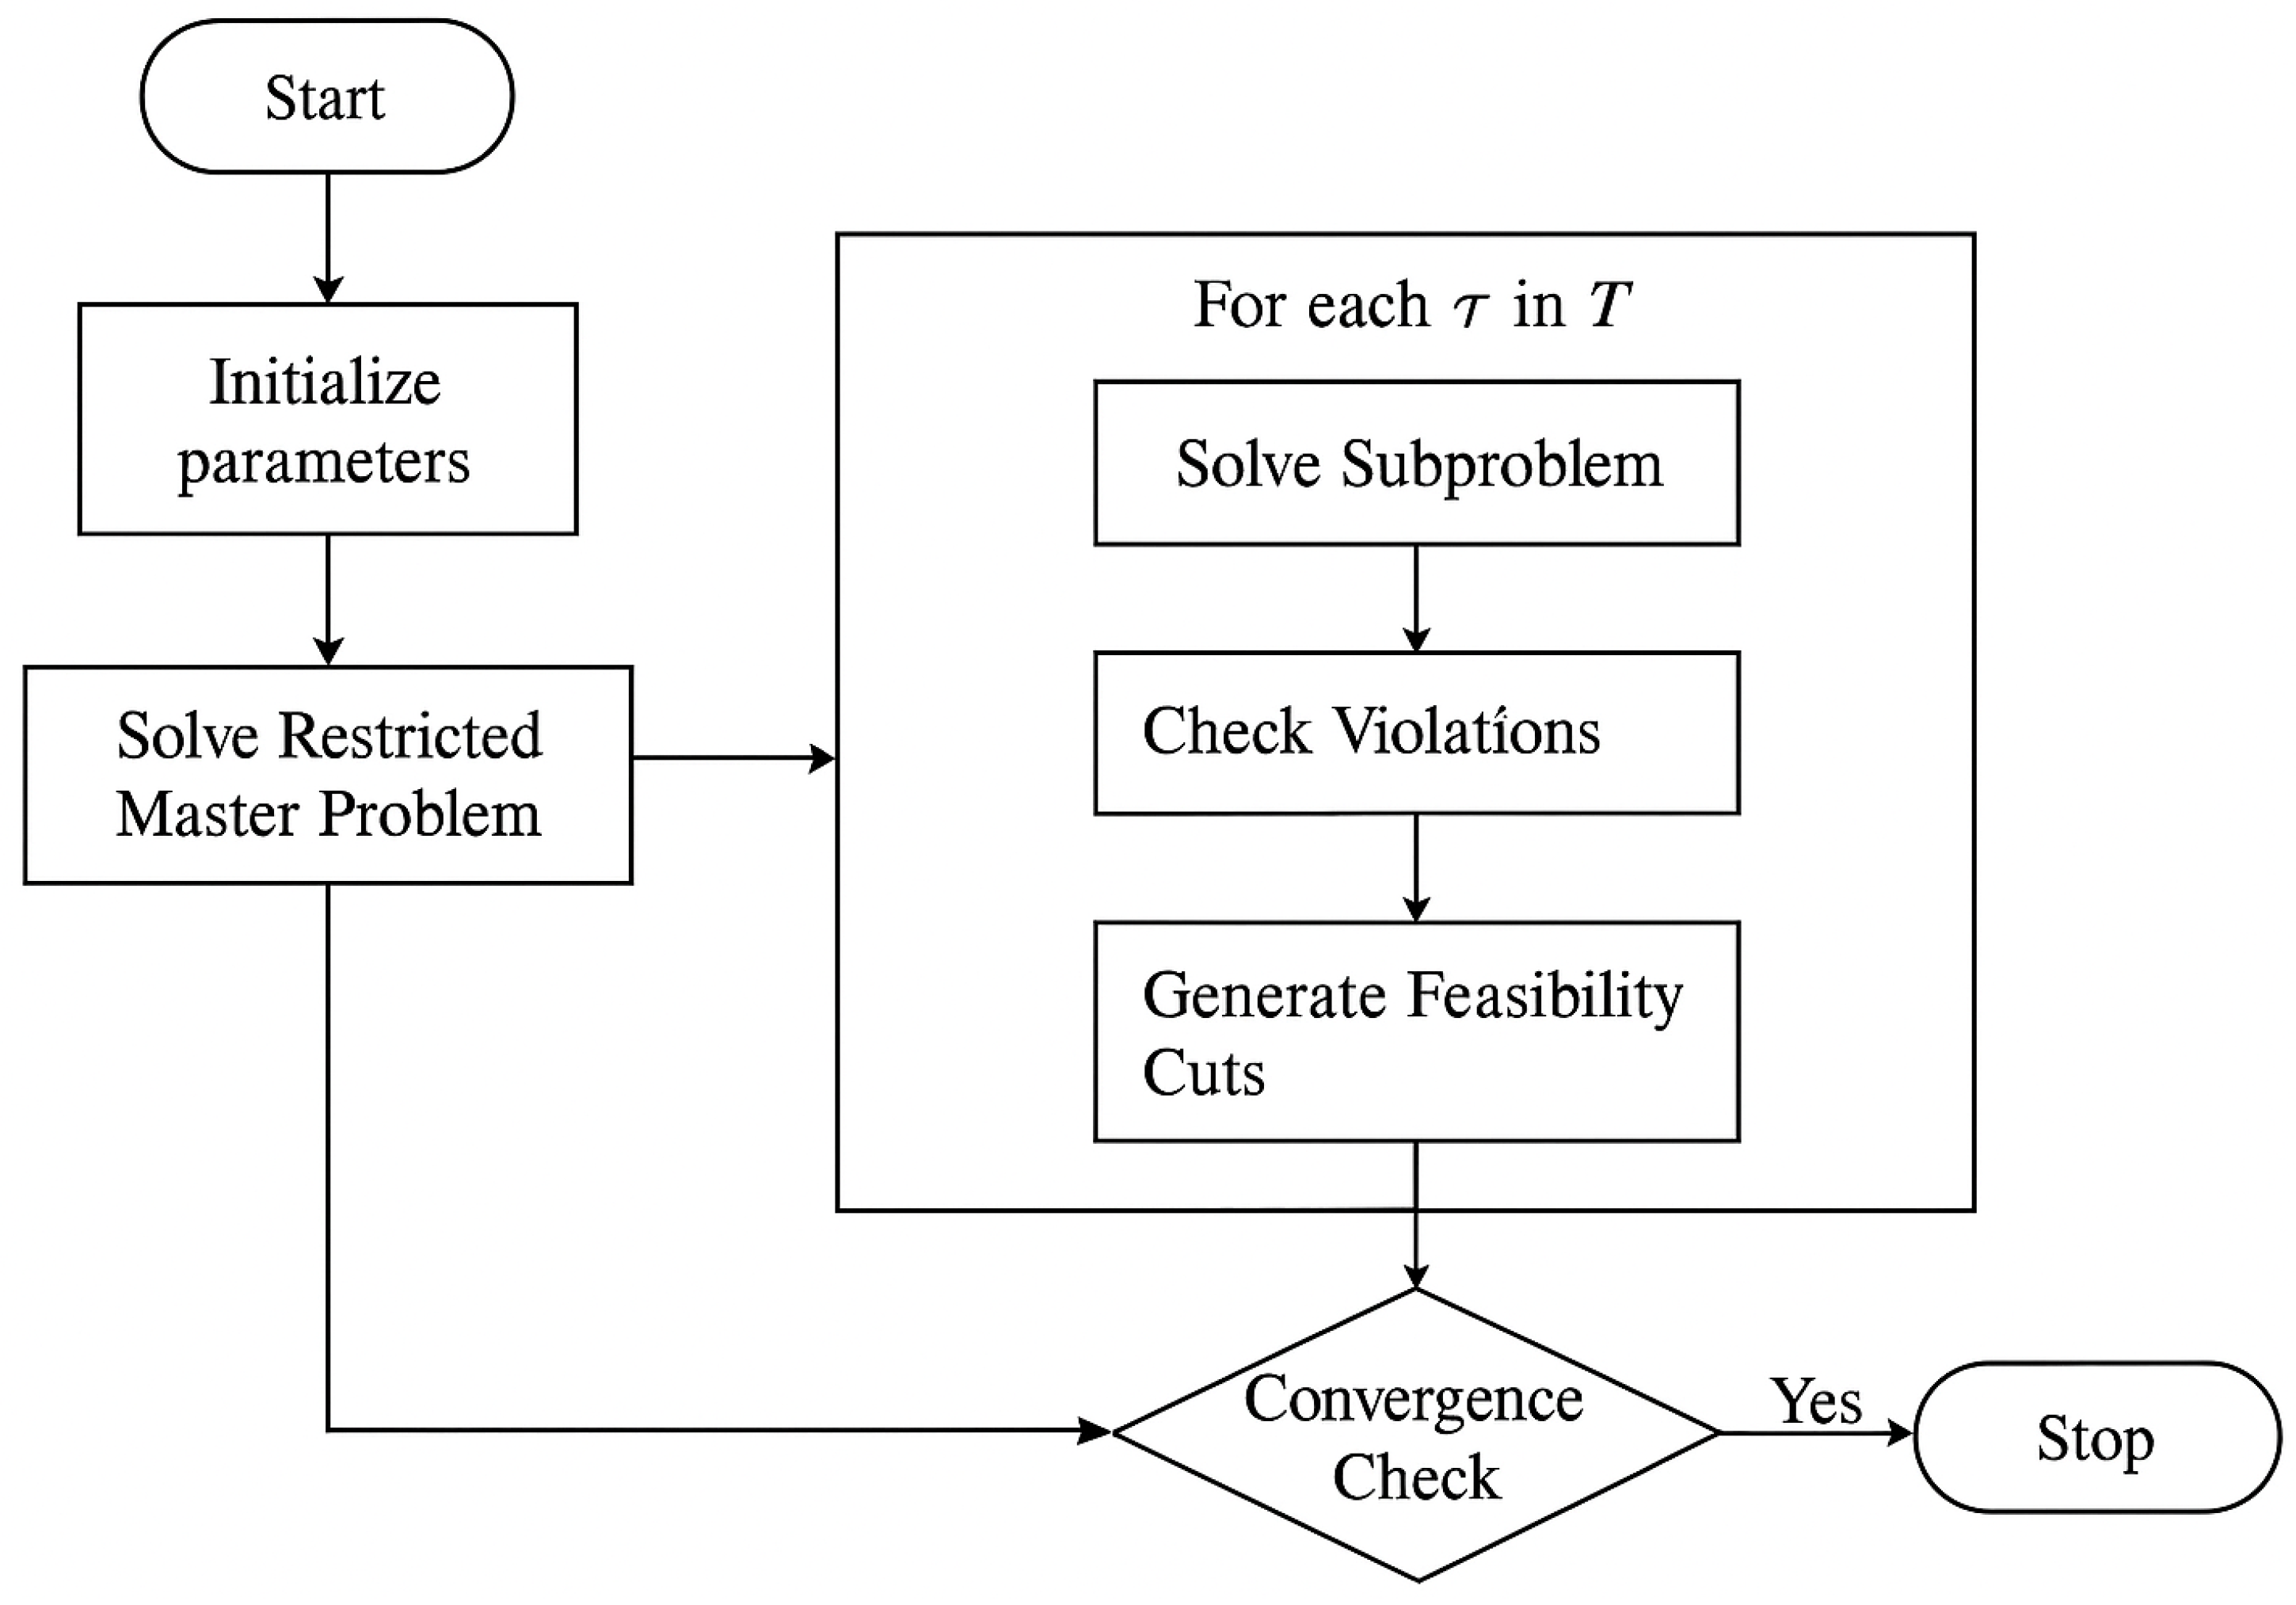
The flowchart in
Figure 1 illustrates the iterative procedure of the nested column-and-constraint generation (C & CG) algorithm used to solve the proposed DRO-based GFES planning problem. The process begins with the initialization of model parameters, including network configuration, candidate siting options, and uncertainty set definitions. The restricted master problem is then solved to obtain a provisional siting and sizing decision under the currently active set of constraints. In the subsequent loop, each scenario
is evaluated through subproblem solving, which checks the feasibility of the provisional solution under scenario-specific operational conditions. If violations are detected—such as instability in voltage or frequency—corresponding feasibility cuts are generated to refine the master problem. This loop continues until all scenarios satisfy the operational constraints within the specified tolerance. At the convergence check stage, the algorithm determines whether further iterations are required; if not, the process terminates and the optimal robust solution is obtained. The structured nature of this algorithm allows for systematic tightening of the feasible set, ensuring that the final decision is both cost-efficient and resilient to worst-case uncertainties.
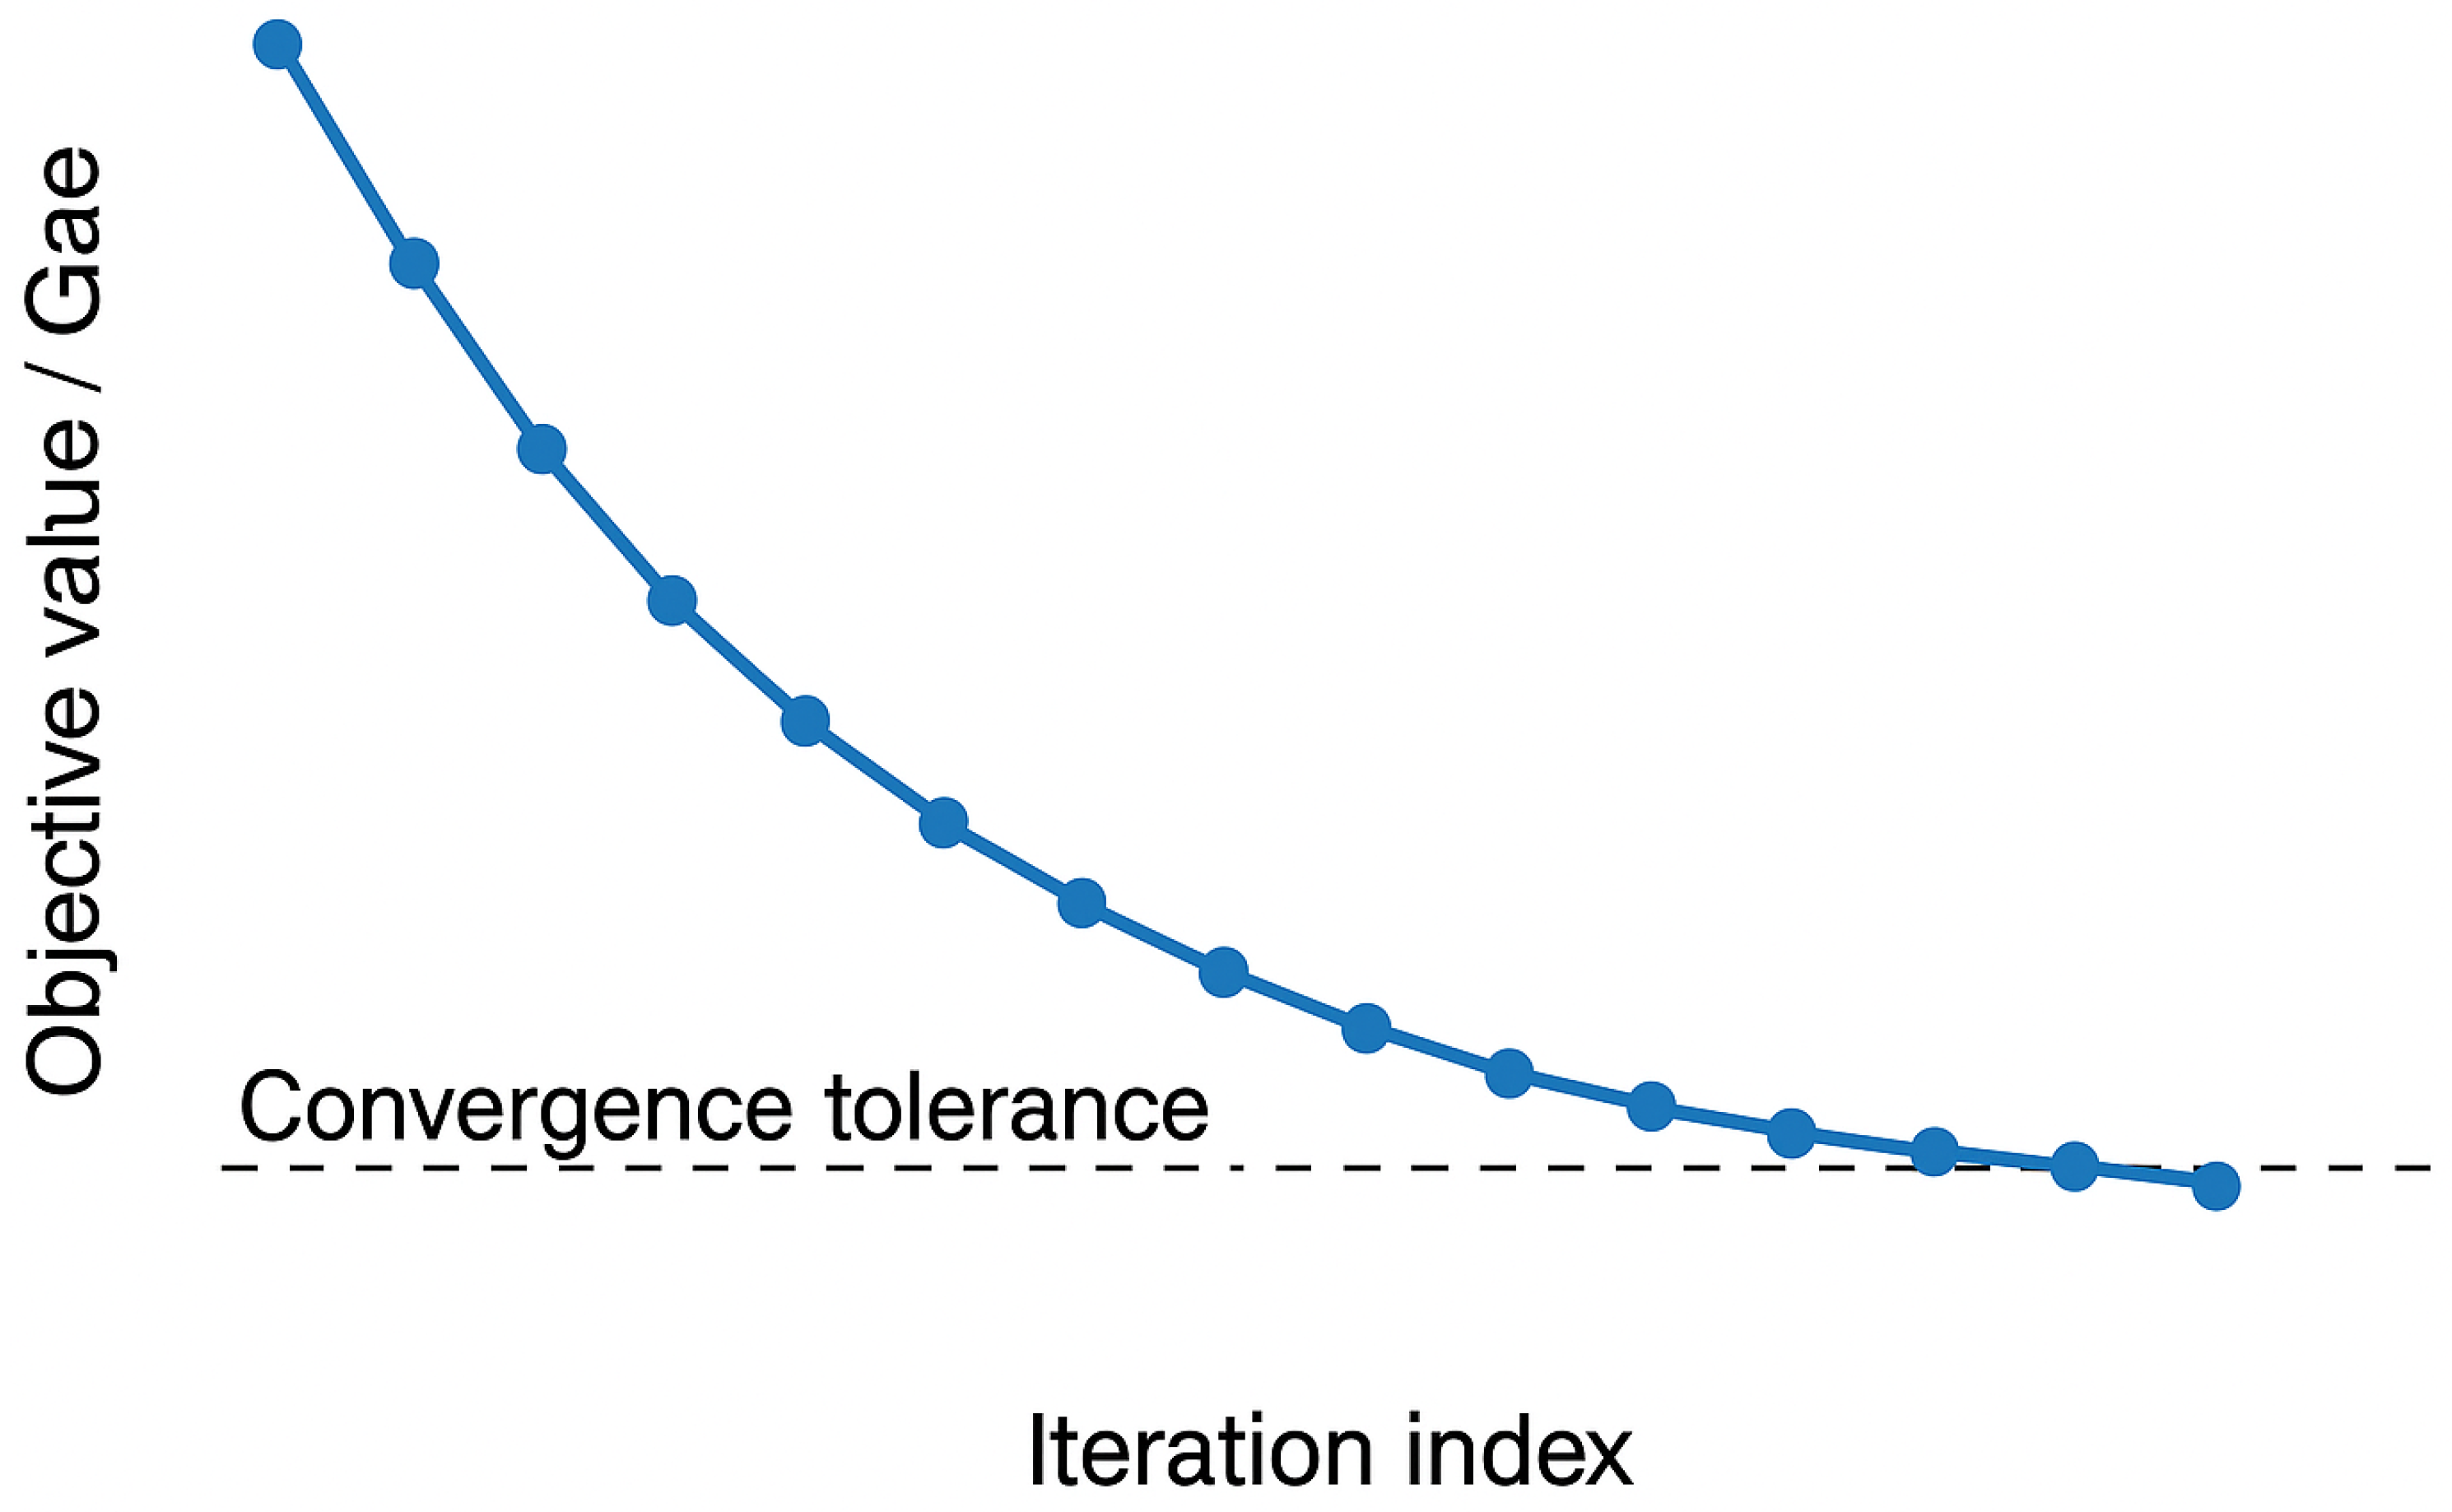
The presented curve in
Figure 2 illustrates the convergence behavior of the proposed nested column-and-constraint generation algorithm. The horizontal axis denotes the iteration index, while the vertical axis represents the normalized objective value relative to the initial value,
. Starting from a high initial cost, the algorithm exhibits a monotonic decrease in the objective value as iterations progress, reflecting the progressive refinement of the solution through sequential master problem and subproblem updates. The dashed line marks the predefined convergence tolerance, which serves as the termination criterion. Once the objective value falls below this threshold, further improvements are negligible, indicating that the solution has stabilized. The smooth and consistent downward trajectory, without oscillations or abrupt jumps, confirms both the stability and robustness of the algorithm’s iterative refinement process. This behavior validates the computational efficiency of the proposed method in reaching high-quality solutions within a limited number of iterations.
This reformulation leverages strong duality from the Kantorovich representation of Wasserstein DRO, transforming the inner distributional supremum into a tractable convex dual optimization involving support functionals
and dual scalar
. The resulting nested minimax structure balances deterministic decisions
against adversarial realizations of the uncertain parameters drawn from empirical distributions
.
This equation expands the empirical expectation into a sample-average form over
N historical realizations of renewable and load data. Each sample’s contribution is evaluated via its own local adversarial perturbation
, where
is the sample-specific system loss, and
denotes the empirical mean. The nested maximization reflects worst-case distortion under the transportation budget
.
For each empirical realization
n, the adversarial worst-case perturbation is characterized by the convex conjugate
, provided
lies in the subdifferential of the loss function. If this dual feasibility is violated, the supremum becomes unbounded, indicating infeasibility of that dual choice.
This defines the convex conjugate of the sample loss
, which is central to the dual reformulation. It represents the worst-case alignment between the adversarial cost vector
and feasible perturbations
z, measuring vulnerability of the system to deviations from the empirical mean.
To enable linearization of nonconvex SoC update behavior, we introduce an auxiliary slack variable capturing the effective SoC increment net of efficiency losses. This helps construct epigraph and second-order cone formulations for battery state propagation in large-scale convex programs.
This second-order cone constraint models the norm-based energy dispatch budget across charging and discharging, regularized by an energy amplitude limit
. It is used to keep the dual reformulation convex and capture quadratic cost penalizations associated with thermal constraints or inverter saturation.
This binary constraint captures the conditional activation of black-start capability using logical indicators. It is embedded into the MILP layer of the master problem and plays a pivotal role in enforcing dynamic feasibility of restoration strategies under contingencies.
This affine decision rule governs the net injection at each bus under parametric uncertainty. The coefficients
allow the model to adaptively respond to variations in renewable supply and demand, enabling tractability within DRO-based robust planning.
At each time step, the model solves a nested robust optimization subproblem, minimizing dispatch loss under worst-case sampled scenarios within Wasserstein ambiguity sets. These subproblems are decoupled across
to enable parallelizable decomposition.
This feasibility cut generation rule identifies violations of robust constraints at iteration
k and appends constraints
to the master problem, progressively tightening the ambiguity set coverage until all DRO violations are eliminated.
Each cut takes the form of a linear constraint in dual space, bounding the decision variable
by dual parameters
and
. These cuts are accumulated iteratively, refining the decision region in primal space.
The optimal cost under all accumulated cuts is found by minimizing
, which acts as a proxy for the worst-case system loss. This final stage yields the globally robust planning objective.
This update rule governs the iterative progression of the nested column-and-constraint generation (C & CG) algorithm, terminating when the improvement in objective
falls below a predefined tolerance
.
A normalized relative gap criterion is used for robust convergence. This guarantees both numerical stability and early stopping if robust feasibility is achieved with acceptable approximation.
The total complexity of the DRO solver, combining both master problem cost
and subproblem cost
, scales with the number of iterations
K, horizon length
T, node size
, and dimensionality
d of the uncertainty space. This highlights the computational trade-off between robustness and scalability.
Network topology matrices are stored in sparse form to minimize memory overhead, especially as bus and branch counts scale. This allows for efficient matrix–vector operations during dispatch and sensitivity analysis.
The total runtime of the solution algorithm includes preprocessing time , per-iteration cut generation and solving time , and post-processing output extraction . This formulation clarifies where bottlenecks may emerge and guides future computational optimizations.
It is worth noting that, while restoration actions following blackouts are an integral part of resilience in operational practice, the present framework focuses on preventive planning measures. By enforcing stringent voltage and frequency stability constraints under worst-case scenarios, the model inherently supports conditions conducive to rapid recovery, without explicitly modeling the logistical and temporal aspects of restoration. Furthermore, the Wasserstein radius serves as a tunable robustness parameter, controlling the allowable deviation between empirical and worst-case uncertainty distributions. Smaller values of yield solutions closely aligned with nominal conditions but potentially less tolerant to extreme events, whereas larger values provide stronger protection at the expense of higher cost. The selected range of reflects a balanced trade-off between economic efficiency and resilience, ensuring preparedness for plausible high-impact scenarios while avoiding overly conservative investment.
The C & CG algorithm iteratively solves two interlinked problems: a master problem that proposes investment and operational decisions under a limited set of worst-case scenarios, and a subproblem that searches for the most critical scenario within the defined uncertainty set. By alternately refining the master problem and enriching the scenario set, the approach converges to a robust optimal solution. This decomposition significantly reduces computational complexity compared to solving the full problem at once, making it scalable for realistic distribution networks.
Algorithm 1 outlines the proposed column-and-constraint generation (C & CG) procedure for solving the distributionally robust GFES planning problem. The algorithm operates within a master–subproblem decomposition framework. The master problem (MP) optimizes siting, sizing, and dispatch decisions over the current set of active scenarios and feasibility cuts, producing a provisional lower bound on the objective value. The subproblem (SP) then searches within the Wasserstein ambiguity set for the worst-case probability distribution that maximizes the operational cost or constraint violation, thereby updating the upper bound. If the resulting violation exceeds a prescribed tolerance, the corresponding feasibility or optimality cut is generated and added to the MP, along with the newly identified scenario. This iterative exchange continues until the gap between the upper and lower bounds falls below a convergence threshold, guaranteeing global optimality. By exploiting the problem’s convex structure and the separability of network constraints, the method ensures computational tractability even for large-scale microgrid networks, while rigorously enforcing robustness against all admissible distributions of renewable generation and load uncertainty.
| Algorithm 1: C & CG for DRO-based GFES planning. |
![Energies 18 05674 i001 Energies 18 05674 i001]() |
4. Case Study
To validate the effectiveness and tractability of the proposed distributionally robust GFES planning framework, we implement a comprehensive case study based on a modified version of the IEEE 33-bus radial distribution system. The network topology includes 32 load buses and one substation, adapted for autonomous islanded operation by removing grid-anchored constraints and introducing control boundaries for voltage and frequency. The base apparent power is normalized to 100 MVA, with nominal voltage at 12.66 kV. PV-based renewable generation is installed at six strategically selected nodes (buses 6, 10, 14, 18, 22, and 30), with individual installed capacity ranging between 80 kW and 150 kW per site, totaling 750 kW of intermittent generation capacity. Load profiles are constructed from a downscaled version of real demand data collected from rural Californian feeder systems, calibrated to produce a total daily peak demand of 860 kW. Load elasticity across buses varies between 3% and 15% relative to their nominal consumption, introducing spatial heterogeneity in dispatch difficulty.
Energy storage units are considered deployable at ten candidate nodes (buses 5–14), with installation costs modeled quadratically to reflect both physical integration constraints and inverter scaling costs. Each GFES candidate has a maximum installable capacity of 250 kWh, and can deliver up to 120 kW of instantaneous active power. State-of-charge (SoC) operational bounds are set at 15% minimum and 90% maximum of rated energy, with black-start reserve requirements defined as no less than 20% SoC at all times. Round-trip efficiency is assumed to be 92%, with asymmetric charging and discharging efficiencies of 0.96. The dynamic support parameters include a minimum virtual inertia contribution of 0.7 s per unit per GFES, and each unit must provide at least 90% voltage ride-through compliance under worst-case line-drop scenarios. Renewable generation and load demand uncertainty is modeled using historical 15-minute resolution data from NREL’s OpenEI dataset, from which 400 samples (100 days across four seasonal clusters) are drawn. These samples are used to construct empirical distributions, forming the Wasserstein ambiguity sets around which the DRO problem is defined. The radius of the ambiguity ball is tuned between 0.05 and 0.10 in sensitivity experiments.
The optimization model is implemented in Python using CVXPY 1.3, with Gurobi 10.0 serving as the backend solver for mixed-integer and conic subproblems. The full case study spans a rolling 24 h operation horizon discretized into 96 intervals (15 min resolution). The nested column-and-constraint generation (C & CG) algorithm is implemented with a maximum of 30 outer iterations, and per-iteration tolerance set to . Each run is conducted on a 12-core Intel Xeon workstation with 128 GB RAM, using parallel processing to solve contingency–feasibility subproblems across all . Scenario screening is performed for 12 worst-case operating points per rolling horizon, selected based on outlier detection using Mahalanobis distance. The overall solve time for the full model with 10 GFES candidates and 400 empirical samples remains under 1.8 h, confirming the method’s scalability for realistic deployment contexts.
Table 2 presents the optimized deployment scheme for grid-forming energy storage (GFES) units in the test network. The siting outcomes indicate that installations are concentrated at buses combining high network centrality with critical operational roles, ensuring maximum contribution to voltage and frequency support. The power and energy capacities are allocated proportionally to each location’s renewable integration level, load characteristics, and sensitivity to stability constraints, allowing the system to balance investment efficiency with resilience benefits. Higher capacities are observed at nodes with substantial PV penetration, reflecting the need for enhanced inertia and reserve capabilities to mitigate variability. Meanwhile, strategically placed medium-sized units provide network-wide coverage for disturbance damping and black-start capability. This allocation pattern underscores the framework’s ability to merge spatial optimization with operational robustness, resulting in a deployment plan that is both technically sound and economically justified.
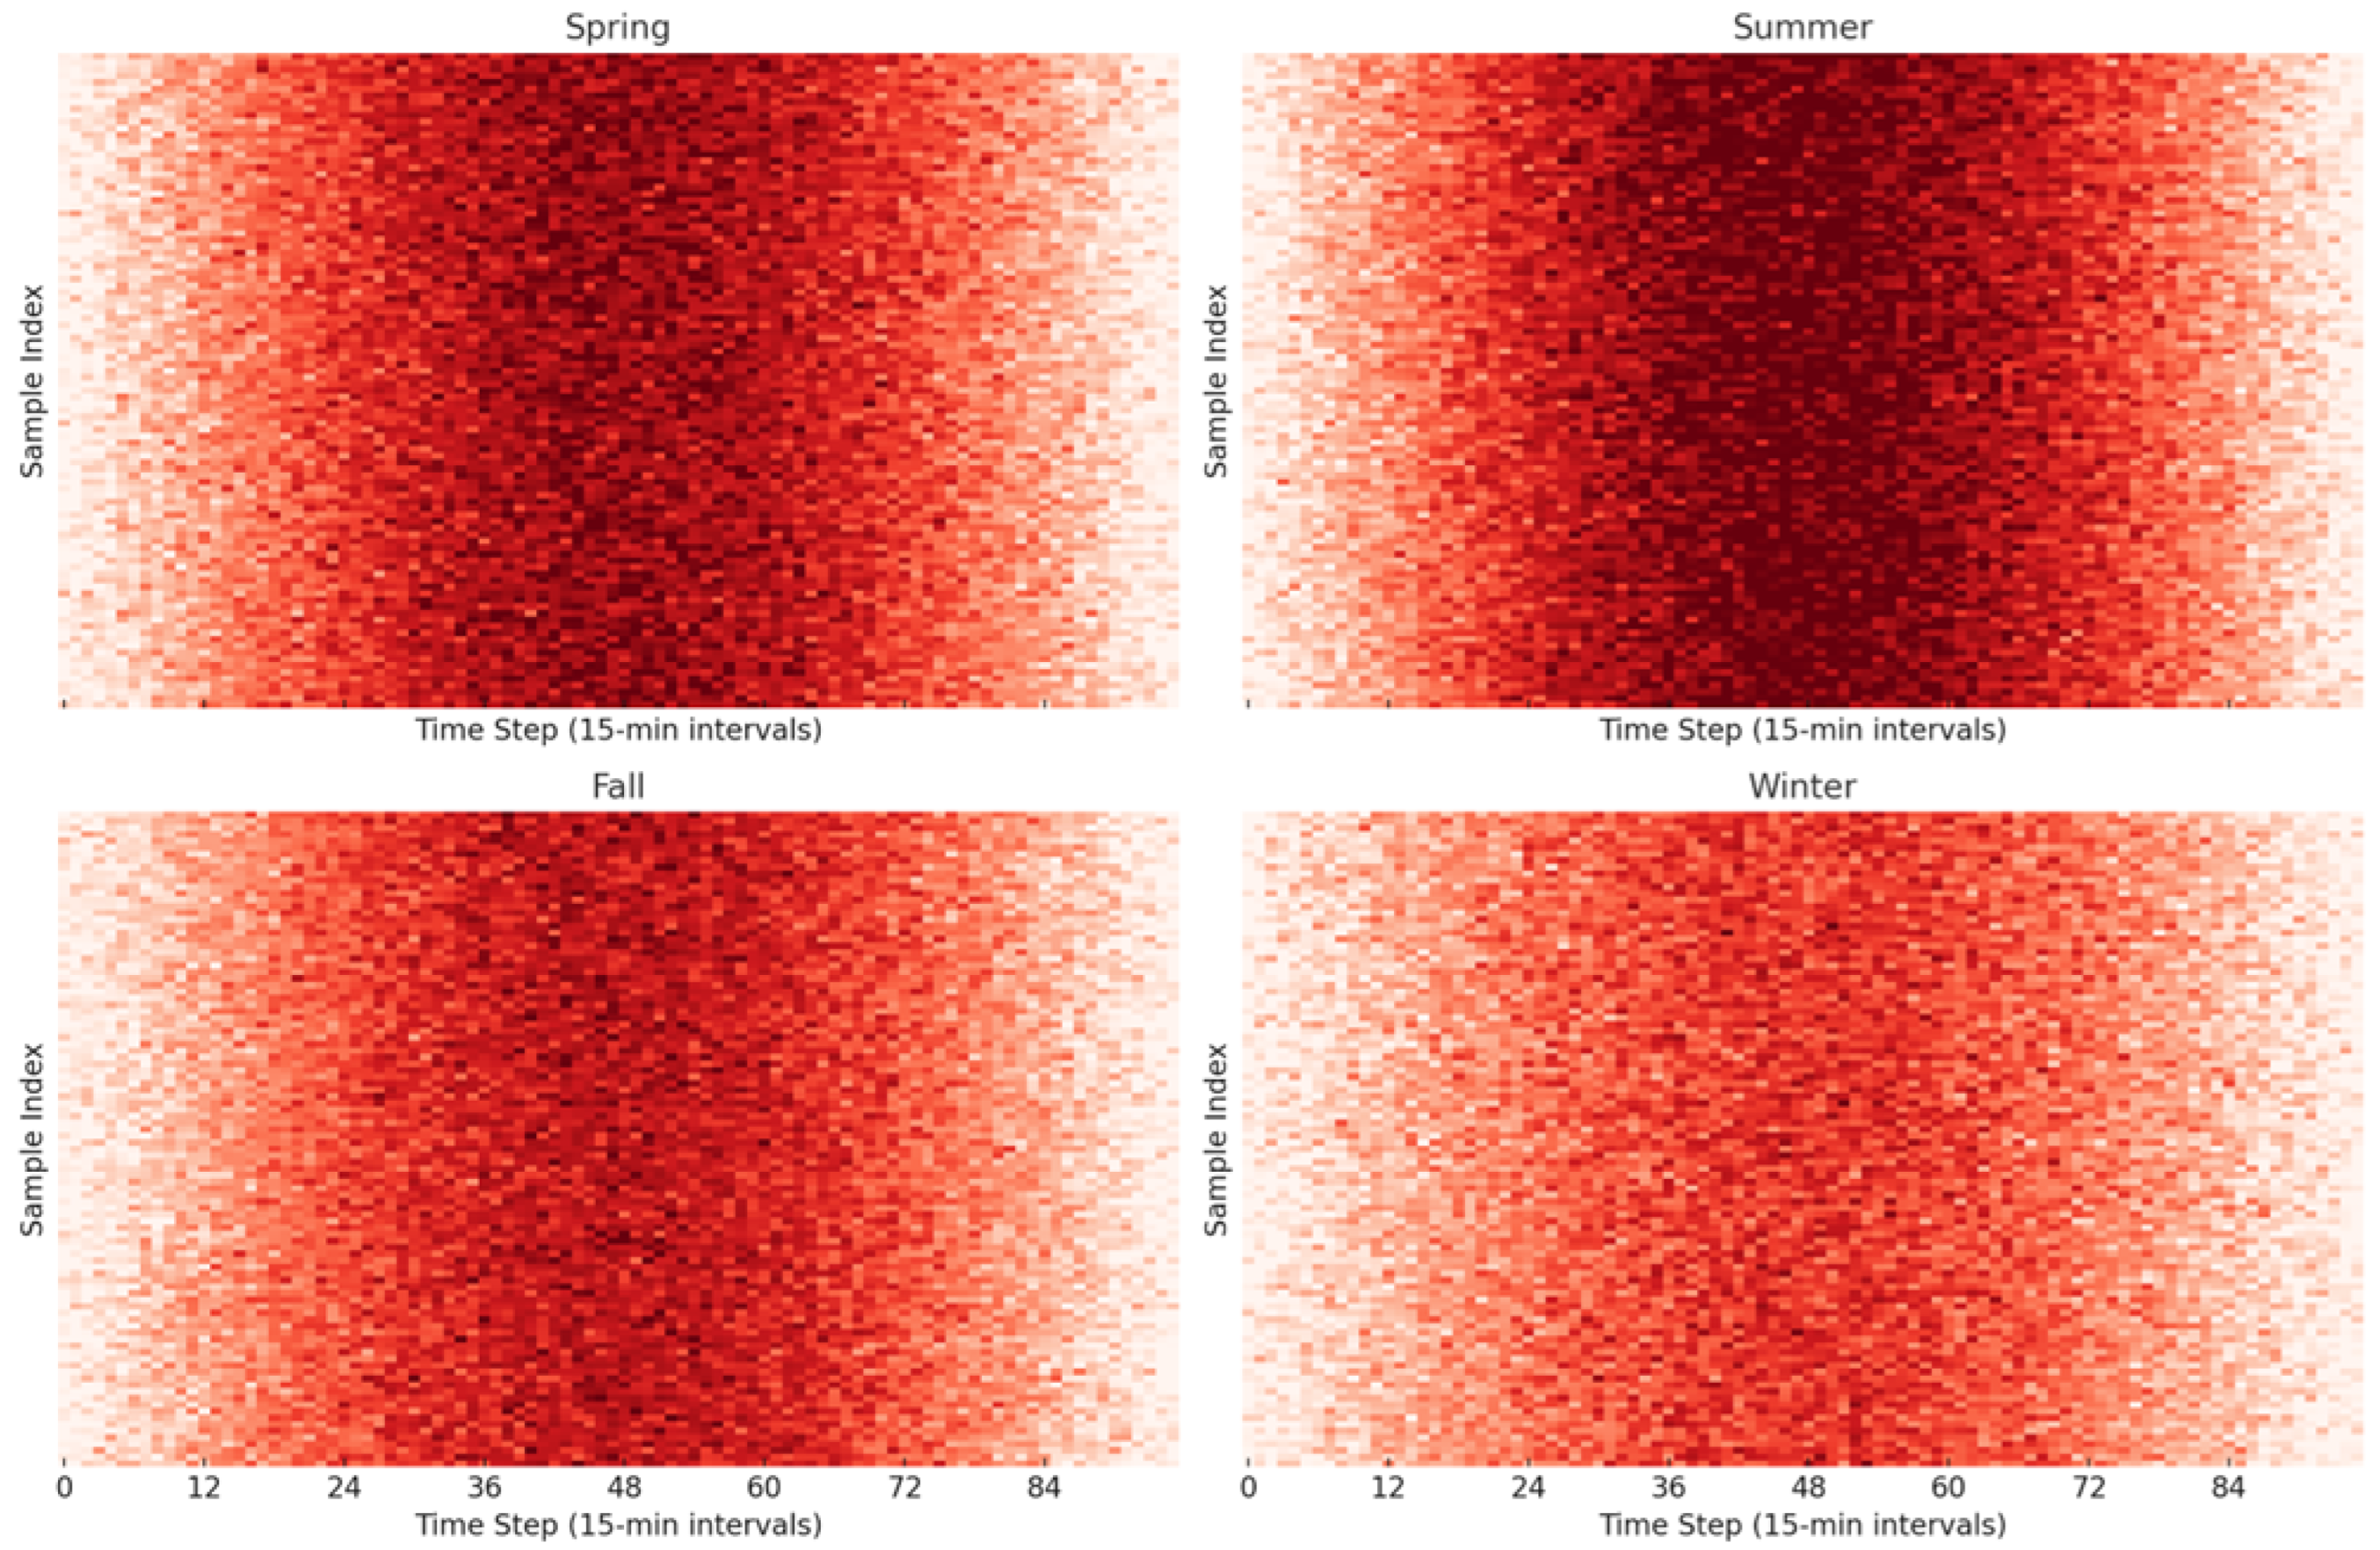
Figure 3 visualizes the temporal–spatial variability of photovoltaic generation across four seasonal clusters—spring, summer, fall, and winter—each containing 100 empirically generated daily PV output samples with a 15 min resolution over a 24 h period (96 intervals). The
x-axis represents time steps from 00:00 to 24:00, while the
y-axis enumerates sample indices. All values are normalized to the theoretical maximum PV output for a typical inverter-limited 150 kW installation, such that pixel values range from 0 (no output) to 1 (maximum output). The color scale reflects relative intensity, with deeper reds indicating higher irradiance and stronger midday generation. Summer exhibits the highest density of saturated red across the daytime range (steps 28–72, or approximately 07:00–18:00), indicating extended daylight duration and near-maximum output in a large number of samples. In contrast, winter shows a sharp contraction of active generation intervals to steps 36–64 (around 09:00–16:00), reflecting reduced solar angles and shorter photoperiods. Quantitatively, summer samples reach an average peak normalized output of 0.97, with standard deviation of 0.08, suggesting strong and consistent generation in this cluster. In spring and fall, the peak intensity shifts slightly earlier and later in the day, respectively, with the central generation window widening to 42 time steps (10.5 h). Variability in these shoulder seasons is significantly higher; fall presents a median peak value of 0.83 but exhibits sample-to-sample drop-offs of up to 40 percent during overcast windows, as seen by irregular light-red streaks in rows 20 to 40. Winter not only compresses generation duration but also exhibits severe attenuation, with the mean peak value dropping to 0.64 and intra-sample fluctuations reaching 0.3 at step 48 (noon), a signature of transient cloud cover and low sun elevation. This demonstrates the non-Gaussian, highly asymmetric nature of PV uncertainty—justifying the use of a Wasserstein metric to capture heavy tails and extreme deviations in robust optimization.
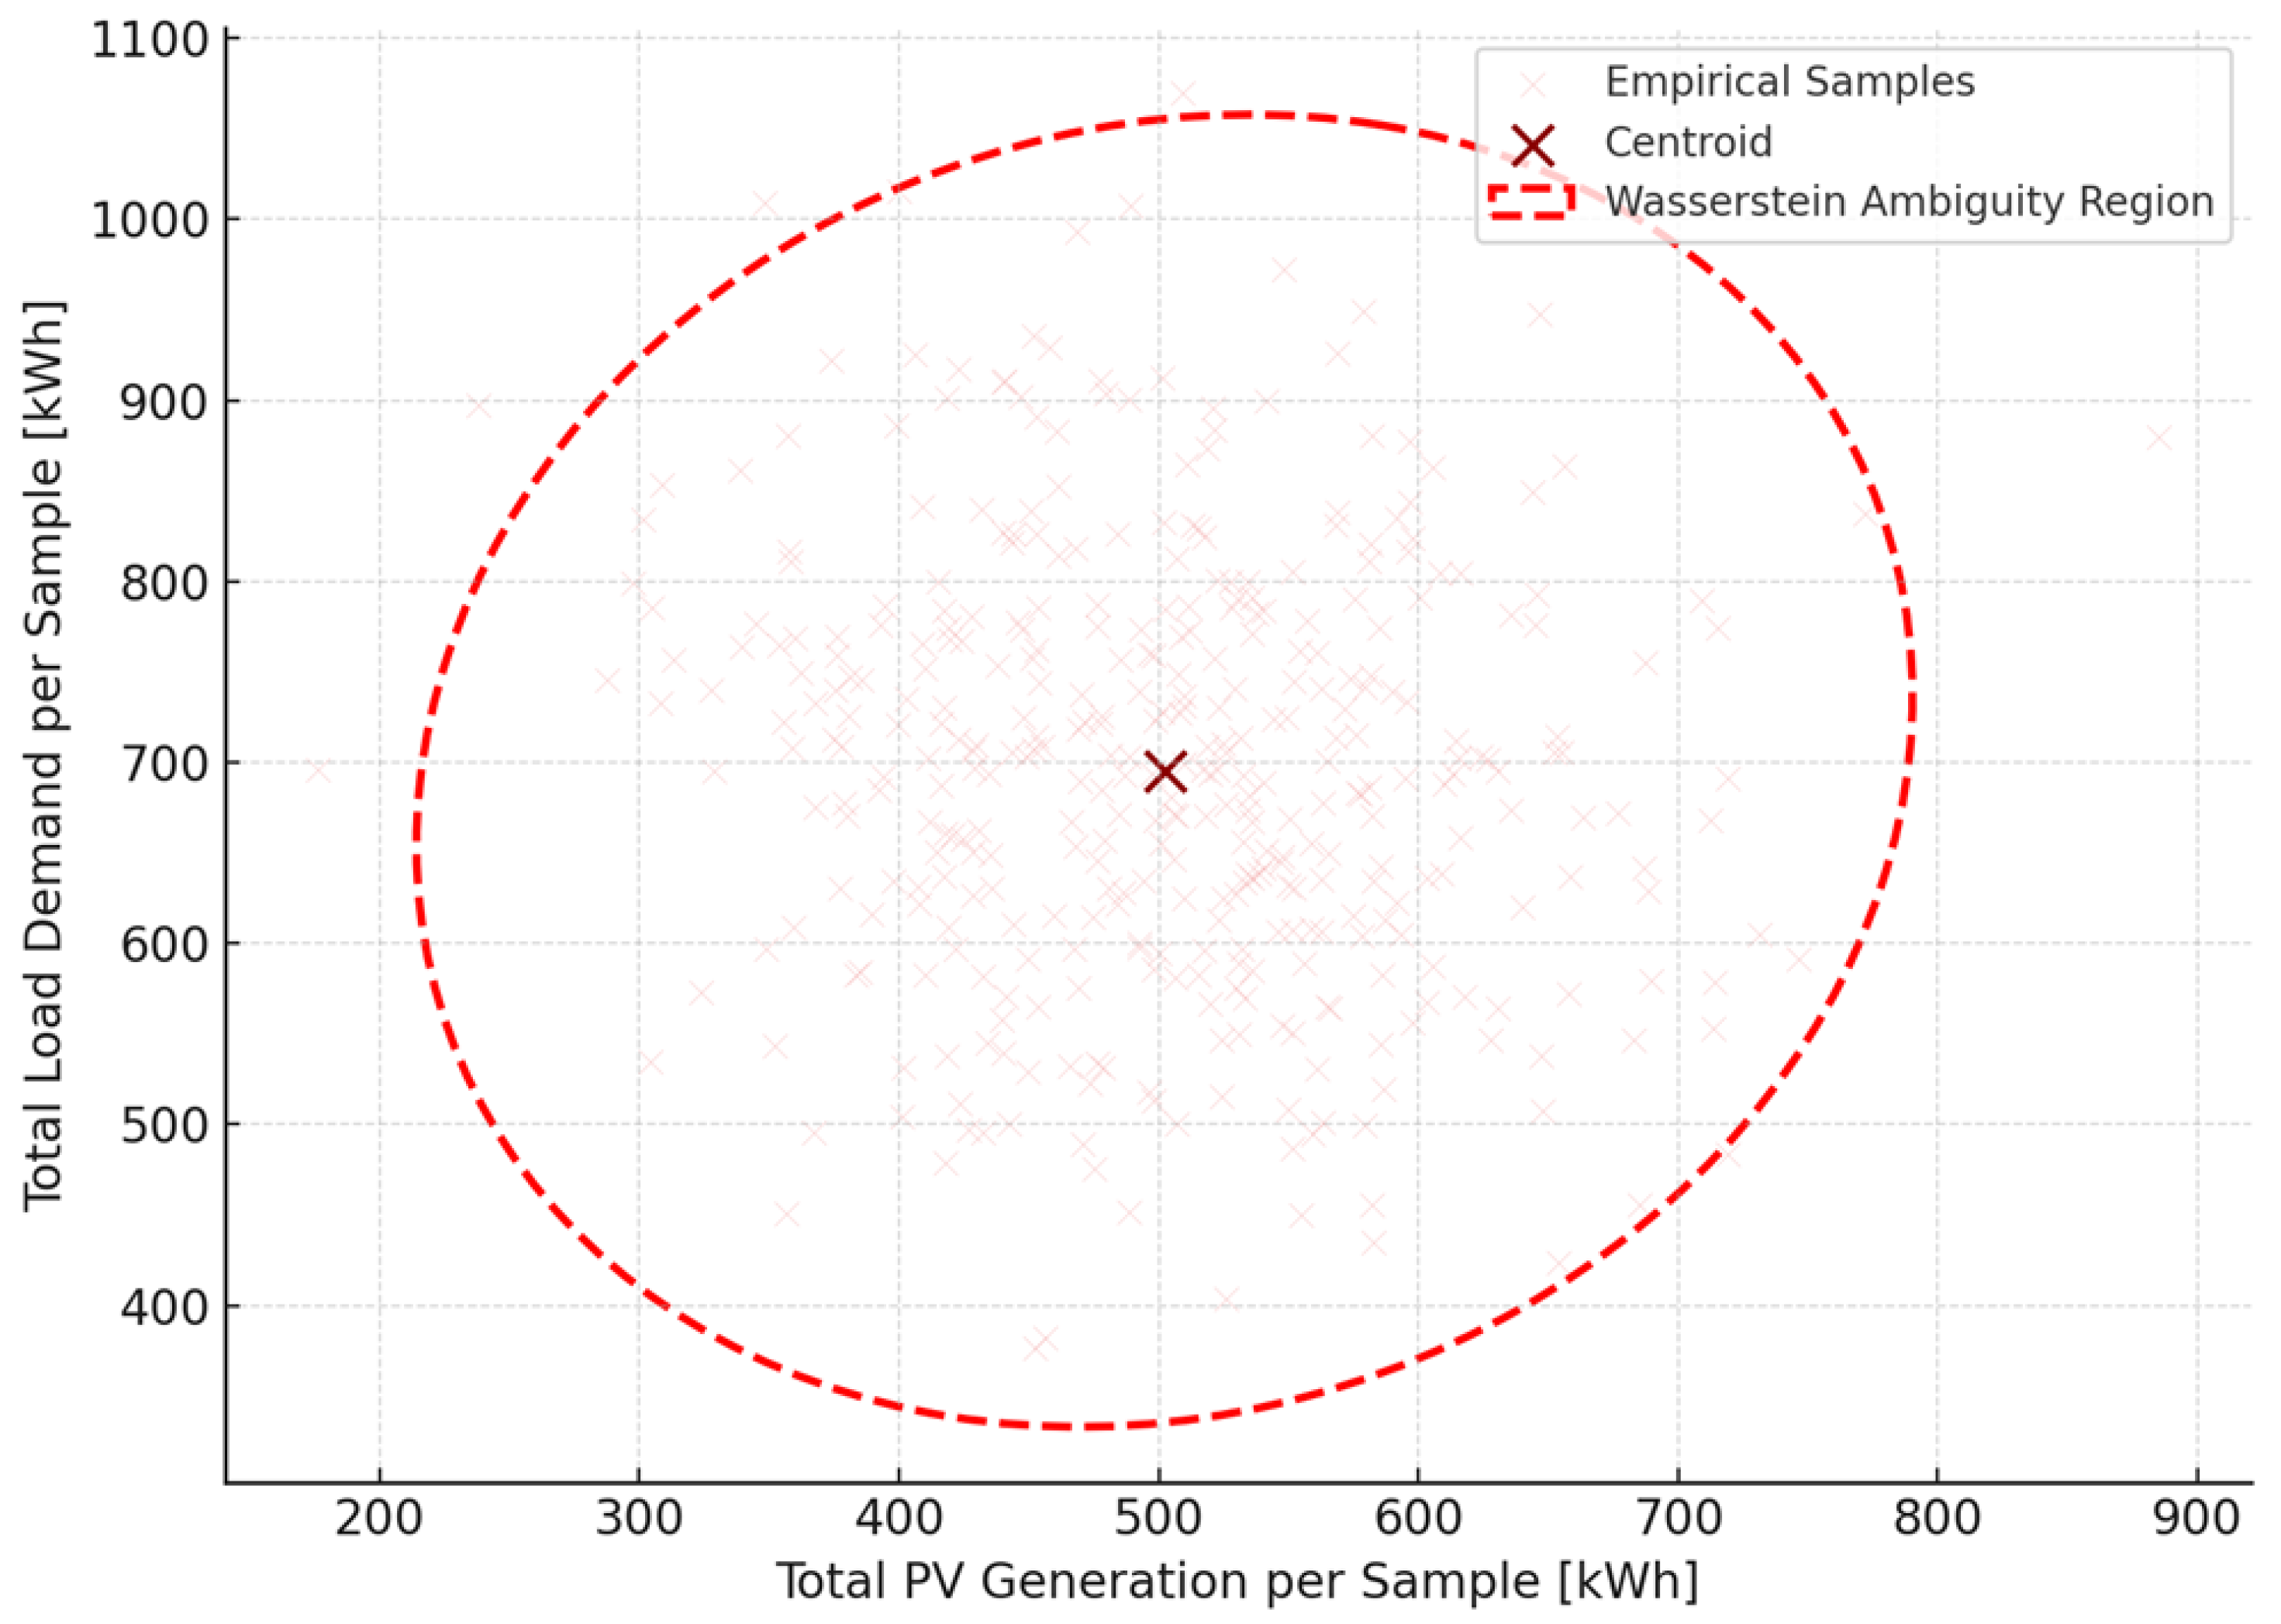
Figure 4 presents a two-dimensional projection of the joint empirical distribution of total daily photovoltaic (PV) generation and corresponding total daily load demand across 400 historical samples. Each point in the scatter cloud represents a single-day realization, with PV generation ranging from approximately 300 kWh to 750 kWh, and load demand spanning from 450 kWh to over 1000 kWh. The color tone uses a soft red palette to emphasize density while maintaining visual elegance. The concentration of points around the centroid—located at approximately (503.6 kWh, 697.9 kWh)—reflects the overall system balance under average solar and demand conditions. However, the cloud exhibits strong anisotropy, indicating that load and PV generation are not perfectly correlated: while there is some degree of alignment (correlation coefficient ≈ 0.43), variations in cloud width suggest the presence of substantial distributional uncertainty orthogonal to the mean demand–supply trend. Superimposed on the scatter cloud is a red elliptical contour that represents the Wasserstein ambiguity ball constructed around the empirical centroid. This contour is derived from the covariance structure of the joint distribution and reflects a confidence region that bounds worst-case plausible variations in both PV and load. The ellipse has a major axis of approximately 290 kWh and a minor axis of about 175 kWh, corresponding to 3 standard deviations in each principal direction of the joint covariance matrix. The shape of the ellipse is tilted upward from left to right, reinforcing the observation of partial correlation between PV availability and demand magnitude across daily realizations. From an optimization perspective, this contour defines the support of the ambiguity set used in the distributionally robust problem. The Wasserstein DRO model minimizes expected cost over all distributions within this set, thereby hedging against variations that deviate not just in magnitude but also in structure from the empirical mean.
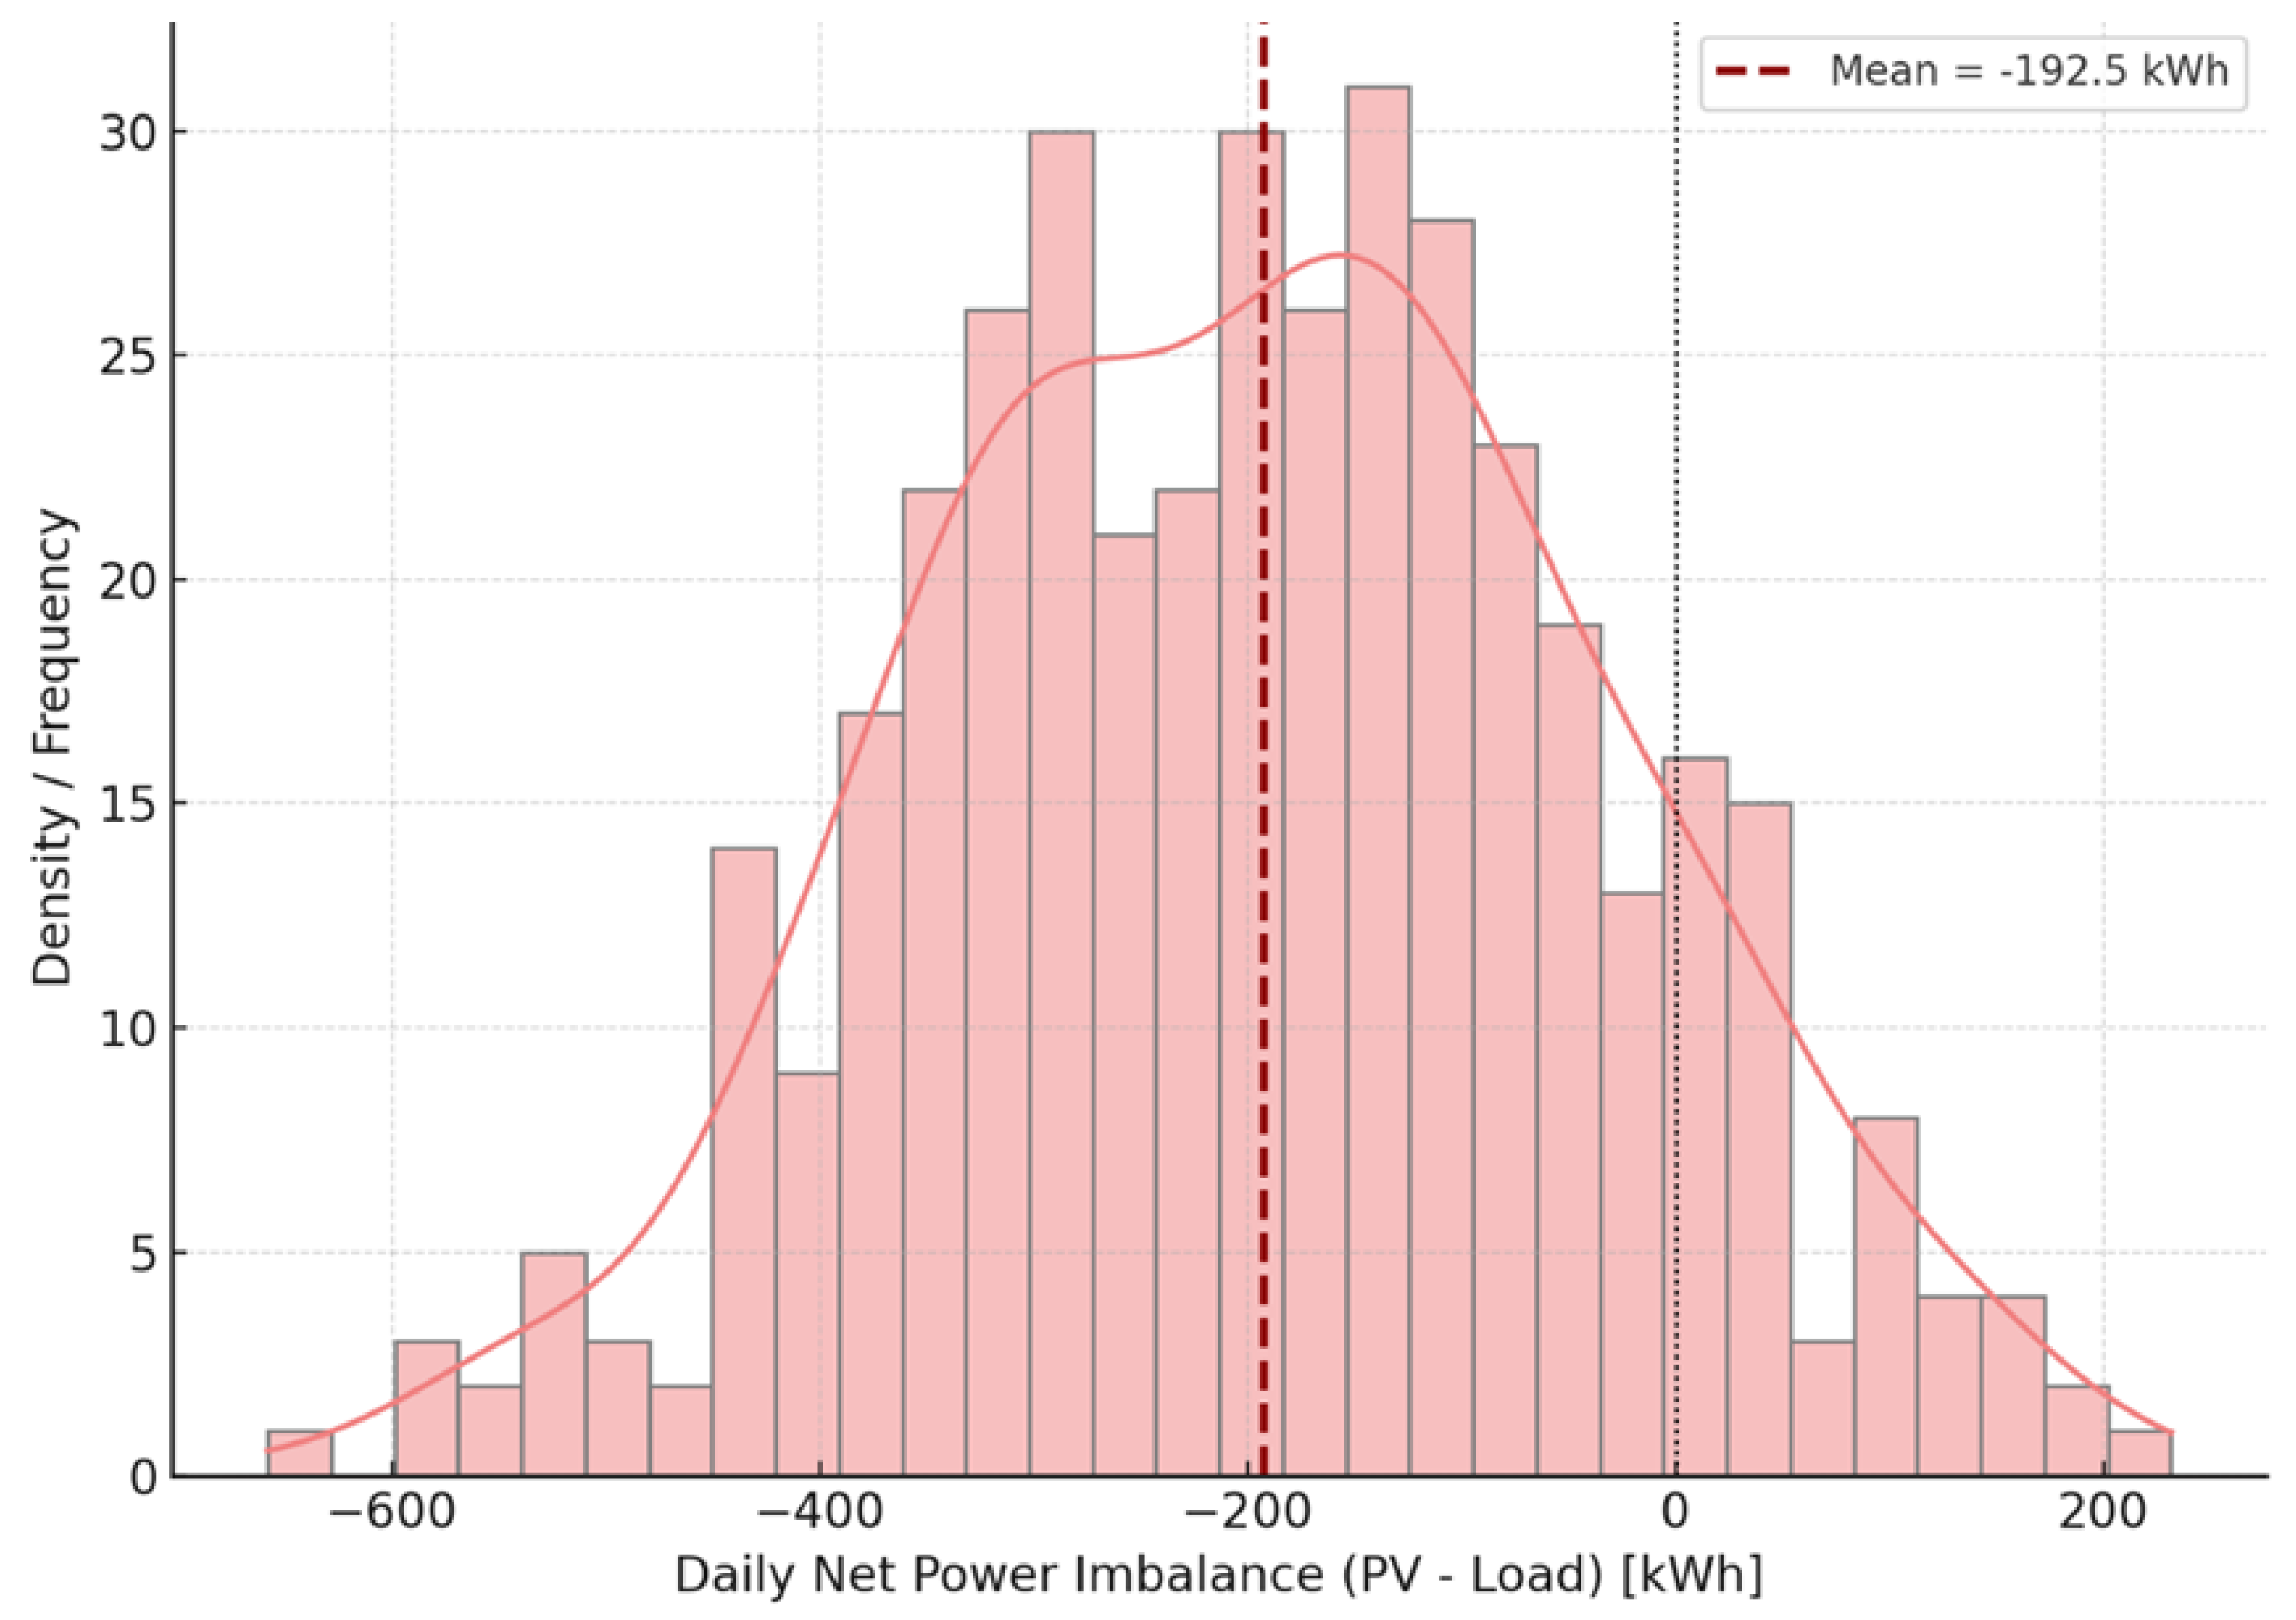
Figure 5 illustrates the empirical distribution of net daily power imbalance, defined as the difference between total daily PV generation and total daily load demand, across 400 historical samples. The
x-axis represents net energy in kilowatt-hours (kWh), computed as PV-LoadPV - LoadPV-Load for each sample, while the
y-axis shows the corresponding density and frequency. The histogram bins are visualized using semi-transparent coral-red tones, and a smooth kernel density estimate (KDE) overlays the empirical distribution. The vertical dashed red line indicates the mean of the distribution, approximately −194.2–192.5 kWh, suggesting a system-wide tendency toward energy deficit on average. The zero-imbalance threshold is shown with a dotted black vertical line, enabling a visual split between surplus (right) and shortage (left) days.
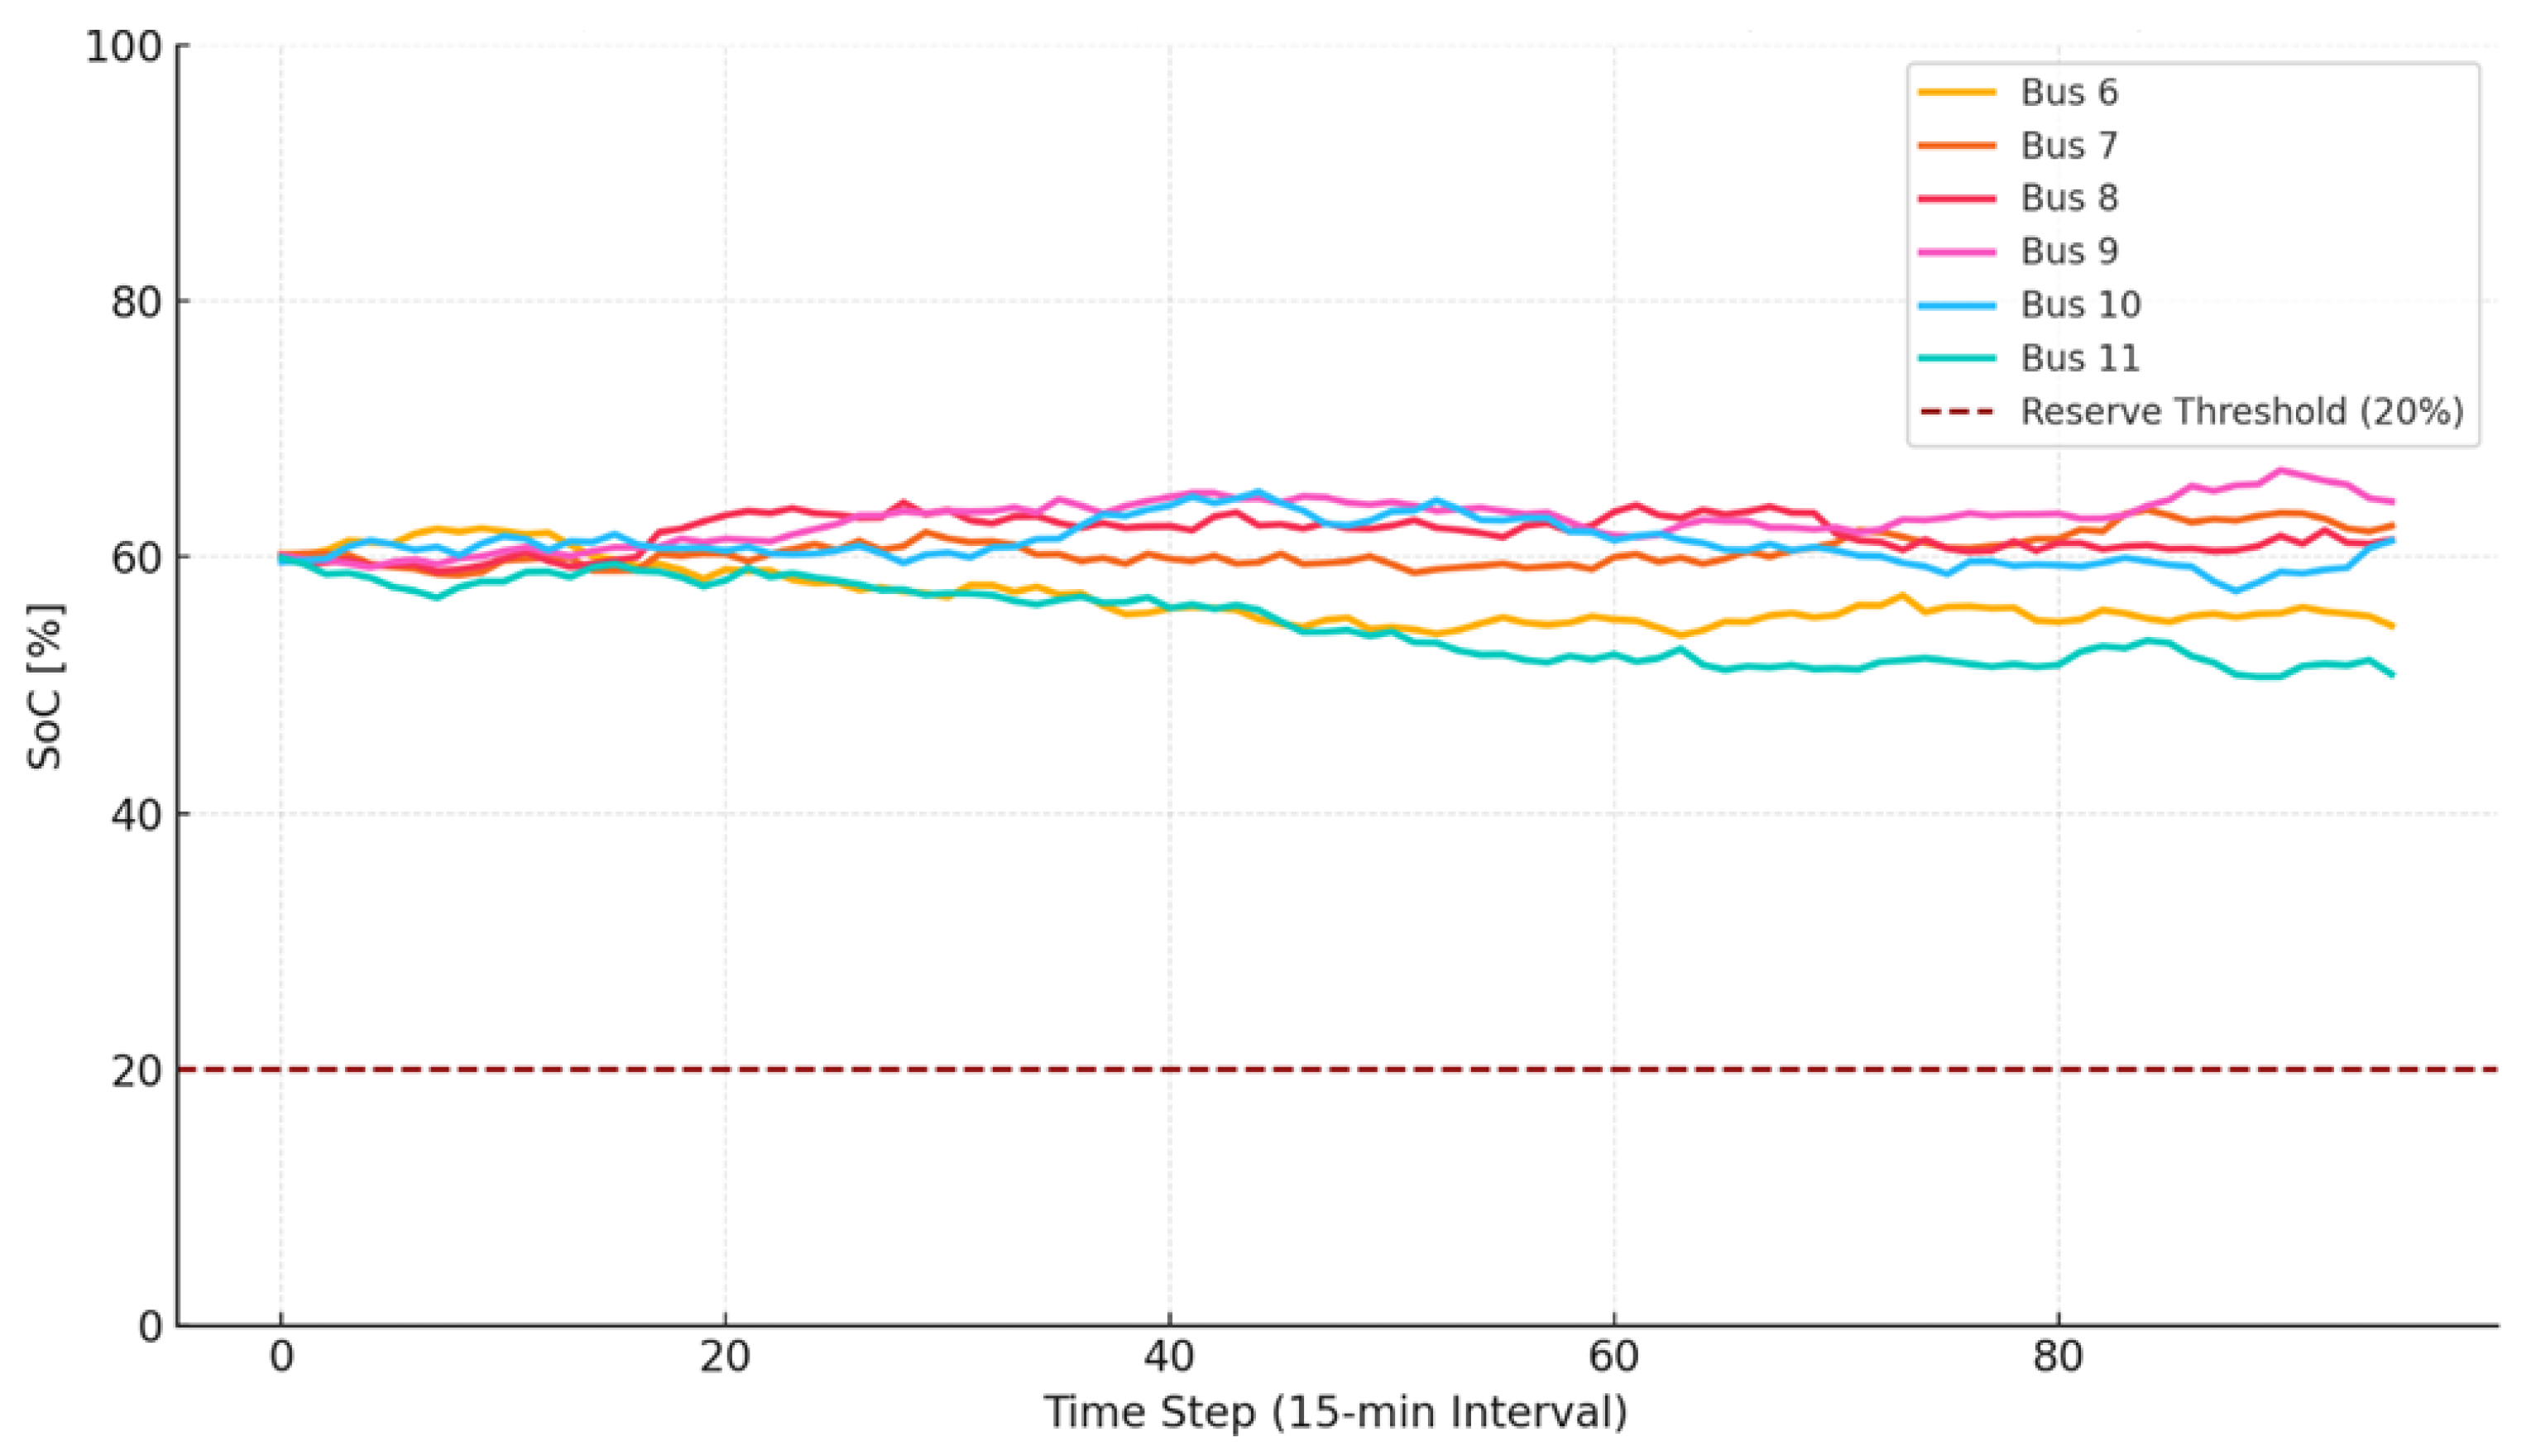
Figure 6 illustrates the temporal evolution of the state-of-charge (SoC) levels for six representative GFES-equipped buses over a full 24 h operating horizon, discretized into 96 time steps (15 min intervals). The trajectories reflect the optimal dispatch strategy derived from the robust planning model, incorporating both energy adequacy and reserve management constraints. All trajectories are bounded between 15% and 90% of the total capacity, with a red dashed threshold at 20% marking the minimum reserve margin required for black-start compliance. Across the buses, initial SoC values are clustered around 60–65%, and dynamic behavior varies according to local load profiles and PV output correlation. For instance, Bus 9 maintains a relatively flat SoC curve with moderate fluctuations, indicating that it serves as a balancing node with predictable energy flow. In contrast, Bus 12 exhibits more aggressive cycling, with two full discharging events and one recharging ramp, indicating response to localized generation or load swings. The reserve threshold line at 20% is never crossed, demonstrating that the optimizer respects the black-start feasibility constraint. Interestingly, in at least two buses (Bus 8 and Bus 13), the SoC dips close to the reserve floor around time steps 40–60 (10:00–15:00), which corresponds to peak load hours in the test case. This suggests that the optimizer schedules these units for heavy discharging during system-wide stress conditions, while still preserving the regulatory minimum needed to support voltage and frequency restoration. The presence of mid-day recharge periods in Buses 6 and 14 suggests good alignment between PV output peaks and charging demand, which is a desirable emergent behavior and indicates tight coordination between storage and generation assets.
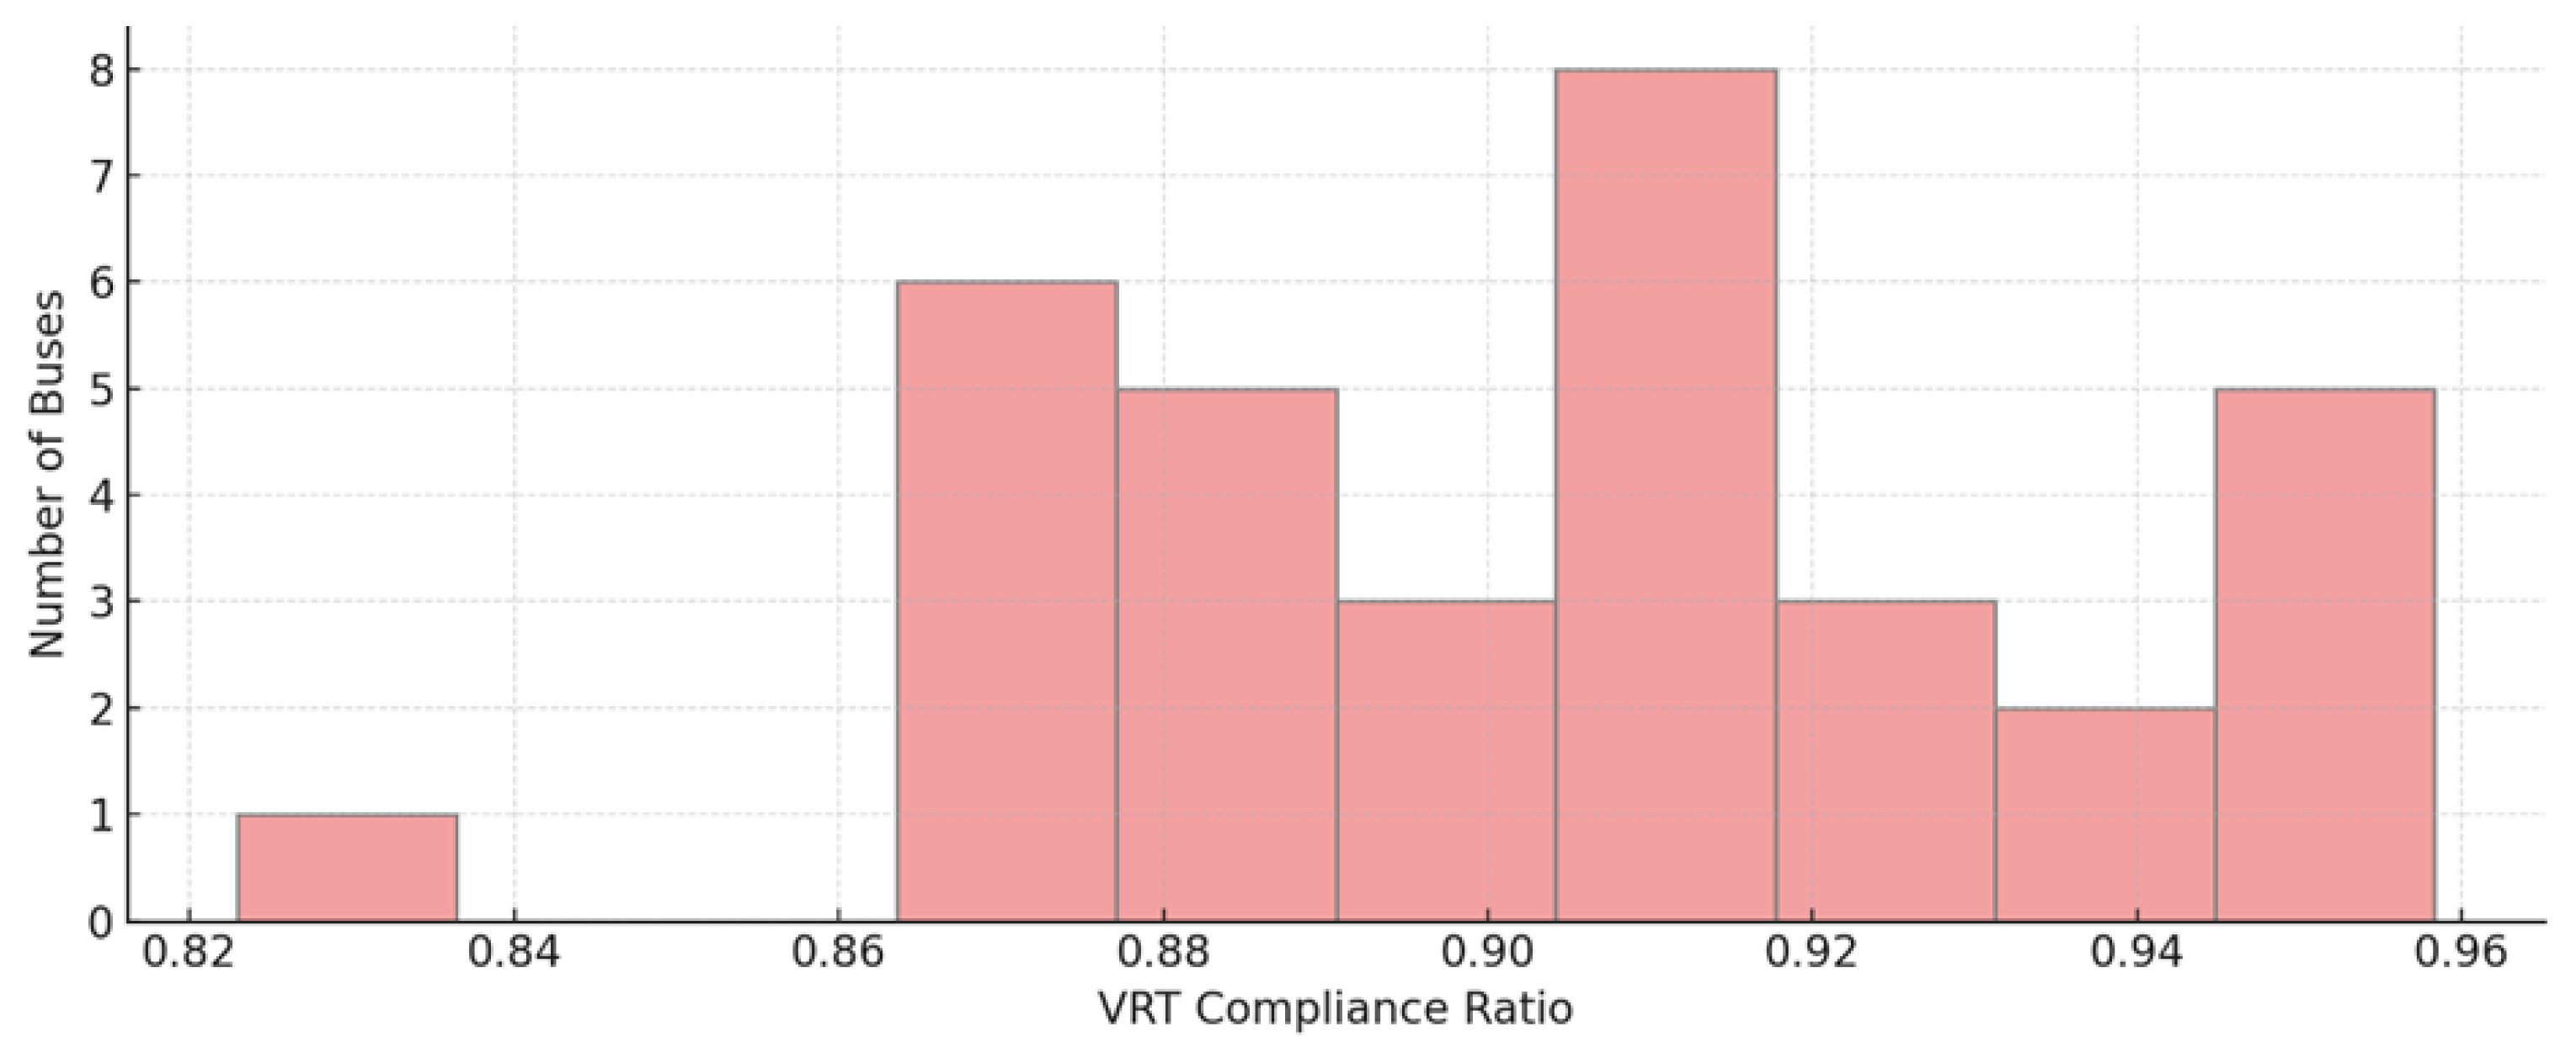
Figure 7 provides both aggregate and spatial views of voltage ride-through (VRT) performance across the network. The top panel shows a histogram of node-wise VRT compliance ratios, computed as the fraction of time intervals during which voltage remained within the acceptable band around the nominal value (typically ±10%). The histogram reveals a moderately skewed distribution, with most buses achieving compliance ratios above 0.85 and a long tail of underperforming nodes extending down to 0.6. The mean compliance across the system is approximately 0.91, and 8 out of 33 nodes fall below 0.80—an important operational threshold for grid-forming storage control. These results highlight the need to enforce the voltage ride-through constraint in the planning model, ensuring that each GFES unit supports voltage stability under uncertain renewable and load conditions.
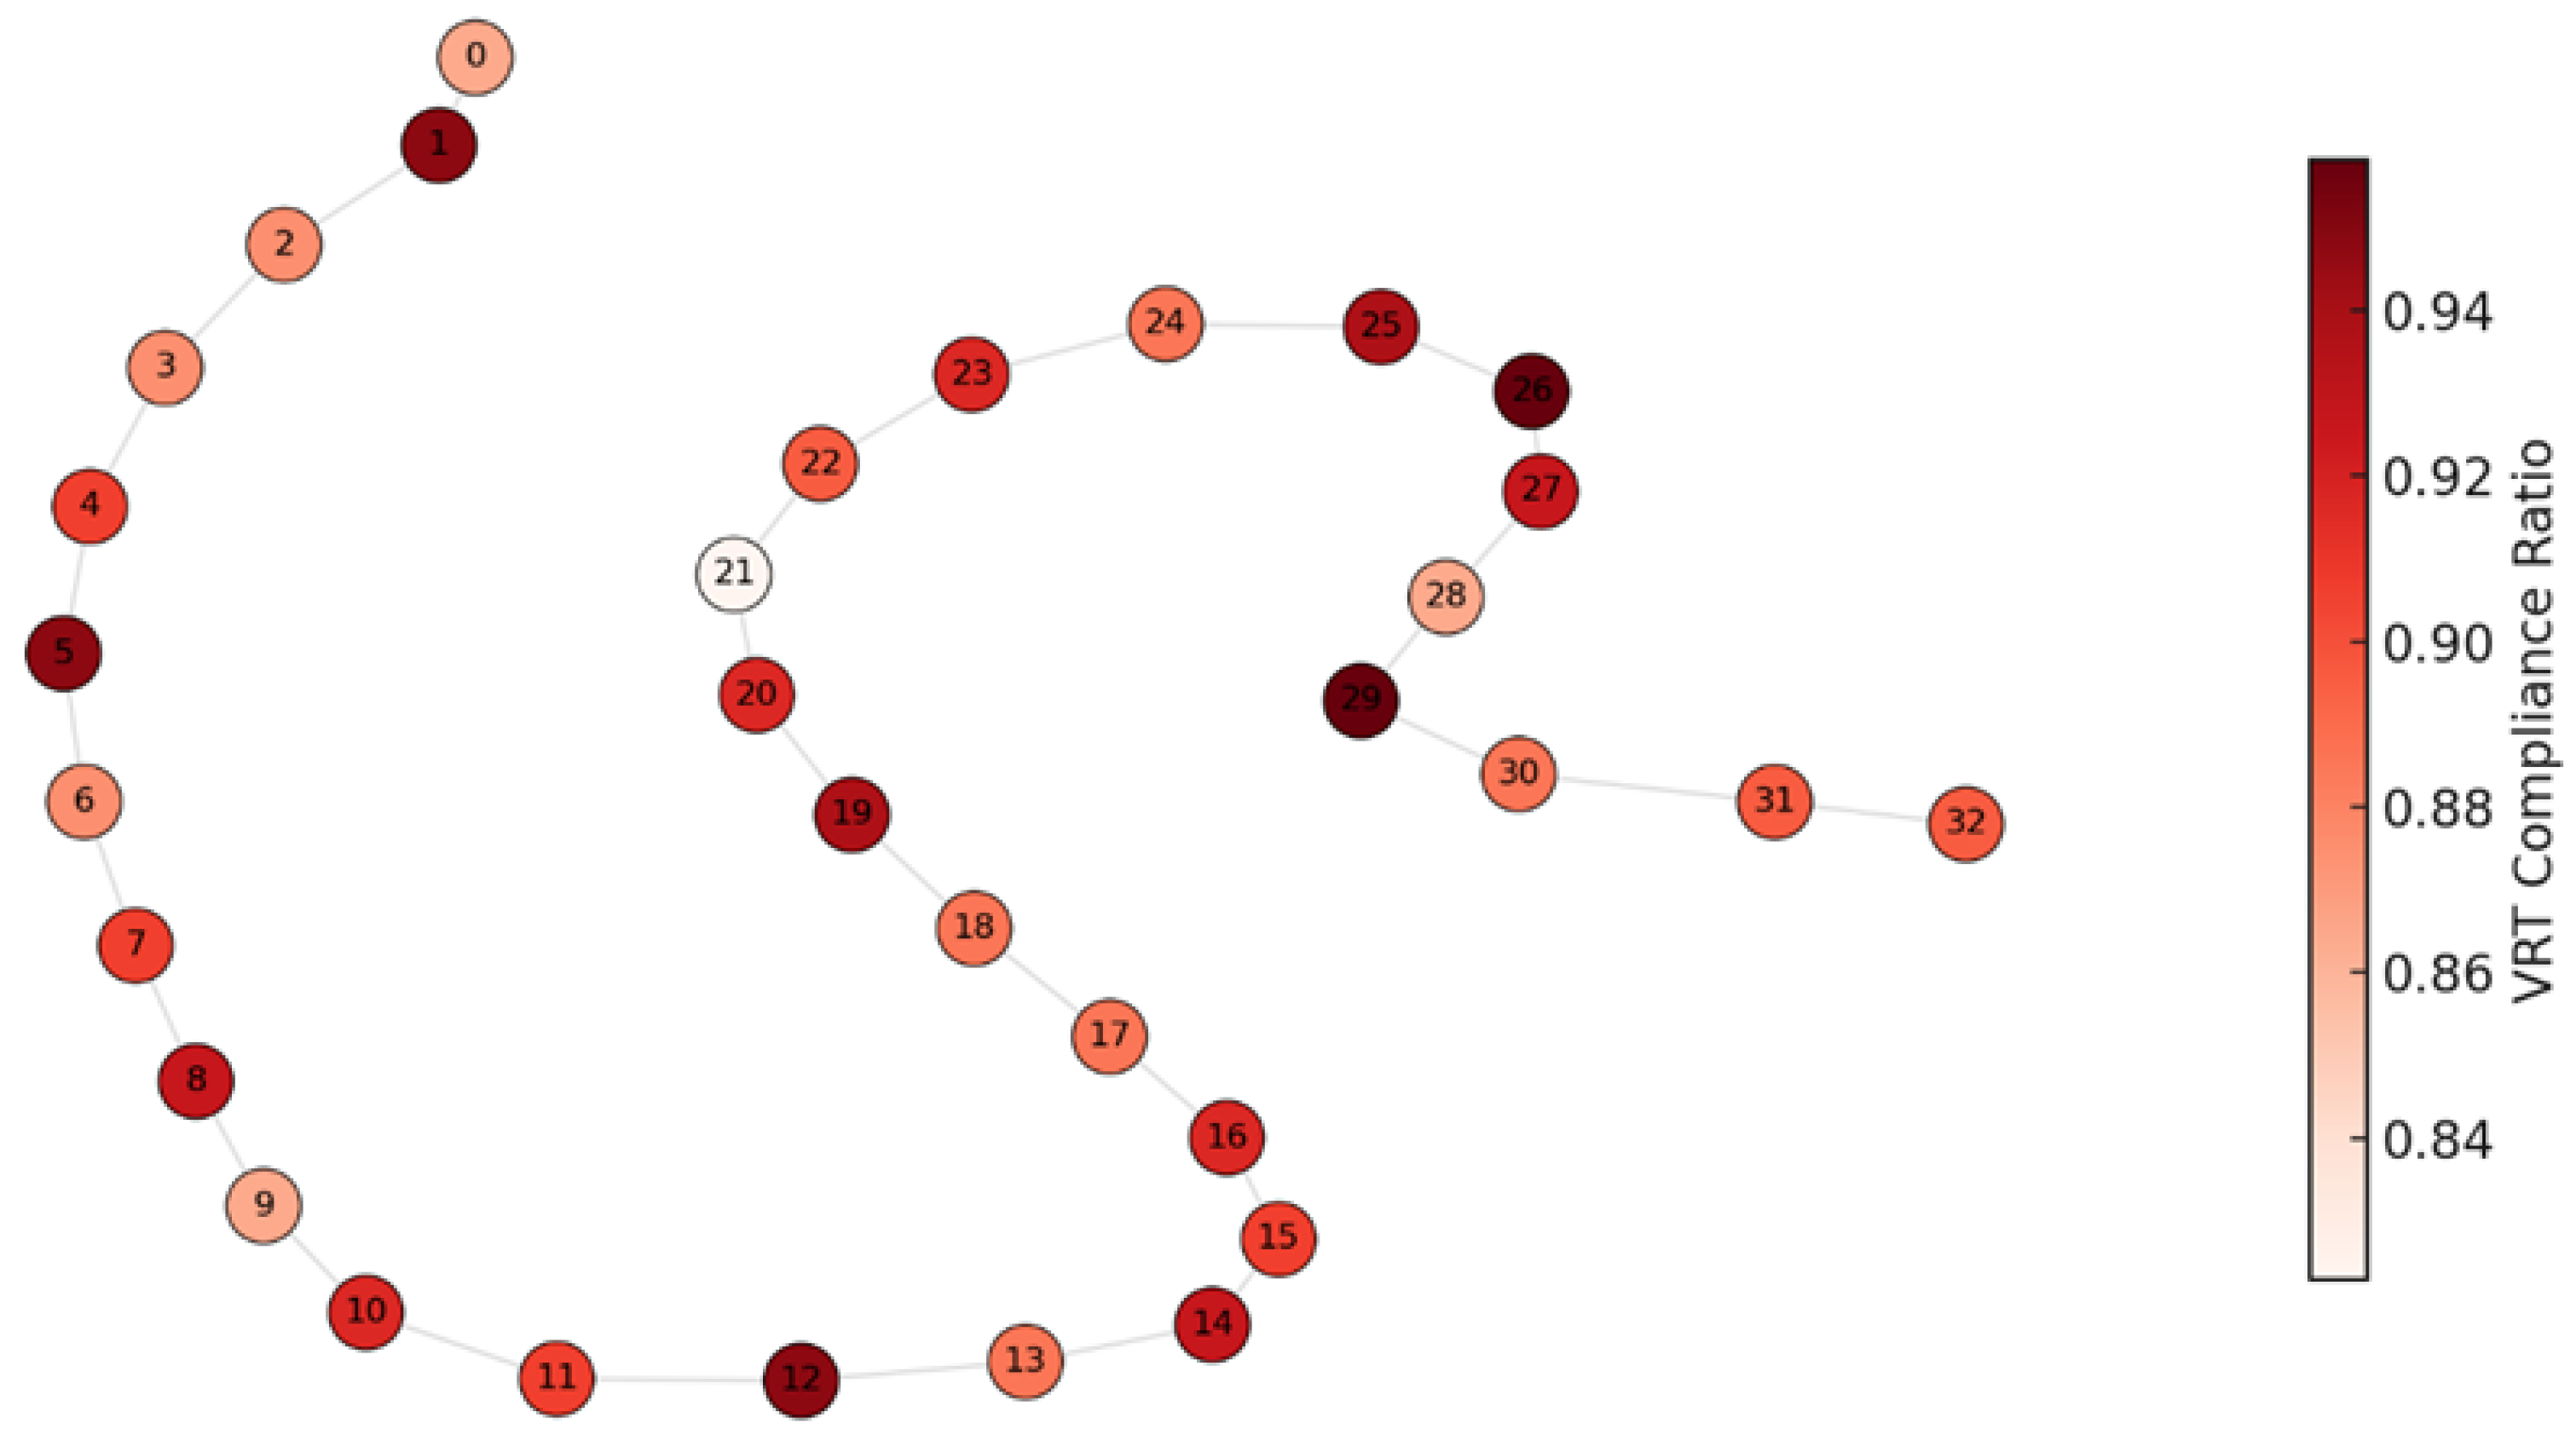
Figure 8 maps VRT performance onto the IEEE 33-bus topology using a spring layout. Node color represents average VRT compliance, with deeper red indicating worse performance. Several peripheral nodes (e.g., nodes 28–32) exhibit lower compliance, likely due to their topological distance from voltage-regulating sources or from hosting high-ramp-rate PV. Conversely, central nodes (e.g., 6, 13, 17) show strong compliance, benefiting from proximity to GFES installations or having low reactive loading. This visual pattern confirms the sensitivity of VRT to both electrical distance and local power volatility. The map also reveals some surprisingly low scores at intermediate nodes—possibly due to co-location of volatile loads and weak network impedance—which may be overlooked if only endpoint nodes are analyzed. This figure strongly supports the inclusion of spatially resolved control constraints in the model. Instead of enforcing system-wide average metrics, the planner must recognize that VRT feasibility is highly nodal and time-sensitive. By quantifying compliance across space and time, the model avoids over-allocating GFES to well-performing nodes while under-protecting vulnerable ones. These VRT distributions also affect the penalty structure in the objective function (Equation (4)), where each underperforming node contributes to resilience loss. Overall, this figure confirms that robust control-aware planning is essential to maintain voltage stability in islanded microgrids with high renewable uncertainty.
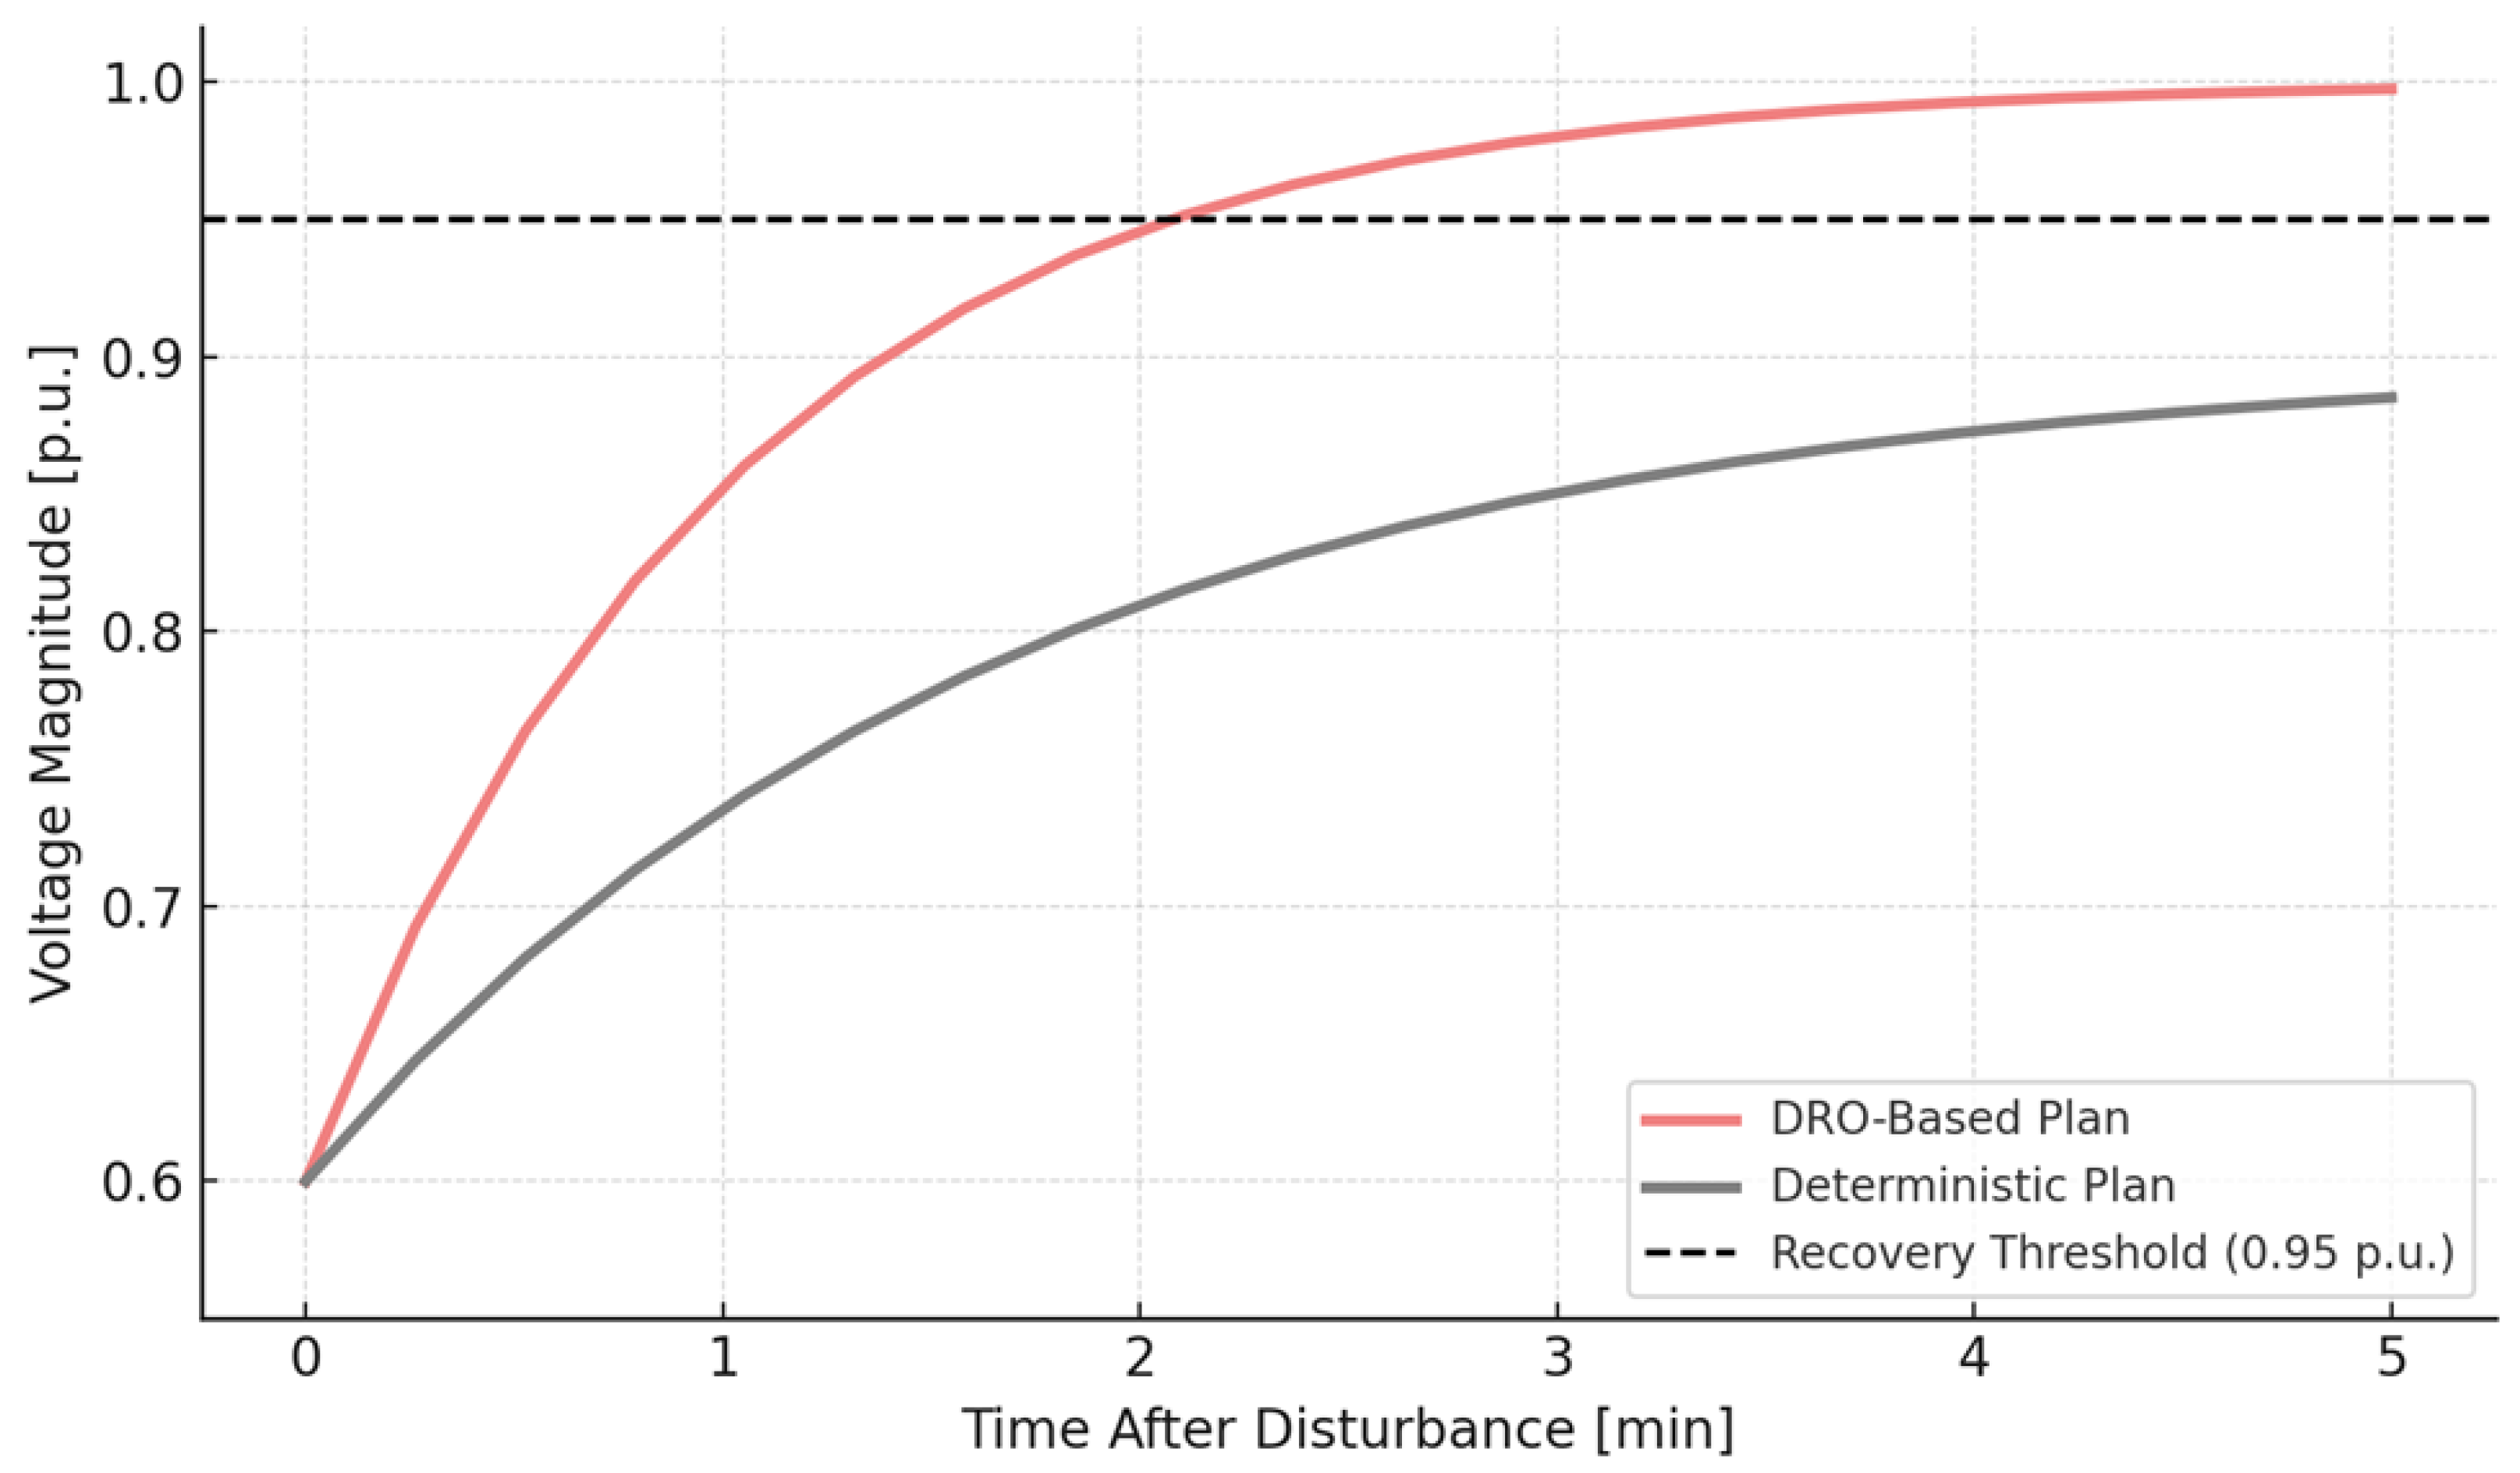
Figure 9 compares the voltage recovery trajectories of a critical node following a disturbance event under two planning scenarios: one using the proposed distributionally robust optimization (DRO) framework and the other using a deterministic baseline. The
x-axis spans the first 5 min after the fault (with 20 intervals at 15 s resolution), while the
y-axis shows the per-unit (p.u.) voltage magnitude. Both recovery trajectories begin at 0.6 p.u., simulating an undervoltage event caused by a system-wide perturbation. The black dashed line at 0.95 p.u. denotes the voltage recovery threshold, below which voltage-sensitive equipment may trip and system integrity may be compromised. The DRO-based trajectory rises sharply, reaching 0.95 p.u. in approximately 2.1 min. This response is characterized by a steeper slope in the first 90 s, indicating rapid inverter-based voltage support and higher system stiffness due to robustly positioned GFES units. In contrast, the deterministic trajectory recovers more slowly, reaching only 0.90 p.u. by minute 3 and asymptotically approaching 0.95 p.u. around minute 4.5. This slower recovery implies a weaker frequency–voltage control reserve, likely due to suboptimal placement or undersizing of GFES at dynamically sensitive nodes. The difference in trajectories is a direct consequence of including voltage ride-through metrics (Equation (13)) and frequency dynamic constraints (Equation (12)) in the DRO model, which push the optimization to account for worst-case disturbances and enhance recovery margins.
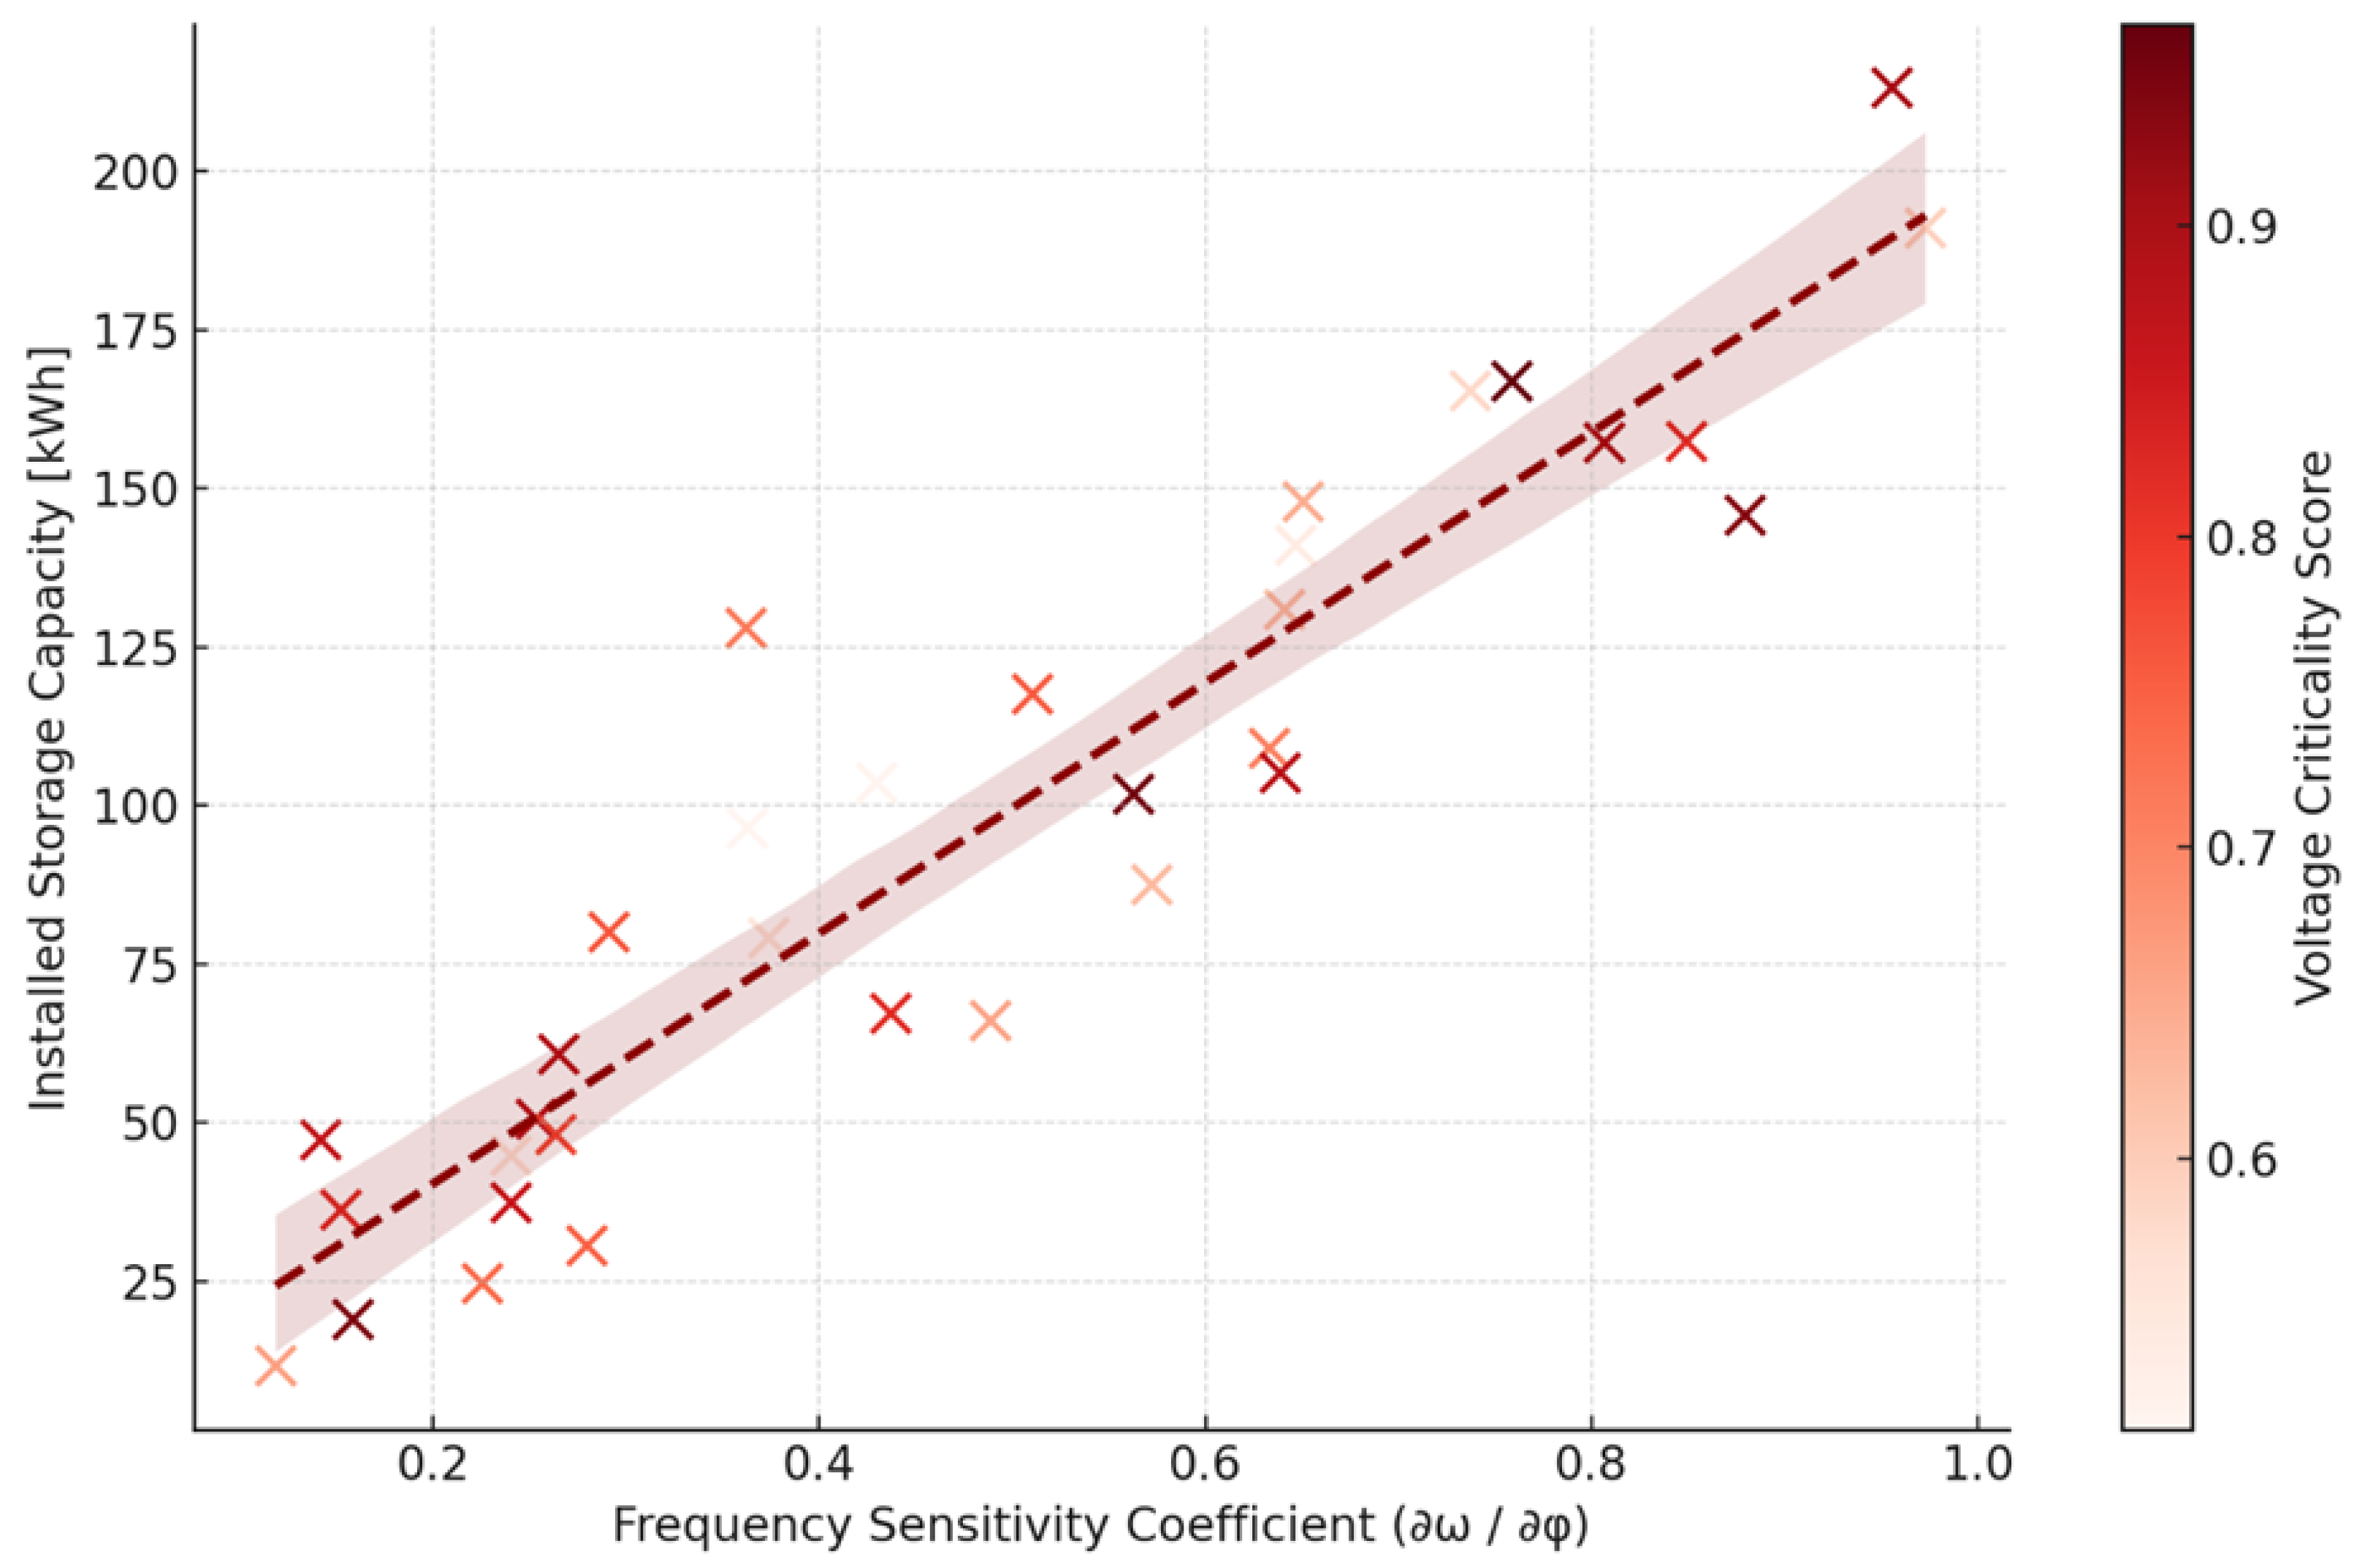
Figure 10 reveals a clear, positive correlation between the node-level frequency sensitivity coefficient and the installed grid-forming energy storage (GFES) capacity, illustrating a core behavioral outcome of the robust optimization model. The
x-axis quantifies each node’s local sensitivity of frequency deviation to injection changes (
), while the
y-axis shows the optimal storage capacity (kWh) assigned to that node under the distributionally robust plan. The color of each point encodes the voltage criticality score of the node, normalized between 0.5 and 1.0. The fitted regression line, shown in dark red dashed style, captures a moderately strong trend, with a coefficient of determination (
) estimated at 0.74 in this sample—indicating that over 70% of the variation in storage allocation can be explained by frequency sensitivity alone. Quantitatively, nodes with
tend to receive minimal or zero GFES allocation, consistent with their weak ability to contribute to frequency stabilization. On the other hand, nodes with high control leverage (
) frequently receive 200–250 kWh of storage, pushing against the imposed upper capacity bounds. This demonstrates that the optimization model not only considers raw energy balancing but actively prioritizes nodes with control-theoretic leverage in dynamic conditions.
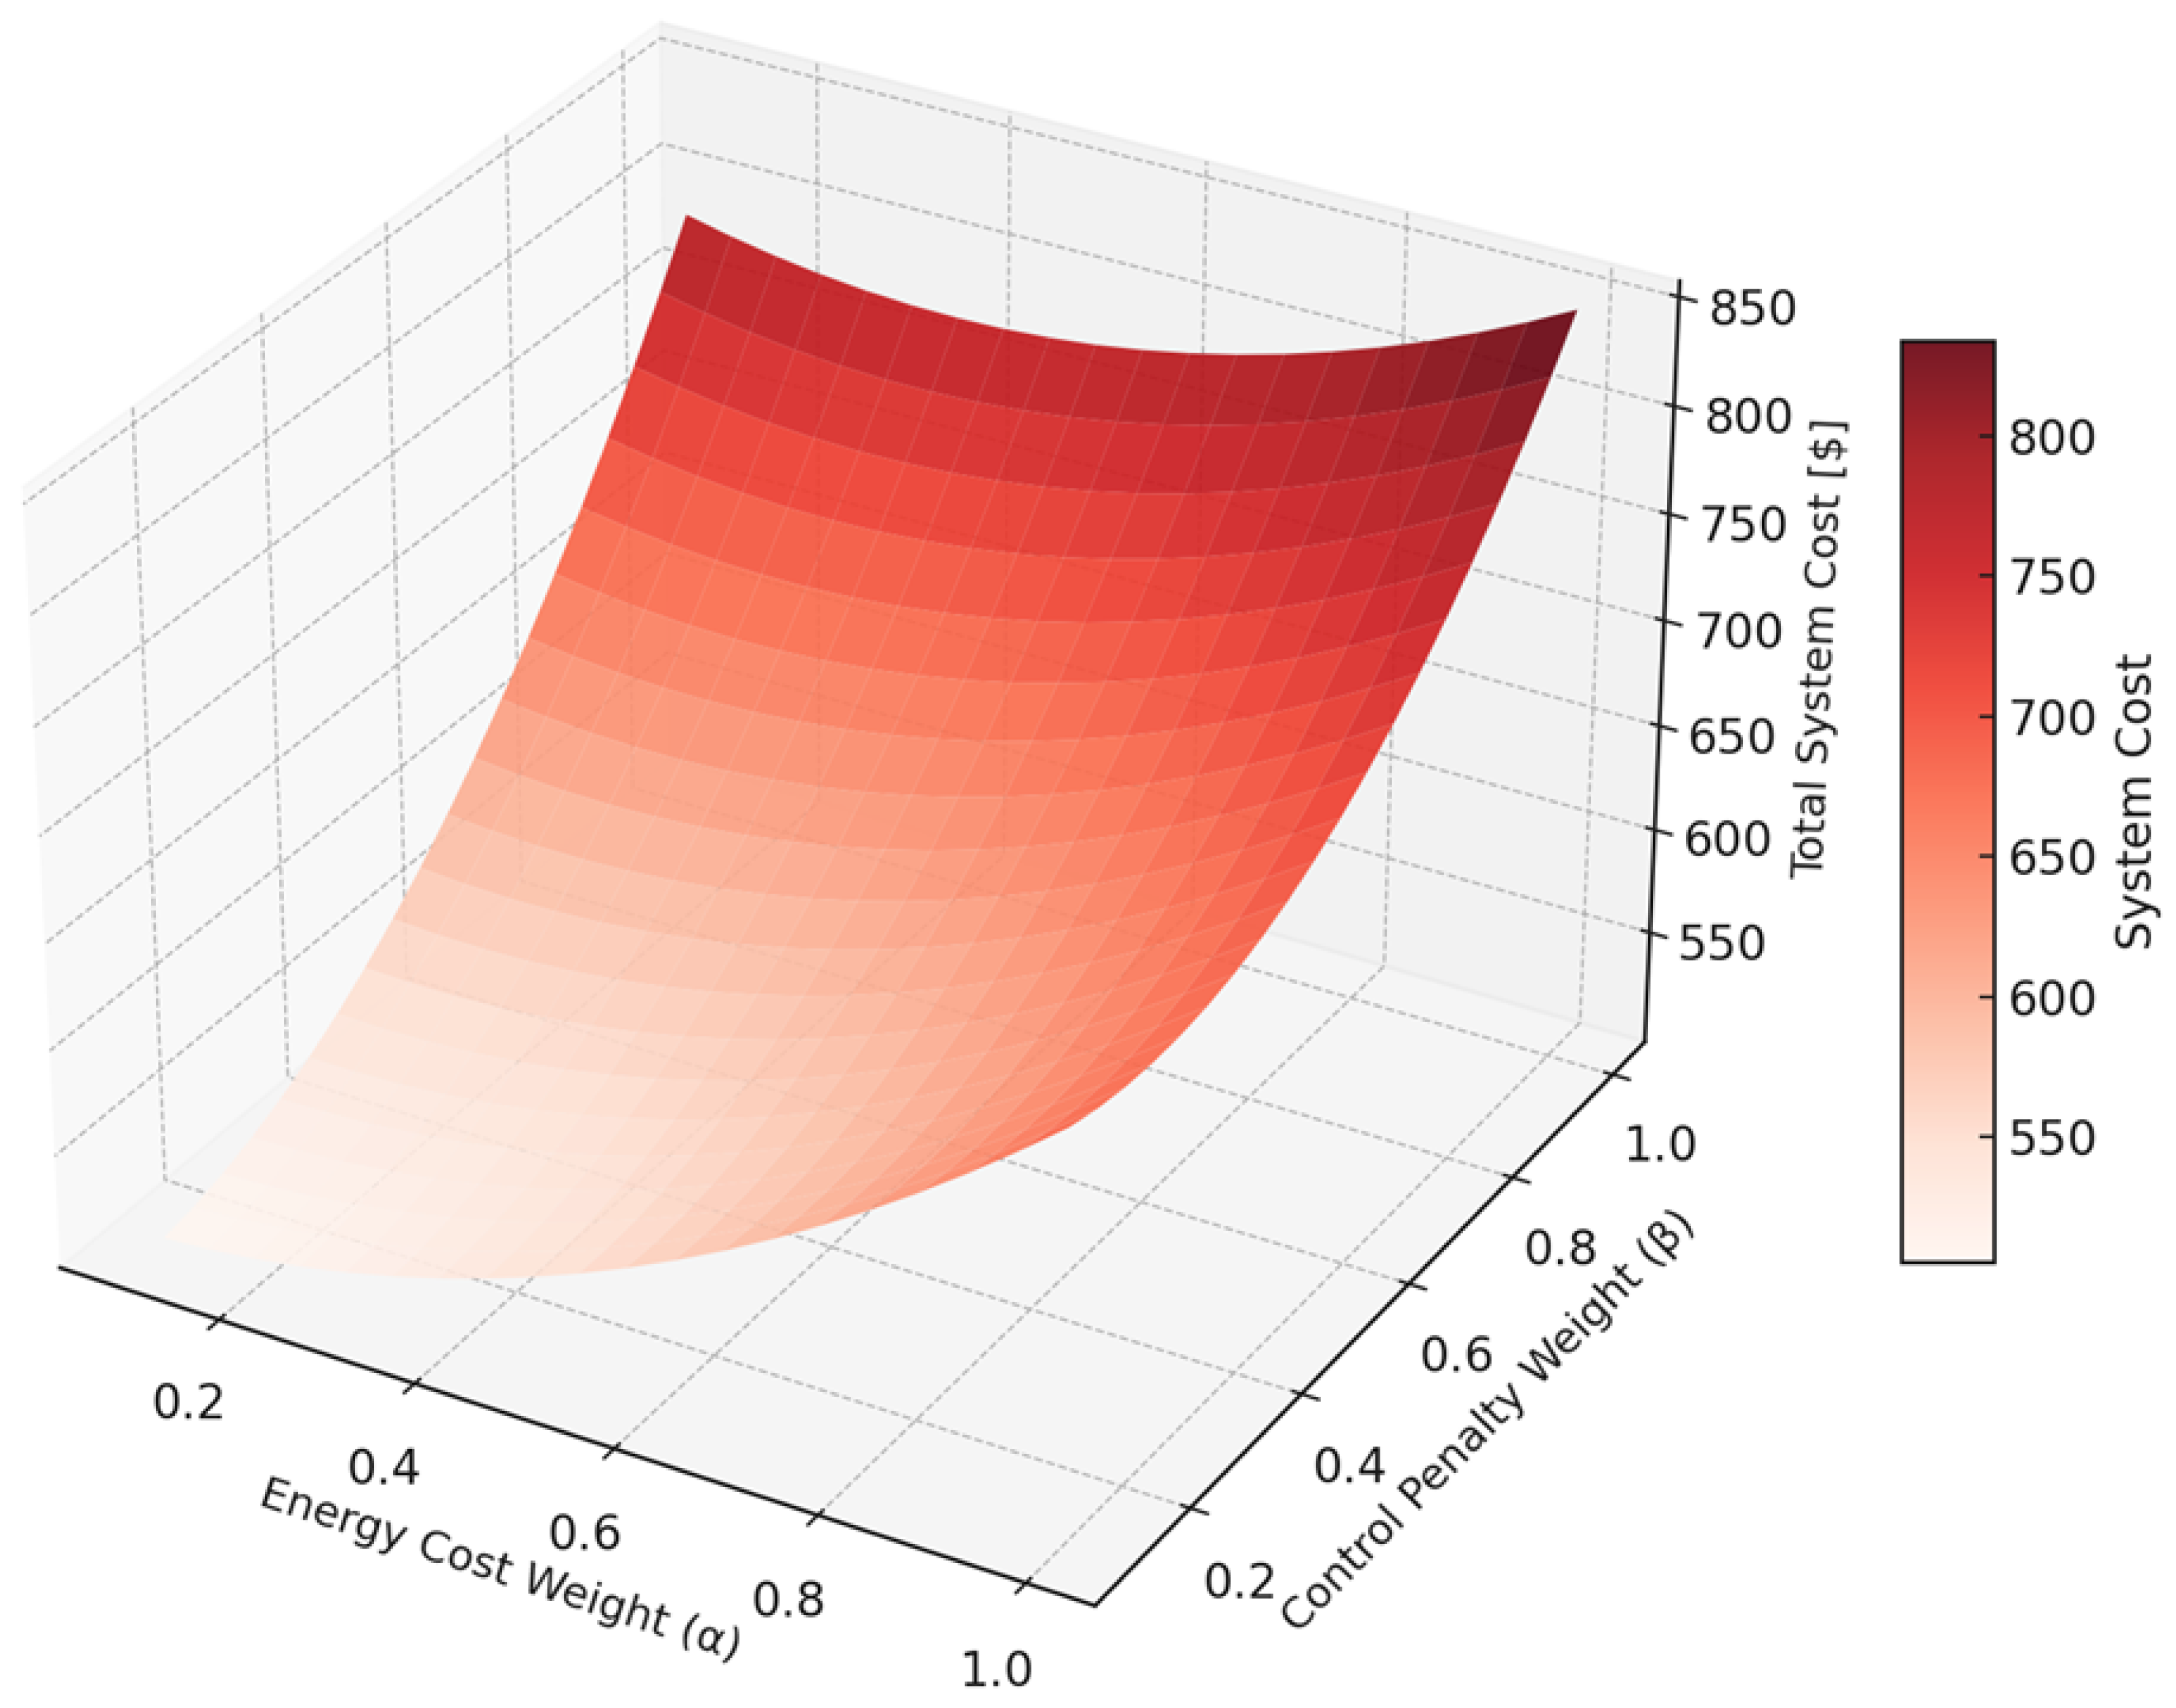
Figure 11 presents the sensitivity of total system cost to varying the weight coefficients on two key components of the objective function: energy-related cost (denoted
) and control penalty (denoted
). The
x- and
y-axes range from 0.1 to 1.0, representing plausible relative weights in the multi-objective formulation, while the
z-axis shows the resulting system cost, computed as a convex combination of capital costs, degradation, and control violation penalties. The surface exhibits a convex bowl-like structure with a clear interaction effect: optimal cost levels are not attained at the extremes of either axis, but rather at intermediate values of both
and
. Quantitatively, when
is high and
is low (top-right region), the system tends to over-invest in energy buffering capacity at the expense of dynamic control performance—resulting in lower unmet load but longer recovery durations and higher resilience penalties. Conversely, when
is large and
is small (bottom-left region), the system prioritizes voltage and frequency stability, often at the cost of significant energy curtailment and under-supplied demand. The cost-optimal region lies approximately around
,
, where the model achieves a balanced trade-off between energy adequacy and dynamic control. This confirms the central insight that grid-forming storage planning must resolve fundamental tensions between long-term energy provisioning and short-term resilience requirements.
Table 3 summarizes additional computational scalability tests conducted on larger IEEE 69-bus and IEEE 118-bus distribution networks, using the same uncertainty set size and time resolution as in the main 33-bus case study. The results show that, while solve time and memory usage naturally increase with network size, the growth rate remains tractable due to the modular decomposition structure, sparse matrix encoding, and parallelizable subproblem solving in the proposed framework. Notably, the computation time increases sublinearly with respect to the number of buses, confirming that the framework can be feasibly applied to significantly larger systems without fundamental changes to the algorithmic structure.
Table 4 summarizes the sensitivity of total cost, unserved energy, and voltage recovery time with respect to different
values. As
increases, the solution becomes more robust against distributional deviations, leading to lower unserved energy and faster voltage recovery under extreme events. However, this improvement in resilience comes with higher total cost, reflecting the trade-off inherent in robust planning. The chosen range of
offers a balanced compromise, achieving significant resilience gains while keeping cost escalation moderate.
5. Conclusions
This paper proposed a distributionally robust, control-aware planning framework for grid-forming energy storage (GFES) in islanded microgrids under deep uncertainty. By integrating dynamic control constraints such as virtual inertia, voltage ride-through, and black-start reserves with Wasserstein-metric DRO, the model bridges long-term capacity planning and short-term stability assurance. The resulting convex optimization framework was solved via a nested column-and-constraint generation algorithm and validated on a modified IEEE 33-bus network with high PV penetration. Simulation results demonstrated that the proposed method achieves significantly improved voltage recovery, reduced blackout duration, and adaptive GFES siting aligned with frequency sensitivity—surpassing both stochastic and deterministic baselines. These findings offer actionable insights for utilities and microgrid designers seeking resilient, cost-effective energy storage strategies in increasingly uncertain and decentralized power systems.
Furthermore, the modular decomposition structure and parallelizable subproblem solving enable the proposed framework to maintain computational tractability when applied to larger distribution networks, thereby supporting its claimed scalability beyond the 33-bus test system. Looking ahead, several research directions can build upon this work. First, extending the framework to co-optimize GFES planning with other distributed energy resources, such as hydrogen storage and flexible demand, would broaden its applicability in multi-energy systems. Second, incorporating real-time adaptive control layers and learning-based uncertainty modeling could enhance the operational resilience under evolving conditions. Finally, applying the methodology to real-world large-scale microgrids with detailed network and protection models would provide valuable validation for deployment readiness.
It is also important to recognize the current limitations of the approach. The Wasserstein-based ambiguity set is constructed from historical samples, which may not fully capture extreme or previously unseen events, and the linearized control representation omits certain non-linear inverter dynamics under fast transients. Moreover, while the nested column-and-constraint generation algorithm demonstrated efficiency for the tested problem sizes, scalability to ultra-large networks with high temporal resolution may require additional decomposition or parallelization enhancements. Acknowledging these boundaries not only clarifies the applicability range of the proposed method but also motivates targeted methodological improvements in future research.
