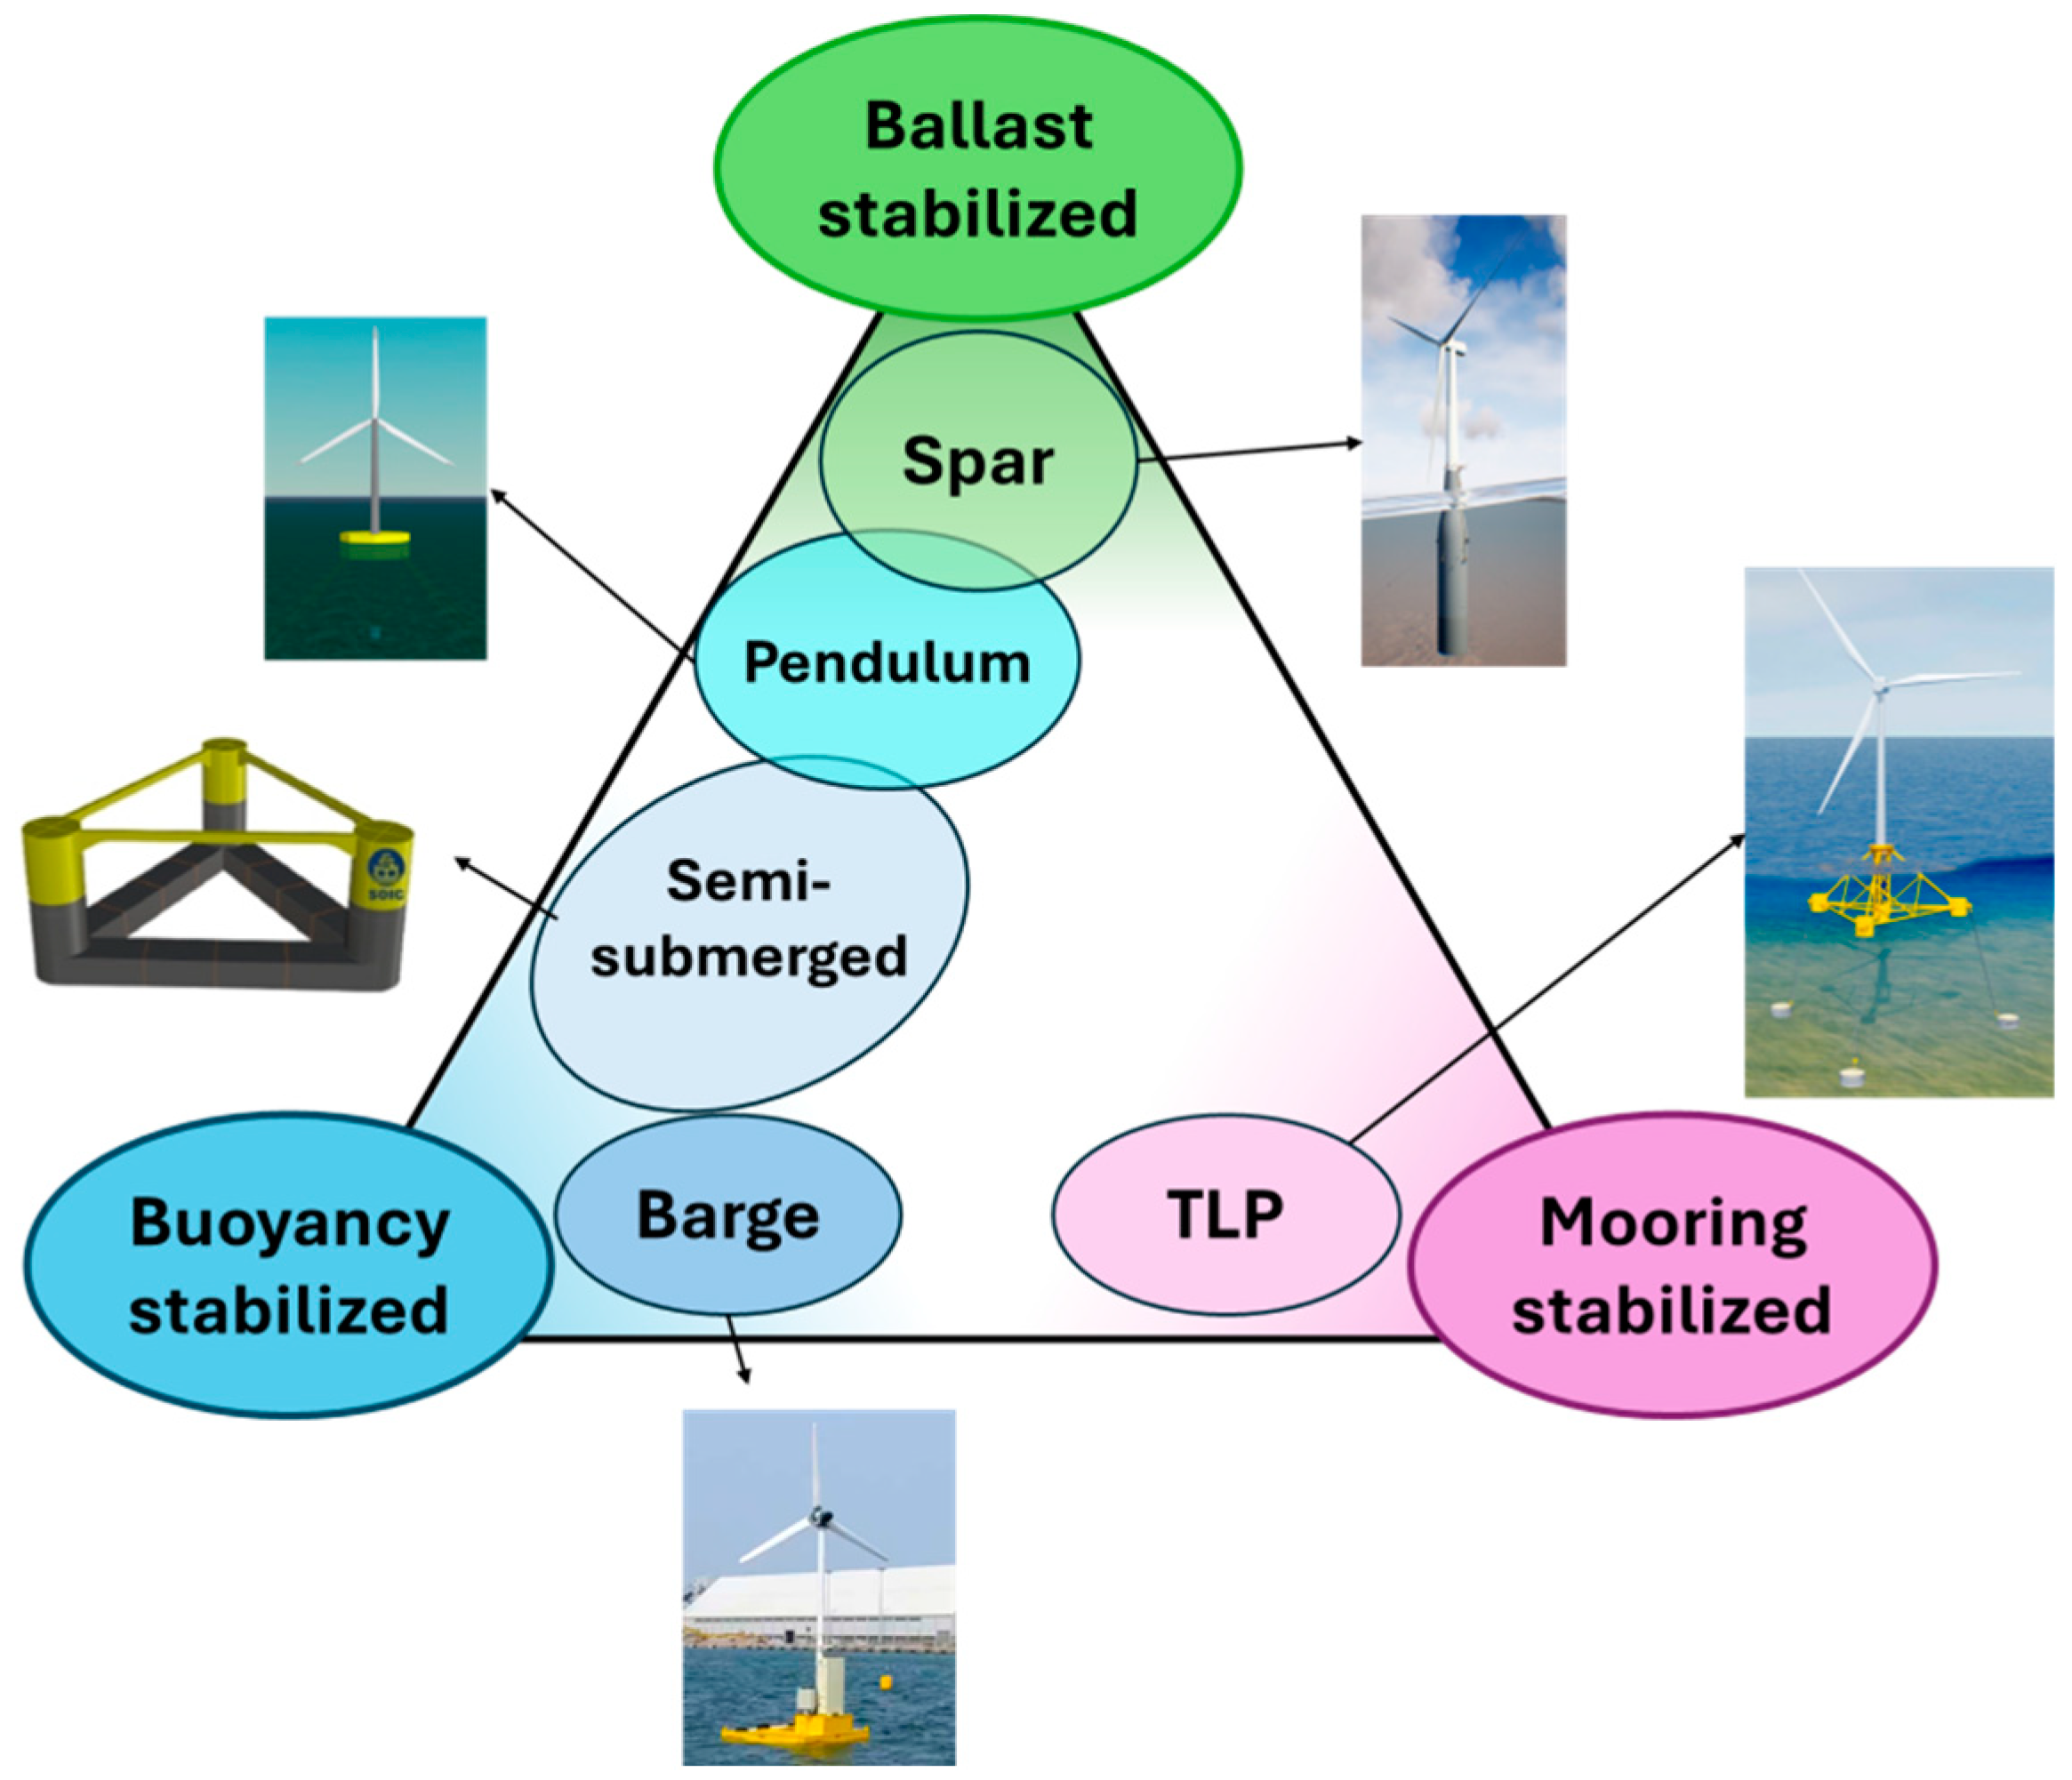
Figure 1.
Classification of floating platforms.
Figure 1.
Classification of floating platforms.
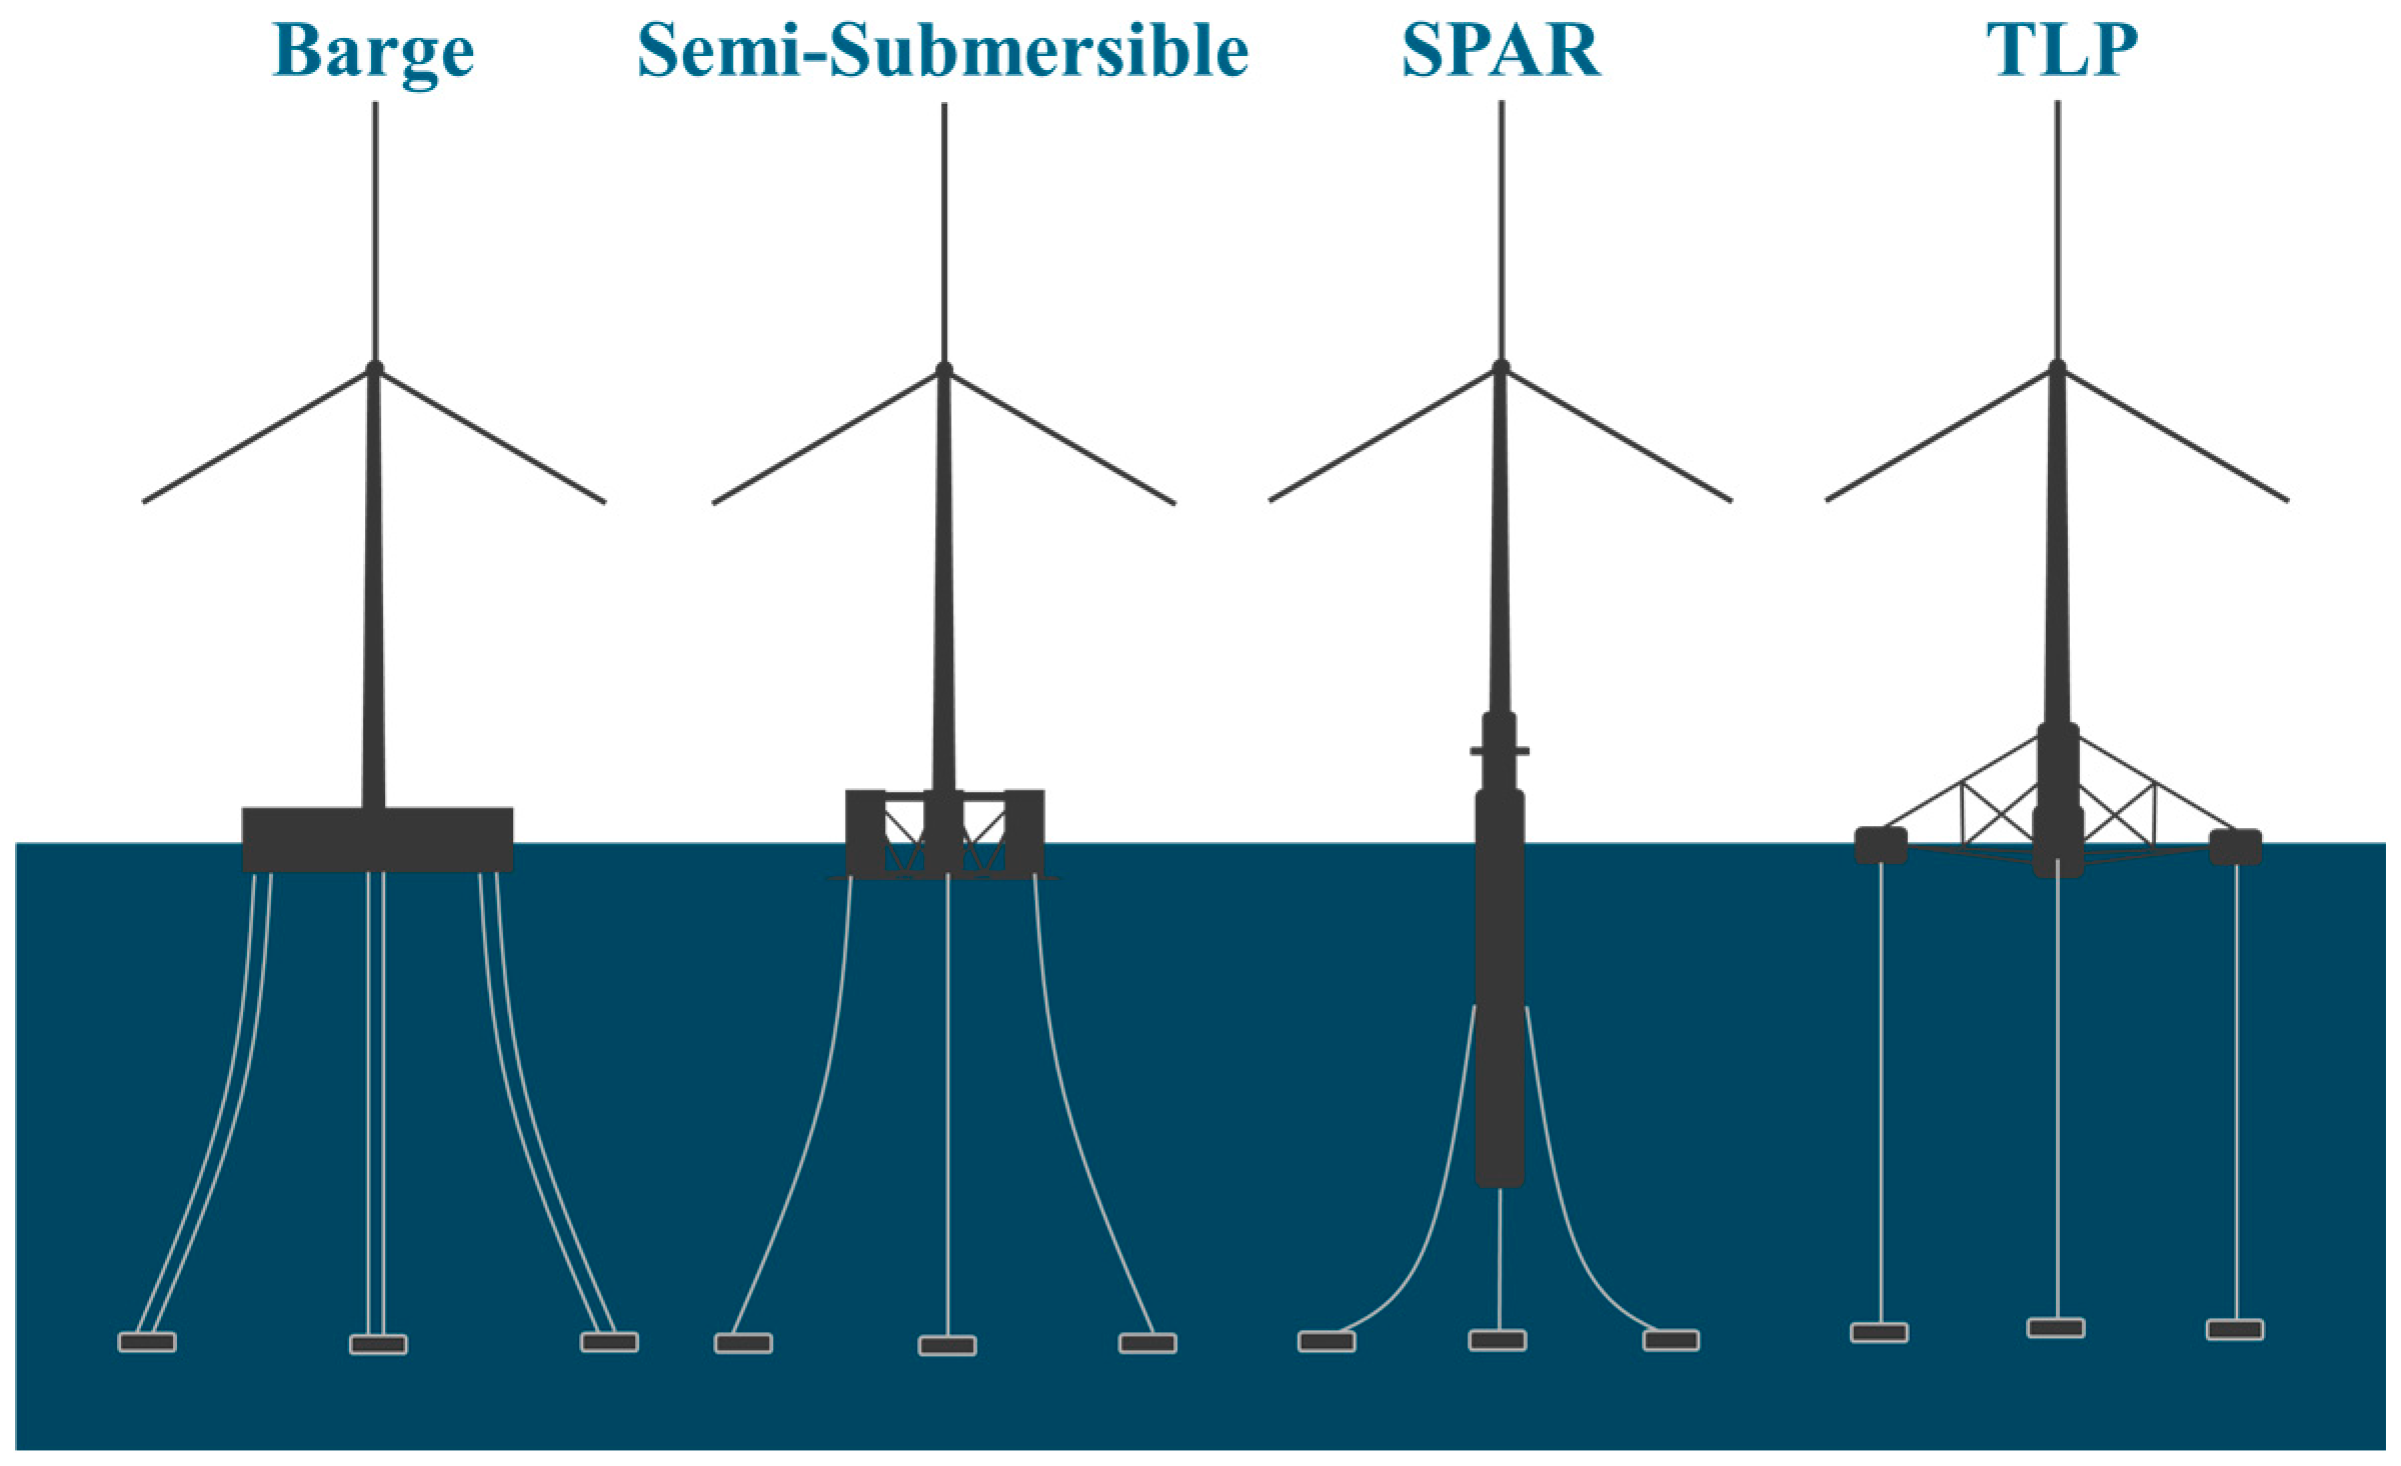
Figure 2.
Types of floating platforms.
Figure 2.
Types of floating platforms.
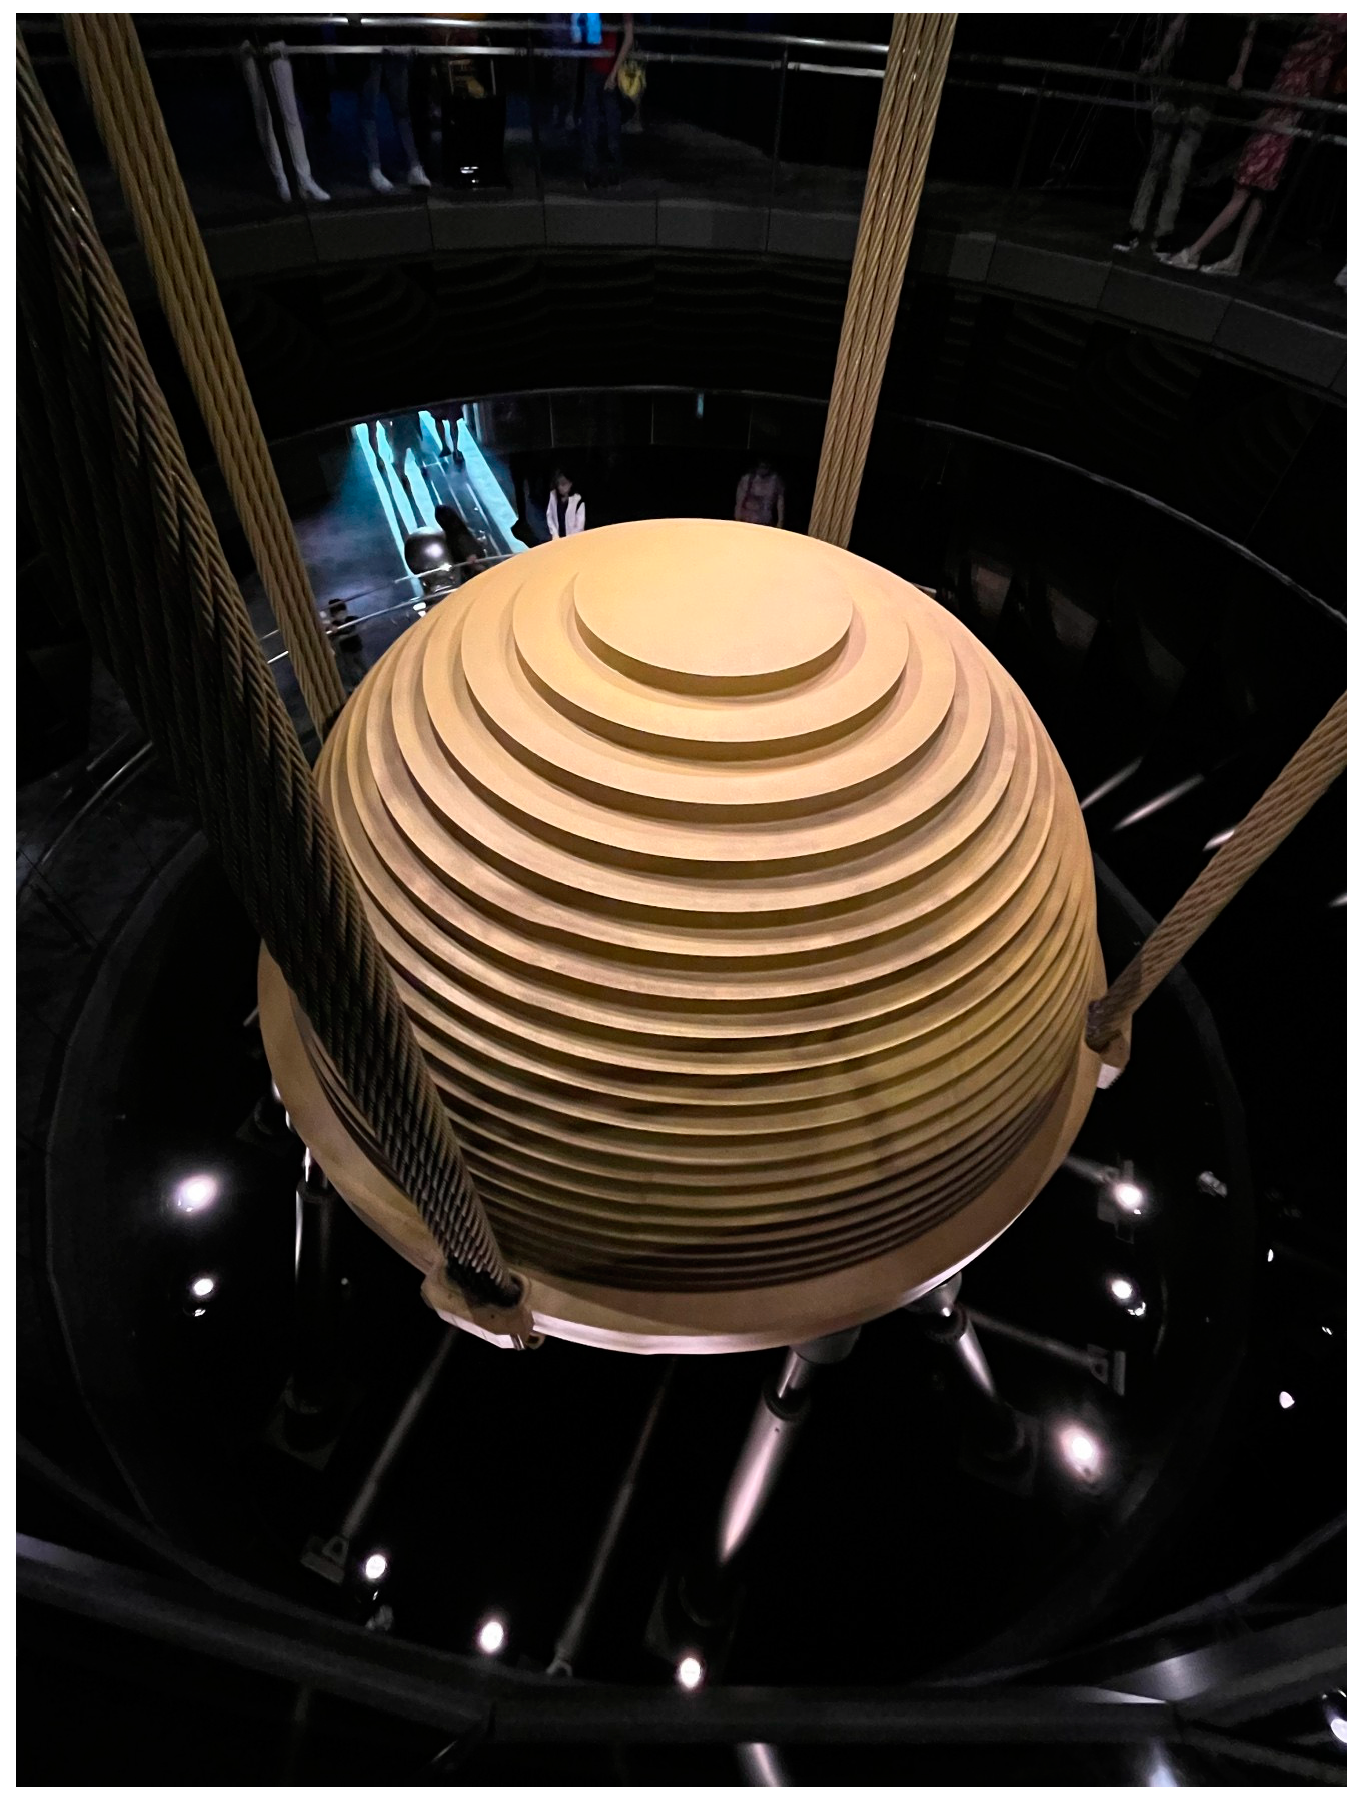
Figure 3.
Taipei 101 Tuned Mass Damper.
Figure 3.
Taipei 101 Tuned Mass Damper.
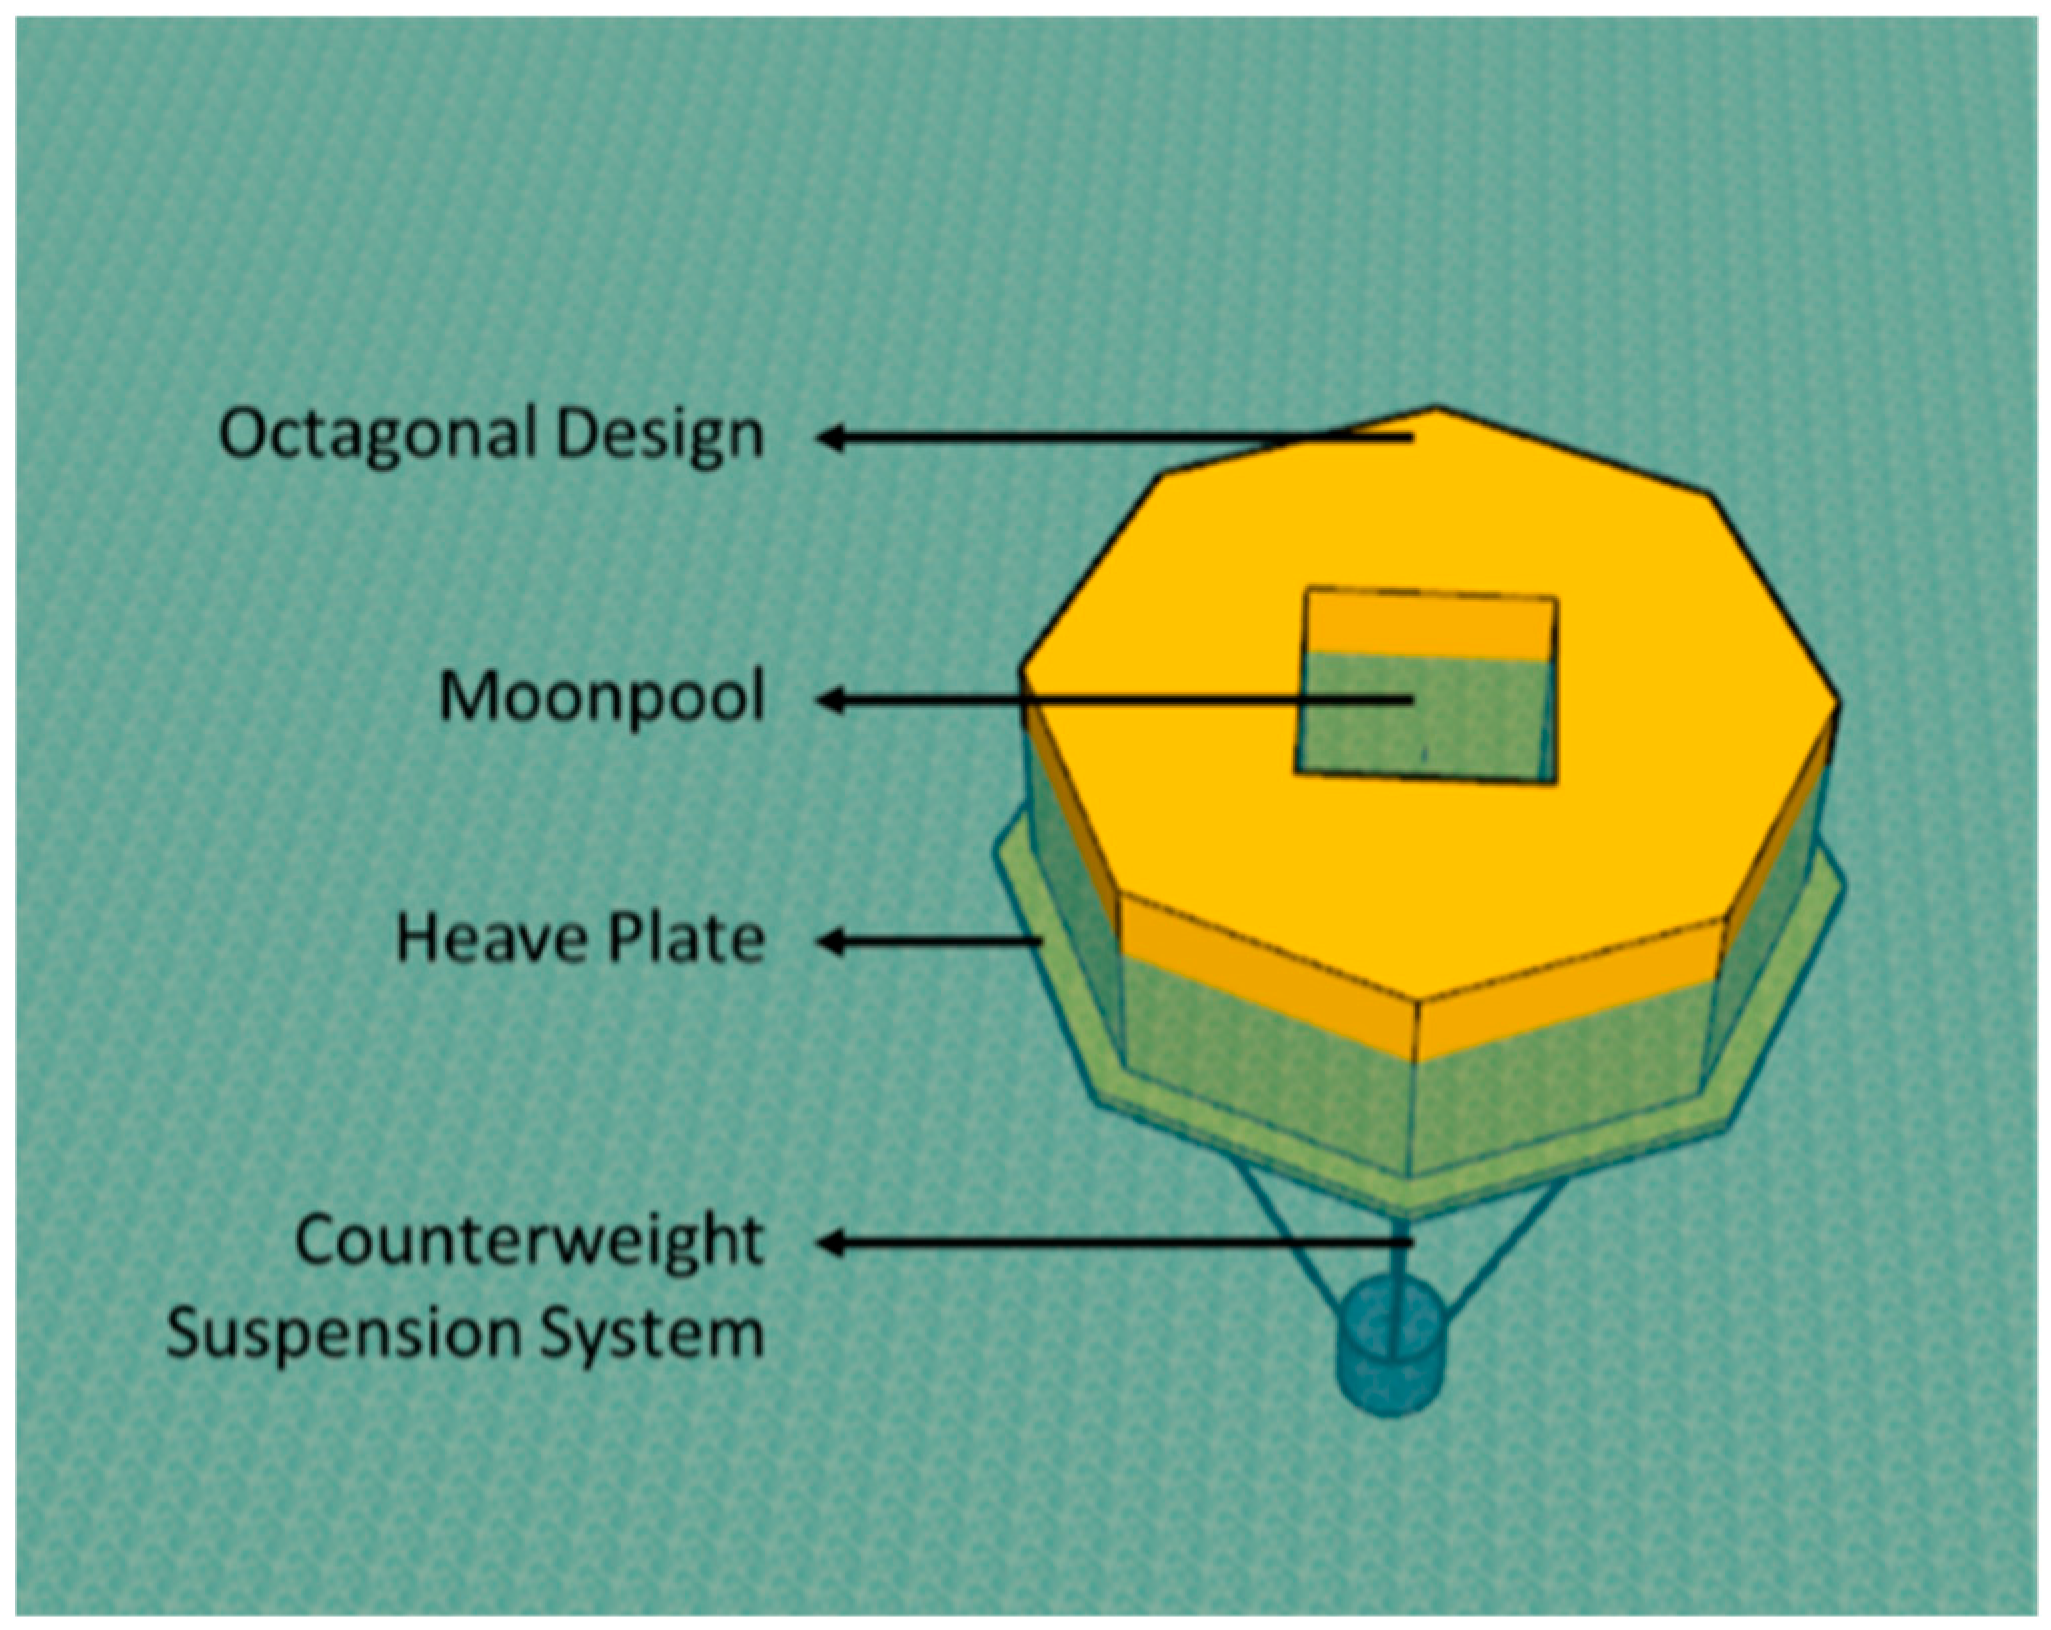
Figure 4.
Design concept of Suspensa OctaFloat.
Figure 4.
Design concept of Suspensa OctaFloat.
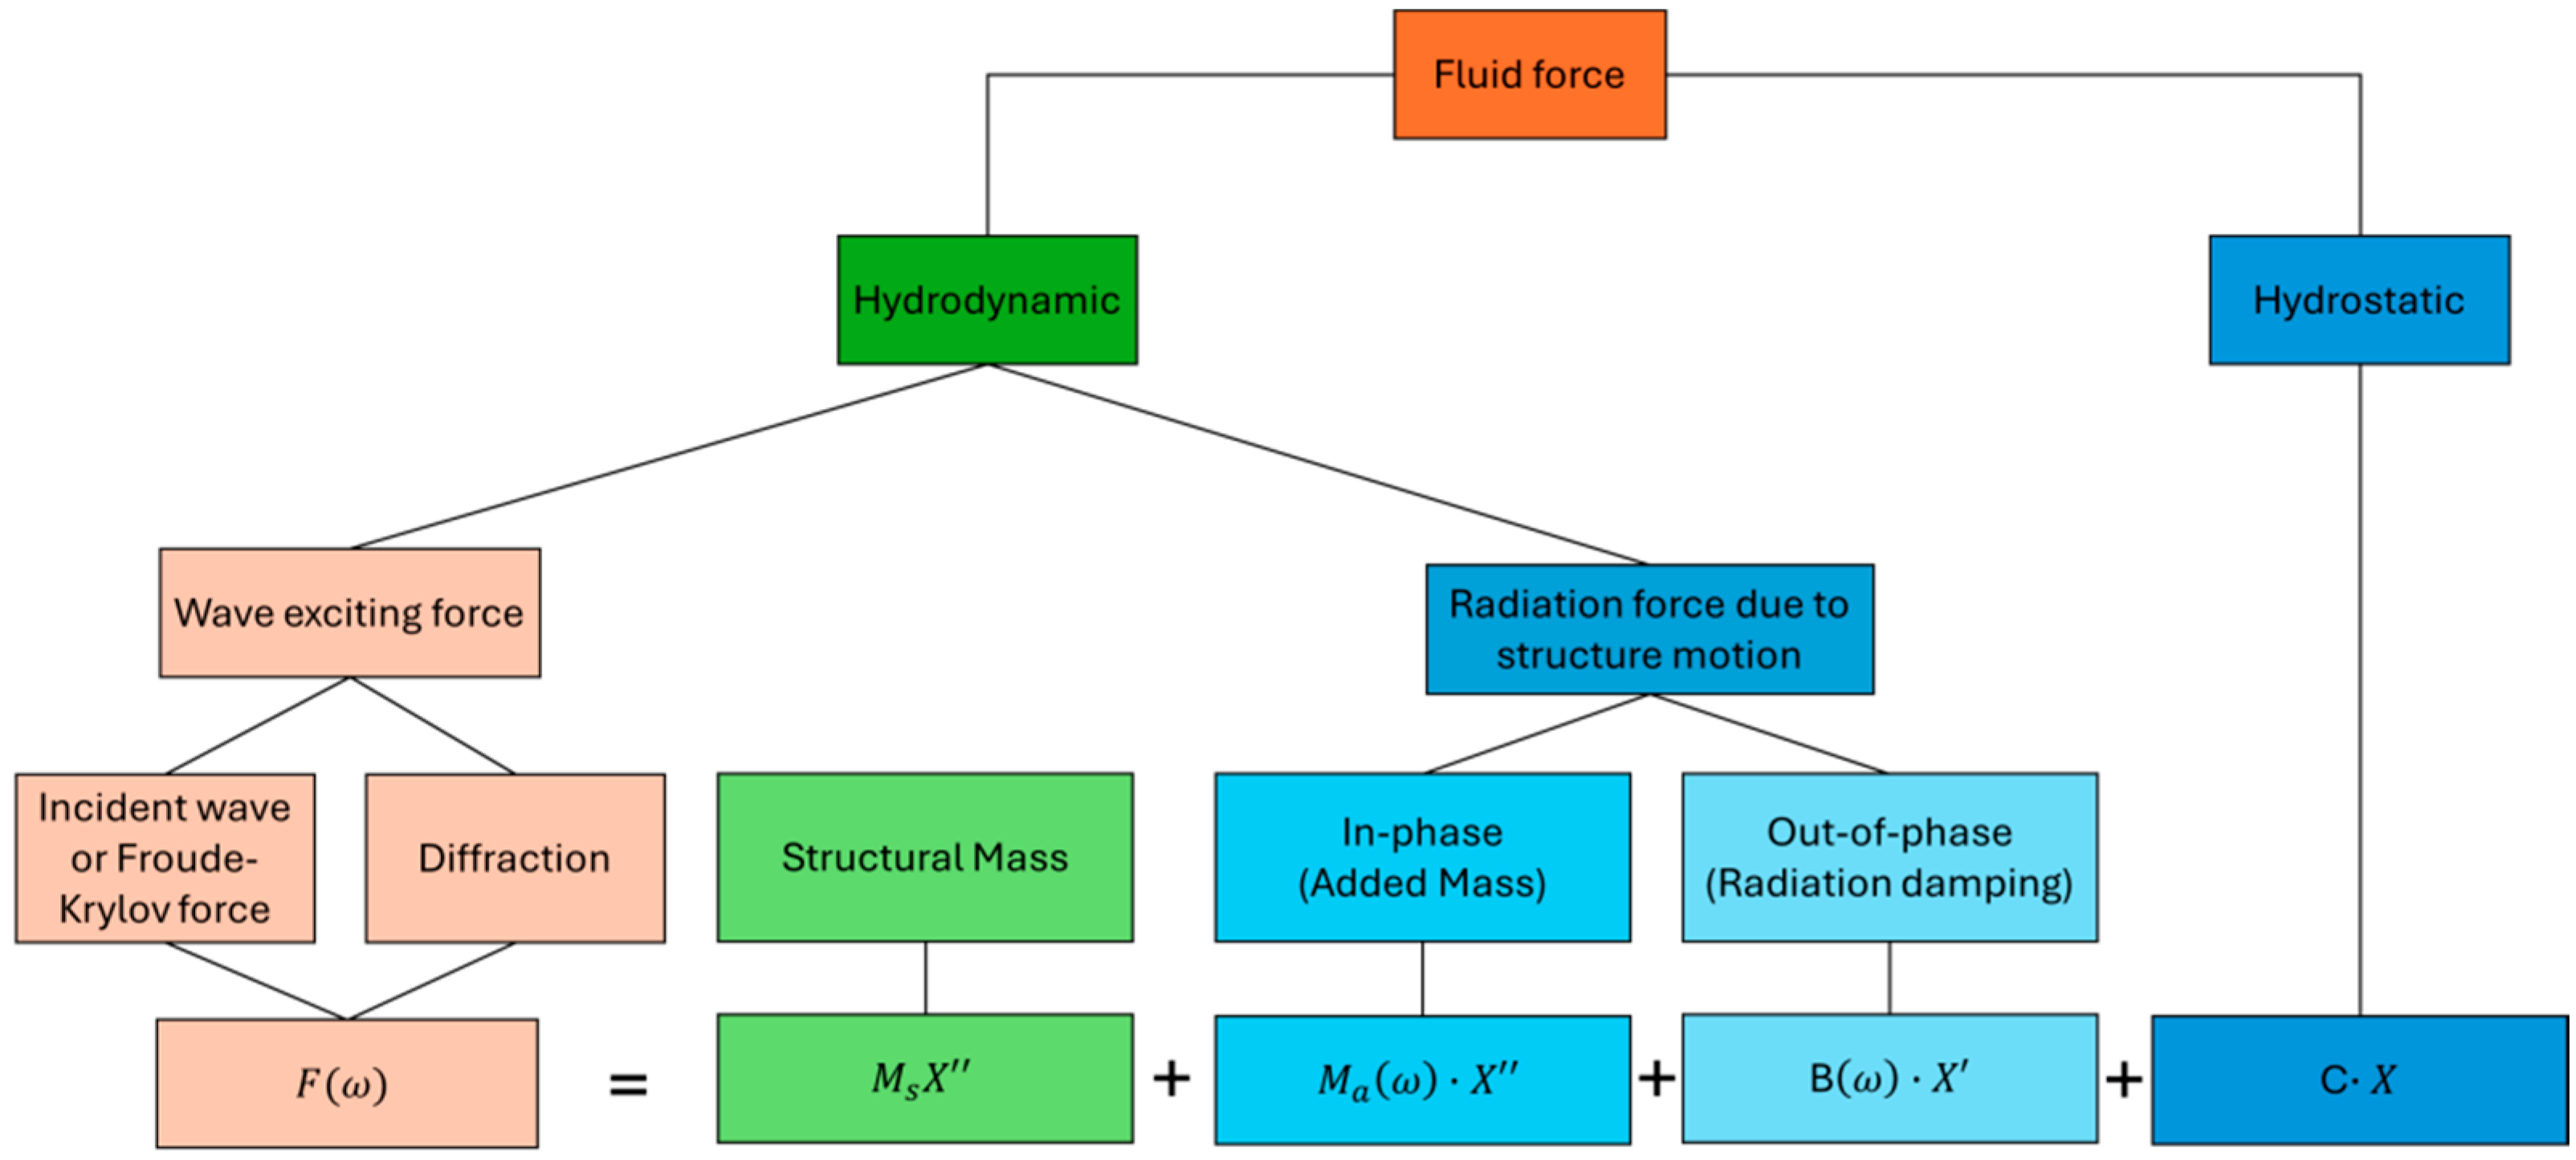
Figure 5.
Theoretical framework of Ansys AQWA.
Figure 5.
Theoretical framework of Ansys AQWA.
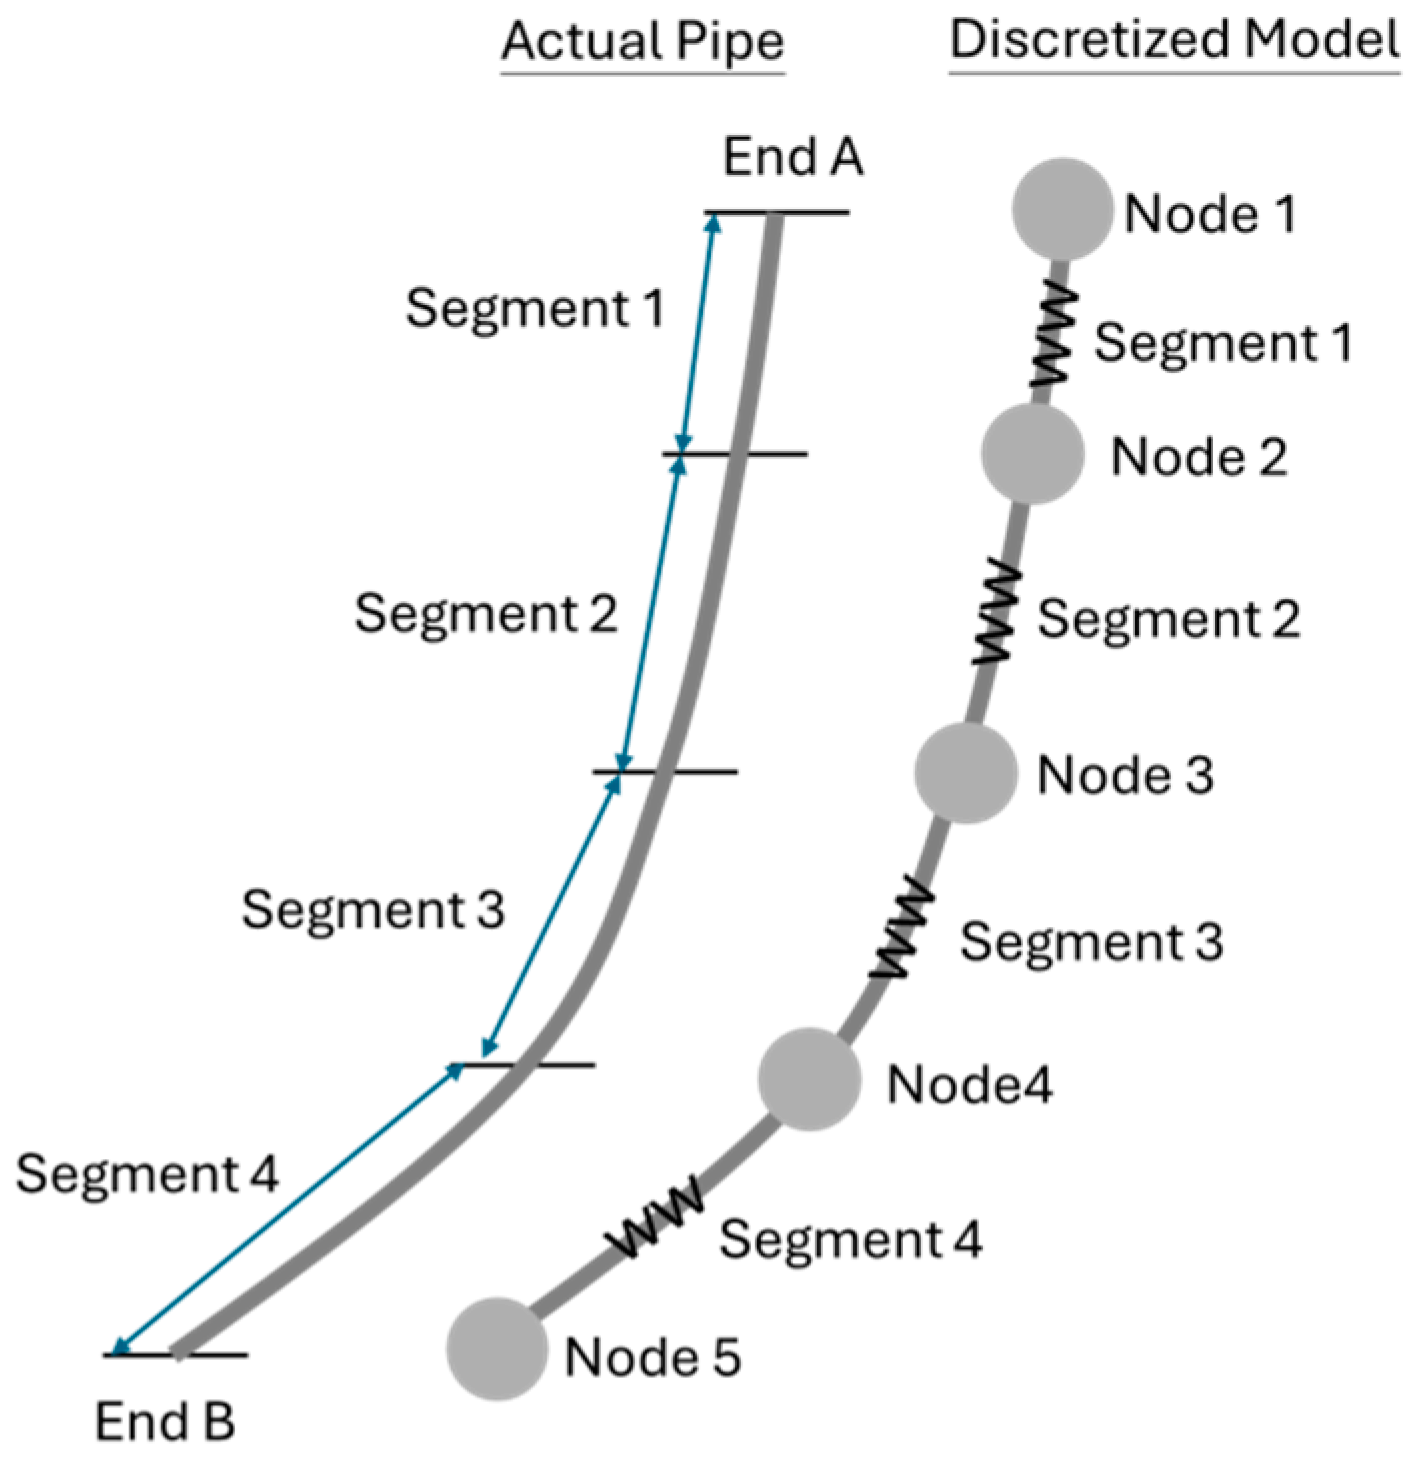
Figure 6.
Lumped mass method in OrcaFlex.
Figure 6.
Lumped mass method in OrcaFlex.
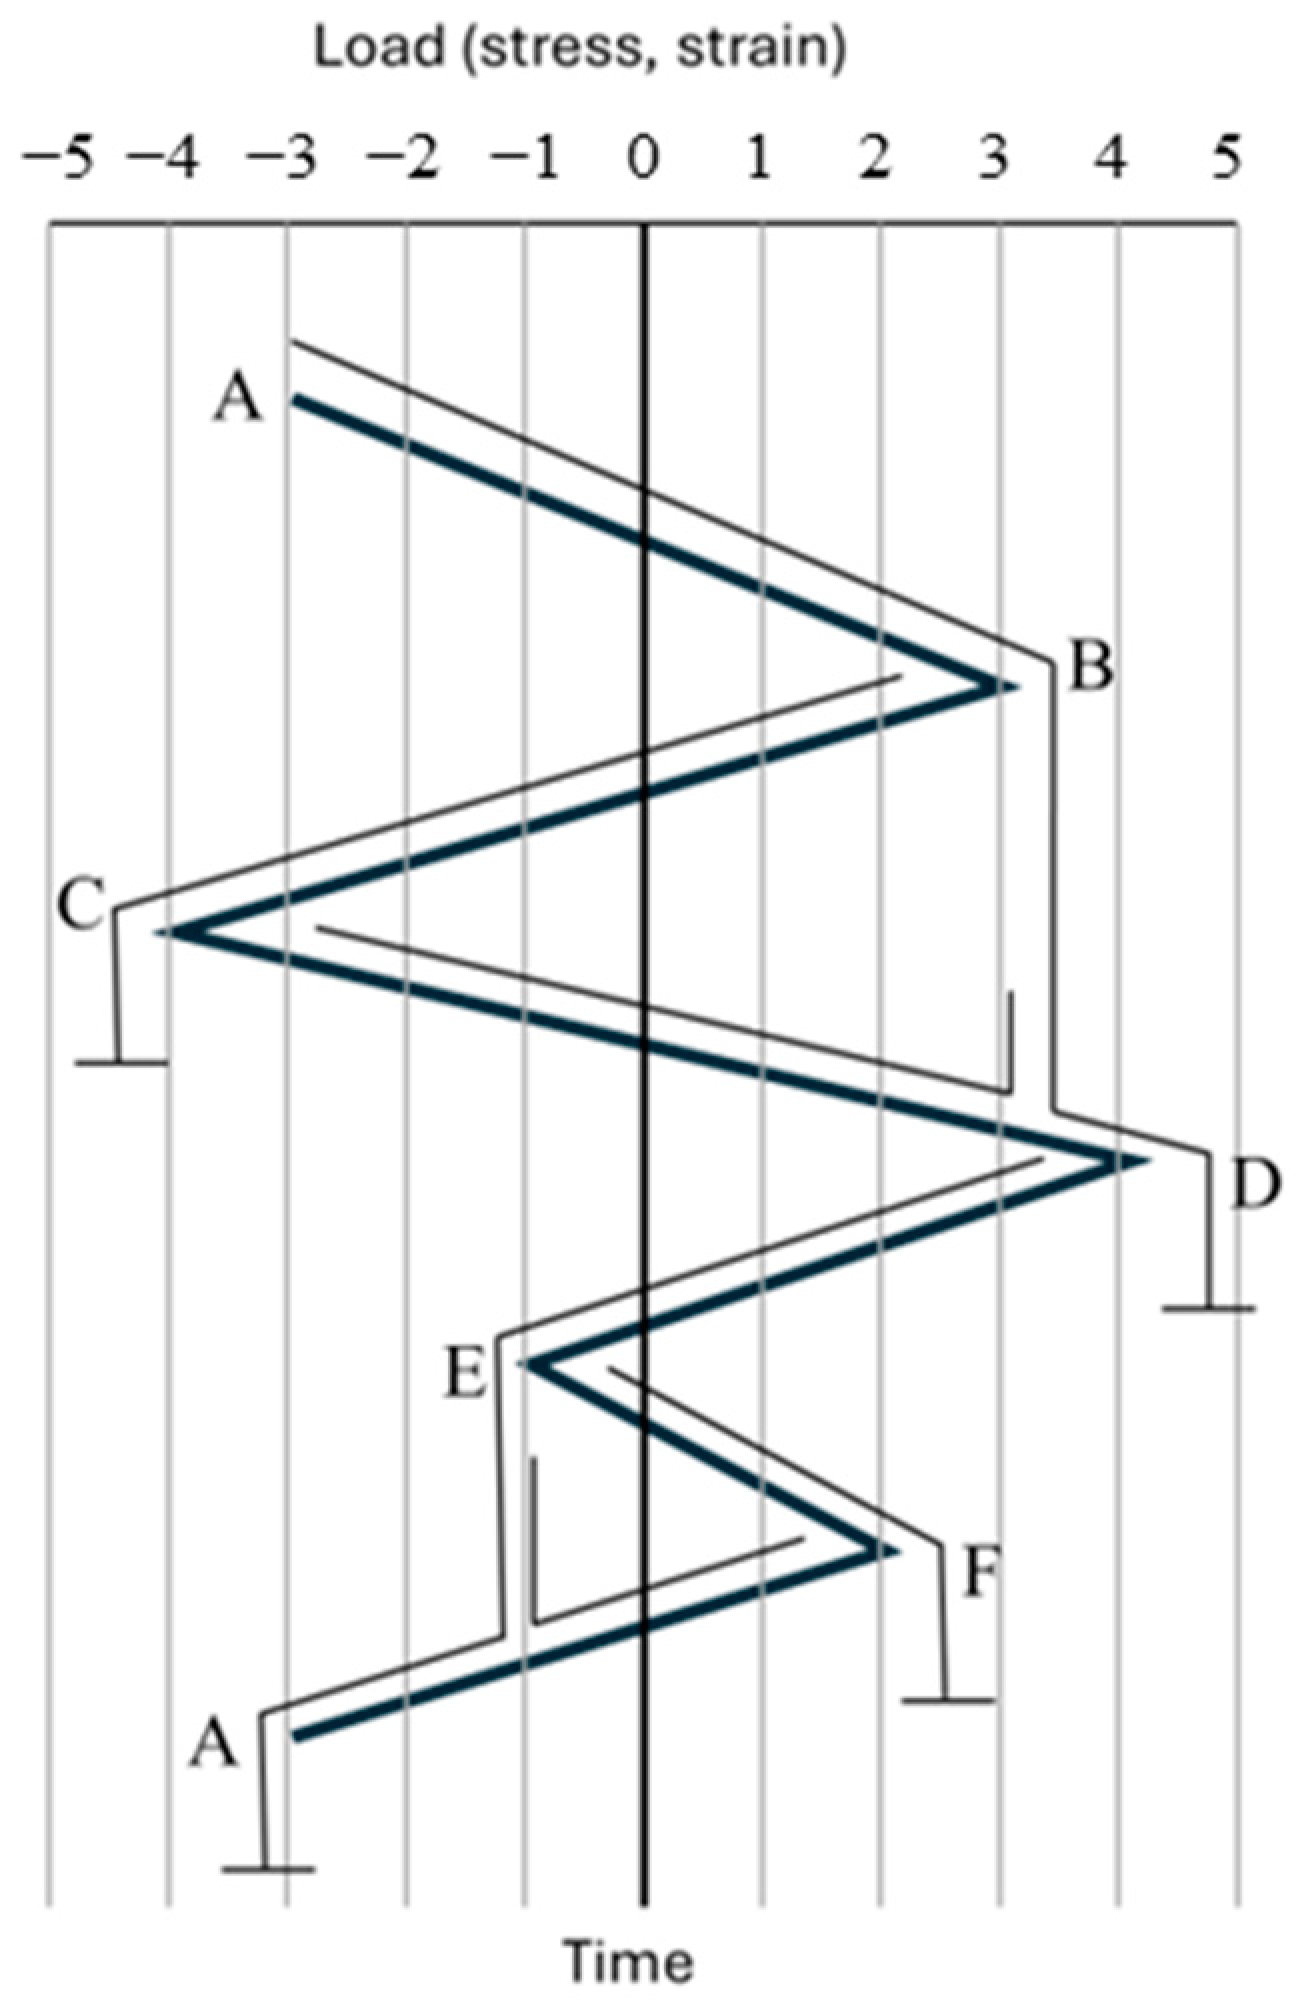
Figure 7.
Schematic diagram of load–time domain history.
Figure 7.
Schematic diagram of load–time domain history.
Figure 8.
Schematic diagram of rainflow cycle counting method.
Figure 8.
Schematic diagram of rainflow cycle counting method.
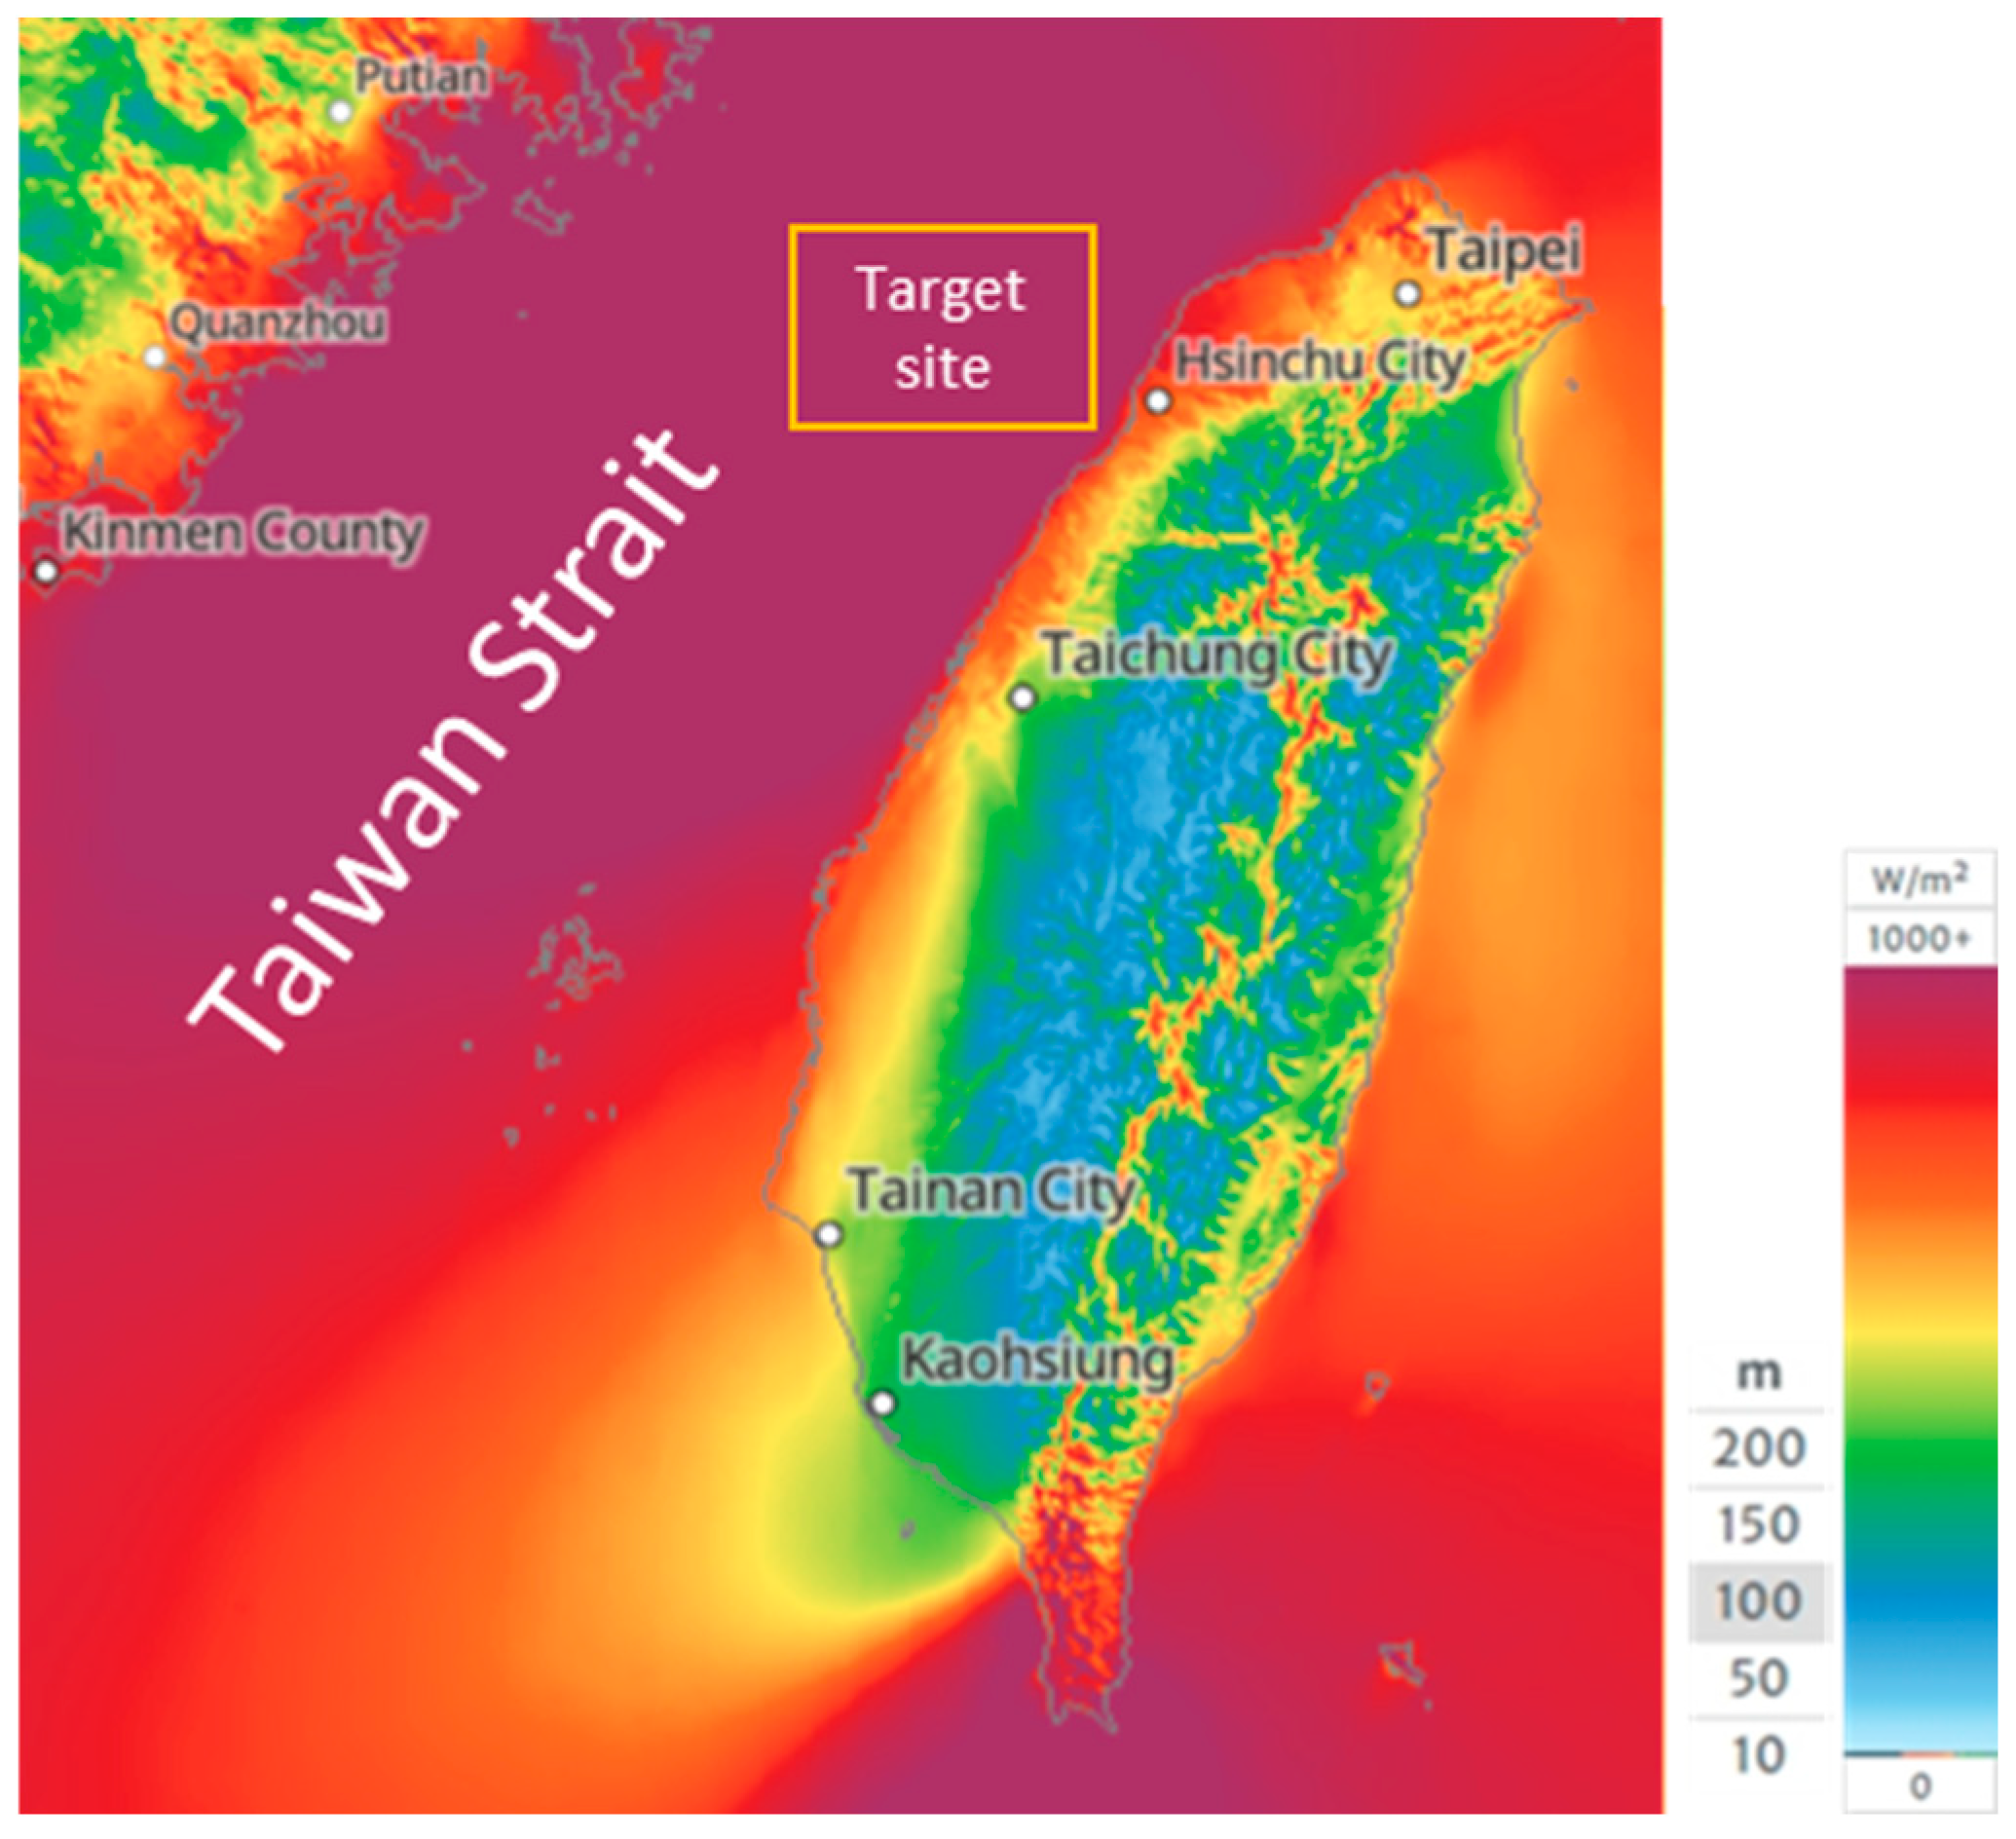
Figure 9.
Taiwan Wind Mean Power Density Map (Retrieve from: GLOBAL WIND ATLAS).
Figure 9.
Taiwan Wind Mean Power Density Map (Retrieve from: GLOBAL WIND ATLAS).
Figure 12.
Suspensa OctaFloat perspective view (including ballast).
Figure 12.
Suspensa OctaFloat perspective view (including ballast).
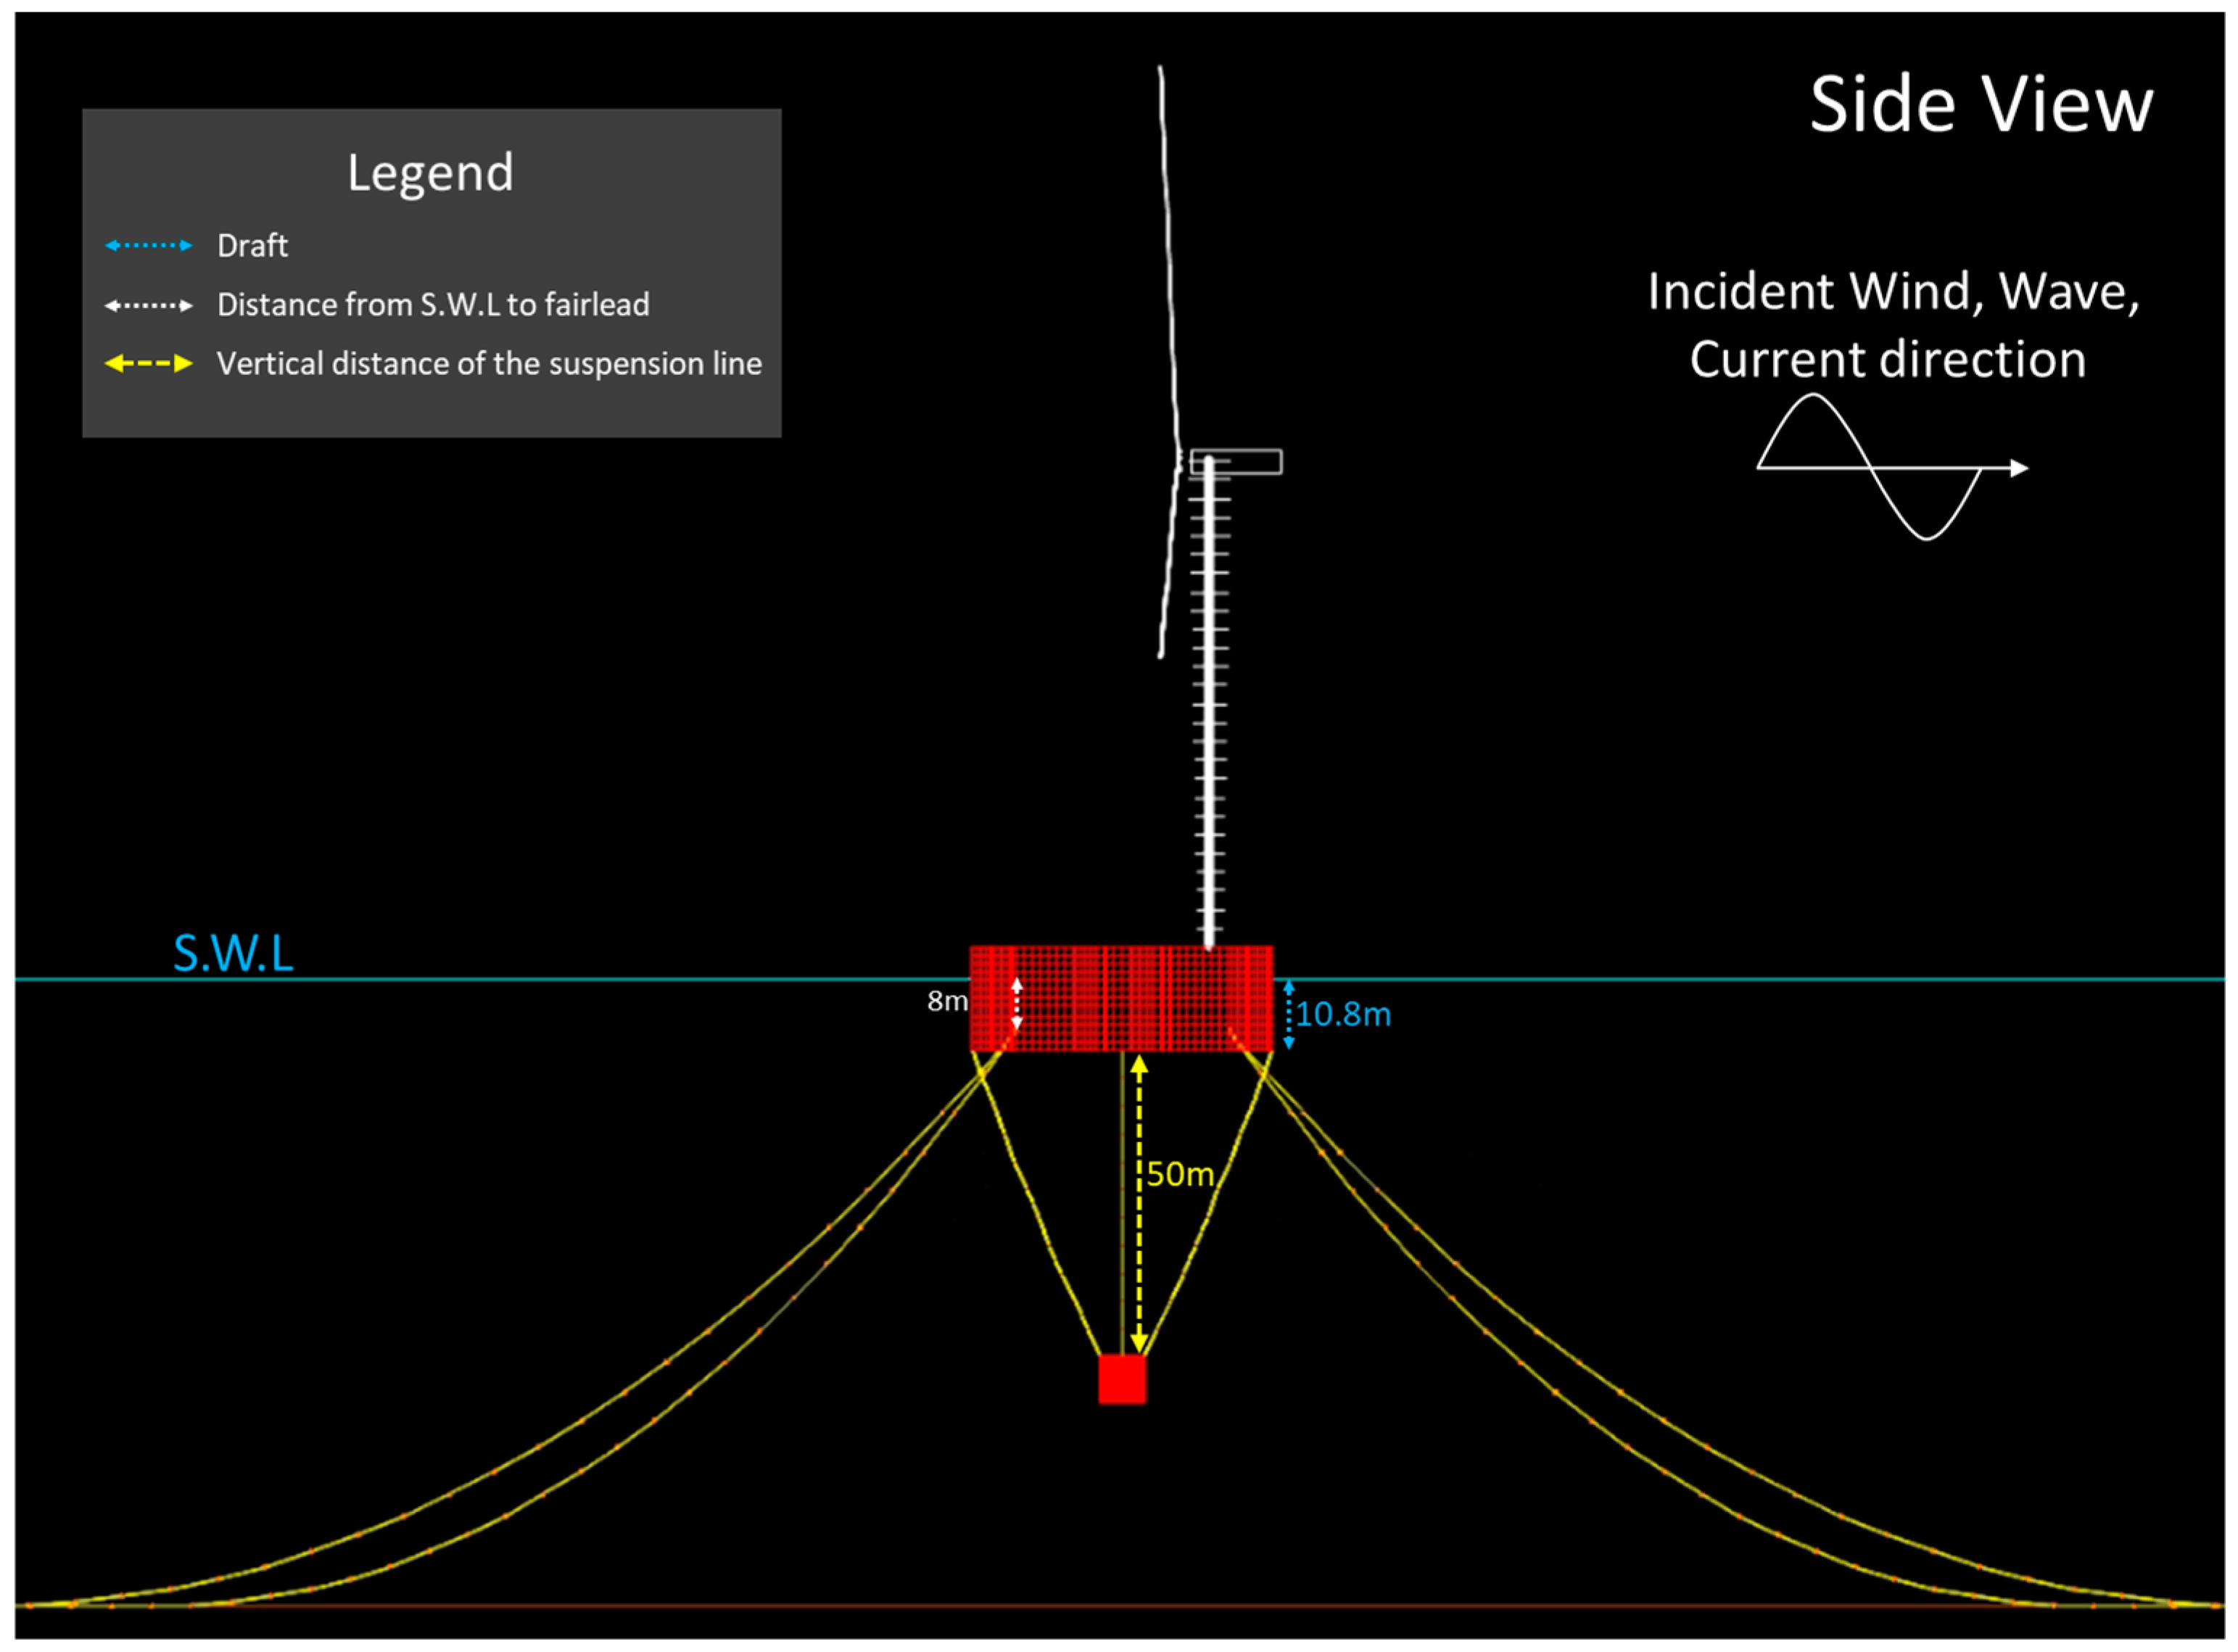
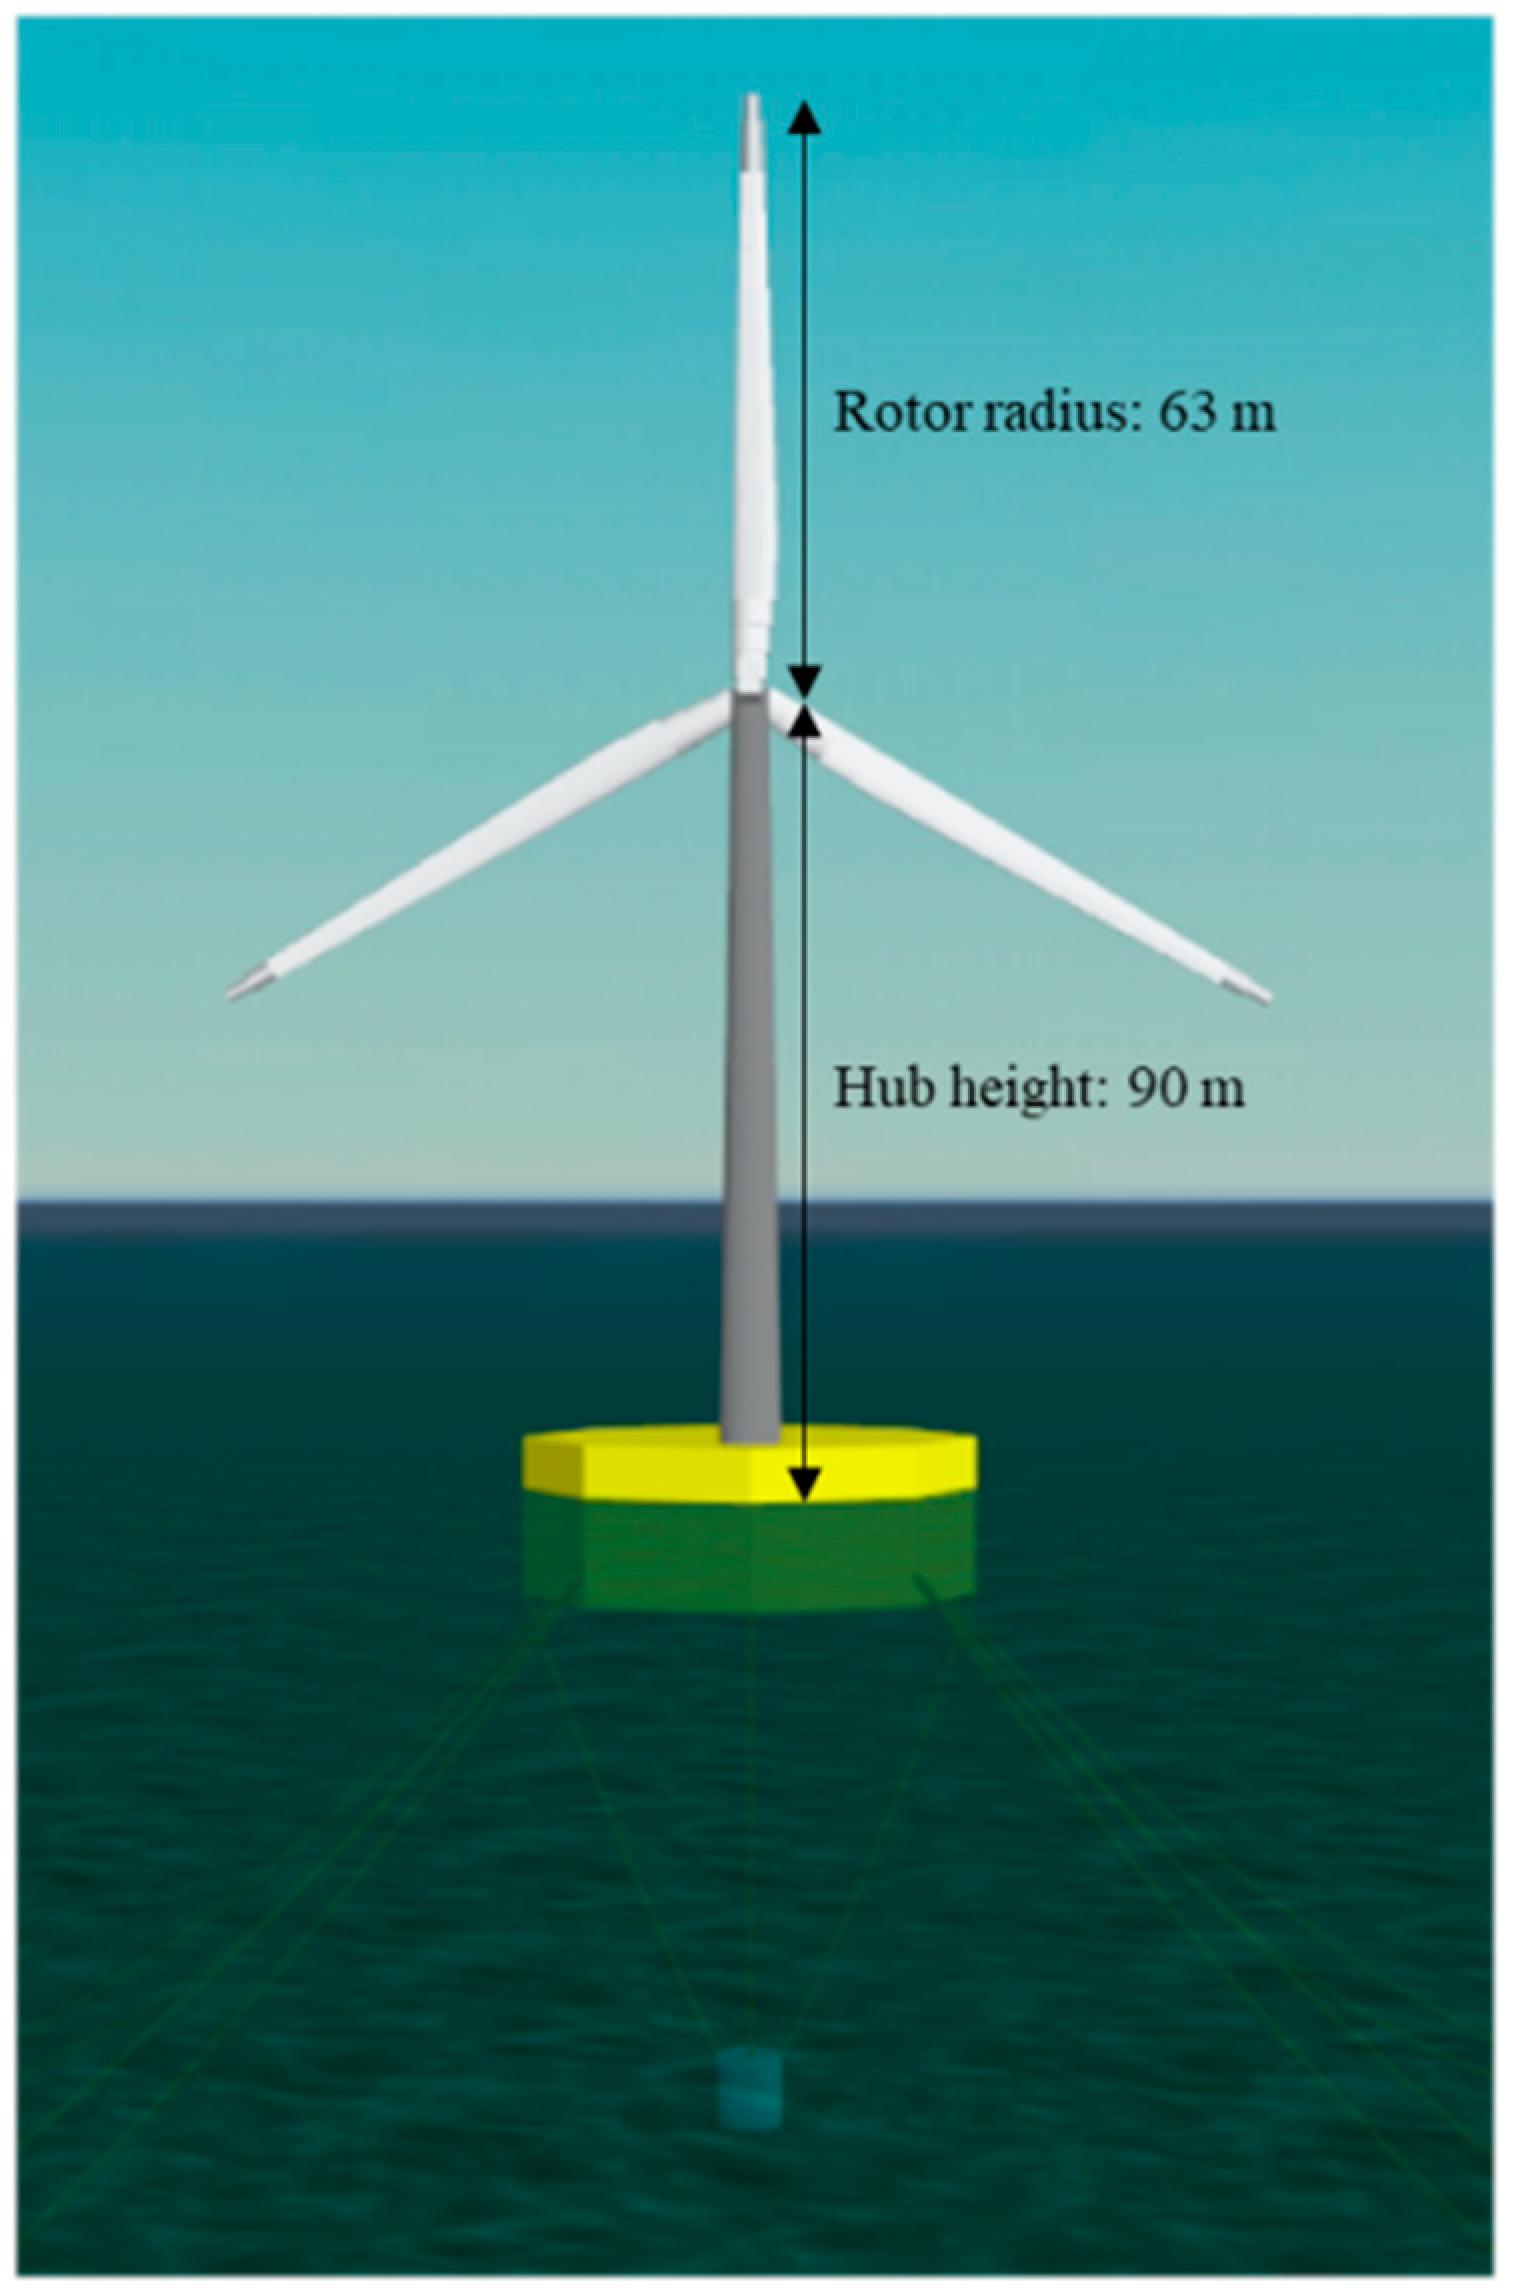
Figure 13.
Scale of Suspensa OctaFloat with NREL 5-MW wind turbine (side view).
Figure 13.
Scale of Suspensa OctaFloat with NREL 5-MW wind turbine (side view).
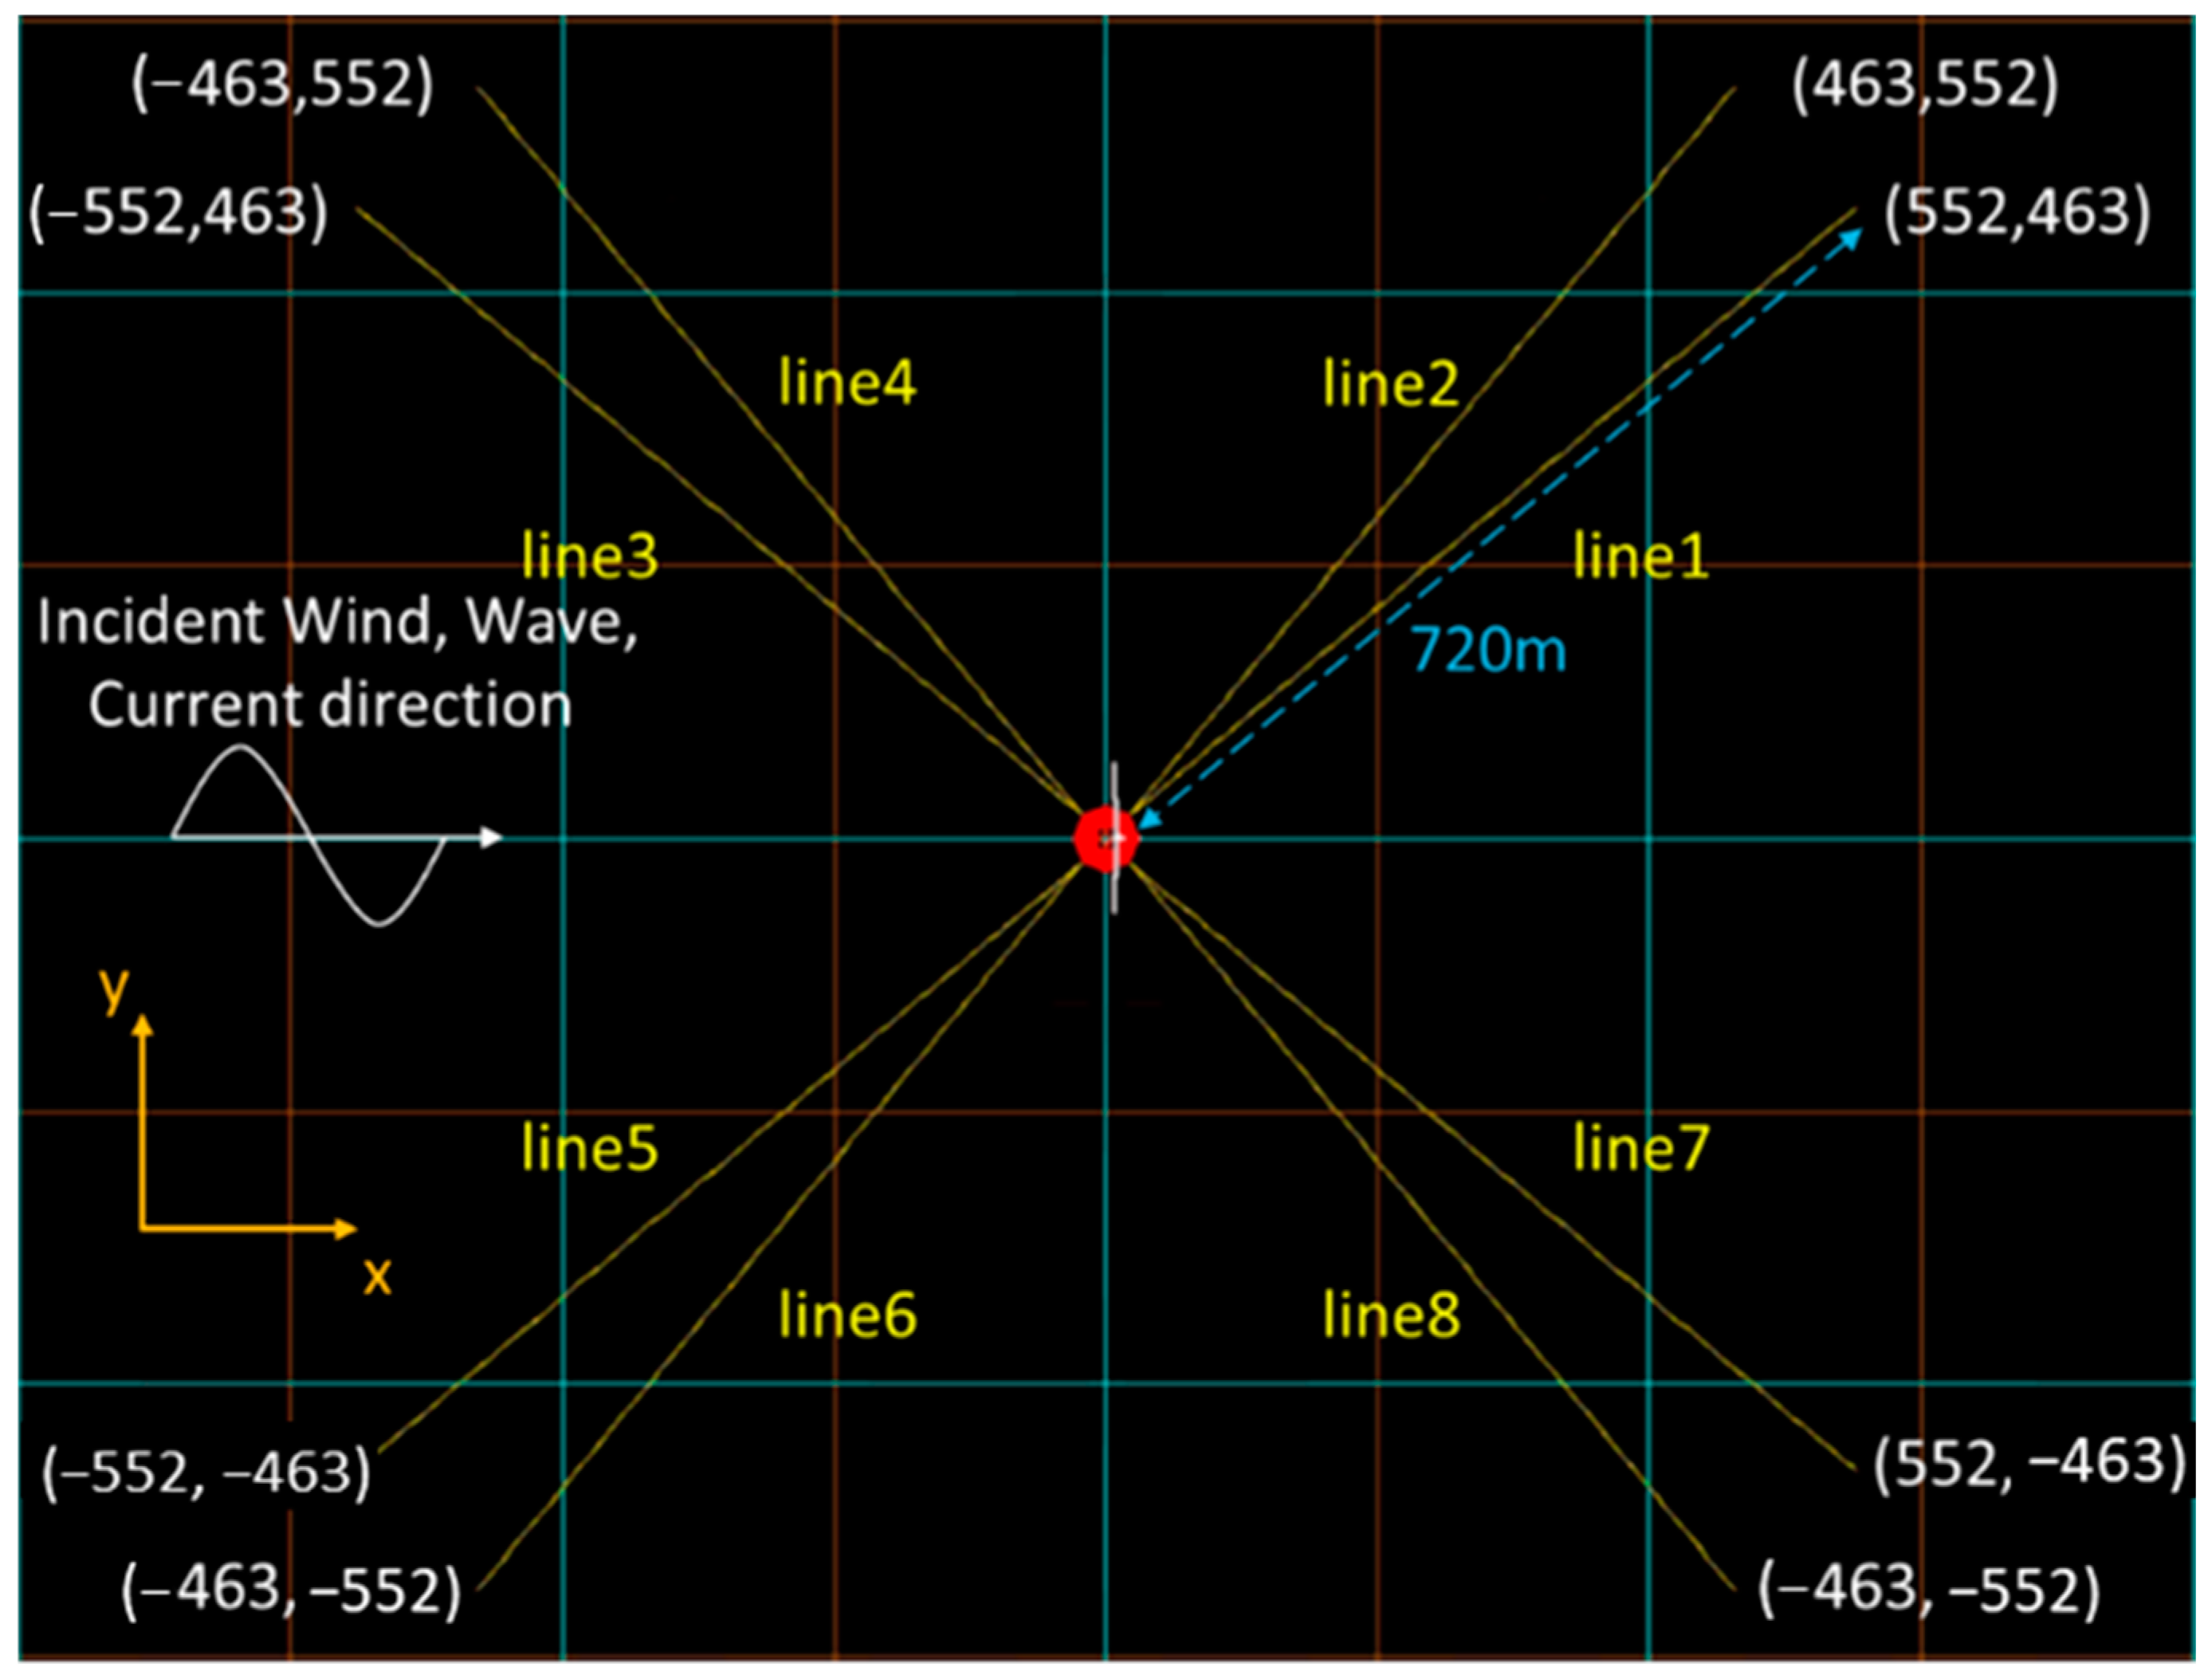
Figure 14.
The 4 × 2 mooring system configuration at Hsinchu site (top view) (Unit: m).
Figure 14.
The 4 × 2 mooring system configuration at Hsinchu site (top view) (Unit: m).
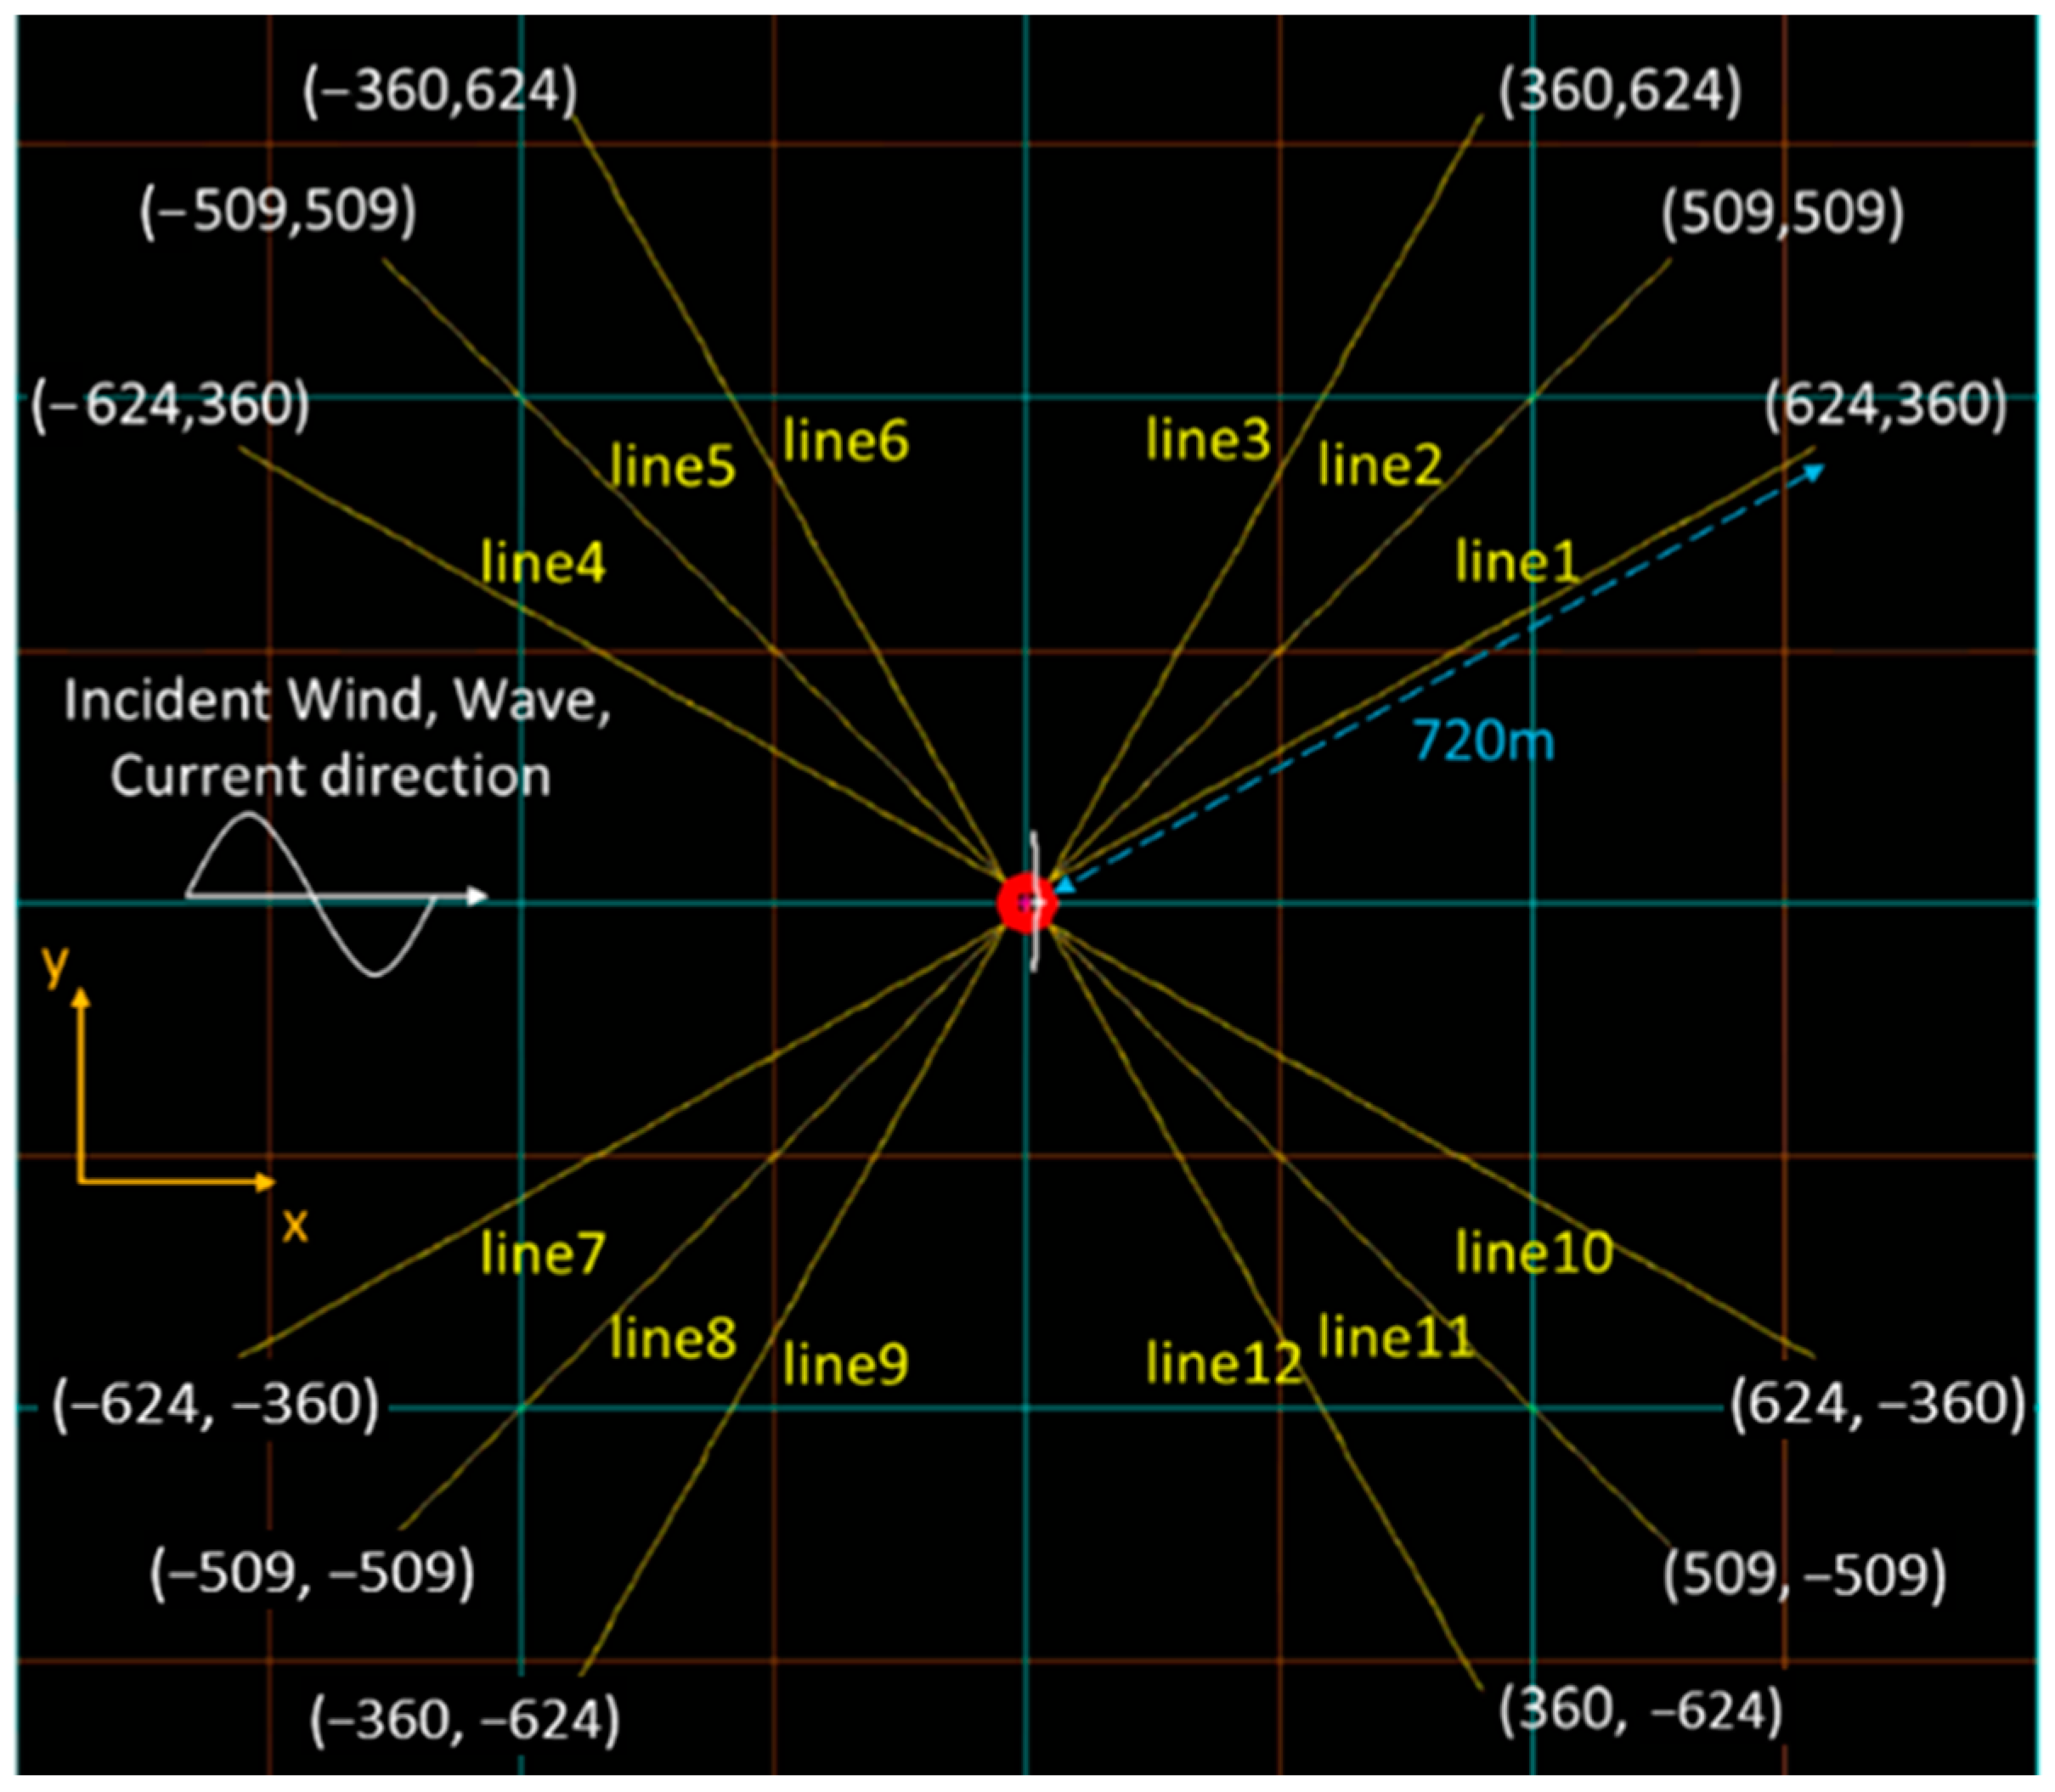
Figure 15.
The 4 × 3 mooring system configuration at Hsinchu site (top view) (Unit: m).
Figure 15.
The 4 × 3 mooring system configuration at Hsinchu site (top view) (Unit: m).
Figure 16.
Power spectral density for six degrees of freedom.
Figure 16.
Power spectral density for six degrees of freedom.
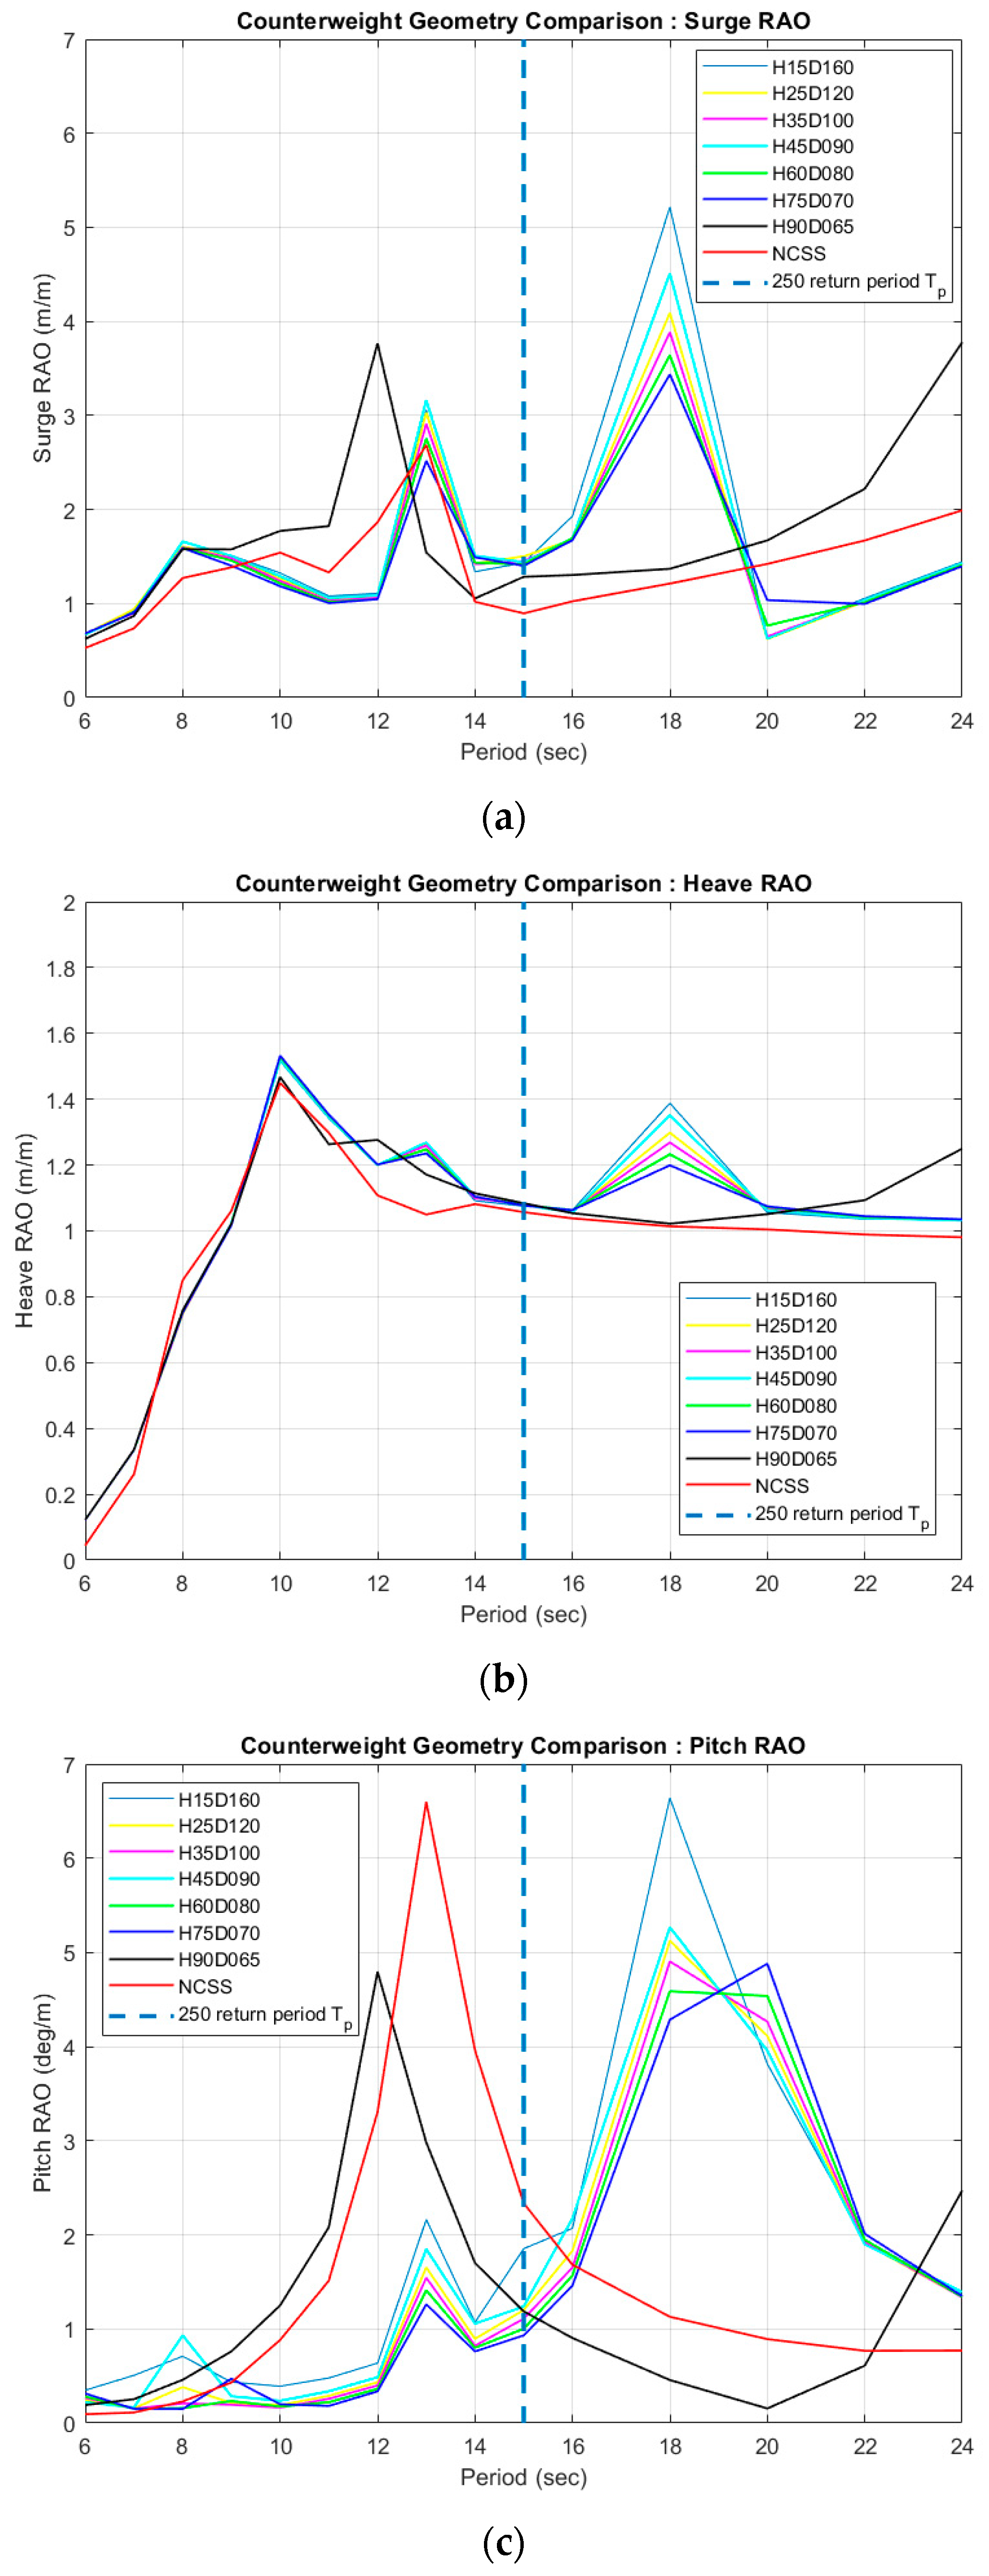
Figure 17.
Comparison of different counterweight geometries for (a) surge, (b) heave, and (c) pitch DOFs.
Figure 17.
Comparison of different counterweight geometries for (a) surge, (b) heave, and (c) pitch DOFs.
Figure 18.
Comparison of (a) surge, (b) heave, and (c) pitch RAOs at the same stiffness ratio.
Figure 18.
Comparison of (a) surge, (b) heave, and (c) pitch RAOs at the same stiffness ratio.
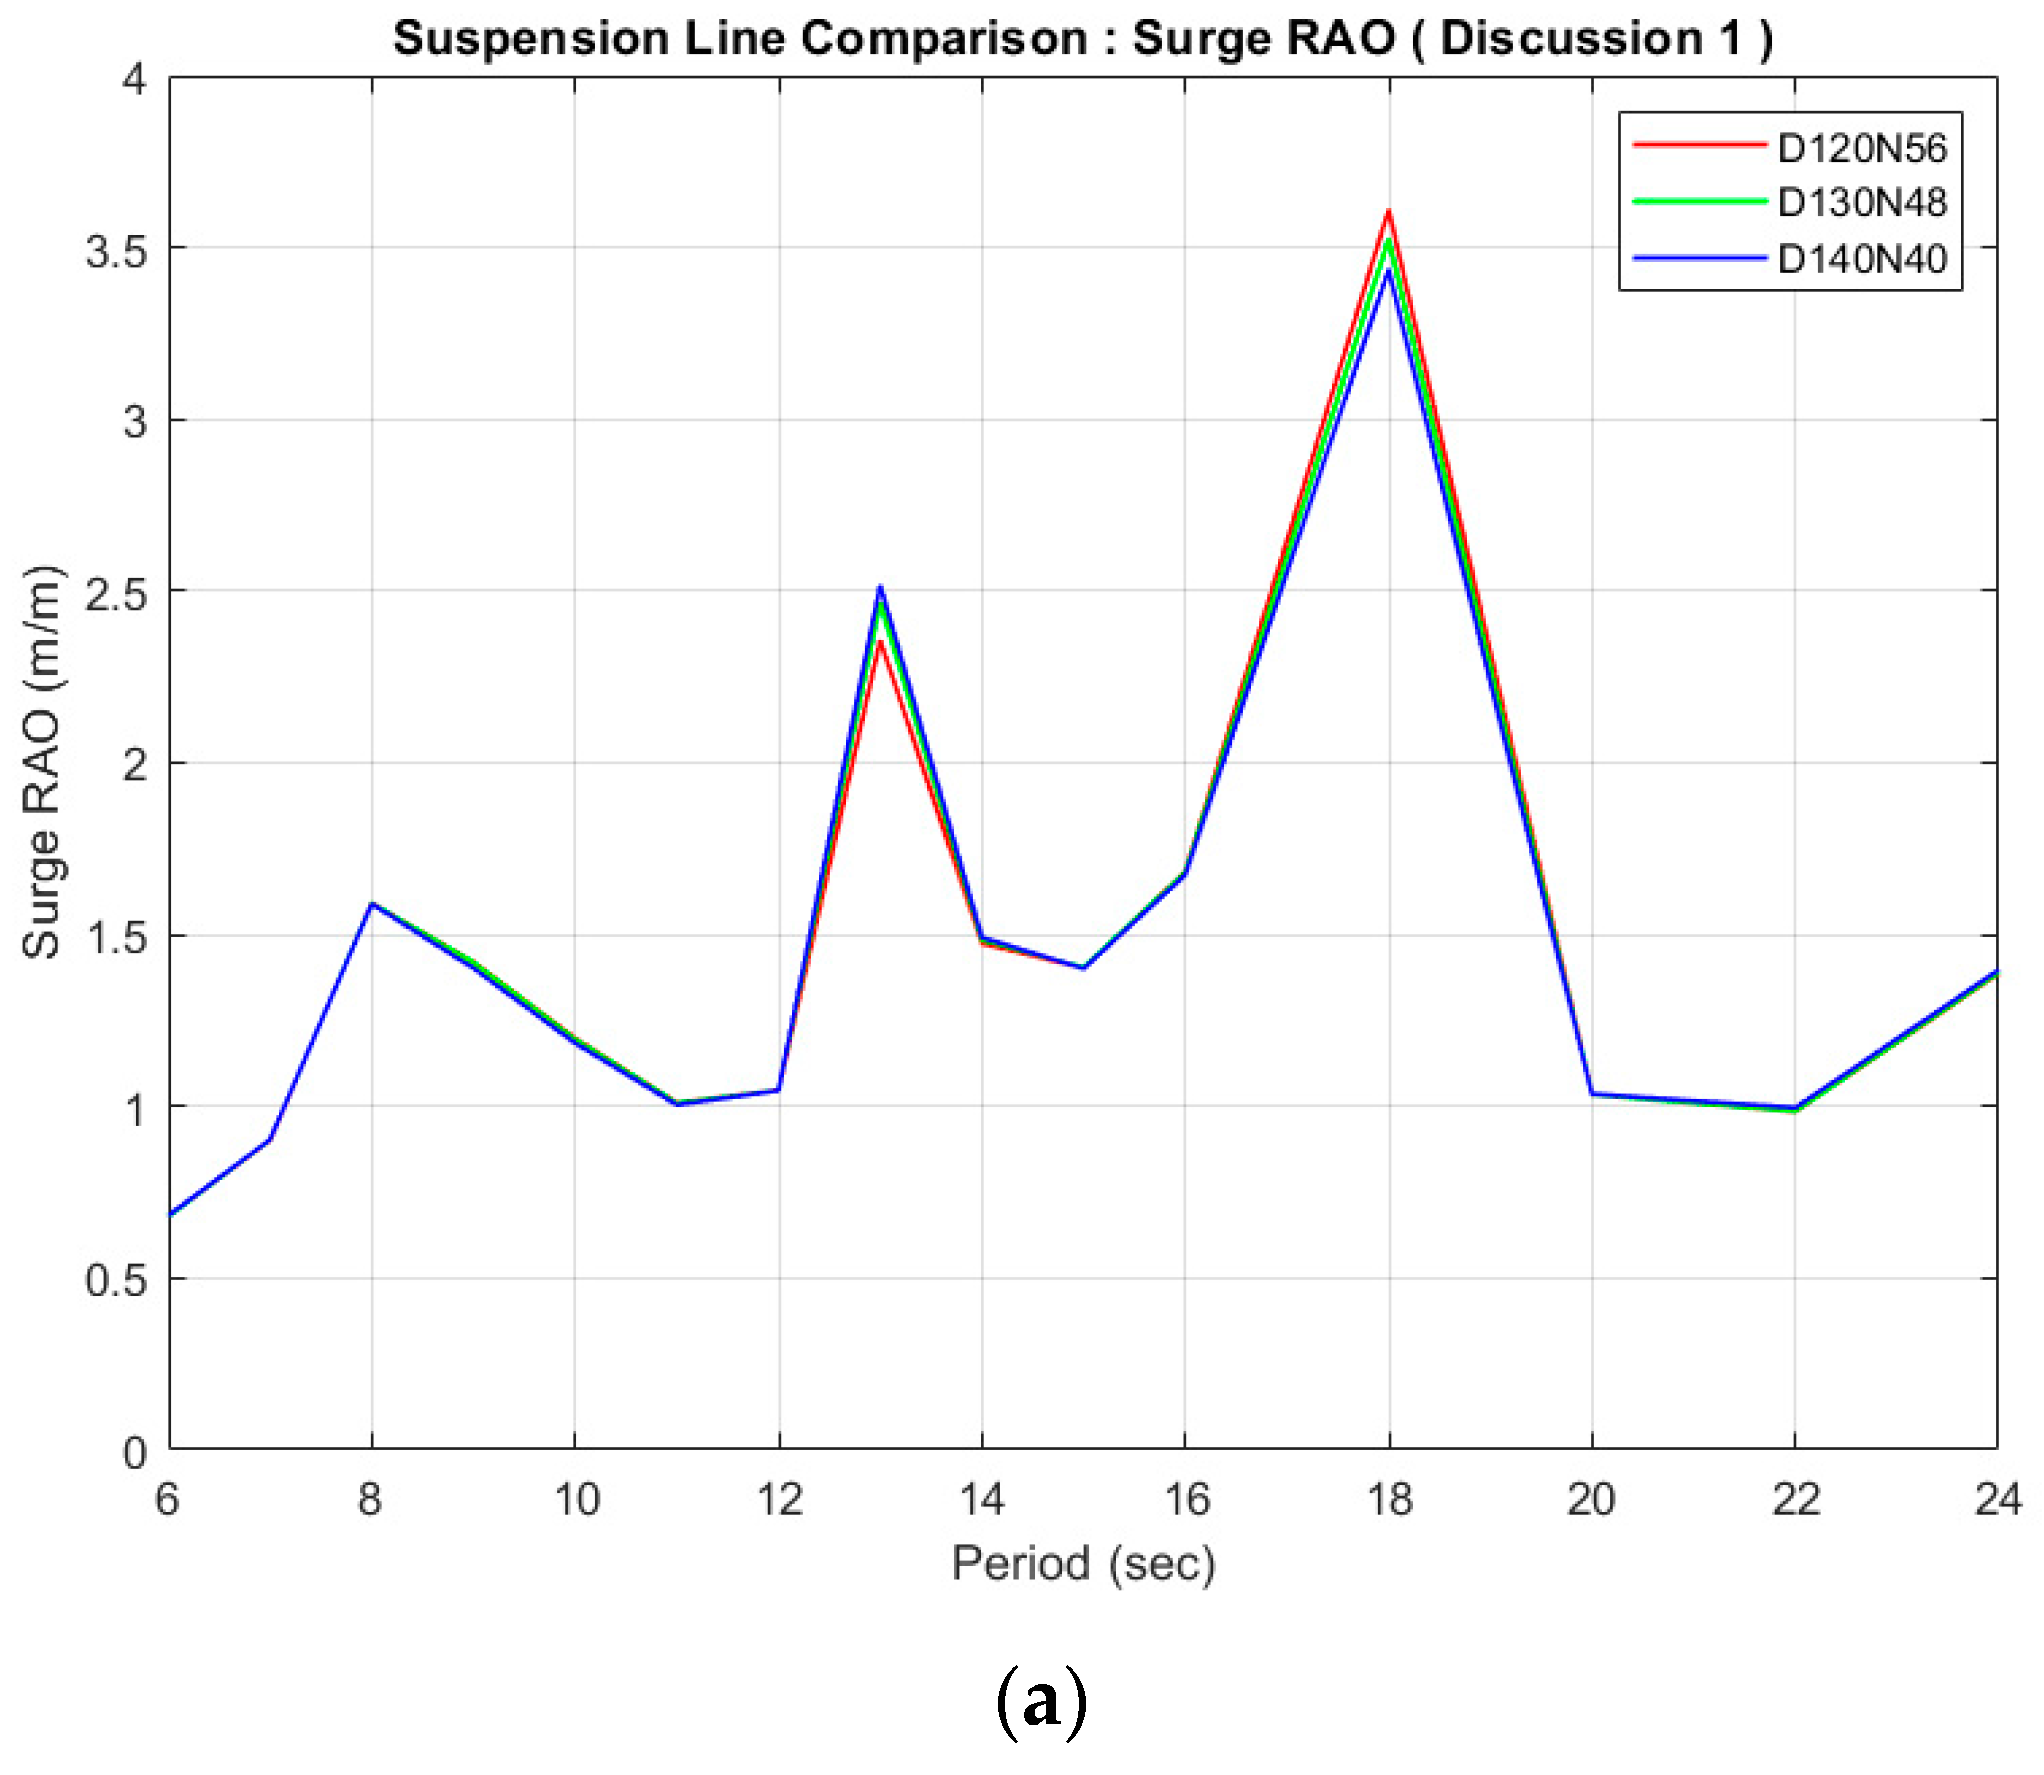
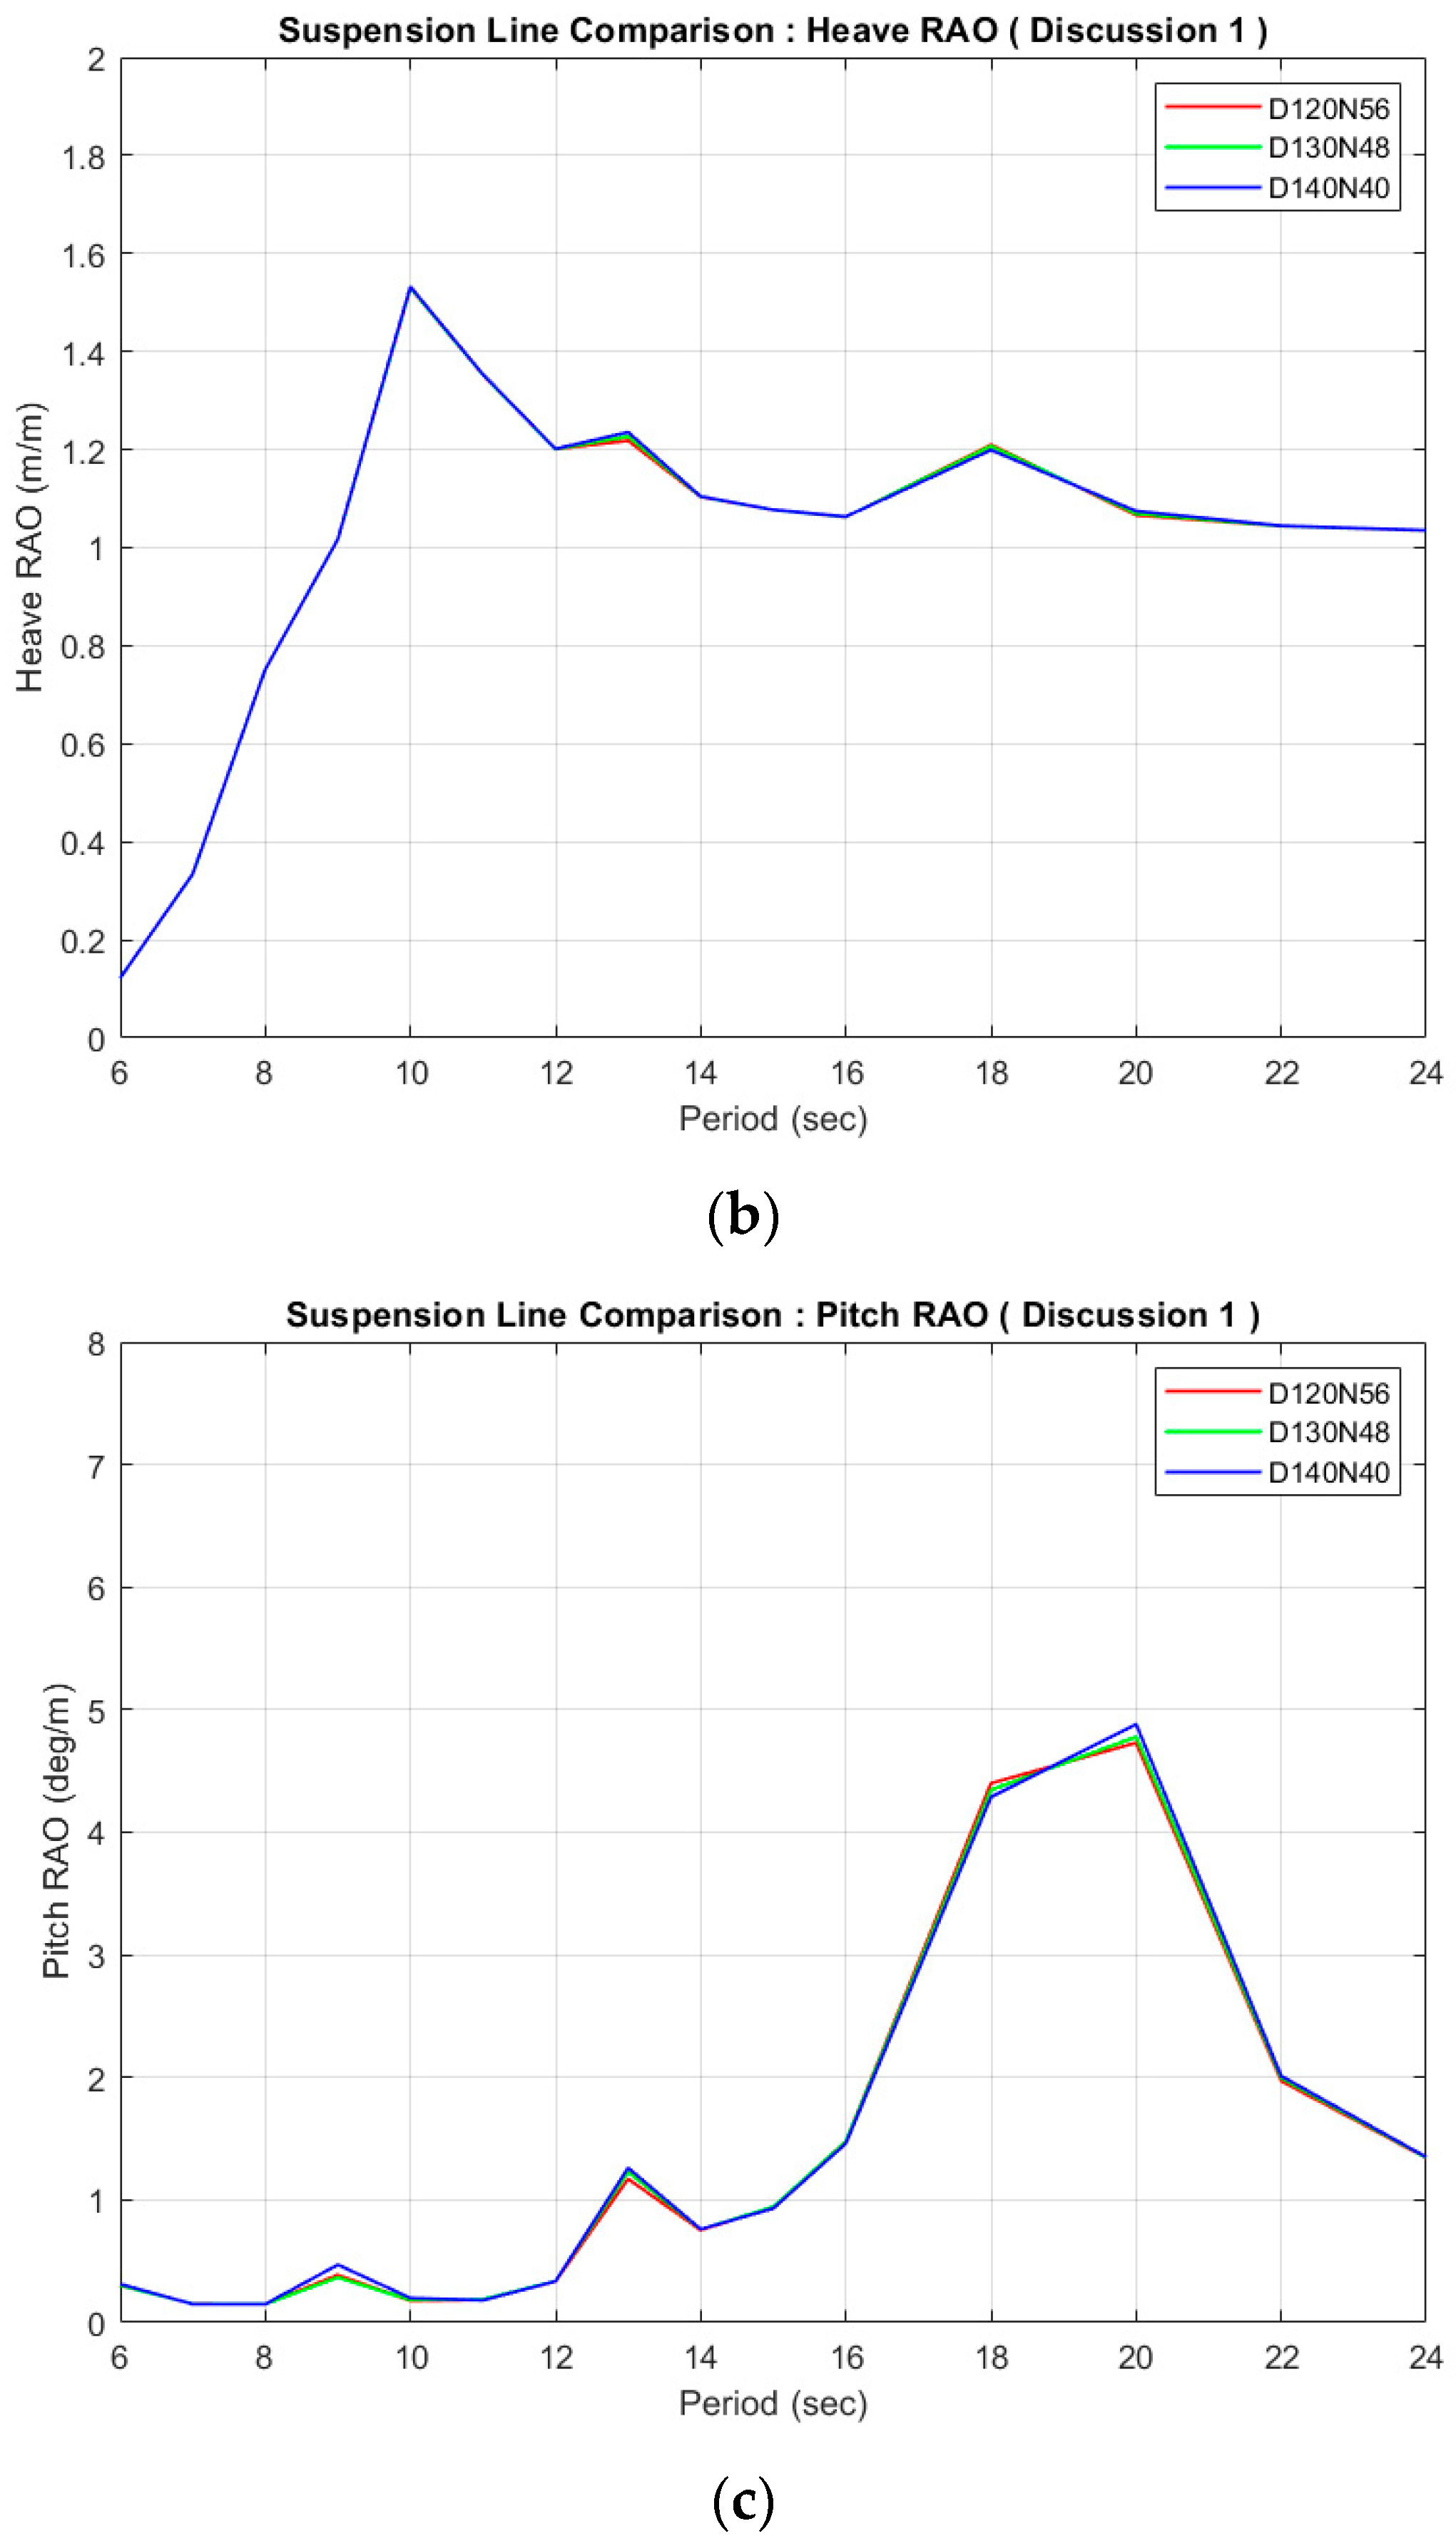
Figure 19.
Comparison of (a) surge, (b) heave, and (c) pitch RAOs at different stiffness ratios.
Figure 19.
Comparison of (a) surge, (b) heave, and (c) pitch RAOs at different stiffness ratios.
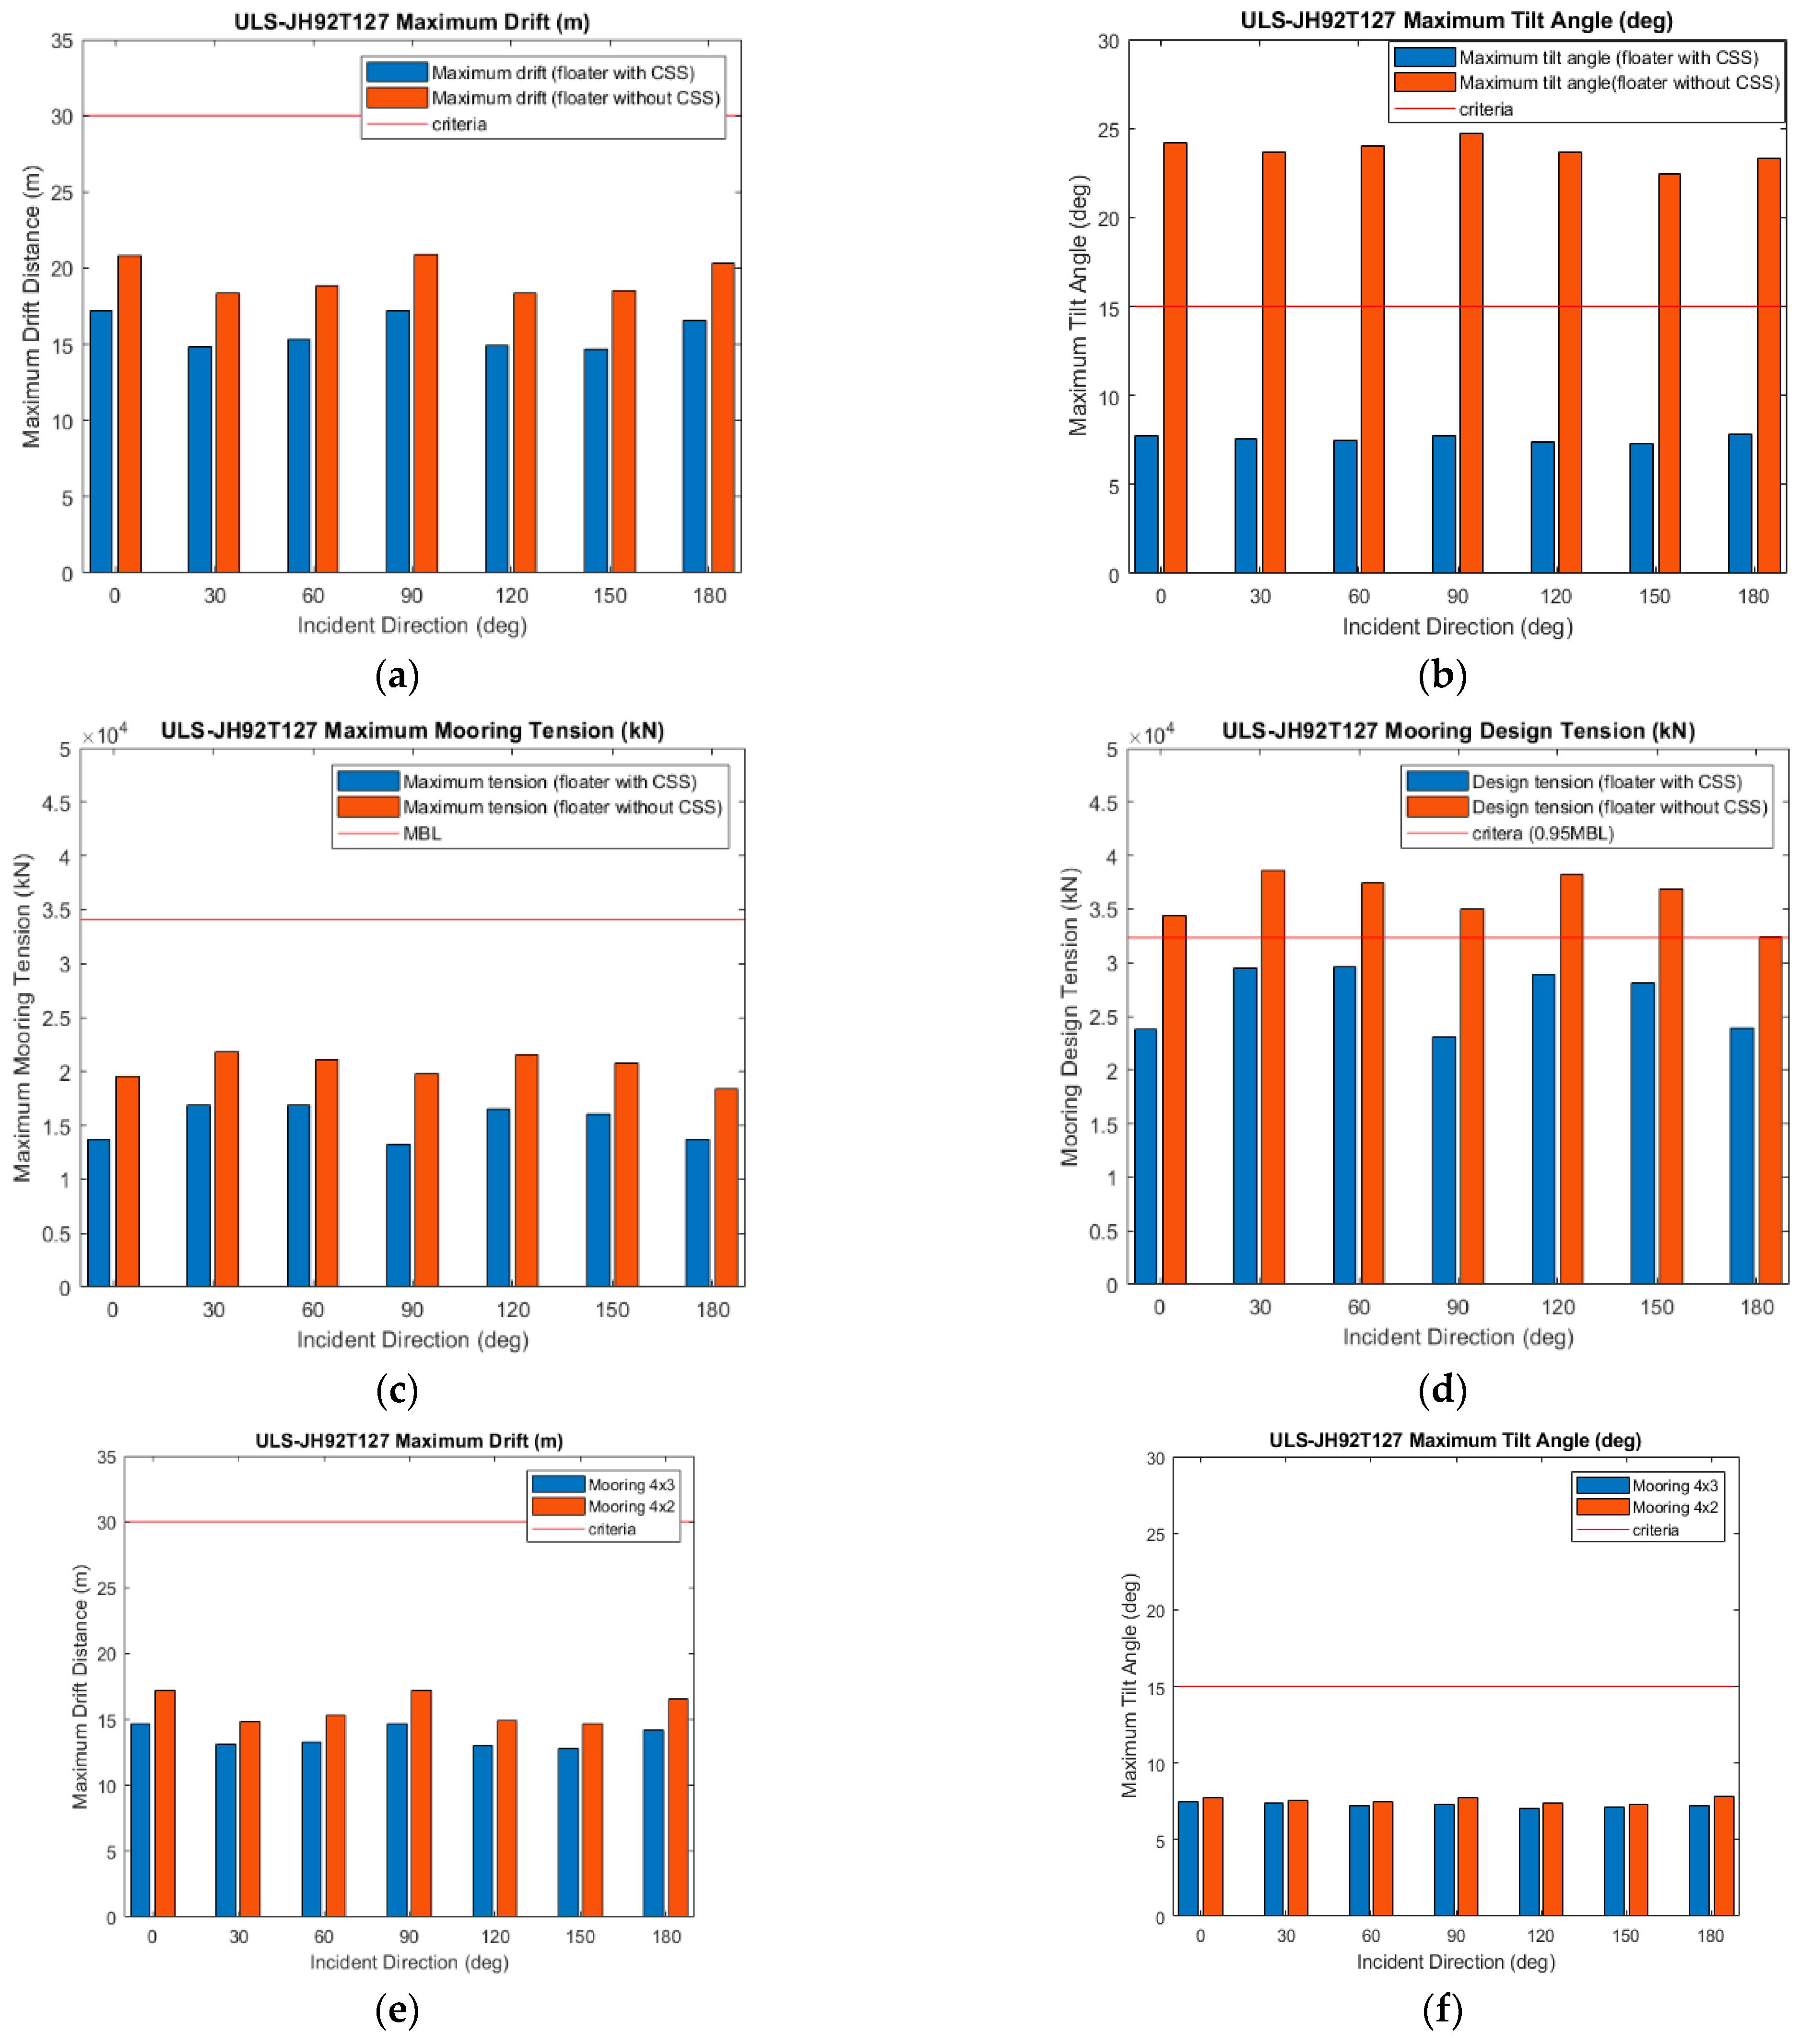
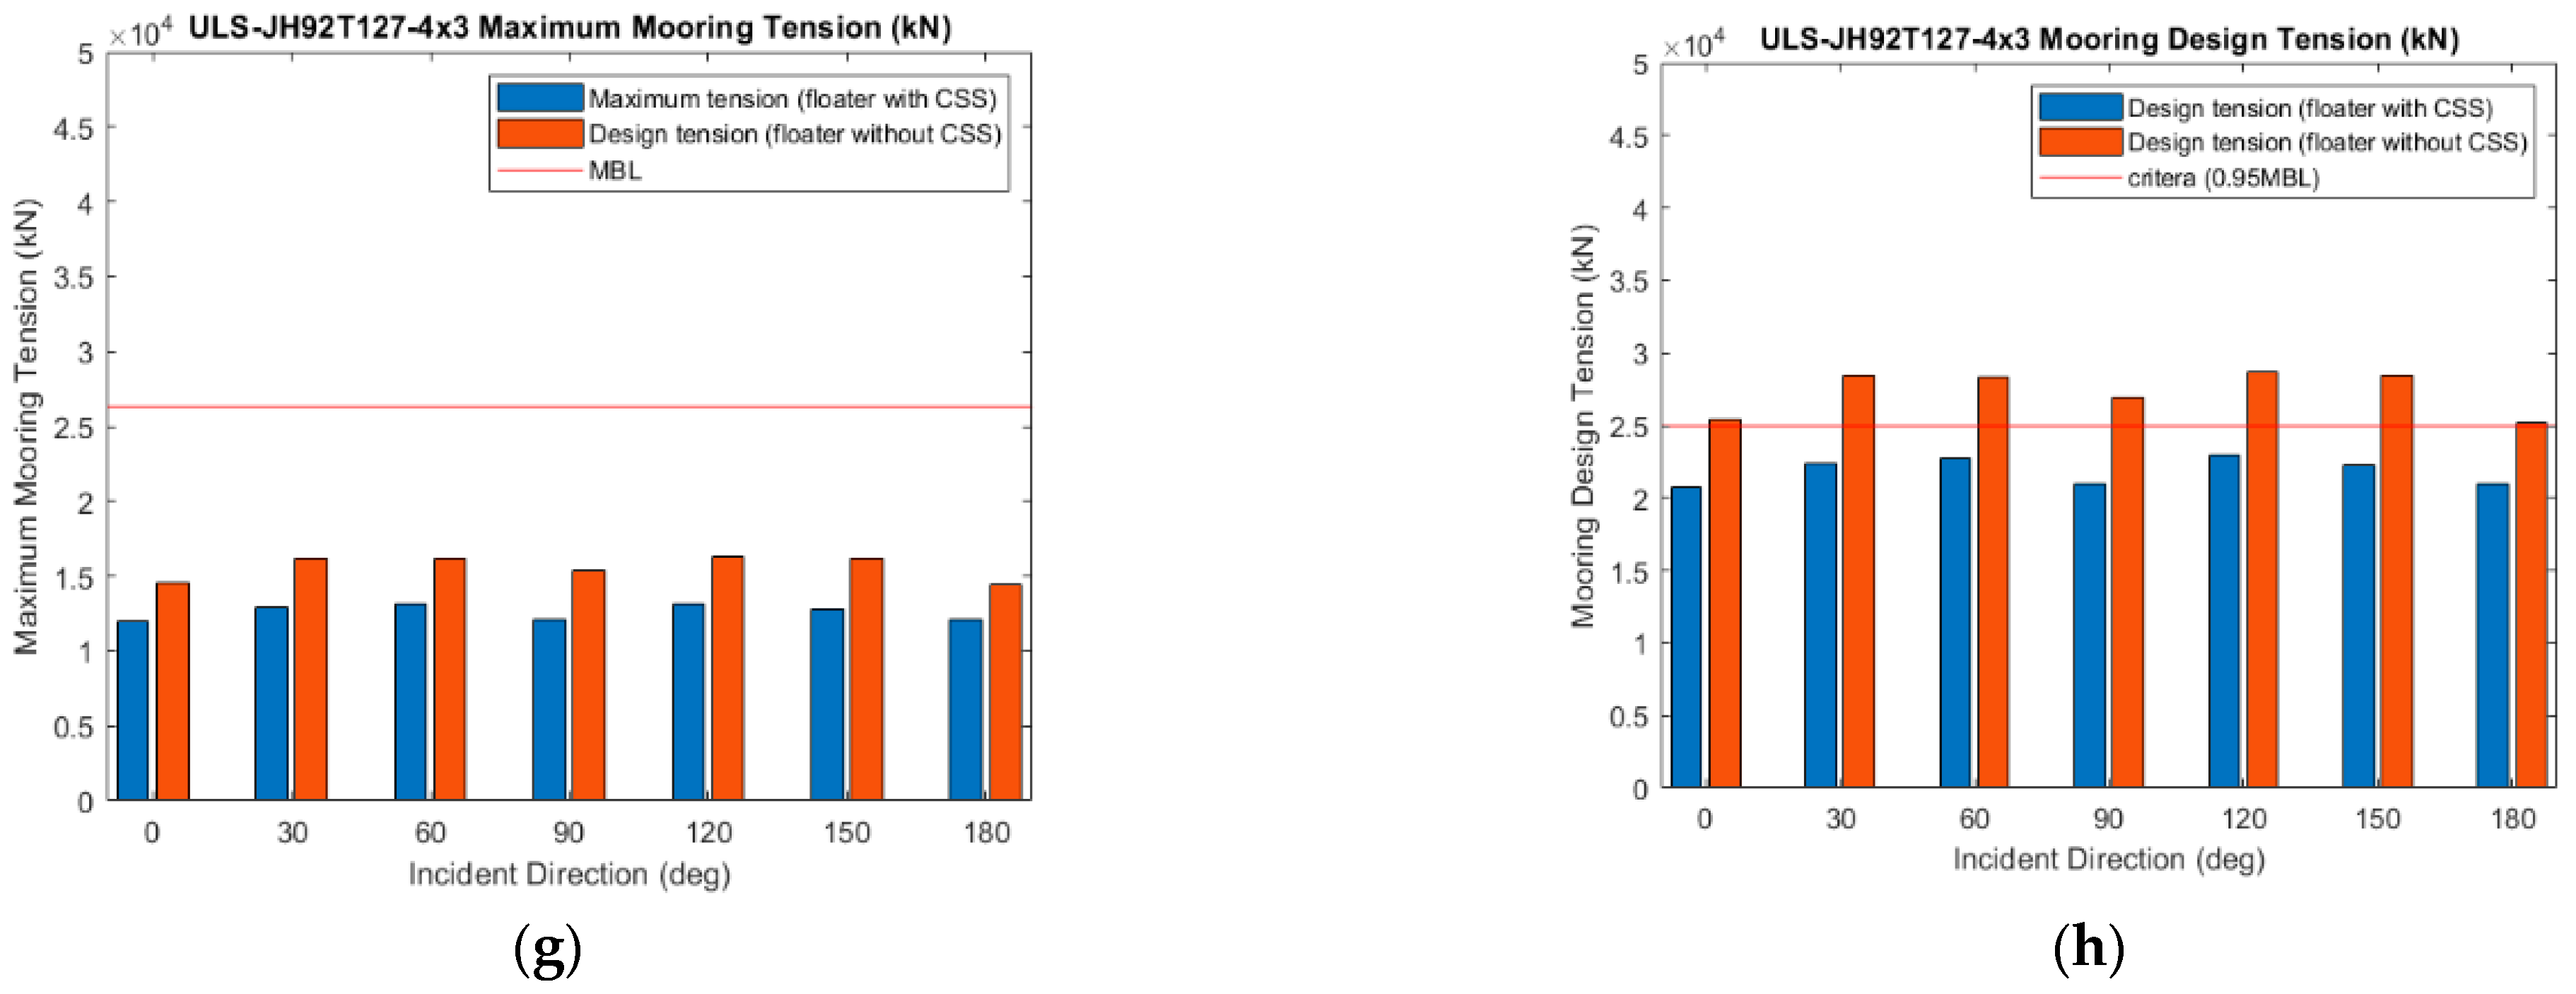
Figure 20.
Validation of ULS Condition. (a–d) Compare 4 × 2 mooring system with and without CSS for dynamic response and mooring tension. (e,f) Compare the dynamic response of the platform between 4 × 2 and 4 × 3 mooring configurations. (g,h) Compare the mooring tension of 4 × 3 mooring configuration with and without CSS.
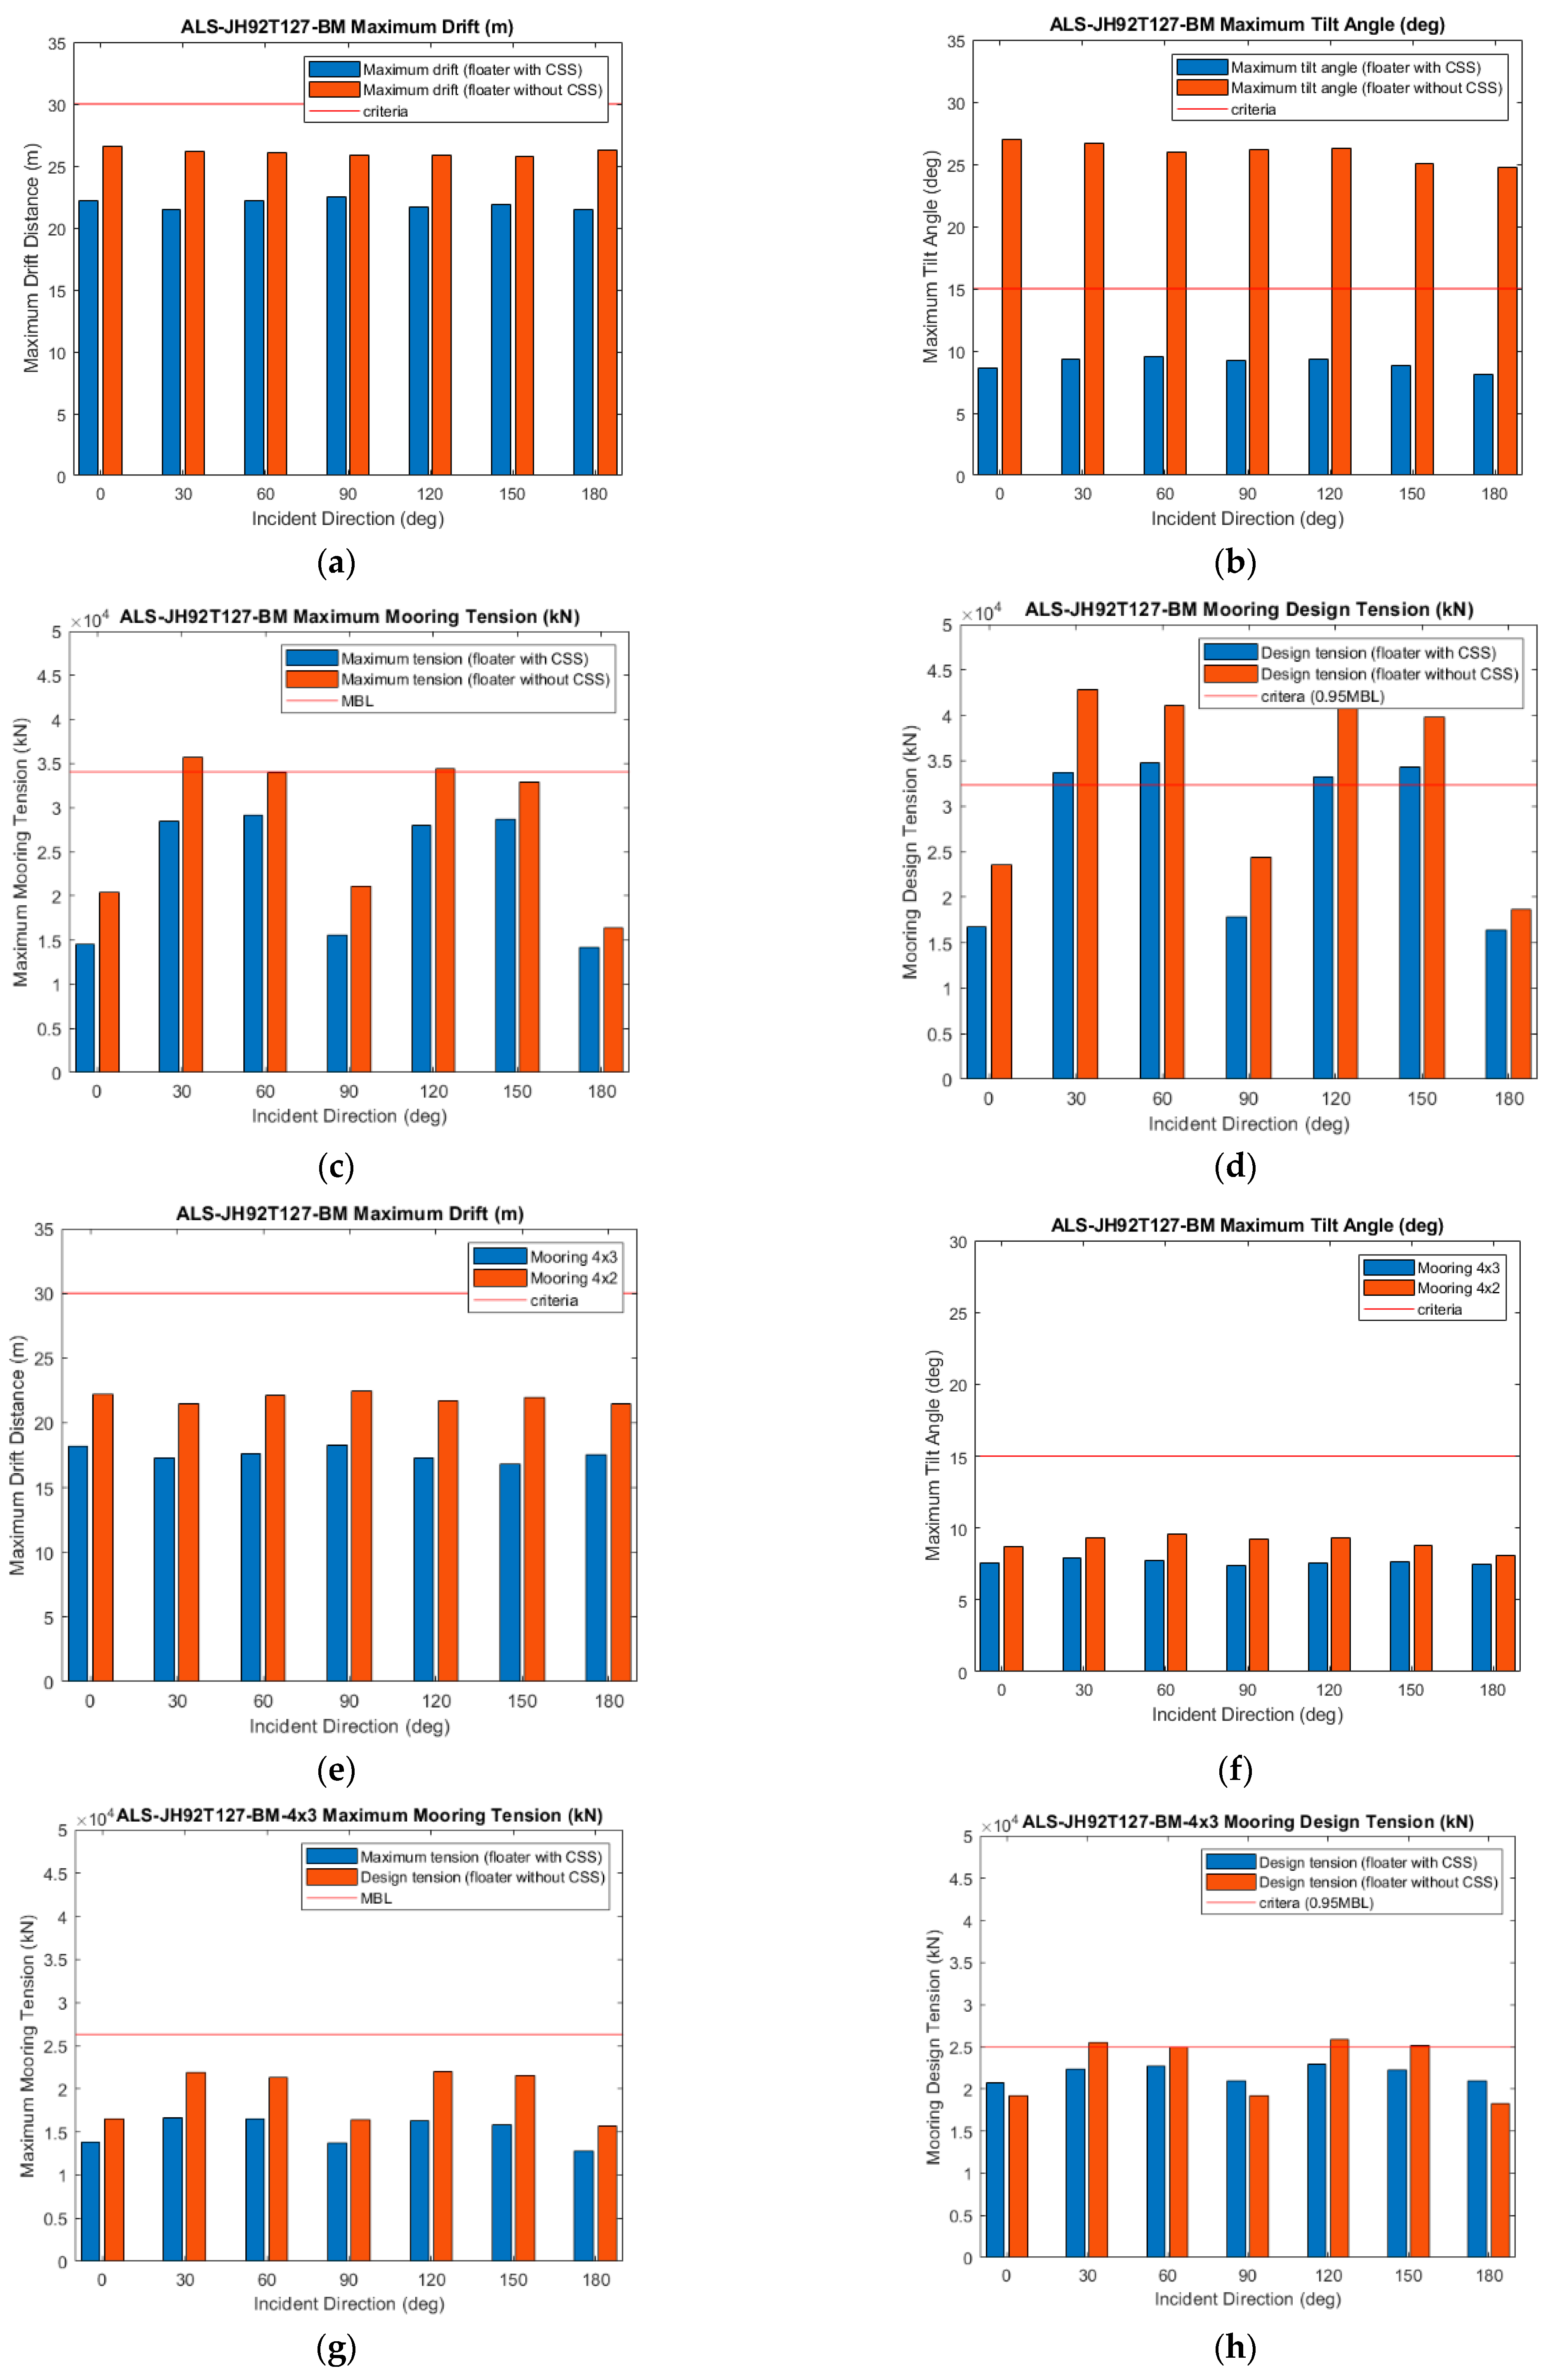
Figure 21.
Validation of ALS Condition. (a–d) Compare 4 × 2 mooring systems with and without CSS. (e,f) Compare the dynamic response of platform between 4 × 2 and 4 × 3 mooring configurations. (g,h) Compare the mooring tension of 4 × 3 mooring configurations with and without the CSS. (i,j) Compare the suspension ropes’ tension.
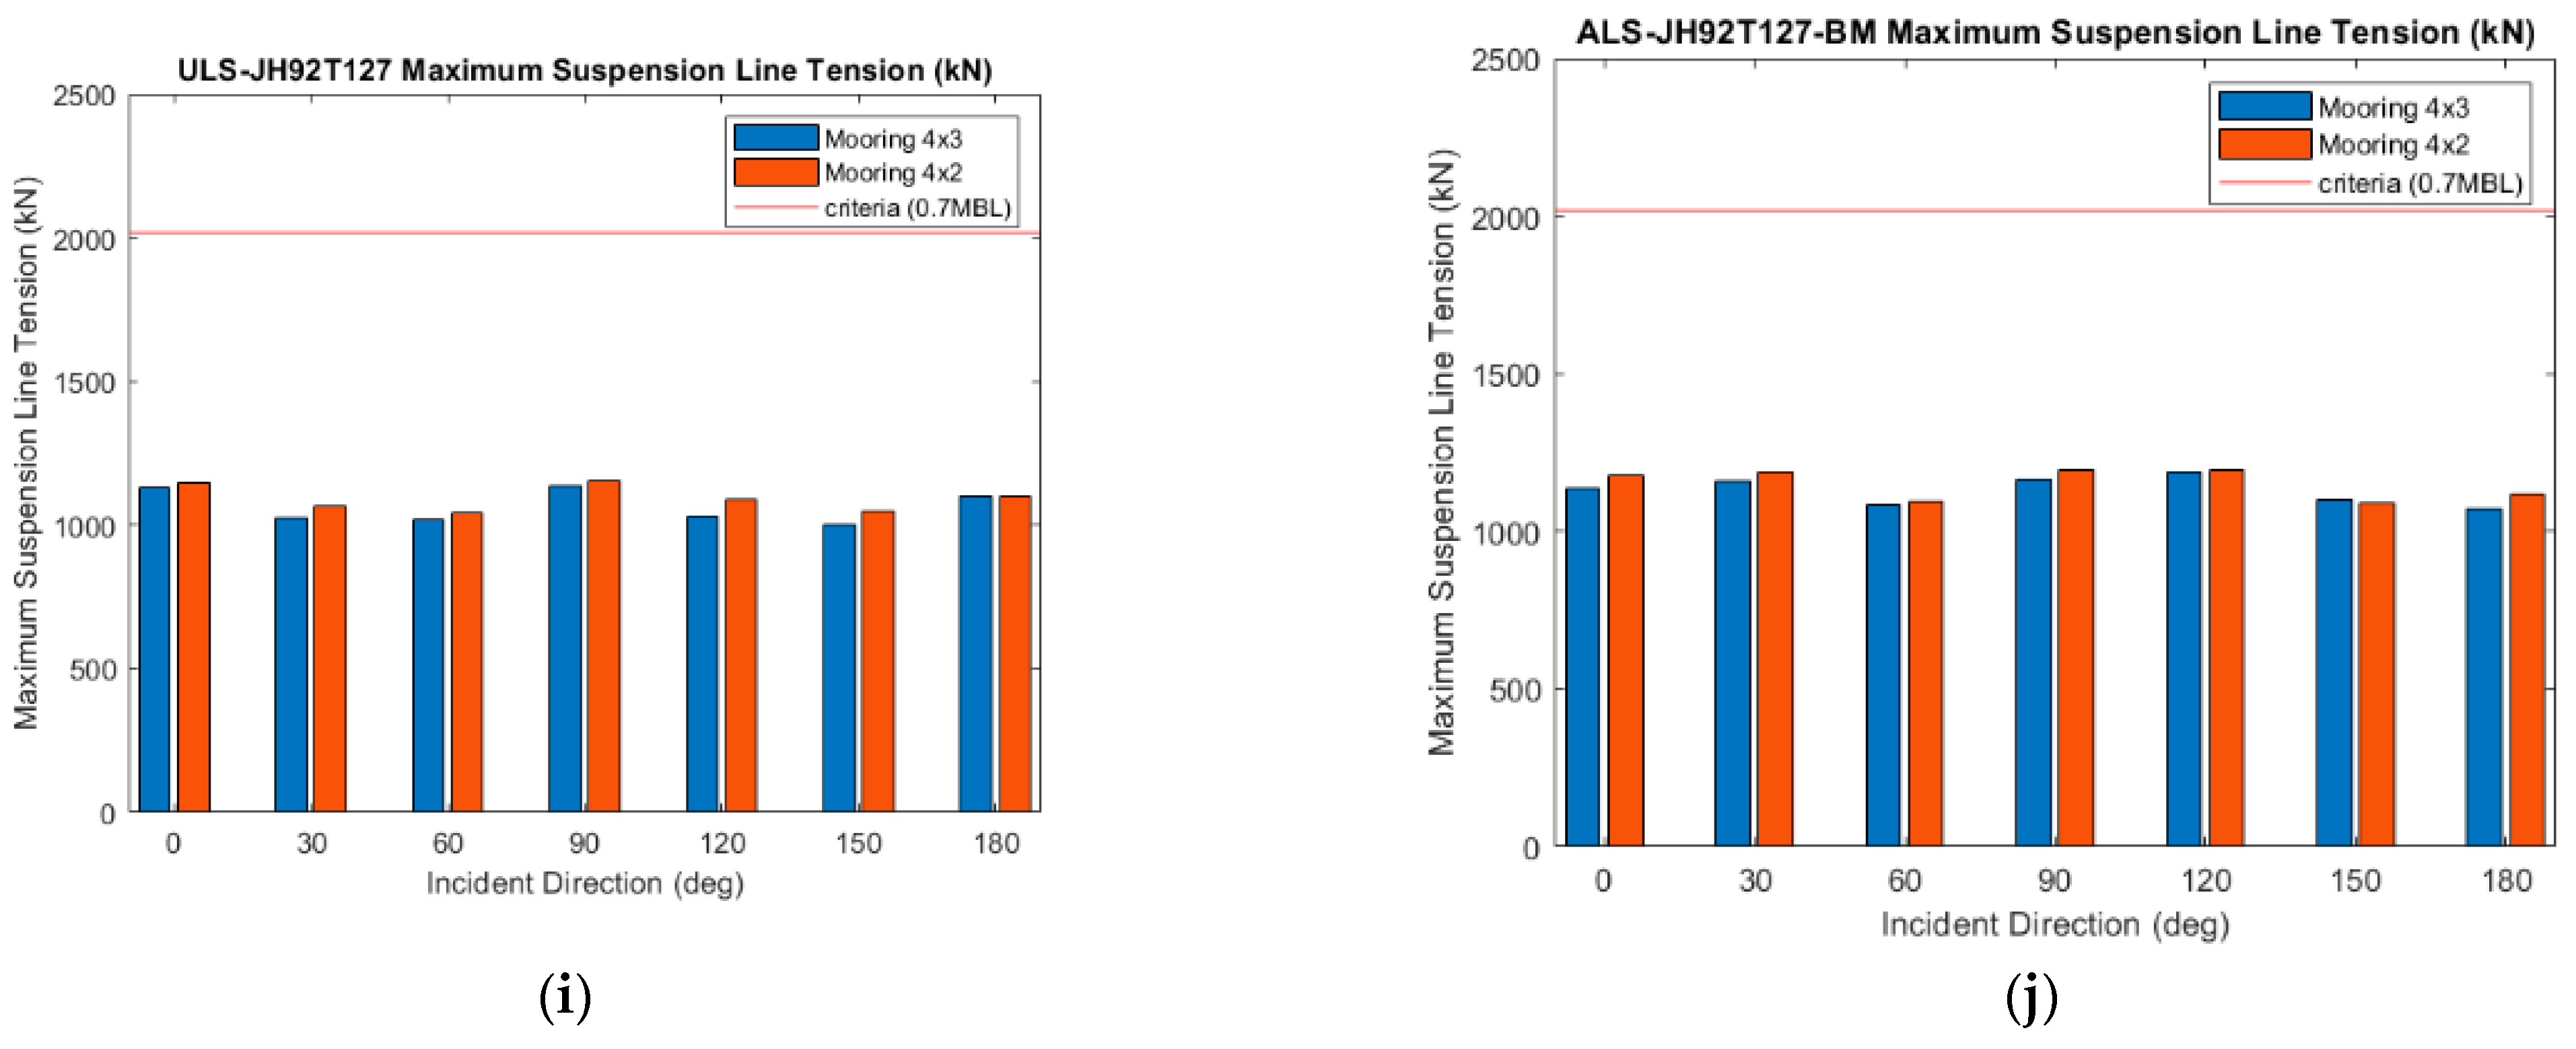
Figure 22.
Maximum tilt angle (left) and suspension line tension (right) under suspension line failure.
Figure 22.
Maximum tilt angle (left) and suspension line tension (right) under suspension line failure.
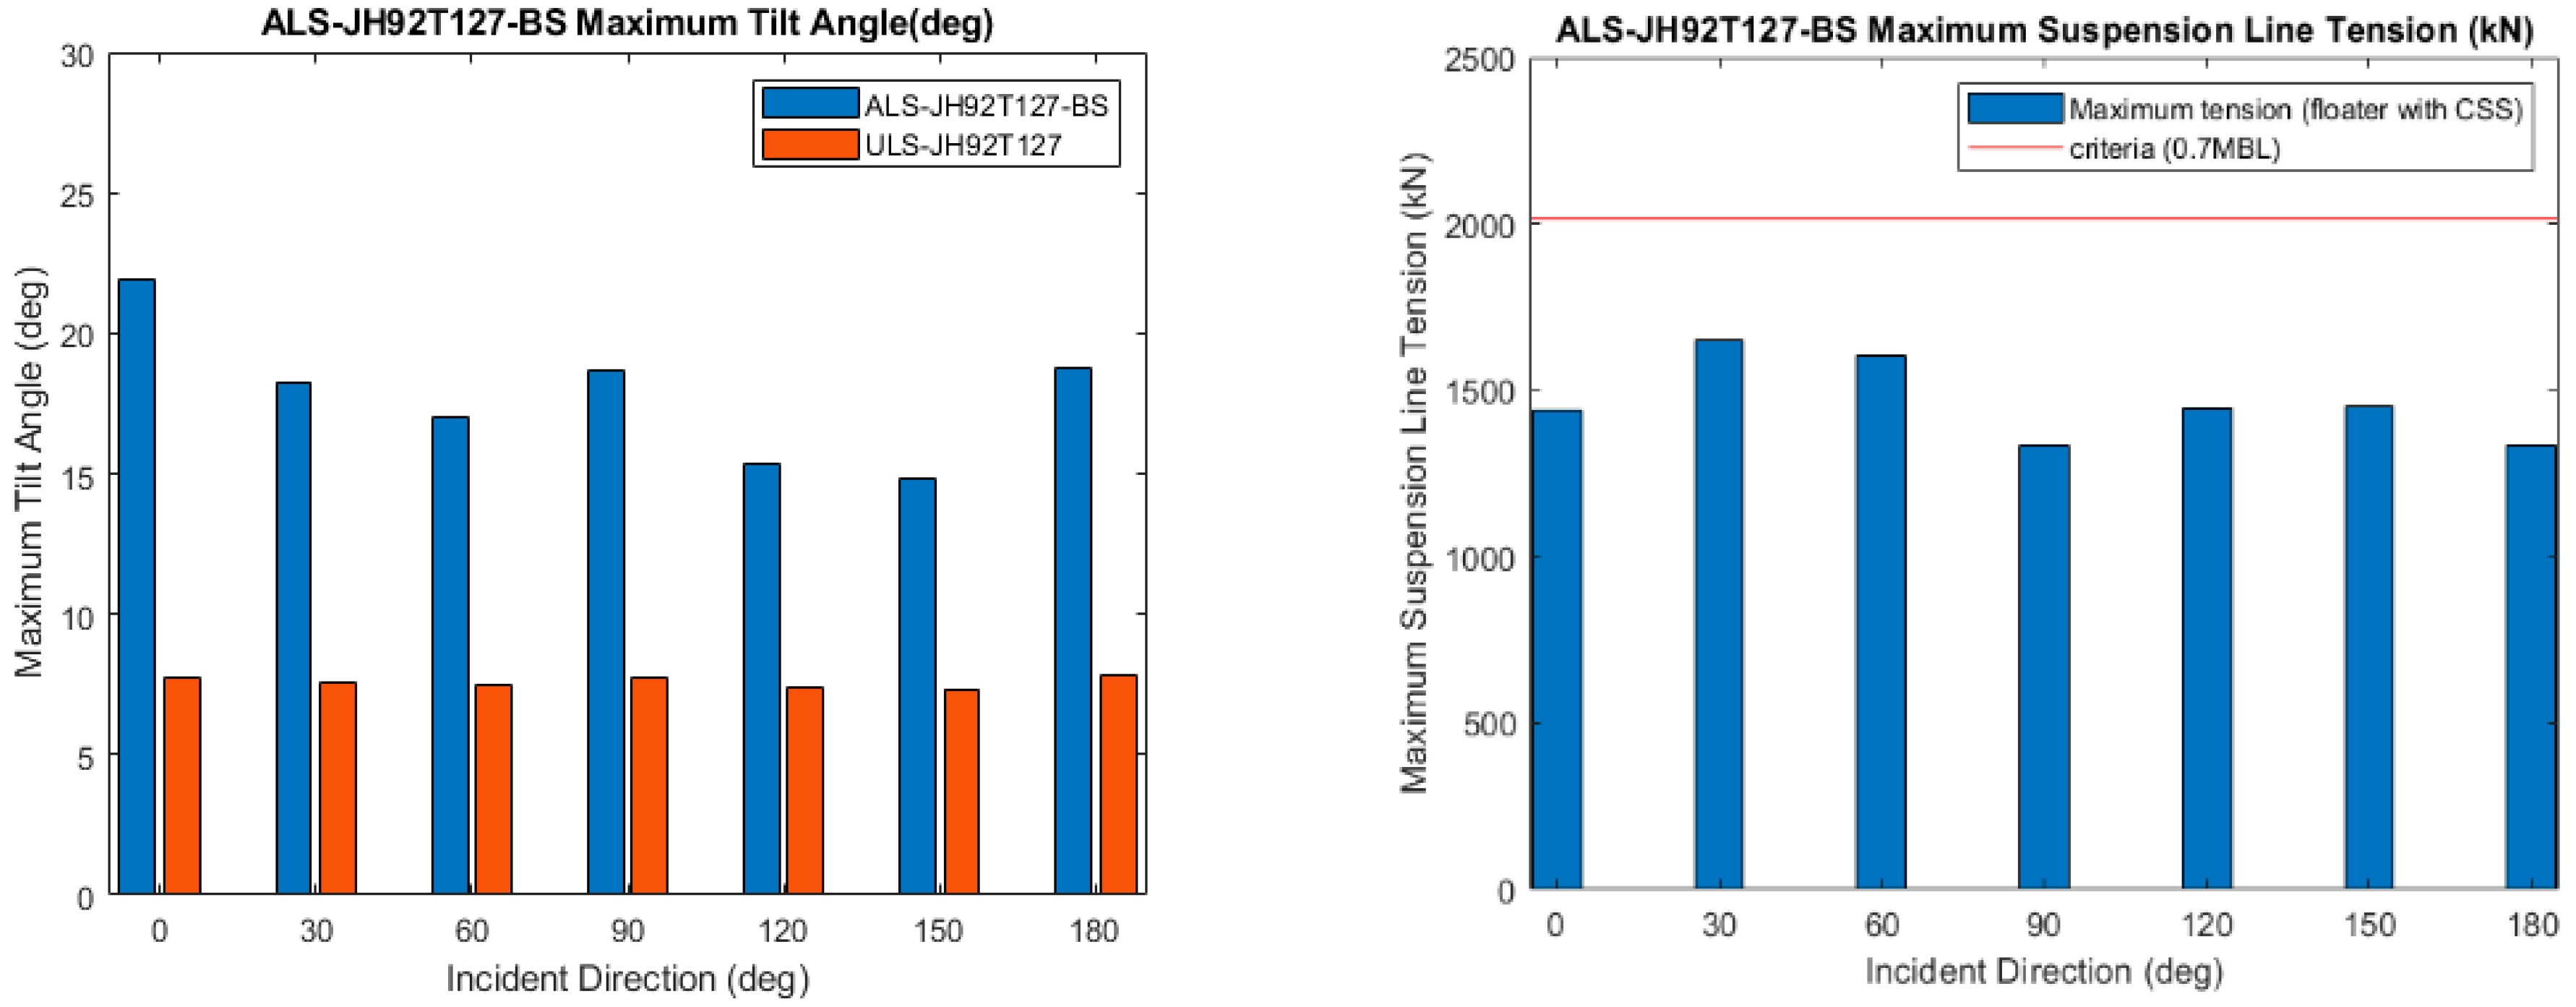
Figure 23.
Validation of SLS Condition. (a,b) Compare 4 × 2 and 4 × 3 mooring configurations, while (c,d) compare floater with and without CSS under 4 × 3 mooring configurations.
Figure 23.
Validation of SLS Condition. (a,b) Compare 4 × 2 and 4 × 3 mooring configurations, while (c,d) compare floater with and without CSS under 4 × 3 mooring configurations.
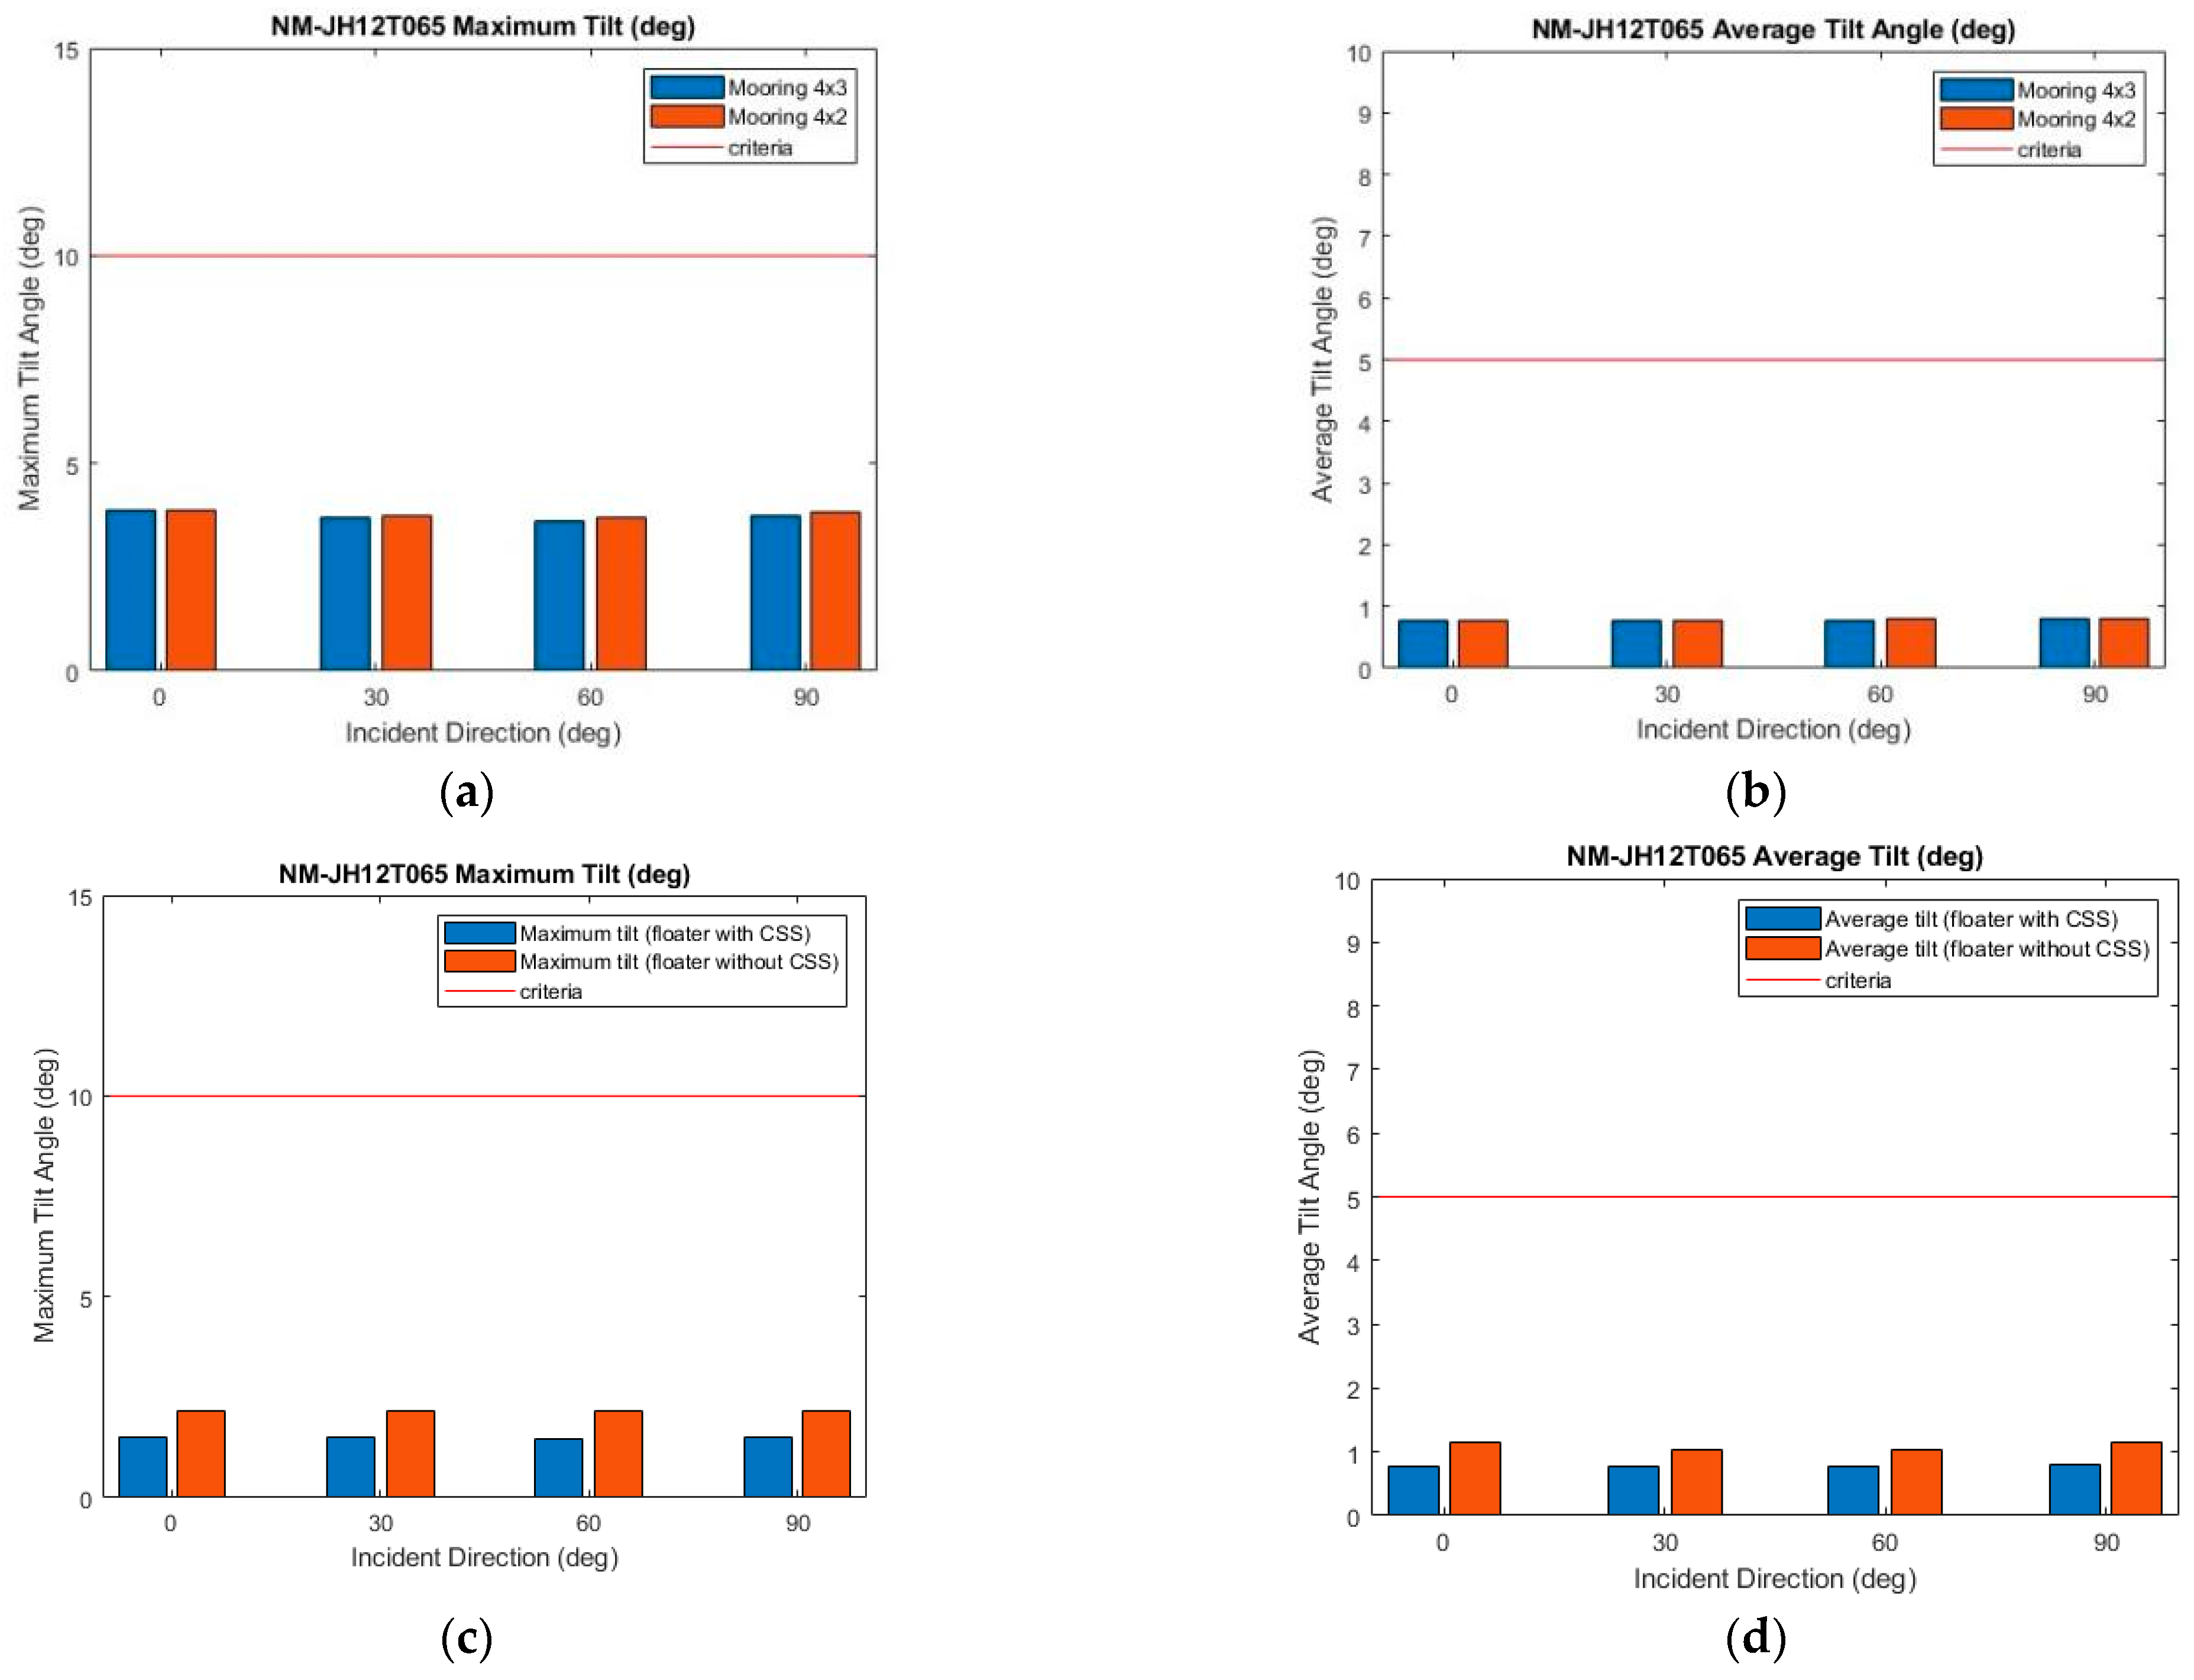
Figure 24.
Validation of Normal Sea State. (a,b) compare 4 × 2 and 4 × 3 mooring configurations, while (c,d) compare floater with and without CSS under 4 × 3 mooring configuration.
Figure 24.
Validation of Normal Sea State. (a,b) compare 4 × 2 and 4 × 3 mooring configurations, while (c,d) compare floater with and without CSS under 4 × 3 mooring configuration.
Figure 25.
Maximum drift ranges under different mooring configurations for SLS (left) and Normal Sea State (right) during operational conditions.
Figure 25.
Maximum drift ranges under different mooring configurations for SLS (left) and Normal Sea State (right) during operational conditions.
Table 1.
Natural periods of different floating platform types (Resource: DNV-RP-0286).
Table 1.
Natural periods of different floating platform types (Resource: DNV-RP-0286).
| Type of Motion | Spar | Semi-Submersible | TLP | Barge |
|---|
| Units | [s] | [s] | [s] | [s] |
| Surge | ~100 (catenary) | ~100 (catenary) | 15–60 (2) | ~100 |
| Heave | 25–40 (3) | 15–25 (3) | 1–2 | 5–10 |
| Pitch | 25–40 (3) | 25–40 (3) | 2–5 | 9–16 |
| Yaw | 5–20 (1) | 50–80 (1) | 8–20 (2) | 50–100 (1) |
Table 2.
Load factor requirements for design of mooring lines (DNV-ST-0119).
Table 2.
Load factor requirements for design of mooring lines (DNV-ST-0119).
| Limit State | Load Factor | Consequence Class |
|---|
| 1 | 2 |
|---|
| ULS | | 1.3 | 1.5 |
| ULS | | 1.75 | 2.2 |
| ALS | | 1.00 | 1.00 |
| ALS | | 1.10 | 1.25 |
Table 3.
Criteria inspected in this study.
Table 3.
Criteria inspected in this study.
| Standard Requirements | Turbine State |
|---|
| Max tilt | Operational |
| Mean tilt | Operational |
| Max tilt | Parking |
| Max drift m | Both |
| Mooring design: | ULS and ALS |
| Fiber ropes design | ULS and ALS |
Table 4.
Minimum requirements for design fatigue factors, DFFs, for mooring line and steel tendon (DNV-ST-0119).
Table 4.
Minimum requirements for design fatigue factors, DFFs, for mooring line and steel tendon (DNV-ST-0119).
| Consequence Class | DFF |
|---|
| 1 | 5 |
| 2 | 10 |
Table 5.
Environmental conditions at Hsinchu, Taiwan site.
Table 5.
Environmental conditions at Hsinchu, Taiwan site.
| Condition | Normal | Northeast Monsoon (SLS) | 50-Year Return Period
(ULS) |
|---|
| 1.22 | 5.0 | 9.2 |
| 6.5 | 13.1 | 12.7 |
| 8.8 | 11.4 | 57 |
| Wind profile | NTM | NTM | EWM |
| 0.4 | 0.88 | 1.159 |
| Turbine | Operating | Operating | Parking |
Table 7.
Parameters of Suspensa OctaFloat.
Table 7.
Parameters of Suspensa OctaFloat.
| Parameters | Unit | Value |
|---|
| Circumcircle diameter | [m] | 48 |
| Freeboard | [m] | 5.4 |
| Draft | [m] | 10.8 |
| Floater weight | [ton] | 12,880 |
| Turbine | [-] | NREL 5-MW |
| Suspended counterweight | [ton] | 2000 |
| CG (platform including ballast) | [m] | (−0.57, 0, −7.15) |
Table 8.
The 4 × 2 mooring system configuration.
Table 8.
The 4 × 2 mooring system configuration.
| Parameter | Value (Unit) |
|---|
| Selected site | Hsinchu, Taiwan |
| Mooring system type | Catenary type |
| Water depth | 100 (m) |
| Anchor radius | 720 (m) |
| Fairlead depth | 8 (m) |
| Chain size and grade [27] | 200 (mm), R4S |
| MBL | 34,048 (kN) |
Table 9.
The 4 × 3 mooring system configuration.
Table 9.
The 4 × 3 mooring system configuration.
| Parameter | Value (Unit) |
|---|
| Selected site | Hsinchu, Taiwan |
| Mooring system type | Catenary type |
| Water depth | 100 (m) |
| Anchor radius | 720 (m) |
| Fairlead depth | 8 (m) |
| Chain size and grade | 180 (mm), R4 |
| MBL | 26,277.7 (kN) |
Table 10.
Formulas for synthetic rope MBL and axial stiffness (d is in meters) [
12].
Table 10.
Formulas for synthetic rope MBL and axial stiffness (d is in meters) [
12].
| Synthetic Rope Type | MBL (kN) | Axial Stiffness (kN) |
|---|
| Nylon ropes (wet) | | |
| Polyester ropes | | |
| Polypropylene ropes | | |
Table 11.
Counterweight suspension system preliminary design parameters.
Table 11.
Counterweight suspension system preliminary design parameters.
| Symbol | L1 (24,0), L2 (0,24), L3 (−24,0), L4 (0,−24) (x,y: Fairlead Position) |
|---|
| Material | Polyester rope bundle |
| Depth of counterweight | 60.8 m under S.W.L. (top of counterweight) |
| Counterweight | Cylinder geometry |
Table 12.
Case symbol of counterweight suspension system optimization.
Table 12.
Case symbol of counterweight suspension system optimization.
| Case Symbol | Counterweight Height | Counterweight Diameter |
|---|
| H15D160 | 1.5 m | 16.0 m |
| H25D120 | 2.5 m | 12.0 m |
| H35D100 | 3.5 m | 10.0 m |
| H45D090 | 4.5 m | 9.0 m |
| H60D080 | 6.0 m | 8.0 m |
| H75D070 | 7.5 m | 7.0 m |
| H90D065 | 9.0 m | 6.5 m |
| NCSS | - | - |
Table 13.
Case symbol of suspension line optimization.
Table 13.
Case symbol of suspension line optimization.
| Case Symbol | Suspension Line Nominal Diameter | Number of Ropes |
|---|
| D130N40 | 130 mm | 40 (10 ropes per bundle) |
| D130N48 | 130 mm | 48 (12 ropes per bundle) |
| D130N56 | 130 mm | 56 (14 ropes per bundle) |
| D120N56 | 120 mm | 56 (14 ropes per bundle) |
| D140N40 | 140 mm | 40 (10 ropes per bundle) |
| NCSS | - | - |
Table 14.
Case symbol of irregular wave simulation.
Table 14.
Case symbol of irregular wave simulation.
| Case Symbol | Significant Wave Height | Peak Period | Direction (deg) |
|---|
| ULS-JH92T127 | 9.2 m | 12.7 s | 0, 30, 60, 90, 120, 150, 180 |
| ALS-JH92T127-BS | 9.2 m | 12.7 s | 0, 30, 60, 90, 120, 150, 180 |
| ALS-JH92T127-BM | 9.2 m | 12.7 s | 0, 30, 60, 90, 120, 150, 180 |
| SLS-JH50T131 | 5.0 m | 13.1 s | 0, 15, 30, 45 |
| NM-JH12T065 | 1.22 m | 6.5 s | 0, 30, 60, 90 |
Table 15.
Natural period of 6 DOFs (unit: second).
Table 15.
Natural period of 6 DOFs (unit: second).
| Natural Period | Surge | Sway | Heave | Roll | Pitch | Yaw |
|---|
| With CSS | 46.16
42.86 | 46.16
42.86 | 9.84
7.31 | 18.75
8.70 | 18.75
8.83 | 24.00 |
| Without CSS | 40.01 | 40.01 | 9.84
7.23 | 12.77 | 13.05 | 23.08 |
Table 16.
Counterweight geometry optimization trials.
Table 16.
Counterweight geometry optimization trials.
| Case Symbol | Counterweight Height | Counterweight
Diameter | Moment of Inertia
|
|---|
| H15D160 | 1.5 m | 16.0 m | 64,000.0 |
| H25D120 | 2.5 m | 12.0 m | 36,000.0 |
| H35D100 | 3.5 m | 10.0 m | 25,000.0 |
| H45D090 | 4.5 m | 9.0 m | 20,250.0 |
| H60D080 | 6.0 m | 8.0 m | 16,000.0 |
| H75D070 | 7.5 m | 7.0 m | 12,250.0 |
| H90D065 | 9.0 m | 6.5 m | 10,562.5 |
| NCSS | - | - | - |
Table 17.
Trials table of discussion 1.
Table 17.
Trials table of discussion 1.
| Case symbol | Suspension Line
Nominal Diameter | Number of Ropes | Stiffness Ratio |
|---|
| D120N56 | 120 mm | 56 (each side 14) | 53.06 |
| D130N48 | 130 mm | 48 (each side 12) | 53.36 |
| D140N40 | 140 mm | 40 (each side 10) | 51.57 |
Table 18.
Trials table of discussion 2.
Table 18.
Trials table of discussion 2.
| Case Symbol | Suspension Line
Nominal Diameter | Number of Ropes | Stiffness Ratio |
|---|
| D130N40 | 130 mm | 40 (each side 10) | 44.47 |
| D130N48 | 130 mm | 48 (each side 12) | 53.36 |
| D130N56 | 130 mm | 56 (each side 14) | 62.26 |
Table 19.
Counterweight suspension system detail configuration.
Table 19.
Counterweight suspension system detail configuration.
| Material | Polyester Rope Bundle |
|---|
| Nominal diameter | 130 mm |
| Number of ropes | 48 (4 × 12) |
| Stiffness ratio | |
| MBL | 2880.88 kN |
| Counterweight geometry | Cylinder—H75D070 |
Table 20.
Environmental load for ULS Condition.
Table 20.
Environmental load for ULS Condition.
| Environmental Condition | ULS |
|---|
| 9.2 |
| 12.7 |
| 57 |
| Wind profile | EWM |
| 1.119 |
| Turbine Condition | Parking |
Table 21.
Environmental load for SLS Condition.
Table 21.
Environmental load for SLS Condition.
| Environmental Condition | SLS |
|---|
| 5.0 |
| 13.1 |
| 11.4 |
| Wind profile | NTM |
| 0.88 |
| Turbine Condition | Operation |
Table 22.
Environmental load for Normal Sea State.
Table 22.
Environmental load for Normal Sea State.
| Environmental Condition | Normal Sea State |
|---|
| 1.22 |
| 4.90 |
| 8.8 |
| Wind profile | NTM |
| 0.40 |
| Turbine Condition | Operation |
Table 23.
Monthly wave height statistics of Hsinchu buoys (2002~2021).
Table 23.
Monthly wave height statistics of Hsinchu buoys (2002~2021).
| Month | (m) | (s) | Load Direction (deg) | Exposure Time (h) |
|---|
| January | 1.3 | 5.0 | 0 | 744 |
| February | 1.2 | 4.9 | 0 | 672 |
| March | 1.0 | 4.7 | 0 | 744 |
| April | 0.8 | 4.5 | 22.5 | 720 |
| May | 0.6 | 4.3 | 22.5 | 744 |
| June | 0.7 | 4.2 | 90 | 720 |
| July | 0.6 | 4.2 | 90 | 744 |
| August | 0.6 | 4.5 | 90 | 744 |
| September | 0.9 | 4.8 | 0 | 720 |
| October | 1.2 | 4.9 | 0 | 744 |
| November | 1.2 | 4.9 | 0 | 720 |
| December | 1.4 | 5.0 | 0 | 744 |
Table 24.
Maximum fatigue damage of mooring line and suspension line.
Table 24.
Maximum fatigue damage of mooring line and suspension line.
Mooring
Configuration | Material | Lifespan (Years) | | | Criteria |
|---|
| 4 2 | Chain | 9.58 × 10² | 1.04 × 10⁻³ | 1.04 × 10⁻² | Pass |
| Polyester (suspension line) | 3.15 × 10⁷ | 3.17 × 10⁻⁸ | 3.17 × 10⁻⁷ | Pass |
| 4 3 | Chain | 2.44 × 10³ | 4.09 × 10⁻⁴ | 4.09 × 10⁻³ | Pass |
| Polyester (suspension line) | 3.45 × 10⁷ | 2.90 × 10⁻⁸ | 2.90 × 10⁻⁷ | Pass |
Table 25.
Criteria check table for turbine parking conditions.
Table 25.
Criteria check table for turbine parking conditions.
| Cases | Mooring Configuration | Max Drift | Max Tilt Angle | Design Tension | Suspension Line |
|---|
| ULS-JH92T127 | With CSS | 4 2 | Pass | Pass | Pass | Pass |
| 4 3 | Pass | Pass | Pass | Pass |
| ALS-JH92T127-BM | 4 2 | Pass | Pass | Fail | Pass |
| 4 3 | Pass | Pass | Pass | Pass |
| ULS-JH92T127 | Without CSS | 4 2 | Pass | Fail | Fail | - |
| 4 3 | Pass | Fail | Fail | - |
| ALS-JH92T127-BM | 4 2 | Pass | Fail | Fail | - |
| 4 3 | Pass | Fail | Fail | - |
Table 26.
Criteria check table for operational conditions.
Table 26.
Criteria check table for operational conditions.
| Cases | Mooring
Configuration | Max Drift | Max Tilt Angle | Average Tilt Angle | Suspension Line |
|---|
| SLS-JH50T131 | With CSS | 4 2 | Pass | Pass | Pass | Pass |
| 4 3 | Pass | Pass | Pass | Pass |
| NM-JH12T065 | 4 2 | Pass | Pass | Pass | Pass |
| 4 3 | Pass | Pass | Pass | Pass |
| SLS-JH50T131 | Without CSS | 4 2 | Pass | Pass | Pass | - |
| 4 3 | Pass | Pass | Pass | - |
| NM-JH12T065 | 4 2 | Pass | Pass | Pass | - |
| 4 3 | Pass | Pass | Pass | - |


