Abstract
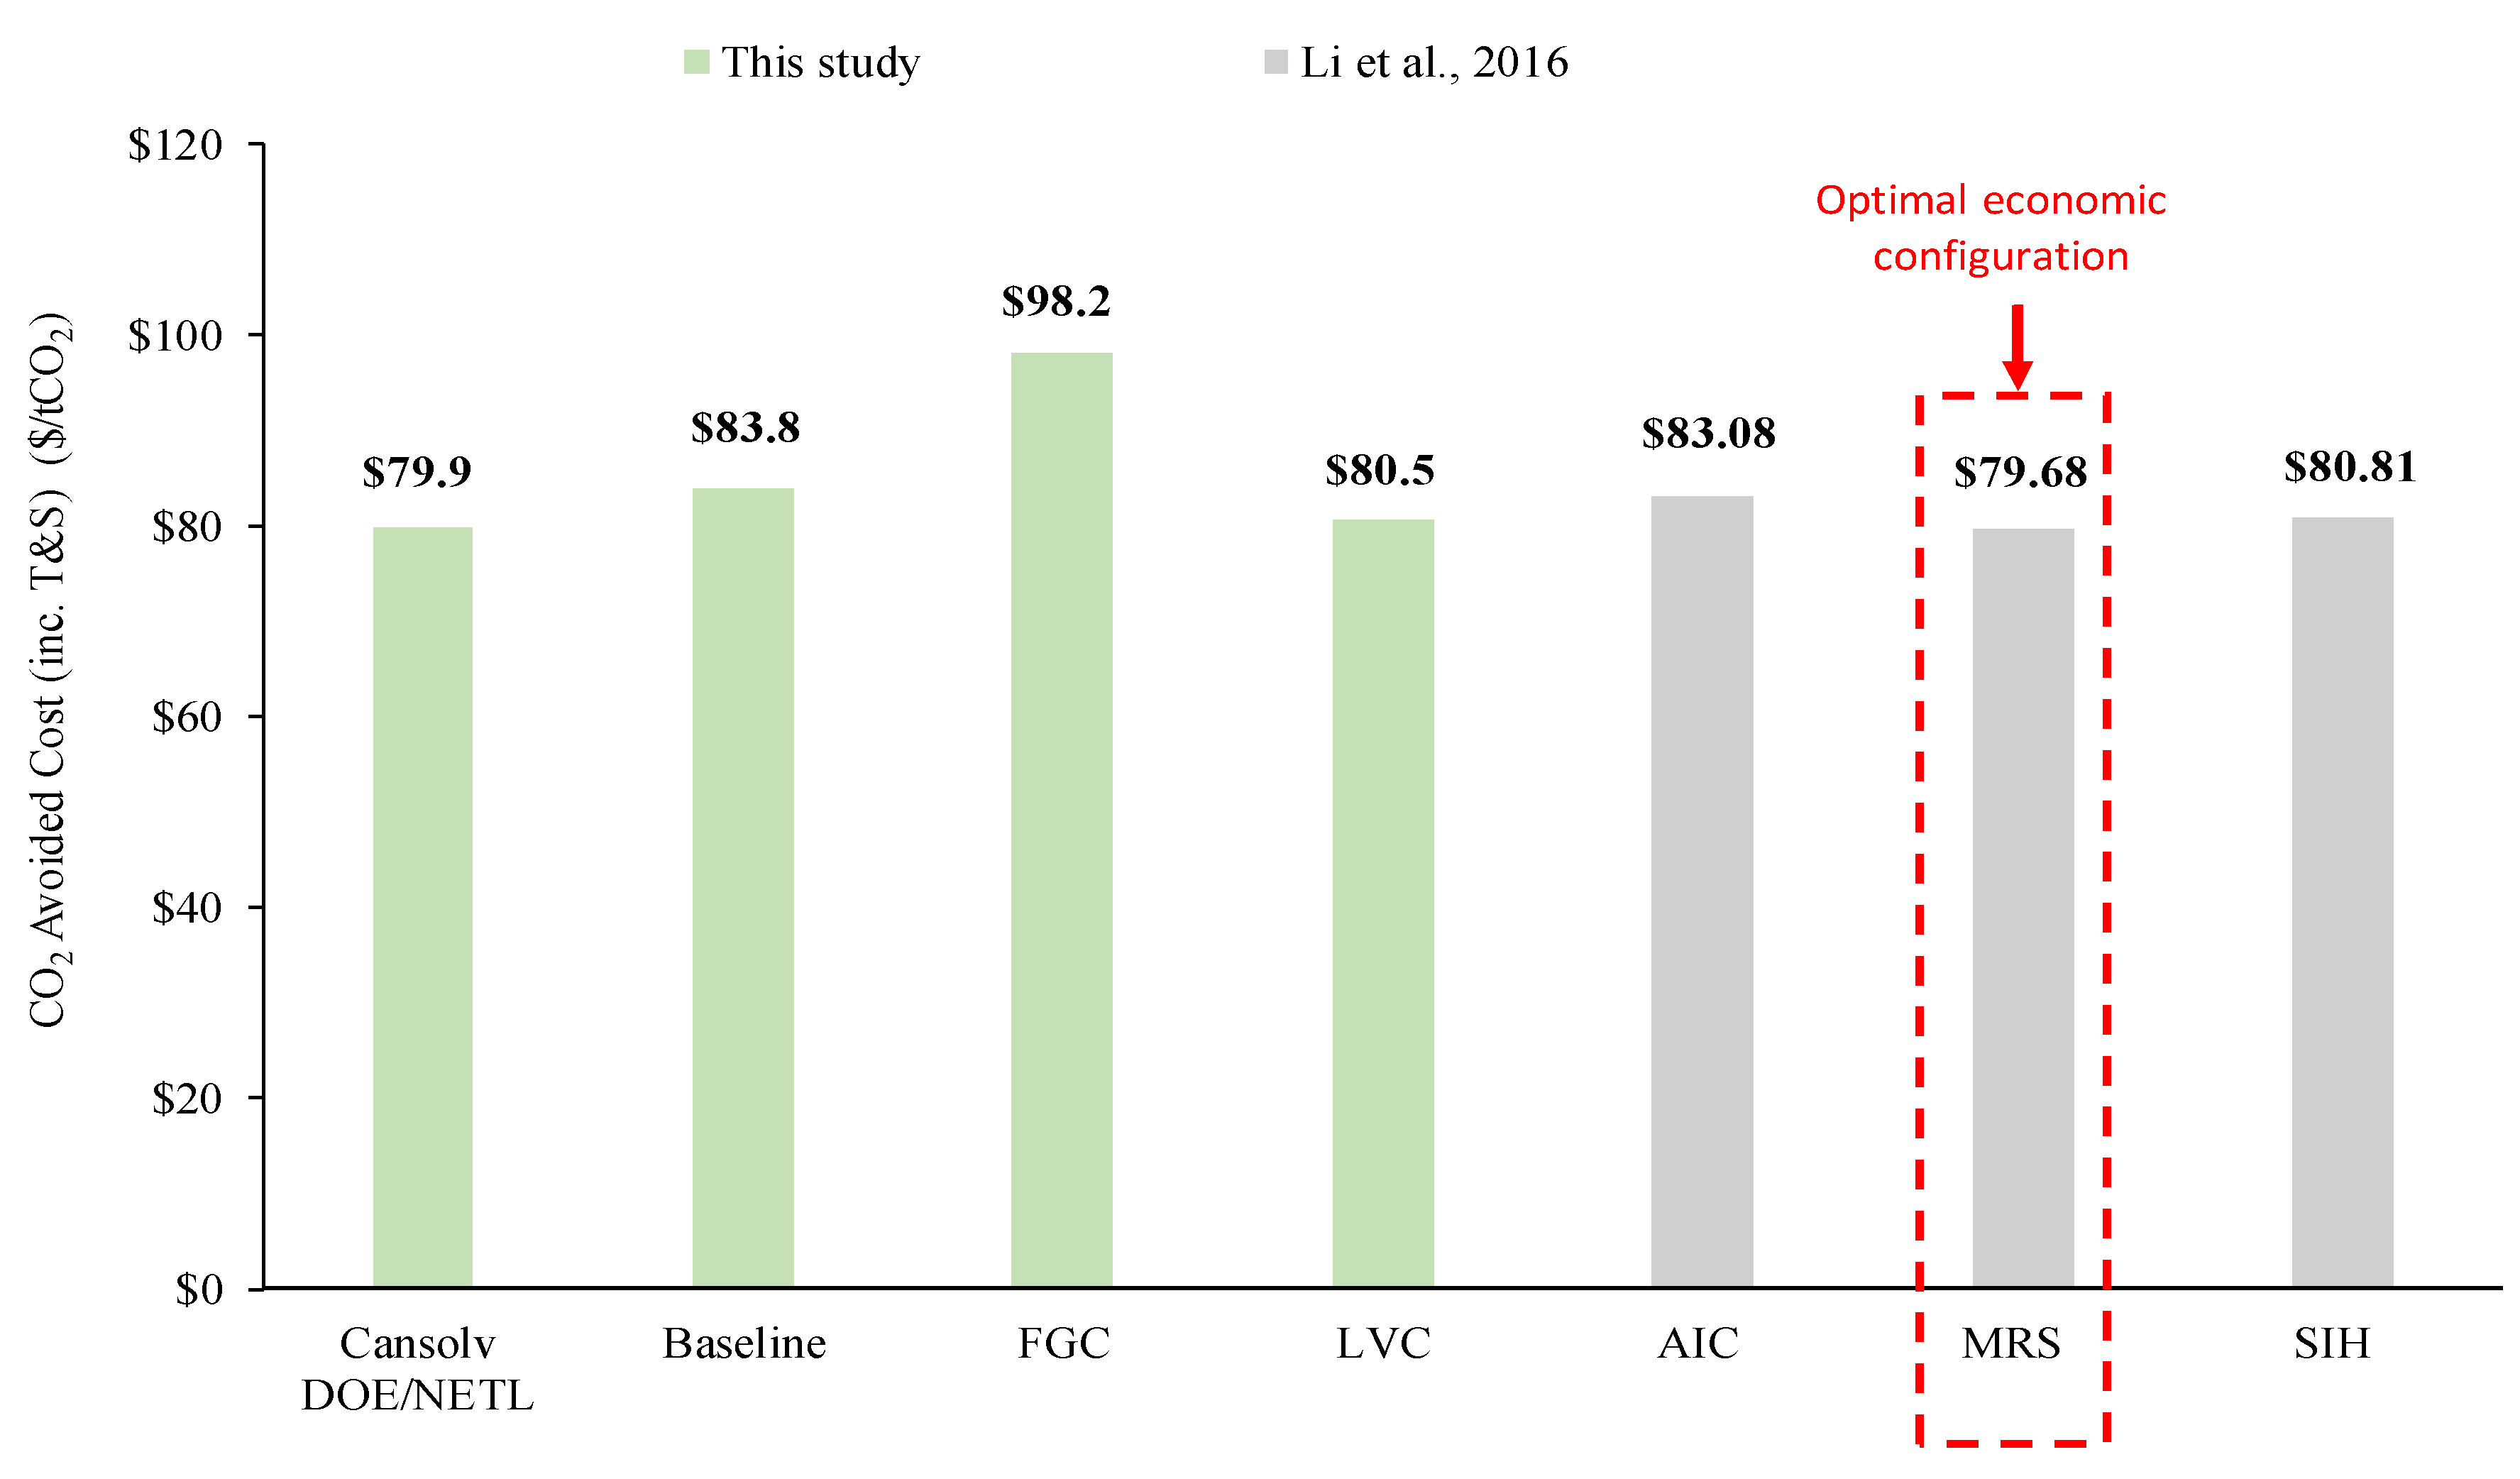
Proposed process intensification in the literature claims relevant savings in operational cost through optimization of the energy required to operate a typical solvent-based CO2 capture facility, meanwhile granting the same capture performance. However, the techno-economic assessment for these proposed designs is not well developed and not fairly compared using a detailed and standardized cost evaluation technique that follows the association for the advancement of cost engineering (ACEE) class 4 costing methodology. This limitation makes it difficult and less viable to decide which solution is more cost-effective in consideration of the integration market with coal or natural gas combined cycle power plants. This work suggests a standardized methodology for cost evaluation and ultimately aids in formulating an accurate and high-fidelity guideline for industrial deployment of the proposed technologies, covering analysis on the flue gas compression (FGC) and lean vapor compression (LVC) configurations. Design, simulation, sensitivity analysis, and optimization are conducted initially to build a baseline design that closely represents an existing commercial design, such as Cansolv and Petra Nova technologies. The energy saving from the two configurations is analyzed in parallel to the investment cost, levelized cost of electricity (LCOE), and the CO2 avoided cost. It was found that FGC improved the capture performance of the baseline design, but at the same time raised the cost of operation and investment by a higher magnitude, making the CO2 avoided cost $98.2/tonneCO2, which is $16 higher than that of the baseline design. Meanwhile, LVC has been defined as an attractive configuration for lowering the CO2 avoided cost.
1. Introduction
1.1. Background
The cumulative amount of atmospheric carbon dioxide (CO2) resulting from heavy dependence on fossil fuels has become a concern in recent decades [1,2,3]. CO2 emissions can be addressed by shifting the worldwide energy dependency towards cleaner energy sources such as hydrogen, solar energy, and nuclear power. This requires long-term planning and adoption of these technologies to substitute the current liability on fossil fuels. Carbon taxes and CO2 emissions credits have been proposed as a potential solution to reduce emissions. This forces businesses and consumers to shift towards developing new technologies that respond to environmental policy. Globally, countries are working to tackle CO2 emissions by implementing various technological strategies: (i) enhancing current power generation methods such as integrated gasification combined cycle (IGCC) and pressurized fluidized bed combustion cycle (PFBC-CC) [4,5,6]. These methods are more efficient at extracting energy than traditional coal-fired power plants, leading to reduced CO2 emissions per unit of electricity generated. However, they face challenges related to operational complexity and substantial capital costs. (ii) Investigating new sustainable and renewable energy options, including solar, wind, nuclear, and geothermal sources. These technologies typically demonstrate lower overall energy efficiency when considering applied scaling costs. (iii) Combining carbon capture and storage (CCS) with existing point source emissions. This approach meets the energy demands of the global sector, which heavily relies on fossil fuels, while also facilitating a reduction in CO2 emissions.
CCS offers a quick solution to reduce CO2 emissions without necessitating a drastic overhaul of the existing energy sector. It facilitates a rapid transition to clean energy, particularly in the most advanced countries. The procedure involves capturing CO2 directly from emission sources, compressing it, and then transporting it through gas pipelines for injection into sealed geological formations. Potential geological sites for storing the captured CO2 include deep saline aquifers, deep coal seams, and abandoned reservoir formations. Three central CO2 capture systems are widely acknowledged as appropriate for commercial use: pre-combustion [7], oxy-fuel combustion [8], and post-combustion [9]. Among them, the most essential technique emerging as a leading solution is post-combustion using solvent-based absorption, mainly amine solvents [10,11]. The emergence of this technique is primarily due to its compatibility with existing power plant infrastructure. Other technologies that can be utilized are: (i) adsorption on solid materials such as activated carbon or zeolites, (ii) utilization of a perm-selective membrane to CO2, though it is challenging due to the low pressure and membranes requiring partial pressure as a driving force, (iii) cryogenic separation, which is also challenging as it requires high pressures. For all these technologies, it is clearly easier to achieve removal at higher pressures, but it necessitates significant compression power and cost, which slows its adoption for large-scale emissions such as power plants. According to a survey conducted in 2022 by the Global Carbon Capture and Storage Institute, out of 194 large-scale CCS projects at various stages of development to operational status, only 30 are classified as operational. Among these, 28 utilize solvent-based technologies to capture 41MtCO2/year from the energy sector. Their integration with the cement and chemical sectors remains limited due to the lack of a controllable heat source to generate steam for regeneration. Introducing an external steam supply significantly reduces overall efficiency. Moreover, the economic viability of solvent-based CO2 capture is primarily justified for large-scale power generation, making it financially unfeasible to incorporate into smaller industries like cement and chemicals. Additionally, many cement and chemical facilities are either small or geographically dispersed, complicating the validation of the need for the large solvent-capture systems that are required. Only one of the 30 projects employs a membrane approach in Brazil to capture 7MtCO2/year from offshore natural gas, and only one of the 30 projects relies on adsorbent-based CO2 capture. The sole operational facility using adsorbents captures nearly 1 million tons of CO2 each year from steam-methane reformers located in Port Arthur, Texas. This situation is largely due to two primary challenges associated with adsorbents: the high costs associated with both adsorbent materials and solid handling.
Despite its maturity and wide applicability, solvent-based CO2 capture technology still suffers from considerable usage of heat for regeneration, which greatly diminishes plant efficiency and raises operational costs. Maintaining the high CO2 capture efficiency while minimizing the energy consumption and expenses is a challenge that requires properly optimized process designs to address it.
The conventional strategy to save on energy consumption at an operating plant involves the reduction in solvent circulation rate by substituting the original chemical sorbent with more effective, compatible options. Although the standardly used monoethanolamine (MEA) has some limitations on physical and chemical properties, it is still the predominant solvent due to its affordability and availability; however, blended amine solvents, such as methyldiethanolamine/piperazine (PZ/MDEA) and advanced solvents N,N-diethylethanolamine-1,6-hexamethyl diamine (DEEA-HMDA), have been investigated and have demonstrated improved performance and significant reductions in both capital expenditure (CAPEX) and operational expenditure (OPEX) compared to MEA [12,13]. For new projects, there is a chance to apply the major upgrade to the operability of the plant upfront during construction through a pre-front-end engineering design (Pre-FEED) Study. Researchers have explored various process intensification strategies for solvent-based CO2 capture to mitigate the energy penalty [14]. These techniques can achieve even greater energy savings when combined with advanced solvent formulations, but the focus of this work is restricted to process intensification. Among the most promising approaches are flue gas compression (FGC) and lean vapor compression (LVC), which target different aspects of the capture process. FGC operates by pressurizing the flue gas before absorption, thereby increasing CO2 partial pressure and enhancing mass transfer efficiency. This method can significantly reduce solvent circulation rates and absorber size, though the energy required for compression presents a critical trade-off. LVC, on the other hand, focuses on heat recovery within the stripping section by compressing and recycling lean solvent vapor, potentially reducing reboiler duty [15,16].
Other process modifications have also shown promise in reducing energy demands. For instance, modified rich split-flow (MRS) designs, conducted at a WtE facility, showed an improvement of 7.8% compared to the base case through capturing waste energy from condensing overhead vapors from the stripper [17]. Moreover, Absorber intercooling (AIC) is considered a critical solution that offers benefits regarding solvent capacity for absorbing and transferring mass in CO2 capture systems [18].
All discussed process intensifications are claimed to reduce energy consumption and, consequently, lower the operational cost; however, this may lead to an increase in capital investment, which necessitates a careful evaluation of the magnitude of improvement in energy saving versus the cost of investment. To answer the question of whether these technologies are proven to be economically viable, a techno-economic assessment (TEA) is deployed as a systematic method to evaluate the CO2 avoided cost from the levelized cost of electricity (LCOE). It involves analyzing process design, energy efficiency, CAPEX, and OPEX.
Despite the technological advances in CO2 capture process intensification, the literature reveals a critical gap in comprehensive techno-economic assessments that fairly compare these alternative designs. Published economic analyses often neglect key economic indicators such as the LCOE and CO2 avoidance costs, which are essential for practical decision-making. This limitation hinders the ability of plant operators and policymakers to identify the most cost-effective solutions.
To address these gaps, this work suggests a standardized methodology for cost evaluation and ultimately aids in formulating an accurate and high-fidelity guideline for industrial deployment of the proposed technologies at the natural gas combined cycle (NGCC) power plant. This was conducted through evaluation of the LCOE, CO2 avoided cost, and avoided costs, which are a limited focus of the few proposed cost analyses in the literature, for the novel configurations following United States Department of Energy (DOE) and National Energy Technology Laboratory (NETL) guidelines for the cost estimate of association for the advancement of cost engineering (AACE) class 4 (−15% to 30% of cost accuracy) [19].
To the best of the author’s knowledge, no previous techno-economic studies have been conducted on FGC and LVC configurations at the level of costing details applied to AIC, MRS, and stripper inter-heating (SIH) configurations presented in Li et al. [11] work. Few studies covered the performance of FGC and LVC, but used a different costing methodology and finance structure, which makes it inappropriate to compare with other proposed configurations. For instance, Fernandez et al. [15] comprehensively optimized the net present value of a CO2 capture system upgraded with LCV based on energy saving from equipment and the comparable investment cost associated with the upgrade. The economic evaluation is based on a simple net present value (NPV) model that assumes a sensitivity rate to energy saving compared to the cost of the upgrade. This economic model does not cover the evaluation of the CO2 avoided cost or the LCOE, which is highly important and necessary for the CO2 capture plant’s economic feasibility. The capture plant cannot be operated in island mode and needs a large source of heat that is usually supplied from the power plant’s steam cycle. Hence, this work strategy involves adding value to the proposed solution by building on a rigorous finance structure of the power plant reported by DOE/NETL guidelines, which accounts, on a detailed basis, for the operation costs and CO2 avoided cost with respect to the change in the LCOE. Schach et al. [20] covered the cost analysis of AIC configuration and installation of a complex matrix of strippers, but not FGC and LVC, and applied a different finance model that assumes the CO2 capture plant operates in island mode and the costing methodology at the low definition of the capital cost and operating cost extracted from different sources [21,22]. This method does not include labor cost, engineering and construction cost, owner’s cost, fuel, and supply cost, which strongly motivates applying the rigorous DOE/NETL costing method [19] with power point integration to evaluate the cost of electricity and help determine which process upgrade is more viable in terms of energy saving and investment cost.
Li et al. [11] have applied the same guidelines referred to the DOE/NETL cost methodology; however, their work does not cover FGC or LCV configurations. In continuation of the work conducted by Li et al. [11], this work investigates the technical and economic performance of post-combustion CO2 capture upgraded with FGC or LVC and integrated at the commercial scale to the DOE/NETL B31B.95 cases study [23]. However, Li et al. [11] used an older version of DOE/NETL cost reporting, published in 2007 [24]; for comparison, the evaluated CO2 avoided cost of AIC, MRS, and SIH configurations is scaled to the baseline model developed in this work and compared to that of FGC and LVC configurations. The TEA framework followed in this work includes the following steps: baseline process design and simulation accompanied with sensitivity analysis to optimize operating conditions, design the LVC and FGC configurations from the optimized baseline, cost estimation by calculation of CAPEX and OPEX of the NGCC power plant equipped with the upgraded CCS facility, including equipment costs and energy requirements, and finally comparing the cost analysis results, LCOE and CO2 avoided cost to the baseline model and the AIC, MRS, and SIH configurations reported in the literature.
1.2. Modeling and Costing Objectives
This study simulates and cost-evaluates FGC and LVC process configurations to extend on existing work in the literature [11] and create a representative frame of comparison that uses the same cost evaluation methodology that is standardized across all the proposed intensification technologies in the literature. The objective is to assess the cost-saving from the modeled LVC and FGC in this work and compare it to the configurations involved in Li et al. [11] work, including AIC, MRS, and SIH, which are described in Section 3.5. Li et al. [11] utilized NETL’s cost guidelines and component costs, while the increase in LCOE or the reduction of CO2 emissions is quantified concerning Li’s baseline scenario and interpolated on the baseline established here. This helps define which approach is more promising in terms of both capture performance and economic viability at high fidelity.
2. Materials and Methods
2.1. Simulation Model
In order to evaluate the cost of different novel process configurations for post-combustion CO2 capture, a rigorous baseline, rate-based model is simulated on Aspen Plus version 14. Afterward, the model is optimized to make it representative of a practical commercial example, such as Cansolv technology installed at SaskPower coal-fired power plant located in Boundary Dam, Canada [25], and Kansai Mitsubishi technology installed at Petra Nova coal-fired power plant located in Texas, United States [26]. Table 1 summarizes the essential design specifications of the two main processing units: (i) absorber and (ii) stripper for the two technologies and the approached design for this study. The height of the absorber is determined by factors such as the solvent-to-flue gas ratio, the capture performance of the solvent, and its viscosity. Since these characteristics are proprietary to Cansolv technology and no public data are available on the chemical formula of the solvent used, the validation of the simulation dimensions of the two units is based only on the flue gas velocity, which can provide insights into the practical viability of the hydrodynamics.

Table 1.
Absorber and stripper simulation design metrics compared to commercial technologies.
A typical CO2 capture design is simulated to treat 3.43 million Nm3/h of flue gas generated by the NGCC power plant reported in DOE/NETL [23]. As shown in Table 1, the simulated design is seven times larger than the commercial Cansolv solution installed at SaskPower. Cansolv captures around 3300 tonnes of CO2/day, while our simulated case captures 5690 tonnes of CO2/day. The latest requires twice the diameter of the Cansolv absorption column to keep gas velocity low and prevent excess liquid hold-up. This also needs to be balanced to keep the gas velocity high enough to avoid causing larger pressure drops. Large pressure drops increase the electric duty of the blower and overall the adsorption cost. The calculated gas velocity at the inlet of the absorber column is ensured to be equal to or higher than the referred velocity (3.04 m/s vs. 1.90 m/s for Cansolv). The simulated flood percentage across the absorber is 69.8% which falls within the recommended range for safe operations. The increase in the absorber diameter above 20 m will result in a lower pressure drop (0.038 barg vs. 0.022 barg for 23 m diameter) and a lower column flooding percent of 52.83% for 23 m diameter. Reducing the size of the column below 20 m must be avoided, as it causes 96.38% flooding due to a large pressure drop of 0.16 barg. For a real case, two parallel columns must be installed to accommodate the large diameter and overall size of the single adsorption vessel. The capture performances improved with increasing the diameter of the absorber due to the time extension in liquid-vapor contact. The highest capture rate of 98% was achieved at an absorber diameter of 23 m; however, the claimed capacity rate for commercial technologies is 95%. Thus, a 20 m diameter is chosen as the baseline for further development of the sensitivity analysis.
Throughout the investigation, sensitivity analysis and optimization are conducted to advise about the best simulation design that minimizes the circulation rate and the cost of capture, and the LCOE.
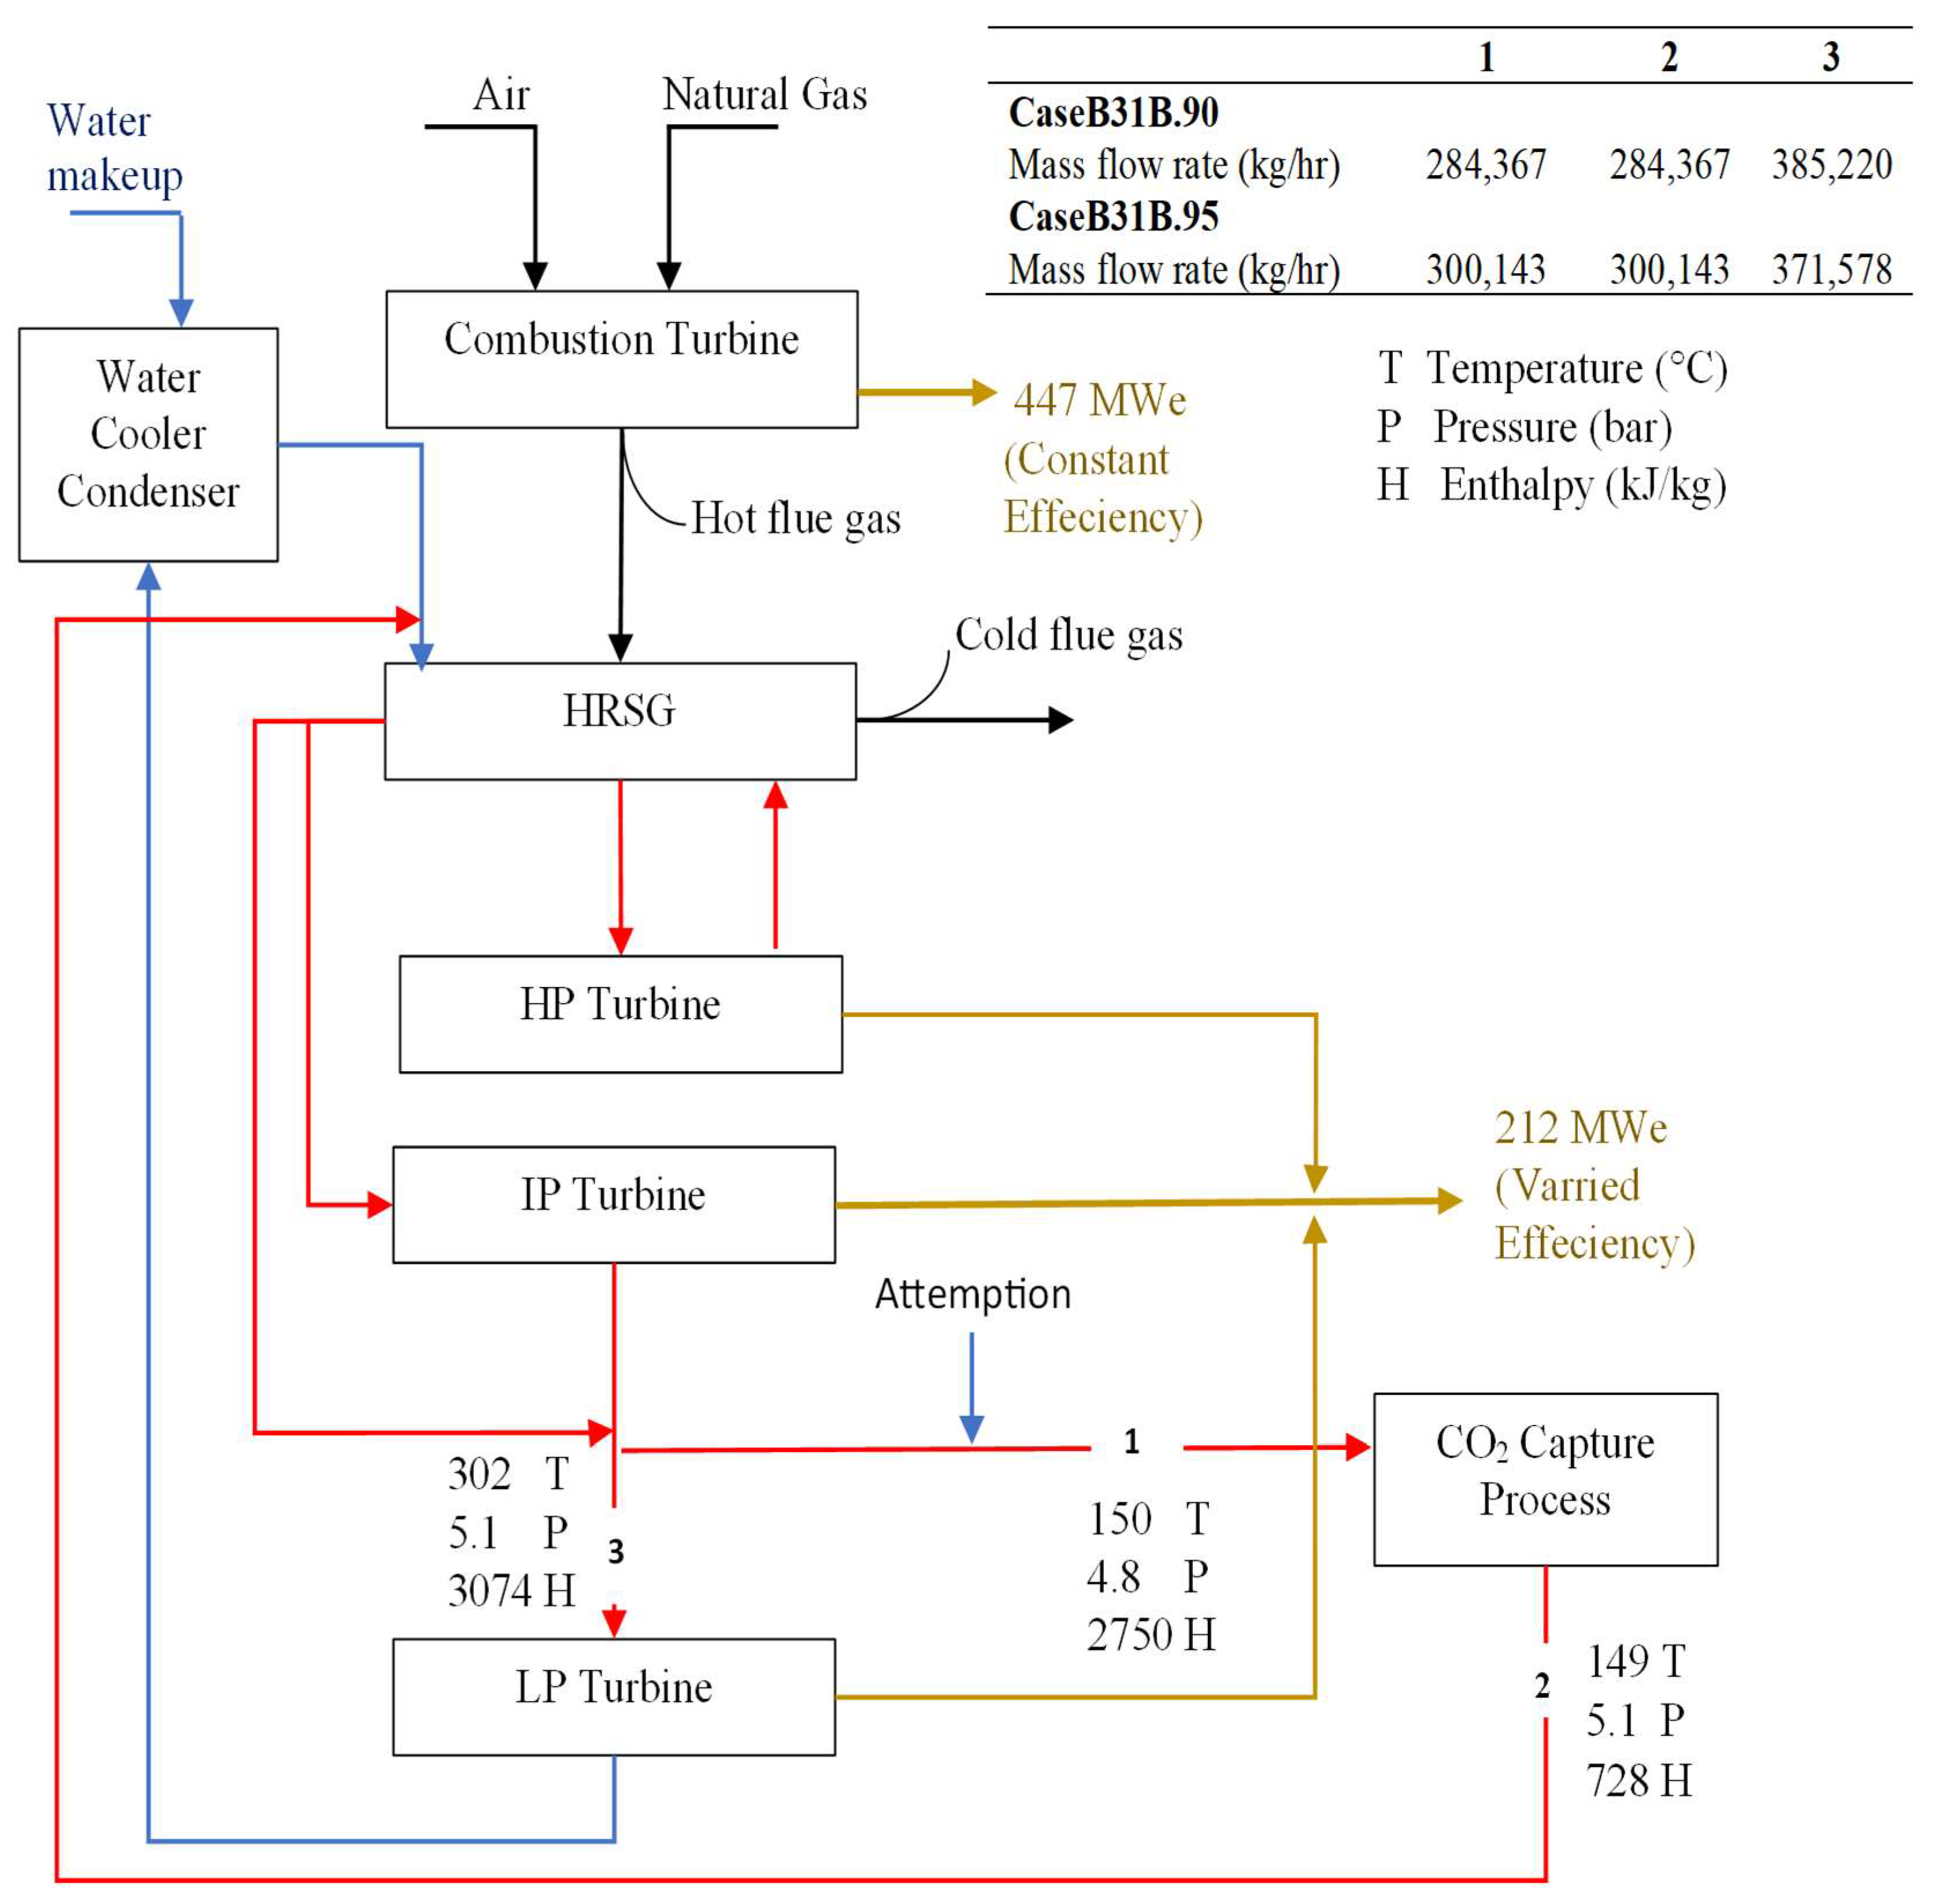
Figure 1 shows a simplified block flow diagram of the proposed F-class NGCC equipped with a CO2 capture facility targeting 90% (case B31B.90) or 95% (case B31B.95) capture rates [23]. The two cases reported a confidential and limited description of the priority CO2 capture facility owned by Cancolv Technologies Inc., Montreal, QC, Canada. The proposed simulation design is approached based on available data and a conducted optimization step prior to process intensification. A detailed process scheme with a full description of the operating condition is presented in the DOE/NETL report [23]; thus, only a brief description is given here. The referred NGCC power plant design comprises the integration of a combustion turbine with steam turbines through a train of heat recovery and steam generation (HRSG) exchangers. The combustion turbine operates on pipeline natural gas with a net power of 447 MWe, at a low-heat value efficiency of 39%, to generate electricity and produce high-temperature flue gas, which is then heat exchanged with water in HRSG to generate steam. The steam drives the steam turbines to produce additional electricity and increase the overall net plant efficiency to 59.4%. Unlike combustion turbines, the steam turbine output of 212 MWe is dependent on the energy requirement of the CO2 capture facility. Extracted steam from the intermediate pressure (IP) turbine output is used to regenerate the CO2 capture solvent. This act introduces a change to the electric output and the efficiency of the low-pressure (LP) turbine. Intermediate and high-pressure turbine output remains unaffected by this change. As shown by the mass balance around the CO2 capture system (stream 1 and 2, see Figure 1), 5.5% extra flow from slipstream 1 (300,143 kg/h for 90% capture vs. 284,367 kg/h for 95% capture) is needed to desorb an additional 5% of captured CO2. The additional 0.5% of heat is wasted on water evaporation during regeneration.
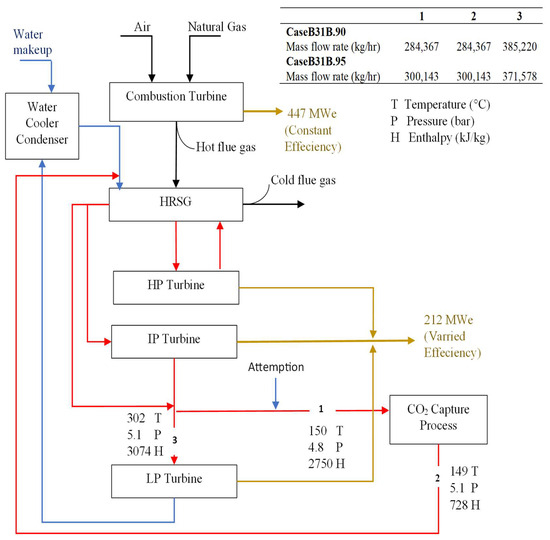
Figure 1.
Block flow diagram of NGCC power plant equipped with CO2 capture facility (for streams details, refer to [23]). Red solid line: steam, blue solid line: cold water, yellow solid line: electricity, and black solid line: process stream.
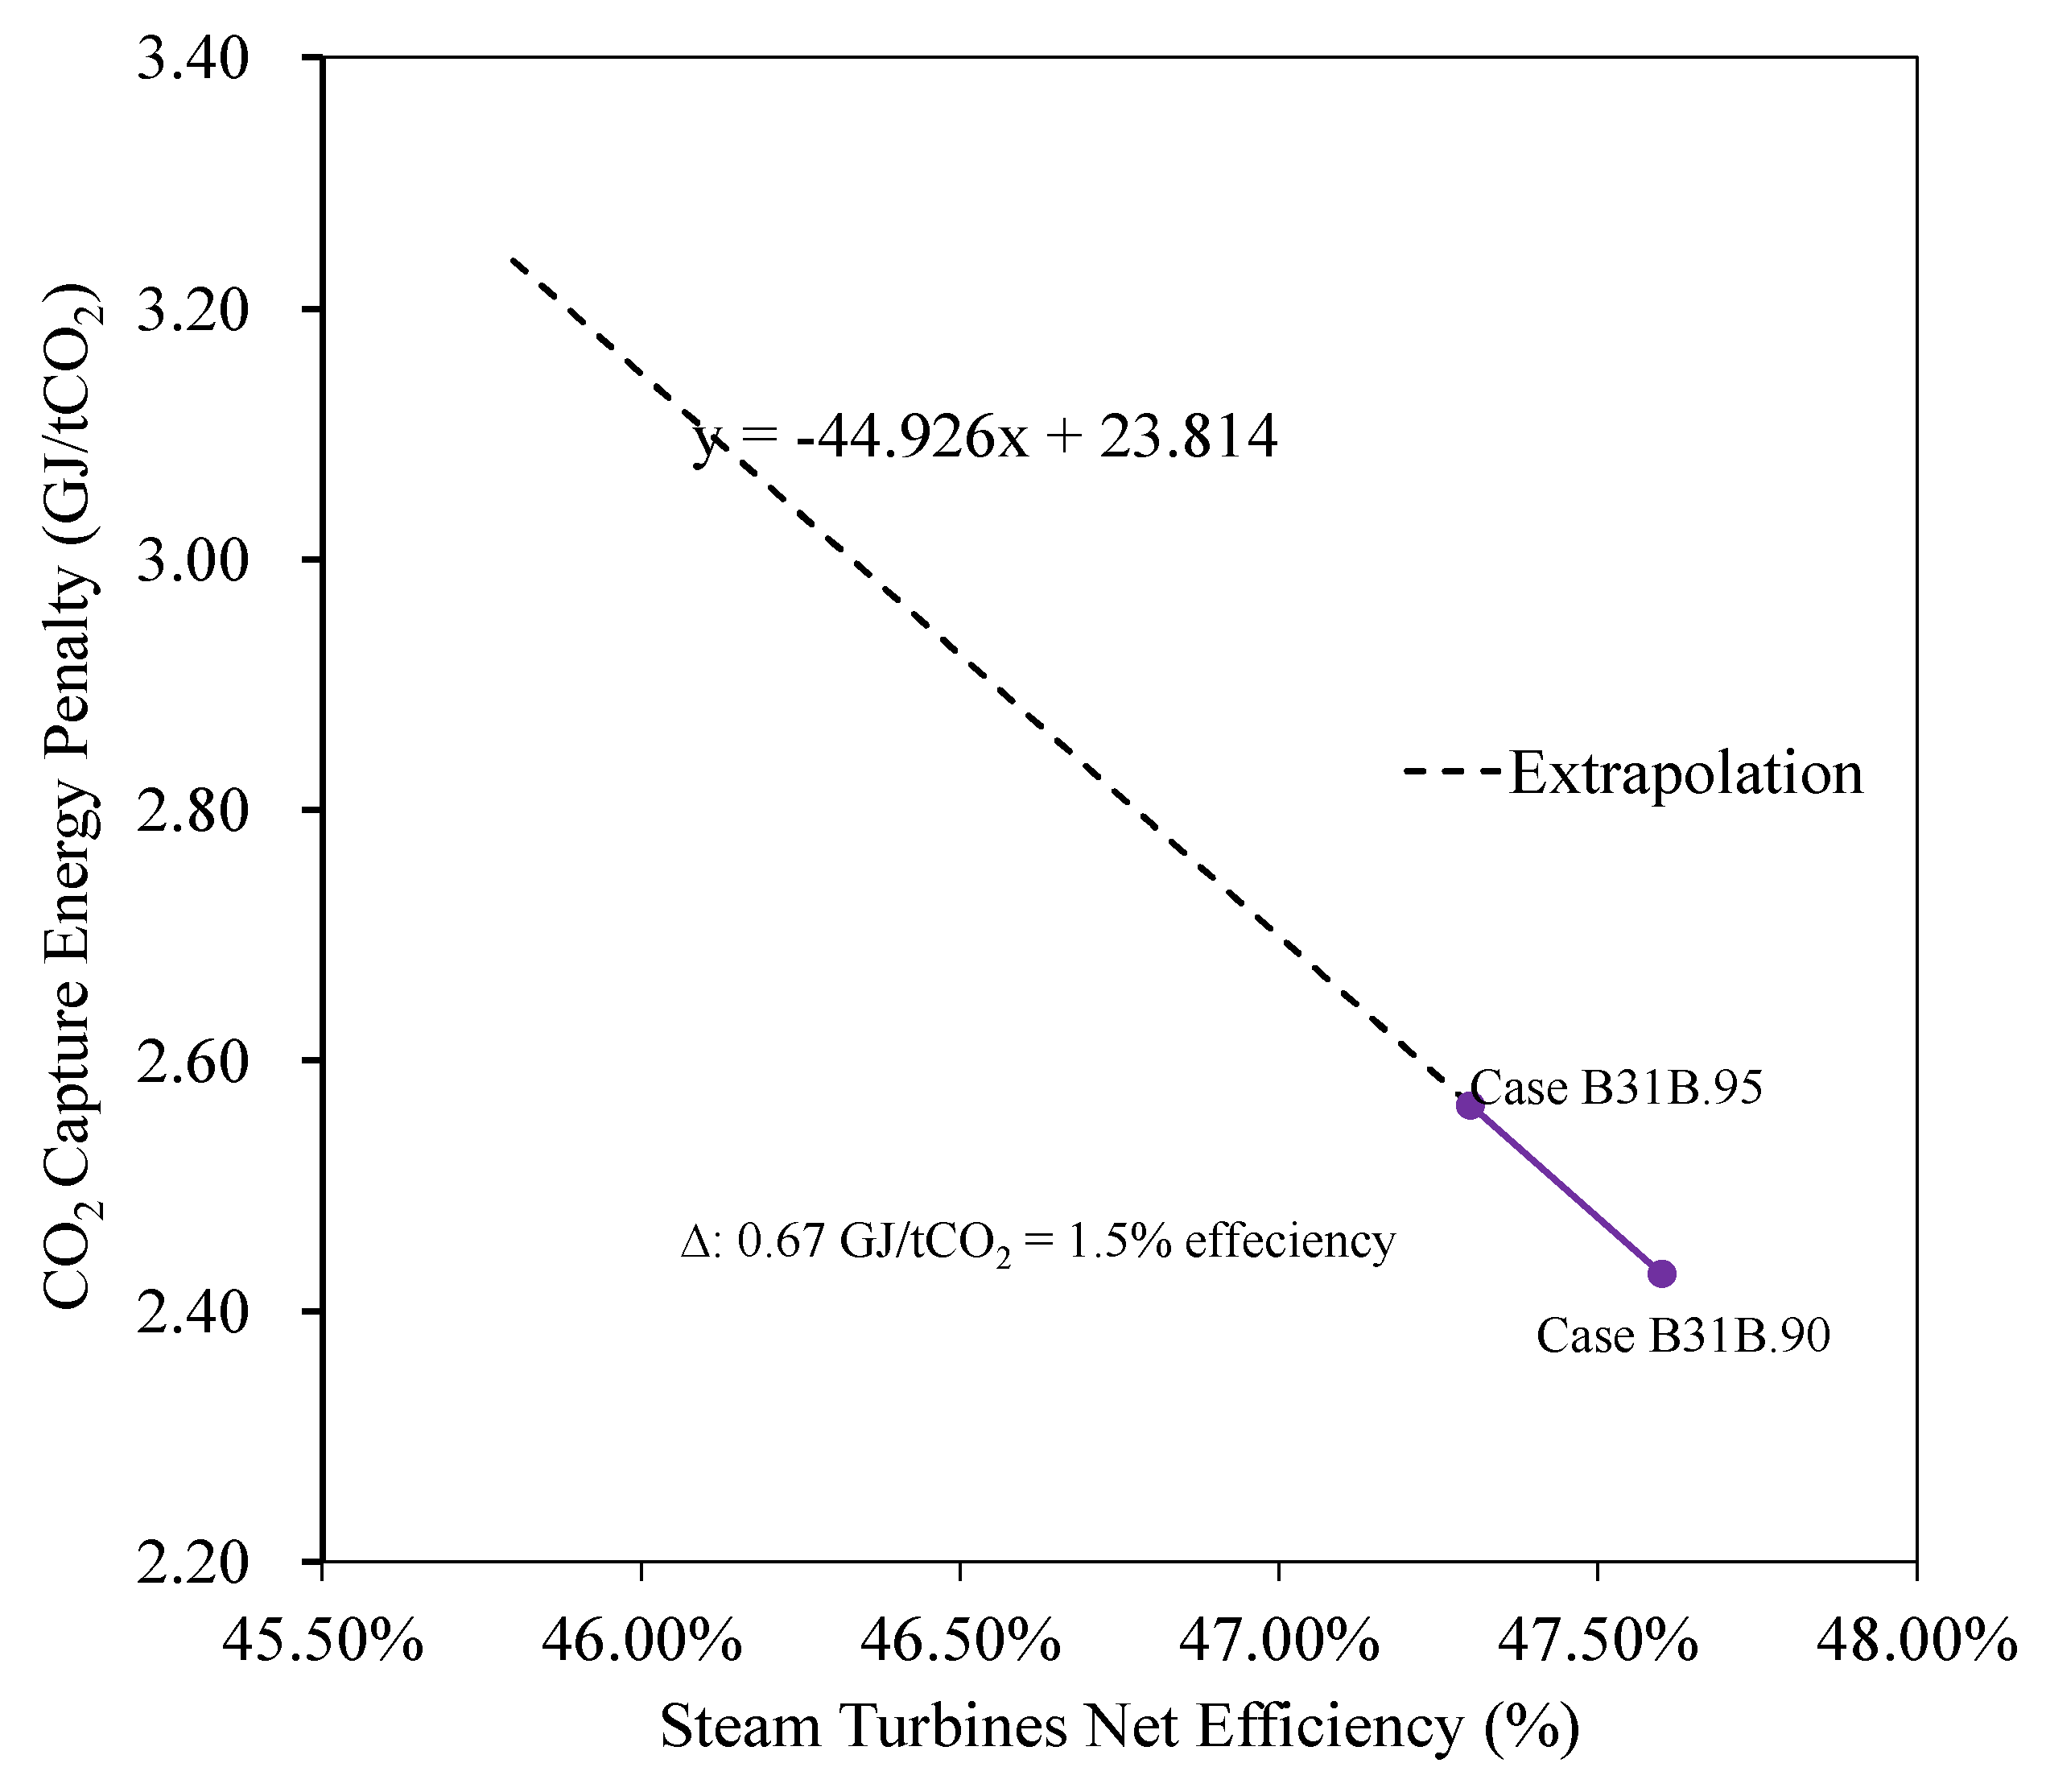
Heat balance calculation around the CO2 capture process indicates that the required regeneration energy for case B31B90 is 2.43 GJ/tCO2 (vs. 2.56 GJ/tCO2 for case B31B95). This is low compared to the reported values for conventional amine-based solvents, ranging between 3 and 5 GJ/tCO2 [29]. In this work, a baseline simulation model of the CO2 capture facility is developed using the conventional MEA solvent (CAS#:141-43-5). MEA is usually used as a benchmark for building case studies, and its property package is predefined on the Aspen Plus® database. Cansolv Technologies Inc. claimed the use of a trade secret chemical formula of an amine solvent. The two presented cases from the DOE/NETL report [23] are used mainly to aid in evaluating the change in the efficiency of the LP turbine in correlation to the regeneration duty, as shown in Figure 2. Extrapolation is used here to eliminate the need to simulate the NGCC plant on Aspen Plus, as the LP turbine is the only component that is tied to the CO2 capture facility. Knowing efficiency is important in determining the cost of electricity. For a detailed mass and heat balance of cases B31B90 and B31B95, please refer to Exhibits 5–21 and 5–35, respectively [23].
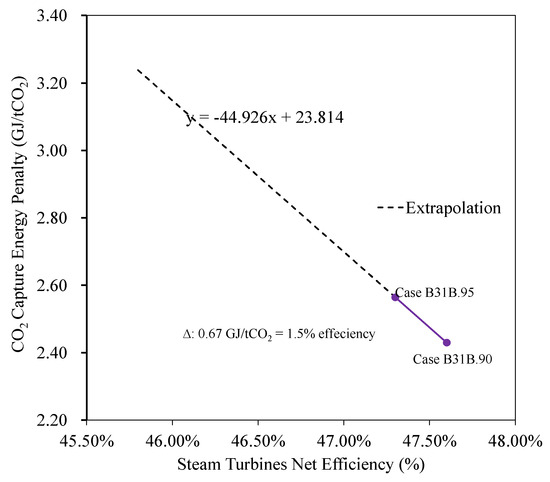
Figure 2.
Extrapolated efficiency against the change in regeneration energy from reported data for cases B31B90 and B31B95.
2.2. Cost Model
TEA was developed following NETL’s Quality Guidelines [19], which include equipment selection, sizing, costing, and estimation of the overall capital cost and operating costs. The dollar value of the plant is in United States Dollar (USD). The cost of each piece of equipment was determined from the Aspen Process Economic Analyser™ (APEA) software quoting database in 2022 dollars.
The total investment cost required to build the facility was calculated by first evaluating the Bare Erected Cost (BEC) and Engineering, Procurement, and Construction (EPC) cost, and then including the process and project contingencies. The construction labor required for installation was included. The following equations are used to estimate the BEC and EPC:
where construction hours (hours) are for installing unitary equipment, NE is the number of units per equipment, Nw is the number of constructors, CostE is the equipment cost, and CostM is the material cost, including piping, civil, steel, instrumentation, insulation, and paint. An average labor rate (labor wage) of $36/h was estimated from the Aspen database. Construction hours are determined based on equipment size and complexity. IFC is the indirect field cost, which represents a 10% share of BEC. EC is the engineering cost and represents a 5% share of BEC.
Labor cost = Construction hours × Labor wage × NE × Nw
BEC = Labor cost + CostE × NE + CostM
EPC = IFC + EC
The contingency included in the cost estimate is based on the risk management or estimating judgment process. The following contingencies are included in the cost estimate. Process contingency is defined as 15%, and project contingency is 23% of the total cost of EPC and BEC based on data from the DOE/NETL report case B31B95 [23]. The process and project contingencies are added to BEC and EPC costs to estimate the total investment cost (TIC) as follows:
TIC = (BEC + EPC) × (100% + ProcessC + ProjectC)
TIC of the CO2 capture unit is added to the TIC of the NGCC case B31A [23] to evaluate the CO2 avoided cost and LCOE. Heat and electric requirements are subtracted from the gross electricity generation to determine the avoided cost based on net power generated.
3. Results and Discussions
3.1. Baseline Design
3.1.1. Influence of Design Parameters on CO2 Capture Performance
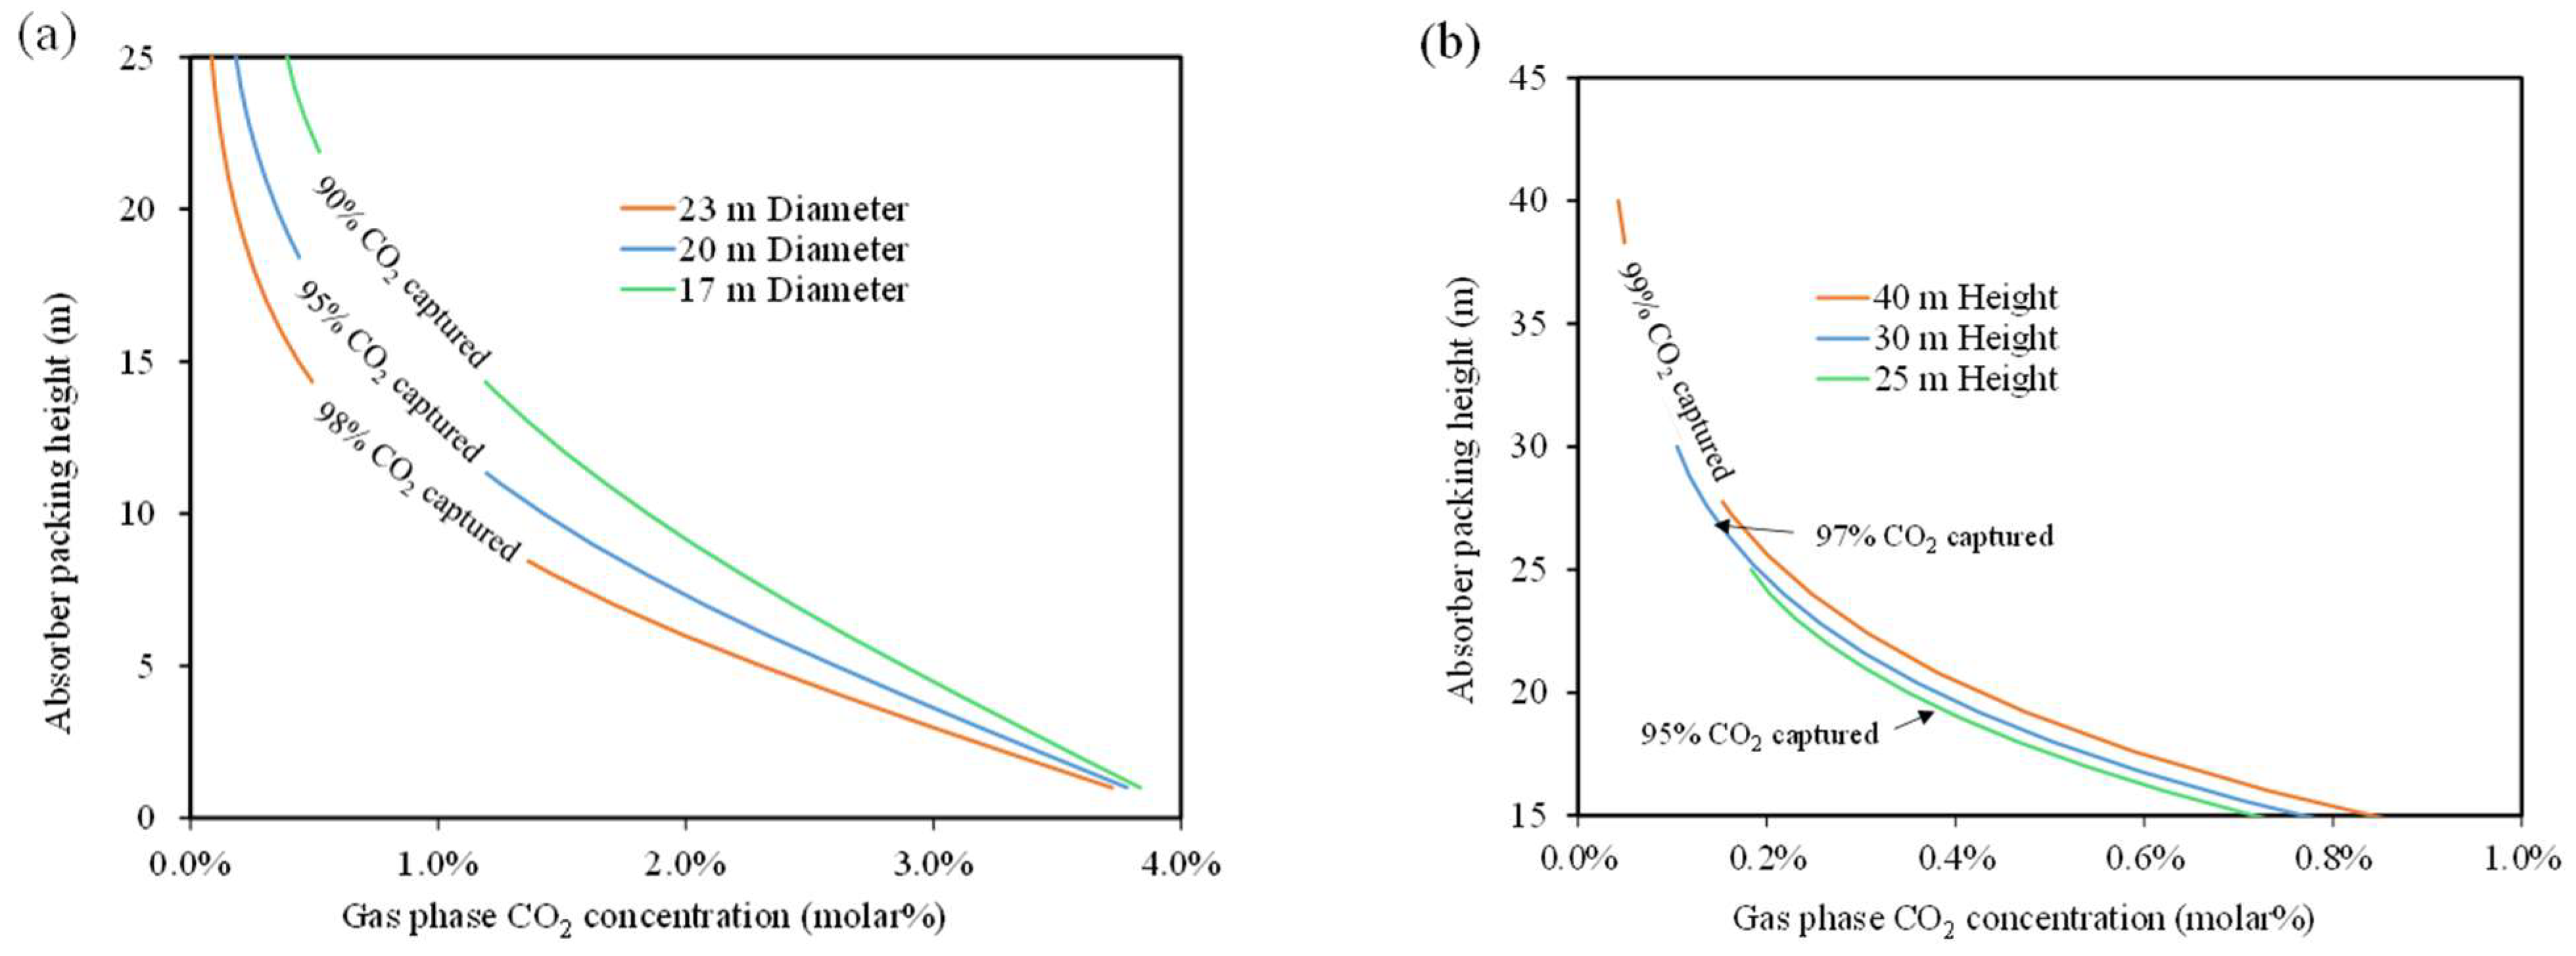
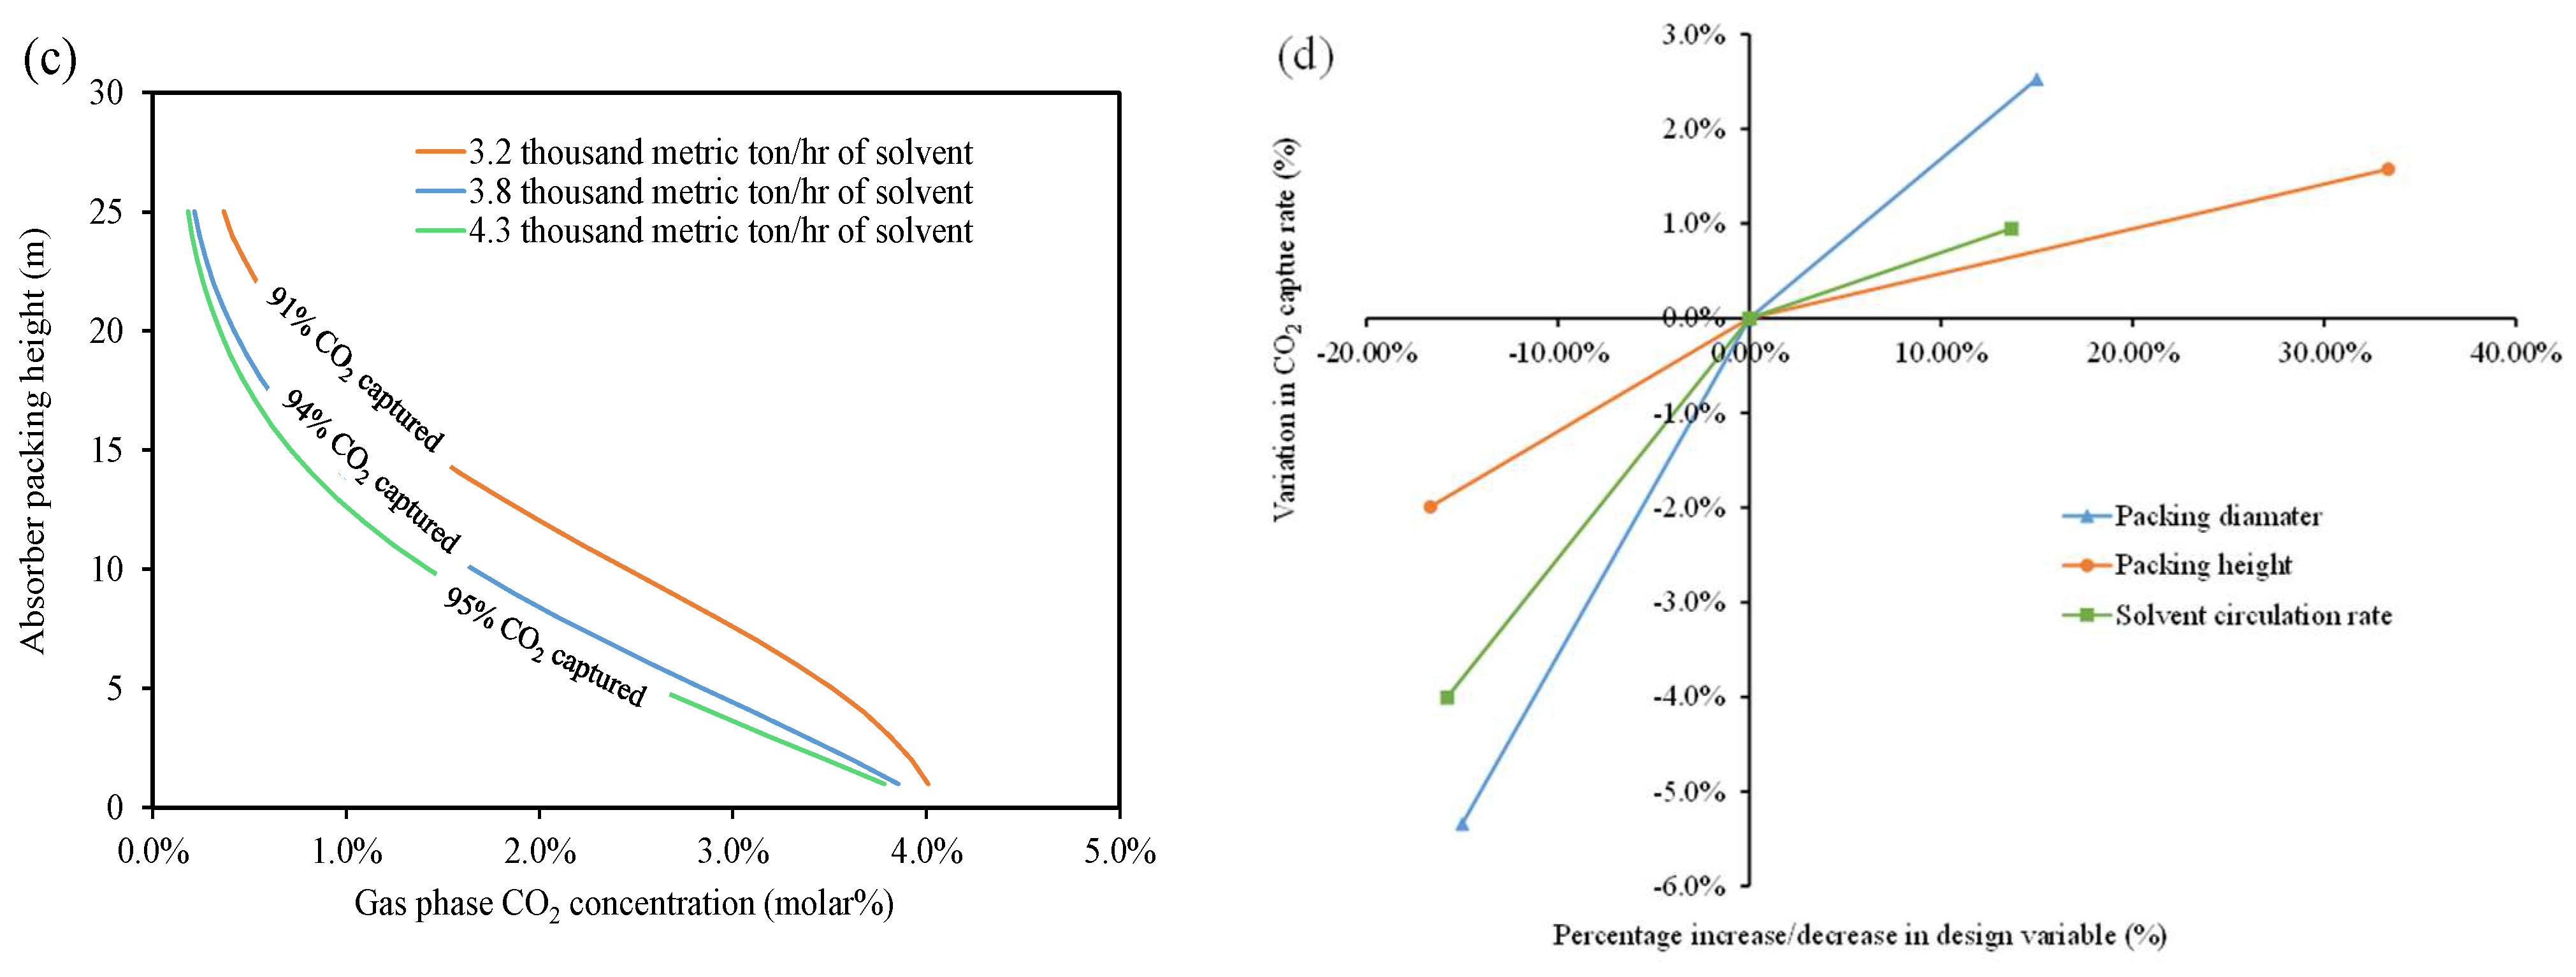
The results of the sensitivity analysis performed on the CO2 lean loading are illustrated in Figure 3, showing the change in the CO2 concentration profile in the flue gas stream along the height of the absorption columns for different concept scenarios. Trend analysis reveals that absorption performance relies strongly on the packing diameter of the absorber. Increasing the packing diameter from 17 m to 20 m enhanced the capture rate by 5% (Figure 3a). Further increase in diameter to 2 m resulted in a similar positive impact but at a lower rate of improvement. The packing height generated a modest improvement of 5% capture rate through doubling it from 25 to 40 m (Figure 3b). The same trend was observed with varying solvent circulation rates, but with the least remarkable improvement (Figure 3c). This confirms that all the investigated parameters are important to consider in defining the optimal combination. A more proper quantification of the effects is shown in Figure 3d, where the percentage variation in CO2 capture rate is calculated across −20% to 30% of relative percentage change in design parameters. The baseline case is defined by 20 m of absorber packing diameter, 25 m of absorber packing height, and 3.8 thousand metric tons/h of solvent circulation rate. Packing diameter and solvent circulation rate are observed to have a stronger influence on the capture rate at low and high limits, while the impact of the packing height is relatively less significant. Wider diameters contribute to lowering the velocity of gas, which in turn increases the contact time with the solvent; however, any benefits gained from a height increase are restricted by the chemical characteristics of the interacting medium, including a decrease in reaction rates at low CO2 profiles in gas as height is extended.
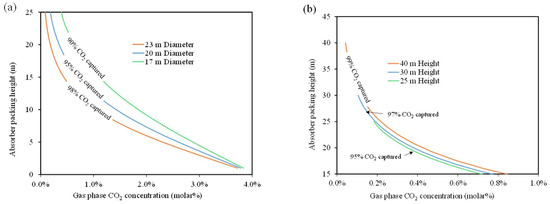
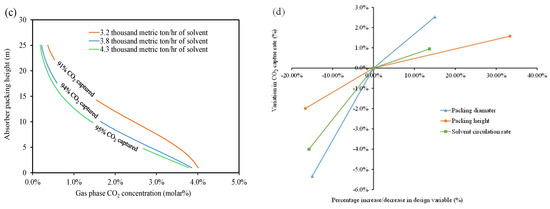
Figure 3.
Effect of design parameters of CO2 capture facility on the capture rate: (a,b) effect of absorber dimensions, (c) effect of solvent circulation rate, (d) magnitude of sensitivity.
The stripper is easier to simulate and design compared to the absorber. Here, the degree of freedom on the manipulated variables is reduced compared to the absorber. The solvent circulation rate has already been analyzed for designing the absorber column, which left control focused on finding the best representative parameter to minimize the re-boiler duty. In this regard, the concentration of MEA in the circulated solvent is identified to be the best candidate with an anticipated large impact on the reboiler duty because it introduces a change in the loading capacity of the solvent. Figure 4a shows the results of varying the concentration of MEA in the lean solvent on the reboiler duty. It is important to point out that the operating constraints for the performed sensitivity are fixed at a 95% capture rate and 100% CO2 recovery. The investigated values of the CO2 concentration are chosen within the allowable range of 27 wt.% to 32 wt.% to avoid the convergence problem of the absorber and stripper hydrodynamics equilibrium. MEA concentration of 30 wt.% (at 2820 metric tons/h solvent circulation rate) is identified as an optimal value to achieve the lowest reboiler duty of 4.62 GJ/tCO2. Considering the influence of a lower limit in MEA concentration, 27 wt.% (equivalent to 357 molCO2/molMEA) increases the solvent circulation rate from 2820 to 3240 metric tons/h to guarantee the same CO2 capture rate. This act requires less heat for CO2 desorption but more heat penalty for raising the temperature of the water solvent (4.8 GJ/tCO2). Two aspects of heat are supplied during regeneration, namely, the sensible and latent heat of solvent and the heat of reaction necessary to strip CO2 off. With the increase in the proportion of water solvent due to dilution, the sensible heat and latent heat simply cause more energy consumption. Alternatively, CO2 loading of 0.376 molCO2/molMEA is achieved at a higher concentration of 32 wt.%. Enhanced loading does not always imply lower energy consumption. If the loading is too high, a lower solvent circulation rate than the minimum threshold requires a higher vapor temperature from the reboiler to supply the same energy for CO2 desorption at a lower MEA concentration. Figure 4b confirms the claim that a high-temperature profile of 115 °C along 70% of the stripper packing height (14 m) is needed to sustain the generation of a high CO2 loading case at 32 wt.% MEA concentration, while a 30 wt.% MEA concentration requires 15% less packing height at a vapor temperature of 115 °C. The 27 wt.% MEA cases require lower temperatures, but the exchanged heat with the large circulation rate wins. Schach et al. [20] reported a similar trend in energy and cost of capture with respect to the lean solvent loading.

Figure 4.
(a) Change in reboiler duty as a function of the CO2 loading. (b) temperature profile along the stripper height at different MEA concentrations in lean solvent.
3.1.2. Optimization of Baseline Design
Optimization is performed to search absorber packing dimensions (height and diameter) at a minimum solvent circulation rate, targeting a constraint of 95% CO2 capture and less than 70% approach to flooding. The simulation model was initially based on an estimated solvent circulation rate derived from the DOE/NETL B31B90 case study. Because there are no existing CO2 capture systems of comparable scale (e.g., the Cansolv system is roughly five times smaller), it was necessary to optimize the design dimensions in a practical and constrained manner. Table 2 demonstrates how these optimization adjustments are performed and lists the constraints used in the optimization task. Upsizing the column volume was found to be a general rule to meet the contact time at a lower solvent circulation rate. These results are used to finalize the baseline design.

Table 2.
Optimization scheme of the baseline design.
3.2. Design Performance of LVC and FGC Configurations
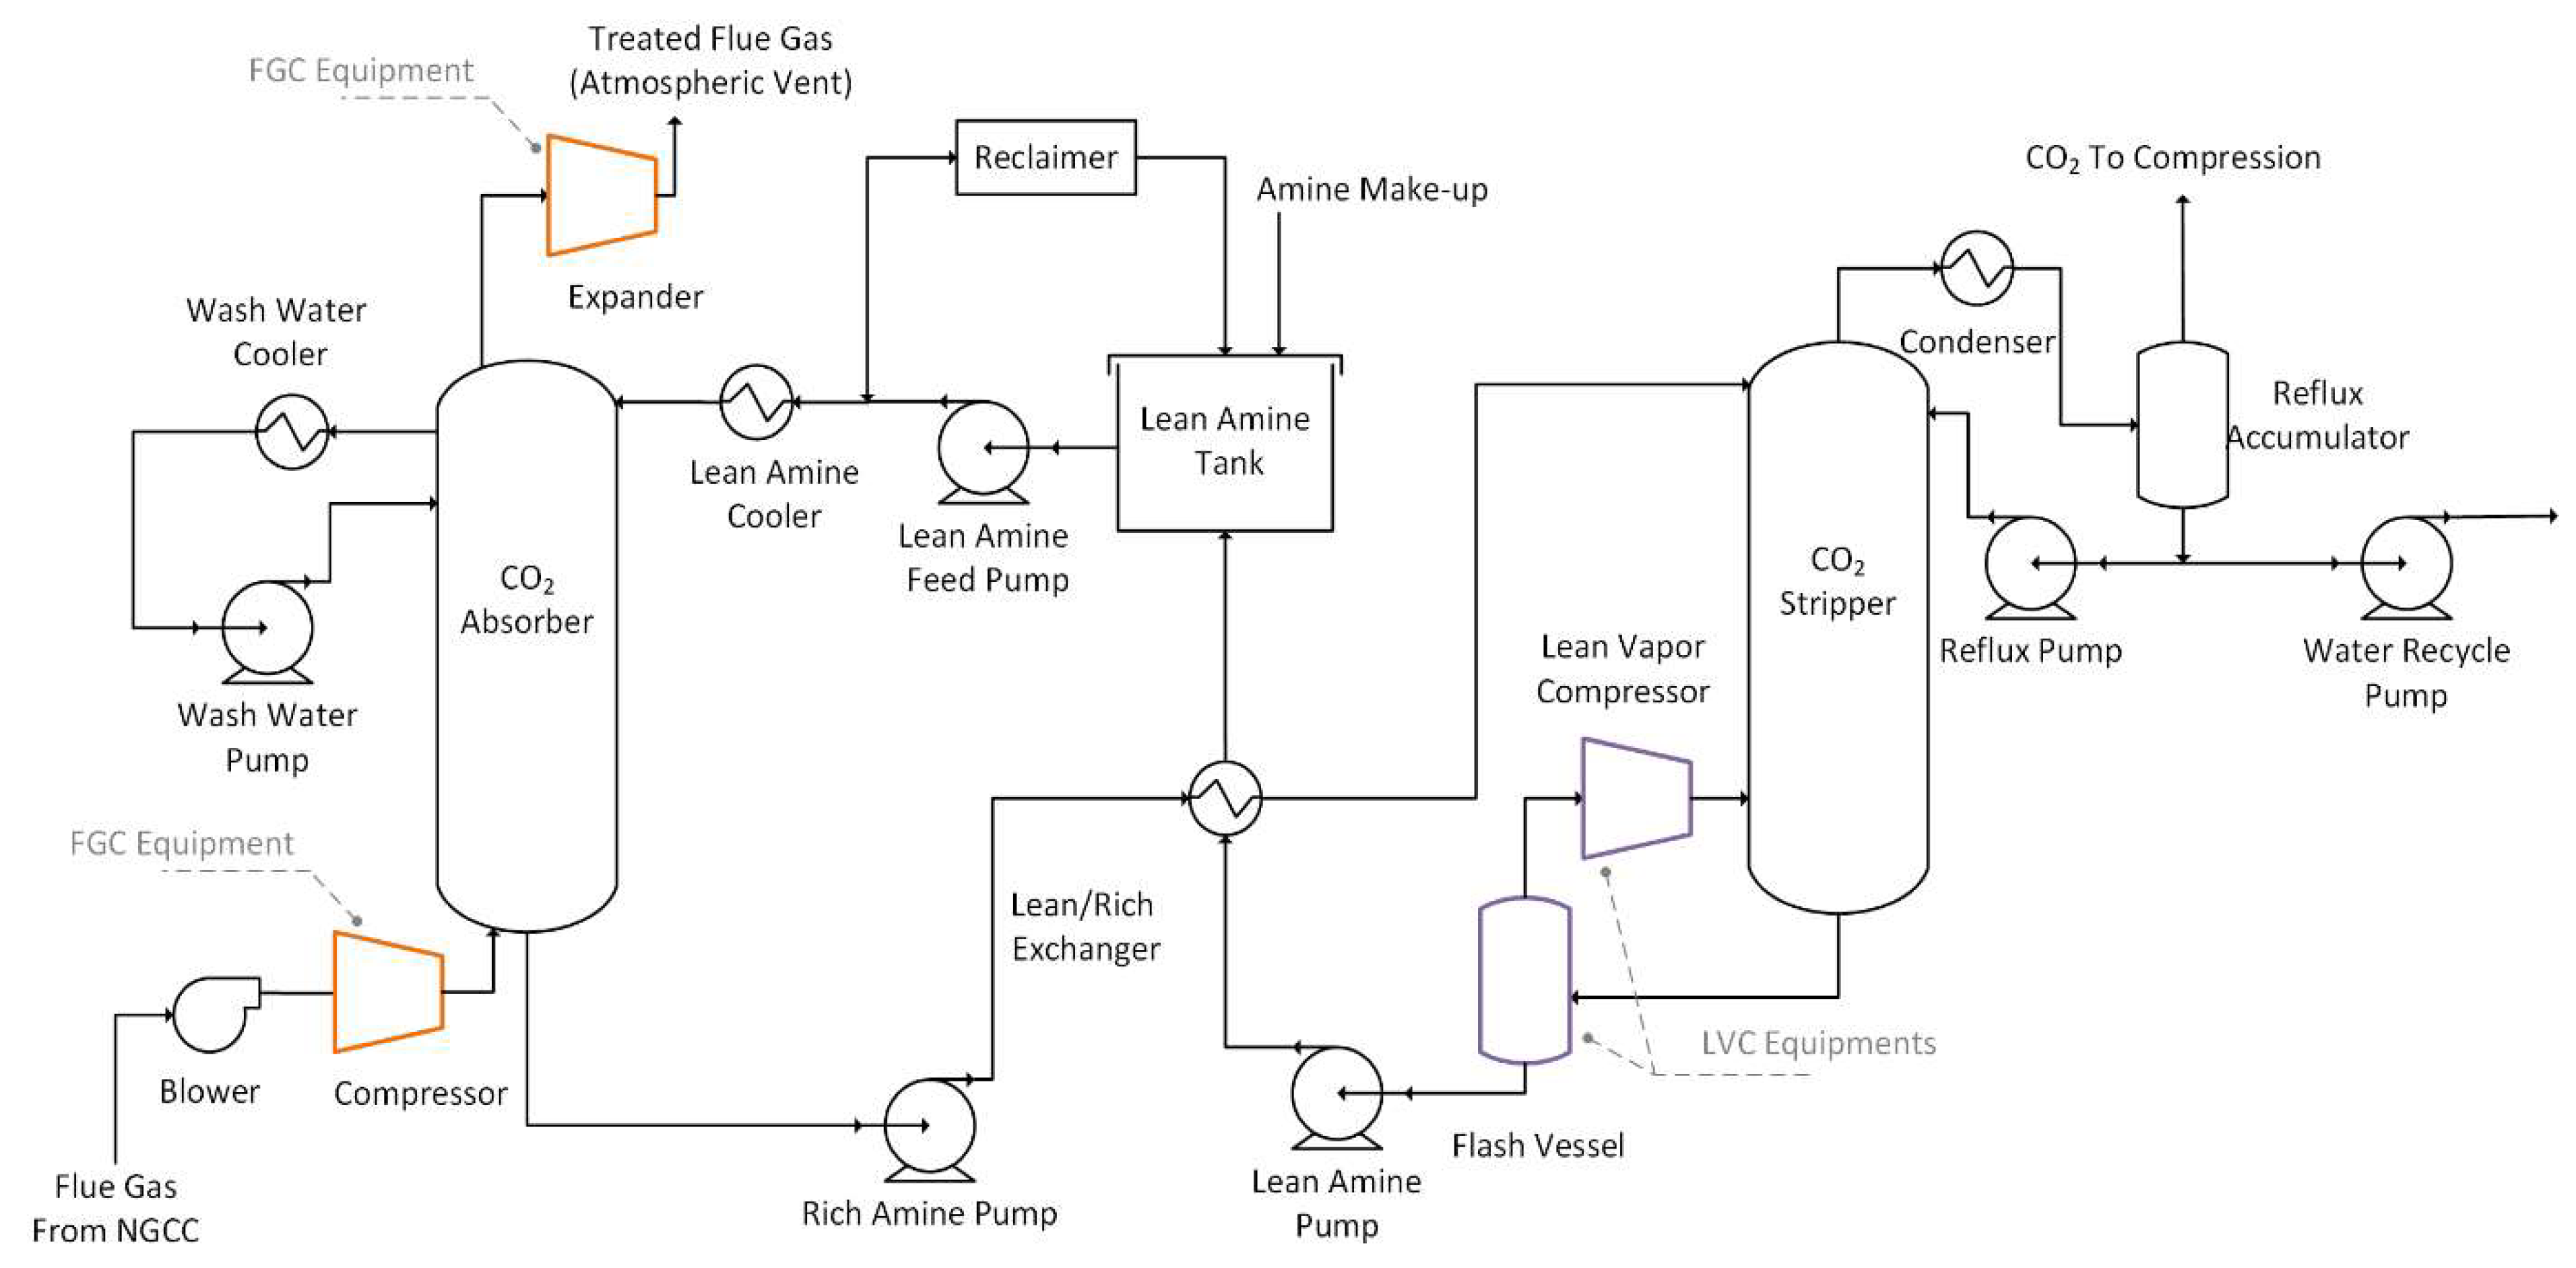
Mass transfer is defined as a major limiting factor in advancing the kinetic improvement for the solvent-based CO2 capture process. The proposed FGC solution comprises the injection of a pressurized flue gas stream to create a larger partial pressure gradient of CO2 between the gas and circulating solvent in the absorber. This helps keep the circulation rate of the solvent low enough to promote the reduction in the reboiler duty. Figure 5 illustrates a detailed scheme of the FGC design.
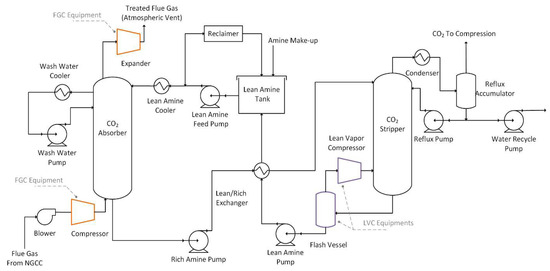
Figure 5.
Schematic process flow sheet of process intensification through separate integration of flue gas compression (FGC) and lean vapor compression (LVC) techniques.
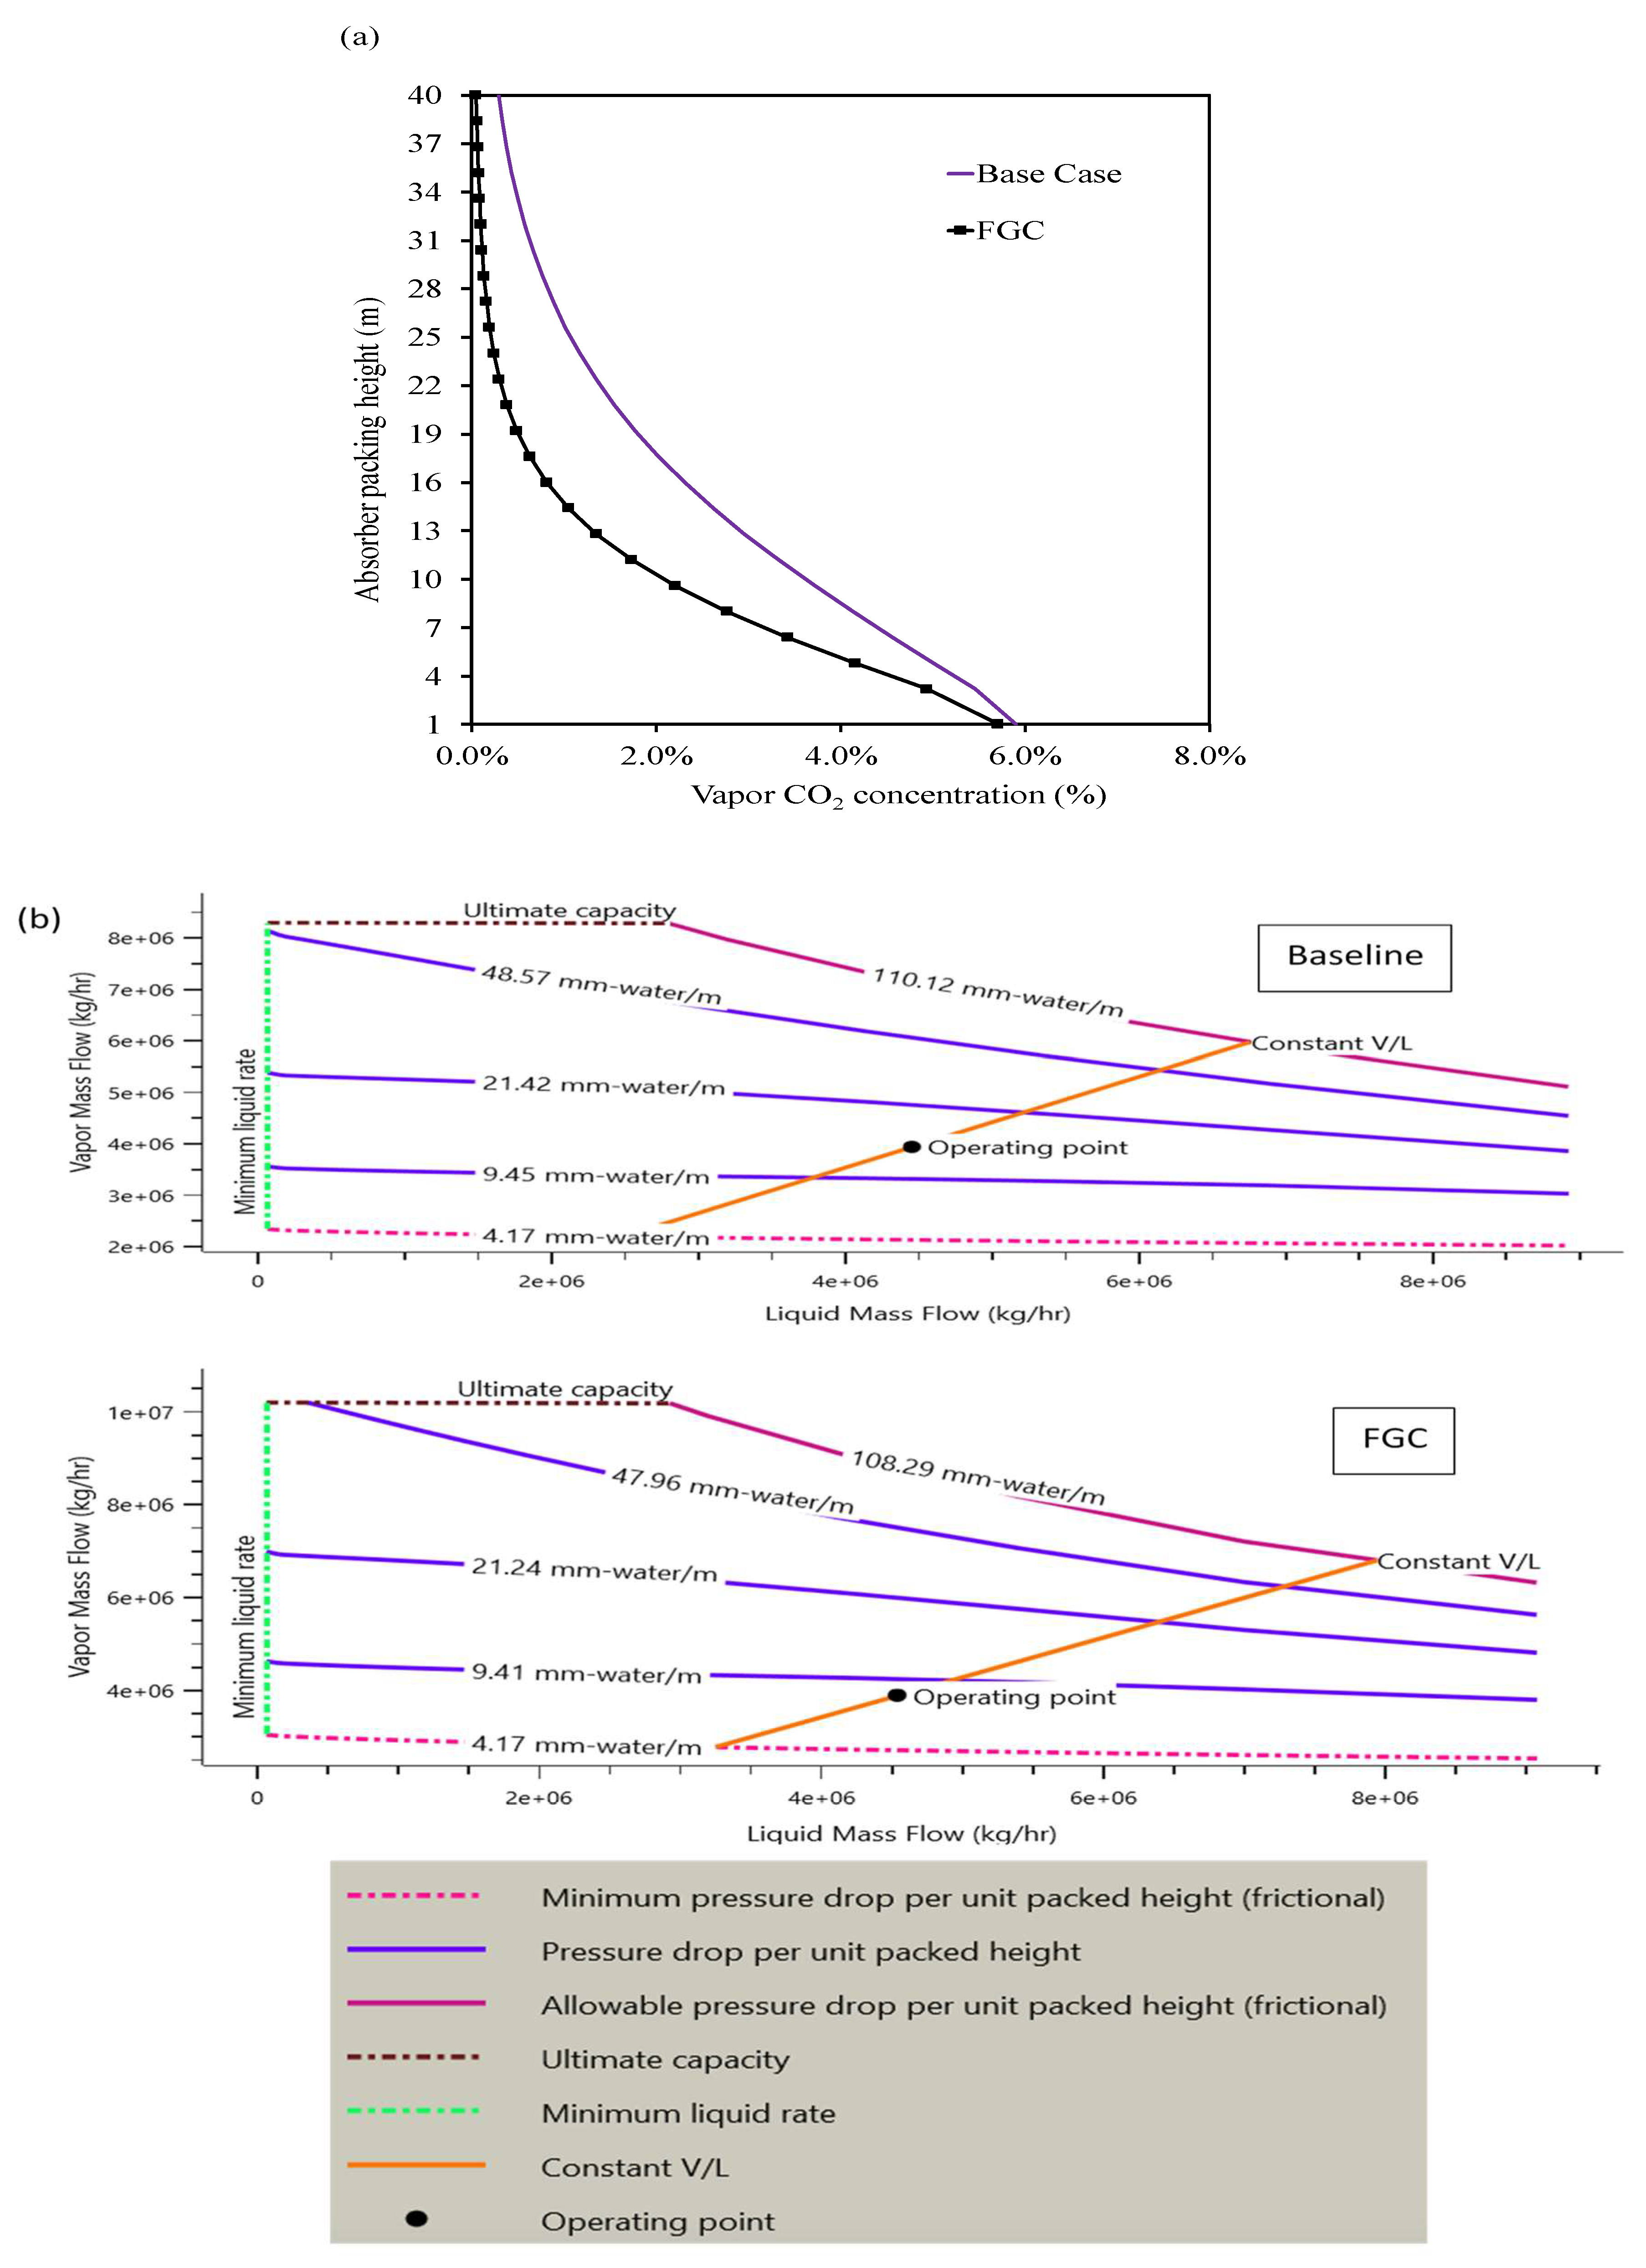
The flue gas is compressed from 1.08 bara to 2 bara at the inlet of the absorber. The lean solvent is pumped at a similar high pressure to prevent liquid holdup. The clean gas at the outlet of the absorber is expanded for partial recovery of the electric energy supplied to the compression station. As a result of this modification, a higher capture rate of 99.15% is achieved (vs. 95.44% for the baseline design). Figure 6a,b illustrate the CO2 concentration and mass flow rate profiles for the FGC case. 95% of the capture rate is achieved early, at half of the total height of the absorber. This can heavily cut the investment cost and reboiler duty. This jump in absorption performance is attributed to the enhanced hydrodynamic characteristics of the absorber. The increase in flue gas density reduces the pressure drop across the packing. In Figure 6b, the hydrodynamic output graph from Aspen’s rate-based design for absorption columns shows that the stage-wise pressure drop is a key feature of the column’s hydrodynamics, which helps in assessing flow feasibility without encountering liquid jet formation at high pressures or weeping at lower pressures. The hydrodynamic results from both the baseline and the optimized designs clearly demonstrate that the column’s operating point has shifted towards regions with lower pressure drops, thereby enhancing mass transfer by prolonging the residence time.
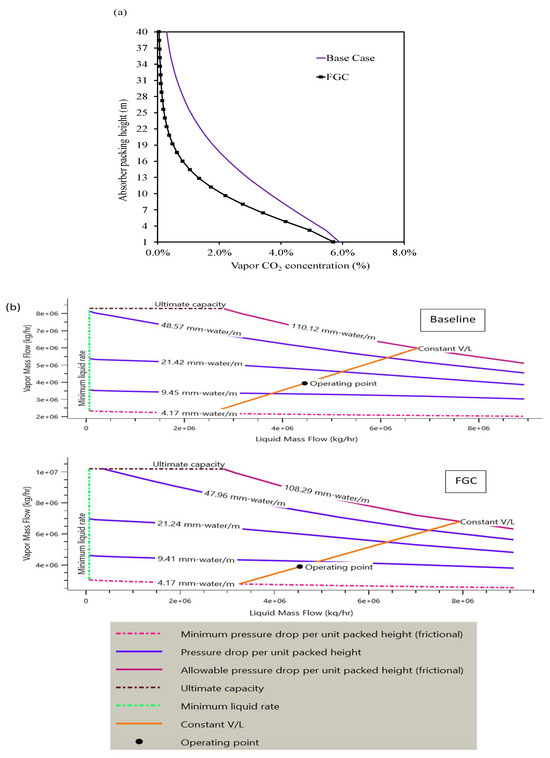
Figure 6.
FGC: (a) CO2 concentration profile, (b) determined sweet spot of absorber operation from hydrodynamic study.
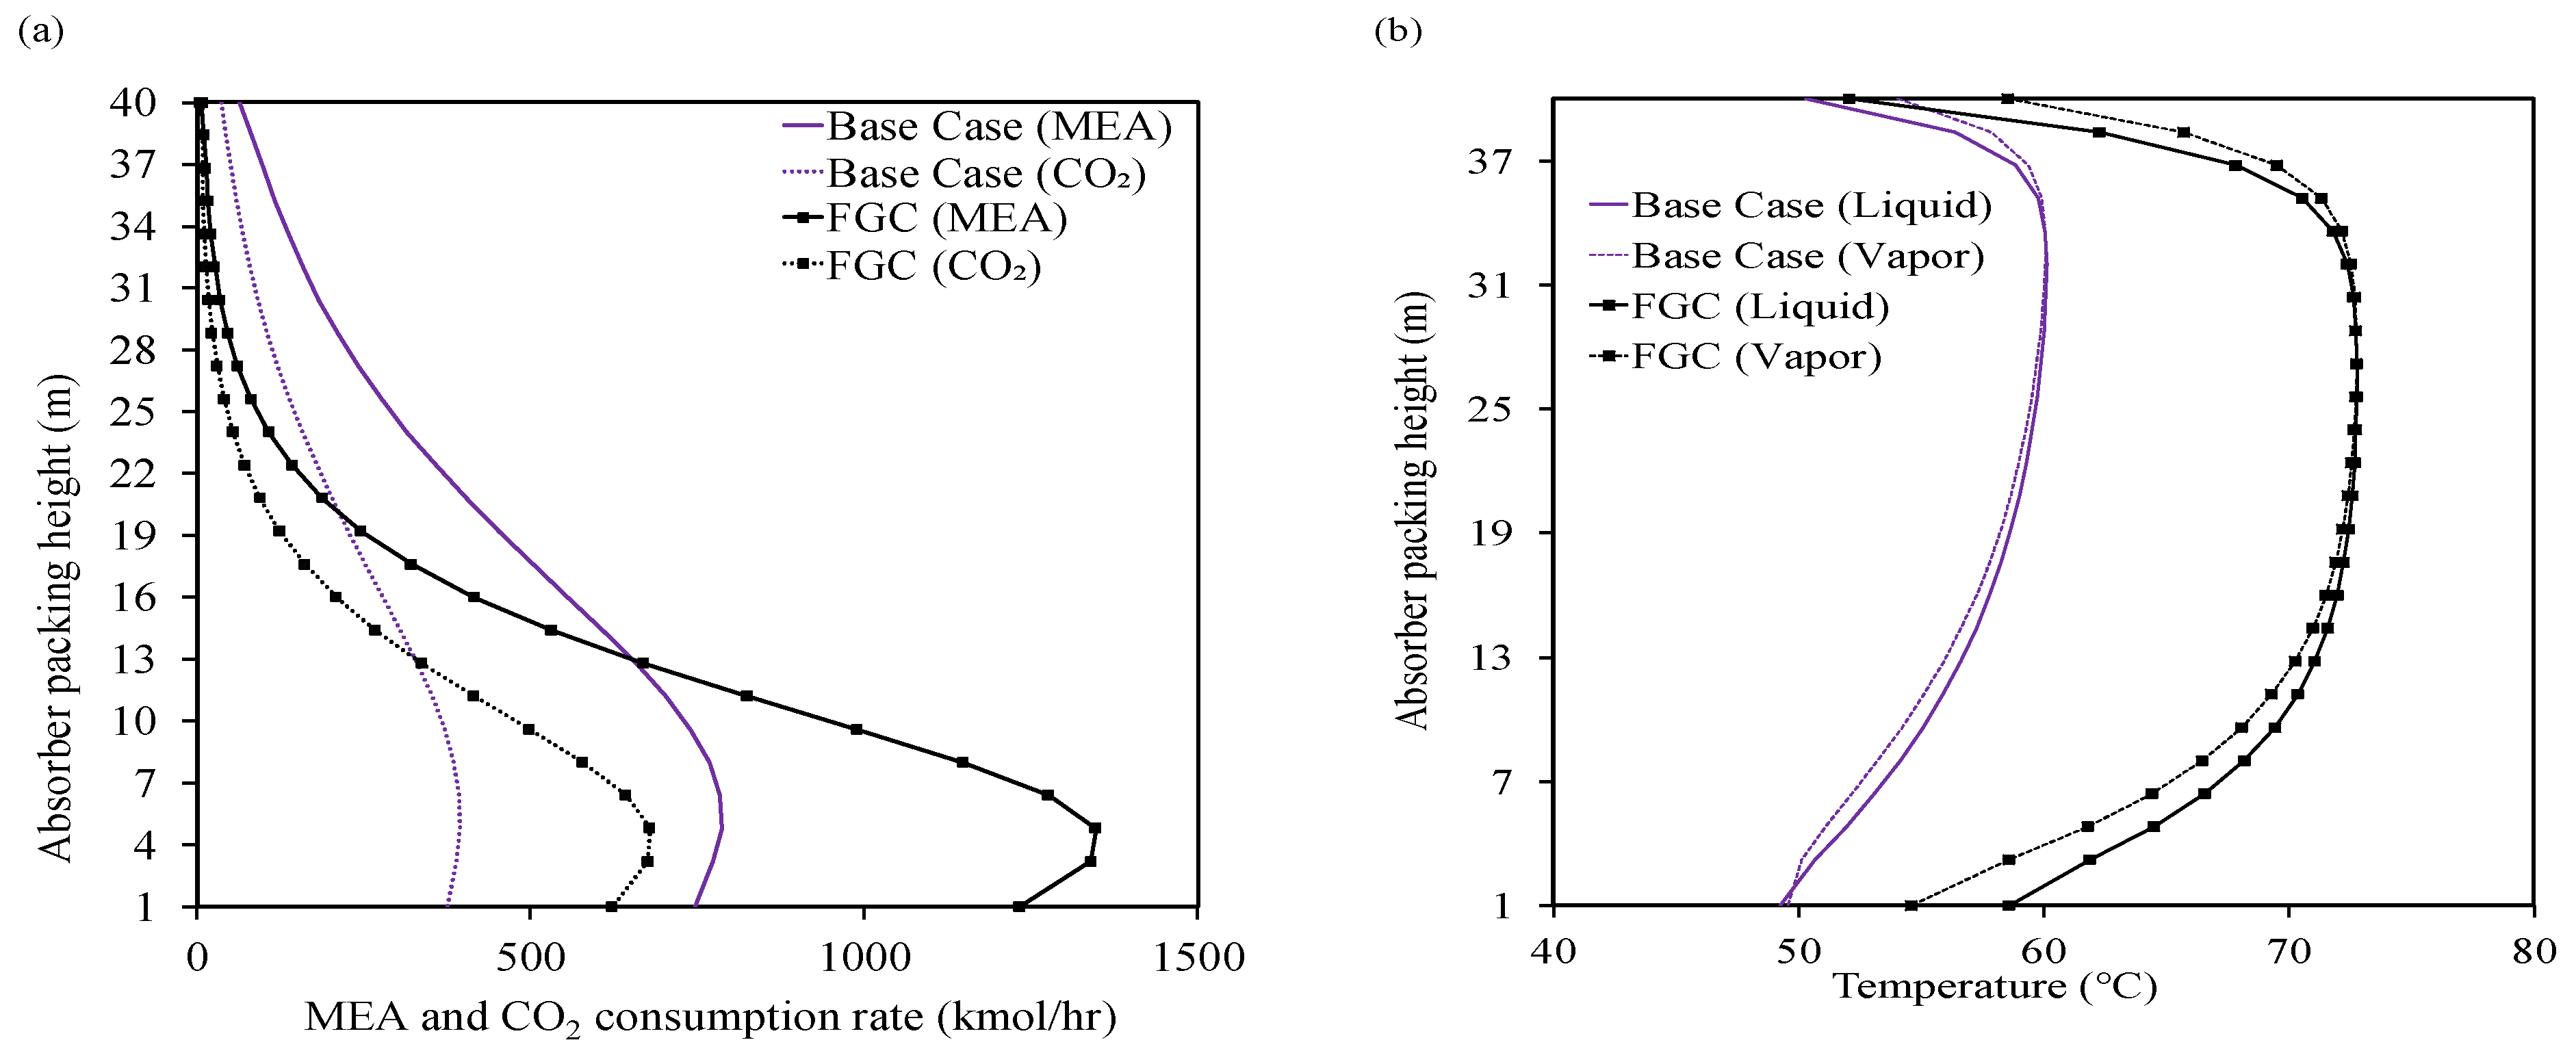
The results of the absorption kinetics related to FGC design are compared with those of the baseline design in Figure 7a. The very rapid consumption of MEA and CO2 at the initial meters of the absorber height explains the high capture performance observed in Figure 6. High CO2 partial pressure favored the absorption kinetics, which peaked at the first 13 m of absorber height and started slowing down sharply with complete absorption of CO2 from the gas phase at 19 m of the absorber height. This effect is also seen on the temperature profile in Figure 7b, with temperatures surpassing 70 °C due to the high exothermicity of CO2 absorption.
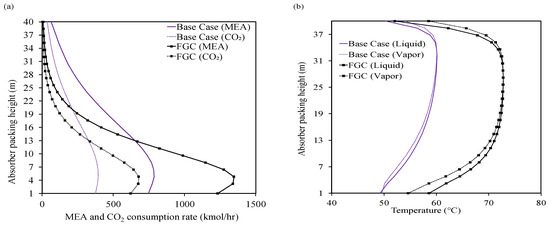
Figure 7.
FGC: (a) absorption kinetic profile, (b) temperature profile.
The principle of LVC involves heat integration via vapor compression of flashed lean solvent coming out of the reboiler. The pressurized vapor is reinjected into the stripper column to aid CO2 desorption, thus reducing the load on the reboiler. Figure 5 illustrates a detailed scheme of the LVC design. The integration resulted in an 18% reduction in reboiler duty compared to the baseline design at the same capture rate of 95%.
3.3. Energy Saving of LVC and FGC Configurations
Equipping the NGCC power plant with a CO2 capture facility significantly influences the net power output. Energy balance and distribution over the simulated cases are compared to the commercial Cansolv design in Table 3. Both proposed designs, FGC and LCV, introduced a valuable improvement to the energy consumption of the baseline design and contributed by 25.5% and 15.4%, respectively, to a reduction in the reboiler duty. This impact reduced the load on the steam cycle and improved the turbine efficiency. However, the Cansolv design claims a much lower reboiler duty that is proprietary to the effectiveness of the solvent use and the undisclosed process design. The overall CO2 capture load must be expanded to include the electric power consumption. This involves the determination of the auxiliary equipment duty for each simulated design. Simulation results indicate that the FGC design exhibits the highest electric power consumption with 92 MWe, followed by LCV 34.8 MWe, and then the baseline design 30.1 MWe. Cansolv is not included in the comparison due to limited accessibility to details on power consumption. The amount of improvement in the reboiler duty for FGC comes at the cost of double the original load of the entire CO2 capture process. The high load is attributed to flue gas compression, which consumes alone five times the power consumed for CO2 consumption. Even though an expanded is used to recover over twice the energy consumed throughout compression, accounting for pressure drop along the absorber column. The reduction in reboiler duty using this design obscures the high power consumption, making it an option to avoid. In contrast, LVC power consumption slightly increased with respect to the baseline design, allowing better valorization of the 15.4% reduction in reboiler duty. The net power output of the NGCC power plant using the LCV design reached 615 MWe, sitting higher than that of the baseline design by 10 MWe. This makes the LVC design advantageous and must be considered from the perspective of reducing power consumption.

Table 3.
Energy balance calculation of the different simulated CO2 capture designs and commercially ready Cansolv technology.
3.4. Capital Investment of LVC and FGC Configurations
Table 4 shows the summarized capital costs for the proposed CO2 capture facility designs added to the NGCC power plant cost for annual capture of 1.76 million metric tonne of CO2/year. Capital costs were calculated from the components named equipment cost, material cost, labor cost, bare erected cost, engineering procurement and construction cost, and process and project contingencies, following the calculation method explained in Section 2, with an accuracy range of −15% to 30%. The cost of equipment is obtained using the APEA quoting database. For a fair comparison, Cansolv technology is excluded from evaluation, and only the baseline design is compared to the proposed FGC and LVC designs. For a detailed breakdown of the NGCC cost, refer to the DOE/NETL report [23]. FGC design requires the highest capital investment of $326.7 M due to the installation of a large and expensive compressor. LVC design requires $14 M less investment than FGC.

Table 4.
CO2 capture and NGCC Capital cost breakdown for 1.76 million tonne/year of CO2 capture capacity.
3.5. LCOE and CO2 Avoided Cost for FGC and LVC Versus Literature Configurations
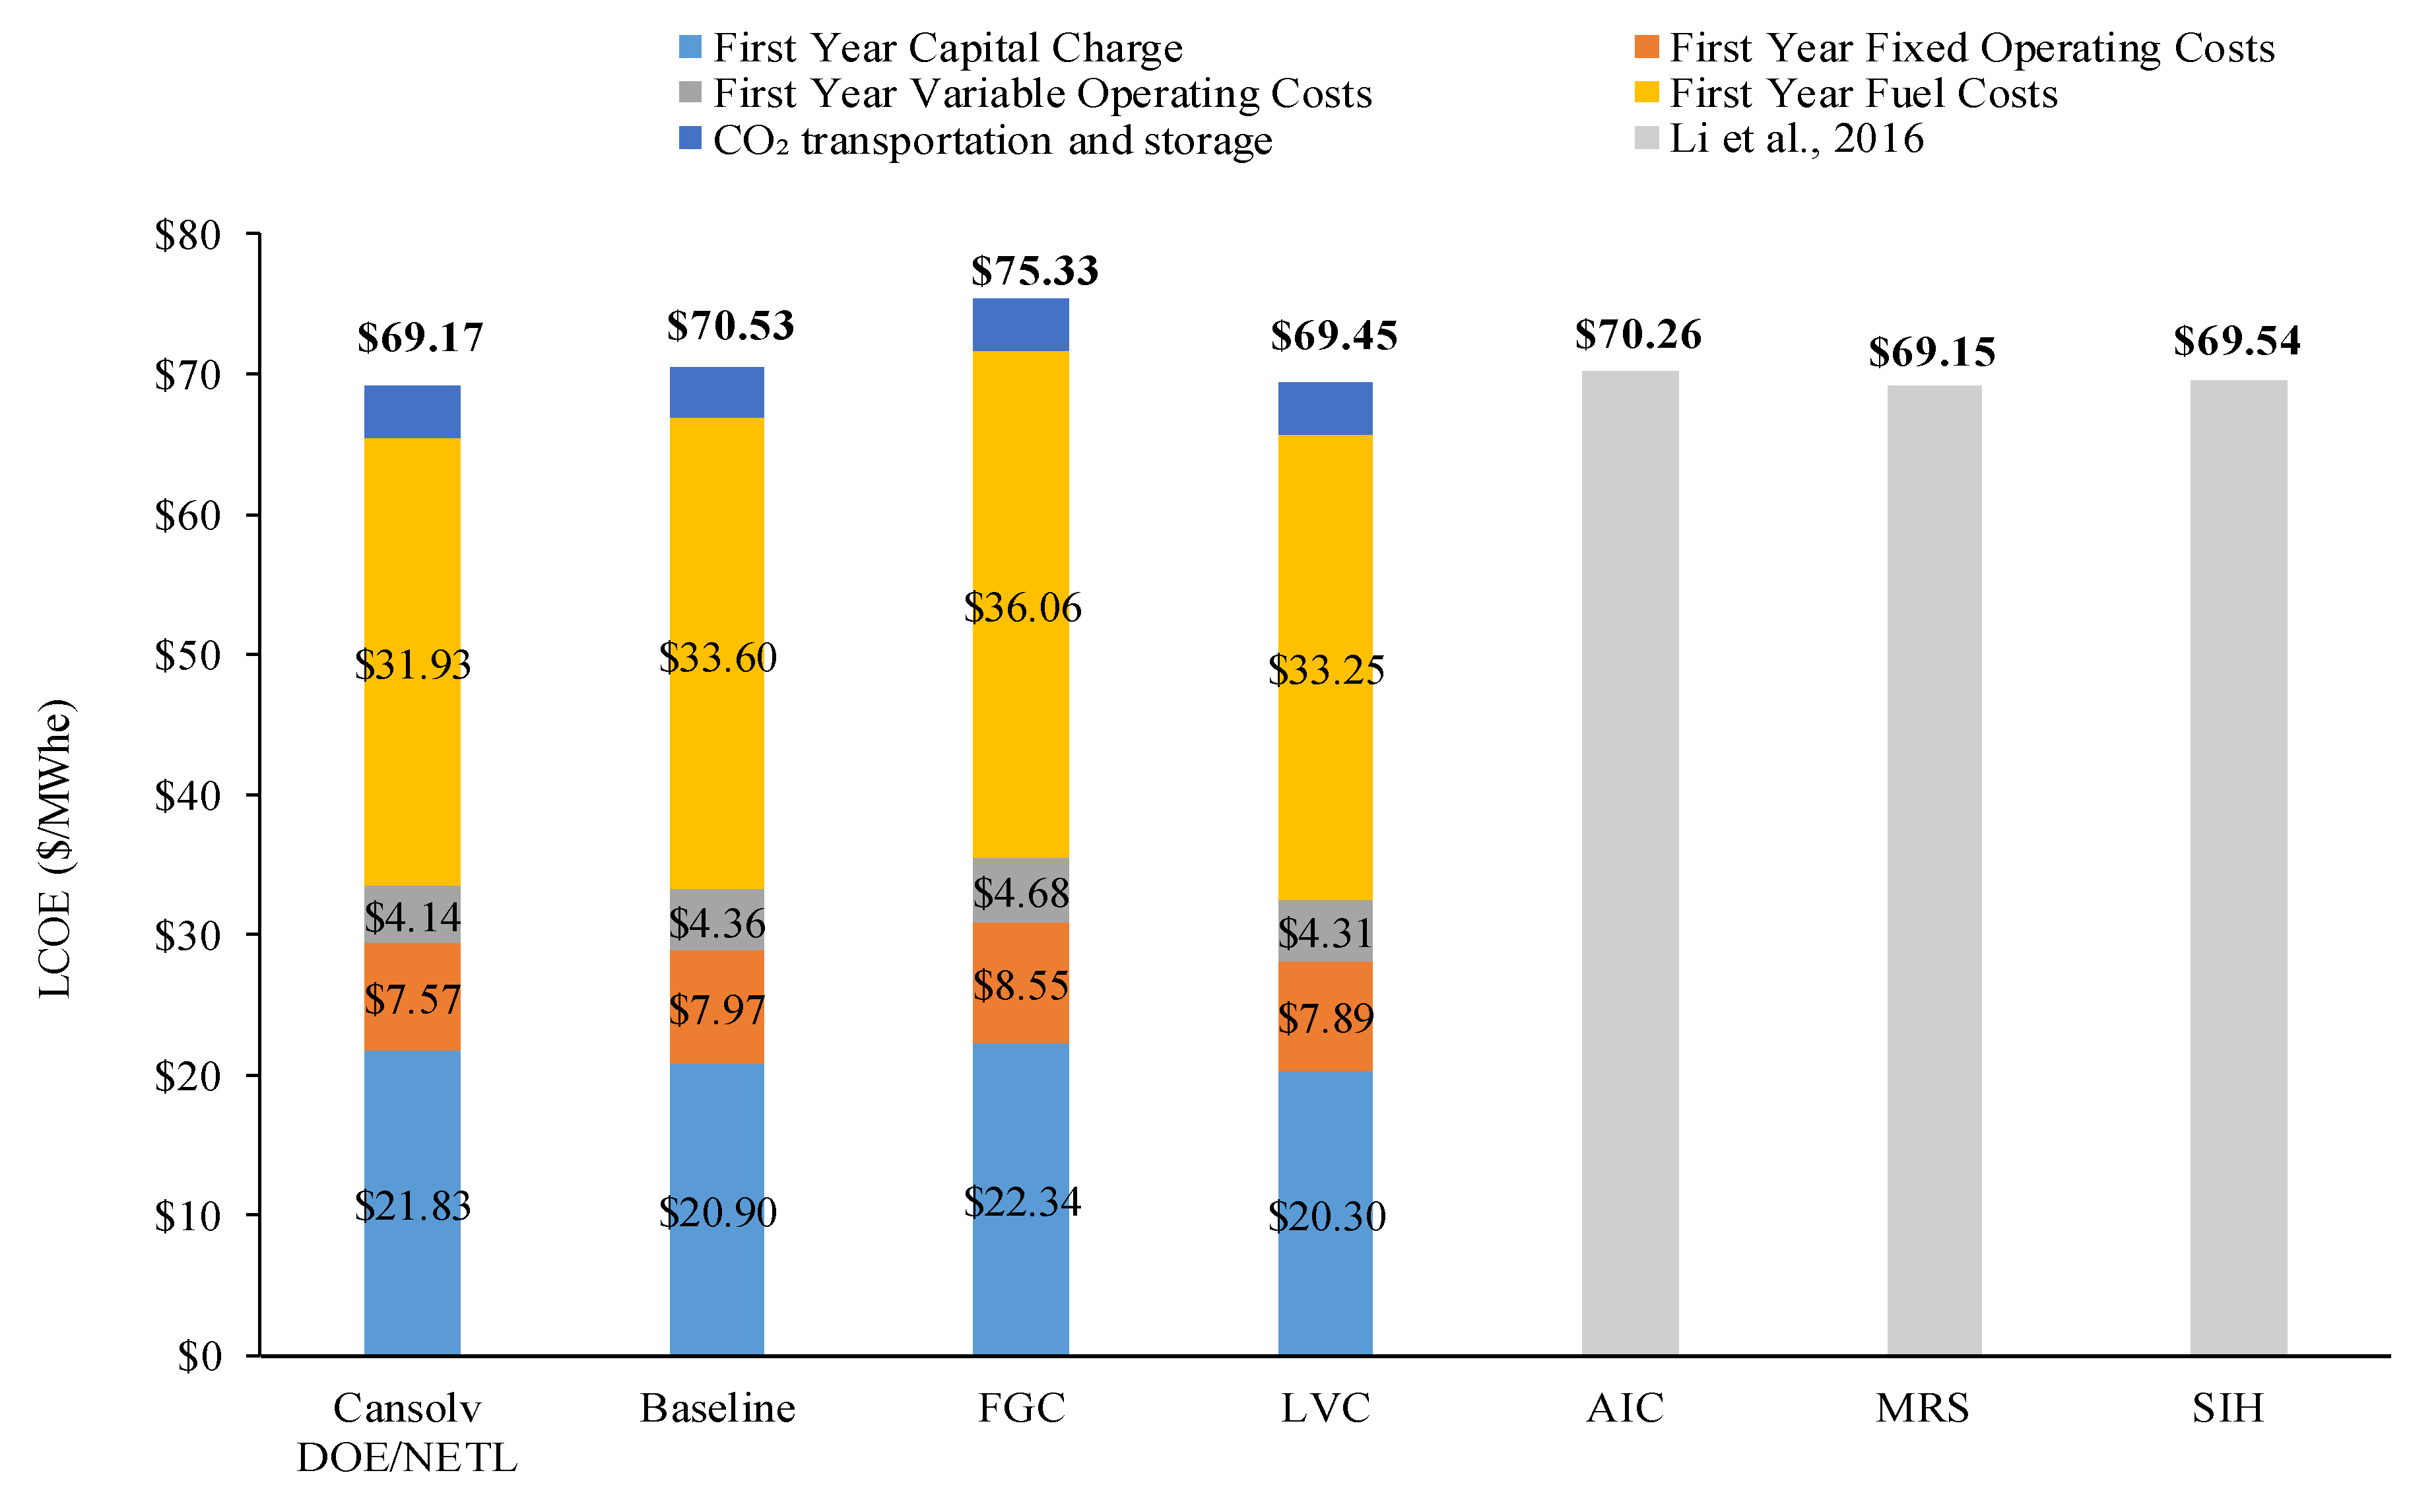
Figure 8 depicts the breakdown of the LCOE. This highlights the major contributors to the first-year CO2 avoided cost, including capital charge, fixed operating cost, and CO2 transportation and storage cost for the proposed designs in this study compared to the standardized levelized cost of electricity for the evaluated configurations by Li et al. [11], using the same cost breakdown. The application of MRS is the most effective upgrade in terms of cost saving at a comparable LCOE to Cansolv technology. Technically, it does not require expensive equipment or compression such as FGC. Simply, the rich solvent is bypassed to recover heat from the condenser before being sent to the stripper. AIC is expected to have little to no remarkable effect on the baseline model since the LCOEs of both cases are comparable. The LCOE of the third solution presented in the literature, SIH, does not deviate so much from the LVC evaluated in this study. FGC does not provide any improvement in cost savings due to a synergic increase in capital and operational expenditures. CO2 avoided cost is estimated from the calculated LCOE, which comprises capital, variable, fixed operating, and fuel costs. As depicted in Figure 9, FGC increased the CO2 avoided cost from $83.8/tCO2 to $98.2/tCO2, while the LVC configuration reduces the CO2 avoided cost by about $2/kg due to the $1.08/MWe-Net saving on the reboiler duty.
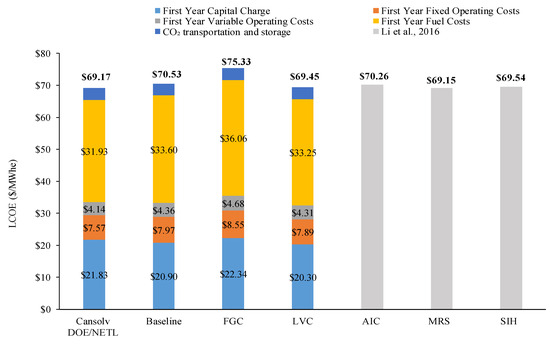
Figure 8.
Breakdown of the levelized cost of electricity for the proposed configuration in this study compared to literature configurations [11].
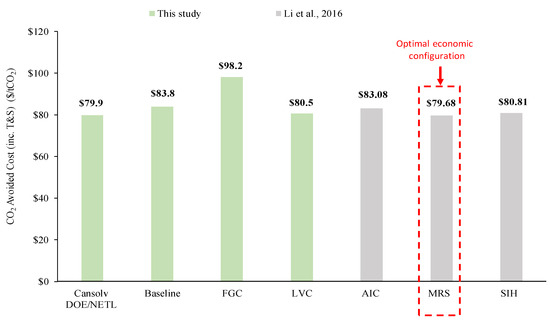
Figure 9.
CO2 avoided cost of the proposed configuration in this study compared to literature configurations [11].
4. Conclusions
In continuation of the work conducted by Li et al. [11], this paper focuses on evaluating the technical and economic performance of the FGC and LVC configuration for process upgrade of post-combustion CO2 capture integrated to 690 MWe-gross NGCC power plants. First of all, process modeling is optimized and compared to commercial system design to ensure the reliability and practicality of the presented results before searching for the best cost-saving option. Energy performances indicated that FGC and LVC configurations can cut up to 26% and 15% of the reboiler load. However, the electric consumption on the compression of a large volume of flue gas tripled plant consumption on CO2 capture auxiliaries from 30 MWe to 92 MWe, even with the addition of an expander. FGC is not a recommended route for upgrading the CO2 capture process as it increased the CO2 avoided cost from $83.8/tCO2 to $98.2/tCO2 and LCOE from $70.53/MWe-Net to $75.33/MWe-Net. LVC is the second-best option to save on energy after the MRS configuration because it reduces reboiler duty with little increase in electric consumption and low investment cost. It showed a reduction in LCOE and CO2 avoided cost down to $69.45/MWe-Net and $80.5/tCO2, respectively. All the proposed configurations discussed aim to decrease the burden on the reboiler, thus leading to energy cost savings; however, certain process additions undermine this goal due to their substantial CAPEX. The findings from this study can serve as a guide to recommend the optimal approach for designing configurations that present a financially viable balance between CAPEX and OPEX. Future research will encompass a wider variety of configurations. Solvent-based CO2 capture continues to be a more viable technology; however, noted challenges, such as solvent degradation and a low tolerance for frequent ramping up and down, highlight the need for additional research to tackle these issues.
Author Contributions
Conceptualization, A.B.; methodology, A.B. and F.B.M.; software, A.B.; validation, A.B. and F.B.M. and S.E.B.; formal analysis, A.B.; investigation, A.B. and F.B.M. and S.E.B.; resources, A.B.; data curation, A.B.; writing—original draft preparation, A.B.; writing—review and editing, A.B. and F.B.M. and S.E.B.; visualization, A.B.; supervision, A.B.; project administration, A.B.; funding acquisition, A.B. All authors have read and agreed to the published version of the manuscript.
Funding
This research received no external funding.
Data Availability Statement
The original contributions presented in this study are included in the article; further inquiries can be directed to the corresponding author.
Conflicts of Interest
The authors declare no conflicts of interest.
References
- Kabir, M.; Habiba, U.E.; Khan, W.; Shah, A.; Rahim, S.; Rios-Escalante, P.R.D.L.; Farooqi, Z.-U.; Ali, L.; Shafiq, M. Climate change due to increasing concentration of carbon dioxide and its impacts on environment in 21st century; a mini review. J. King Saud Univ.-Sci. 2023, 35, 102693. [Google Scholar] [CrossRef]
- Nunes, L.J.R. The Rising Threat of Atmospheric CO2: A Review on the Causes, Impacts, and Mitigation Strategies. Environments 2023, 10, 66. [Google Scholar] [CrossRef]
- Soeder, D.J. Fossil Fuels and Climate Change. In Fracking and the Environment; Springer International Publishing: Cham, Switzerland, 2021; pp. 155–185. [Google Scholar] [CrossRef]
- Niu, M.; Xie, J.; Liang, S.; Liu, L.; Wang, L.; Peng, Y. Simulation of a new biomass integrated gasification combined cycle (BIGCC) power generation system using Aspen Plus: Performance analysis and energetic assessment. Int. J. Hydrogen Energy 2021, 46, 22356–22367. [Google Scholar] [CrossRef]
- Pang, L.; Shao, Y.; Zhong, W.; Liu, H. Oxy-coal combustion in a 30 kWth pressurized fluidized bed: Effect of combustion pressure on combustion performance, pollutant emissions and desulfurization. Proc. Combust. Inst. 2021, 38, 4121–4129. [Google Scholar] [CrossRef]
- Xiang, Y.; Cai, L.; Guan, Y.; Liu, W.; He, T.; Li, J. Study on the biomass-based integrated gasification combined cycle with negative CO2 emissions under different temperatures and pressures. Energy 2019, 179, 571–580. [Google Scholar] [CrossRef]
- Jansen, D.; Gazzani, M.; Manzolini, G.; Dijk, E.V.; Carbo, M. Pre-combustion CO2 capture. Int. J. Greenh. Gas Control 2015, 40, 167–187. [Google Scholar] [CrossRef]
- Koohestanian, E.; Shahraki, F. Review on principles, recent progress, and future challenges for oxy-fuel combustion CO2 capture using compression and purification unit. J. Environ. Chem. Eng. 2021, 9, 105777. [Google Scholar] [CrossRef]
- Wang, M.; Lawal, A.; Stephenson, P.; Sidders, J.; Ramshaw, C. Post-combustion CO2 capture with chemical absorption: A state-of-the-art review. Chem. Eng. Res. Des. 2011, 89, 1609–1624. [Google Scholar] [CrossRef]
- Liang, Z.; Rongwong, W.; Liu, H.; Fu, K.; Gao, H.; Cao, F.; Zhang, R.; Sema, T.; Henni, A.; Sumon, K.Z.; et al. Recent progress and new developments in post-combustion carbon-capture technology with amine based solvents. Int. J. Greenh. Gas Control 2015, 40, 26–54. [Google Scholar] [CrossRef]
- Li, K.; Leigh, W.; Feron, P.; Yu, H.; Tade, M. Systematic study of aqueous monoethanolamine (MEA)-based CO2 capture process: Techno-economic assessment of the MEA process and its improvements. Appl. Energy 2016, 165, 648–659. [Google Scholar] [CrossRef]
- Ding, X.; Chen, H.; Li, J.; Zhou, T. Comparative techno-economic analysis of CO2 capture processes using blended amines. Carbon Capture Sci. Technol. 2023, 9, 100136. [Google Scholar] [CrossRef]
- Bai, L.; Zhao, D.; Zhong, X.; Dong, S.; Liu, H. Techno-economic analysis of CO2 absorption into a promising blended amine of DEEA-HMDA. Authorea 2022, preprint. [Google Scholar] [CrossRef]
- Nilavuckkarasi, R.K.; Muthumari, P.; Ambedkar, B.; Moniha, M. Carbon-rich solvent regeneration in solvent-based post-combustion CO2 capture process (PCCC): Process intensification by megasonics. Chem. Eng. Process.-Process Intensif. 2020, 151, 107913. [Google Scholar] [CrossRef]
- Fernandez, E.S.; Bergsma, E.J.; de Miguel Mercader, F.; Goetheer, E.L.V.; Vlugt, T.J.H. Optimisation of lean vapour compression (LVC) as an option for post-combustion CO2 capture: Net present value maximisation. Int. J. Greenh. Gas Control 2012, 11, S114–S121. [Google Scholar] [CrossRef]
- Le Moullec, Y.; Kanniche, M. Screening of flowsheet modifications for an efficient monoethanolamine (MEA) based post-combustion CO2 capture. International J. Greenh. Gas Control 2011, 5, 727–740. [Google Scholar] [CrossRef]
- Vinjarapu, S.H.B.; Neerup, R.; Larsen, A.H.; Villadsen, S.N.B.; von Solms, N.; Jensen, S.; Karlsson, J.L.; Kappel, J.; Lassen, H.; Blinksbjerg, P.; et al. Pilot-scale CO2 capture demonstration of heat integration through split flow configuration using 30 wt % MEA at a Waste-to-Energy facility. Sep. Purif. Technol. 2024, 345, 127311. [Google Scholar] [CrossRef]
- Rezazadeh, F.; Gale, W.F.; Rochelle, G.T.; Sachde, D. Effectiveness of absorber intercooling for CO2 absorption from natural gas fired flue gases using monoethanolamine solvent. Int. J. Greenh. Gas Control 2017, 58, 246–255. [Google Scholar] [CrossRef]
- Gerdes, K.; Summers, W.; Wimer, J. Quality Guidelines for Energy System Studies: Cost Estimation Methodology for NETL Assessments of Power Plant Performance; DOE/NETL-2011/1455, 1513278; U.S. Department of Energy Office of Scientific and Technical Information: Oak Ridge, TN, USA, 2011. [CrossRef]
- Schach, M.-O.; Schneider, R.; Schramm, H.; Repke, J.-U. Techno-Economic Analysis of Postcombustion Processes for the Capture of Carbon Dioxide from Power Plant Flue Gas. Ind. Eng. Chem. Res. 2010, 49, 2363–2370. [Google Scholar] [CrossRef]
- Bejan, A.; Tsatsaronis, G.; Moran, M.J. Thermal Design and Optimization; A Wiley-Interscience Publication; Wiley: New York, NY, USA, 1996. [Google Scholar]
- Peters, M.S. Plant Design and Economics for Chemical Engineers; McGraw-Hill: New York, NY, USA, 2003; Available online: http://archive.org/details/plantdesignecono0000pete_u8k1 (accessed on 10 May 2025).
- Schmitt, T.; Leptinsky, S.; Turner, M.; Zoelle, A.; White, C.W.; Hughes, S.; Homsy, S.; Woods, M.; Hoffman, H.; Shultz, T.; et al. Cost and Performance Baseline for Fossil Energy Plants Volume 1: Bituminous Coal and Natural Gas to Electricity. Available online: https://netl.doe.gov/projects/files/CostAndPerformanceBaselineForFossilEnergyPlantsVolume1BituminousCoalAndNaturalGasToElectricity_101422.pdf (accessed on 24 September 2023).
- Carbon Dioxide Capture from Existing Coal-Fired Power Plants; DOE/NETL-401/120106; Office of Systems Analyses and Planning Division. Carbon Dioxide Capture from Existing Coal-Fired Power Plants: Oak Ridge, TN, USA, 2006. Available online: https://www.osti.gov/biblio/20923766 (accessed on 10 May 2025).
- Herzog, H. Lessons Learned from CCS Demonstration and Large Pilot Projects. 2016. Available online: https://sequestration.mit.edu/bibliography/CCS%20Demos.pdf (accessed on 19 April 2025).
- Kennedy, G.W.A. Parish Post-Combustion CO2 Capture and Sequestration Demonstration Project (Final Technical Report); DOE-PNPH-03311; Petra Nova Power Holdings LLC.: Thompsons, TX, USA, 2020. [Google Scholar] [CrossRef]
- Just, P.E. Shell Cansolv deploying CCS worldwide. In Proceedings of the Second Post-Combustion Capture Conference (PCCC2), Bergen, Norway, 17–20 September 2013. [Google Scholar]
- Aboudheir, A. An Optimum Solution for Coal Power Plants to Reduce CO2 Emissions. 2019. Available online: https://www.engineering.pitt.edu/contentassets/f4be457906164980bfec191246d45549/2019.9.5-ahmed-aboudheir.pdf (accessed on 19 April 2025).
- Carbon Dioxide Capture Handbook. Available online: https://www.netl.doe.gov/sites/default/files/netl-file/Carbon-Dioxide-Capture-Handbook-2015.pdf (accessed on 19 April 2025).
Disclaimer/Publisher’s Note: The statements, opinions and data contained in all publications are solely those of the individual author(s) and contributor(s) and not of MDPI and/or the editor(s). MDPI and/or the editor(s) disclaim responsibility for any injury to people or property resulting from any ideas, methods, instructions or products referred to in the content. |
© 2025 by the authors. Licensee MDPI, Basel, Switzerland. This article is an open access article distributed under the terms and conditions of the Creative Commons Attribution (CC BY) license (https://creativecommons.org/licenses/by/4.0/).

