Article

Measuring and Simulating Wind Farm Wakes in the North Sea for Use in Assessing Other Regions

by
Richard J. Foreman
1,*,
Cristian Birzer
1 and
Beatriz Cañadillas
2,*
1
School of Electrical and Mechanical Engineering, Adelaide University, Adelaide, SA 38108, Australia
2
Institute of Flight Guidance, Technical University of Braunschweig, 38092 Braunschweig, Germany
*
Authors to whom correspondence should be addressed.
Energies 2025, 18(20), 5538; https://doi.org/10.3390/en18205538
Submission received: 13 September 2025 / Revised: 14 October 2025 / Accepted: 17 October 2025 / Published: 21 October 2025
(This article belongs to the Special Issue Advancements in Wind Farm Design and Optimization)

Abstract

“Wind theft”, the extraction of upstream wind resources by neighboring wind farms on account of wind farm or cluster wakes, is receiving wider popular attention. Cluster wakes need to be accounted for in wider planning strategies, for which measurements and wake models can be deployed to aid this process. To contribute to such planning measures, a flight campaign for investigating cluster waking and other phenomena in the North Sea was conducted in 2020 and 2021 to contribute extra flight data obtained during the first flight campaign of 2016 and 2017. We report the latest results of the 2020–2021 flight campaign following the work and methodology of Cañadillas et al. (2020), where, using the 2016–2017 flight measurements, wake lengths extending up to approximately 60 km in stable stratification were inferred, consistent with an explicit stability-dependent analytical model. Analysis of the recent 2020–2021 flight data is approximately consistent with the results of Cañadillas et al. (2020) in stable conditions, albeit with greater scatter. This is because Cañadillas et al. (2020) analyzed only flights in which the wind conditions remained nearly constant during the measurement period, whereas the current dataset includes more variable conditions. Comparisons with the analytical-based engineering model show good first-order agreement with the flight data, but higher-order effects, such as flow non-homogeneity, are not accounted for. The application of these results to the stability information for developing offshore wind energy regions such as the East Coast of the USA and Bass Strait, Australia gives an outline of the expected wake lengths there. Simple engineering models, such as that demonstrated here, though primarily designed for commercial applications, need to be further developed into advanced spatial planning frameworks for offshore wind energy areas.

1. Introduction

Recently, several events have stalled the expansion of offshore wind energy, such as the failure of the offshore areas N-10.1 and N-10.2 in the North Sea to receive a single bid in a recent auction (https://www.offshorewind.biz/2025/08/06/germanys-2-5-gw-offshore-wind-tender-fails-to-attract-bids/, accessed on 5 September 2025). One reason for the lack of bidding could be uncertainty with regard to the effect on the wind resources of the N-10 area due to already-established or soon-to-be-established neighboring wind farms. “Wind theft”, merely one or more wind farms or clusters extracting resources upstream from a neighboring wind farm [1], is increasingly reaching the attention of popular media. But the wake or wind speed deficit downstream from wind farms has been a known and detectable issue for approximately 20 years [2], and the wind energy community has paid increasing attention to it in recent years as offshore wind farms have become significantly larger [3,4,5,6,7]. So far, it appears that this issue has been neglected in large-scale planning and area allocation activities, with wind farm design and structure left to the infrastructural priorities of the individual developers and their designers. Since other regions around the world are opening their near-coastal windy regions for offshore wind developers, there are probably many lessons to be learned from the Northern European experience in dealing with “wind theft”.
Short, and possibly negligible, wind farm wakes can be confidently said to occur in regions of higher background turbulence, which usually means unstable atmospheric stratification. In offshore conditions, this translates into warmer sea surface temperatures compared with the overlying airflow, which enhances vertical turbulent exchange and the mixing out of wind speed deficits in wake flows. In stable stratification, such as when warm air flows over colder water, and, thus, when vertical exchange is damped, offshore wind farm wakes are well known to be much longer [5], reaching lengths of many tens of kilometres [8]. In addition to atmospheric stability, other important atmospheric physics governing long farm wakes include boundary-layer-height capping, low-level jets, gravity waves, and wind veer [9,10,11,12].
To directly quantify the wake-length dependence on stability without only relying on the assumptions of satellite-based methods [13], or the range-limited performance of scanning lidars [6,14], a previous aircraft-based measurement campaign within the WIPAFF project [15] was conducted in 2016–2017 in which wind farm wake wind speeds were sampled at increasing distances downstream [16]. A clear wake signal was detected in the data from the 2016–2017 offshore campaign, particularly in stable conditions [8]. Moreover, the stability-dependent analytical model proposed by Emeis [17,18] was shown to be able to describe the stability dependence of wake lengths and has subsequently been adapted for use in the commercial engineering package OpenWind [19].
A second flight campaign in the North Sea was conducted in 2020–2021 as part of the X-Wakes project to yield more wind farm wake data with an extra focus on inter-cluster interactions as well as to generate in situ measurements of coastal and blockage phenomena on wind farms [20]. With these new data covering more atmospheric conditions, and given the small number of flights during stable conditions in the first 2016–2017 campaign, we find it useful to redeploy the wake-extraction methodology and analysis of Cañadillas et al. [8] and determine if a more refined wake-length stability dependence may be extracted from this new dataset. We wish to determine whether a more refined relationship between wake length and atmospheric stability can be derived from the expanded data, thereby improving our understanding of offshore wake flows and supporting the optimization of analytical wake models. Analyses of a few of the 2020–2021 campaign flights have already been performed by Cañadillas et al. [14] and zum Berge et al. [21] and compared with the Weather Research and Forecasting model, as well as an engineering model. Since Cañadillas et al. [8], we have also further developed the explicit stability-dependent analytical Emeis [17,18] engineering model, which could potentially be used for brief surveys of offshore regions, engineering applications, and first-order wind resource assessments. The original analytical wind farm wake formulation proposed by Emeis [17,18] was shown to give plausible results in Cañadillas et al. [8] with respect to the 2016–2017 flight campaign, and has been developed further based on data from large-eddy simulations (LESs) [19] and wind turbine power measurements [22]. However, LES models are generally prevented from investigating stratification beyond near-neutral-stable conditions due to the computational expense [19,23]. See Ouro et al. [12] for a general review of the issues, particularly stability, associated with LES, computational fluid dynamics, and numerical weather prediction in simulating wind farm flows.
‘Engineering’ wake models are advantageous for being able to capture the essential wake physics without the enormous computational costs of LESs, e.g., [19,24], or even the moderate costs and complexity of weather numerical prediction, e.g., [1,14]. Numerical weather prediction models additionally are disadvantaged by not resolving individual wind turbine flow, having different interacting physical parameterizations from which to choose, whereas simplified engineering parameterizations, by definition, focus on a greatly reduced physics relevant to wind energy. For commercial applications, engineering models are required in order to make thousands of simulations from which to find an optimized wind farm layout.
An analytical wind farm model wake that is simple but useful on account of its explicit stability dependence (in the Monin–Obukhov sense) is the ‘top-down’ roughness model proposed by Emeis [17,18,25]. Divided into an added wind-farm roughness component [17] and a downstream wind speed recovery component [18], the analytical version gives plausible results with respect to the wind speed recovery based on previous wind farm wake recovery estimates from 2016–2017 flight data [8]. The expanded two-dimensional model for use in engineering models was also found to reproduce the wake structures with respect to the wind farm wake results produced with LESs [19] and to estimate wind farm power measurements [22].
The purpose of the following analysis is to summarize the wake length–stability dependence as previously performed for the 2016–2017 campaign, but for the more recent 2020–2021 campaign. We seek an explicit stability dependence with which to classify inferences of wake lengths from the aircraft measurements for the purposes of developing accurate engineering models of wind farm and cluster wakes.
Section 2 presents the flight measurements of the 2020–2021 campaign to be analyzed as well as a description of the wake model and how it is to be used here. The results of the analysis of the new campaign are presented in Section 3 and compared with model results in order to aid interpretation of the data. Section 4 explores the consequences of stability-dependent long wakes in a couple of developing offshore wind regions outside of Northern Europe in the USA and Australia using stability roses based on data sourced from ERA5 Reanalysis [26]. The many years’ worth of experience in the North Sea has shown that, if inter-cluster wake losses are to be mitigated, the organization of the wind farms probably needs to be conducted at a larger and more coordinated scale than previously undertaken [1].

2. Methodology

2.1. Flight Measurements of Cluster Wakes

Similar to the previous campaign in the period 2016–2017 [15,27] focusing on the flow around and downstream of individual wind farms in the German sector of the North Sea [16], flights were performed in the period 2020–2021 with different patterns around and downstream of wind farms, while recording meteorological data, aircraft motion, and positioning data [20]. The accuracy of the horizontal velocity components is stated as better than 0.5 m/s [20,28]. The resulting dataset, consisting of flight data from up to two aircraft of the University of Braunschweig, is sourced from the online repository [29]. A detailed description and tabulation of the 49 flights by the aircraft (Dornier 128, Cessna F406), their flight paths, and the recorded measurements are provided by Lampert et al. [20]. For the current study, we have only concentrated on the Dornier 128 measurements.
The flight paths in the North Sea are representative of the map shown in Figure 1, which depicts a flight path (Flight 23, 23 July 2020) in the regions of the clusters N-2, N-3, and N-4 in the German sector of the North Sea. They were flown downstream of the N-3 cluster (Gode Wind 1 and 2, Nordsee One), which, in turn, is downstream of the larger N-2 cluster (alpha ventus, Merkur, Trianel I and II, and Borkum Riffgrund I and II) at the time of the measurement campaign. Since the 2020–2021 flight campaign, further wind farms have been erected including the Kaskasi wind farm in the N-4 cluster. This particular flight strategy involved taking off from Wilhelmshaven airport in Northern Germany, conducting vertical profiling south of the wind farms, and rounding the N-3 cluster before flying legs orthogonal to the wind direction up to, and sometimes behind, the N-4 cluster (Meerwind Sud/Ost, Nordsee Ost, and Amrumbank West), and then returning to Wilhelmshaven airport. The vertical profiling, amounting to a rapid ascent and descent, adjacent to the flight legs, or up- and downstream of the clusters, was often performed at different positions to survey the vertical structure of the boundary layer.
Wake extraction from the published 100 Hz velocity signal follows the procedure described by Cañadillas et al. [8]: First, legs downstream from the N-3 cluster are defined from the flight path. For each leg, a smoothed wind speed signal is fitted with a Gaussian profile within a predefined wake width based on the horizontal extent of the upstream N-3 cluster; the width then expands gradually downstream. Figure 1 shows five legs downstream of the cluster N-3. The path’s color scale corresponds to the aircraft’s altitude illustrating boundary-layer profiling at various points before and after the flight legs are performed, but generally holding a steady level at approximately hub height.
A modified version of Table 2 from Lampert et al. [20] is presented in Table 1, summarizing the relevant details of the flights considered in the current study. Of the flight patterns classified by Lampert et al. [20] into meandering (wake detection patterns), blocking (upstream wind farm patterns), coastal (flights along the North Sea coast), and above (patterns flown above wind farms), only the meandering flights are considered. From those meandering ones, only flights east and, thus, downstream of the N-2 and N-3 clusters are analyzed, which rules out a number of meandering flights south of N-3, where, due to the geographic wind farm configurations, the flight pattern is only downstream of a few turbine rows deep. A further three meandering flights east of the N-2 and N-3 clusters are ruled out due to the high freestream wind speeds (>17 m/s), as wind turbines are generally operating at rated power, which mimimizes wake effects, particularly as they took place during unstable or neutral conditions.
A single flight, depending on the wind direction and the flight path, may be analyzed for multiple wakes downstream of different clusters. Table 1 gives the approximate flow path under the column heading “Cluster Interaction”. For example, N-3– indicates a flow downstream of the N-3 cluster while N-2–N-4 indicates a flow downstream from N-2 potentially impinging on cluster N-4. The “Time” column gives the time at the start of the first leg until the final leg is completed, where the total number of legs is given in the proceeding column. For example, Flight ID = 2 for flow from N-2 to N-4 has only one recoverable leg and the time period, thus, constitutes only 15 min, which gives one a sense of the duration of a single leg. The wind speed and direction are round estimates of the area-averaged flow within the wake region.
The stability classification proposed by Sathe et al. [30] (see Table A1 in Appendix A) is to be found for each flight in the right-most column of Table 1. The classification is based on the magnitude of the Obukhov length [m],
L = u * 3 κ g T H ,
where u * is the friction velocity [m/s], κ is von Karman’s constant [−], g is the acceleration due to gravity [m/s2], T is the average temperature [K], and H is the kinematic turbulent sensible heat flux [K m/s]. We have focused on the Obukhov length since most stability parameterizations, including the analytical model used here, are based on some formulation of Monin–Obukhov similarity theory. Ideally, we would have flux measurements at sea level near the wind farm in freestream conditions in order to estimate the values of u * and H. Since this is currently not possible, the Obukhov length is estimated from the bulk flux model developed by Andreas et al. [31] using the 10 min mean meteorological data recorded at the FINO1 platform (Data sourced from: https://login.bsh.de/, accessed on 5 September 2025) located within the N-2 cluster [32]. Input parameters to the bulk flux formula are the mean 10 min wind speed, air temperature, and relative humidity at 40 m above sea level, the barometric pressure at 20 m above sea level, and the sea surface temperature recorded with a 20 Hz infrared radiation thermometer aboard the Dornier 128 aircraft. These 20 Hz data have been aggregated to 10 min for the duration of the flight to be harmonized with the FINO1 data. The value of L in Table 1 is the median value calculated over the time indicated, since near-neutral stability can result in very large absolute values of L (i.e., H 0 ). The range of L values can be seen in Appendix A when compared with the bulk Richardson number calculated at hub height.

2.2. Engineering Wake Models

For comparison with the 2020–2021 flight data, the analytical Emeis model [17,18,25] for estimating the explicit wind farm wake-length dependence on stability has been incorporated into the FLORIS (FLOw Redirection and Induction in Steady-state) model version 3.3 (https://nrel.github.io/floris/, accessed on 5 September 2025) The FLORIS model developed by NREL (FLORIS: A Brief Tutorial: https://docs.nrel.gov/docs/fy20osti/75661.pdf, accessed on 5 September 2025) is an engineering wake model for assessing energy yields of wind farms by taking individual turbine wakes into account based on well-known turbine wake models such as the Jensen [33] and TurbOPark [34] techniques, as well as for testing control strategies such as wake steering [35]. While the TurbOPark approach may be used for the simulation of long wakes [36,37], an explicit stability-dependent wind farm wake model has yet to be included in FLORIS.
Simulations with the FLORIS model are conducted as follows based on wind farm cluster layouts using the available North Sea wind turbine coordinates. First, the Jensen [33] wind turbine wake model is run for a decay constant of 0.05 given an undisturbed wind speed U and turbulence intensity I u as inputs to calculate the thrust coefficient of each turbine. A spatially smoothed thrust coefficient c t x , y from the resulting individual turbine coefficients C T is used in the Emeis [17] in-farm formulation (see the Appendix in Cañadillas et al. [19]) for the initial farm wind speed deficit
U R 0 = U farm U = h + Δ z 1 Δ z 1 I u + Φ m κ 2 C d h + Δ z 1 Δ z 1 I u + Φ m κ 2 C t , eff ,
where h is the hub height [m], Δ z 1 (= 0.1 D ) is the vertical separation between the freestream flow and wake flow [m], C d is the sea surface drag coefficient, I u is the ambient turbulence intensity [−], ϕ m is the stability-dependent dimensionless wind shear, and the effective surface drag is
C t , eff = π 8 c t x , y s D 2 + C d ,
where C d is the ground (or ocean) drag coefficient. We have used the default NREL 5 MW [38] turbine type for calculating the thrust coefficients C T in FLORIS. The NREL 5 MW turbine has a diameter D = 120 m and hub height h = 90 m. Note that the actual wind farm turbine types within clusters N-2, N-3, and N-4 vary in size from somewhat smaller capacity (e.g., Amrumbank West, 3.6 MW) to larger capacity (e.g., Nordsee Ost, 6.2 MW). Hence, the NREL 5 MW turbine is an approximation to the turbines used throughout the clusters and is consistent with the simplicity of the analytical model used here. Lacking turbine status signals, we also assume 100% capacity at the time of flight recording, which may not be true due to any planned outages or curtailment. The Figure 7 of zum Berge et al. [21] gives a picture of the different issues of each turbine that reduce the capacity of the N-2, N-3, and N-4 clusters during Flight 19.
The cumulative farm velocity deficit U 0 defined by Equation (2) is projected and ‘recovered’ downstream by
U R = 1 + U wake U 1 exp β t ,
to obtain the wind speed wake pattern for comparison with actual wake measurements. Here, U R is the wind speed recovery, U is the freestream wind speed, β is a stability-dependent constant, and t is the dependent variable time [s], so that the equation must be recast in the spatial domain (see Cañadillas et al. [8]). The disturbed wind speed is then a function of the downstream coordinates u x , y in the engineering model.
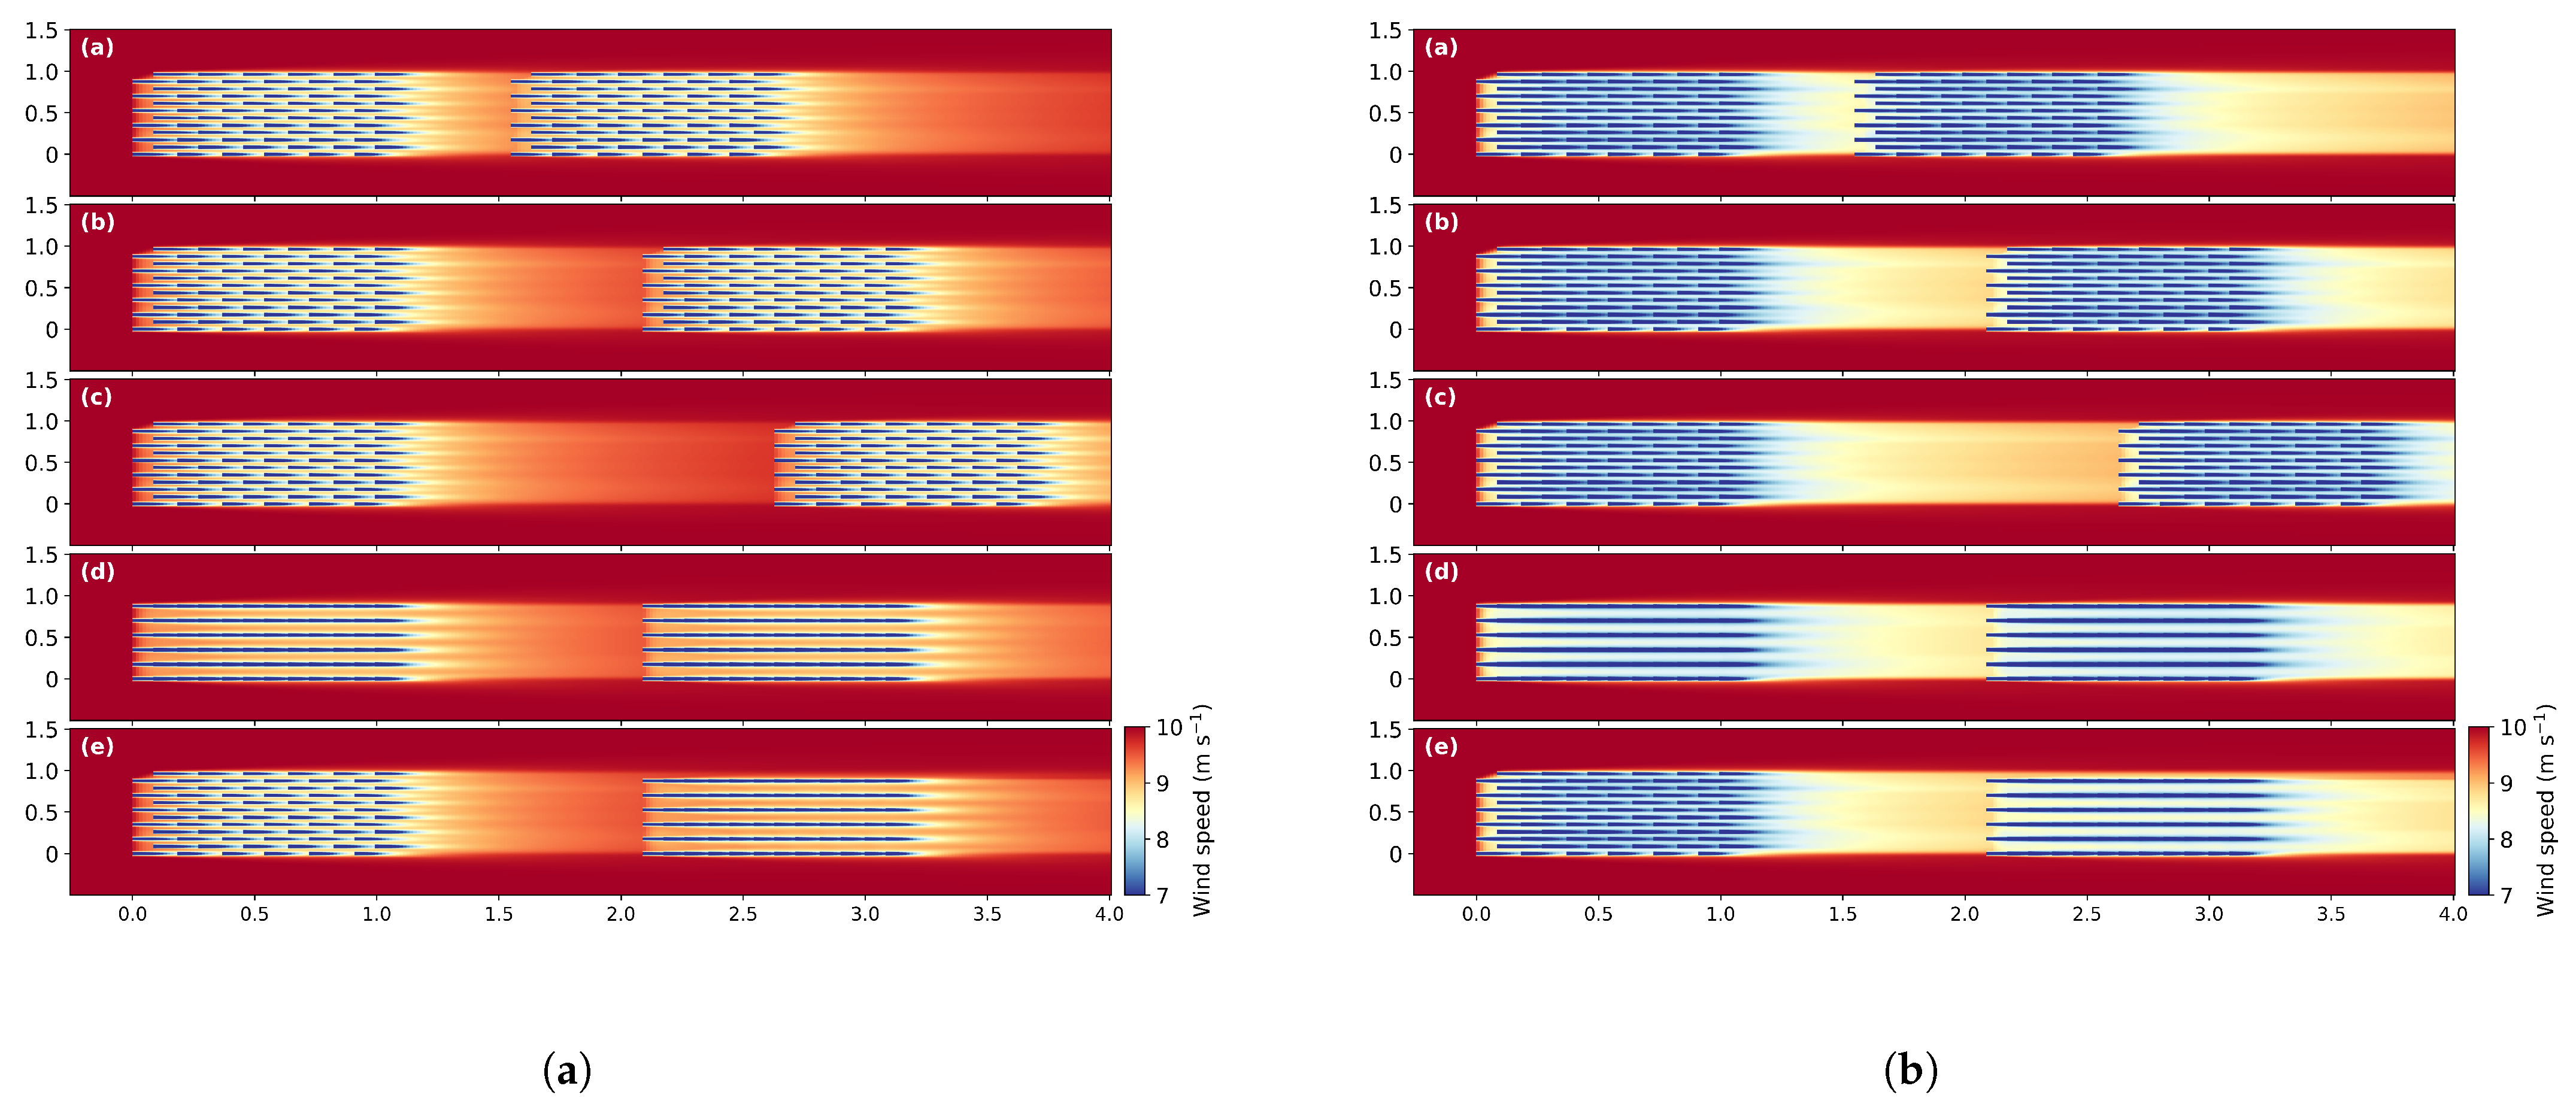
In order to demonstrate the physical realism of the model results, Figure 2a presents FLORIS/Emeis results in neutral conditions for a number of staggered and aligned wind farm configurations for a couple of wind farms separated by 5, 10, and 15 km, showing the same configurations as in Figure 4 of Stieren and Stevens [24], but using the Emeis analytical model with the default NREL 5 MW wind turbine. Wake strengths are comparable with LES results from Stieren and Stevens [24], but with a simple analytical configuration for different wind farm configurations. Note that since the analytical model is simply a drag model, it will not capture non-linear effects such as speed-up around the wind farm. Visually, the Emeis internal wind farm wind speeds are somewhat stronger and the downstream wake somewhat weaker than the LES wind speeds. Since LES models simulate stable stratification very expensively, if at all, in the case of very stable conditions, engineering models, which usually make the assumption of neutral atmospheric stability ( L = ), are still interesting when exploring stable conditions, and would be particularly useful when surveying wake lengths in offshore regions densely populated with wind farms. Figure 2b gives FLORIS/Emeis simulations but for stable conditions h / L = 0.25 , illustrating the greater reduction in wind speed affecting the downstream wind farms compared with neutral conditions.

3. Measured and Simulated Cluster Wakes

We present two examples of the flights listed in Table 1 (Flights 23 and 24) of the measured and simulated cluster wakes with the aircraft and the FLORIS/Emeis model, respectively, and an aggregated long-range result of all flights listed in Table 1. Using this generalization, we then extrapolate the consequences of the flight results in Section 4 for newer offshore regions in Bass Strait, Australia, and off the Eastern United States Coast near Martha’s Vineyard.
Figure 3 presents Flight 24 (ID = 6 according to Table 1) illustrating the simulated flow field from cluster N-2 directly to N-3 and downstream from N-3 in stable conditions h / L = 0.25 . This value of h / L is chosen to match the average stable curve found in the Figure 7a of Cañadillas et al. [8] for the 2016–2017 campaign results and reproduced below in Figure 4. While Cañadillas et al. [8] explicitly accounted for stability by separating neutral and stable cases, their investigation of stable conditions grouped all available flight measurements into a single moderately stable state ( h / L = 0.25 ), rather than covering the full spectrum of stable conditions, due to the limited dataset.
The top panel is the FLORIS/Emeis “engineering” model based on the Emeis analytical model for a background and homogeneous freestream wind speed of U = 9 m/s, which has been applied acknowledging that spatially homogeneous conditions are unlikely to ever be completely realized in real offshore conditions. This, however, is the assumption usually made by engineering models in making generalized energy assessments.
The vertical black lines in Figure 3 at different distances of x are the positions of the flight legs as illustrated in the wind farm map in panel (a) where the legs are colored according to the altitude scale indicated to the right of panel (a). At the completion of the legs, there is often a surveying of the boundary-layer structure, but these parts of the legs are filtered from the wind speeds considered. Also indicated in panel (a) is the origin at the N-2 cluster (specifically, alpha ventus), the outer boundaries of the assumed cluster wake, and the surrounding wind farms (blue points) at the time of flight. Flight legs take place between the N-2 and N-3 clusters ( x = 8.0 km), between the Nordsee One wind farm and Godewinds of cluster N-3 ( x = 20.5 km), and at progressive distances downstream of cluster N-3.
Presented in each successive panel (b)–(f) are the raw aircraft data (grey), a moving average of dimensions equal to the wake half-width (black), the free wind speed assumed from regions outside the wake (blue dashed line), the Gaussian fit to the smooth wake signal (red dashed line), and the FLORIS/Emeis wind speed at the positions of the legs (dashed yellow). The origin y = 0 m in these panels corresponds with the presumed wake centerline indicated by the black dots in panel (a) at progressive downstream distances, with positive/negative y representing north/south directions. The vertical dashed black lines are the assumed wake width corresponding to the expanding wake width illustrated in panel (a). The titles of each panel show the downstream position with respect to cluster N-2 and N-3 (in parentheses).
At x = 8.0 km shown in panel (b), there is a bi-modal wake structure in the wind speed measurements corresponding to the top (the wind farms alpha ventus, Merkur, and Trianel I and II) and bottom halves (the wind farms Borkum Riffgrund I and II) of cluster N-2, which are smoothed into a single feature by the Gaussian fit (red dashed curve). Through the origin y = 0 km there exists a strip of freestream wind speed positioned between the top and bottom clusters, as evident in both the model and raw data, with the freestream wind speed peak offset by approximately y = 3 km, resulting from a slight error in the estimated wind direction of 270°, which is, of course, an average over the flight legs. The qualitative shape of the wake profile agrees with the FLORIS/Emeis model but with a positive offset indicative of a slightly overestimated freestream wind speed, which the measurements suggest is probably closer to U free = 8.5 m/s at this position rather than the assumed average U = 9 m/s over the course of the flight.
At leg x = 20.5 km presented in panel (c), the top half of the cluster N-2 wake has decayed with distance x while the Nordsee One wind farm has regenerated the wake, which is displaced from that anticipated by the FLORIS/Emeis model by a couple of kilometres.
Panel (d) shows the flight leg at x = 30.0 km (5 km with respect to N-3) immediately downstream of the Godewind wind farm, and illustrates two rough or turbulent patches in both the data and model at y = 0 and 10 km, indicating the direct detection of turbine wakes. The wake of the southern half of cluster N-2 not impinging on cluster N-3 is evident in the wind speed deficit at approximately y = 10 km. For y < 10 km, presumably beyond the wake, the measurements suggest non-homogeneous flow in the north–south direction. Non-homogeneous north–south wind speeds persist further downstream from x = 35.2 km till x = 81.7 km with some 10–11 m/s to the north of the wake and approximately 8 m/s south of the wake. Despite the inhomogeneity, it could be declared that the wake has almost recovered by approximately 55 km downstream from the N-3 cluster (or 81.7 km downstream of N-2). For all flights, the wake length is adjudged to be the distance the wind speed has recovered from the last wind farm (i.e., Godewind in Figure 3), here indicated by the scale on the bottom x-axis in the top panel.
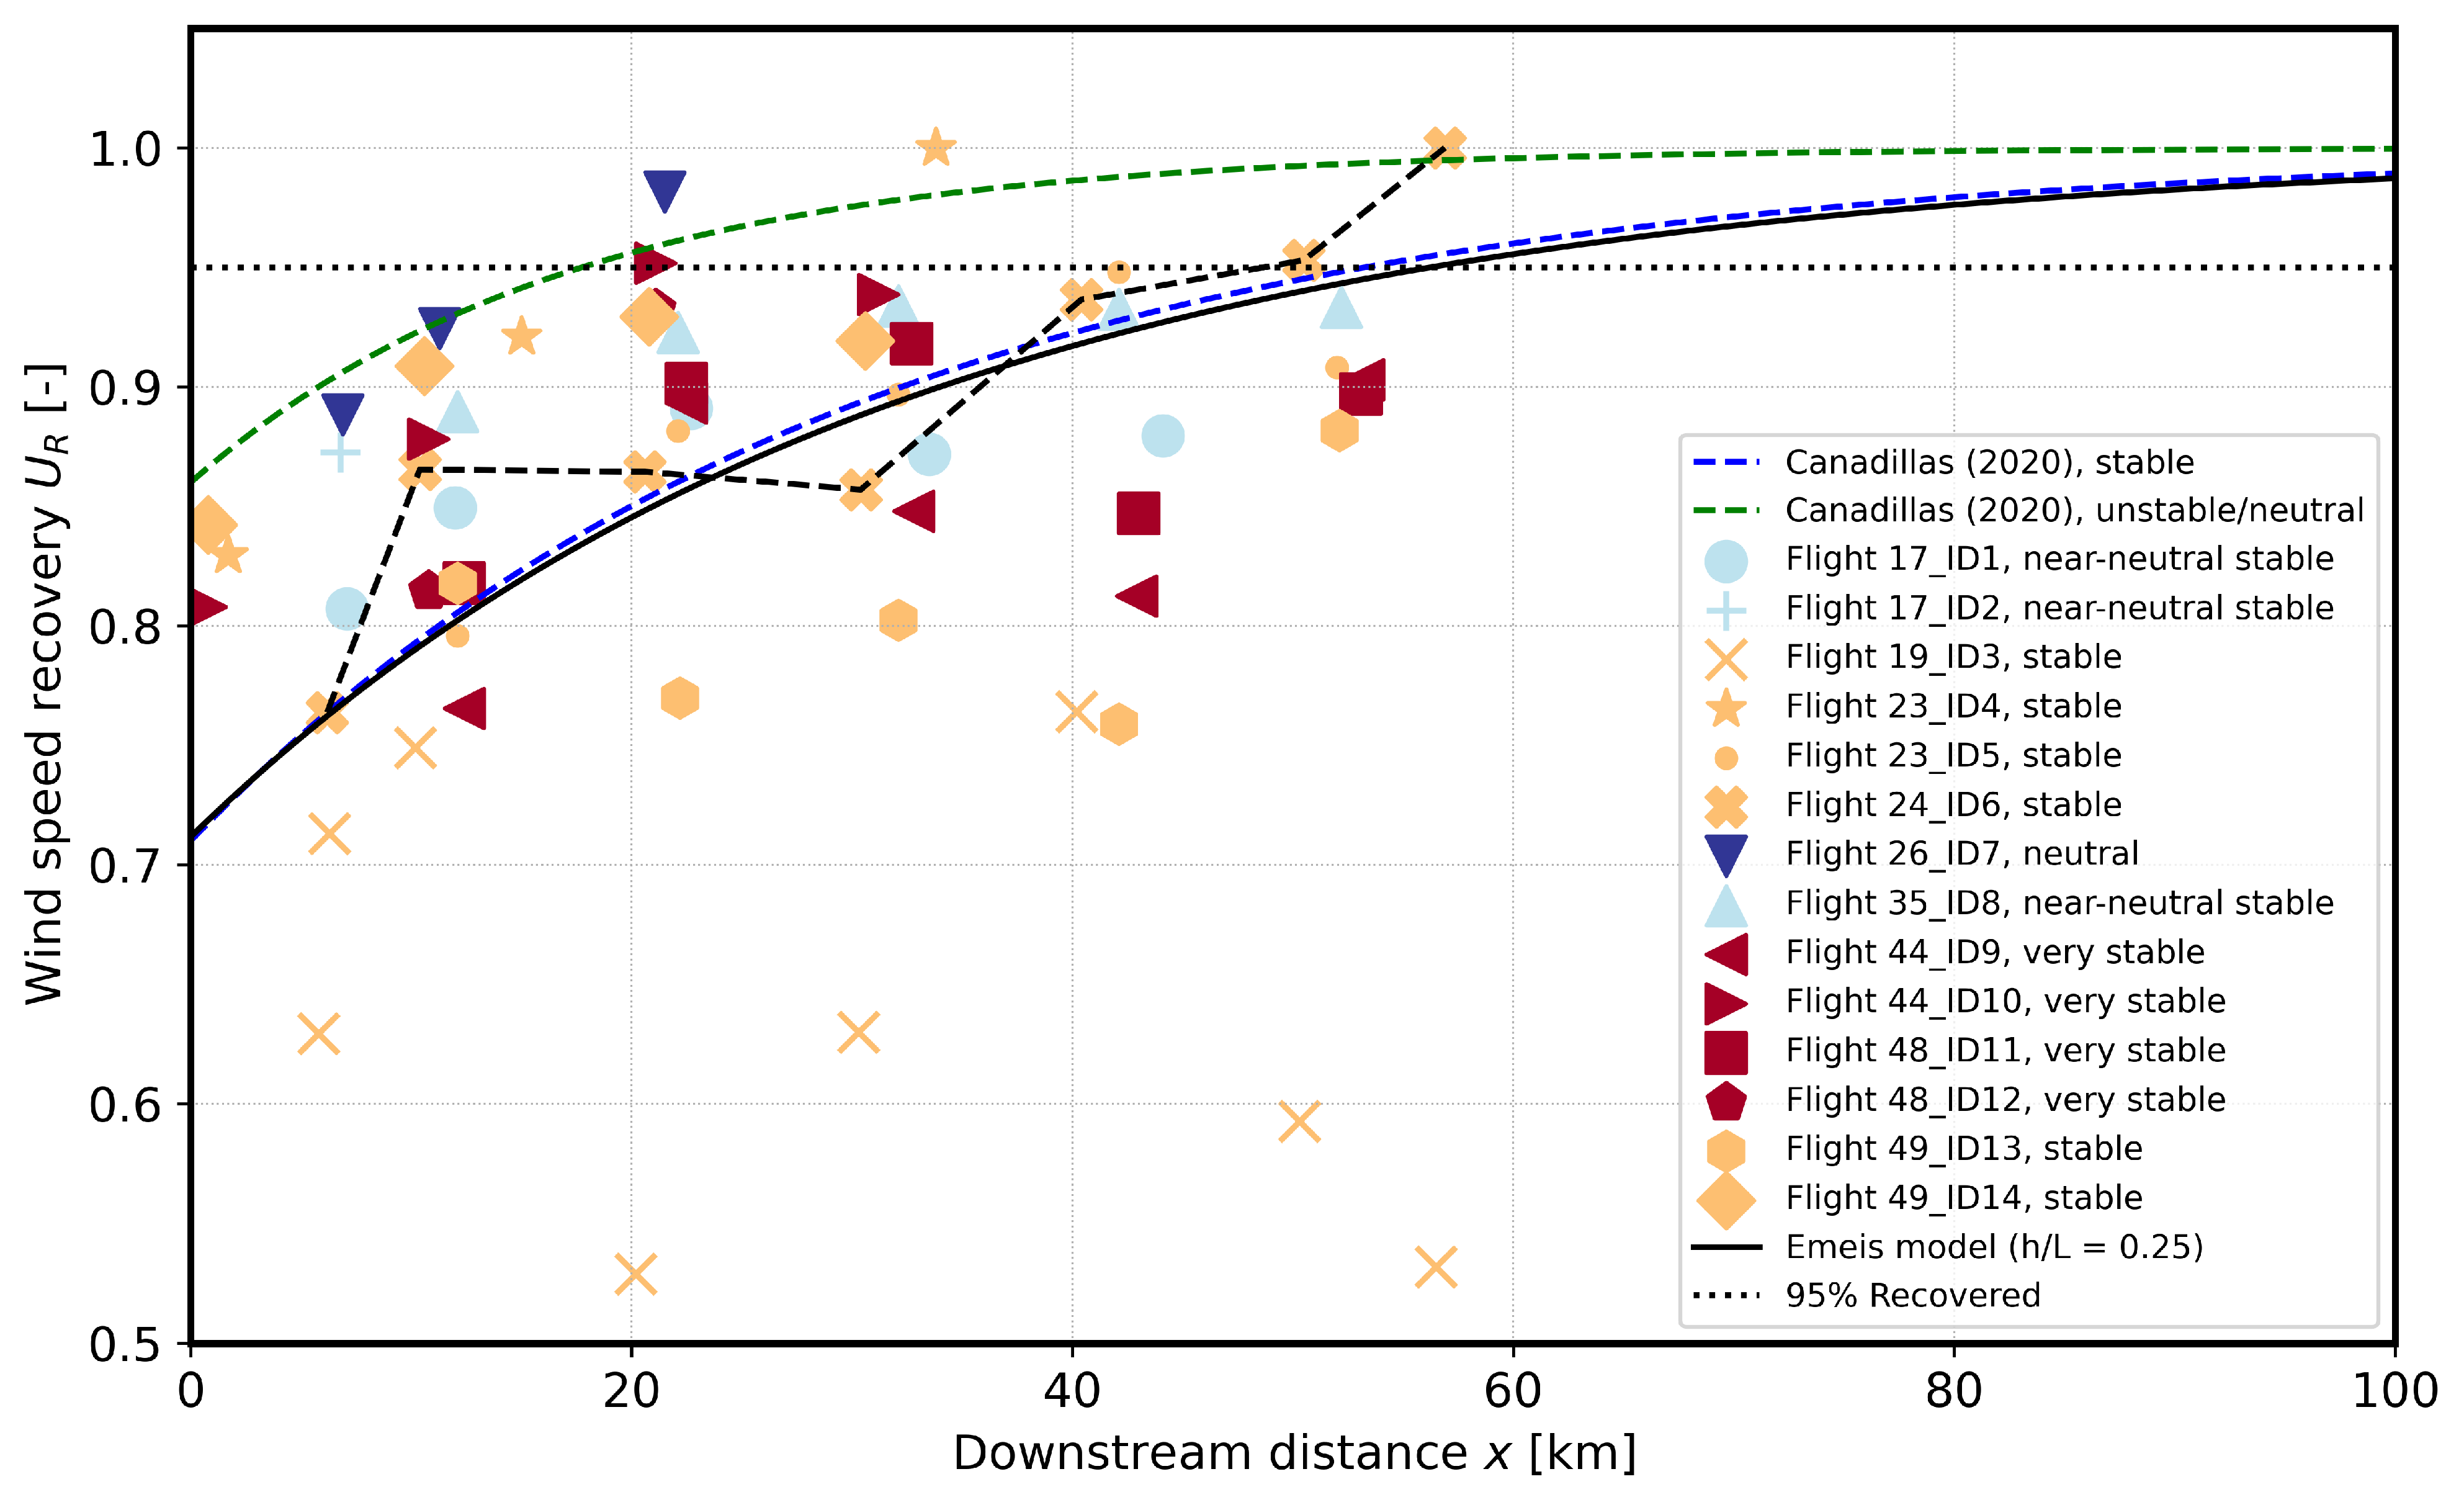
Following the usage of Cañadillas et al. [8], the wake length is defined as the position at which the wind speed in the wake returns to 95% of the freestream wind speed. Hence, at the wake length, the wind speed recovery U R = 0.95 , where
U R = U min U free .
Here, U min is the minimum wind speed of the Gaussian fit to the smoothed (black) wake profiles at each downstream flight leg x. For Flight 24, the wind speed recovery U R is plotted in Figure 4 (orange crosses and the dashed black line) along with U R calculated for all other flights listed in Table 1.
For example, in Figure 3d, the Gaussian fit (red dashed line) has smoothed over much of the flow complexity including wind speed non-homogeneity, a bi-modal horizontal wind speed profile, and the high level of turbulence, giving U min 7 m/s. Also, U free is the inferred freestream wind speed (blue dashed lines) at that downstream location estimated from the wake boundaries and calculated at the location y of minimum wind speed U min . The average value of U free and its standard deviation for all legs is given in Table 1. In Figure 3d, U free 9.5 m/s, and, hence, U R 0.75 at x = 5 km, which in Figure 4 at x = 5 km is represented by the cross sitting precisely on the blue curve, which was a fit to the stable cases of the 2016–2017 campaign reported by Cañadillas et al. [8]. Indeed, Flight 24, ID = 6 tracks excellently with this curve (see black dashed line) and has “recovered” at 95% of the the free stream, which amounts to a wake length of 50 –60 km.
In Figure 4, the markers are colored according to the stability classification of Table 1. Ideally, the dark red cases representing very stable conditions congregate towards the bottom part of the plot, with the orange markers representing stable conditions just above, followed by the light blue markers representing near-neutral stability above sitting higher in the plot again. However, we find a cluster of points, independent of the magnitude of stability around the blue curve proposed by Cañadillas et al. [8] and the one neutral case (Flight 26) aligning with the neutral curve (green) proposed by Cañadillas et al. [8]. The outlier dataset is from Flight 19, which fails to indicate any sign of wind speed recovery within 60 km. Another stability indicator, the bulk Richardson number calculated at hub height, points to Flight 19 being the most stable case, as shown in Appendix A. Further investigation of this case is required to explain the lack of wind speed recovery.
There is a greater spread of points here compared with the results of Cañadillas et al. [8], which we will attribute to a number of factors. For example, we have seen already in Figure 3 that non-homogeneity of the flow field complicates the estimate of the freestream wind speed at each leg U free . Moreover, since the 2016–2017 campaign was centered around the cluster N-4, which is relatively more compact and separated from the other clusters, the wake flow complexity may be simpler and, thus, more reproducible there. As there is little distinction between the near-neutral stable and very stable cases, this confounds our attempt to determine a refined stability dependence based on L using the 2020–2021 campaign data. Therefore, practical applications of FLORIS/Emeis simulations can probably only reasonably be held at a constant h / L = 0.25 in stable conditions, as shown above for Flight 24, and then set to h / L = 0 in neutral conditions.
In order to highlight some further complexities, Figure 5 presents Flight 23 on 23 July 2020, which, because of the wind direction 240°, we have divided into two separate cases corresponding to flow downstream from clusters N-2 (ID = 4, U = 12 m/s) and N-3 (ID = 5, U = 11 ). The two-dimensional flow in Figure 5 has been generated with the Emeis/FLORIS model for h / L = 0.25 and a freestream wind speed of 12 m/s. The vertical black lines have been positioned at the locations where flight legs were performed. There are two x-coordinates: Above is the coordinate for the origin at cluster N-2 (ID = 4); below is the coordinate for the origin at cluster N-3 (ID = 5). The middle row of panels (a)–(d) represent the part of the legs behind N-2 (showing only the first three legs), while the bottom row of panels (e)–(j) represent the part of the legs behind N-3.
Panel (a) shows a narrower wake width downstream from N-2 (black dashed lines) compared with the broadening shown in panel (e), as we attempt to avoid the evolving wake from N-3 in the legs downstream from N-2. Also, the legs barely extend far enough, as the flight path was designed to capture the wake centered on cluster N-3.
Panel (d) shows the wake at x = 33.8 km, which has all but disappeared behind N-2 at this position. There exists a relatively strong and clear wake signal behind N-3 corresponding to x = 12.1 km, which is excluded from the wake signal behind N-2. The FLORIS/Emeis model underestimates the wake strength behind N-3 in this case because of the inaccurate freestream wind speed ( U = 12 m/s) through that cluster, which puts the power at the limit of the partial load region for the NREL 5 MW turbine. Directly behind the N-2 cluster shown in panel (b) at x = 1.7 km are the ‘ragged’ modeled wind speeds centred on y = 3 km, illustrating that the individual turbine wakes have been directly measured in this leg. They merge into a single wake structure at x = 15.0 km (panel (c)) where the wake of Nordsee One has just been initiated (at y 15 km). Referring back to Figure 4, Flight 23 (ID = 4) corresponds to the orange stars, which, although labelled as stable, are positioned closer to the neutral curve (green dashed line) than the stable one proposed by Cañadillas et al. [8]. Hence, this particular case could be classified as near-neutral stable based on the wind speed recovery alone.
As mentioned with respect to panel (d), the wake flow that develops behind N-3 is already well formed at x = 12.1 km (with respect to the origin at N-3) before decaying noticeably at x = 22.1 km within a non-homogeneous north–south flow. The model shows a more pronounced wake in panel (f) because the simulation in the panels (f)–(j) has a freestream wind speed of 11 m/s, which is located deeper within the partial load region of the NREL 5 MW turbine compared with U = 12 m/s. Hence, the background flow has a north-west–south-east gradient typical of the climatological mean in the North Sea [39]. In theory, the FLORIS model can be set to a non-uniform input flow, but this is not generally performed in engineering calculations. In practice, many such simulations are made for a range of wind speed and wind direction bins under the assumption that non-homogeneity is averaged out from the final calculated energy yield. Nonetheless, the FLORIS/Emeis simulation tracks approximate wake decay and wind speed recovery even accounting for the flow inhomogeneity.
The wake strength decays with increasing downstream distance x, and appears to even disappear at x = 42.1 km, but a signal has recovered again at x = 52.0 km. Moreover, the wake centreline is at approximately y = 5 km at x = 32.1 km (panel (h)) and then at approximately y = 5 km at x = 52.0 km (panel (j)). Hence, wake meandering and non-uniform wind speed recovery may also contribute to the scatter in Figure 4.

4. Wake Length Scenarios

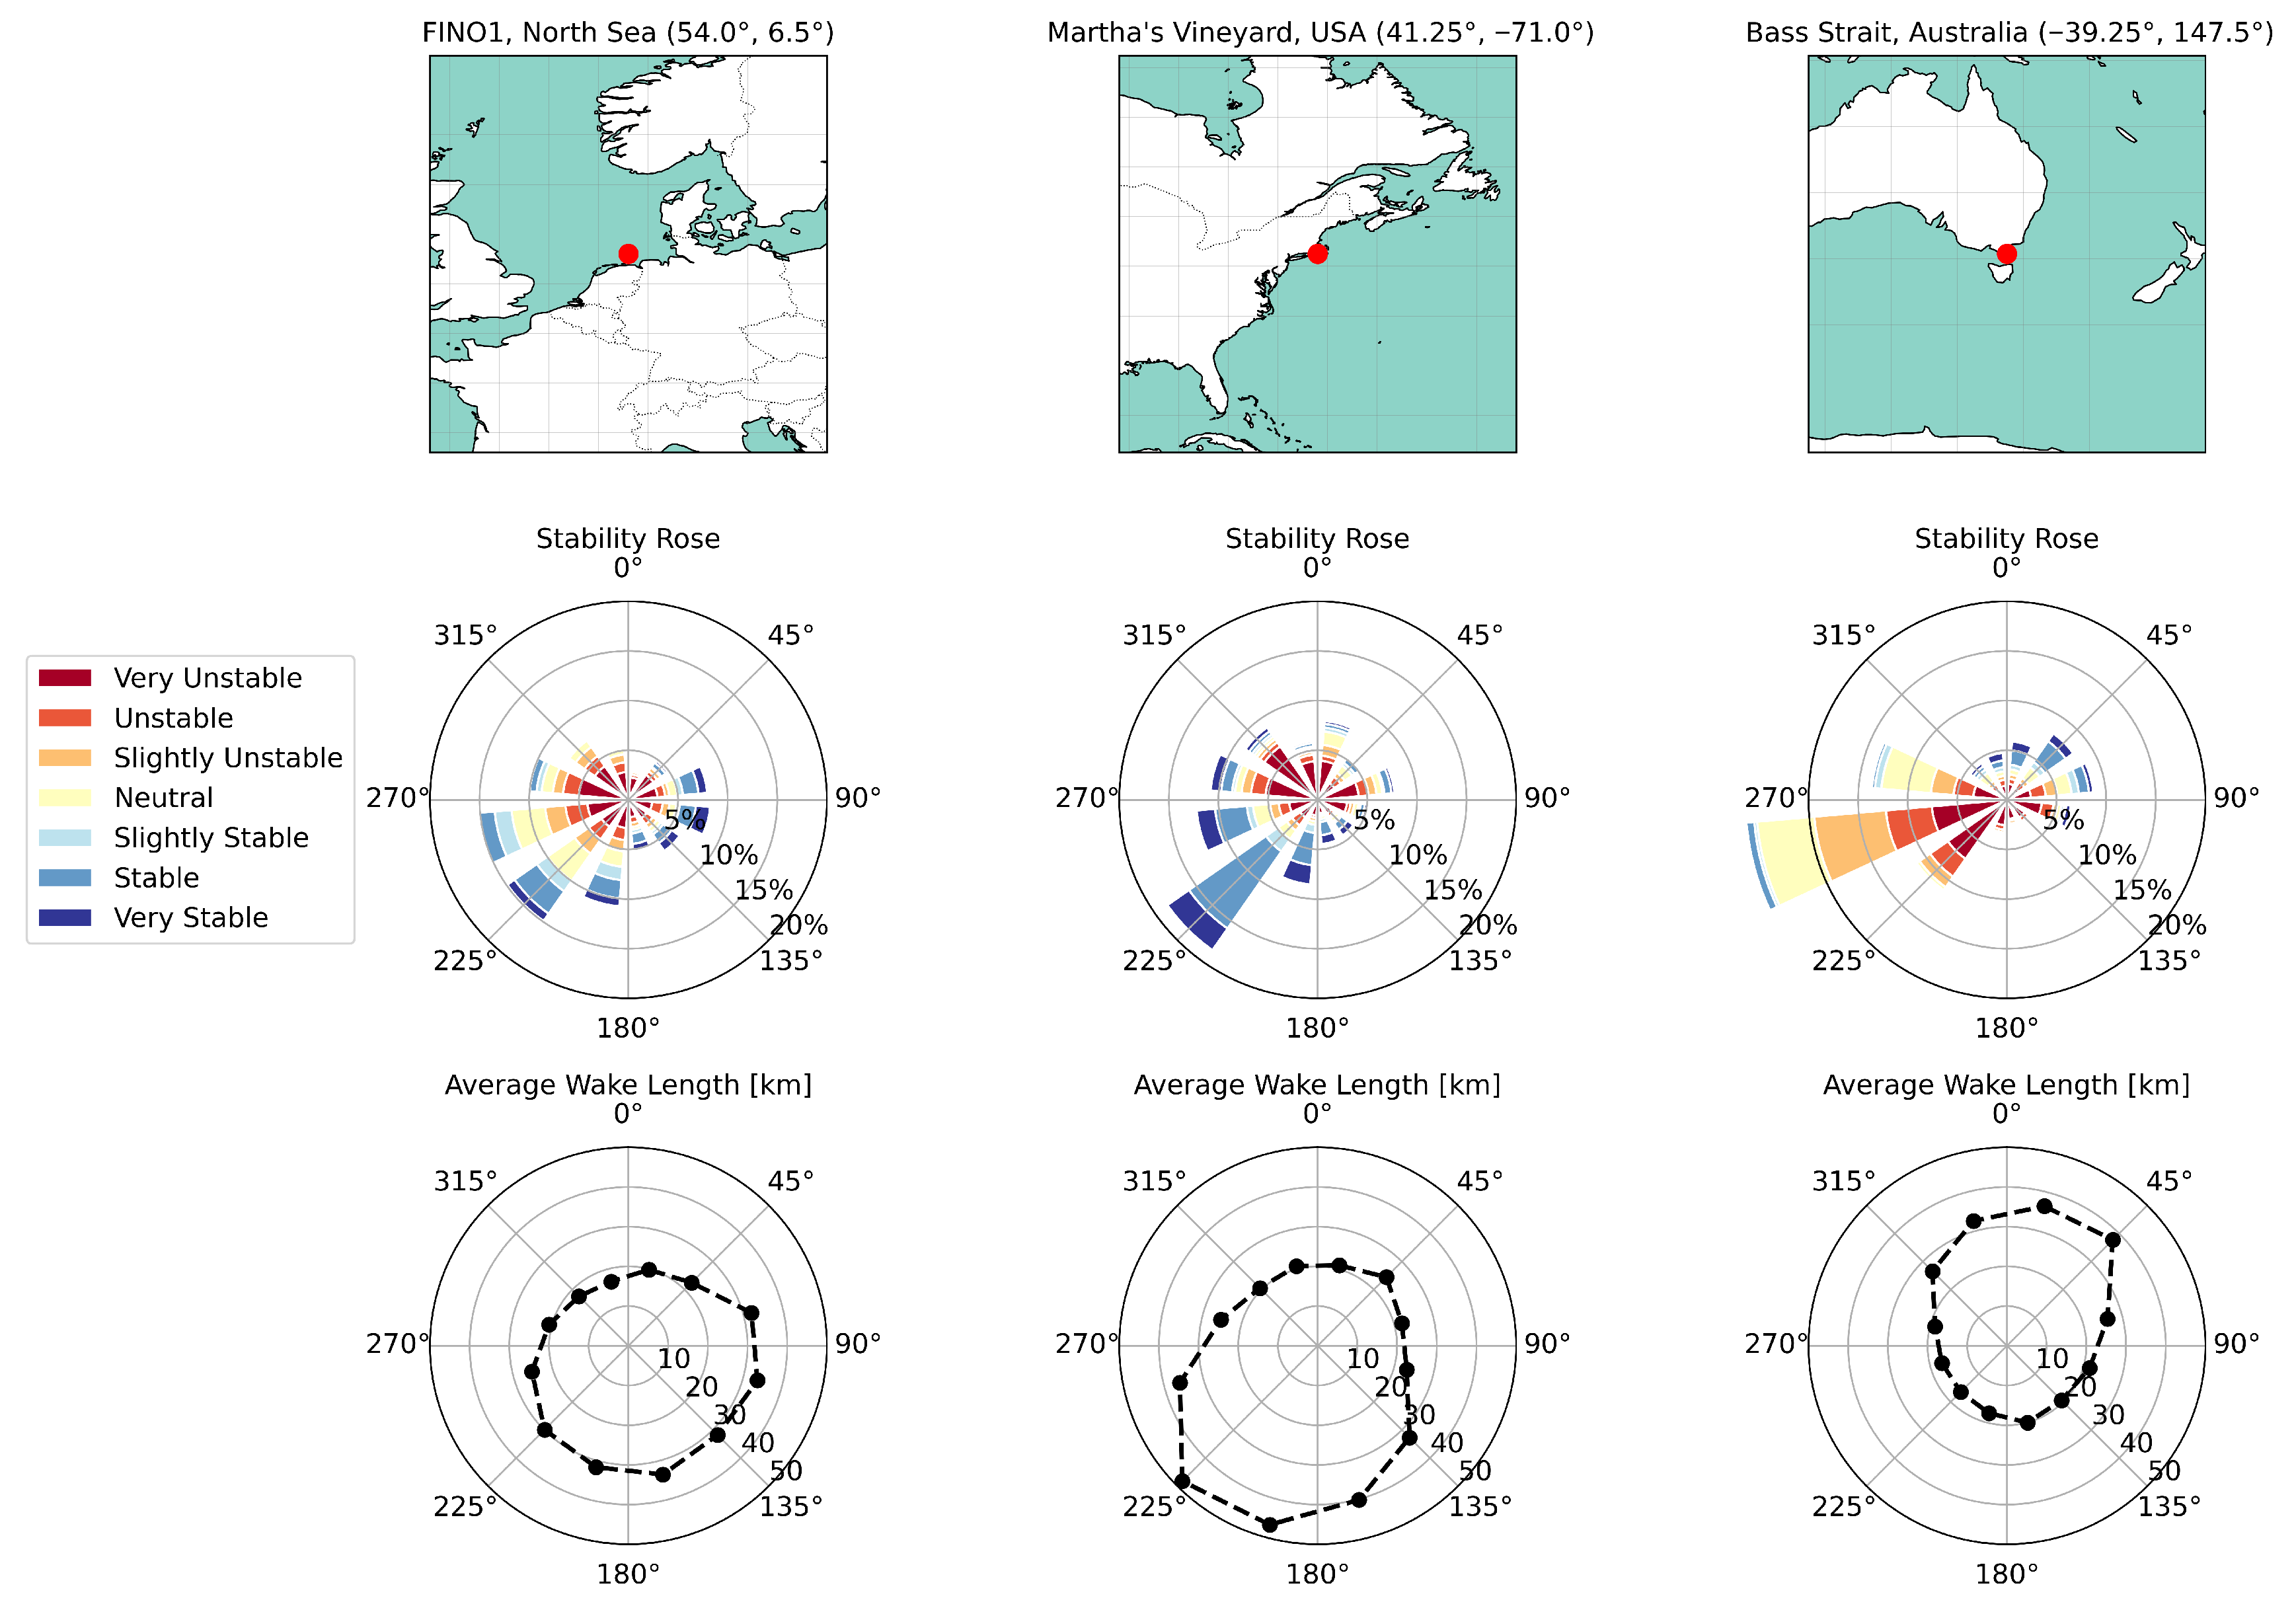
Analysis of flight data within cluster wakes here and previously by Cañadillas et al. [8] reveal consistent wake lengths exceeding 50 km in stable conditions for wind farms in the North Sea. Outside of the North Sea, the stability climatologies vary and wind farm wake lengths may need to be considered differently in other settings. In order to investigate this, we use ERA5 Global Reanalysis [26] to calculate Obukhov lengths for three different offshore locations for the single year 2024. The surface parameters extracted from offshore ERA5 data are hourly 10 m wind velocity components, the 2 m air and dew point temperature (from which to calculate relative humidity), the sea surface temperature, and surface pressure. As with FINO1 data, we use the bulk flux model formula of Andreas et al. [31] to estimate the surface fluxes over water from standard surface meteorological parameters, from which we derive the Obukhov length. The stability classes according to Sathe et al. [30] (see Table A1 in Appendix A) have then been used in constructing stability roses. Each stability case can then be converted into an assumed wake length as shown in Table A1: We assume near-neutral stable, stable, and very stable conditions correspond to cases of wake lengths of 60 km. All other cases, neutral to very unstable conditions, are interpreted as giving wake lengths of 15 km. For each direction on the wind rose, an average wake length is calculated from the hourly stability classifications and plotted in similar polar coordinates bins as the stability rose.
The three regions we have selected for consideration are interesting because one is at the FINO1-platform in the North Sea located within one of the regions of highest wind farm density in the world, and where we possess the most information regarding wind farm wake length. The East Coast of the USA (south of Martha’s Vineyard) is birthing the first North American wind farms and could soon lead to a productive expansion of wind farms in that part of the world [40,41]. Meanwhile, Bass Strait in Australia between the Australian mainland and the island of Tasmania is currently in advanced planning [42]. All three regions have similar wind resources amounting to approximately 10 m/s and about 1000 W/m2 at hub height [43].
Figure 6 presents maps of the three regions, stability roses, and average wake lengths based on the stability roses. The stability rose of FINO1 would be familiar to many [44], with winds predominantly south-westerly, with a fair mixture of stabilities. Easterly flows are rarer but often very stable, while north-westerlies from the open North Sea are usually unstable. On average, wake lengths are fairly uniform with direction, but longer average wake lengths of 30 km for flow from the mainland and south-west, and approximately 20 km from the north-west, are found. Ideally, no cluster would be within 20–30 km of a neighboring one in this region.
The stability rose at the cluster of wind farms on the East Coast, USA, south of Martha’s Vineyard, including the Vineyard Wind 1 wind farm, is also presented. The wind direction is predominantly from the south-west towards where there are warmer sea surface temperatures. Thus, as warmed air from the south-west flows over the cooler waters south of the Martha’s Vineyard, stable stratification is usually found and will result in the long wakes generated here. The average wake lengths indicate that lengths of 50 km could be expected in the predominant wind direction. Large-scale planning measures could be implemented to ensure extra wind farm spacing in this direction. However, we have assessed only one year of ERA5 data and different stability metrics and coordinates may lead to other conclusions [45,46]. Polar wake length plots based on stability roses could be generated for the precise coordinates and simulated with the analytical model if the proposed wind turbine coordinates were known.
In extreme contrast to Martha’s Vineyard, the stability rose at the position of wind farms planned for Bass Strait between the southern coast of Victoria and the northern coast of Tasmania reveals almost a uniform western wind direction in neutral to unstable conditions. Combined with this being a natural wind tunnel directing the fast and constant southern sea climate of flow from the west, one can predict this region to be an excellent position for offshore wind energy resources. We see that the predominant wind direction is from the west and usually of neutral to unstable conditions as flow proceeds from the cool southern waters to the relatively warmer Bass Strait. Moreover, the westerly flow usually brings the highest wind speeds. Wind farm wake lengths of less than 20 km will be found here, on average, except for a minority of cases for flow from the north-east in which stable conditions and wakes up to 40 km could be found. Generally, if wind farm developments are separated by 20 km, most ‘wind theft’ will probably be minimized in this region.

5. Conclusions

An analysis of the most recent X-Wakes project flights (2020–2021) for detecting wake effects in the North Sea builds on the work of Cañadillas et al. [8], who examined flight measurements from the WIPAFF project conducted in the period 2016–2017. Our results agree with the averaged wake length of approximately 60 km proposed by Cañadillas et al. [8] but with considerably more scatter. One flight did not begin to recover even within 60 km and a couple of shorter wakes of 15 km were found corresponding to near-neutral conditions. Comparisons with the analytical Emeis wake model built into FLORIS software reveal the plausible capture of wake effects and, thus, would be useful in assessing the potential resource-consuming effects from upstream wind farms in detailed offshore planning activities. This knowledge can be applied anywhere in the world, for which we provide a couple of examples in developing offshore regions beyond Northern Europe, including south of Martha’s Vineyard in the USA and Bass Strait south of Victoria in Australia. These two regions exhibit heavily contrasting stability climatologies resulting in vastly different wake length climatologies. Offshore resource assessments need to account for long wakes in order to avoid disappointed investors.

Author Contributions

Conceptualization, writing, analysis, and funding: R.J.F., C.B. and B.C. All authors have read and agreed to the published version of the manuscript.

Funding

This research has been supported by the FINO1 project (https://www.fino1.de/en/, accessed on 5 September 2025) funded by the German Federal Ministry for Economic Affairs and Climate Action (BMWK) (FKZ:03EE3115).

Data Availability Statement

Flight measurement data recorded by the Institute of Flight Guidance of the Technical University of Braunschweig are publicly available at https://doi.org/10.1594/PANGAEA.955382. ERA5 Reanalysis may be sourced from the Climate Data Store of Copernicus: https://cds.climate.copernicus.eu/, accessed on 5 September 2025) Measurements from the FINO1 platform were sourced from the BSH’s (German Federal Maritime and Hydrographic Agency) Insitu Portal accessible through https://login.bsh.de/.

Conflicts of Interest

The authors declare no conflicts of interest.

Appendix A. Stability Classification

The stability classification of Sathe et al. [30] based on the Obukhov length is reproduced in Table A1. The wake lengths are inferred from the flight results presented in Figure 4.
Table A1. The stability classification of Sathe et al. [30] and the assumed wind farm wake length.
StabilityObukhov Length [m]Wake Length [km]
Very stable 10 < L < 50 60
Stable 50 < L < 200 60
Near-neutral stable 200 < L < 500 60
Neutral | L | > 500 15
Near-neutral unstable 500 < L < 200 15
Unstable 200 < L < 100 15
Very unstable 100 < L < 50 15
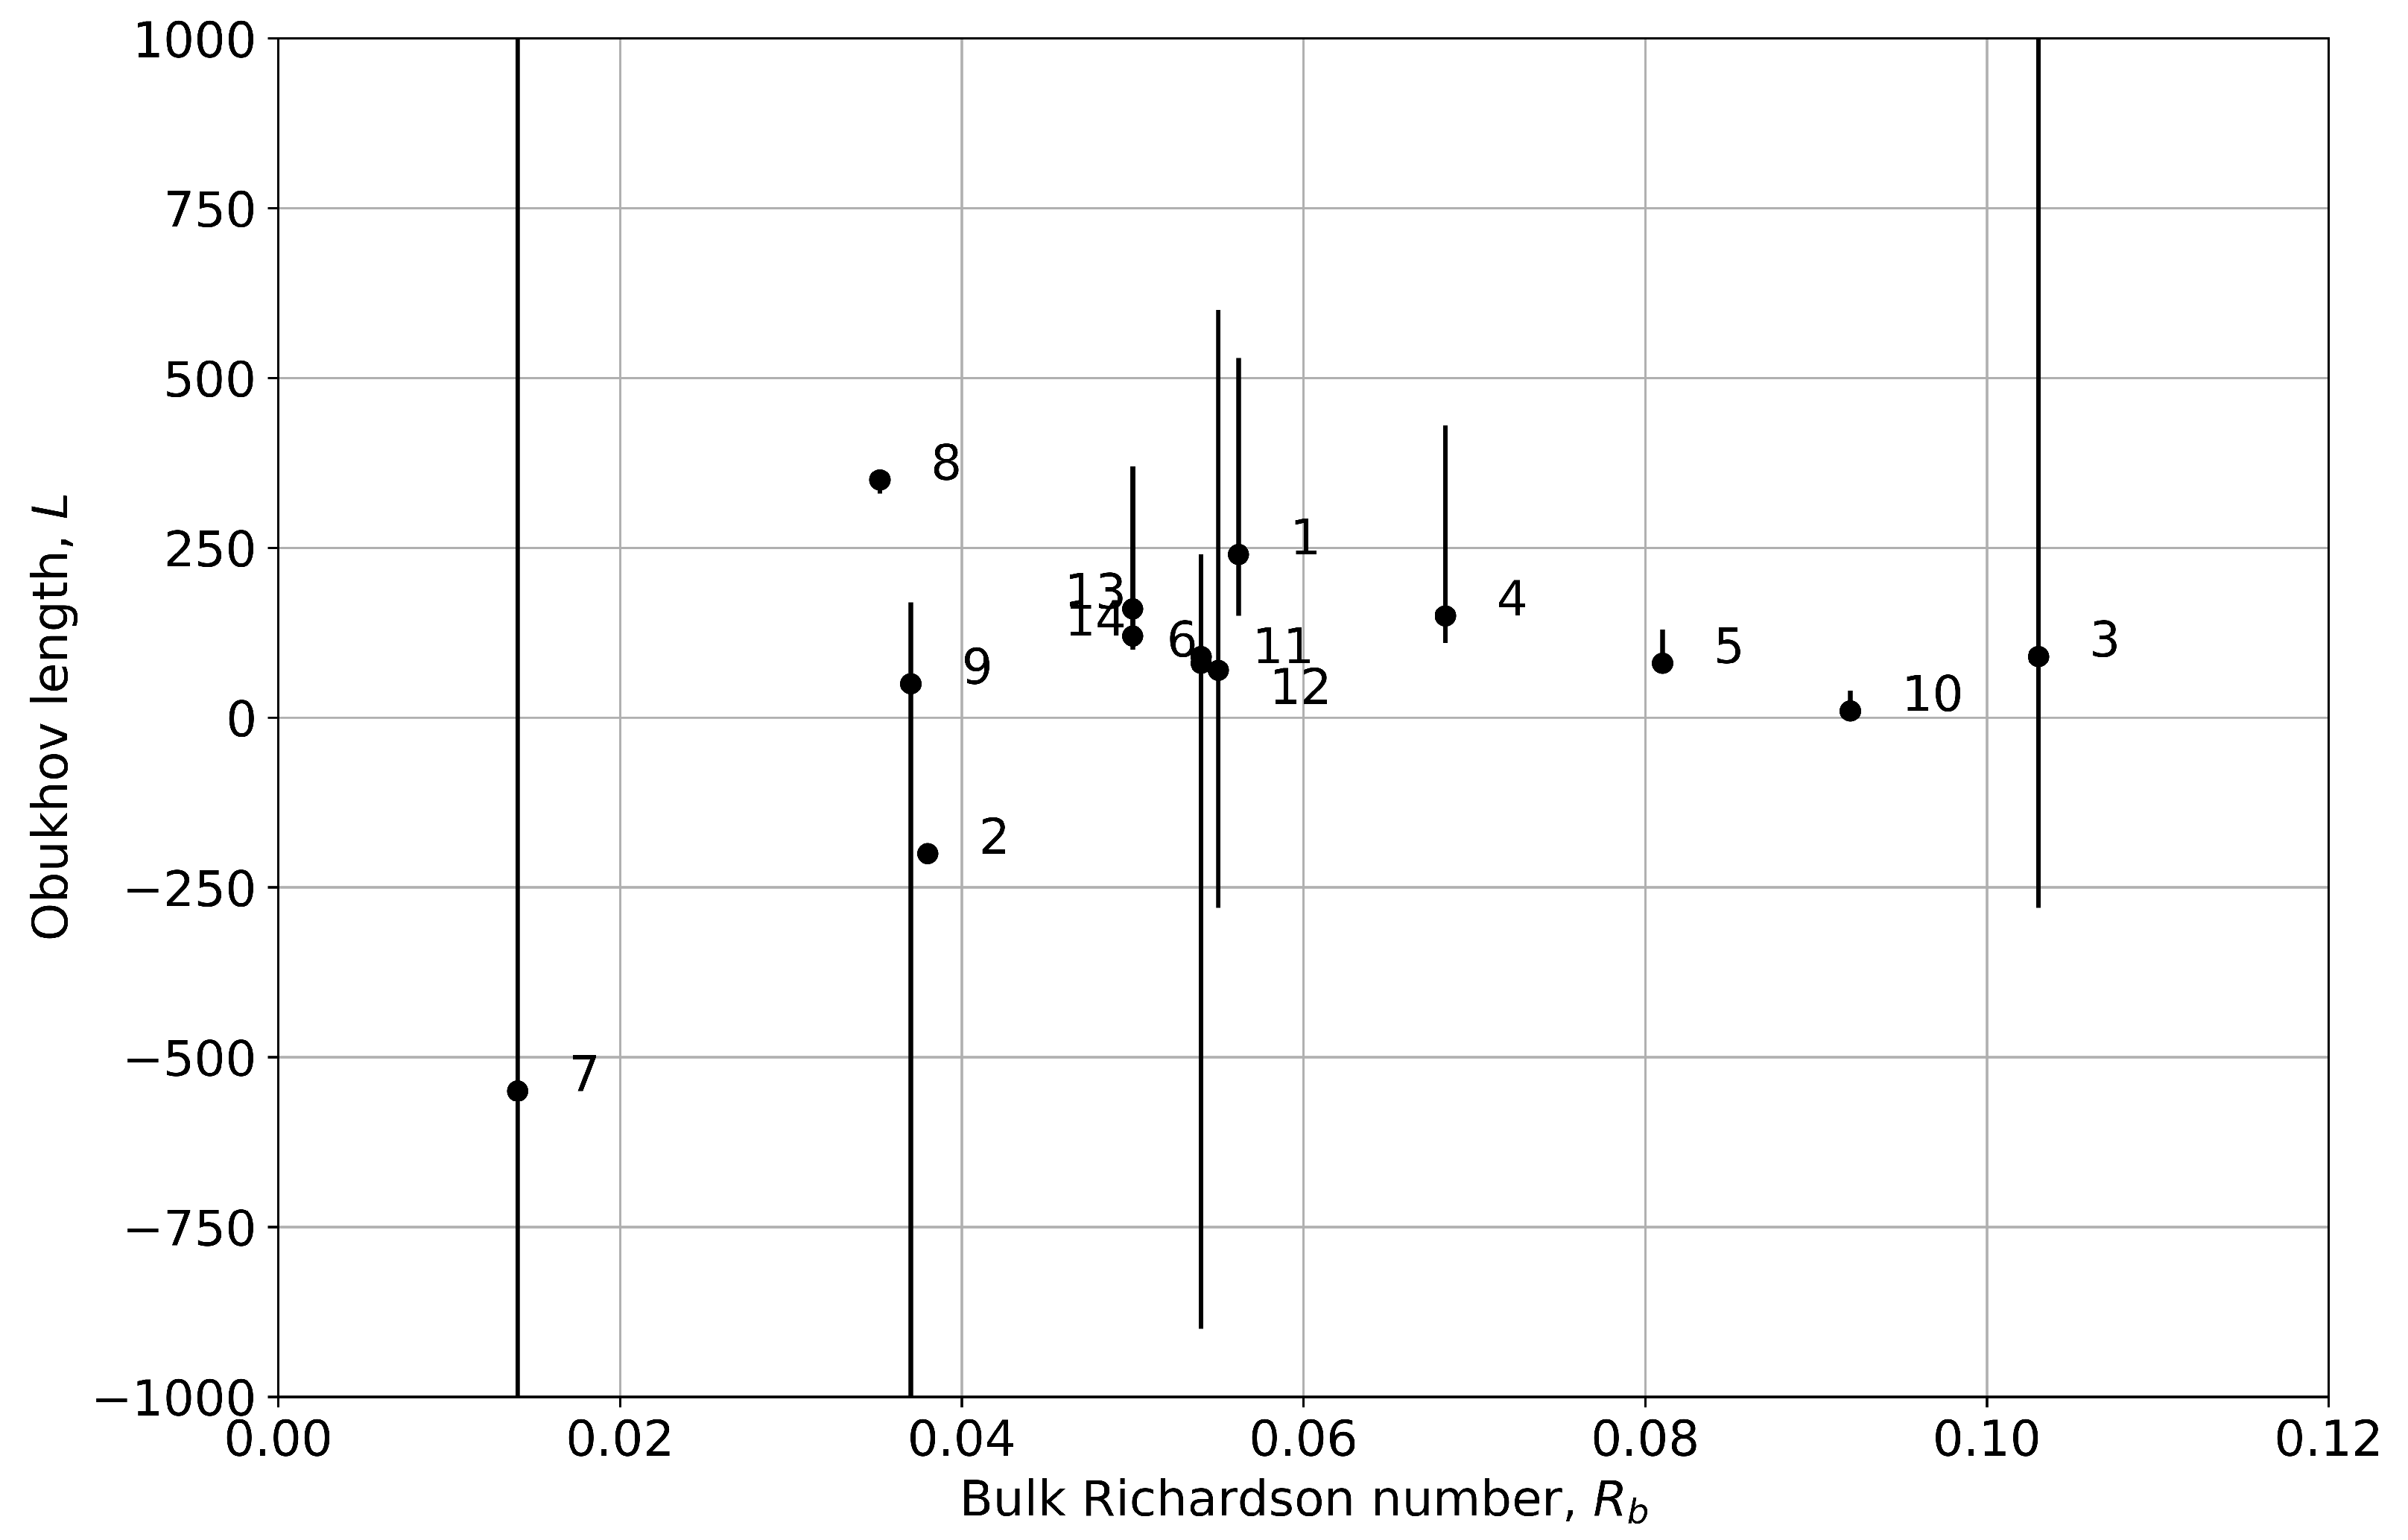
The Obukhov length L is estimated from FINO1 measurements and plotted in Figure A1 against the bulk Richardson number:
R b = ( g / T ) ( θ θ 0 ) z U 2 ,
which is calculated from flight observations at hub height. Here, θ is the potential temperature at flight altitude z, and θ 0 is the sea surface temperature. All quantities are determined from instrumentation aboard the Dornier 128.
Figure A1. The median Obukhov length estimated from FINO1 measurements and aircraft-based sea surface temperature as a function of the bulk Richardson number derived from flight data. The vertical lines show the range of variation of L which sometimes extends beyond the scale indicating near-neutral conditions. The numbers correspond to the Flight IDs in Table 1.
Energies 18 05538 g0a1
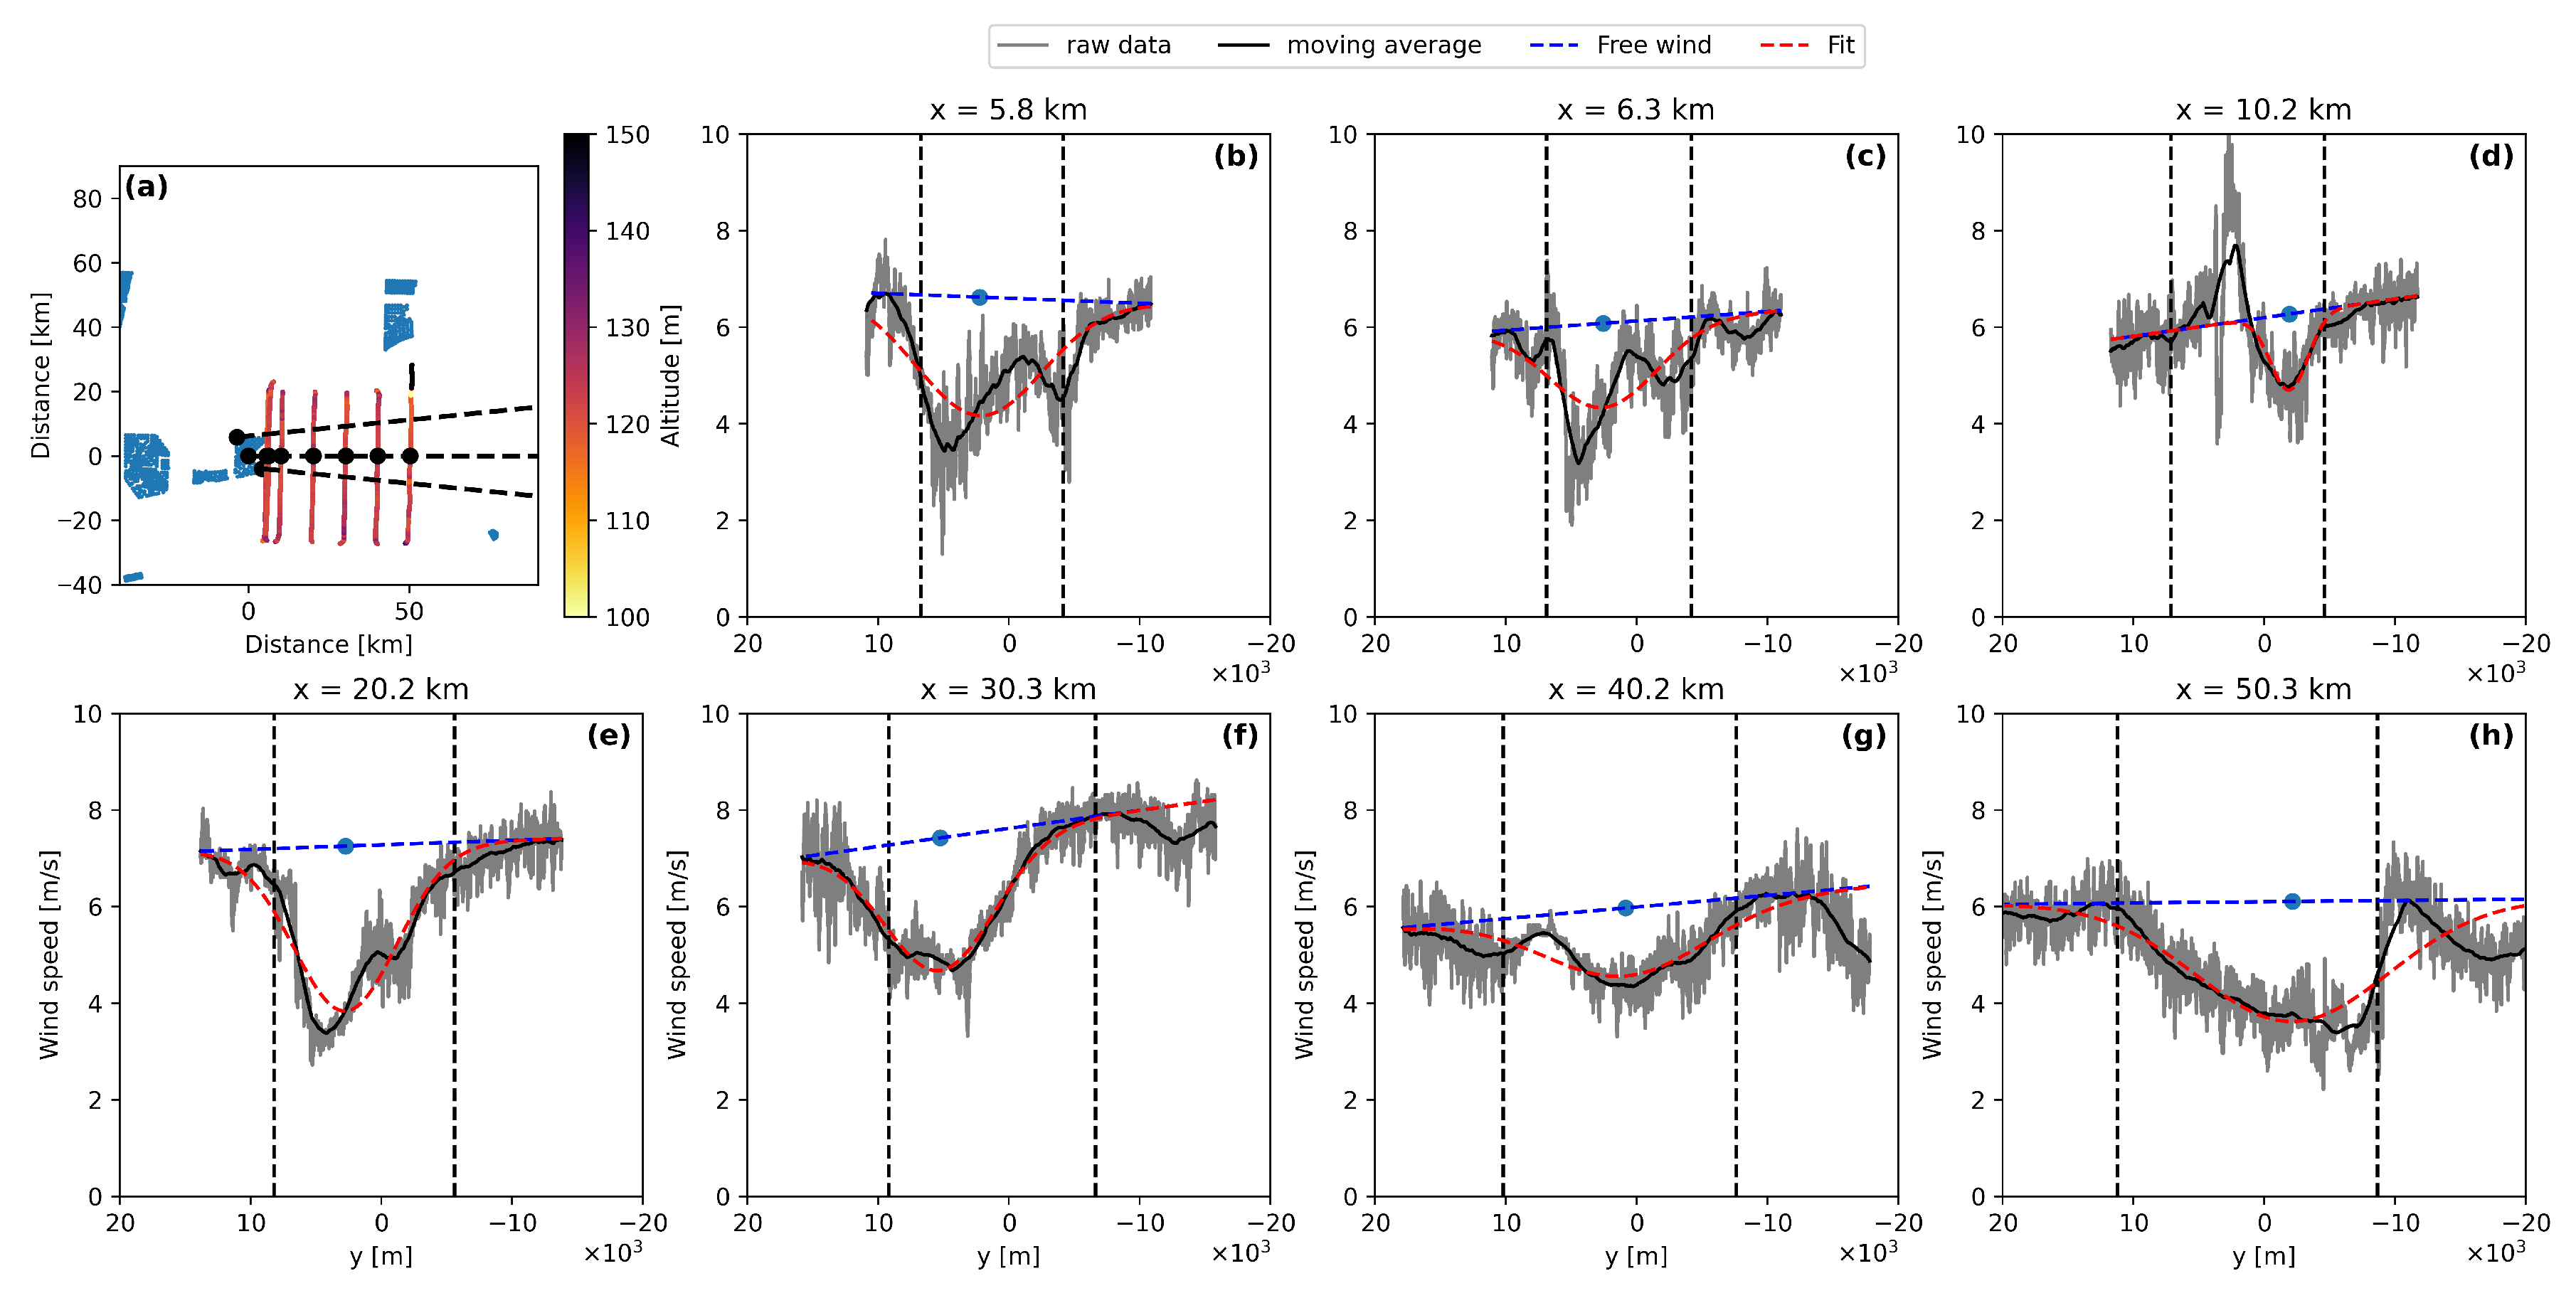
While the sign of stability is generally in agreement between these two parameters, with the exception of cases ID = 2 and 7, there is little correlation between the two parameters. The Richardson number shows that the anomalous case Flight 19 (ID = 3) occurred during the most stable conditions, but with near-neutral stable and unstable instances of L also detected, as seen by the broad error bar. The wind speeds of Flight 19 are reproduced in Figure A2.
Figure A2. Flight legs of the anomolous Flight 19 (ID = 3) presented as crosses in Figure 2. Panel (a) shows the individual legs coloured according to altitude. In panels (bh), wind speeds are represented as grey (raw 100 Hz measurements), black (smoothed measurements, and red (Gaussian fit to the smoothed data). The blue line is the assumed freestream wind speed estimated from wind speeds beyond the assumed wake width.
Energies 18 05538 g0a2

References

  1. Pryor, S.C.; Barthelmie, R.J. Wind shadows impact planning of large offshore wind farms. Appl. Energy 2024, 359, 122755. [Google Scholar] [CrossRef]
  2. Christiansen, M.B.; Hasager, C.B. Wake effects of large offshore wind farms identified from satellite SAR. Remote Sens. Environ. 2005, 98, 251–268. [Google Scholar] [CrossRef]
  3. Fitch, A.C.; Olson, J.B.; Lundquist, J.K.; Dudhia, J.; Gupta, A.K.; Michalakes, J.; Barstad, I. Local and mesoscale impacts of wind farms as parameterized in a mesoscale NWP model. Mon. Weather Rev. 2012, 140, 3017–3038. [Google Scholar] [CrossRef]
  4. Nygaard, N.G.; Hansen, S.D. Wake effects between two neighbouring wind farms. J. Phys. Conf. Ser. 2016, 753, 032020. [Google Scholar] [CrossRef]
  5. Platis, A.; Siedersleben, S.K.; Bange, J.; Lampert, A.; Bärfuss, K.; Hankers, R.; Cañadillas, B.; Foreman, R.; Schulz-Stellenfleth, J.; Djath, B.; et al. First in situ evidence of wakes in the far field behind offshore wind farms. Sci. Rep. 2018, 8, 2163. [Google Scholar] [CrossRef]
  6. Schneemann, J.; Rott, A.; Dörenkämper, M.; Steinfeld, G.; Kühn, M. Cluster wakes impact on a far-distant offshore wind farm’s power. Wind Energy Sci. 2020, 5, 29–49. [Google Scholar] [CrossRef]
  7. Akhtar, N.; Geyer, B.; Rockel, B.; Sommer, P.S.; Schrum, C. Accelerating deployment of offshore wind energy alter wind climate and reduce future power generation potentials. Sci. Rep. 2021, 11, 11826. [Google Scholar] [PubMed]
  8. Cañadillas, B.; Foreman, R.; Barth, V.; Siedersleben, S.; Lampert, A.; Platis, A.; Djath, B.; Schulz-Stellenfleth, J.; Bange, J.; Emeis, S.; et al. Offshore wind farm wake recovery: Airborne measurements and its representation in engineering models. Wind Energy 2020, 23, 1249–1265. [Google Scholar] [CrossRef]
  9. van der Laan, M.P.; Sørensen, N.N. Why the Coriolis force turns a wind farm wake clockwise in the Northern Hemisphere. Wind Energy Sci. 2017, 2, 285–294. [Google Scholar] [CrossRef]
  10. Porté-Agel, F.; Bastankhah, M.; Shamsoddin, S. Wind-turbine and wind-farm flows: A review. Bound.-Layer Meteorol. 2020, 174, 1–59. [Google Scholar] [CrossRef]
  11. Stipa, S.; Ajay, A.; Allaerts, D.; Brinkerhoff, J. The multi-scale coupled model: A new framework capturing wind farm–atmosphere interaction and global blockage effects. Wind Energy Sci. 2024, 9, 1123–1152. [Google Scholar] [CrossRef]
  12. Ouro, P.; Ghobrial, M.; Ali, K.; Stallard, T. Numerical modelling of offshore wind-farm cluster wakes. Renew. Sustain. Energy Rev. 2025, 215, 115526. [Google Scholar] [CrossRef]
  13. Djath, B.; Schulz-Stellenfleth, J.; Cañadillas, B. Study of Coastal Effects Relevant for Offshore Wind Energy Using Spaceborne Synthetic Aperture Radar (SAR). Remote Sens. 2022, 14, 1688. [Google Scholar] [CrossRef]
  14. Cañadillas, B.; Beckenbauer, M.; Trujillo, J.J.; Dörenkämper, M.; Foreman, R.; Neumann, T.; Lampert, A. Offshore wind farm cluster wakes as observed by long-range-scanning wind lidar measurements and mesoscale modeling. Wind Energy Sci. 2022, 7, 1241–1262. [Google Scholar] [CrossRef]
  15. Platis, A.; Bange, J.; Bärfuss, K.; Cañadillas, B.; Hundhausen, M.; Djath, B.; Lampert, A.; Schulz-Stellenfleth, J.; Siedersleben, S.; Neumann, T.; et al. Long-range modifications of the wind field by offshore wind parks - results of the project WIPAFF. Meteorol. Z. 2020, 29, 355–376. [Google Scholar] [CrossRef]
  16. Lampert, A.; Bärfuss, K.; Platis, A.; Siedersleben, S.; Djath, B.; Cañadillas, B.; Hunger, R.; Hankers, R.; Bitter, M.; Feuerle, T.; et al. In situ airborne measurements of atmospheric and sea surface parameters related to offshore wind parks in the German Bight. Earth Syst. Sci. Data 2020, 12, 935–946. [Google Scholar] [CrossRef]
  17. Emeis, S. A simple analytical wind park model considering atmospheric stability. Wind Energy 2010, 13, 459–469. [Google Scholar] [CrossRef]
  18. Emeis, S. Wind Energy Meteorology: Atmospheric Physics for Wind Power Generation; Springer: Berlin/Heidelberg, Germany, 2018. [Google Scholar]
  19. Cañadillas, B.; Foreman, R.; Steinfeld, G.; Robinson, N. Cumulative interactions between the global blockage and wake effects as observed by an engineering model and large-eddy simulations. Energies 2023, 16, 2949. [Google Scholar] [CrossRef]
  20. Lampert, A.; Hankers, R.; Feuerle, T.; Rausch, T.; Cremer, M.; Angermann, M.; Bitter, M.; Füllgraf, J.; Schulz, H.; Bestmann, U.; et al. In situ airborne measurements of atmospheric parameters and airborne sea surface properties related to offshore wind parks in the German Bight during the project X-Wakes. Earth Syst. Sci. Data Discuss. 2024, 16, 4777–4792. [Google Scholar] [CrossRef]
  21. zum Berge, K.; Centurelli, G.; Dörenkämper, M.; Bange, J.; Platis, A. Evaluation of Engineering Models for Large-Scale Cluster Wakes With the Help of In Situ Airborne Measurements. Wind Energy 2024, 27, 1040–1062. [Google Scholar] [CrossRef]
  22. Foreman, R.J.; Cañadillas, B.; Robinson, N. The atmospheric stability dependence of far wakes on the power output of downstream wind farms. Energies 2024, 17, 488. [Google Scholar] [CrossRef]
  23. Maas, O.; Raasch, S. Wake properties and power output of very large wind farms for different meteorological conditions and turbine spacings: A large-eddy simulation case study for the German Bight. Wind Energy Sci. 2022, 7, 715–739. [Google Scholar] [CrossRef]
  24. Stieren, A.; Stevens, R.J. Impact of wind farm wakes on flow structures in and around downstream wind farms. Flow 2022, 2, E21. [Google Scholar] [CrossRef]
  25. Emeis, S. Analysis of some major limitations of analytical top-down wind-farm models. Bound.-Layer Meteorol. 2023, 187, 423–435. [Google Scholar] [CrossRef]
  26. Hersbach, H.; Bell, B.; Berrisford, P.; Hirahara, S.; Horányi, A.; Muñoz-Sabater, J.; Nicolas, J.; Peubey, C.; Radu, R.; Schepers, D.; et al. The ERA5 global reanalysis. Q. J. R. Meteorol. Soc. 2020, 146, 1999–2049. [Google Scholar] [CrossRef]
  27. Bärfuss, K.; Hankers, R.; Bitter, M.; Feuerle, T.; Schulz, H.; Rausch, T.; Platis, A.; Bange, J.; Lampert, A. In-Situ Airborne Measurements of Atmospheric and Sea Surface Parameters Related to Offshore Wind Parks in the German Bight; PANGAEA: Bremen, Germany, 2019. [Google Scholar] [CrossRef]
  28. Corsmeier, U.; Hankers, R.; Wieser, A. Airborne turbulence measurements in the lower troposphere onboard the research aircraft Dornier 128-6, D-IBUF. Meteorol. Z. 2001, 10, 315–329. [Google Scholar] [CrossRef]
  29. Rausch, T.; Bärfuss, K.; Hankers, R.; Bitter, M.; Feuerle, T.; Cremer, M.; Angermann, M.; Füllgraf, J.; Lampert, A. In-Situ Airborne Measurements of Atmospheric and Sea Surface Parameters Related to Offshore Wind Parks in the German Bight; PANGAEA: Bremen, Germany, 2023. [Google Scholar] [CrossRef]
  30. Sathe, A.; Mann, J.; Barlas, T.; Bierbooms, W.A.; van Bussel, G.J. Influence of atmospheric stability on wind turbine loads. Wind Energy 2013, 16, 1013–1032. [Google Scholar] [CrossRef]
  31. Andreas, E.L.; Mahrt, L.; Vickers, D. A new drag relation for aerodynamically rough flow over the ocean. J. Atmos. Sci. 2012, 69, 2520–2537. [Google Scholar] [CrossRef]
  32. Fischer, G. Installation and operation of the research platform FINO 1 in the North Sea. In Offshore Wind Energy: Research on Environmental Impacts; Springer: Berlin/Heidelberg, Germany, 2006; pp. 237–253. [Google Scholar]
  33. Jensen, N.O. A Note on Wind Generator Interaction; Risø National Laboratory: Roskilde, Denmark, 1983. [Google Scholar]
  34. Nygaard, N.G.; Steen, S.T.; Poulsen, L.; Pedersen, J.G. Modelling cluster wakes and wind farm blockage. J. Phys. Conf. Ser. 2020, 1618, 062072. [Google Scholar] [CrossRef]
  35. Fleming, P.; Annoni, J.; Scholbrock, A.; Quon, E.; Dana, S.; Schreck, S.; Raach, S.; Haizmann, F.; Schlipf, D. Full-scale field test of wake steering. J. Phys. Conf. Ser. 2017, 854, 012013. [Google Scholar] [CrossRef]
  36. Nygaard, N.; Poulsen, L.; Svensson, E.; Pedersen, J.G. Large-scale benchmarking of wake models for offshore wind farms. J. Phys. Conf. Ser. 2022, 2265, 022008. [Google Scholar] [CrossRef]
  37. Munters, W.; Adiloglu, B.; Buckingham, S.; Beeck, J.v. Wake impact of constructing a new offshore wind farm zone on an existing downwind cluster: A case study of the Belgian Princess Elisabeth zone using FLORIS. J. Phys. Conf. Ser. 2022, 2265, 022049. [Google Scholar] [CrossRef]
  38. Jonkman, J.; Butterfield, S.; Musial, W.; Scott, G. Definition of a 5-MW Reference Wind Turbine for Offshore System Development; Technical Report; National Renewable Energy Laboratory (NREL): Golden, CO, USA, 2009. [Google Scholar]
  39. Dörenkämper, M.; Olsen, B.T.; Witha, B.; Hahmann, A.N.; Davis, N.N.; Barcons, J.; Ezber, Y.; García-Bustamante, E.; González-Rouco, J.F.; Navarro, J.; et al. The making of the new european wind atlas—Part 2: Production and evaluation. Geosci. Model Dev. Discuss. 2020, 2020, 1–37. [Google Scholar] [CrossRef]
  40. Livingston, H.G.; Lundquist, J.K. How many offshore wind turbines does New England need? Meteorol. Appl. 2020, 27, e1969. [Google Scholar] [CrossRef]
  41. Barthelmie, R.J.; Larsen, G.C.; Pryor, S.C. Modeling Annual Electricity Production and Levelized Cost of Energy from the US East Coast Offshore Wind Energy Lease Areas. Energies 2023, 16, 4550. [Google Scholar] [CrossRef]
  42. Gao, Q.; Hayward, J.A.; Sergiienko, N.; Khan, S.S.; Hemer, M.; Ertugrul, N.; Ding, B. Detailed mapping of technical capacities and economics potential of offshore wind energy: A case study in South-eastern Australia. Renew. Sustain. Energy Rev. 2024, 189, 113872. [Google Scholar] [CrossRef]
  43. Davis, N.N.; Badger, J.; Hahmann, A.N.; Hansen, B.O.; Mortensen, N.G.; Kelly, M.; Larsén, X.G.; Olsen, B.T.; Floors, R.; Lizcano, G.; et al. The Global Wind Atlas: A high-resolution dataset of climatologies and associated web-based application. Bull. Am. Meteorol. Soc. 2023, 104, E1507–E1525. [Google Scholar] [CrossRef]
  44. Emeis, S.; Siedersleben, S.; Lampert, A.; Platis, A.; Bange, J.; Djath, B.; Schulz-Stellenfleth, J.; Neumann, T. Exploring the wakes of large offshore wind farms. J. Phys. Conf. Ser. 2016, 753, 092014. [Google Scholar] [CrossRef]
  45. Archer, C.L.; Colle, B.A.; Veron, D.L.; Veron, F.; Sienkiewicz, M.J. On the predominance of unstable atmospheric conditions in the marine boundary layer offshore of the US northeastern coast. J. Geophys. Res. Atmos. 2016, 121, 8869–8885. [Google Scholar] [CrossRef]
  46. Bodini, N.; Lundquist, J.K.; Kirincich, A. US East Coast lidar measurements show offshore wind turbines will encounter very low atmospheric turbulence. Geophys. Res. Lett. 2019, 46, 5582–5591. [Google Scholar] [CrossRef]
Figure 1. Example of a flight path (Flight 23, 23 July 2020) conducted during the X-Wakes flight campaign. The flight ‘legs’ behind each cluster are approximately aligned with the predominant wind direction of 240°.
Energies 18 05538 g001
Figure 2. Spatial wind speed distribution from the FLORIS/Emeis model for (a) neutral and (b) stable conditions using the wind farm configuration reported by Stieren and Stevens [24] (see their Figure 4). in their LES work, for two staggered wind farms separated by (a) 5 km, (b) 10 km, and (c) 15 km, two aligned wind farms separated by (d) 10 km, and (e) a staggered–aligned set-up separated by 10 km. Length and spanwise coordinates are normalized by the farm length and width, respectively.
Energies 18 05538 g002
Figure 3. Flight 24 from N-2 (Trianel, Merkur, alpha ventus, and Borkum Riffgrund I and II) to N-3 (Nordsee One and Godewind I and II) and further downstream for wind speed U = 9 m/s and a wind direction of 270° in stable conditions. Top panel: the corresponding FLORIS/Emeis simulation for the Monin–Obukhov similarity parameter h / L = 0.25 . The origins of the top and bottom x-axes are placed at the alpha ventus (top axis) and Godewind (bottom axis) wind farms. The vertical black lines are positioned at the location of the flight legs. The recorded wind speeds from these legs are plotted in the panels (bj) below along with the wind speeds from the FLORIS/Emeis simulation. Panel (a) shows the individual legs colored according to altitude. The origin of the plot in panel (a) is located at the alpha ventus wind farm in cluster N-2. In panels (bf), wind speeds are represented as grey (raw 100 Hz measurements), black (smoothed measurements), red dashed (Gaussian fit to the smoothed data), and yellow dashed (FLORIS/Emeis wind speeds). The dashed blue line is the assumed freestream wind speed estimated from wind speeds beyond the assumed wake width. The ‘wake length’ in this instance is interpreted as the recovery distance downstream from Godewind (bottom x-axis in the top panel).
Energies 18 05538 g003
Figure 4. Wind speed recovery calculated by Equation (5) from the flights listed in Table 1. The dashed curves are the exponential fits used in Cañadillas et al. [8] for flights of the 2016–2017 campaign. The Emeis analytical model (solid black line) is for stable conditions ( h / L = 0.25 ) and input parameters to match the stable Cañadillas et al. [8] curve (blue dashed line). The horizontal dotted line corresponds to the assumed wind speed recovery of 95%. The dashed black line emphasises the track of the Flight 24, ID = 6 as shown above in Figure 3.
Energies 18 05538 g004
Figure 5. Flight 23 from N-2 to N-4 (ID = 4), and N-3 to further downstream (ID = 5), for freestream wind speeds U = 12 m/s and 11 m/s, respectively, and a wind direction of 240° in stable conditions. Top panel: the corresponding FLORIS/Emeis simulation for U = 12 m/s and h / L = 0.25 . The vertical black lines are positioned at the flight legs whose recorded wind speeds are plotted in the panels below along with the results of the FLORIS/Emeis simulation. The x-coordinates along the top refer to the origin at N-2 (panels (ad)) while the x-coordinates along the bottom refer to the origin at N-3. Panels (a,e) show the individual legs coloured according to altitude whose origin is at the Merkur and Godewind wind farms in clusters N-2 and N-3, respectively. In panels (bd,fj), wind speeds are represented as grey (raw 100 Hz measurements), black (smoothed measurements), red (Gaussian fit to the smoothed data), and yellow (FLORIS/Emeis wind speeds). The blue line is the assumed freestream wind speed estimated from wind speeds beyond the assumed wake width. Panels (bd,fj) correspond to the origin at cluster N-2 and N-3, respectively. For example, panel (d) ( x = 33.1 km) shows wind speeds to the left of panel (f) ( x = 12.1 km) when looking downstream.
Energies 18 05538 g005
Figure 6. Maps showing the locations of FINO1, Martha’s Vineyard, and Bass Strait (top), stability roses (middle) formed from offshore ERA5 data for the year 2024, and corresponding polar plots (bottom) of average wake lengths at the corresponding locations.
Energies 18 05538 g006
Table 1. Summary of the selected meandering flights from the X-Wakes 2020–2021 campaign for flow from the west and south-west downstream of the N-2, N-3, and N-4 clusters for wind speeds within the partial load region of most wind turbines.
ID aFlight
No. b
Cluster
Interaction c
DateTime d
[UTC]
No.
Legs
Wind
Speed U
[m/s] e
Wind
Speed
U free
[m/s] f
Wind
Direction
[°] g
Obukhov
Length
L [m] h
Stability i
117N-3–3 Jul 202011:55–13:0551211.1 ± 0.5 240240near-neutral stable
217N-2–N-43 Jul 202011:10–11:2511210.9240−200unstable
319N-2–N-3–14 Jul 202014:05–15:50886.4 ± 0.7 27090stable
423N-2–N-423 Jul 202012:30–13:3031210.6 ± 1.4 240150stable
523N-3–23 Jul 202013:20–14:4051110.6 ± 0.4 24080stable
624N-2–N-3–24 Jul 20209:10–10:50799.5 ± 0.7 27090stable
726N-2–N-328 Jul 20209:10–10:1031515.1 ± 0 250−550neutral
835N-3–8 Apr 202113:40–14:5051716.5 ± 0.2 240350near-neutral stable
944N-3–27 Jul 202110:45–12:2051010.2 ± 0.3 23050very stable
1044N-4–27 Jul 202112:30–13:4541110.6 ± 0.4 23010very stable
1148N-3–30 Jul 20218:30–10:0551110.9 ± 0.4 24080stable
1248N-4–30 Jul 202110:30–11:0521112.3 ± 1.1 24070stable
1349N-3–11 Sep 202113:25–14:455910.0 ± 0.5 240160stable
1449N-4–11 Sep 202114:50–15:45499.4 ± 0.5 240120stable
a Identification (ID) to distinguish cases of the same flight number. b Numbers (No.) based on Lampert et al. [20]. c Cluster designations “N” (= North Sea) based on the German government’s offshore wind farm area development plan. N-3 denotes cluster N-3 while N-3 is a flight downstream from N-3 (see Figure 1). d Approximate to the nearest 5 min from the first to the final leg. e Estimated to the nearest integer from comparison of model with flight data. f Mean and standard deviation of the values of inferred free wind from flight data outside the wake. g Approximate to the nearest 10° estimated from flight data. h The median Obukhov length calculated with Equation (1) during the period shown in Time. The ranges of L are displayed in Figure A1. i Based on the stability classification of Sathe et al. [30] and reproduced in Appendix A.
Disclaimer/Publisher’s Note: The statements, opinions and data contained in all publications are solely those of the individual author(s) and contributor(s) and not of MDPI and/or the editor(s). MDPI and/or the editor(s) disclaim responsibility for any injury to people or property resulting from any ideas, methods, instructions or products referred to in the content.