Article

The Impact of Brine Saturation and Distribution on Lean Gas Huff-n-Puff EOR Performance of Tight Oil Reservoirs: Examples from the Montney Formation (Canada)

by
Chengyao Song
*,
Amin Ghanizadeh
and
Christopher R. Clarkson
Department of Earth, Energy, and Environment, University of Calgary, 2500 University Drive NW, Calgary, AB T2N 1N4, Canada
*
Author to whom correspondence should be addressed.
Energies 2025, 18(20), 5537; https://doi.org/10.3390/en18205537
Submission received: 19 September 2025 / Revised: 16 October 2025 / Accepted: 20 October 2025 / Published: 21 October 2025
(This article belongs to the Special Issue Challenges and Opportunities in the Global Clean Energy Transition)

Abstract

Oil recovery from low-permeability (‘tight’) oil reservoirs remains low despite the application of modern drilling and completions technologies, which has increased interest in trialing enhanced oil recovery (EOR) schemes. Cyclic gas injection (Huff-n-Puff, HNP) is a promising approach to EOR for these reservoirs. However, the underlying mechanisms of EOR using the HNP scheme in tight reservoirs are not yet fully understood. This laboratory study investigates the performance of lean gas (80%C1 + 20%C2; approximating produced gas compositions from the field) HNP using low-permeability core plug samples from the Montney Formation of Canada. An objective of the study was to evaluate the effects of induced fractures, and brine saturation and distribution, on the efficiency of lean gas HNP performance. Both intact and artificially fractured core plugs were studied. The introduction of fractures into the low-permeability core plugs improved recovery factors by 17.5–18.5%. However, the presence of brine limited oil production from both intact and fractured core plugs. Notably, when brine was concentrated along the fracture surfaces, the recovery factor dropped significantly, down to just 1.2% of original oil in place (OOIP). This reduction is primarily attributed to the low solubility of methane and ethane (C1 + C2) in brine, which hinders the injectant’s ability to diffuse into the core matrix and mobilize oil. The findings of this study will be of interest to operators evaluating the potential of cyclic gas injection in low-permeability reservoirs.

1. Introduction

With global oil and gas consumption continuing to rise and conventional hydrocarbon reserves on decline, there has been an increased focus on low-permeability (“unconventional”) hydrocarbon (such as tight oil and liquid-rich gas) reservoir development. Multi-fractured horizontal wells (MFHWs) are currently the most popular technology used to exploit these resources. However, oil recovery from these reservoirs remains low, and production decline rates are often rapid [1]. To address this low recovery, there has been an increased focus on enhanced oil recovery schemes. The gas Huff-n-Puff (HNP) scheme using MFHWs, which involves cycles of gas injection (“huff”), soaking, and production (“puff”), has been tested in the laboratory and in the field, yielding favorable results [2,3,4,5,6,7]. Nevertheless, the complex reservoir characteristics of tight oil reservoirs—such as fracture complexity, reservoir heterogeneity, fluid saturation distributions, wettability distribution, etc.—affect lean gas HNP EOR results [5,8,9,10,11,12,13]. Moreover, there have been limited studies of EOR performance in tight oil reservoir where reservoir energy has been depleted following primary recovery.
As shown in Table 1, several experimental studies have focused on the gas HNP scheme in tight rock. Gas type, reservoir pressures and reservoir petrophysical properties (e.g., permeability, porosity, and wettability) are the primary factors influencing recovery performance [1,3]. Several studies also explored the impact of brine saturation on oil recovery from tight rock samples (e.g., Table 1; [3,8,14]) It has been observed that increased brine saturation consistently resulted in a decline in oil recovery. However, these investigations typically assumed a homogeneous distribution of brine within the rock, which does not accurately reflect in situ reservoir conditions [8,14,15]. It is believed that reservoir heterogeneity caused by the introduction of hydraulic fractures could lead to highly heterogeneous brine distributions [1,16]. Importantly, the impact of heterogeneous brine distributions on cyclic solvent injection processes, particularly lean gas HNP, in tight oil reservoir remains largely unexplored.
To assess the impact of brine saturation and its distribution on lean gas HNP performance in depleted tight oil systems, a series of experiments were conducted using dead oil and core samples from the Montney Formation in Alberta, Canada. Initially, two HNP experiments were performed on two intact core plugs (i.e., without induced fractures), each with a different level of brine saturation (0% vs. 33.9%), to evaluate the influence of brine content on oil recovery. Following this, the same two core plugs were artificially fractured under in situ conditions, and subjected to a second set of HNP tests, allowing for a direct comparison of the effect of brine saturation in fractured versus unfractured samples. Additionally, a third core plug sample was fractured prior to the HNP testing, and formation brine was introduced directly through the fractures to simulate non-uniform brine distribution in the matrix—a condition more representative of the actual reservoir environment immediately after hydraulic fracturing. The HNP test with the third core sample aimed to examine the effect of heterogeneous brine distribution on lean gas HNP efficiency. The findings from these experiments provided valuable insights into the roles of brine saturation and distribution during solvent-based EOR schemes applied to low-permeability hydrocarbon reservoirs.

2. Mechanisms of Lean Gas HNP in Tight Oil Reservoirs

As previously discussed (e.g., Ghanizadeh et al. [3]), during cyclic gas injection (e.g., lean gas) in tight oil reservoirs, the primary EOR mechanisms include gas-induced oil swelling, interfacial tension (IFT) reduction, oil viscosity reduction, extraction of light-medium components, solution gas drive, and free gas expansion [7,22,23,24,25,26,27]. Additionally, the induced fractures of tight oil reservoir increase the contact interface between the injected lean gas and crude oil, enhancing the diffusion of gas into the oil-saturated matrix [28,29]. However, the presence of brine in the matrix also hinders oil flow by reducing oil phase relative permeability, which in turn leads to a lower oil recovery factor [30].

3. Materials

3.1. Rock Samples

Three core plug samples were collected from the Montney Formation of Alberta, Canada. These samples were extracted from the 2/3 slabbed cores, with the core plugs cut parallel to the bedding planes. Prior to performing the HNP experiments, a comprehensive suite of petrophysical and geochemical analyses were conducted on the core samples. As summarized in Table 2 and Table 3, the quartz, K-feldspar, and clay content of the rock are around 42.03 wt.%, 7.82 wt.%, and around 22.64 wt.%, respectively. The porosity of the core samples is 4.2% for Sample #1, 4.4% for Sample #2, and 2.6% for Sample #3, respectively, while the permeability is 0.00042 md for Sample #1, 0.00078 md for Sample #2, and 0.00022 md for Sample #3, respectively. Samples #1 and #2 were sister core plugs obtained from the same depth, whereas Sample #3 was collected from a nearby location and exhibits similar petrophysical properties.
The core samples used in this study were selected to have a limited range in composition and petrophysical properties so that the impact of rock heterogeneity on results could be minimized, and the impact of brine saturation and distribution on the EOR performance could be more clearly ascertained. By minimizing the influence of other geological factors, this study allowed for a more reliable identification of key mechanisms impacting gas injectivity and recovery during the lean gas HNP process in tight oil reservoirs.

3.2. Fluid Samples

The oil sample used in this research was also collected from the Montney Formation (AB, Canada). Because this study aimed to experimentally simulate depleted reservoirs, such as those with pressures below bubble point, dead oil was applied in the experiments. The crude oil was filtered through a 0.1-micron filter at a commercial laboratory to remove wax and solid impurities. The physical properties of the oil sample are detailed in Table 4. The oil density was estimated to be 0.83 g/cm3, and oil viscosity was determined to be 2.48 cP under ambient conditions (i.e., 1 atm and 25 °C). The synthetic brine was prepared based on the chemical composition of field-produced brine, with its physical properties summarized in Table 5.
Compositional analysis of field-produced gas resulted in the following component percentage estimates: 80.1% C1, 10% C2, 5.6% C3, 2.2% C4, 1% N2, 0.4% C5, 0.3% C6, 0.2% C7, 0.1% CO2 and other trace components. A simplified lean gas mixture—comprising 80% methane (C1) and 20% ethane (C2)—was used in this study to approximate produced gas in the field.
The results of this work will be used to inform future reservoir simulation and experimental studies performed under in situ conditions (e.g., live oil to be applied). In this study, dead oil and simplified lean gas mixture were used to reduce experimental complexity.

4. Experiments

4.1. Experimental Setup

The coreflooding setup used in this study (Figure 1) was largely adopted from previous work [3], with modifications to accommodate lean gas HNP tests with both intact and fractured core plug samples. For the intact core HNP test, gas injection and production were performed at the same end of the coreholder. In contrast, for the fractured core HNP test, fluids—including oil, water and gas—were produced from the opposite end of the coreholder to the injection end.

4.2. Experimental Procedures

Five experimental scenarios were designed to examine the effects of induced fractures, brine saturation and distribution on lean gas HNP EOR using the three Montney core plug samples. The experimental procedures are outlined below:
  • Helium porosity measurement—helium porosity of the three intact core plugs was determined by combing helium pycnometry (Micromeritics® Norcross, GA, USA, Accupyc II 1340TM) to obtain a grain density/volume estimate and calipering to estimate bulk density/volume.
  • Gas (N2) permeability measurement—matrix permeability values of the core plugs were determined using the gas (N2) pulse-decay technique (Corelab® Tulsa, OK, USA, PDP-250TM), under different effective stresses (500 and 1800 psi), with mean pore pressures ranging from 200 to 1000 psi to derive the slip-correct gas permeabilities.
  • Brine or oil saturation—after evacuating the core plugs for 48 hrs to remove gas, the core plugs were fully saturated with either dead oil (Sample #1 and #3) or brine (Sample #2) under 1500 psi for 5 days. Saturations were calculated from the mass change in the samples before and after saturation.
  • Liquid permeability measurement—liquid (oil or brine) pulse-decay permeability measurements [31] were conducted on the core plugs (oil for Sample #1 and #3; brine for Sample #2) under the same effective stress conditions used for the previous gas permeability testing.
  • Inducing various brine saturations—following the liquid permeability tests, brine (for sample #1 and #3) or crude oil (for sample #2) was flooded into the core samples to achieve different brine saturation levels. The brine saturations were determined from the mass difference in samples before and after saturation, combined with the measured quantities of fluids produced.
  • Lean gas HNP using intact core plugs—for each cycle of lean gas HNP, simplified lean gas was injected into the intact core plugs at a constant pressure (1300 psig) for 1 hr. The core plugs were then soaked with the injected lean gas for another hour, followed by a production period (i.e., atmosphere pressure) for 4 h. Similar HNP scheme was also employed in the previous study [3]. Three cycles of HNP were performed for Sample #1 and Sample #2.
  • Fracturing of intact core plugs—after completing the lean gas HNP experiments using the intact core plugs, the core plugs were fractured under stress within the coreholder using the procedure of Ghanizadeh et al. [3]. The axial pressure was increased in a stepwise manner, while the radial pressure was kept constant until the core plugs fractured. Sample #1 and #2 were both fractured using this procedure, while Sample #3 was unintentionally fractured during oil saturation (Step 3). Hence, for Sample #3, the intact core HNP test (Step 6) was skipped and Step 8 was implemented directly.
  • Lean gas HNP with fractured core plugs—following Step 7, lean gas HNP experiments were conducted on the fractured core plugs under similar conditions to the intact core HNP tests. Another four HNP cycles were performed for each core sample (Sample #1, #2, and #3).
  • Post-test liquid (oil) permeability measurement—after the HNP tests, liquid (oil) permeability was measured again on the fractured core plugs under stress loading (500–4000 psi) and unloading (4000–500 psi) conditions, to evaluate permeability hysteresis.
Note that Sample #1 was fully saturated with oil and contained no brine prior to the HNP testing. Sample #2 was saturated with both oil and brine (57.3% oil + 33.9% brine) prior to HNP testing. As noted, Sample #3 experienced unexpected fracturing during the oil saturation stage (Step 3). As a result, intact core HNP test (Step 6) was not performed and no additional fracturing was necessary (Step 7). Nevertheless, Sample #3 was included for fractured lean gas HNP testing and the post-test permeability measurement (Step 8–9). Following oil saturation and liquid permeability measurement (Step 3&4), brine was assumed to have entered Sample #3 through the induced fractures during Step 5, resulting in a saturation of 66.6% oil and 20% brine prior to the HNP test of Step 8.
Experiments were performed at 25 °C (room conditions). The objective of this proof-of-concept study was not to reproduce field conditions, but rather to compare the results of lean gas HNP tests for different water saturations and water distributions. Performing the experiments at room temperature helped to simplify the experimental procedures and minimize the risk of thermal-induced core damage (e.g., clay swelling or minerology dissolution). The results of this work will be used to inform future reservoir simulation and experimental studies performed under in situ conditions (e.g., reservoir temperature and live oil), which in turn will be used to support the design of potential pilot tests in the field.

5. Results

5.1. Matrix Permeability

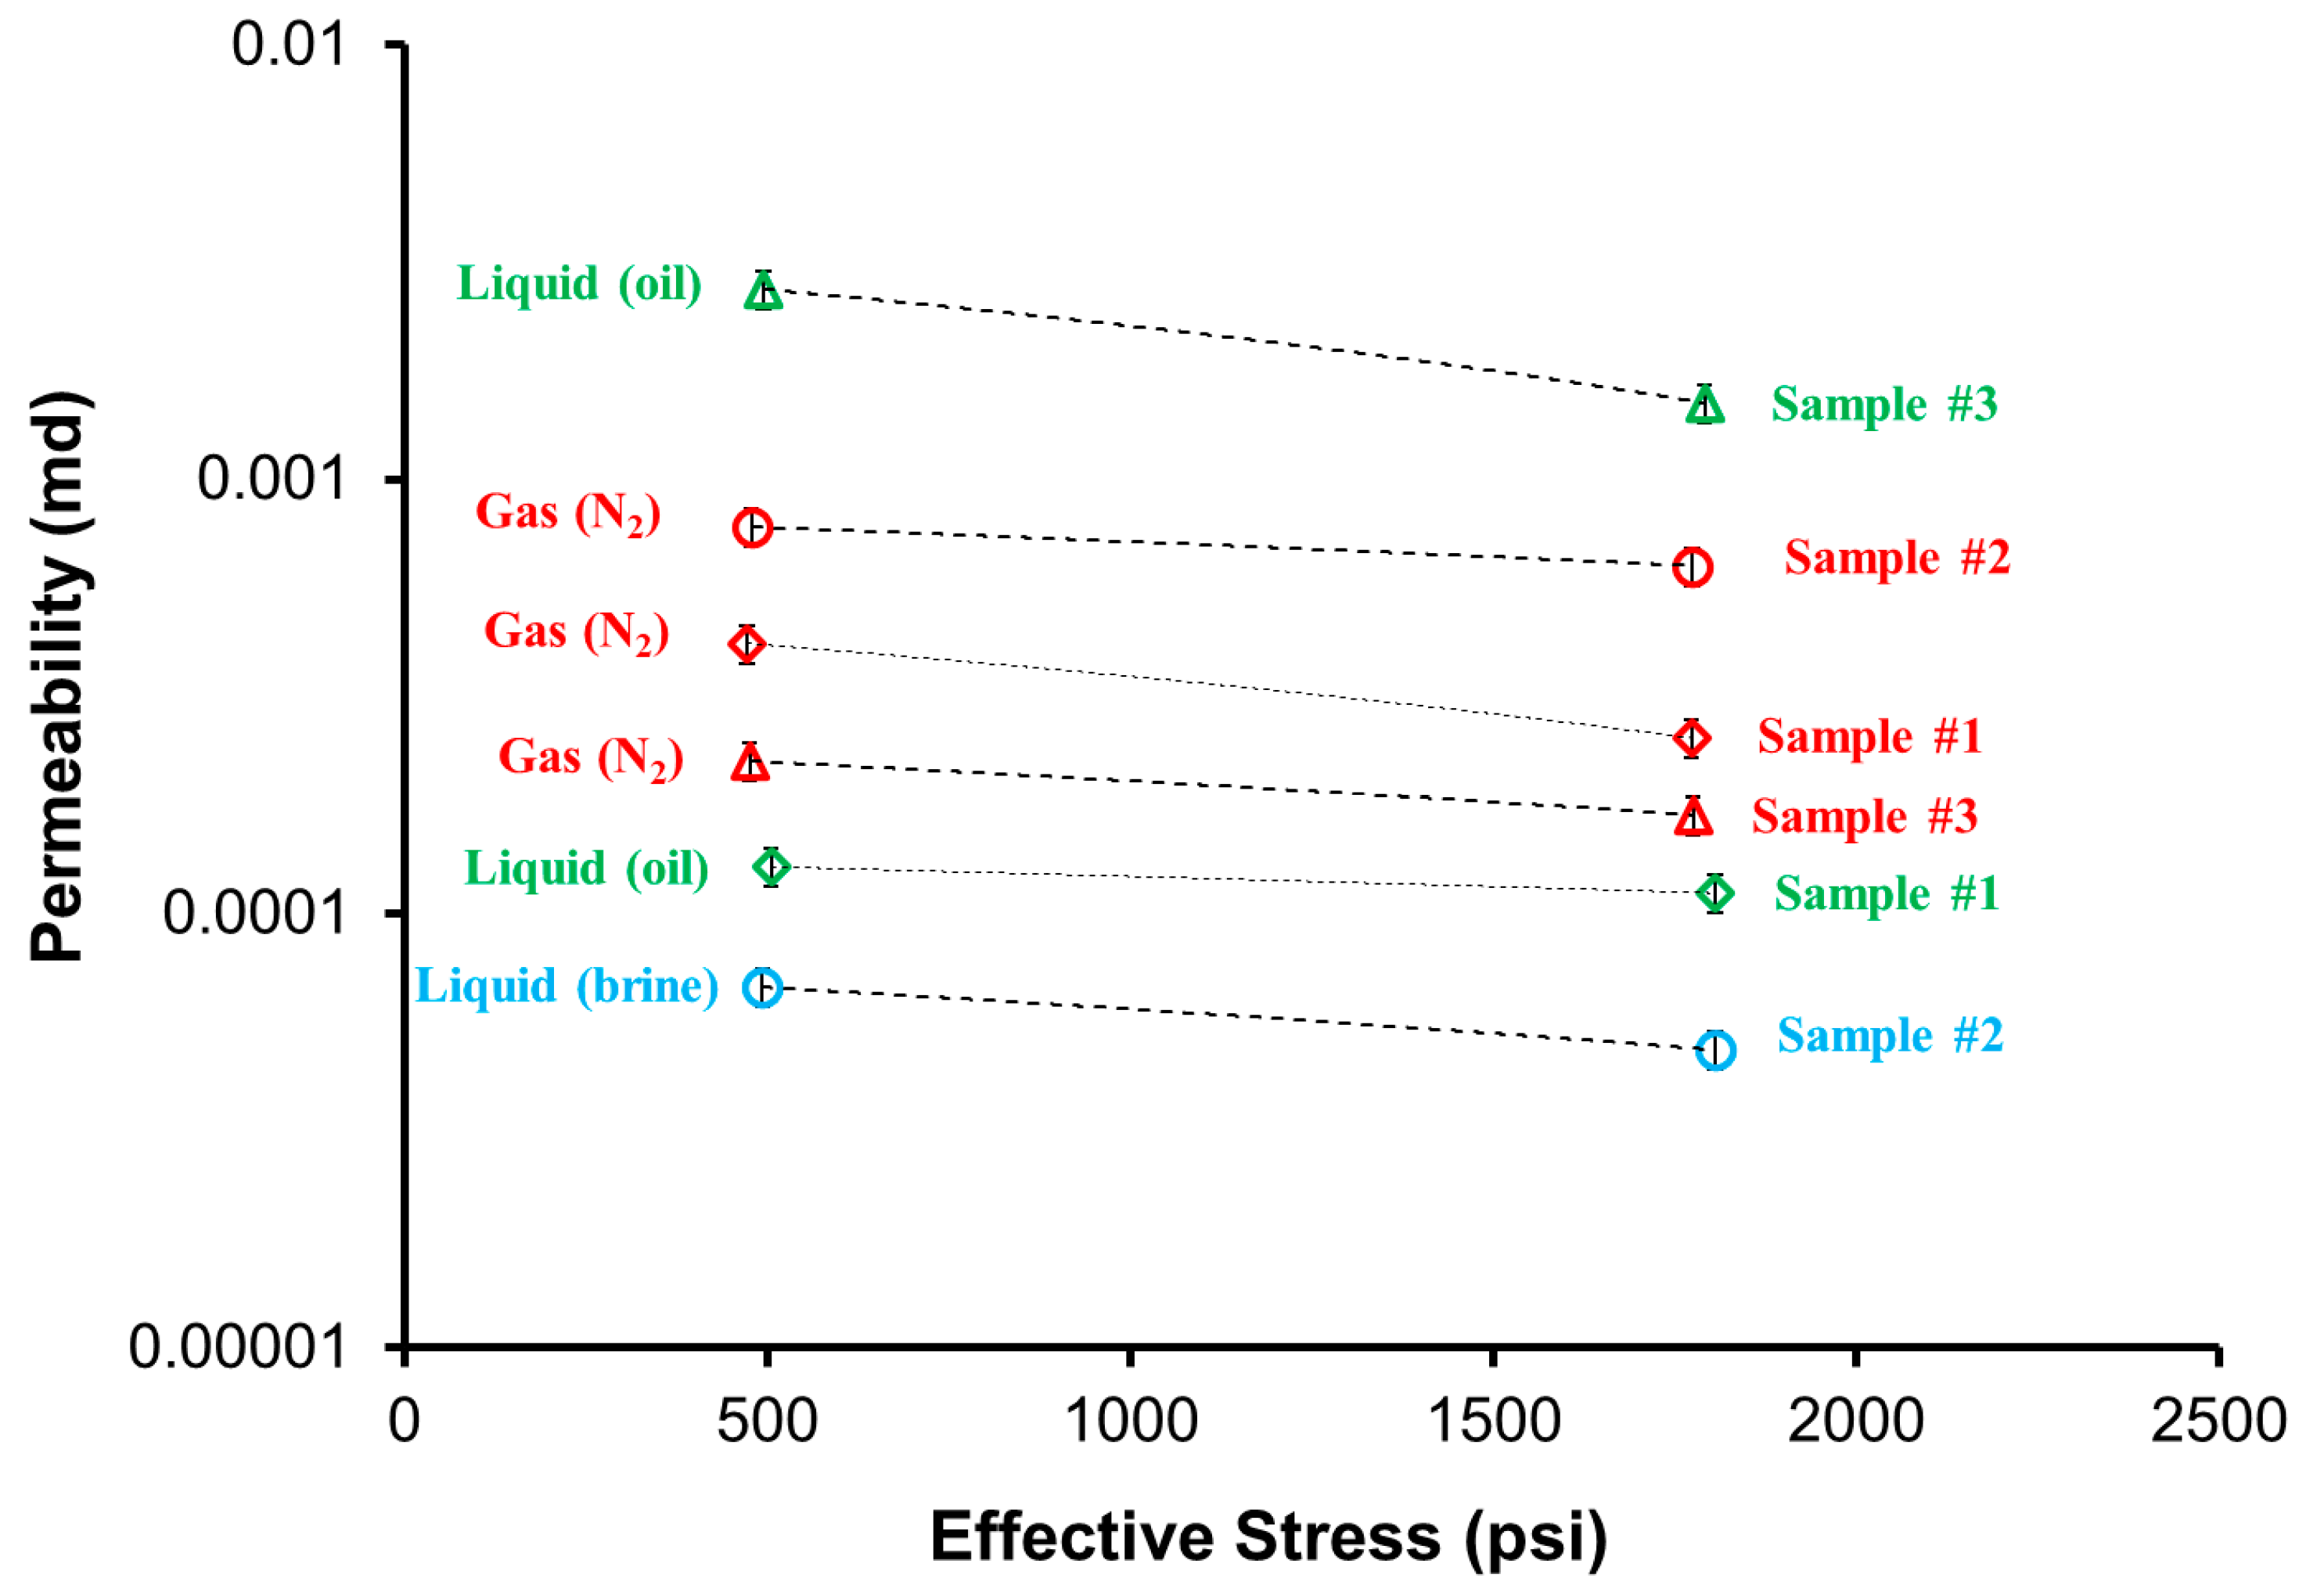
As shown in Figure 2, the slip-corrected gas permeability for Samples #1–3 was 0.00042 md, 0.00078 md, and 0.00022 md under 500 psi effective stress, and 0.00025 md, 0.00063 md, and 0.00017 md under 1800 psi effective stress. Liquid permeability values for Sample #1 (oil) and Sample #2 (brine) are lower than gas permeability, aligning with previous studies [3]. In contrast, Sample #3 exhibited higher liquid (oil) permeability than gas permeability, which is not consistent with the literature [3,30].
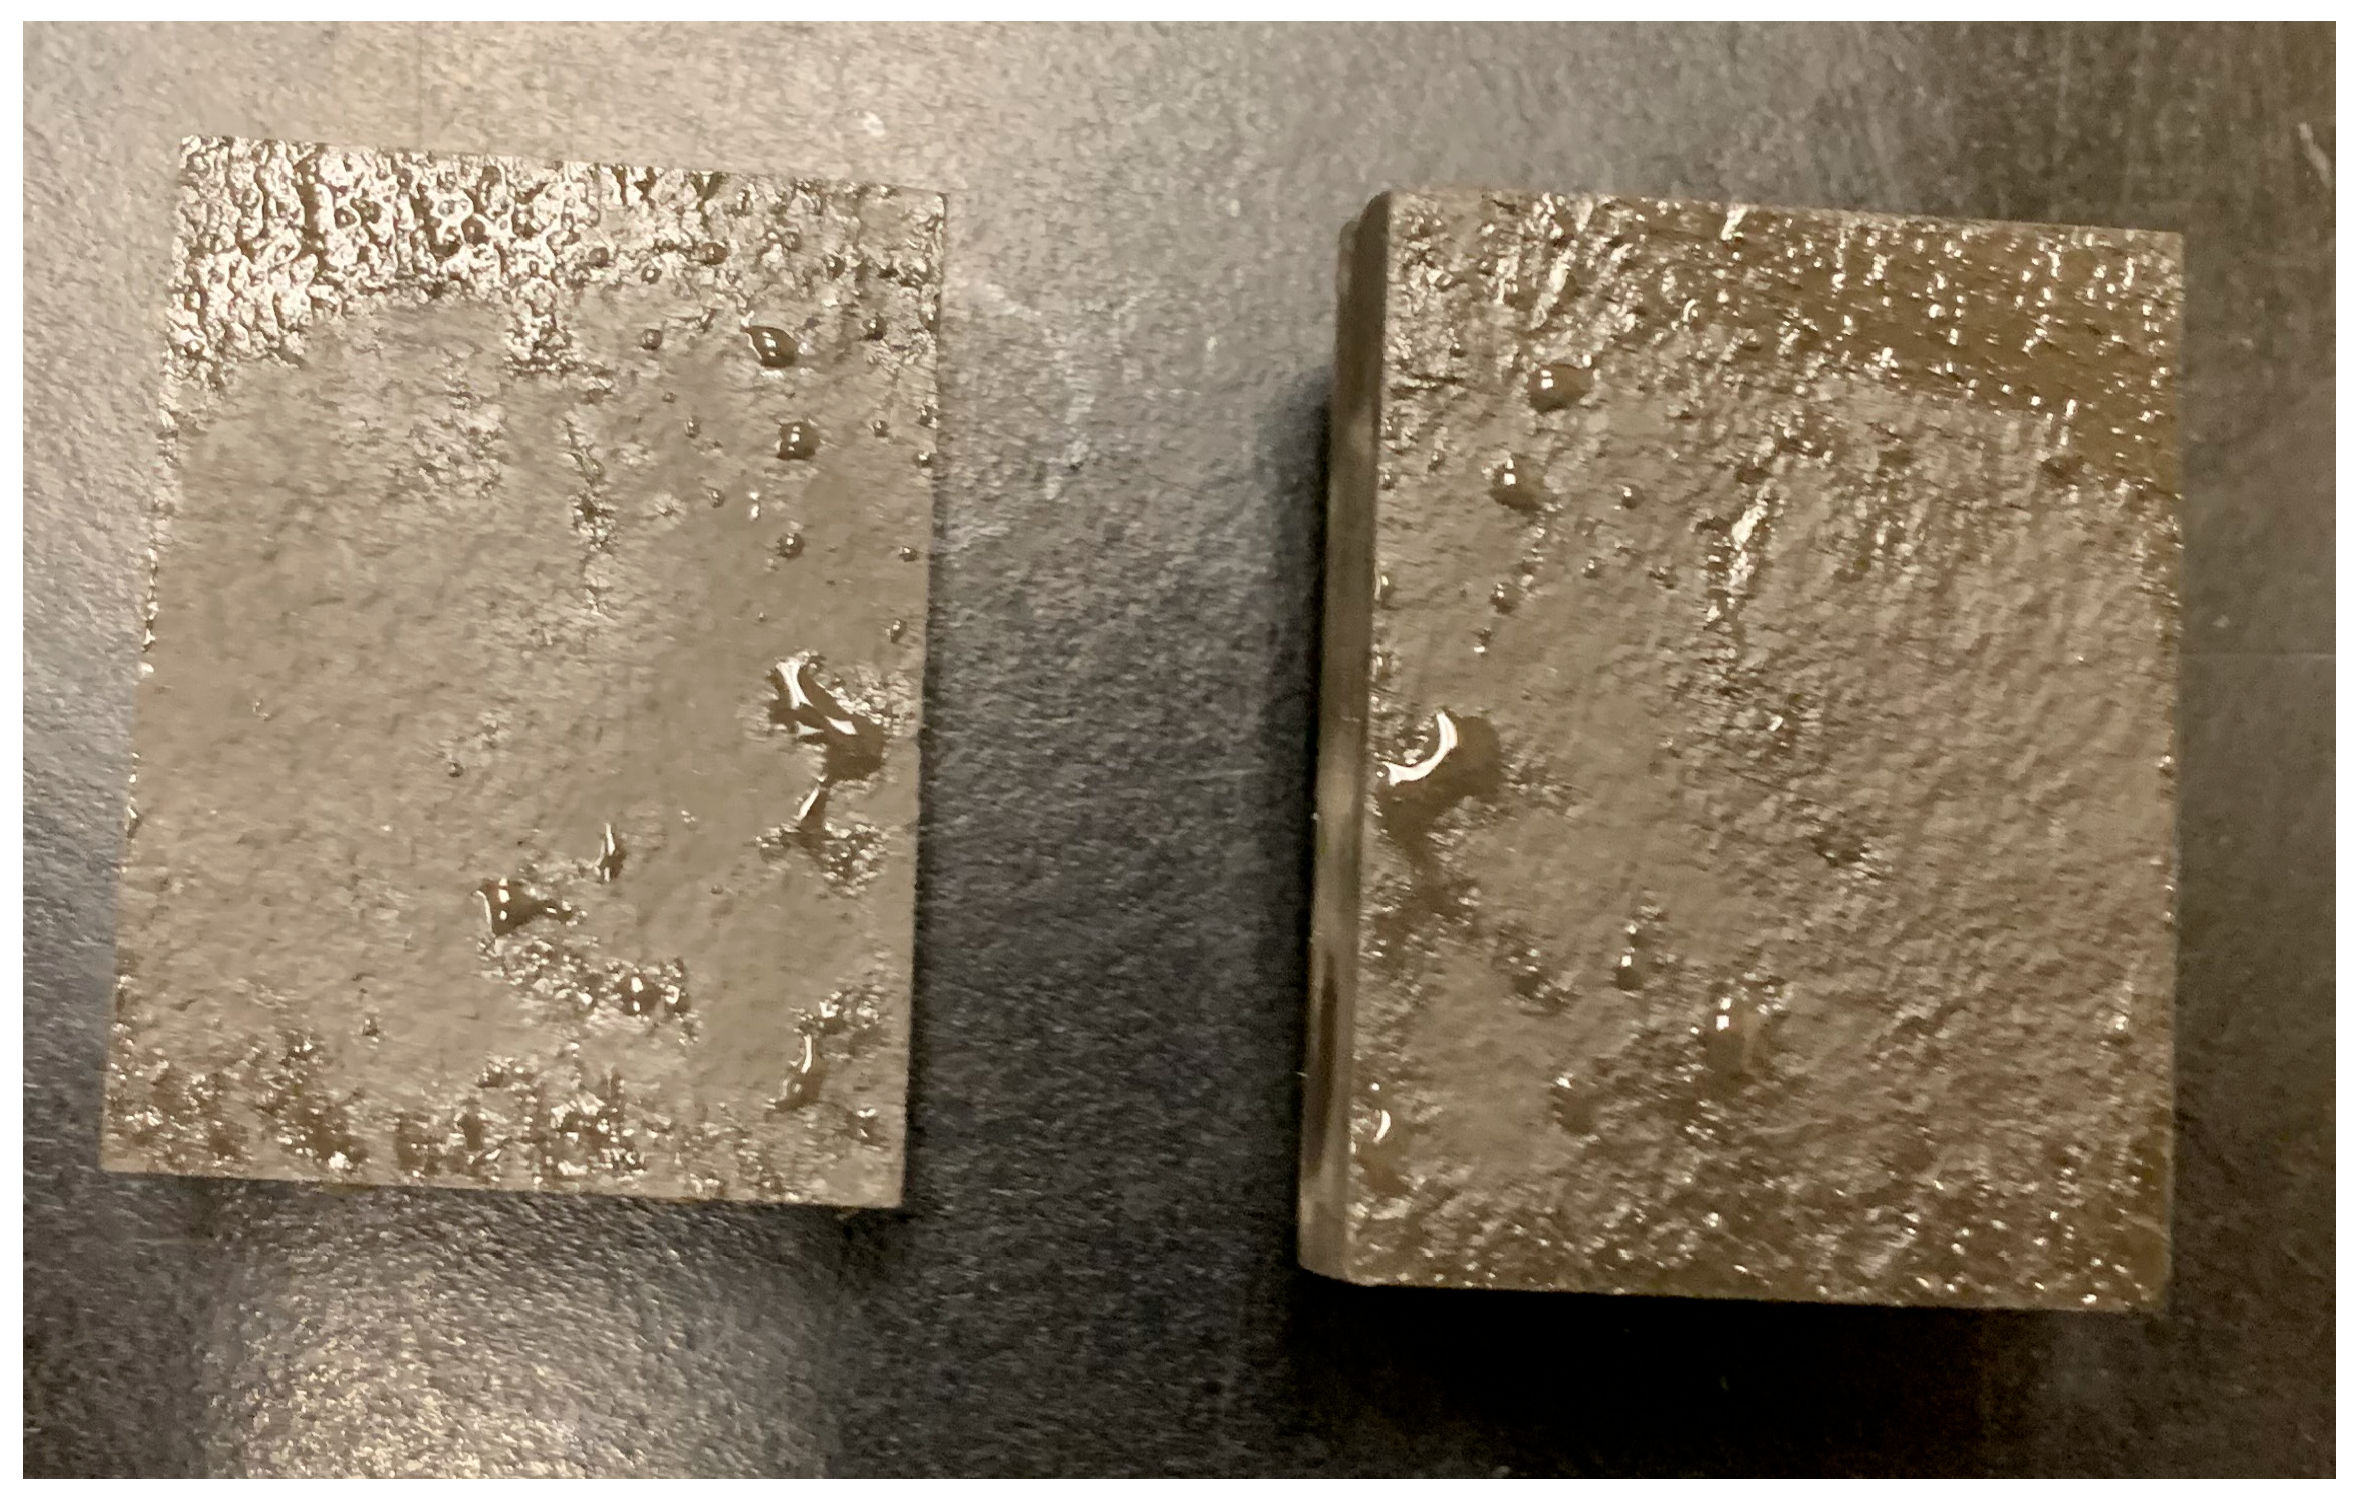
The gas (N2) permeability for Sample #3 is smaller than for Sample #1 and #2. This trend is consistent with the porosity results, suggesting that Sample #3 was not fractured during the gas permeability measurements. However, it is believed that Sample #3 was fractured during the oil saturation process, which was performed after gas permeability measurements and prior to liquid permeability measurements. Post-test analysis also revealed a significant fracture in Sample #3 (Figure 3), likely causing its elevated liquid permeability. A possible reason for fracturing is the rapid variation in effective stress at the beginning of oil saturation, when the pore pressure was increased from 0 psi to 1500 psi, while the confining pressure was maintained at 2000 psi. As a result, the effective stress changed from 2000 psi to 500 psi in a short period of time, resulting in sample fracturing. Previous research has suggested that Montney cores are relatively easy to fracture. For example, Keneti and Wong [32] reported that the tensile strength of Montney core samples parallel to the bedding was 0.3–2.8 MPa, and Vaisblat et al. [33] derived brittleness indices of Montney rocks in a range of 60–90. These values indicate the Montney cores are susceptible to fracturing caused by stress changes that are parallel to planes of weakness (laminations). Becerra Rondon [34] also highlighted that the strong heterogeneity of Montney rocks contributed significantly to fracture initiation and propagation. As such, it is believed the fracturing of Sample #3 was likely due to a combination of experimental conditions and the geomechanical properties of the sample.

5.2. Lean Gas HNP Recovery

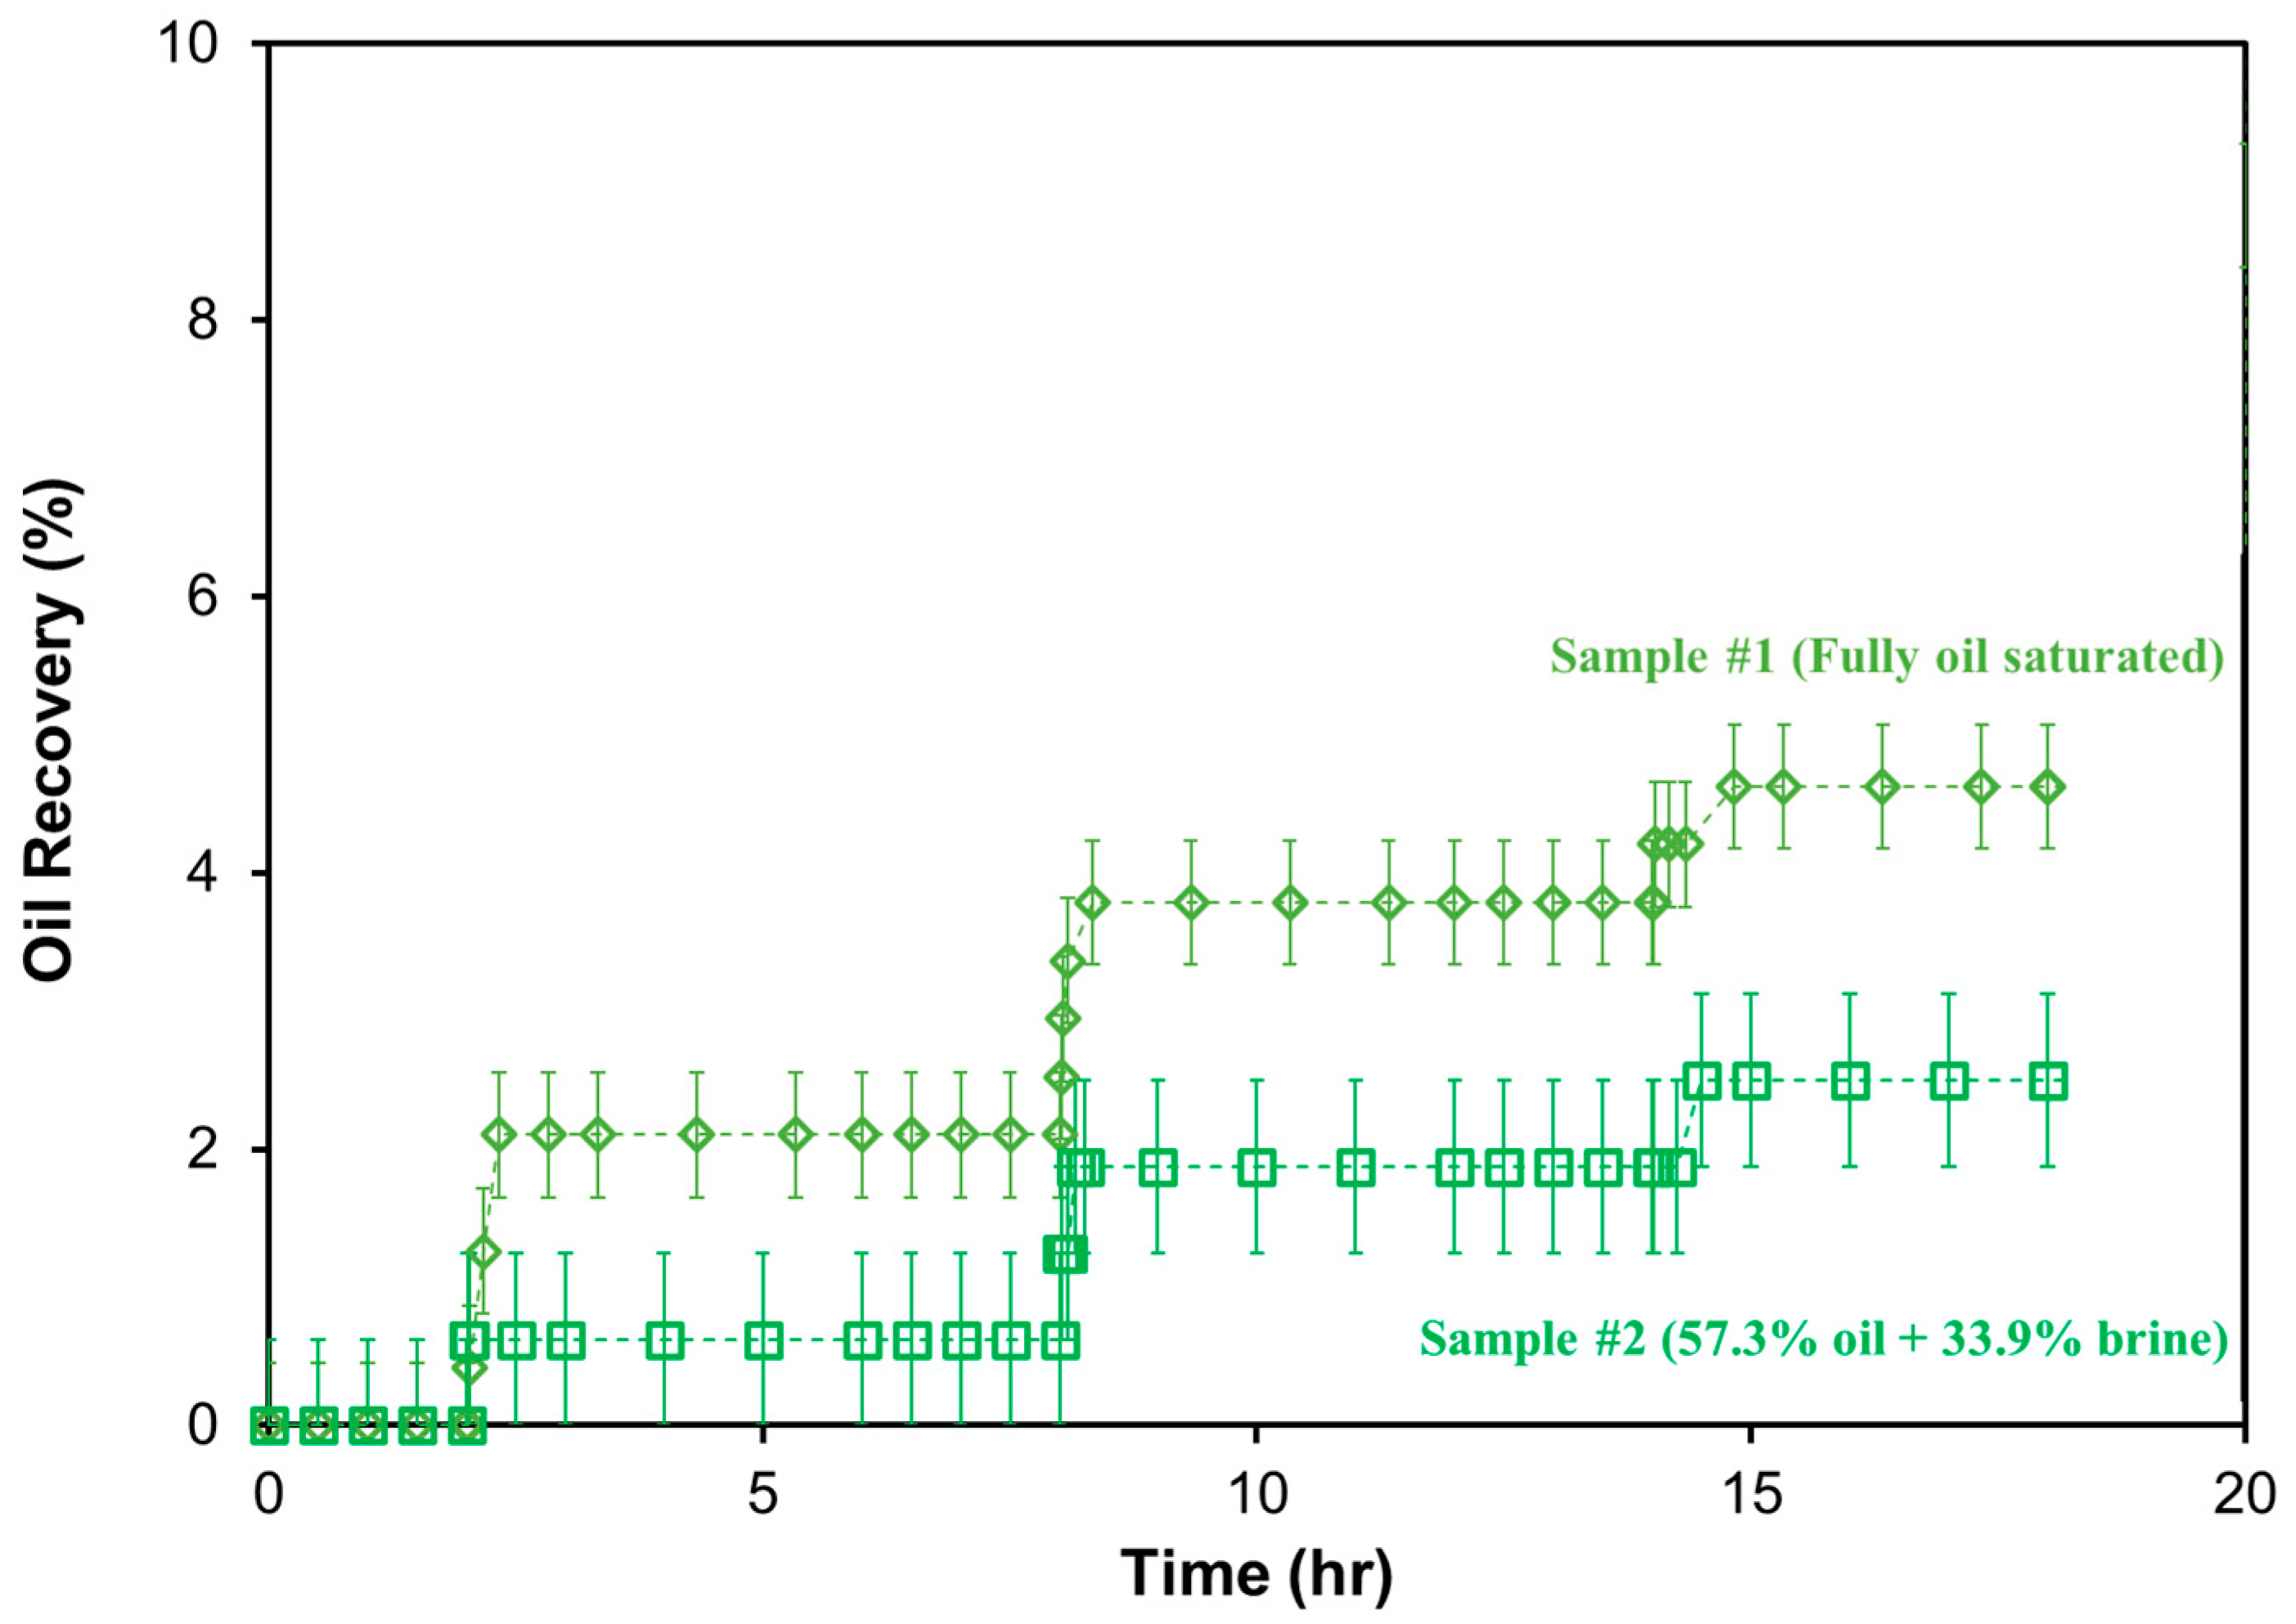
Lean gas HNP with intact core plugs. As previously mentioned, three cycles of lean gas HNP were conducted using intact core samples (Sample #1 and Sample #2). Sample #1 was fully saturated with oil prior to the HNP test, while Sample #2 was saturated with 57.3% oil and 33.9% brine. As shown in Figure 4, the maximum oil recovery from the intact Sample #1 was 4.6% versus 2.5% for intact Sample #2. The mechanisms leading to this difference will be discussed in Section 6. It is important to note that Sample #3, which was fractured during the oil saturation process, was excluded from the comparison of intact core HNP test results.
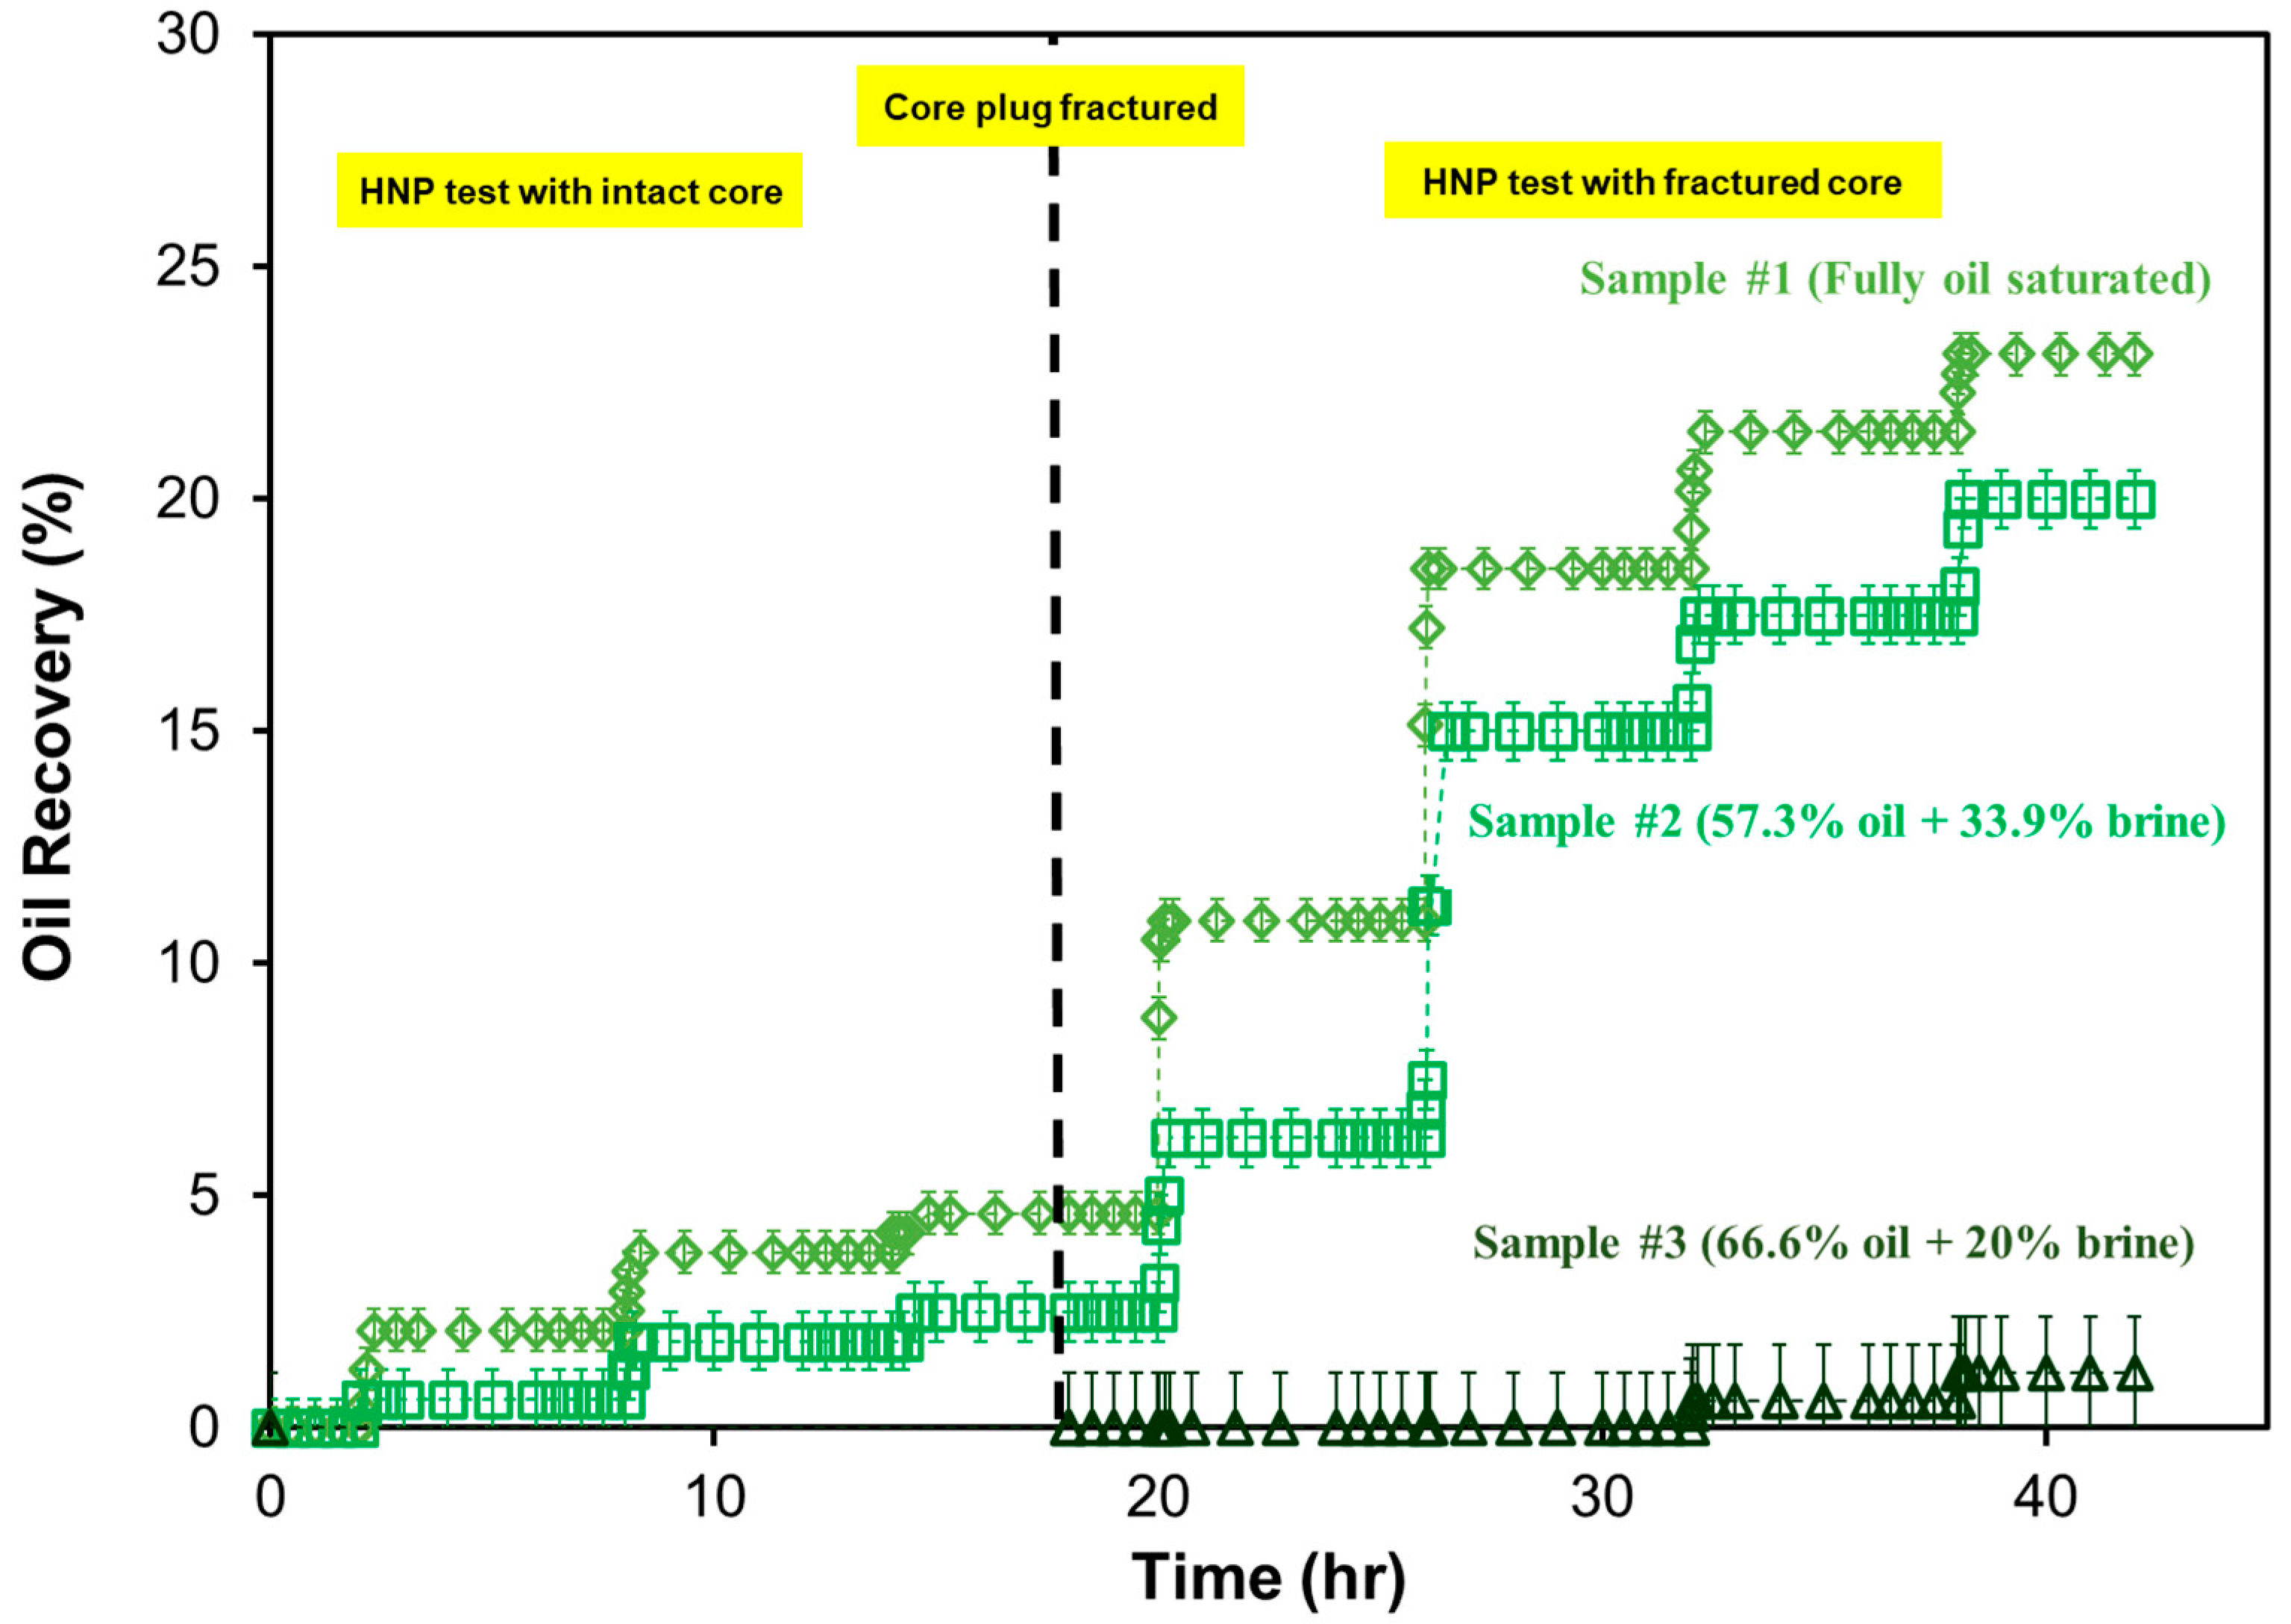
Lean gas HNP with fractured core plugs. Following the intact core HNP experiments, Sample #1 and Sample #2 were artificially fractured under in situ stress conditions, as detailed in Section 4.2. Lean gas HNP was then conducted on each fractured core sample (Sample #1–3), for four additional cycles under similar conditions to the intact core tests, until oil production was exhausted. As shown in Figure 5, fracturing significantly enhanced oil recovery in Sample #1 and # 2, yielding additional recoveries of 18.5% and 17.5%, respectively. This led to ultimate recovery factors of 23.1% for Sample #1 and 20% for Sample #2. In contrast, Sample #3 (initially containing 66.6% oil + 20% brine) exhibited a substantially lower recovery of just 1.2%, despite its higher initial oil saturation than Sample #2 (initially containing 57.3% oil + 33.9% brine). The reasons for this discrepancy, along with the associated recovery mechanisms, will be discussed in Section 6.
It should be noted that the recovery performance with dead oil used in this study is not fully comparable to that using in situ oil during the lean gas HNP process, even for depleted reservoirs. Reservoir gases dissolved in in situ oil can lead to a lower oil viscosity and higher compressibility [35]. Moreover, the solution gas in in situ oil can expand and provide an additional driving force for oil flow when producing to lower pressure. These combined effects are expected to result in higher oil recovery during lean gas HNP with in situ oil, compared to dead oil.
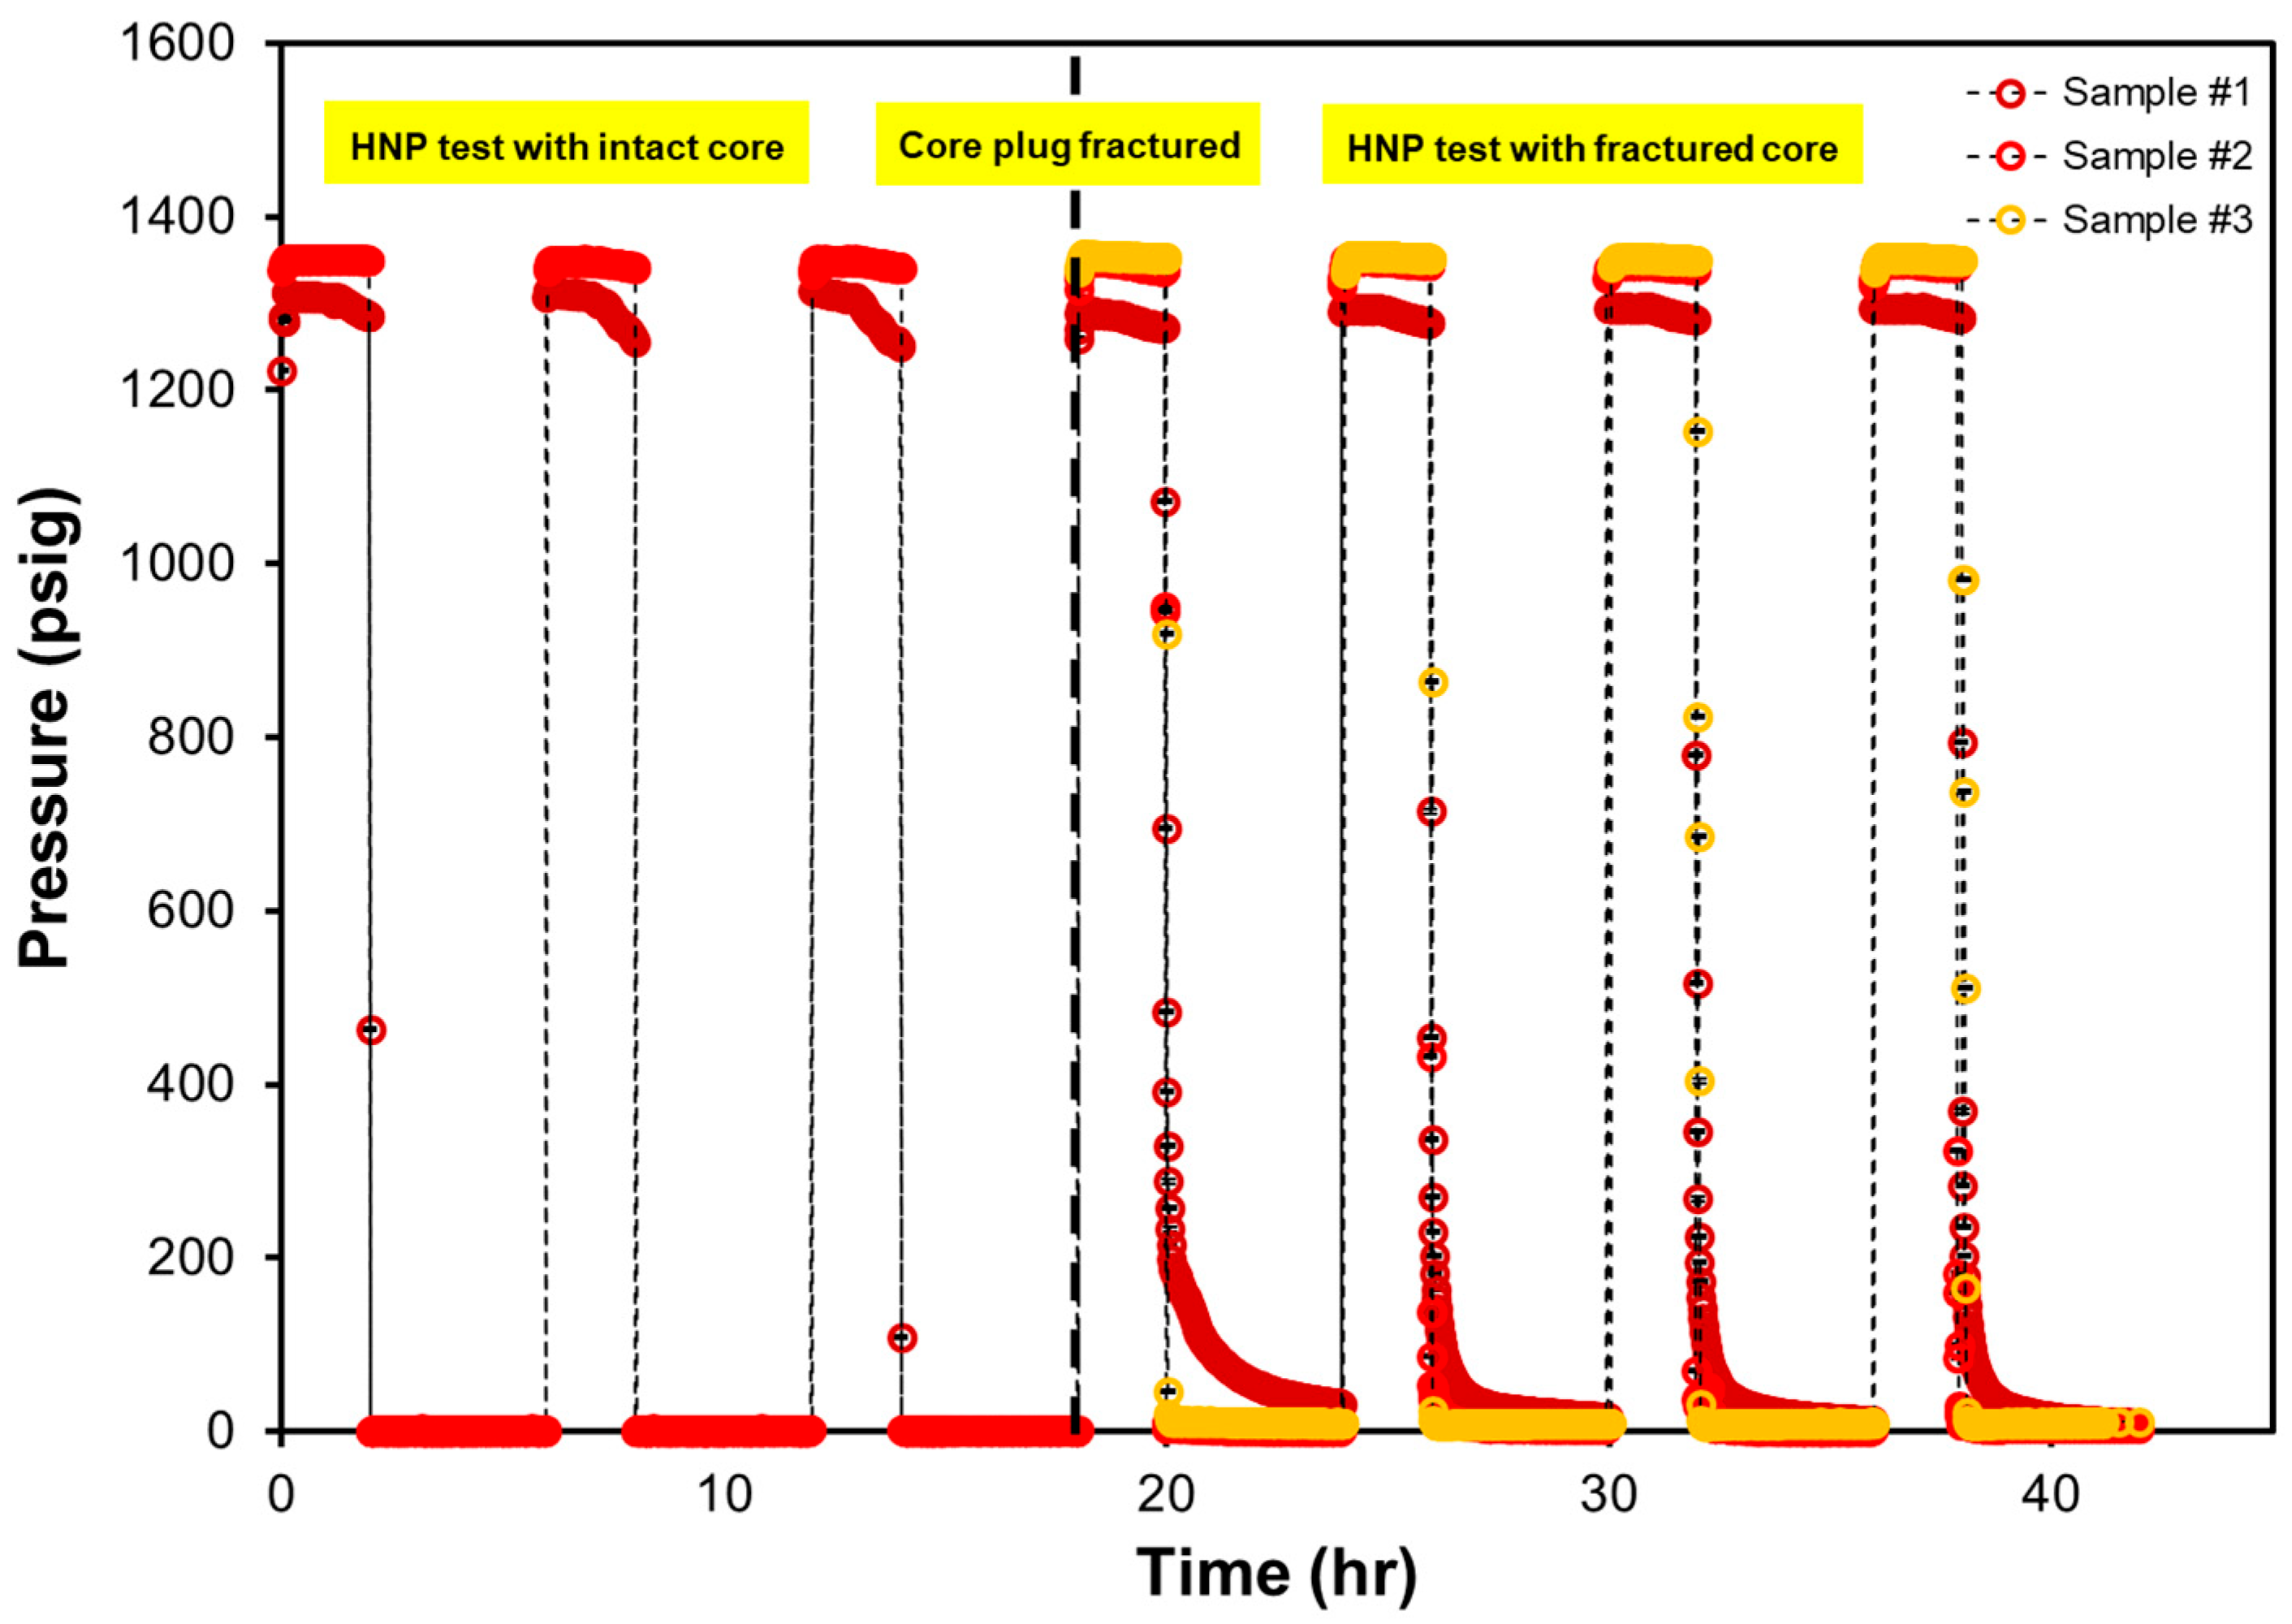
System pressures during the lean gas HNP process. The system pressures—during injection, soaking, and production—were continuously monitored and recorded throughout the lean gas HNP experiments. As illustrated in Figure 6, a clear pressure decline was observed during the soaking period of each cycle of Sample #1. In contrast, Sample #2 and #3 exhibited minimal pressure change during the same period. This difference is primarily attributed to the variations in initial fluid saturation among the samples. Sample #1 was fully saturated with oil, allowing for more effective gas-oil interaction and gas dissolution, which contributed to the observed pressure drop. In comparison, Sample #2 was initially saturated with 57.3% oil and 33.9% brine, and Sample #3 with 66.6% oil and 20% brine. The presence of brine in Samples #2 and #3 likely reduced gas solubility and limited gas-oil mass transfer during soaking, resulting in the relatively stable system pressures.
Because the gas dissolution capacity of dead oil is higher than in situ oil, more lean gas is anticipated to dissolve into the core samples saturated with dead oil and create a more significant pressure decay during soaking. In this study, the use of dead oil might also contribute to the pressure performance of Sample #1.

5.3. Post-Test Permeability Evaluation with Fractured Core Plugs

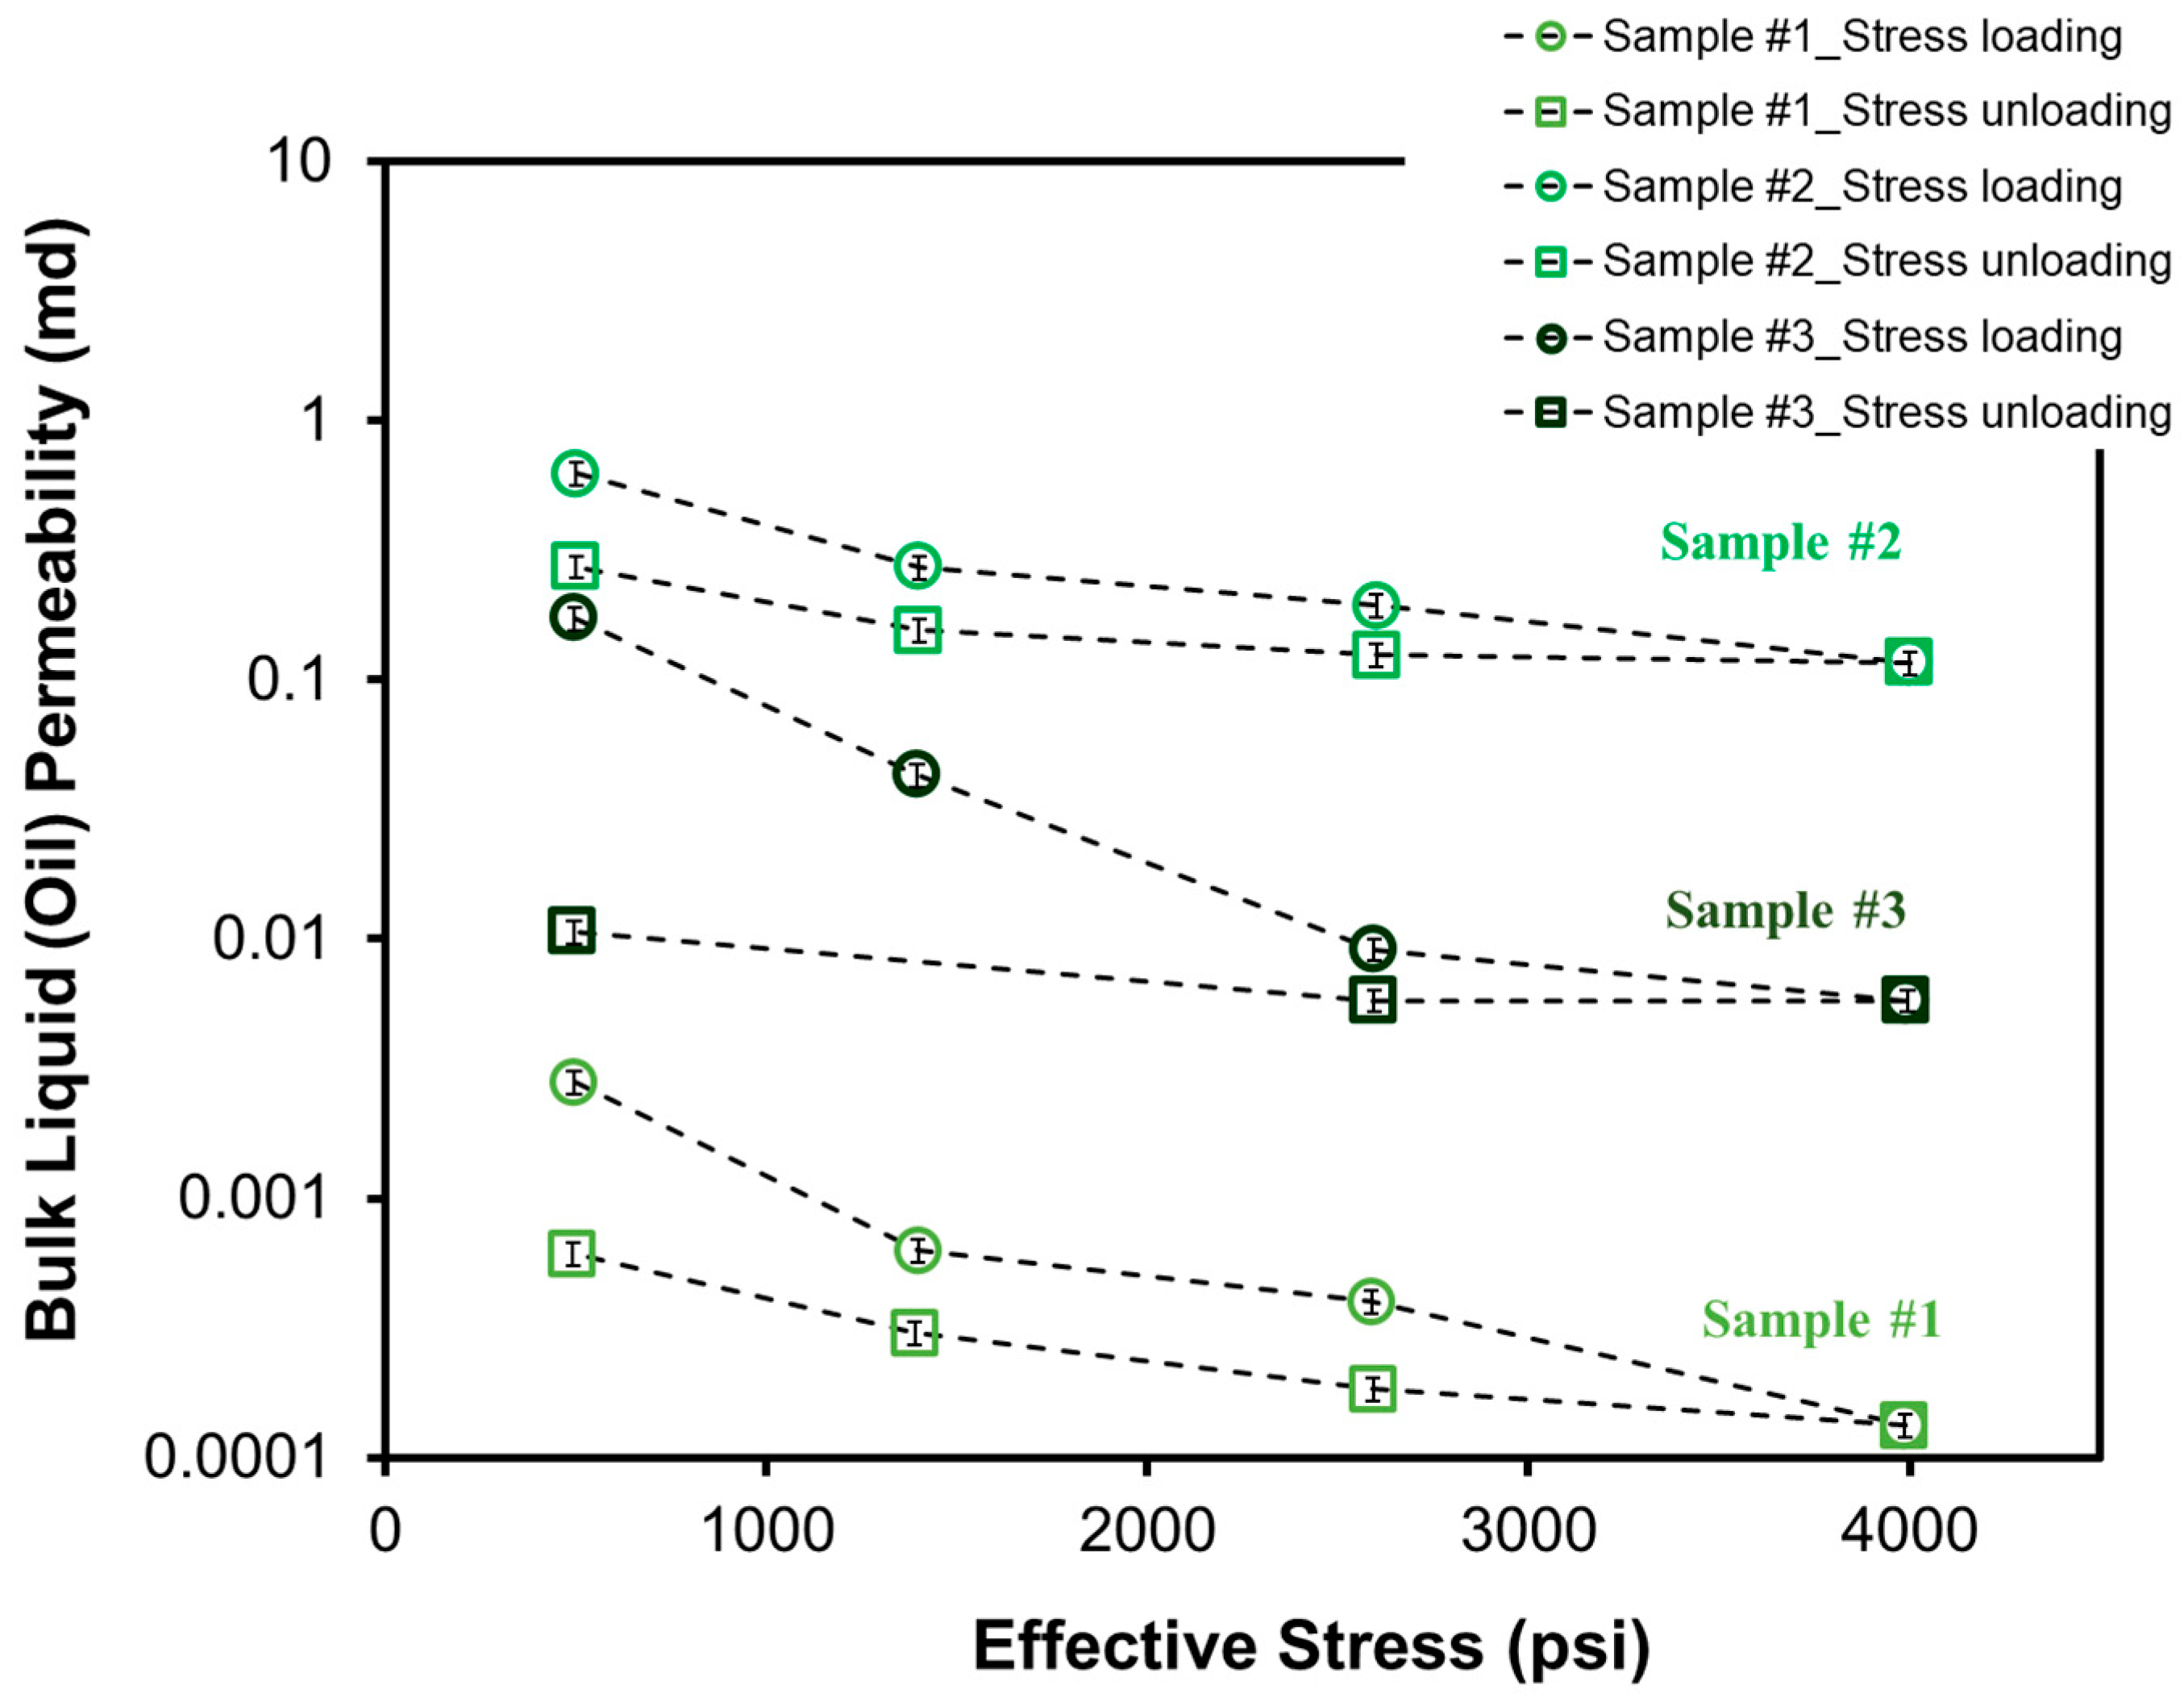
Following the fractured sample HNP experiments, liquid (oil) permeability was measured as a function of stress for each fractured core sample. As shown in Figure 7, during stress loading from 500 to 4000 psi, bulk permeability decreased from 0.003 to 0.0001 md for Sample #1, from 0.6 to 0.1 md for Sample #2, and from 0.2 to 0.006 md for Sample #3. During stress unloading from 4000 to 500 psi, bulk permeability increased from 0.0001 to 0.0006 md for Sample #1, from 0.1 to 0.3 md for Sample #2, and from 0.006 to 0.01 md for Sample #3. The permeability during stress loading remained consistently higher than during unloading, indicating pronounced permeability hysteresis. This behavior reflects the dynamic changes in permeability under varying stress conditions during the HNP process.
Additionally, the measured permeability of Sample #3 was higher than that of Sample #1, but lower than Sample #2. The order contrasts with the permeability trend observed in the intact core permeability tests (Figure 2). This suggests that fractures, rather than matrix properties alone, control the permeability in tight oil reservoirs.

6. Discussion

Impact of brine saturation on lean gas HNP. As illustrated in Figure 4 and Figure 5, Sample #1—initially fully saturated with oil—achieved a higher recovery factor than Sample #2, which was initially saturated with 57.3% oil and 33.9% brine. As discussed in Section 2, the presence of brine is known to impair the effectiveness of lean gas EOR due primarily to two mechanisms:
(1)
Low solubility of the main components of the injected lean gas (80% C1 + 20% C2) in brine. For example, Zhao et al. [36] conducted methane solubility tests in brine with salinity up to 234 g/L, which is similar to the Montney Formation brine used in this study (~210 g/L). Those tests yielded a methane solubility of only ~0.00081 mol/mol at 1450 psi and 25 °C. Kim et al. [37] reported that the solubility of ethane in brine was even lower than methane (e.g., 0.00043 mol/mol under 1450 psi and 10 °C). Solubility values of both of these components in brine are orders of magnitude lower than in liquid hydrocarbons (e.g., ~0.015 mol/mol for methane and ~0.053 mol/mol for ethane at 145 psi and 200 °C) [38]. The low solubility of lean gas components in brine reduces gas injectivity into the tight rock matrix when brine is present [39].
(2)
Low oil phase relative permeability at high brine saturations. For example, Ghanizadeh et al. [30] reported that oil phase relative permeability decreases from 1 to 0. 3 as water saturation increases from 0% to 41% for a Montney core plug, which in turn limits oil mobility and overall recovery. The brine saturations selected in the current study are within a range that significantly affects oil relative permeability, allowing the impact of brine saturation on oil recovery during lean gas HNP to be evaluated.
These findings indicate that tight liquid hydrocarbon reservoirs with lower brine saturations are more likely to achieve higher oil recovery when subjected to cyclic lean gas injection.
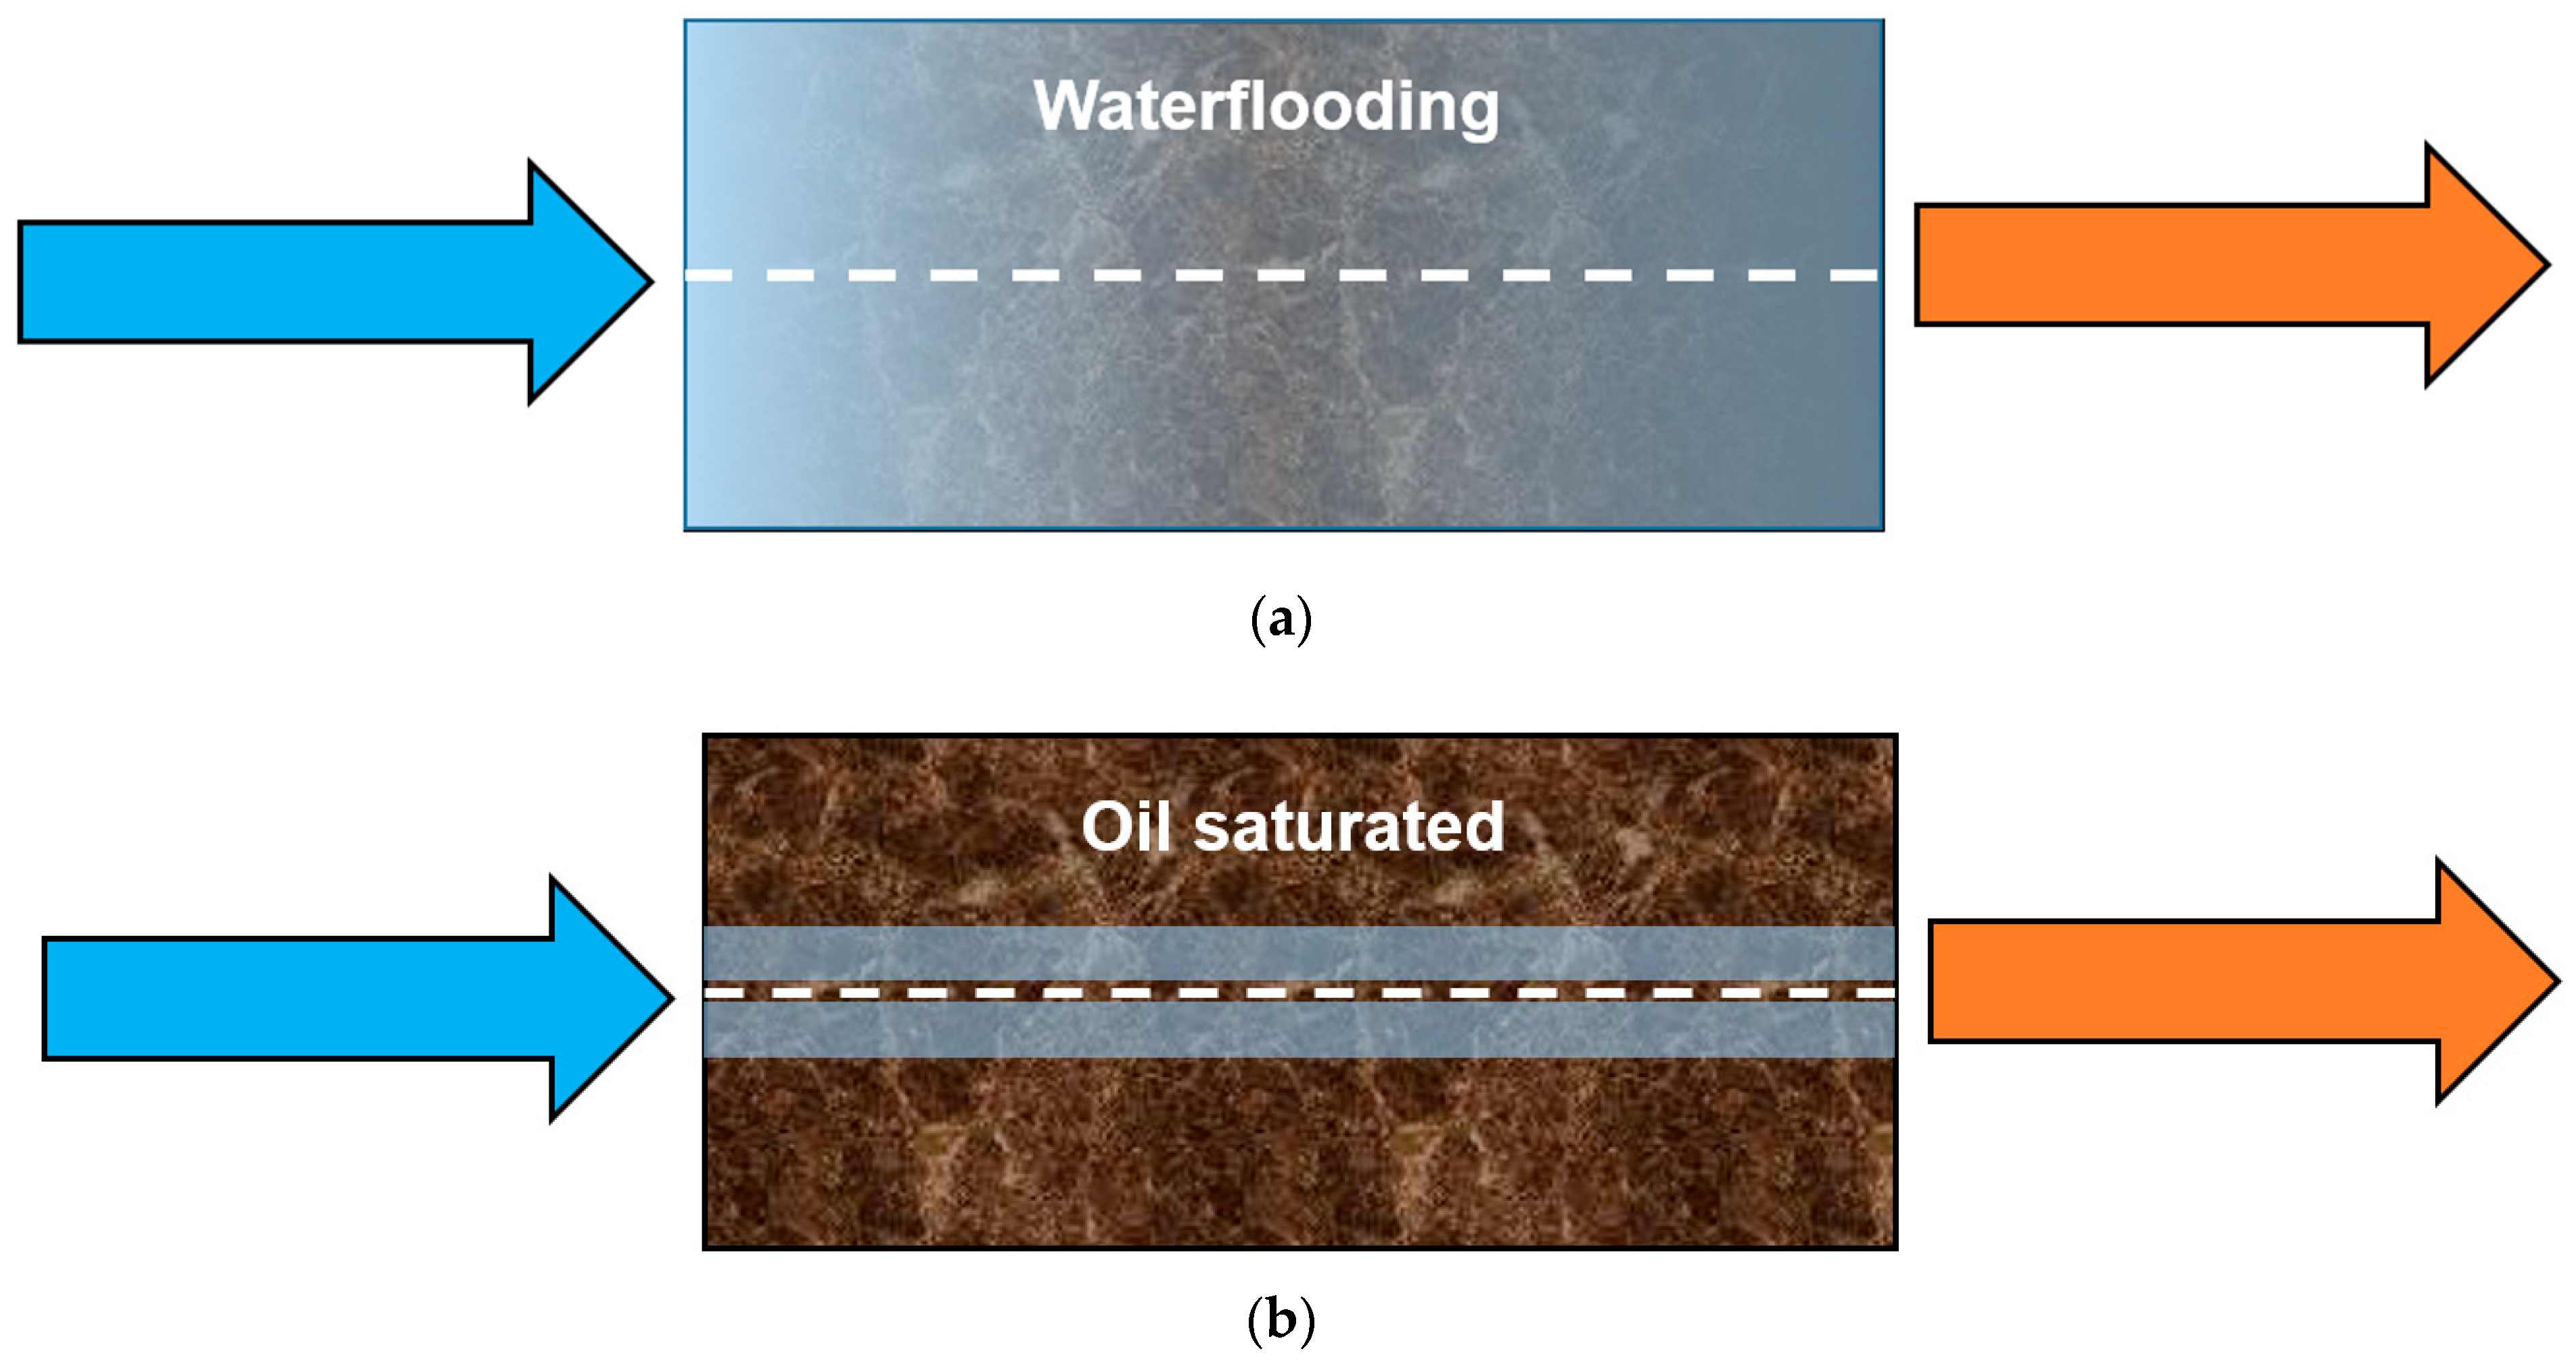
Impact of brine distribution on lean gas HNP. As discussed above, lower brine saturation usually results in higher oil recovery. However, a notable contrast was observed between Sample #2 and Sample #3 after the core plugs were artificially fractured. Despite a higher initial brine saturation for Sample #2 (57.3% oil and 33.9% brine) than Sample #3 (66.6% oil and 20% brine), Sample #2 yielded a recovery factor of 20%, nearly 20 times higher than that of Sample #3 (around 1%). This apparent contradiction is likely attributed to the differences in brine distribution within the core samples. Prior to fracturing, Sample #2 exhibited a relatively homogeneous distribution of brine and oil throughout the core. As a result, its post-fracture fluid distribution remained largely uniform within the matrix (Figure 8a), allowing for effective contact between the injected lean gas and the oil. In contrast, fractures in Sample #3 were unintentionally induced during the oil saturation stage. During subsequent brine injection, brine preferentially flowed into the newly formed high-permeability fracture network. This resulted in the formation of a brine-rich zone adjacent to the fracture surfaces (as shown in the photograph of Figure 3 and illustrated schematically in Figure 8b). As discussed in the previous section (“Impact of brine saturation on lean gas HNP”), due to the low solubility of the injected lean gas (80% C1 and 20% C2) in brine [39], this brine-rich zone likely acted as a barrier to impede gas diffusion from the fractures to the matrix. Therefore, a lower oil recovery was achieved for Sample #3. Although Sample #3 was unintentionally fractured, its fracture geometry was similar to other low-permeability core samples fractured using the procedure of Ghanizadeh et al. [3]. Sample #3 represented a typical fractured tight oil system where a significant amount of water accumulates around fractures after hydraulic fracturing with a water-based fluid, or waterflooding; this allowed the impact of a heterogeneous brine distribution on lean gas HNP performance to be evaluated.
The findings above could be important for the design of field-scale lean gas injection in tight oil systems: for reservoirs that have recently undergone hydraulic fracturing or waterflooding, water that has accumulated around high-permeability flow paths (e.g., primary or secondary fractures) or injection wells may impair lean gas injectivity and reduce EOR performance. Appropriate reservoir conditioning and injection strategies need to be considered to mitigate this effect.
Impact of fractures on lean gas HNP. The flow of liquid hydrocarbons and gas in tight oil systems is significantly influenced by the presence of fractures [19]. To assess the recovery efficiency associated with induced fractures during the EOR process, intact core plugs (Sample #1 and #2) were artificially fractured under in situ stress conditions after completing three cycles of lean gas HNP. Four additional HNP cycles were then conducted under similar conditions (i.e., similar injection, soaking, and production pressure and durations), resulting in significant improvements in oil recovery, i.e., an additional 18.5% for Sample #1 and 17.5% for Sample #2, (Figure 5).
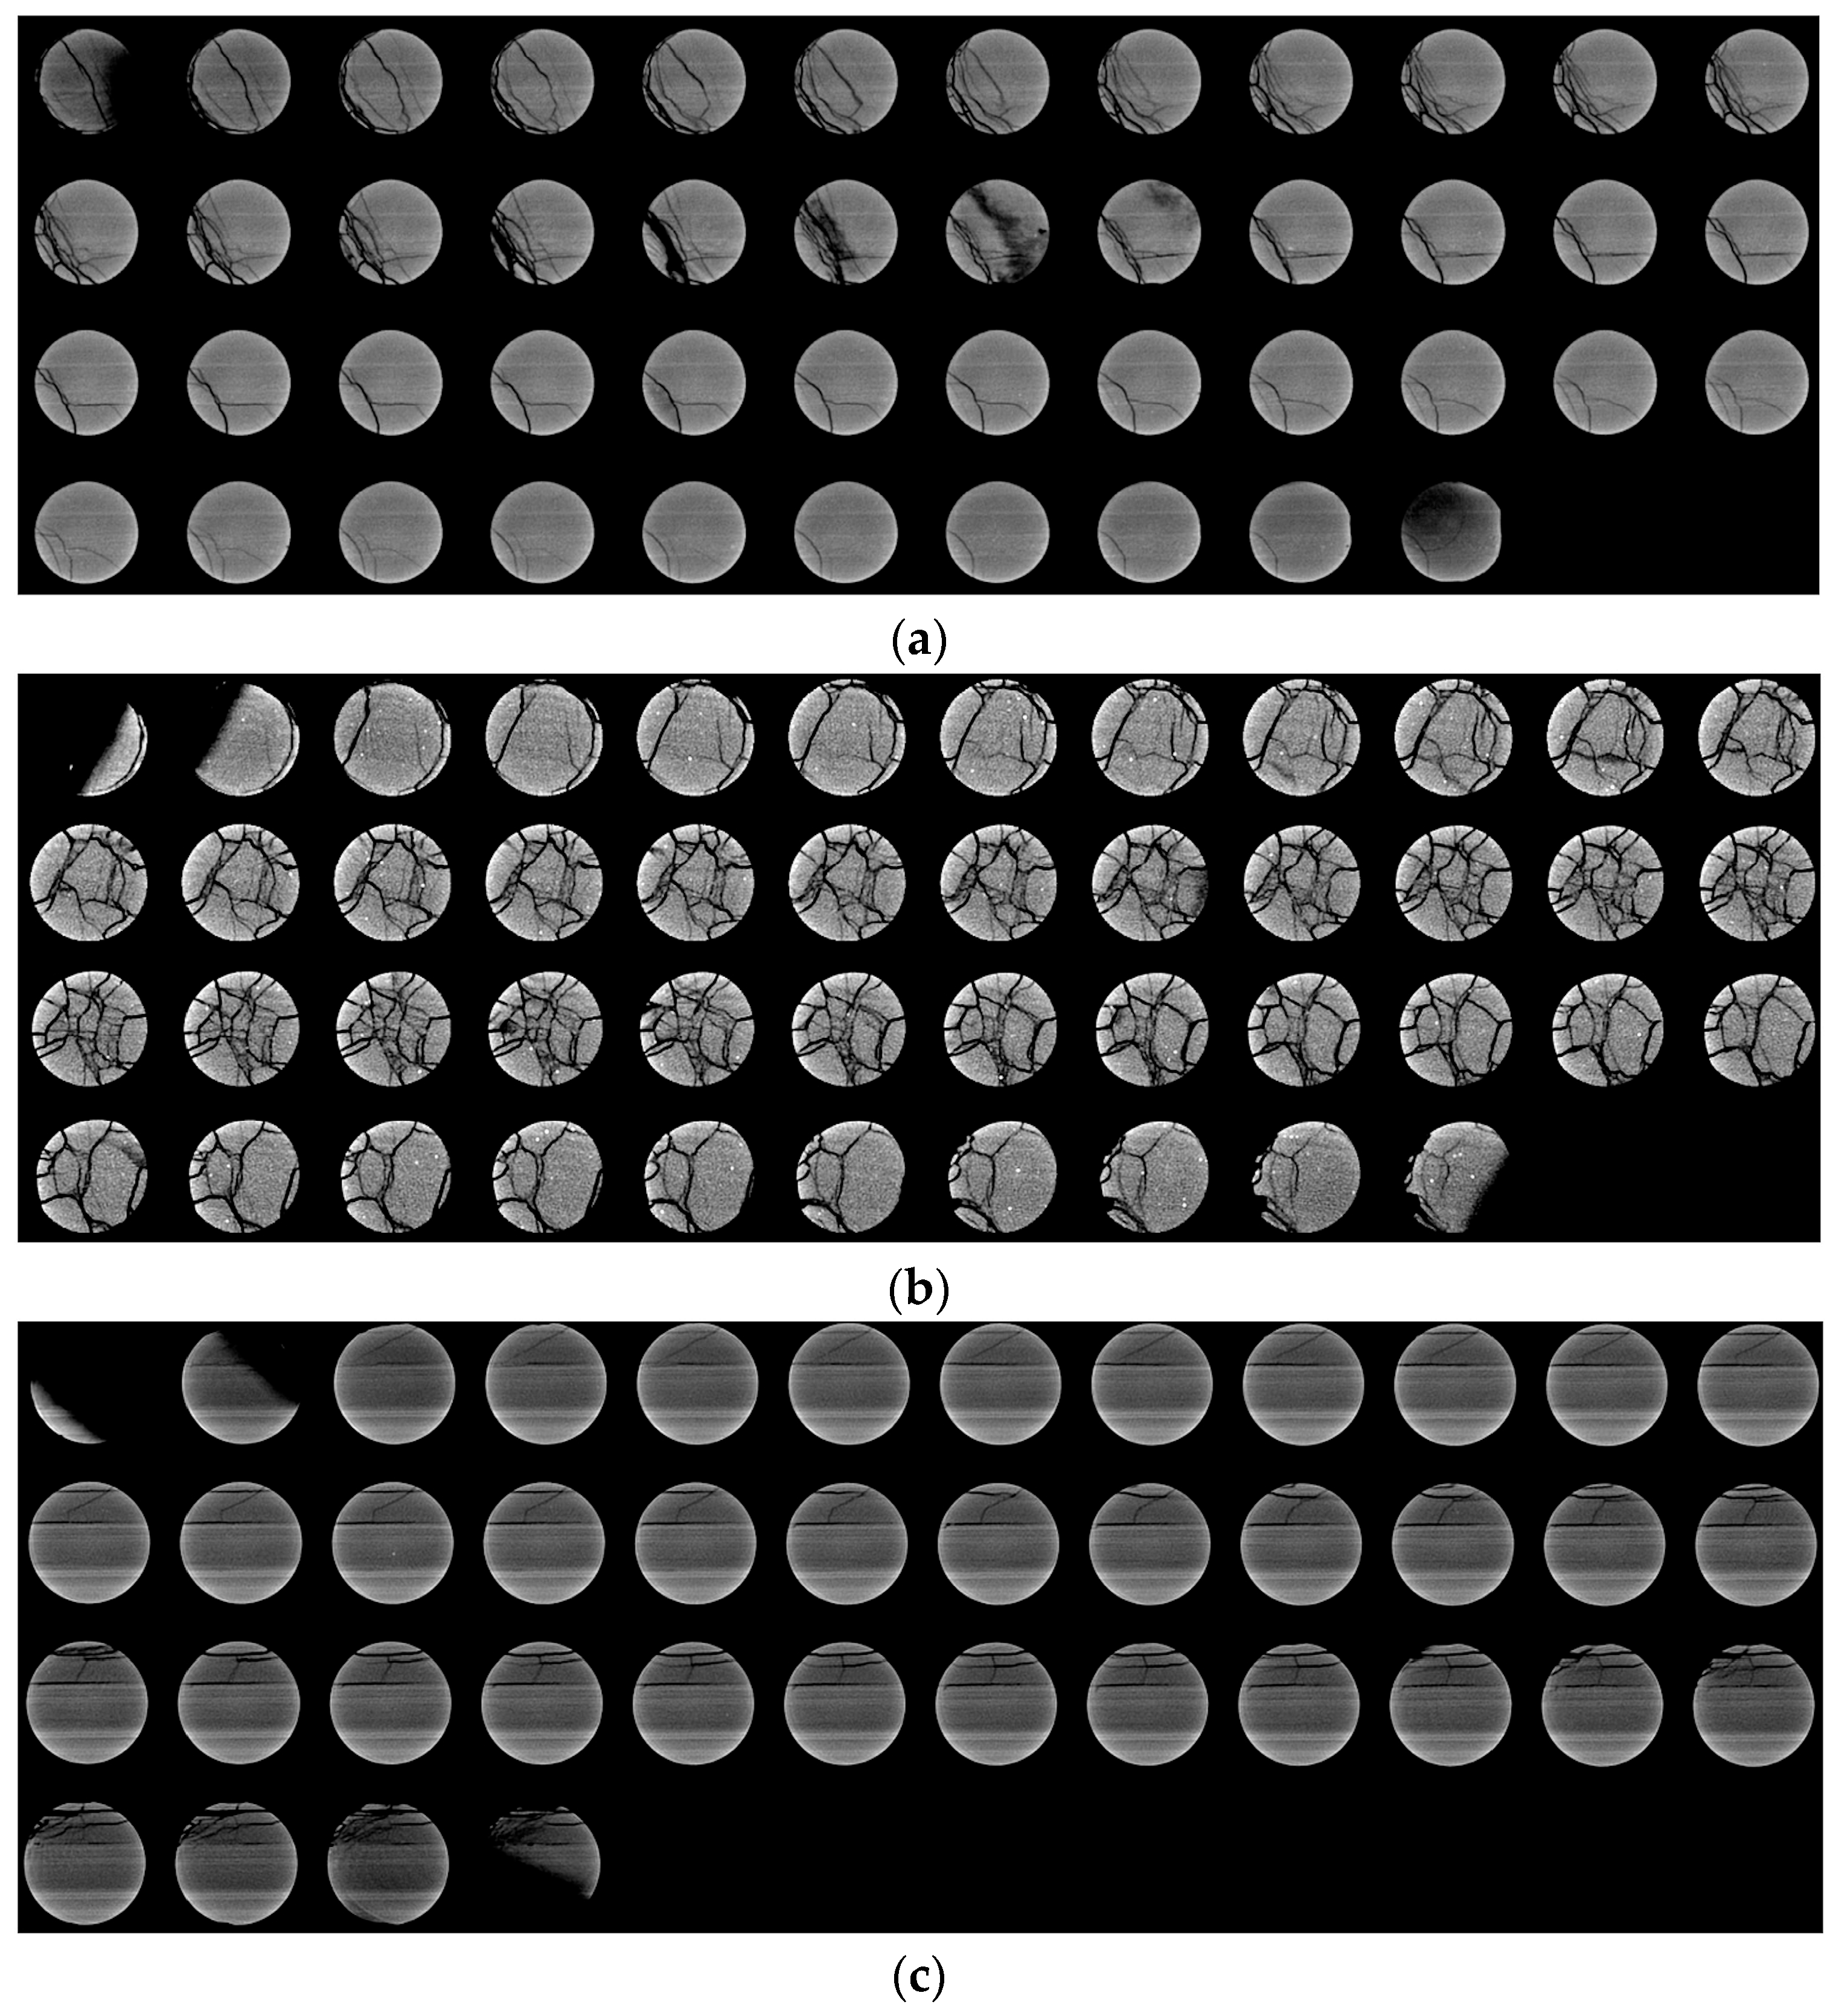
Post-HNP CT scans (Figure 9a–c) revealed extensive fracture networks that formed due to the combination of artificial fracturing in Sample #1 and #2, and repeat HNP cycles in Sample #1, #2 and #3. These fractures are believed to significantly improve the contact area between the injected gas and in-place oil, thereby enhancing mass transfer and fluid flow within the low-permeability matrix–fracture system. This improved connectivity is considered as a key factor controlling the observed recovery enhancement for Sample #1 and Sample #2 after fracturing [8,23,28,29].

7. Conclusions

This laboratory study evaluated the influence of brine saturation and distribution on cyclic lean gas injection using low-permeability core plug samples collected from Montney Formation, Canada. The key conclusions of the work are summarized below:
  • Three cycles of lean gas HNP were performed on intact core samples (Sample #1 and #2), resulting in recovery factors of 4.6% and 2.5%, respectively.
  • Four additional lean gas HNP cycles were performed on the core plugs (under similar conditions to the intact core plugs) following artificial fracturing. This led to an increase in the recovery factors of 23.1% for Sample #1 and 20% for Sample #2.
  • The presence of fractures significantly improves oil recovery by increasing the contact area between injected gas and in-place oil, which enhances mass transfer and fluid flow within the matrix-fracture system.
  • Lower brine saturation within the matrix normally contributes to a higher oil recovery during the lean gas HNP process.
  • In addition to saturation, water distribution is another critical factor influencing the recovery performance. For the first time, this study quantified the negative effect of heterogeneous brine distribution on recovery performance for lean gas HNP in tight oil reservoirs. It was determined that brine concentrated near fracture surfaces for one of the samples (Sample #3) significantly hindered lean gas diffusion into the matrix and reduced oil recovery (i.e., 1.2% only).
  • For reservoirs that have just undergone hydraulic fracturing or waterflooding, appropriate reservoir conditioning and injection strategies should be applied to mitigate the adverse effects of heterogeneous brine distribution on EOR performance.

Author Contributions

Conceptualization, C.S., A.G. and C.R.C.; Methodology, C.S., A.G. and C.R.C.; Formal analysis, C.S. and A.G.; Investigation, C.S., A.G. and C.R.C.; Writing—original draft, C.S.; Writing—review & editing, C.R.C.; Supervision, A.G. and C.R.C.; Funding acquisition, C.R.C. All authors have read and agreed to the published version of the manuscript.

Funding

This research was funded by Natural Sciences and Engineering Research Council of Canada (NSERC) through an Appliance grant [ALLRP 568627-21].

Data Availability Statement

The original contributions presented in this study are included in the article. Further inquiries can be directed to the corresponding author.

Acknowledgments

The authors gratefully thank the sponsors of the Tight Oil Consortium hosted at the Department of Earth, Energy and Environment at the University of Calgary. Chris Clarkson would like to acknowledge ARC Resources and Ovintiv for support of his Research Chair in the field of Subsurface Transitional Energy Pathways (‘STEPs’) at the University of Calgary, and Matt and Tara Brister for support of his Tamaratt Professorship in Transitional Energy Research. The authors further thank Natural Sciences and Engineering Research Council of Canada (NSERC) for providing funding for this work through an Alliance grant (ALLRP 568627-21).

Conflicts of Interest

The authors declare no conflict of interest.

References

  1. Song, C.; Yang, D. Experimental and Numerical Evaluation of CO2 Huff-n-puff Processes in Bakken Formation. Fuel 2017, 190, 145–162. [Google Scholar] [CrossRef]
  2. Hoffman, B.T. Huff-N-Puff Gas Injection Pilot Projects in the Eagle Ford. In Proceedings of the SPE Canada Unconventional Resources Conference, Calgary, AB, Canada, 13–14 March 2018. Paper SPE-189816-MS. [Google Scholar] [CrossRef]
  3. Ghanizadeh, A.; Song, C.; Hamdi, H.; Clarkson, C.R. Experimental and Computational Evaluation of Cyclic Solvent Injection in Fractured Tight Hydrocarbon Reservoirs. Sci. Rep. 2021, 11, 9497. [Google Scholar] [CrossRef]
  4. Tang, W.; Sheng, J.J. Huff-n-puff Gas Injection or Gas Flooding in Tight Oil Reservoirs? J. Pet. Sci. Eng. 2022, 208, 109725. [Google Scholar] [CrossRef]
  5. Milad, M.; Jinin, R.; Sidek, A.; Imqam, A.; Tarhuni, M. Huff-n-Puff Technology for Enhanced Oil Recovery in Shale/Tight Oil Reservoirs: Progress, Gaps, and Perspectives. Energy Fuels 2021, 35, 17279–17333. [Google Scholar] [CrossRef]
  6. Ma, M.; Zhang, Q.; Emami-Meybodi, H. A Proxy-based Workflow for Screening and Optimizing Cyclic CO2 Injection in Shale Reservoirs. Fuel 2025, 400, 135742. [Google Scholar] [CrossRef]
  7. Emami-Meybodi, H.; Ma, M.; Zhang, F.; Rui, Z.; Rezaeyan, A.; Ghanizadeh, A.; Hamdi, H.; Clarkson, C.R. Cyclic Gas Injection in Low-Permeability Oil Reservoirs: Progress in Modeling and Experiments. SPE J. 2024, 29, 6217–6250. [Google Scholar] [CrossRef]
  8. Thomas, F.B.; Piwowar, M.; Noroozi, M.; Gibb, W.; Marin, J.; Zhang, H. Experimental Measurements of Montney and Duvernay Gas-Cycling Enhanced Oil Recovery GCEOR. In Proceedings of the SPE Canada Unconventional Resources Conferences, Virtual, 29 September–2 October 2020. Paper 199994-MS. [Google Scholar] [CrossRef]
  9. Torabi, F.; Asghari, K. Effect of Operating Pressure, Matrix Permeability and Connate Water Saturation on Performance of CO2 Huff-and-puff Process in Matrix-fracture Experimental Model. Fuel 2010, 89, 2985–2990. [Google Scholar] [CrossRef]
  10. Sheng, J.J. Critical Review of Field EOR Projects in Shale and Tight Reservoirs. J. Pet. Sci. Eng. 2017, 159, 654–665. [Google Scholar] [CrossRef]
  11. Zhu, C.; Guo, W.; Wang, Y.; Li, Y.; Gong, H.; Xu, L.; Dong, M. Experimental Study of Enhanced Oil Recovery by CO2 Huff-n-puff in Shales and Tight Sandstones with Fractures. Pet. Sci. 2021, 18, 852–869. [Google Scholar] [CrossRef]
  12. Liu, F.; Kang, Y.; Zhang, M.; Hu, Y.; Huang, Y.; Li, L.; Pan, H. Comparative Study on the Macroscopic Exploitation and Microscopic Mobilization Characteristics of CO2 and N2 HNP to Enhance Shale Oil Recovery. Energy Fuels 2024, 38, 5974–5987. [Google Scholar] [CrossRef]
  13. Xia, Y.; Xin, X.; Yu, G.; Wang, Y.; Lei, Z.; Zhang, L. Design of CO2 Huff-n-Puff Parameters for Fractured Tight Oil Reservoirs Considering Geomechanical Effects. Processes 2024, 12, 2777. [Google Scholar] [CrossRef]
  14. Du, D.; Pu, W.; Jin, F.; Liu, R. Experimental Study on EOR by CO2 Huff-n-puff and CO2 Flooding in Tight Conglomerate Reservoirs with Pore Scale. Chem. Eng. Res. Des. 2020, 156, 425–432. [Google Scholar] [CrossRef]
  15. Mahzari, P.; Mitchell, T.M.; Jones, A.P.; Oelkers, E.H.; Striolo, A.; Iacoviellom, F.; Shearing, P.R.; Juri, J.E. Novel Laboratory Investigation of Huff-n-puff Gas Injection for Shale Oils under Realistic Reservoir Conditions. Fuel 2021, 284, 118950. [Google Scholar] [CrossRef]
  16. Wang, L.; Tian, Y.; Yu, X.; Wang, C.; Yao, B.; Wang, S.; Winterfeld, P.H.; Wang, X.; Yang, Z.; Wang, Y.; et al. Advances in Improved/Enhanced Oil Recovery Technologies for Tight and Shale Reservoirs. Fuel 2017, 210, 425–445. [Google Scholar] [CrossRef]
  17. Song, C.; Ghanizadeh, A.; Younis, A.; Clarkson, C.R. Experimental Evaluation of the Impact of Induced Fractures on Cyclic Solvent Injection Performance in Low-Permeability Hydrocarbon Reservoirs. Fuel 2023, 354, 129327. [Google Scholar] [CrossRef]
  18. Shilov, E.; Dorhjie, D.B.; Mukhina, E.; Zvada, M.; Kasyanenko, A.; Cheremisin, A. Experimental and Numerical Studies of Rich Gas Huff-n-puff Injection in Tight Formation. J. Pet. Sci. Eng. 2022, 208, 109420. [Google Scholar] [CrossRef]
  19. Bai, H.; Zhang, Q.; Li, Z.; Li, B.; Zhu, D.; Zhang, L.; Lv, G. Effect of Fracture on Production Characteristics and Oil Distribution during CO2 Huff-n-puff under Tight and Low-permeability Conditions. Fuel 2019, 246, 117–125. [Google Scholar] [CrossRef]
  20. Zheng, T.; Yang, Z.; Liu, X.; Luo, Y.; Xiao, Q.; Zhang, Y.; Zhao, X. Understanding Immiscible Natural Gas Huff-N-Puff Seepage Mechanism in Porous Media: A Case Study of CH4 Huff-n-Puff by Laboratory Numerical Simulations in Chang-7 Tight Core. Nat. Resour. Res. 2021, 30, 2397–2411. [Google Scholar] [CrossRef]
  21. Guo, Y.; Shi, Y.; Mohanty, K. Comparison of the Effectiveness of CO2 and Hydrocarbon Gas for Shale Huff ’n’ Puff. SPE J. 2025, 30, 2942–2957. [Google Scholar] [CrossRef]
  22. Li, H.; Zheng, S.; Yang, D. Enhanced Swelling Effect and Viscosity Reduction of Solvent(s)/CO2/Heavy-oil Systems. SPE J. 2013, 18, 695–707. [Google Scholar] [CrossRef]
  23. Thomas, F.B.; Noroozi, M.; Apil, R.; White, A. Considerations for Gas Cycling EOR. In Proceedings of the SPE Workshop: The Duvernay Liquid Rich Shale—What Makes It Different and How We Optimize it? Calgary, AB, Canada, 18 October 2017. [Google Scholar]
  24. Ghedan, S. Global Laboratory Experience of CO2-EOR Flooding. In Proceedings of the SPE/EAGE Reservoir Characterization and Simulation Conference, Dhabi, United Arab Emirates, 19–21 October 2009. Paper SPE 125581. [Google Scholar] [CrossRef]
  25. Pu, W.; Wei, B.; Jin, F.; Li, Y.; Jia, H.; Liu, P.; Tang, Z. Experimental Investigation of CO2 Huff-n-puff Process for Enhancing Oil Recovery in Tight Reservoirs. Chem. Eng. Res. Des. 2016, 111, 269–276. [Google Scholar] [CrossRef]
  26. Assef, Y.; Kantzas, A.; Almao, P.P. Numerical Modelling of Cyclic CO2 Injection in Unconventional Tight Oil Resources; Trivial Effects of Heterogeneity and Hysteresis in Bakken Formation. Fuel 2019, 236, 1512–1528. [Google Scholar] [CrossRef]
  27. Morel, D.; Bourbiaux, B.; Latil, M.; Thiebot, B. Diffusion Effects in Gas Flooded Light Oil Fractured Reservoirs. SPE Adv. Technol. Ser. 1993, 1, 100–109. [Google Scholar] [CrossRef]
  28. Silva, F.V.; Belery, P. Molecular Diffusion in Naturally Fractured Reservoirs: A Decisive Recovery Mechanism. In Proceedings of the SPE Annual Technical Conference and Exhibition, San Antonio, TX, USA, 8 October 1989. Paper SPE-19672-MS. [Google Scholar] [CrossRef]
  29. Ellafi, A.; Jabbari, H. Understanding the Mechanisms of Huff-n-Puff, CO2-EOR in Liquid-Rich Shale Plays: Bakken Case Study. In Proceedings of the SPE Canada Unconventional Resources Conference, Virtual, 29 September–2 October 2020. Paper SPE-200001-MS. [Google Scholar] [CrossRef]
  30. Ghanizadeh, A.; Song, C.; Clarkson, C.R.; Younis, A. Relative Permeability of Tight Hydrocarbon Systems: An Experimental Study. Fuel 2021, 294, 119487. [Google Scholar] [CrossRef]
  31. Jone, S.C. A Technique for Faster Pulse-Decay Permeability Measurements in Tight Rocks. SPE Form. Eval. 1997, 12, 19–25. [Google Scholar] [CrossRef]
  32. Keneti, S.A.R.; Wong, R.C.K. Investigation of Anisotropic Behavior of Montney Shale Under Indirect Tensile Strength Test. In Proceedings of the Canadian Unconventional Resources & International Petroleum Conference, Calgary, AB, Canada, 19–21 October 2010. Paper CSUS/SPE 138104. [Google Scholar]
  33. Vaisblat, N.; Shokri, A.R.; Ayranci, K.; Harris, N.; Chalaturnyk, R.J. Significance of Rock Compositional Control on Geomechanical Properties and Hydraulic Fracturing of the Montney Formation, Western Canadian Basin. In Proceedings of the Unconventional Resources Technology Conference (URTeC), Brisbane, Australia, 18–19 November 2019. Paper URTEC-198199-MS. [Google Scholar]
  34. Becerra Rondon, D.M. Geological Characterization and Evaluation of Reservoir Quality in the Montney Formation in West-Central Alberta. Doctoral Thesis, University of Calgary, Calgary, AB, Canada, 2022. Available online: http://hdl.handle.net/1880/114729 (accessed on 10 October 2025).
  35. Davarpanah, A.; Mirshekari, B. Experimental Study of CO2 Solubility on the Oil Recovery Enhancement of Heavy Oil Reseroirs. J. Therm. Anal. Calorim. 2020, 139, 1161–1169. [Google Scholar] [CrossRef]
  36. Zhao, Y.; Yu, J.; Shi, H.; Guo, J.; Liu, D.; Lin, J.; Song, S.; Wu, H.; Gong, J. Study of Methane Solubility Calculation Based on Modified Henry’s Law and BP Neural Network. Processes 2024, 12, 1901. [Google Scholar] [CrossRef]
  37. Kim, Y.S.; Lim, B.D.; Lee, J.E.; Lee, C.S. Solubilities of Carbon Dioxide, Methane, and Ethane in Sodium Chloride Solution Containing Gas Hydrate. J. Chem. Eng. Data 2008, 53, 1351–1354. [Google Scholar] [CrossRef]
  38. Riazi, M.R.; Vera, J.H. Method to Calculate the Solubility of Light Gases in Petroleum and Coal Liquid Fractions on the Basis of Their P/N/A Composition. Ind. Eng. Chem. Res. 2005, 44, 186–192. [Google Scholar] [CrossRef]
  39. Soltanian, M.R.; Amoois, M.A.; Cole, D.R.; Darrah, T.H.; Graham, D.E.; Pfiffner, S.M.; Phelps, T.J.; Moortgat, J. Impacts of Methane on Carbon Dioxide Storage in Brine Formations. Groundwater 2018, 56, 176–186. [Google Scholar] [CrossRef]
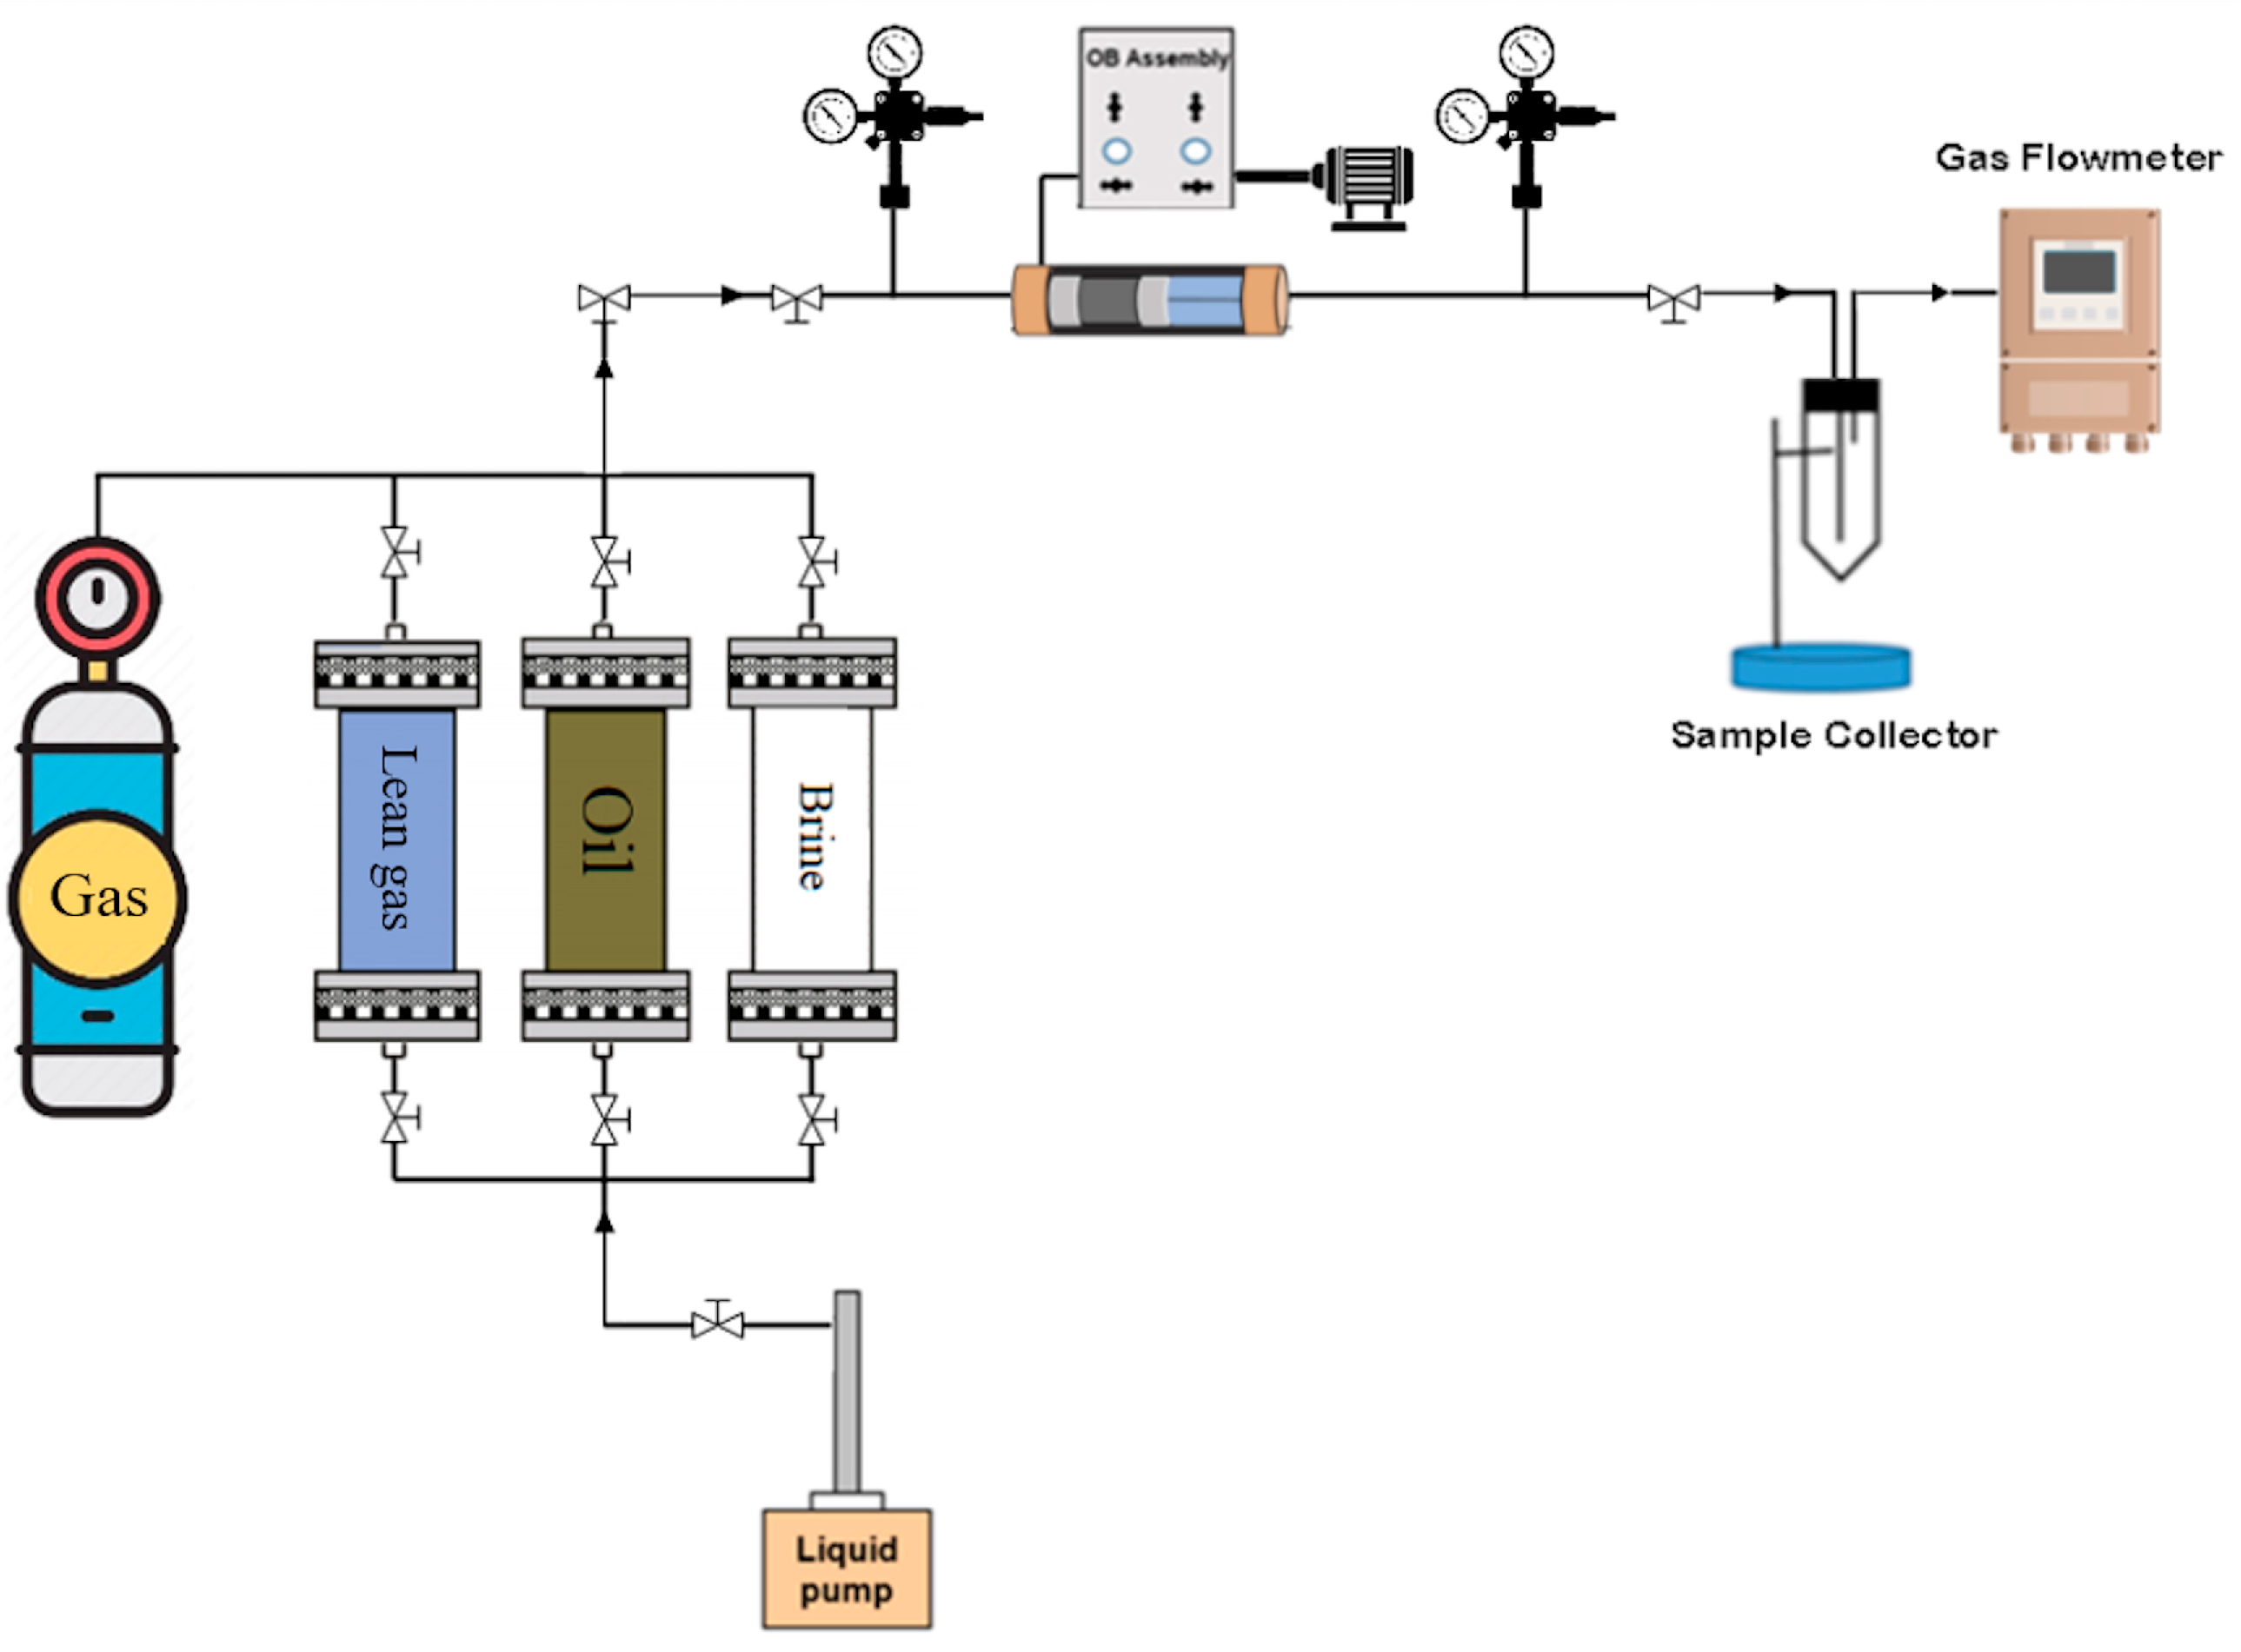
Figure 1. Schematic of lean gas HNP experimental setup used for both intact and fractured core samples (adapted from Ghanizadeh et al. [3]).
Energies 18 05537 g001
Figure 2. Stress-dependent matrix gas (N2) permeability and liquid (oil or brine) permeability measured with the analyzed Montney core samples. Note that the oil permeability of Sample #3 is higher than expected because of sample fracturing during the oil saturation stage (after gas permeability measurements; see text for explanation).
Energies 18 05537 g002
Figure 3. Image of fracture surfaces of core plug Sample #3. This core plug was fractured during the oil saturation stage.
Energies 18 05537 g003
Figure 4. Oil recovery as a function of elapsed time for lean gas HNP experiments performed using intact core samples (Sample #1 and Sample #2). Results of Sample #1 were adapted from Song et al. [17].
Energies 18 05537 g004
Figure 5. Oil recovery as a function of elapsed time for lean gas HNP experiments performed with intact (Sample #1 and #2) and fractured core plug samples (Sample #1–3). Results of Sample #1 were adapted from Song et al. [17].
Energies 18 05537 g005
Figure 6. System pressure as a function of elapsed time for lean gas HNP experiments performed with intact (Sample #1 and #2) and fractured core plug samples (Sample #1–3). Results of Sample #1 were adapted from Song et al. [17].
Energies 18 05537 g006
Figure 7. Liquid (oil) permeability measured during stress loading and unloading cycles for the analyzed fractured core samples.
Energies 18 05537 g007
Figure 8. Illustration of two brine distribution scenarios: (a) relatively uniform distribution of brine and oil within the core plug matrix, achieved by saturating the core plug with brine and oil before fracturing (i.e., Sample #2); (b) brine accumulation near the fracture surfaces caused by saturating the core plug with brine after fracturing (i.e., Sample #3).
Energies 18 05537 g008
Figure 9. Post-HNP CT scan images (X-Y direction) for the fractured core plug samples: (a) Sample #1, (b) Sample #2, and (c) Sample #3. Fractures are detected from top to bottom of the core plug. Images of Sample #1 were adapted from Song et al. [17].
Energies 18 05537 g009
Table 1. Literature review of laboratory HNP experiments for tight reservoirs (partially adapted from Song et al. [17]).
No.FormationSample
Condition
Gas TypePorosity
(%)
Permeability
(md)
Initial Brine
Saturation
(%)
Cycle
No.
Final
Recovery
(%)
Reference
1Duvernay, CanadaFracturedCO23.20.0001250445[3]
Duvernay, CanadaFracturedLean Gas2.10.0001250429
2Montney/Duvernay CanadaFracturedLean gas6~0.0008207~35[8]
3Bakken, CanadaIntactCO218.6–23.10.56–0.8335.8–57.1642.8–63[1]
4Haynesville Shale USAFracturedLean gas80.0006–0.0009~11735–50[15]
5AnonymousIntactCO29.00.8842.4337[14]
6Ordos Basin, ChinaIntactCO29.60.01203~70[11]
Intact3.80.000533~55
Fractured8.90.0183~78
Intact4.30.000253~58
7Anonymous, RussiaIntactRich gas4.1–17.0N/A0529–88[18]
Anonymous, RussiaFractured2.3–10.9N/A541–88
8AnonymousIntactCO26.50.89N/A123[19]
AnonymousFractured6.80.89113
9Ordos Basin, ChinaIntactCH411.40.14557.7325[20]
Rich gas11.70.14560.6331
10AnonymousIntactCO211.90.0010684[21]
Rich gas11.70.001674
Table 2. Bulk mineralogy of Montney core sample in the vicinity of the analyzed cores (adapted from Song et al. [17]).
Quartz
(wt.%)
K-Feldspar
(wt.%)
Plag. Feldspar
(wt.%)
Calcite
(wt.%)
Dolomite
(wt.%)
Pyrite
(wt.%)
Illite
(wt.%)
Chlorite
(wt.%)
42.037.8215.91.697.592.318.474.2
Table 3. Summary of the petrophysical properties of the analyzed core plug samples.
Sample IDDepth
(m)
Bulk
Density
(g/cm3)
Grain
Density
(g/cm3)
Helium
Porosity
(%)
Pulse-Decay (N2)
Gas Permeability
(md) 1
#12149.22.592.704.20.00042
#22149.22.612.734.40.00078
#32156.92.642.712.60.00022
1 Slip-corrected pulse-decay (N2) gas permeability evaluated at an effective stress of 500 psi.
Table 4. Physical properties of the Montney (dead) oil sample used in this study.
FluidDensity (g/cm3)
[25 °C, 1 atm]
Viscosity (cP)
[25 °C, 1 atm]
Compressibility (psi−1)
[25 °C, 1 atm]
Montney Dead Oil0.832.480.0000052
Table 5. Physical properties of the synthetic brine prepared based on the composition of formation produced brine.
FluidDensity (g/cm3)
[25 °C, 1 atm]
Viscosity (mPa.s)
[25 °C, 1 atm]
Compressibility (psi−1)
[25 °C, 1 atm]
Synthetic brine1.040.9980.000003
Disclaimer/Publisher’s Note: The statements, opinions and data contained in all publications are solely those of the individual author(s) and contributor(s) and not of MDPI and/or the editor(s). MDPI and/or the editor(s) disclaim responsibility for any injury to people or property resulting from any ideas, methods, instructions or products referred to in the content.