Article

Scaling of Automotive Fuel Cells in Terms of Operating Indicators

Faculty of Civil and Transport Engineering, Poznan University of Technology, Piotrowo 3 street, 60-965 Poznan, Poland
*
Author to whom correspondence should be addressed.
Energies 2025, 18(20), 5513; https://doi.org/10.3390/en18205513 (registering DOI)
Submission received: 15 September 2025 / Revised: 9 October 2025 / Accepted: 16 October 2025 / Published: 19 October 2025
(This article belongs to the Special Issue Sustainable Development of Fuel Cells and Hydrogen Technologies)

Abstract

The search for alternatives to fossil fuels has led to hydrogen becoming an important factor in the powering means of transportation. Its most effective application is in fuel cells. A single fuel cell is not a sufficient source of power, which is why a stack of fuel cells is the more common solution. Fuel cells are tested using single units, as this allows all cell parameters (the current density, flow rates and efficiency) to be evaluated. Therefore, the scalability of fuel cells is an essential factor. This paper analyses the scalability of fuel cells with a power of approximately 100 kW and 1.2 kW. Road tests of the fuel cells were compared with stationary tests, which allowed the load to be reproduced and scaled. This provided a representation of the scaled current and the scalable power of the fuel cell. The research provided voltage–current characteristics of fuel cell stacks and their individual equivalents. It was concluded that regardless of the power scaling or current values, the characteristics obtain similar patterns. A very important element of the research is the awareness of the properties of these cells (the number of cells and active charge exchange area) in order to compare the unit characteristics of fuel cells.

1. Introduction

1.1. Requirements for Fuel Cells

Reducing dependence on fossil fuels has intensified research into alternative energy carriers for road transport. Typical substitutes for conventional fuels are LPG, gaseous fuels (CNG and LNG), methanol, ethanol and hydrogen (in liquid and gaseous forms). All of these fuels can be used in combustion engines, but only some of them can be used in fuel cells.
The ongoing industrial revolution has caused transport emissions to increase by approximately 1.7% per year since 1990, reaching a level of 24% in 2022 [1]. The use of carbon-free fuels allows for a significant reduction in CO2 emissions. One way to reduce CO2 emissions is to use hydrogen. Hydrogen can be used as an energy carrier to power combustion engines, but its main application in transportation today is in fuel cells. Their development is constantly evolving and their practical application still requires many technical issues to be solved. Contemporary issues surrounding the use of fuel cells in transport focus on several aspects:
  • The cell designs and their current characteristics (mainly the power density).
  • Current losses occurring in cells.
  • The scalability of fuel cells.
These are described in the following sections, introducing the topic.

1.2. Fuel Cells in the Automotive Industry

The road transport sector is currently dominated by combustion engines. However, the impact of electric drives is becoming increasingly visible (due to the possibility of extending the range of these vehicles). Hydrogen-powered vehicles can contribute significantly to the decarbonisation of all transport sectors. Fuel cell electric vehicles (FCEVs) are best suited for applications requiring a long range (PC and HDV), heavy loads (HDV) and high flexibility (PC and LDV). It is apparent that the use of fuel cells is particularly important here, as these vehicle segments consume the most energy. In 2025, trucks and buses represented only 5% of the fuel cell-powered vehicle fleet. However, they could achieve more than 30% of the total CO2 reduction potential [2].
In the McKinley consulting firm’s report [3], it is stated that the growing demand for clean hydrogen will result in:
  • A 30% demand for hydrogen in 2030 in the EU, Japan, Korea and the US. These regions could represent up to 60% of the total demand.
  • A potential price range for clean hydrogen of USD 1–12/kg H2 (the price variation depends on the end user and geographical region).
Modern hydrogen storage systems have been developed in a way that two solutions dominate the automotive market: hydrogen storage at a pressure of 35 MPa (passenger cars and trucks) and 70 MPa (passenger cars). These different pressure values result in different volumetric energy densities: at a lower pressure, it is 2.63 MJ/dm3, and at higher pressure, it is 4.27 MJ/dm3 [4,5].
The theoretical potential voltage of a single fuel cell is 1.23 V at a temperature of 25 °C and standard atmospheric pressure [6]. The present typical efficiency of fuel cells is approximately 50–60%, which is more favourable than for internal combustion engines (with a typical efficiency of 30% and a maximum efficiency of 45%), considering that the only product of combustion in the cell is water.
Although there are many fuel cells on the market—low-temperature [7]: PEM, AFC, DMFC and PAFC; and high-temperature: SOFC and MCFC—automotive solutions mainly consist of PEM cells (Figure 1).
Low-temperature fuel cells operate at temperatures of up to approximately 80 °C. Although this is not a high value, only fuel cells with a power output of 200 W to 2 kW can be cooled by air [9]. Cells above 2 kW require liquid cooling [10,11].
The development of fuel cells has resulted in a reduction in the platinum concentration. In 1962, Gemini, equipped with a 1 kW fuel cell, had 35 mg/cm2 of platinum, while today’s Toyota Mirai has only 0.365 mg/cm2. In this case, the use of platinum has been reduced by more than 100 times [11].
Globally, 80% of FCEVs (72,000 units at the end of 2022) were passenger vehicles. Buses represented approximately 6400 vehicles (84% in China), light commercial vehicles (MDVs) represented 3870 vehicles, and HDVs represented 3300 vehicles (mainly in China—98%) [12].
Vehicles available on the market use fuel cells with an output ranging from 95 to 128 kW: 114 kW (Mirai Gen. I) [13], 128 kW (Mirai Gen. II) [14], 103 kW (Honda Clarity) [15], 95 kW (Hyundai Nexo) [16] and 115 kW (Saic MAXUS FCV80) [17]. Ref. [7] states that the fuel consumption of these vehicles ranges from 0.77 to 1.15 kg/100 km, but the conditions under which these tests were conducted are not specified. Road and laboratory tests of FCEVs indicate slightly higher fuel consumption values in the range of 0.975–1.506 kg/100 km with the stack efficiency in the range of 53–60% [18].
For heavy-duty vehicle applications, the Ballard company offers fuel cells with power outputs ranging from 120 to 360 kW (liquid-cooled), operating in the range of 520–750 V with a current ranging from 19 to 230 A at a hydrogen pressure of 5 to 8 bar [19]. For stationary and marine applications, systems ranging from 200 kW to 1.2 MW are offered. Other manufacturers offer fuel cells with a power range of up to 180 kW for MD and HD vehicles. Furthermore, these fuel cells can be multiplied, which means that the final power of the system can be increased significantly [13,20].
The HYBARI (HYdrogen-HYBrid Advanced Rail vehicle for Innovation) project used Toyota fuel cells (PEM 60 kW × 4) to power a two-car rail vehicle powered by four motors, each with a power output of 90 kW [21].

1.3. Assessment Capabilities for Fuel Cells

1.3.1. Modern Fuel Cells Research

The modelling of fuel cells may include electrochemical [22,23,24], flow [24,25] and voltage losses calculations [26].
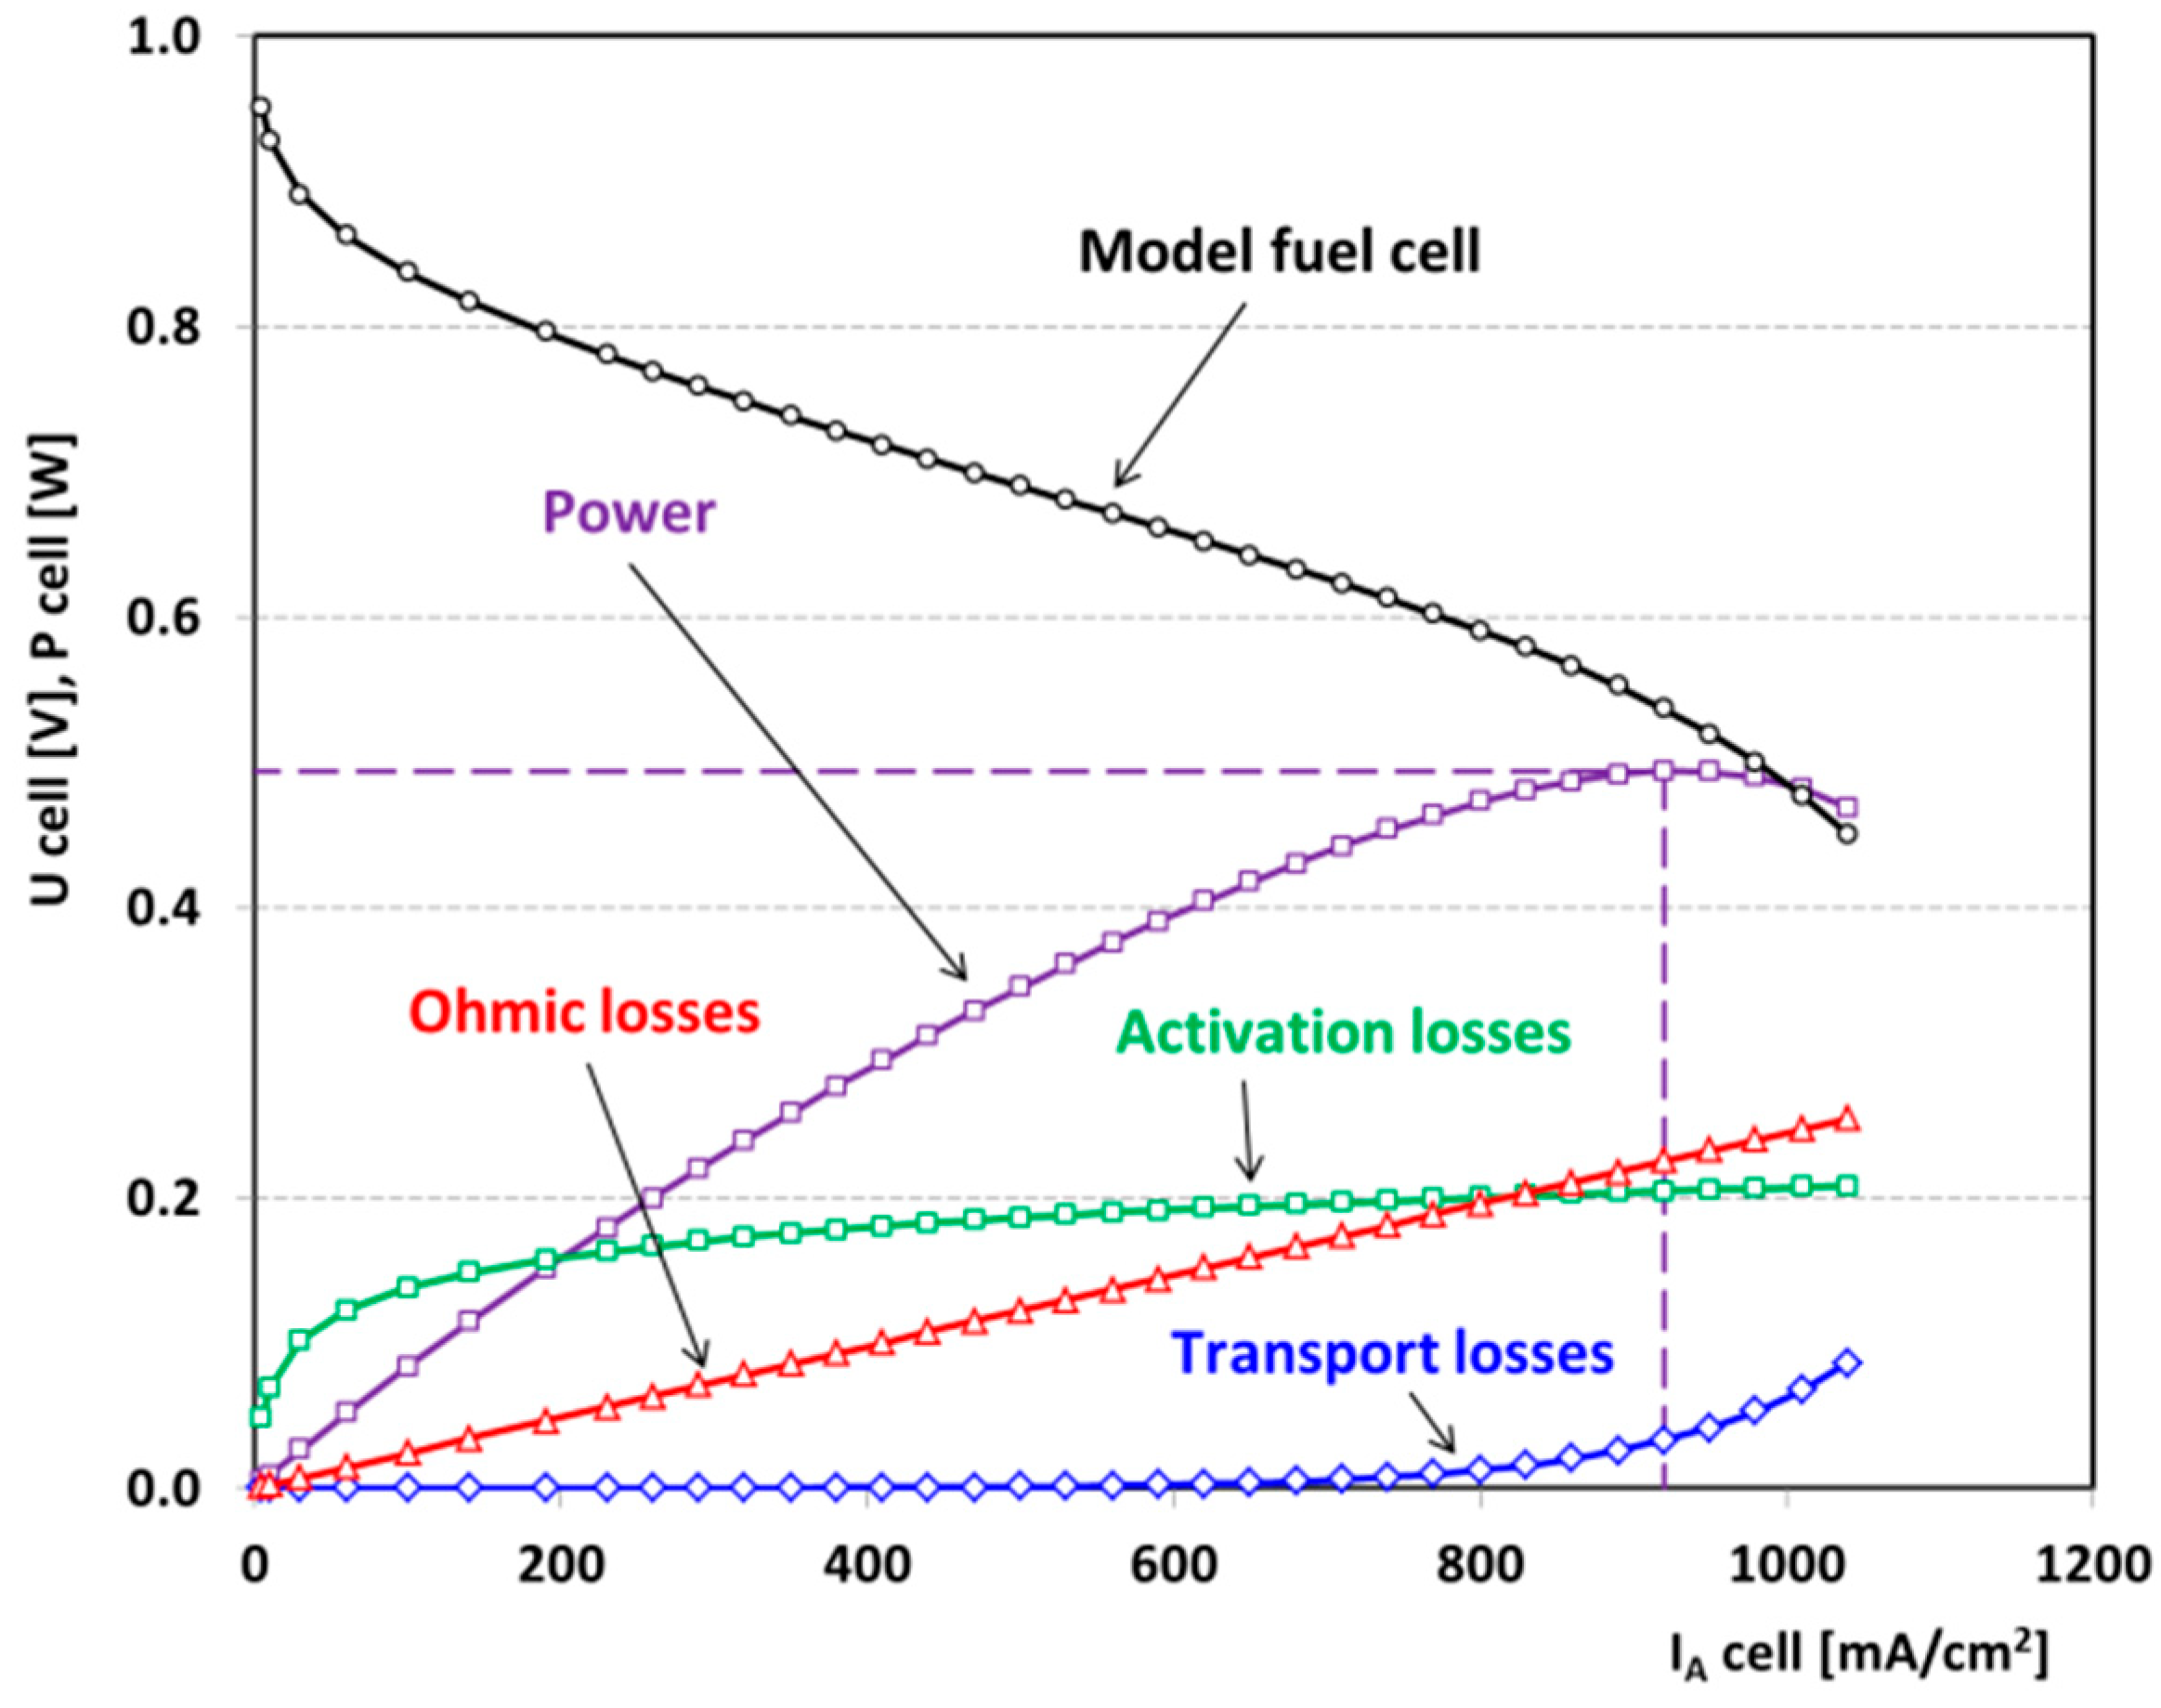
Based on the Butler–Volmer equation [27] relating to the equilibrium potential of a fuel cell, three separate voltage loss areas can be distinguished (Figure 2):
  • Voltage activation (activation losses).
  • Resistive (ohmic losses).
  • Mass transport (transport losses).
A few years ago, fuel cells achieved an energy-to-weight ratio of around 2 kW/kg [15] (equivalent to approximately 3.1 kW/dm3 [28]). Contemporary solutions (Toyota Mirai II) offer more than twice that: 5.4 kW/kg [17] and 5.4 kW/dm3 [29]. In addition, Japan and the European Union have proposed ambitious targets of a 6 kW/dm3 power density for PEMFC before 2030 and 9 kW/dm3 before 2060 [30,31].
Research conducted by Philip and Ghosh [32] indicates that with a four times increase in cell power (from 55 to 250 kW), its mass increases from 28 to 125 kg (a 4.4 times increase) and its volume increases from 18 to 80 dm3 (also 4.4 times greater). This means that changes in the cell scalability can be proportional. It should be mentioned that the research also included a heat exchanger and here, an increase in cell power results in an equal additional weight of the exchanger. This relationship indicates that increasing the cell power reduces the weight and volume of the heat exchanger.

1.3.2. Scalability of Fuel Cells

The analysis of the scalability effect of PEM fuel cells was conducted by Leelasupakorn et al. [33] by using a single fuel cell with an active surface area of 5 and 50 cm2. The platinum concentration was 0.2 mg/cm2. The analysis of the power of the two types of cells did not indicate proportional changes. In addition, the cell with a larger surface area generated a lower voltage at the same current. However, in the activation loss area, the polarisation curves did not differ significantly from each other. The efficiency of the larger cell was lower as it resulted in increased water production with a less homogenous catalyst layer. In summary, the analyses concluded that one of the important elements in the operation of such cells is the stability of the temperature, which was maintained at 353 K.
A simulation analysis of a scaled fuel cell system was proposed by Hu-ang et al. [34]. The paper presents a solution for a single cell and a scaled 3 × 3 cell. The system model included a cell, a battery, an energy management system (EMS) and a DC–DC converter. The research consisted of analysing the similarity of changes in the current and voltage in each cell (single and in nine segments). Very similar voltage and current values were obtained, with an error of less than 4% and similar dynamics of changes.
A technical analysis of fuel cell multiplication was presented by Zheng et al. [35]. The analysis concerned four parallel-connected stacks with a power of 630 kW—a total of 2.52 MW. It was concluded that the electrical efficiency of the system is 48.18% and is lower than in other similar studies with high-temperature cells (57.64%) [36].
Modern fuel cells research focuses on optimising their weight and volume, which is particularly crucial in drone applications. A study on reducing the cooling of each membrane (MEA) was conducted by Luo et al. [37]. The research investigated the cooling of 30 stack membranes per membrane or per two, three, four and five. It was stated that reducing cooling per four cells reduced the stack volume by 22% while increasing the unit power by 22.4% (at a current of 33 A). Increasing the current to 82.5 A did not affect the characteristic of the unit power increase (24% increase). Increasing the number of cells to five did not change the unit parameters. The research outlined that the use of two cells per cooling system results in the greatest changes in the unit (volume) power.
Current research indicates the presence of new methods for testing fuel cell scalability, but there is a lack of similar studies in the literature that take into account different cells and their scaling. In most cases, studies are based on a single cell and a subsequent attempt at modular construction. Instead, a different scaling model was used here: “down scaling”, i.e., the evaluation of a stack of cells and scaling them using a small fuel cell module.
This study puts forward the hypothesis that it is possible to scale fuel cells from typical automotive systems to low-power fuel cells. All losses that are generated by typical fuel cells are taken into account. Such scaling allows for a comparison of their operating characteristics. The positive verification of the hypothesis will enable the future scaling of cells in the opposite direction: based on small cells, it will be possible to determine the operating conditions of large fuel cell stacks.
The aim of the research is to analyse the scalability of two different types of fuel cells and to compare their voltage–current characteristics. Due to the different capacities of the analysed systems, it was possible to compare their characteristics in relation to the active surface area of the measuring cell. Despite the different surface areas (which affect the analysis results), a comparison of voltage–current characteristics was made in the area of dynamic road tests. Previous scaling analyses focused on different sizes of stacks of the same basic cell. In this study, a small-scale 1.2 kW cell was compared with a typical production fuel cell with a power output of over 100 kW.
The following sections present the research methodology (Section 2), which describes the testing of the vehicle and low-power cells. The next section (Section 3) presents an analysis of the vehicle’s drive performance. Section 4 contains the methodology for downscaling cells (from a large to small scale) and the results of such actions. Section 5 discusses the results obtained, together with the voltage–current characteristics of both types of cells.

2. Materials and Methods

2.1. FCHEV Vehicle

Fuel cell losses were tested using a second-generation Toyota Mirai with a mileage of only 300 km. The technical data of the drive system are presented in Table 1. The drive system is a hybrid drive system: it contains two energy sources and two drives. The system allows operation in battery mode, fuel cell mode or both energy sources simultaneously. It should be noted, according to Table 1, that the power of the fuel cell is about 4 times greater than the power of the battery. This means that the dominant source of power in the vehicle is the fuel cell. The latest generation of the drive system contains Li-Ion batteries with a lower electrical capacity than the previous generation, but with a higher operating voltage.
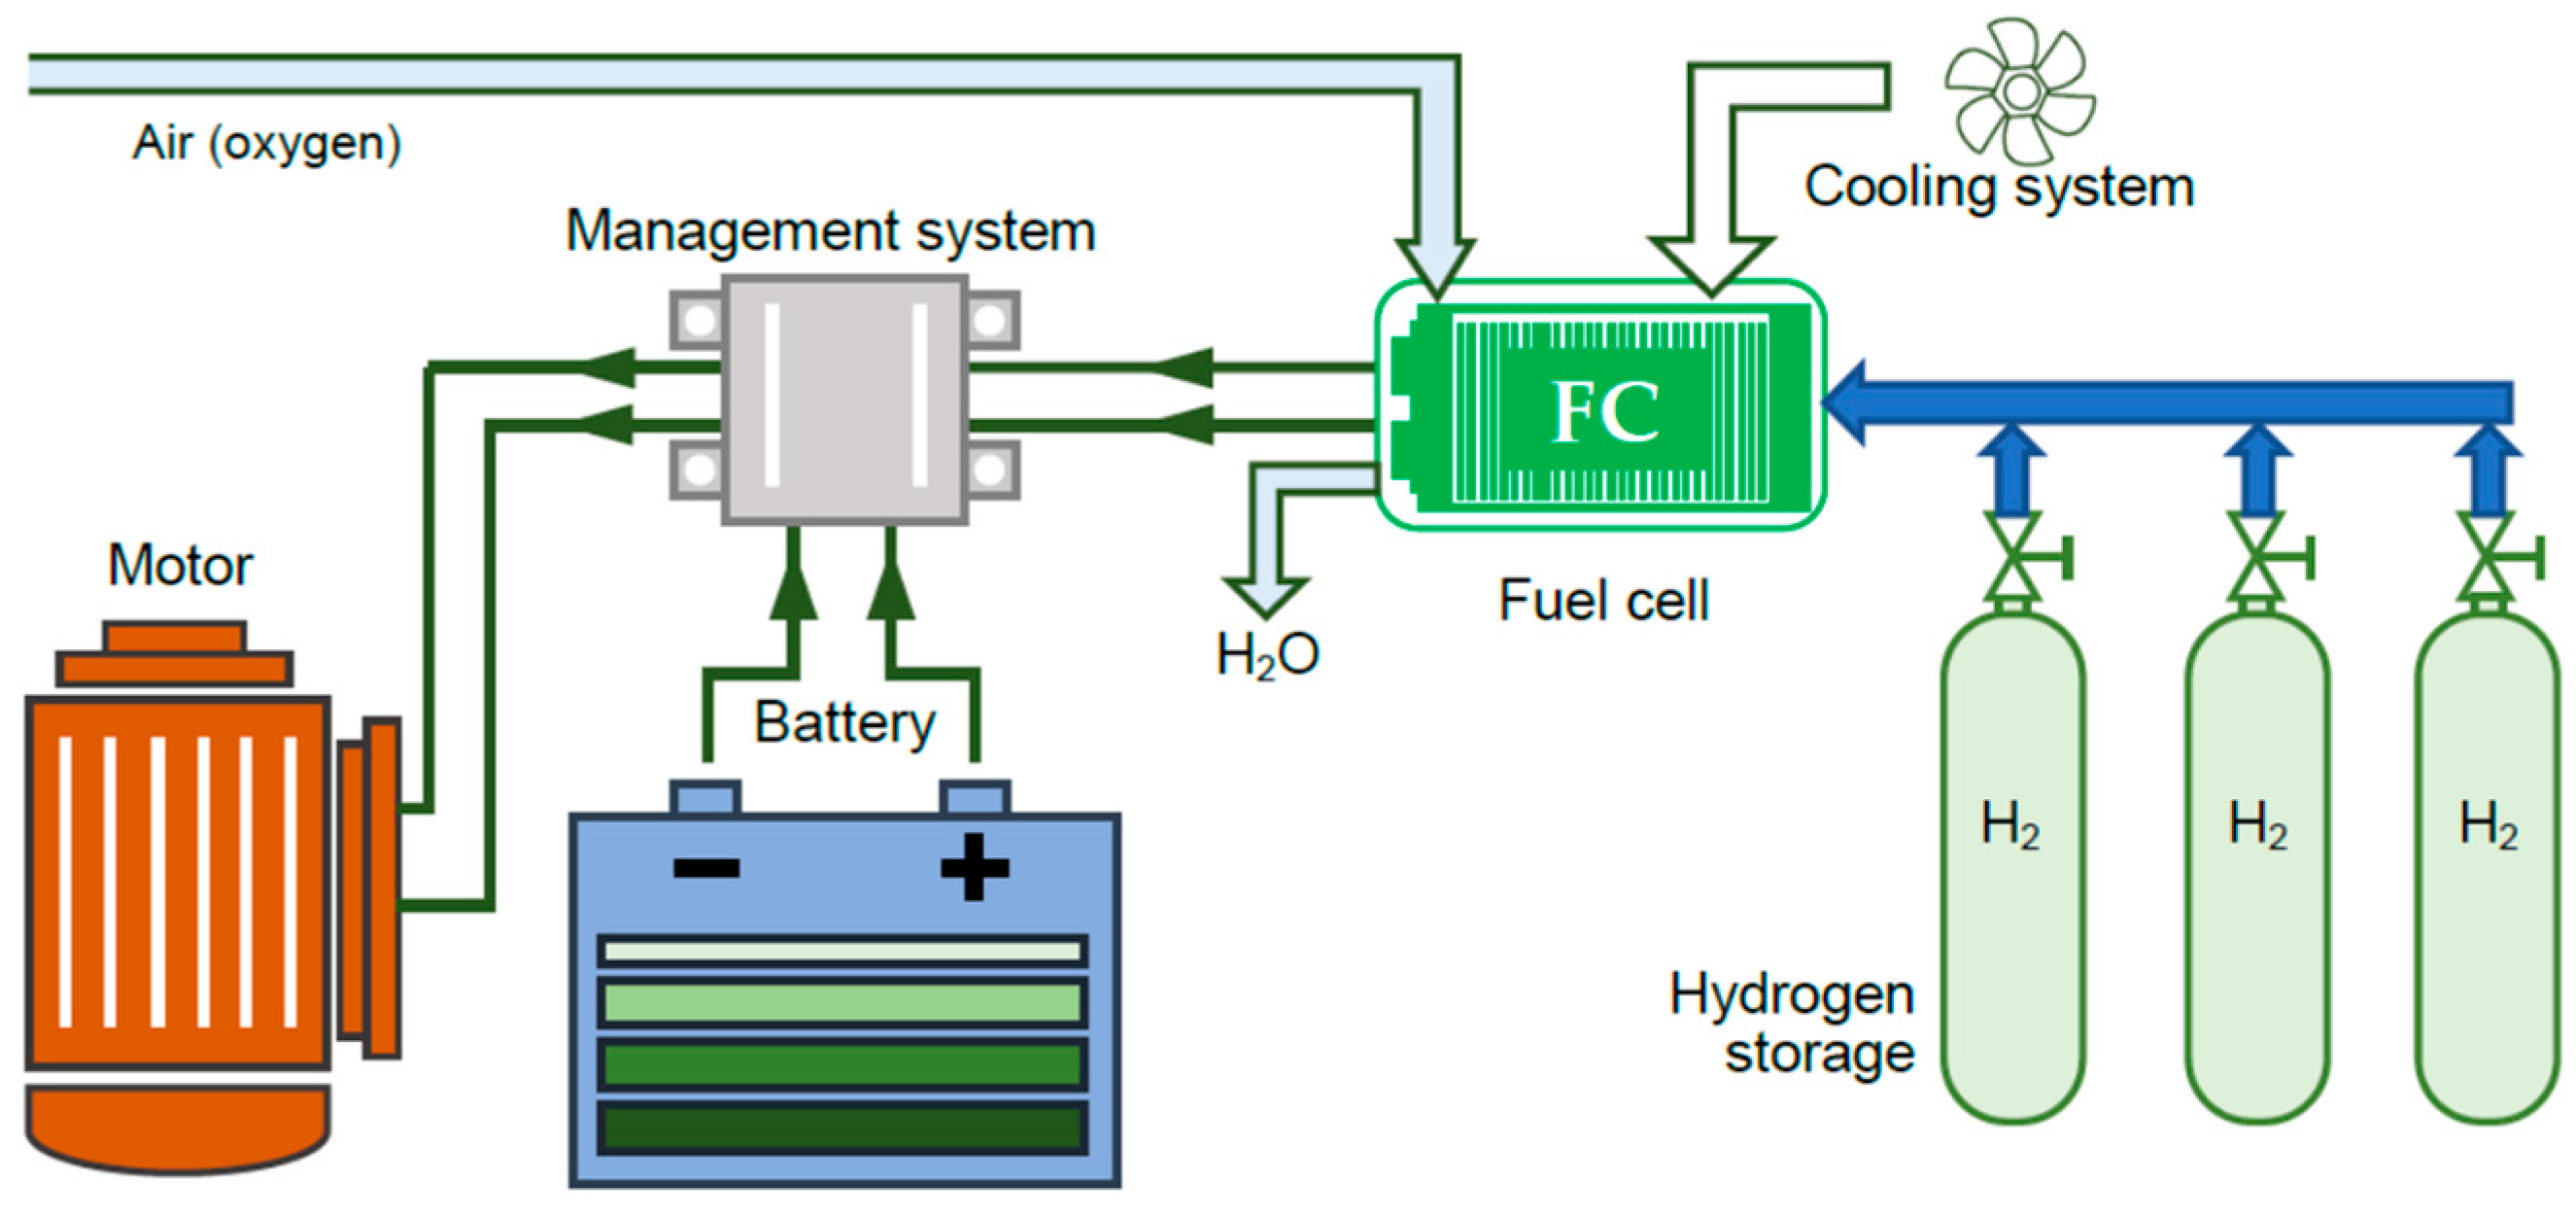
The drive system shown in Figure 3 features a fuel cell, a battery system and three hydrogen storage tanks (the older generation of the drive system has two). The system is based on the use of a fuel cell, as studies have shown that the battery’s share of use in road traffic conditions is approximately 18% [38].
Table 1. Toyota Mirai powertrain system [29,39,40].
ComponentParameterMirai II Gen.
Vehiclemass2415 kg
top speed175 km/h
acceleration 0 to 60 mph9.2 s
range (homologation cycle)650 km
Fuel celltypePEM (polymer electrolyte)
power128 kW (174 KM)
power density5.4 kW/kg; 5.4 kW/dm3
(excl. end plates)
number of cells330
Motortypepermanent magnet synchronous
peak power134 kW at 6940 rpm
maximum torque300 Nm
maximum speed16,500 rpm
BatterytypeLi-Ion
capacity4 Ah
output31.5 kW × 10 s
nominal voltage310.8 V (3.7 V × 84)
energy1.24 kWh
Hydrogen
storage
internal volume142.2 dm3
nominal pressure70 MPa
mass5.6 kg

2.2. HEL 1.2 kW System

Stationary tests were carried out using the Hybrid Energy Lab-System based on a stack of PEM fuel cells with a total power of 1.2 kW, air-cooled with an open cathode (Figure 4a). The solutions of these systems varied and contained from 47 (older designs) to 36 individual cells [41,42,43,44]. The stack consists of 36 cells generating a voltage in the range of 18–36 V. The system is equipped with lead-acid batteries with an energetic value of 18 Ah and a voltage of 24 V (Li-Ion cells with a capacity of 10 Ah can also be used). A DC/DC voltage converter and a programmable load system were built into the test bench. This programmable system was used to scale the current and cell power values. The input data were provided on the basis of road tests of the Toyota Mirai. The tests used hydrogen stored in a steel tank at a maximum pressure of 20 MPa, which was reduced to a constant pressure of 5 bar at the fuel cell anode inlet (Figure 4). The technical characteristics of the test bench are summarised in Table 2.
The scalability of fuel cells involved the following testing procedure:
  • Driving the vehicle while acquiring basic vehicle operating parameters and data of the fuel cell stack and high-voltage batteries. The authors used specialised TechStream measuring equipment dedicated to Toyota vehicles, enabling data to be retrieved from the OBD system at a frequency of 1 Hz (as required by regulations). For the purposes of this article, only a few measurement values were used: the vehicle speed and electric motor speed and the voltage and current from the electric motor, HV battery, fuel cell, voltage converter data, temperature and pressure at several different points in the hydrogen storage system. The data were read from a single vehicle controller, which was the EV (electric drive) controller.
  • Due to the use of the HEL system (with a power of 1.2 kW), the cell current and cell power values were scaled down by a factor of 1:100.
  • The HEL system allows the load value to be set using a programmable control device. It is possible to obtain a load in the form of current or power.
  • The set load is not directly the cell load but the system load (as shown in Figure 4b). This approach means that the scaling will not directly apply to the cell stack (Mirai)–cell stack (HEL), but only to the cell stack (Mirai)–system load (HEL).
One of the limitations of the actual research is the lack of static tests. This leads to dynamic changes in size and sometimes prevents a full analysis of the processes taking place. However, in real-world conditions, such cells are usually under variable conditions (and these were used for further analysis in the three phases of vehicle operation). Due to specific driving conditions (up to 140 km/h), the maximum power of the cell (as well as the high-voltage battery) was not reached, which narrowed the voltage–current characteristics obtained for the second-generation Toyota Mirai fuel cell stack.

3. Results

3.1. Results of Road Tests of the Toyota Mirai Vehicle

Road tests of the vehicle were performed in accordance with the requirements of the Real Driving Emissions (RDE) test. The test covers urban, extra-urban and motorway phases (Figure 5). In accordance with the test requirements, Figure 5 shows the driving speed profile and the minimum RDE test requirements.
As part of the test, 10-minute segments were selected for scaling. The purpose of scaling is to replicate the conditions of a typical driving test in a small-scale fuel cell.
As shown in Figure 5, an urban phase at the beginning of the test, a sub-urban phase (with speeds up to 90 km/h) and a motorway phase (with speeds up to 140 km/h without stopping) were selected. All phases were selected in such a way that they were the initial parts of all three sections. This means that each of these stages is different: in the urban and sub-urban phases, there are sections where the vehicle comes to a complete stop, while in the motorway phase, there are no such stops.
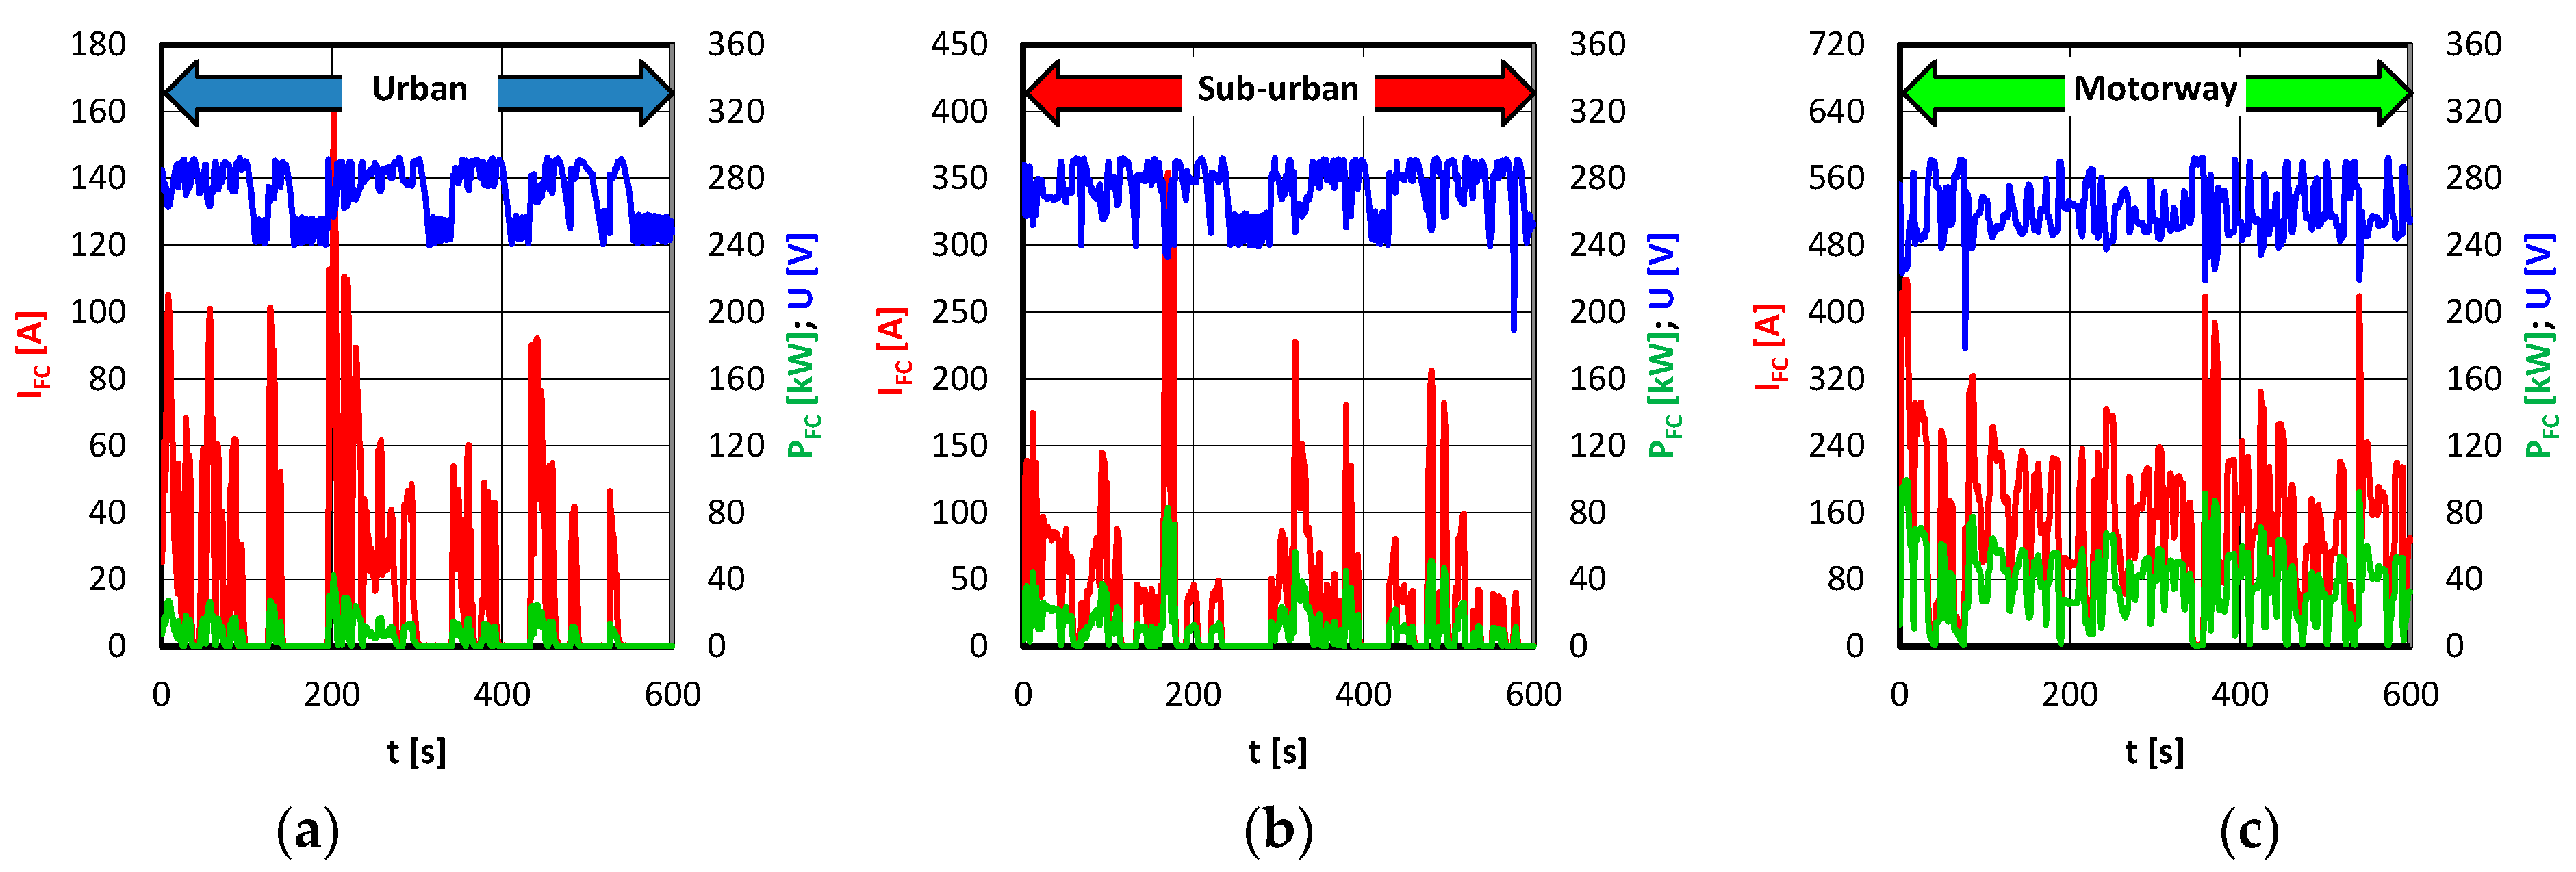
The selection of the individual phases allowed the further evaluation of the operating conditions of the fuel cell. Figure 6 provides the time characteristics of the fuel cell operating conditions. In urban driving conditions (Figure 6a), small values of the cell current intensity are observed. Only large peaks of this intensity occur when the driving speed is rapidly increased (which can be compared with the data in Figure 5). In sub-urban driving conditions (Figure 6b), the current values are approximately two times higher. Under motorway driving conditions (Figure 6c), high values for the fuel cell stack current are observed. As can be seen from the data in Figure 6, the cell voltage values range between 240 and 290 V and remain at a constant level of fluctuation regardless of the value of the power used. Individual voltage peaks (minimum values) may result from flushing the cell to limit the hydrogen supply [46]. This is due to the current–voltage characteristics, where the voltage changes are minor with large oscillations in the cell current (as will be shown later in this paper).
Detailed characteristics of the cell power under various driving conditions are shown in Figure 7. Under urban driving conditions, low fuel cell load values are obtained (Figure 7a). Power values do not exceed 45 kW. In addition, the IFC-PFC correlation is very high, exceeding 99%. Higher driving speeds result in higher loads (Figure 7b). These loads are twice as high, but the IFC→PFC correlation is still high at 99.6%. There are slightly lower minimum voltage values, which is related to cell flushing. Under motorway driving conditions, the power is already above 100 kW. The correlation is at the same level, but occasional voltage values fall below 180 V.
It should be noted that regardless of the vehicle’s driving conditions and load, the current–power characteristics of the fuel cell stack do not change (do not degrade). This indicates that the cell is in very good condition, which is reflected in the low mileage of the vehicle.
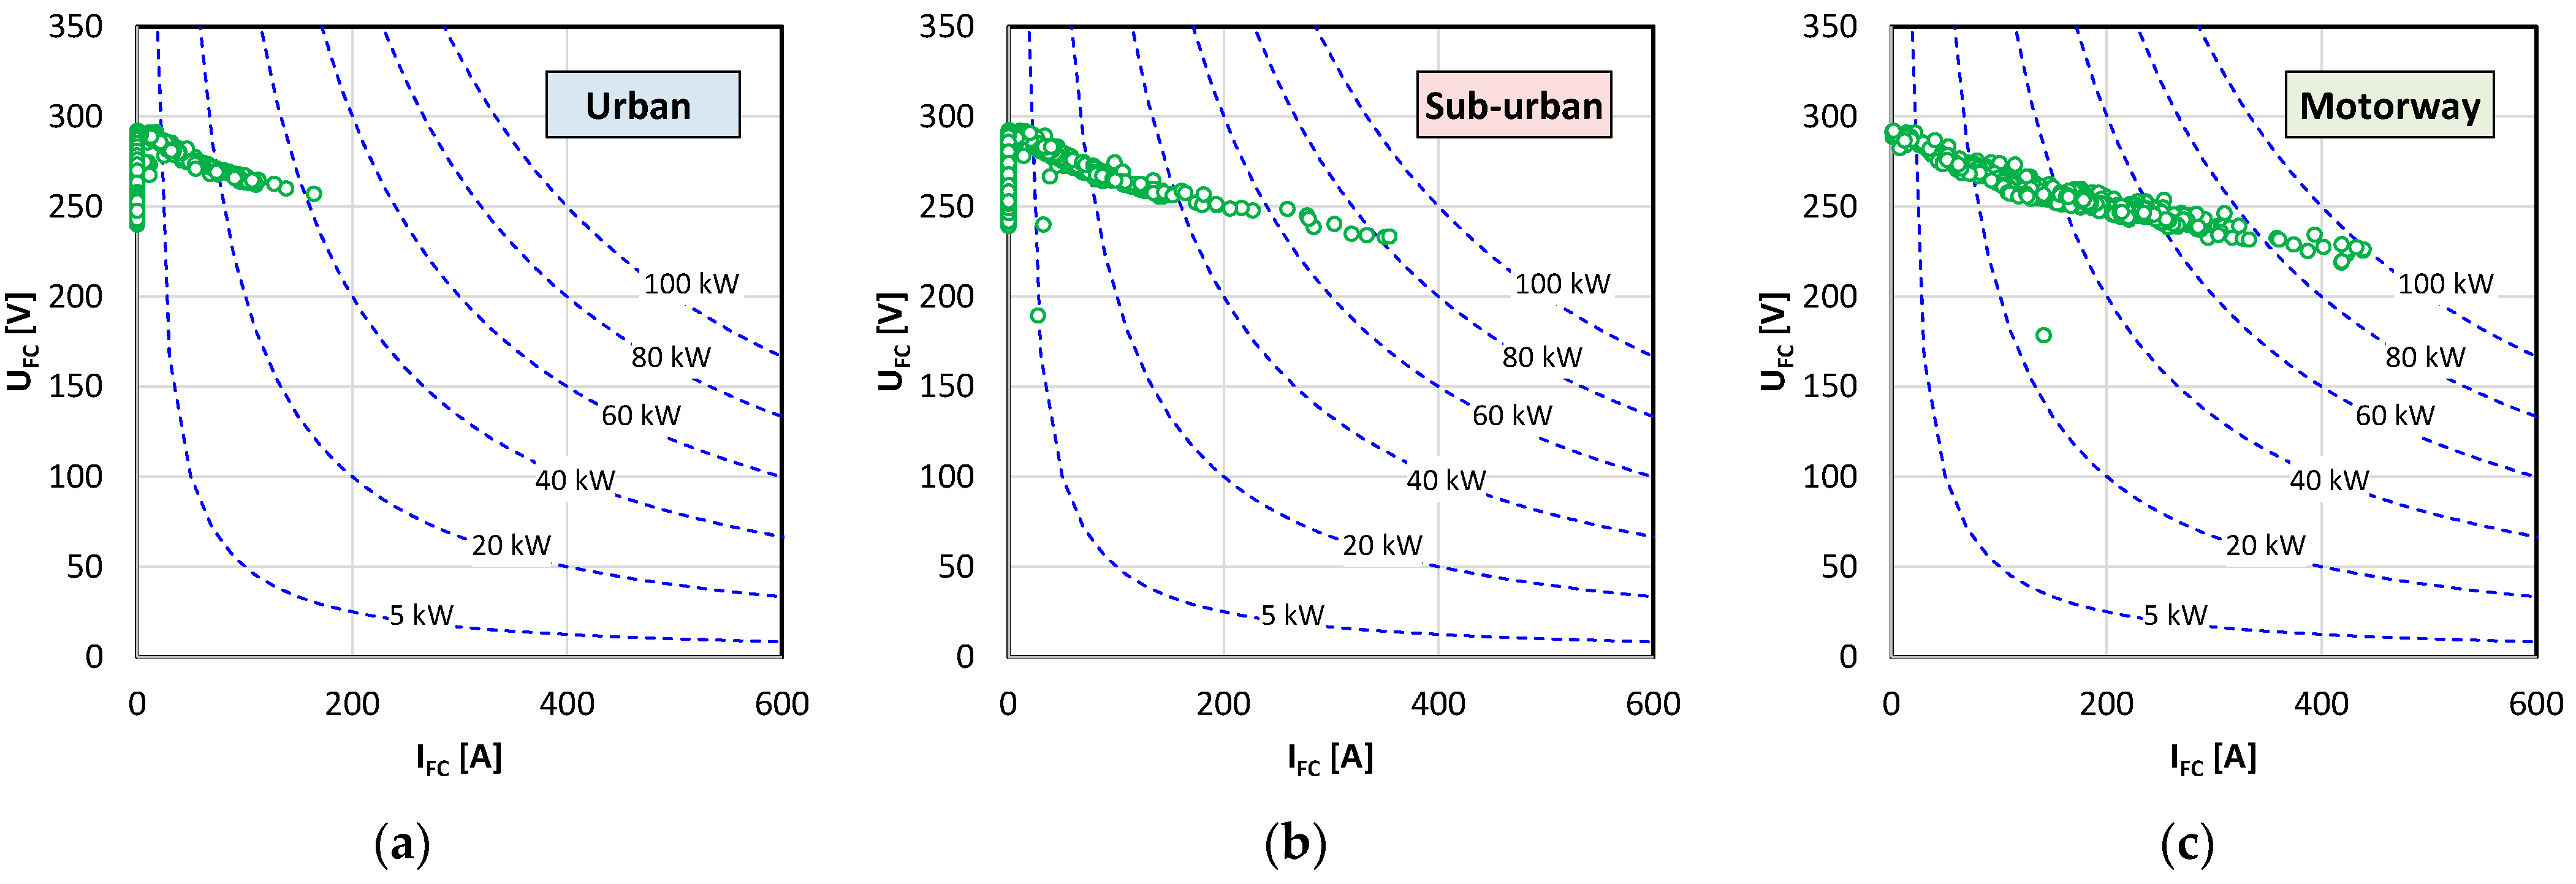
The current–voltage characteristics of the cell stack obtained from the road tests indicate specific current values depending on the traffic conditions (Figure 8). In urban traffic conditions (Figure 8a), a large share of power below 5 kW is observed. In this range, the cell is operating at an idle speed. In the sub-urban driving range (Figure 8b), the cell continues to be idle, but the power used is significantly higher. The range of 5–20 kW and 20–40 kW dominates in this case. This conclusion is a result of the density of the measurement data in these ranges. In the motorway driving range (Figure 8c), there is no cell idling and its high efficiency is utilised (not specified in these studies, but it is lowest when idling).
Assuming that the maximum cell voltage can be around 1 V (theoretically 2.27 V), the voltage should be around 330 V when there is no load. The value is below 300 V, which means that the activation losses (according to Figure 2) are approximately 10%. Subsequently, there are resistance losses. The lack of analysis of the maximum power of the system (due to the driving speeds obtained in the test) makes it impossible to determine the mass transport losses. These losses occur mainly in the range of the highest current values obtained from the fuel cell stack.
As mentioned earlier, the battery’s share in the drive system of the Toyota Mirai hydrogen vehicle is minor and does not exceed 20%. Similar results were obtained during the current research (Figure 9). In urban conditions (Figure 9a), battery power consumption reaches 10 kW and fuel cell power consumption reaches approximately 40 kW (Figure 8a). Power recovery is significantly higher, at 20 kW. In sub-urban conditions, the battery power consumption is 20 kW and fuel cell power consumption is approximately 80 kW. In motorway conditions, where the power of the cells is significantly higher, approximately 25 kW of the battery power is used.
As can be seen from the above analyses, the battery’s share is, on average, no more than 25% in all driving conditions. In sub-urban and motorway conditions, power recovery is approximately 40 kW. This is twice as much as in urban conditions. The analysis of the braking power data indicates significantly lower values of battery power used to support the fuel cell stack than the power recovered.
The correlation between temperature changes and pressure drops in the high-pressure tank is most evident at the beginning of the run (Figure 10). With relatively equal hydrogen temperatures in the tanks (start of the urban run—Figure 10a), pressure changes follow temperature changes. Stopping the vehicle results in no hydrogen consumption while increasing the hydrogen temperature in the tank. The greatest discrepancies are apparent during the non-urban run, where the vehicle brakes rapidly to a stop (Figure 10b). In the selected time interval, there is no correlation between the temperature and pressure of the fuel in the tank. At high speeds, no stops were made (Figure 10c) and an almost linear relationship between hydrogen temperature changes and pressure drops was obtained.
In urban conditions, the differences in the temperature recorded in the high-pressure tank are ±1 °C. In non-urban conditions, the differences are greater, at around ±2 °C. In highway conditions, the changes are greatest, reaching ±4 °C. The magnitude of the temperature changes is mainly due to hydrogen consumption in each phase of driving. However, these changes do not have a significant impact on cell scaling, as there is a three-stage pressure reduction (to several kPa) before the hydrogen is delivered to the injectors.

3.2. Fuel Cell Stack Scaling

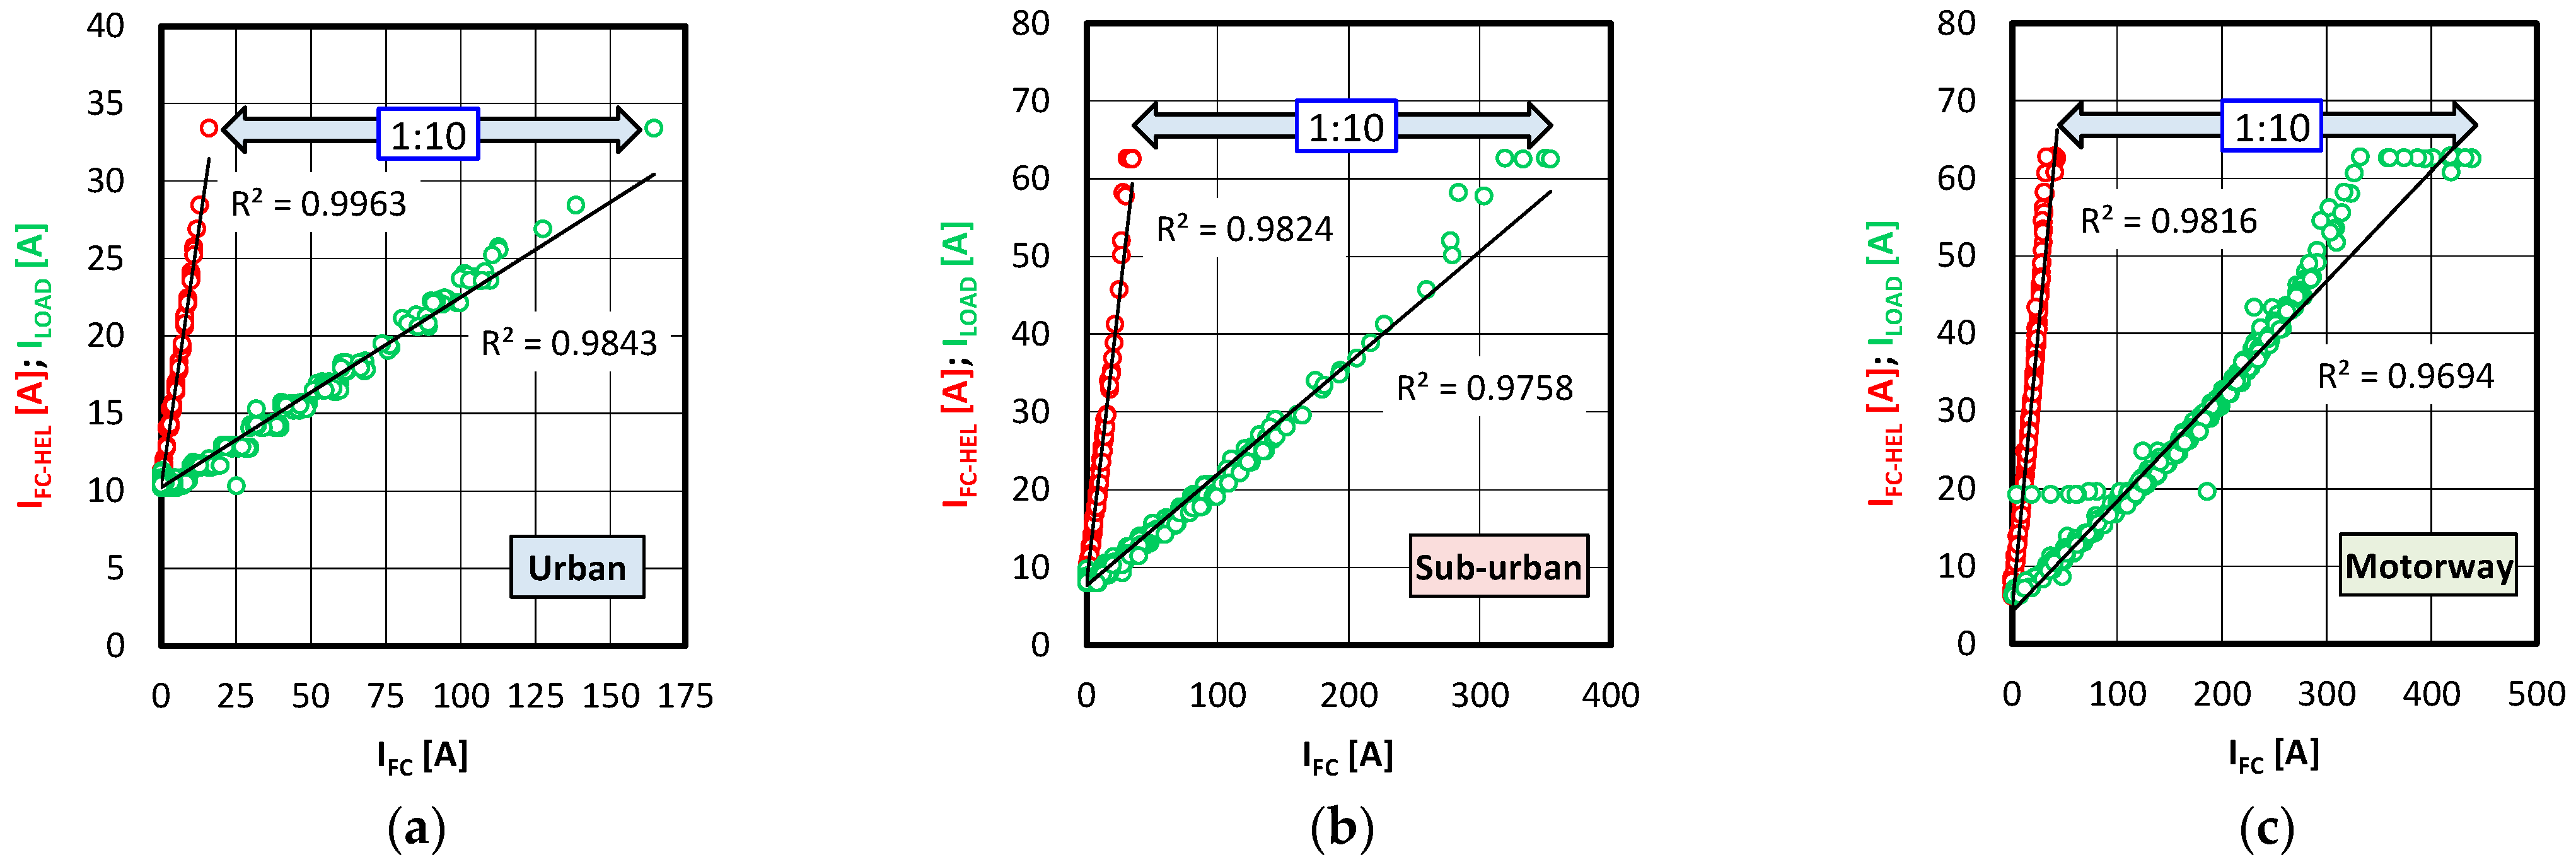
The scaling of the original route shown in Figure 6 consisted of scaling the current of the cell stack and scaling the power of the stack. As previously stated, the current and power values were scaled within specific driving speed ranges (each phase)—Figure 11. As can be seen in Figure 11, the vehicle cell current (IFC) was scaled to the HEL system load (ILOAD) value. Slightly different scaling values were obtained for each driving phase. During urban and sub-urban driving, the current values were approximately 80–100% higher. This means that the load (ILOAD) would also be proportionally higher. In motorway conditions (Figure 11c), the dynamics of change are much higher, but the current values are also higher.
Considering the difficulties in identifying the values in Figure 11, a comparative analysis of the Mirai cell stack current (IFC) values was completed in terms of scaling the values to ILOAD. Scaling to ILOAD allowed the IFC-HEL cell to be loaded. Due to the hybrid configuration of the HEL system (a cell with a battery connected in parallel), the load on the 1.2 kW fuel cell is the outcome. The lead-acid battery used was operated in a discharged state in order to obtain fairly high cell current values. At the same time, as part of the scaling, attempts were made to avoid conditions in which the battery itself would only respond to changes in the programmable load.
The analysis of cell scaling to the HEL load value and then to the consequent HEL cell current is presented in Figure 12. As mentioned earlier, due to the minimum battery charge values (with a capacity of 18 Ah), the cell current did not fall below 10 A in any scaling phase.
Comparing the scaling of the cell current from the load current, it can be concluded that the coefficient of determination is highest during the urban phase (R2 = 0.9843—Figure 12a). As the cell current increases, the R2 index decreases slightly. This is mainly due to the increasing dynamics of cell current changes and its more difficult translation into the HEL system load. In the sub-urban phase, the R2 index is slightly lower than in the urban phase, and lowest in the motorway phase.
The assessment of the conversion of the HEL load to the HEL cell current indicates that the R2 fit values are even higher than in the previous scaling. Here, approximately 1% higher values are observed. The best fit is for the urban phase, with R2 = 99.63%.
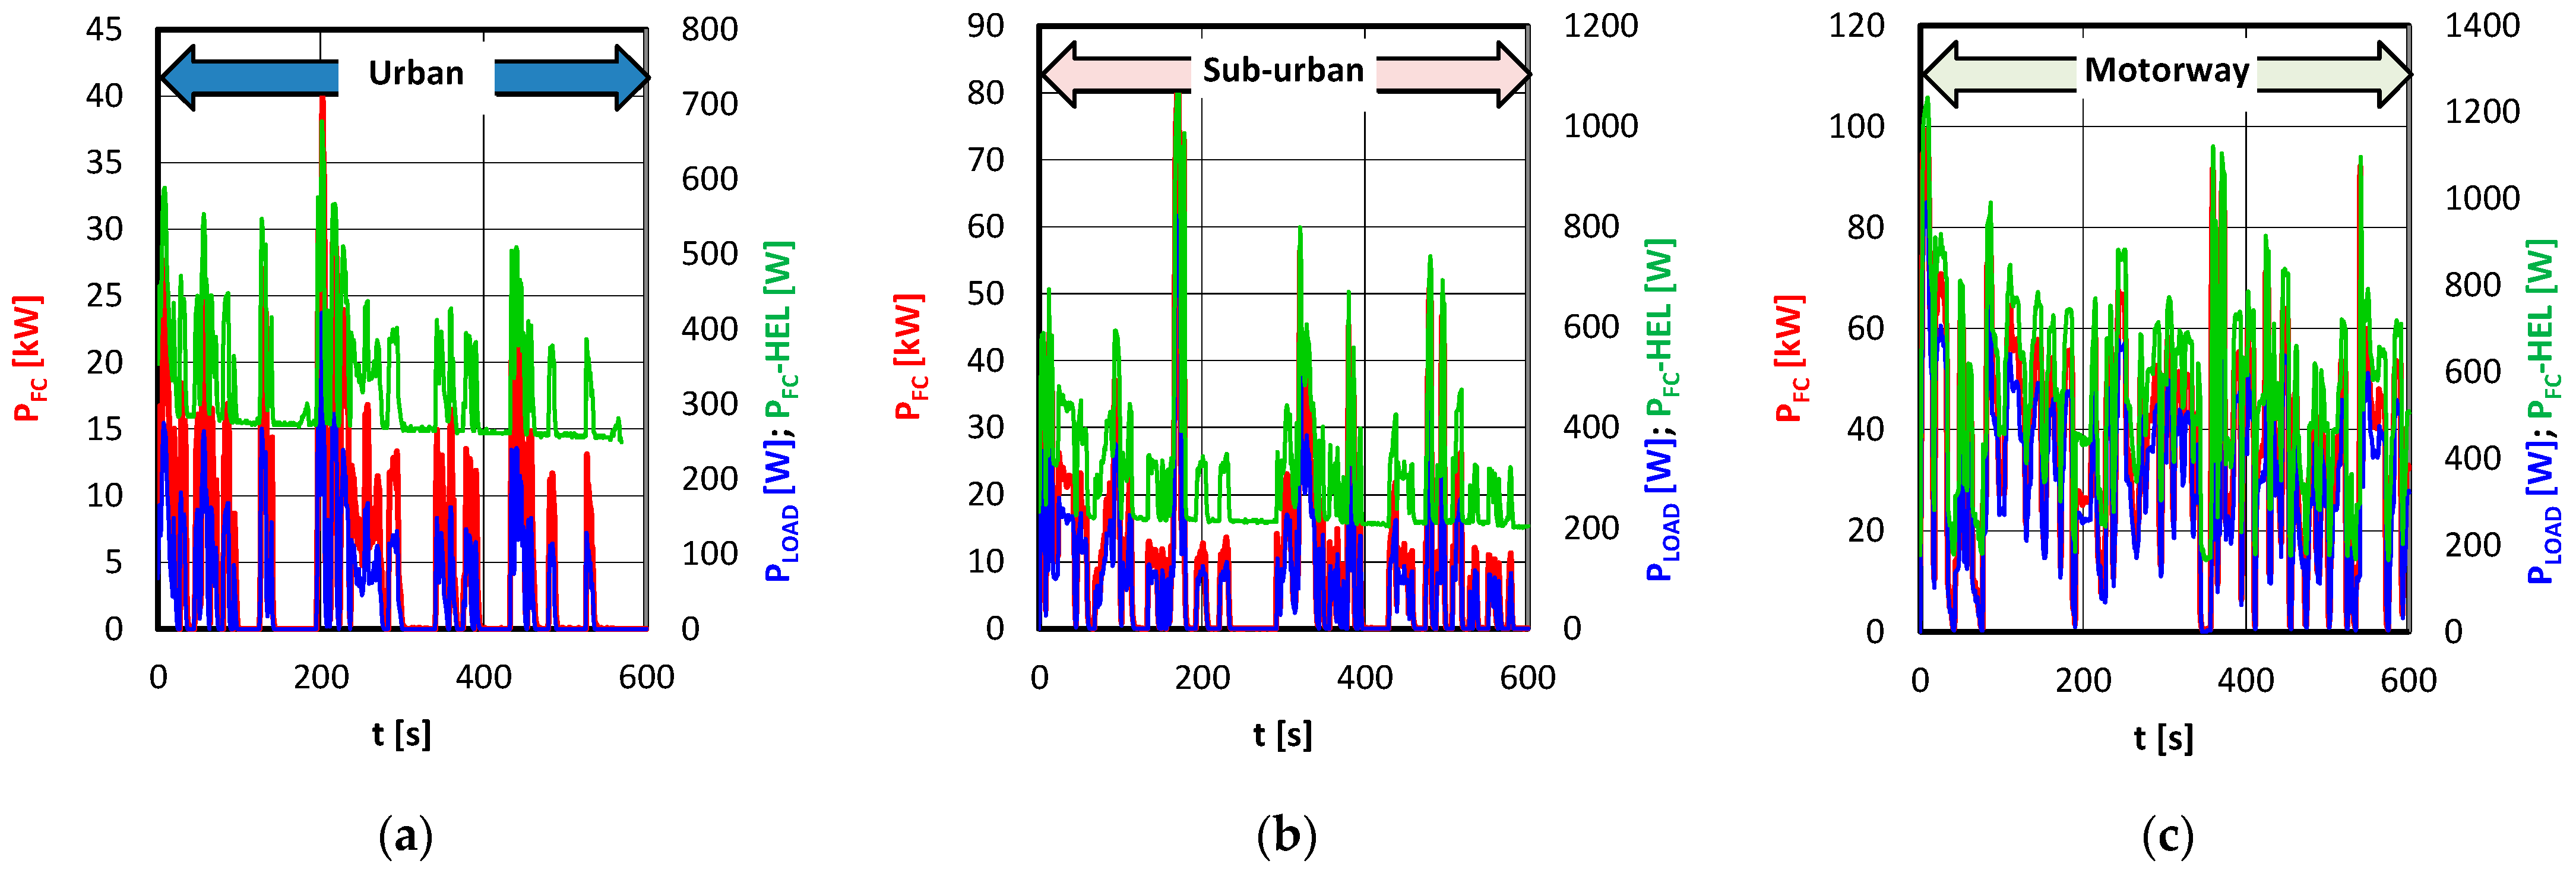
In the further part of the research, a similar scaling was performed, but in terms of the fuel cell power. Based on the power of Toyota Mirai cells obtained during the road test, a comparison was made under various operating conditions (Figure 13). In urban conditions, the cell power used was the lowest (up to 15 kW, peak up to 25 kW—Figure 13a), while in suburban conditions, it was slightly higher, up to 20 kW. In motorway conditions, the fuel cell power used was the highest, sometimes exceeding 60 kW (with a slightly higher peak). It should be noted that this is only half of the manufacturer’s declared power.
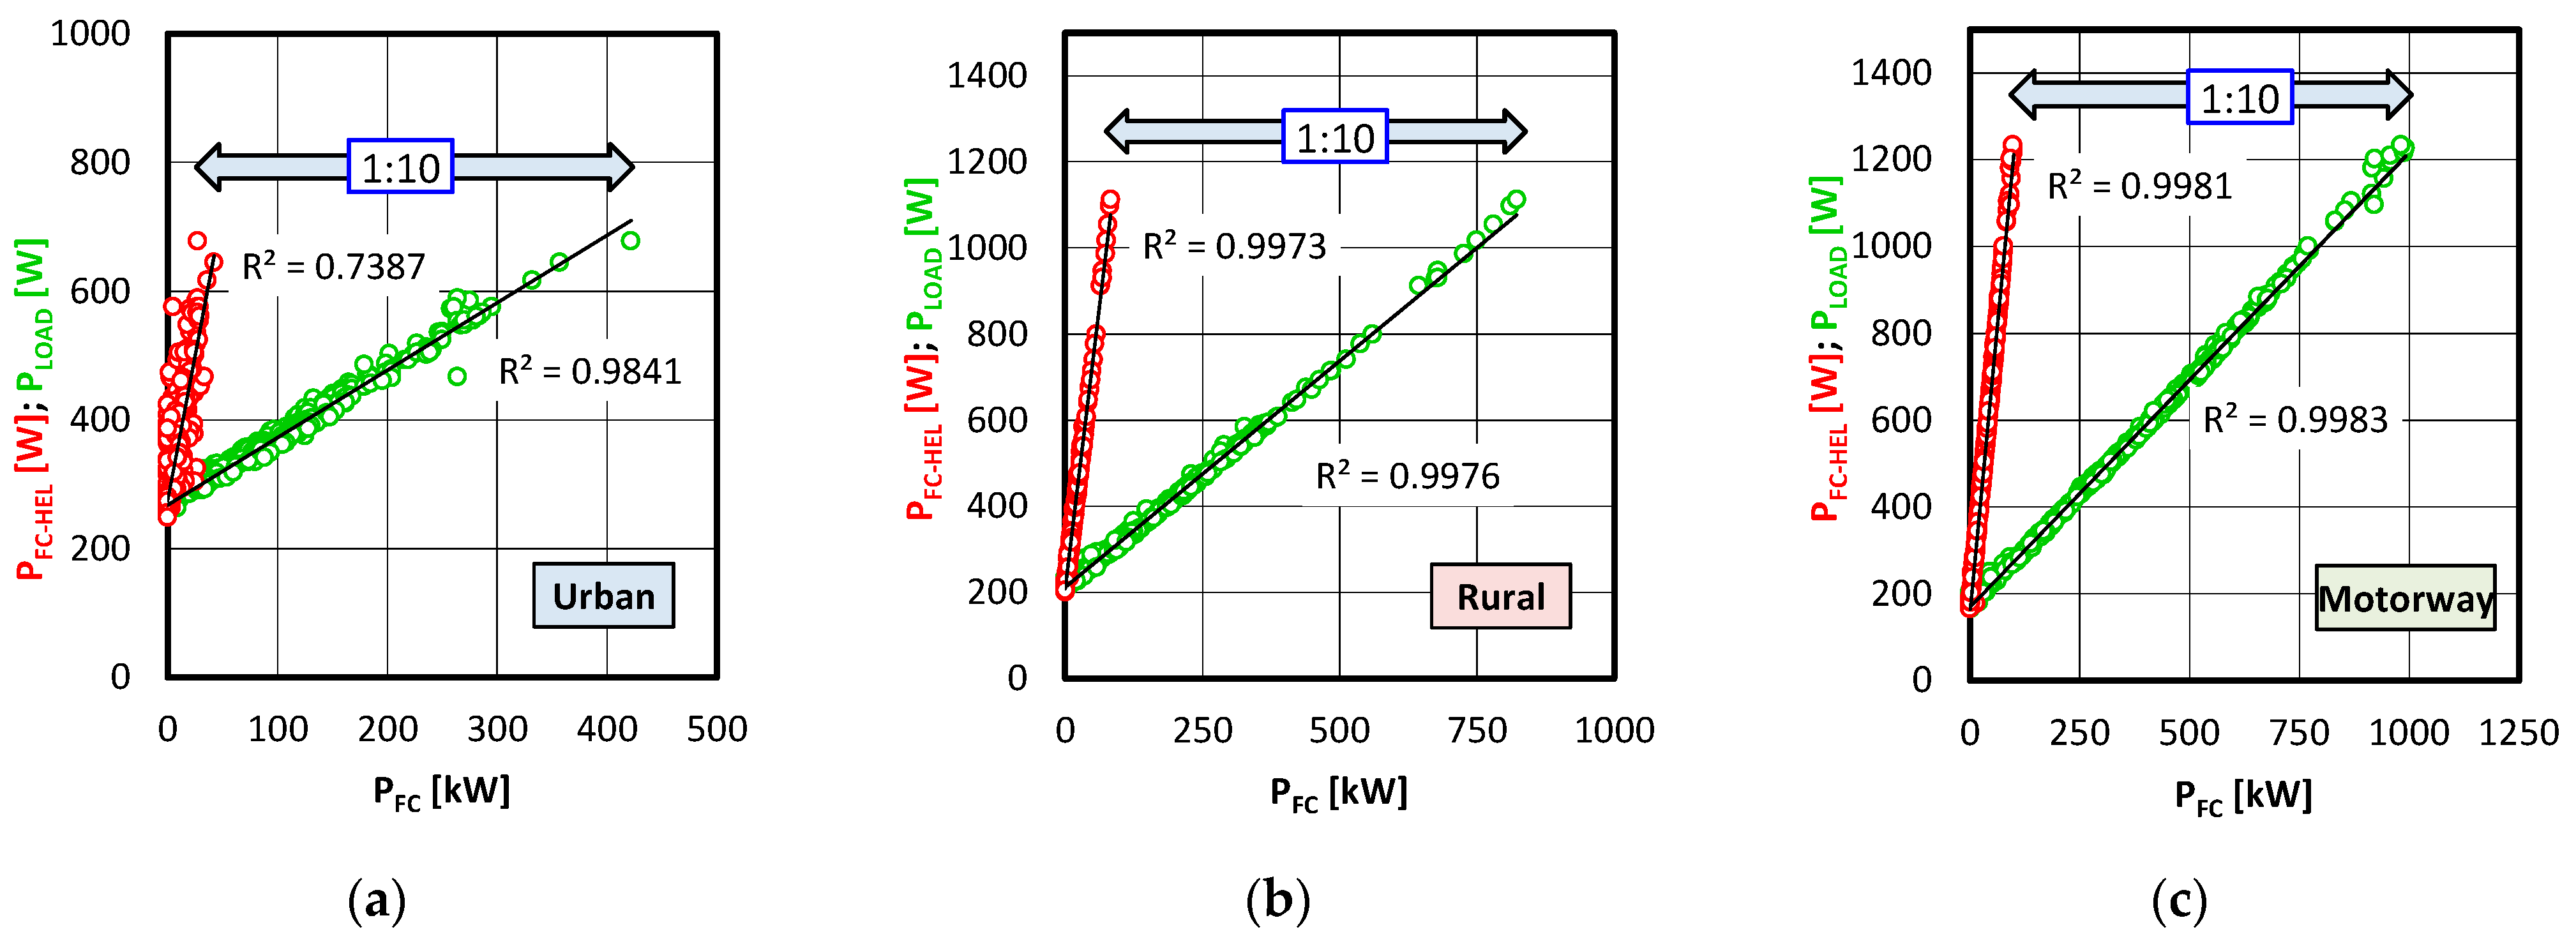
The fuel cell power was scaled to the load power (as before) and the result was compared to the HEL fuel cell power.
The steps mentioned earlier are presented in Figure 14. The representation of cell power in urban conditions (Figure 14a) is the same as the representation of the cell current (as indicated by identical R2 determination coefficient values of 98.4%). In sub-urban driving conditions (Figure 14b), the fit of the cell power to the load power is better than the fit of the current (R2 is 99.7% vs 97.6%). In motorway driving conditions, the adjustment value is highest (R2 = 99.8%). As can be seen from the above analyses, as the driving speed and cell load increase, the power fit values improve.
Similar results were obtained by scaling the PLOAD load power to the PFC-HEL cell power. The coefficient of determination is very low in urban conditions (R2 = 74%), but increases significantly in sub-urban and motorway conditions. This is due to the lower dynamics of cell power changes, as its operating conditions ‘reflect’ typical rather than aggressive vehicle speeds.
By scaling the current and cell power and conducting appropriate tests, it was possible to plot the characteristics of both cell types based on the original Toyota Mirai cells.

4. Discussion

Before proceeding with the assessment of fuel cell scalability, the voltage–current characteristics of individual fuel cells should be plotted.
The data in Table 1 indicate that there are 330 fuel cells in the stack installed in the vehicle. It is much more difficult to determine the active surface area for the hydrogen ion flow, which is used to determine the previously mentioned characteristics. There are no confirmed data on the surface area of the fuel cells in the second-generation Toyota Mirai. Nevertheless, publications indicate that the first-generation Mirai has a single-cell surface area of 237 cm2 [47,48]. Considering that the cell power ratio is
z 1 = P F C I I   g e n . P F C I   g e n . = 128   k W 114   k W = 112 %
then, with the same number of cells, we should assume a 12% larger proton exchange area second-generation model compared to the first-generation.
If the number of cells (in the second-generation Toyota Mirai) is smaller by a ratio of:
z 2 = n F C I   g e n . n F C I I   g e n . = 370 330 = 112 %
it can be assumed that the ion exchange surface area can also be increased proportionally by 12%.
On this basis, it was determined (using the scaling method) that:
A s i n g l e   F C = 237   c m 2   · 112 % · 112 % = 297   c m 2
The calculations indicate that it is possible to estimate the surface area of the second-generation Toyota Mirai fuel cell at 297 cm2. The calculated (estimated) size of the active surface of the Toyota Mirai II fuel cell is used to determine the unit current of the cell. The voltage–current characteristic itself does not depend on this result. Due to the fact that the active surface area of the two cells differs significantly, the characteristics presented below do not have a major impact on cell scaling. The assessment of the Toyota cell surface area is mainly used to indicate changes in the cell design and does not have a major impact on the subsequent analysis results.
In addition, the operating conditions of the HEL cell also determine the number of such cells: there are 36 of them (Table 2). The older version of the system contained 47 cells [41,49], where sources reported an active area of 120 cm2 [50] or 110 cm2 [51].
On the basis of the estimated active surface areas of the fuel cell, the voltage values of a single cell and the current values of a single cell were determined.
The results of scaling the voltage–current characteristics to single-cell conditions are shown in Figure 15 (for current scaling conditions—Figure 15a—and for cell power scaling conditions—Figure 15b). Although the voltage–current characteristics are shown in both figures, they result from scaling the current intensity and scaling the fuel cell power, respectively (as analysed in earlier sections of this paper).
Current scaling results in completely different characteristics, despite being correct (Figure 15a). This difference is mainly due to the type of fuel cells used for scaling. Both systems are different and have different purposes. As the data analysis shows, although the areas are different and the results are related to the relative area, the differences in the rate of the voltage drop are still significant. The minimum voltage value for UHEL is 0.5 V, while for UFC-Mirai¬, it is at 0.68 V. The ratio of the relative current values obtained is as high as three. This means that when scaling cells, their unit size and type of construction must be taken into account.
Similar observations were made during fuel cell power scaling. Their voltage–current characteristics do not differ from the previous ones. The same data were obtained again, which indicates the arbitrary possibility of a scalable comparison of the current or cell power (Figure 15b).
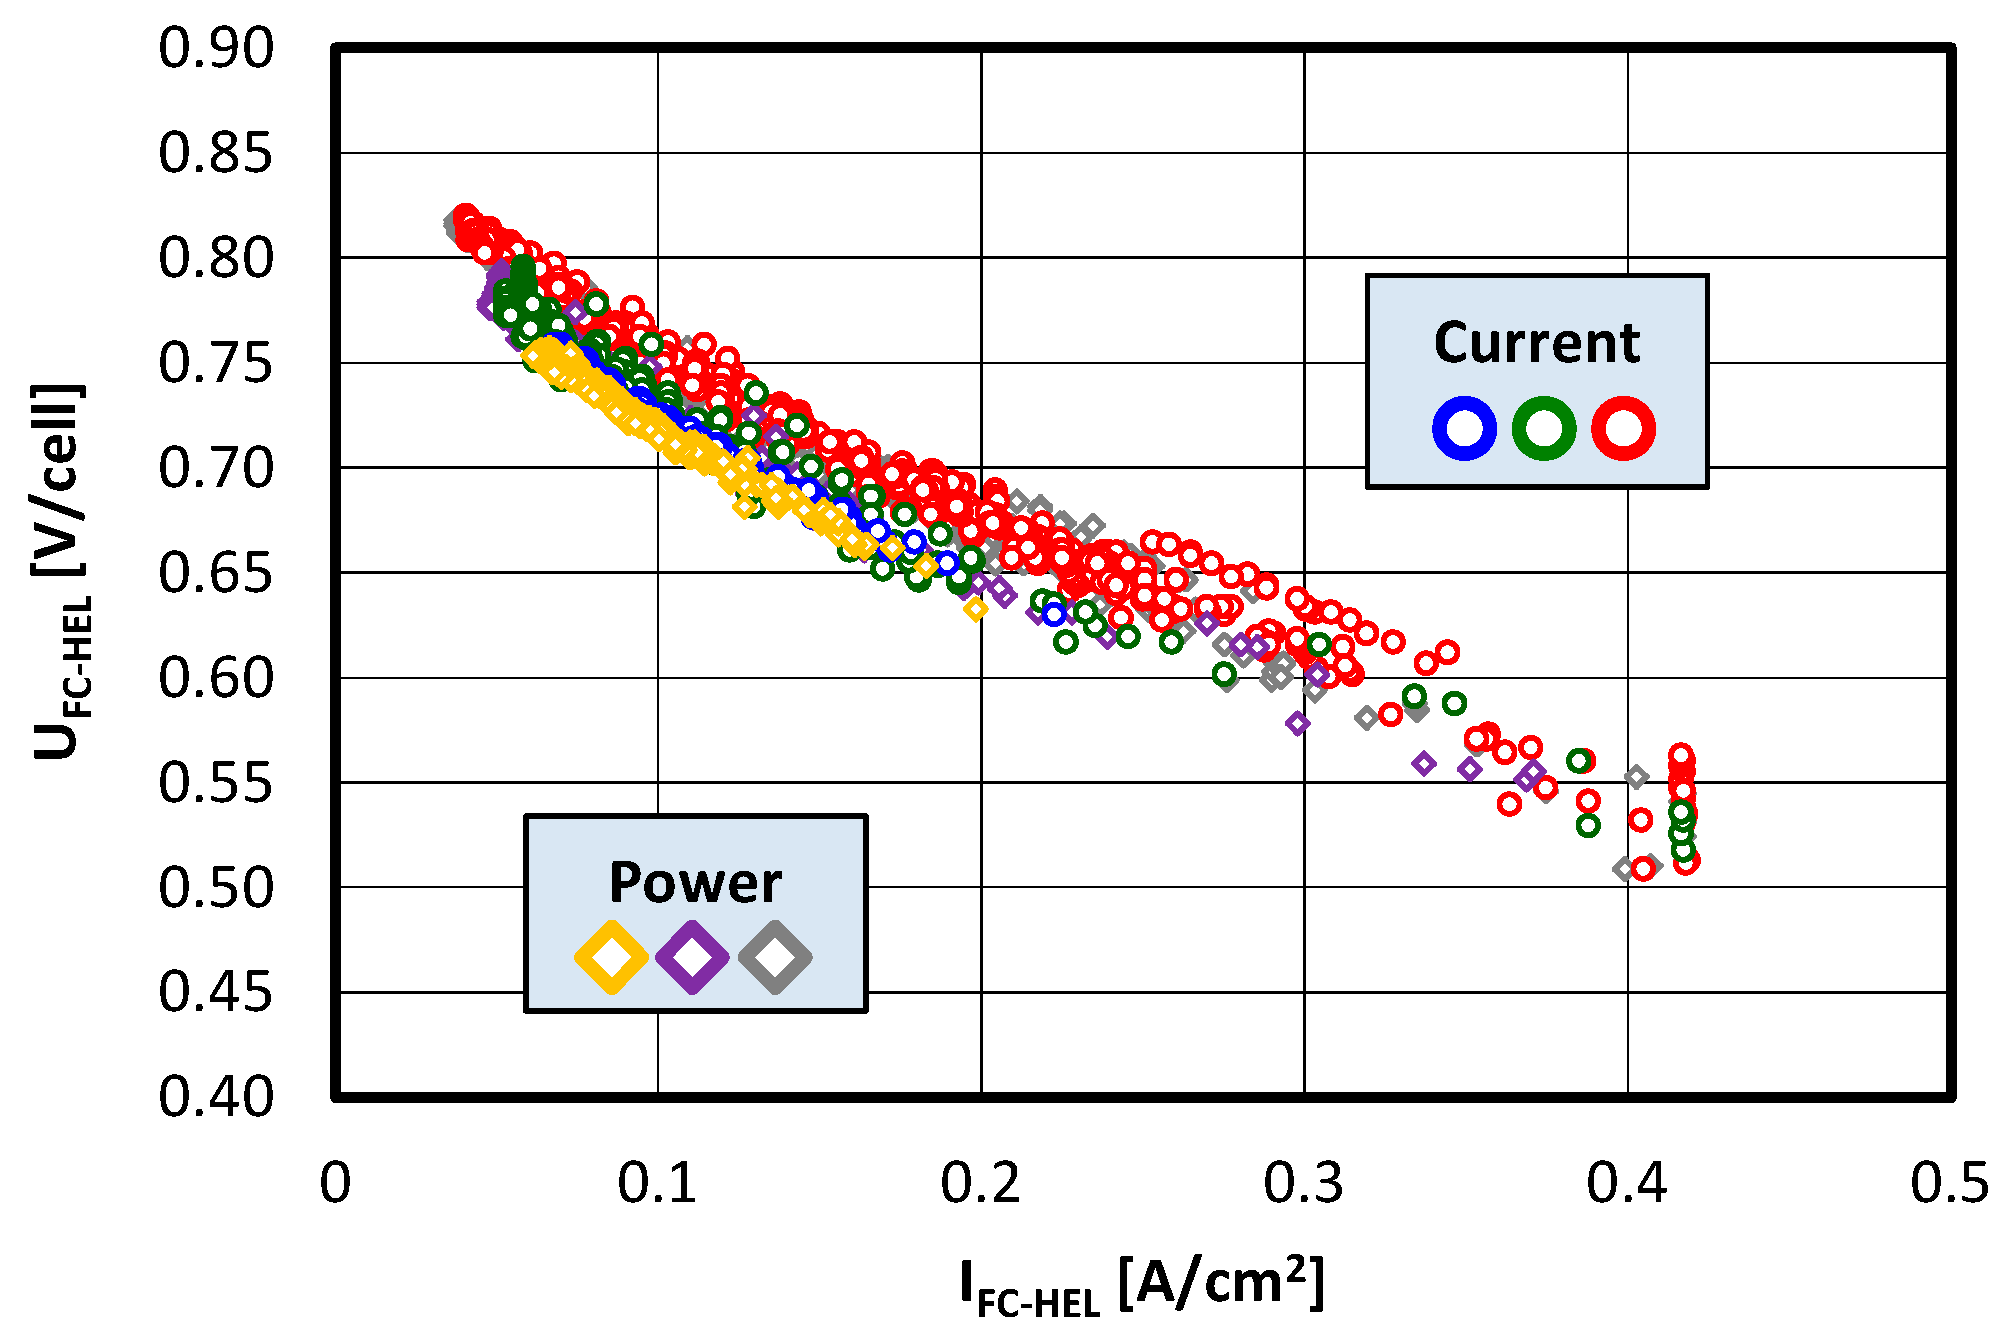
When analysing only the voltage–current characteristics of a small 1.2 kW cell, it should be noted that the activation voltage is 0.82 V (Figure 16). The same parameter for the Toyota cell is 0.9 V (Figure 15). This means that the difference in the design of these cells is significant. Activation losses are very high in a 1.2 kW cell. In addition, the results shown in Figure 16 indicate higher voltage values when scaling the current than the cell power. These differences are not very large, but they are characteristic of each phase of the driving simulation.

5. Conclusions

This study evaluated the characteristics of fuel cells before and after scaling. A 128 kW cell was compared with a 1.2 kW cell. This comparison concerned the scaling of a high-power cell in order to map its operation by a 1.2 kW cell.
A reasonable reference point for cell scaling can be the voltage–current characteristic. However, this also depends on the size of the active surface of the cell. The important factor here is the voltage change rate of the cell, not the full range of the current changes. In dynamic analyses, the power level is irrelevant, as the characteristics cover a specific pattern of changes.
Based on the research hypothesis, it was concluded that it is possible to scale fuel cells “downwards”. This means that it is possible to scale and evaluate the characteristics of cells: cell stacks and small fuel cell modules. The different current–voltage characteristics result from the active surface area of the fuel cell.
The following general conclusions were reached:
  • In order to compare the characteristics of fuel cells, it is necessary to know the number and ion exchange surface area of such cells in order to evaluate the unit voltage and current of the cell rather than the stack. It is possible to compare cells by presenting the general characteristics of the stacks, but these characteristics are not reliable.
  • It is possible to scale fuel cells to laboratory conditions (single cell) while maintaining appropriate conditions (a static test or driving test) or to road conditions, as presented in this study.
  • Scaling the current or power of the cell means that the characteristics obtained do not differ from each other. It follows that there is a high degree of independence in the choice of the scaled quantity in order to determine the similarity of the scale.
  • Despite certain changes in temperature (Figure 10) during each phase of driving, this does not have a significant impact on cell scaling; this is mainly due to the fact that a hydrogen injection occurs after a three-stage pressure reduction, which significantly stabilises the temperature of the hydrogen.
The results presented above indicate that fuel cell scaling does not necessarily have to concern only voltage–current characteristics, but can also take into account scaling in terms of the cell efficiency. It seems that the dynamic scaling of fuel cells can be used to analyse their efficiency in typical transport applications, both in passenger cars and trucks (for which fuel cell stacks will have higher power, but also less dynamic changes in operation).

Author Contributions

Conceptualisation, I.P. and P.P.; methodology, I.P. and P.P.; software, I.P. and P.P.; validation, I.P. and P.P.; formal analysis, I.P. and P.P.; investigation, I.P. and P.P.; resources, I.P. and P.P.; data curation, I.P. and P.P.; writing—original draft preparation, I.P. and P.P.; writing—review and editing, P.P.; visualisation, I.P. and P.P.; supervision, I.P. and P.P.; project administration, I.P. and P.P.; funding acquisition, I.P. and P.P.; All authors have read and agreed to the published version of the manuscript.

Funding

This research received no external funding.

Data Availability Statement

The original contributions presented in this study are included in this article. Further inquiries can be directed to the corresponding author(s).

Conflicts of Interest

The authors declare no conflicts of interest.

Abbreviations

ACalternating current
AFCAlkaline Fuel Cell
CO2carbon dioxide
DCdirect current
DMFCDirect Methanol Fuel Cell
FCfuel cell
FCEVfuel cell electric vehicle
FCHEVfuel cell hybrid electric vehicle
H2hydrogen
HDVheavy-duty vehicles
HELHybrid Energy Lab
Icurrent
LDVlight-duty vehicles
Li-Ionlithium-ion
MCFCMolten Carbonate Fuel Cell
Ppower
PAFCPhosphoric Acid Fuel Cell
PCpassenger cars
PEMProton Exchange Membrane
RDE Real Driving Emissions
SOFCsolid oxide fuel cell
ttime
Uvoltage

References

  1. Von Tettau, P.; Sterlepper, S.; Mauermann, P.; Wick, M.; Tinz, S.; Jesser, M.; Walters, M.; Pischinger, S. Laboratory Assessments Applied to Mass-Produced Automotive Fuel Cells. Int. J. Hydrogen Energy 2024, 52, 1127–1136. [Google Scholar] [CrossRef]
  2. McKinsey & Company. Hydrogen Scaling Up. A Sustainable Pathway for the Global Energy Transition; McKinsey & Company: New York, NY, USA, 2017. [Google Scholar]
  3. McKinsey & Company. Hydrogen: Closing the Cost Gap Unlocking Demand for Clean Hydrogen by 2030; McKinsey & Company: New York, NY, USA, 2025. [Google Scholar]
  4. Ding, D.; Wu, X.-Y. Hydrogen Fuel Cell Electric Trains: Technologies, Current Status, and Future. Appl. Energy Combust. Sci. 2024, 17, 100255. [Google Scholar] [CrossRef]
  5. Böhm, M.; Fernández Del Rey, A.; Pagenkopf, J.; Varela, M.; Herwartz-Polster, S.; Nieto Calderón, B. Review and Comparison of Worldwide Hydrogen Activities in the Rail Sector with Special Focus on On-Board Storage and Refueling Technologies. Int. J. Hydrogen Energy 2022, 47, 38003–38017. [Google Scholar] [CrossRef]
  6. Rees, N.V.; Compton, R.G. Carbon-Free Energy: A Review of Ammonia- and Hydrazine-Based Electrochemical Fuel Cells. Energy Environ. Sci. 2011, 4, 1255. [Google Scholar] [CrossRef]
  7. Luo, Y.; Wu, Y.; Li, B.; Mo, T.; Li, Y.; Feng, S.-P.; Qu, J.; Chu, P.K. Development and Application of Fuel Cells in the Automobile Industry. J. Energy Storage 2021, 42, 103124. [Google Scholar] [CrossRef]
  8. Das, H.S.; Tan, C.W.; Yatim, A.H.M. Fuel Cell Hybrid Electric Vehicles: A Review on Power Conditioning Units and Topologies. Renew. Sustain. Energy Rev. 2017, 76, 268–291. [Google Scholar] [CrossRef]
  9. Chen, Q.; Zhang, G.; Zhang, X.; Sun, C.; Jiao, K.; Wang, Y. Thermal Management of Polymer Electrolyte Membrane Fuel Cells: A Review of Cooling Methods, Material Properties, and Durability. Appl. Energy 2021, 286, 116496. [Google Scholar] [CrossRef]
  10. Zhang, G.; Kandlikar, S.G. A Critical Review of Cooling Techniques in Proton Exchange Membrane Fuel Cell Stacks. Int. J. Hydrogen Energy 2012, 37, 2412–2429. [Google Scholar] [CrossRef]
  11. Wang, Y.; Ruiz Diaz, D.F.; Chen, K.S.; Wang, Z.; Adroher, X.C. Materials, Technological Status, and Fundamentals of PEM Fuel Cells—A Review. Mater. Today 2020, 32, 178–203. [Google Scholar] [CrossRef]
  12. Wallington, T.J.; Woody, M.; Lewis, G.M.; Keoleian, G.A.; Adler, E.J.; Martins, J.R.R.A.; Collette, M.D. Hydrogen as a Sustainable Transportation Fuel. Renew. Sustain. Energy Rev. 2025, 217, 115725. [Google Scholar] [CrossRef]
  13. Manzo, D.; Thai, R.; Le, H.T.; Venayagamoorthy, G.K. Fuel Cell Technology Review: Types, Economy, Applications, and Vehicle-to-Grid Scheme. Sustain. Energy Technol. Assess. 2025, 75, 104229. [Google Scholar] [CrossRef]
  14. Legala, A.; Kubesh, M.; Chundru, V.R.; Conway, G.; Li, X. Machine Learning Modeling for Fuel Cell-Battery Hybrid Power System Dynamics in a Toyota Mirai 2 Vehicle under Various Drive Cycles. Energy AI 2024, 17, 100415. [Google Scholar] [CrossRef]
  15. Matsunaga, M.; Fukushima, T.; Ojima, K. Powertrain System of Honda FCX Clarity Fuel Cell Vehicle. World Electr. Veh. J. 2009, 3, 820–829. [Google Scholar] [CrossRef]
  16. Sery, J.; Leduc, P. Fuel Cell Behavior and Energy Balance on Board a Hyundai Nexo. Int. J. Engine Res. 2022, 23, 709–720. [Google Scholar] [CrossRef]
  17. Wang, Y.; Yuan, H.; Martinez, A.; Hong, P.; Xu, H.; Bockmiller, F.R. Polymer Electrolyte Membrane Fuel Cell and Hydrogen Station Networks for Automobiles: Status, Technology, and Perspectives. Adv. Appl. Energy 2021, 2, 100011. [Google Scholar] [CrossRef]
  18. Di Pierro, G.; Bitsanis, E.; Tansini, A.; Bonato, C.; Martini, G.; Fontaras, G. Fuel Cell Electric Vehicle Characterisation under Laboratory and In--use Operation. Energy Rep. 2024, 11, 611–623. [Google Scholar] [CrossRef]
  19. Ballard Power Systems. Fuel Cell Power for Heavy Duty Applications. FCmove-XD; Ballard Power Systems: Burnaby, BC, Canada, 2025. [Google Scholar]
  20. Dolan, C.; Gangi, J.; Homann, Q.; Fink, V.; Kopasz, J. 2019 Fuel Cell Technologies Market Report; U.S. Department of Energy; Argonne National Laboratory: Lemont, IL, USA, 2020.
  21. Toyota. JR East, Hitachi and Toyota to Develop Hybrid (Fuel Cell) Railway Vehicles Powered by Hydrogen; Toyota Motor Corporation: Toyota City, Japan, 2020. [Google Scholar]
  22. Wurzenberger, J.C.; Rašić, D.; Tavcar, G.; Glatz, T.; Mele, I.; Katrasnik, T. FCEV Performance Assessment—Electrochemical Fuel Cell and Battery Modelling on Vehicle Level; SAE International: Warrendale, PA, USA, 2020; 2020–01–0857. [Google Scholar]
  23. Bagherabadi, K.; Skjong, S.; Pedersen, E. Dynamic Modelling of PEM Fuel Cell System for Simulation and Sizing of Marine Power Systems. Int. J. Hydrogen Energy 2022, 47, 17699–17712. [Google Scholar] [CrossRef]
  24. Zhang, G.; Wu, L.; Qin, Z.; Wu, J.; Xi, F.; Mou, G.; Wang, Y.; Jiao, K. A Comprehensive Three-Dimensional Model Coupling Channel Multi-Phase Flow and Electrochemical Reactions in Proton Exchange Membrane Fuel Cell. Adv. Appl. Energy 2021, 2, 100033. [Google Scholar] [CrossRef]
  25. Liu, Y.; Dirkes, S.; Kohrn, M.; Wick, M.; Pischinger, S. A High-Fidelity Real-Time Capable Dynamic Discretized Model of Proton Exchange Membrane Fuel Cells for the Development of Control Strategies. J. Power Sources 2022, 537, 231394. [Google Scholar] [CrossRef]
  26. Bressel, M.; Hilairet, M.; Hissel, D.; Ould Bouamama, B. Model-Based Aging Tolerant Control with Power Loss Prediction of Proton Exchange Membrane Fuel Cell. Int. J. Hydrogen Energy 2020, 45, 11242–11254. [Google Scholar] [CrossRef]
  27. Barbir, F. Fuel Cell Electrochemistry. In PEM Fuel Cells; Elsevier: Cambridge, MA, USA, 2005; pp. 33–72. [Google Scholar] [CrossRef]
  28. Zhang, G.; Yuan, H.; Wang, Y.; Jiao, K. Three-Dimensional Simulation of a New Cooling Strategy for Proton Exchange Membrane Fuel Cell Stack Using a Non-Isothermal Multiphase Model. Appl. Energy 2019, 255, 113865. [Google Scholar] [CrossRef]
  29. Yoshizumi, T.; Kubo, H.; Okumura, M. Development of High-Performance FC Stack for the New MIRAI; SAE International: Warrendale, PA, USA, 2021; 2021–01–0740. [Google Scholar]
  30. Jiao, K.; Xuan, J.; Du, Q.; Bao, Z.; Xie, B.; Wang, B.; Zhao, Y.; Fan, L.; Wang, H.; Hou, Z.; et al. Designing the Next Generation of Proton-Exchange Membrane Fuel Cells. Nature 2021, 595, 361–369. [Google Scholar] [CrossRef]
  31. Chen, X.; Zhang, Y.; Xu, S.; Dong, F. Bibliometric Analysis for Research Trends and Hotspots in Heat and Mass Transfer and Its Management of Proton Exchange Membrane Fuel Cells. Appl. Energy 2023, 333, 120611. [Google Scholar] [CrossRef]
  32. Philip, N.; Ghosh, P.C. Optimal Sizing of Electrical and Thermal Energy Storage Systems for Application in Fuel Cell Based Electric Vehicles. J. Energy Storage 2024, 83, 110753. [Google Scholar] [CrossRef]
  33. Leelasupakorn, H.; Kaewchada, A.; Traisantikul, W.; Tiengtrakarnsuk, W.; Limtrakul, S.; Vatanatham, T. Scaleup Effect on Performance of Proton Exchange Membrane Fuel Cell. Chiang Mai J. Sci. 2008, 35, 89–94. [Google Scholar]
  34. Huang, L.; Ouyang, Q.; Chen, J.; Liu, Z.; Wu, X. A Scalable Segmented-Based PEM Fuel Cell Hybrid Power System Model and Its Simulation Applications. Energies 2023, 16, 6224. [Google Scholar] [CrossRef]
  35. Zheng, P.; Xie, X.; Zhang, C.; Cai, S.; Pan, J.; Zhang, H.; Yan, M.; Mu, Q. Techno-Economic Assessment Framework for 2.5 MW-Scale Grid-Connected Proton Exchange Membrane Fuel Cell Power Systems: A Case Study in China. Int. J. Hydrogen Energy 2025, 167, 150942. [Google Scholar] [CrossRef]
  36. Pérez-Trujillo, J.P.; Elizalde-Blancas, F.; Della Pietra, M.; Silva-Mosqueda, D.M.; García Guendulain, J.M.; McPhail, S.J. Thermoeconomic Comparison of a Molten Carbonate Fuel Cell and a Solid Oxide Fuel Cell System Coupled with a Micro Gas Turbine as Hybrid Plants. Energy Convers. Manag. 2023, 276, 116533. [Google Scholar] [CrossRef]
  37. Luo, L.; Guo, Z.; Cao, H.; Zhang, J.; Wang, H.; Lu, S.; Xiang, Y. Effect of Coolant Flow Field Heat Network Structure on Specific Power and Consistency of the kW-Scale High-Temperature Polymer Electrolyte Membrane Fuel Cells Stack. Int. J. Hydrogen Energy 2025, 166, 150971. [Google Scholar] [CrossRef]
  38. Pielecha, I.; Szałek, A.; Tchorek, G. Two Generations of Hydrogen Powertrain—An Analysis of the Operational Indicators in Real Driving Conditions (RDC). Energies 2022, 15, 4734. [Google Scholar] [CrossRef]
  39. Enomoto, K.; Ida, A.; Harada, T.; Takeuchi, H. Development of Safety Performance for FC Stack in the New Toyota FCEV; SAE International: Warrendale, PA, USA, 2022; 022–01–0686. [Google Scholar]
  40. Konno, N.; Mizuno, S.; Nakaji, H.; Ishikawa, Y. Development of Compact and High-Performance Fuel Cell Stack. SAE Int. J. Altern. Powertrains 2015, 4, 123–129. [Google Scholar] [CrossRef]
  41. Soltani, M.; Mohammad Taghi Bathaee, S. Development of an Empirical Dynamic Model for a Nexa PEM Fuel Cell Power Module. Energy Convers. Manag. 2010, 51, 2492–2500. [Google Scholar] [CrossRef]
  42. Allagui, H.; Mzoughi, D.; Bouaicha, A.; Mami, A. Modeling and Simulation of 1.2 kW Nexa PEM Fuel Cell System. Indian J. Sci. Technol. 2016, 9, 1–8. [Google Scholar] [CrossRef]
  43. Salim, R.; Nabag, M.; Noura, H.; Fardoun, A. The Parameter Identification of the Nexa 1.2 kW PEMFC’s Model Using Particle Swarm Optimization. Renew. Energy 2015, 82, 26–34. [Google Scholar] [CrossRef]
  44. Abbade, H.; El Fadil, H.; Lassioui, A.; Intidam, A.; Hamed, A.; El Asri, Y.; Fhail, A.; Hasni, A. Deep Learning-Based Performance Modeling of Hydrogen Fuel Cells Using Artificial Neural Networks: A Comparative Study of Optimizers. Processes 2025, 13, 1453. [Google Scholar] [CrossRef]
  45. Heliocentris Hybrid Energy Lab. Instruction Heliocentris Academia GmbH; Heliocentris Academia GmbH: Berlin, Germany, 2016. [Google Scholar]
  46. Czarnigowski, J.; Skiba, K.; Kida, M.; Jakliński, P.A. Simple Dynamic Model of a PEM-Type Fuel Cell. Combust. Engines 2025, 202, 147–153. [Google Scholar] [CrossRef]
  47. Andrade, T.S.; Thiringer, T. Low Platinum Fuel Cell as Enabler for the Hydrogen Fuel Cell Vehicle. J. Power Sources 2024, 598, 234140. [Google Scholar] [CrossRef]
  48. Wang, H.; Wang, R.; Sui, S.; Sun, T.; Yan, Y.; Du, S. Cathode Design for Proton Exchange Membrane Fuel Cells in Automotive Applications. Automot. Innov. 2021, 4, 144–164. [Google Scholar] [CrossRef]
  49. Salim, R.I.; Noura, H.; Nabag, M.; Fardoun, A. Modeling and Temperature Analysis of the Nexa 1.2 kW Fuel Cell System. J. Fuel Cell Sci. Technol. 2015, 12, 061006. [Google Scholar] [CrossRef]
  50. Sevjidsuren, G.; Uyanga, E.; Bumaa, B.; Temujin, E.; Altantsog, P.; Sang, D. Exergy Analysis of 1.2 kW NexaTM Fuel Cell Module. In Clean Energy for Better Environment; Aydinalp, C., Ed.; InTech: Rijeka, Croatia, 2012; ISBN 978-953-51-0822-1. [Google Scholar]
  51. Del Real, A.J.; Arce, A.; Bordons, C. Development and Experimental Validation of a PEM Fuel Cell Dynamic Model. J. Power Sources 2007, 173, 310–324. [Google Scholar] [CrossRef]
Figure 1. Operating temperatures and power range of typical fuel cells [8].
Energies 18 05513 g001
Figure 2. Current–voltage characteristics including specification of common fuel cell losses.
Energies 18 05513 g002
Figure 3. General scheme of the second-generation Toyota Mirai powertrain.
Energies 18 05513 g003
Figure 4. Diagram of the Hybrid Energy Lab (HEL) System measurement system from Heliocentris: (a) view of the system; (b) diagram of the fuel cell stack and hydrogen and energy flow [45].
Energies 18 05513 g004
Figure 5. Analysis of the Toyota Mirai II route: (a) full route in accordance with the RDE procedure; (b) part of the route subjected to scaling.
Energies 18 05513 g005
Figure 6. Time characteristics of current, voltage and power of the fuel cell stack: (a) in urban driving conditions; (b) in sub-urban driving conditions; (c) in motorway driving conditions.
Energies 18 05513 g006
Figure 7. Current and power characteristics of the Toyota Mirai II fuel cell stack: (a) in urban driving conditions; (b) in sub-urban driving conditions; (c) in motorway driving conditions.
Energies 18 05513 g007
Figure 8. Current–voltage characteristics of the Toyota Mirai II fuel cell stack: (a) in urban driving conditions; (b) in sub-urban driving conditions; (c) in motorway driving conditions.
Energies 18 05513 g008
Figure 9. Current–voltage characteristics of the Toyota Mirai II high-voltage battery: (a) in urban driving conditions; (b) in sub-urban driving conditions; (c) in motorway driving conditions.
Energies 18 05513 g009
Figure 10. Time characteristics of temperature (T1, T2 and T3) and pressure (P) changes in the high-pressure tanks of the Toyota Mirai II: (a) in urban driving conditions; (b) in sub-urban driving conditions; (c) in motorway driving conditions.
Energies 18 05513 g010
Figure 11. Time characteristics of scaling the current intensity of the Toyota Mirai II fuel cells to low-scale conditions: (a) in urban driving conditions; (b) in sub-urban driving conditions; (c) in motorway driving conditions.
Energies 18 05513 g011
Figure 12. Qualitative indicators of 10 times scaling of the current level of the Toyota Mirai II fuel cell stack to low-scale conditions: (a) in urban driving conditions; (b) in sub-urban driving conditions; (c) in motorway driving conditions.
Energies 18 05513 g012
Figure 13. Time characteristics of power scaling of the Toyota Mirai II fuel cell stack under low-scale conditions: (a) in urban driving conditions; (b) in sub-urban driving conditions; (c) in motorway driving conditions.
Energies 18 05513 g013
Figure 14. Qualitative indicators of 10 times scaling of the power of the Toyota Mirai II fuel cell stack to low-scale conditions: (a) in urban driving conditions; (b) in sub-urban driving conditions; (c) in motorway driving conditions.
Energies 18 05513 g014
Figure 15. Qualitative indicators of 10 times scaling of the power of the Toyota Mirai II fuel cell stack (light colour) to low-scale conditions (dark colour): in urban driving conditions (blue); sub-urban driving conditions (red); motorway driving conditions (green): (a) during current scaling; (b) during cell power scaling.
Energies 18 05513 g015
Figure 16. Current–voltage characteristics of current and power scaling of the Toyota Mirai II fuel cell stack for low-scale conditions in urban, sub-urban and motorway driving conditions.
Energies 18 05513 g016
Table 2. Technical specifications of the Hybrid Energy Lab System [45].
Fuel CellTitleUnitValueTitle
Rated outputW1200
No. of cells36
Area of cellcm2150
Rated currentA60
Operating voltageV18–36
Hydrogen purityMin.4.0
Permissible H2 inlet pressurebar1–15
DC converter
Max output powerW1500
Max output currentADC55
Rated output voltage VDC24
Output voltage rangeVDC21–30
Max input currentADC60
Input voltage rangeVDC18–36
Efficiency%96
Inverter
Continuous output power (50 Hz), 115 VAC (60Hz) WAC1500
Inlet voltageVDC21–30
Output voltageVAC230
Efficiency%93
Electronic Load Module
Max. continuous powerW1200
DC load currentADC0–85
DC load voltageVDC0–80
Battery Module
Battery set 1lead-acid24 V, (2 × 12 V), 7.2 Ah
Battery set 2lead-acid24 V, (2 × 12 V), 18 Ah
Disclaimer/Publisher’s Note: The statements, opinions and data contained in all publications are solely those of the individual author(s) and contributor(s) and not of MDPI and/or the editor(s). MDPI and/or the editor(s) disclaim responsibility for any injury to people or property resulting from any ideas, methods, instructions or products referred to in the content.