Abstract
To efficiently recover waste heat from gas turbines, a hybrid recompression supercritical carbon dioxide (SCO2)–organic Rankine cycle (ORC) regenerative combined system is proposed. The ORC employs a mixed working fluid to enhance thermodynamic matching. Thermodynamic, compactness, and economic models are established to analyze the influence of key operating parameters on system performance. Based on parametric analysis, decision variables are identified and used for single-objective and multi-objective optimizations of system performance metrics. Results show that increasing the split ratio in the recompression cycle improves thermodynamic performance but simultaneously increases both heat transfer area per unit output power (APR) and the levelized electricity cost (LEC). In the ORC, the temperature glide during evaporation and condensation of the mixed working fluid enables better thermal match with the heat source and sink, thereby reducing the required heat transfer area and associated cost rate. Under multi-objective optimization targeting APR and LEC, the optimal decision variables are determined as 560 °C, 4.2, 0.71, 44 °C, and 0.71, respectively.
1. Introduction
Gas turbines offer several advantages, such as flexible operation, rapid start-up, compact design, and environmental compatibility. However, their single-unit thermal efficiency is relatively low, primarily due to the significant amount of waste heat discharged into the atmosphere [1]. Therefore, waste heat recovery has become a critical strategy for improving the overall efficiency of gas turbines. Currently, the most widely adopted waste heat recovery method is the gas–steam combined cycle. Nevertheless, considering the broad range of exhaust gas temperatures in gas turbines, this approach may not always represent the most efficient or optimal solution [2]. In recent years, the supercritical carbon dioxide (SCO2) cycle has garnered increasing attention due to its superior thermal efficiency and compact configuration. Edward J. Parma et al. [3] demonstrated that when the heat source temperature exceeds 450 °C, the SCO2 cycle achieves higher thermal efficiency compared to the steam power cycle. Furthermore, the turbine size required for the SCO2 cycle is only approximately one percent of that needed for a conventional steam turbine [4].
The supercritical carbon dioxide cycle belongs to the Brayton power cycle family. Among various configurations, the recompression cycle is recognized for its high thermodynamic efficiency and simple layout, making it the most promising configuration within current SCO2 cycles [5]. Li [6] conducted an optimization study on a 50 MW-scale shipborne SCO2 recompression cycle. The results demonstrated that when the condensation margin was set to 0.1, the optimized cycle achieved a thermal efficiency of 48.16%. To further improve the thermodynamic performance of the SCO2 cycle, researchers proposed integrating an organic Rankine bottoming cycle to recover waste heat, leading to the development of the SCO2–organic Rankine combined cycle. Feng [7] performed a comparative analysis between the organic Rankine regenerative cycle and the basic organic Rankine cycle. The findings revealed that, under identical thermal conditions, the regenerative cycle achieved significantly higher thermal efficiency, albeit with a slightly higher levelized energy cost compared to the basic cycle. Regarding the selection of working fluids for the organic Rankine cycle, Fu [8] showed that the use of the mixed working fluid R600/R245fa resulted in superior performance in terms of net output power, thermal efficiency, and exergy efficiency compared to pure working fluids. Wang et al. [9] investigated the SCO2–organic Rankine combined cycle and found that when isobutene was used as the working fluid in the organic Rankine cycle, the system exergy efficiency reached 62.64%. Cao [10] studied a solar-assisted SCO2–organic Rankine combined cycle using R245ca as the working fluid. The results indicated that the optimal thermal efficiency of the system was 35.07%. He [11] applied the SCO2–organic Rankine combined cycle to ship propulsion. Optimization results showed that with a SCO2 pressure ratio of 2.7, a split ratio of 0.27, and an organic Rankine evaporation pressure of 770 kPa, the system achieved a thermal efficiency of 42.82%, with a total production cost of 11.6 USD/GJ. Nami et al. [12] developed a comprehensive thermoeconomic and environmental impact model for the SCO2–organic Rankine combined cycle. Mohammadi et al. [13] constructed a thermoeconomic model for the SCO2 recompression–organic Rankine regenerative combined cycle and applied the particle swarm optimization algorithm for performance optimization. Song et al. [14] put forward a combined cycle system for waste heat recovery of internal combustion engines. This system couples the SCO2 cycle with a bottoming organic Rankine cycle. The results indicate that the optimized net power output and investment cost of the combined cycle system are, respectively, 58% and 4% higher than those of the sole SCO2 cycle system. Overall, the SCO2–organic Rankine combined cycle has shown promising thermodynamic and thermoeconomic performance. However, most existing optimization studies have focused on single-objective optimization, with limited attention given to multi-objective optimization approaches. Considering the need to evaluate multiple performance indicators in real-world applications, conducting multi-objective optimization studies is essential. Moreover, current research on the combined cycle lacks systematic evaluations of system compactness [15,16], which is a key performance indicator for SCO2 systems. Therefore, in-depth investigations into compactness are necessary to support broader system design and application.
Nevertheless, in the existing research, there is a shortage of efficient power systems tailored for the utilization of waste heat from gas turbines. Moreover, comprehensive evaluation methodologies for waste heat utilization systems are also lacking. Therefore, this study presents an optimization analysis of a composite supercritical carbon dioxide–ORC combined system designed for waste heat recovery from gas turbines. The organic Rankine cycle component of the system utilizes non-azeotropic mixed working fluids to enhance thermodynamic performance. The optimization model incorporates three key performance indicators as objective functions: exergy efficiency, cost per unit of output power, and heat transfer area per unit of output power. To achieve a balanced and comprehensive improvement in system performance, a multi-objective optimization framework based on the genetic algorithm is employed to identify the optimal operating parameters. This approach enables the simultaneous consideration of energy efficiency, economic viability, and system compactness.
2. Models and Methods
2.1. Research Subjects
Figure 1 illustrates a composite SCO2 recompression–organic Rankine cycle regenerative combined cycle system designed for waste heat recovery in gas turbine applications. The system integrates three primary subsystems: a gas turbine system, an SCO2 Brayton cycle, and an ORC. The high-temperature exhaust gas from the gas turbine is utilized as the primary heat source. Within the combined cycle architecture, the SCO2 recompression cycle operates as the topping cycle, while the ORC functions as the bottoming cycle. Through thermal integration between the two cycles—specifically by recovering the residual cooling heat from the SCO2 cycle—the system enables enhanced overall thermal efficiency and facilitates deep energy utilization. The gas turbine system comprises a compressor (C1), a turbine (GT), and two combustors (CC1 and CC2). The SCO2 cycle includes two compressors (C2 and C3), two turbines (T1 and T2), a heat exchanger (H1), two regenerators (HTR and LTR), and a cooler (Cooler1). The ORC subsystem consists of a pump, a turbine (T3), two heat exchangers (H3 and H4), a regenerator (R), and a condenser (Cooler2). The numbers from 1 to 36, along with 2’, 3’, and 9’, denote the state points of the fluid.
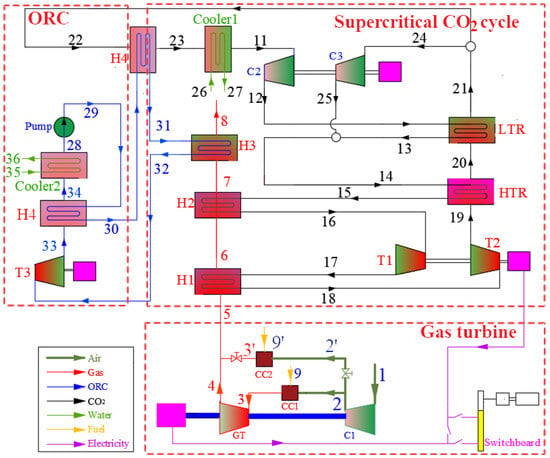
Figure 1.
Schematic diagram for the proposed system.
The selected working fluid must exhibit favorable thermophysical properties, chemical stability, and environmental compatibility [17]. Given the relatively high temperature of the heat source in the system, alkanes with superior thermodynamic performance, such as R601a, are considered appropriate choices. However, due to its flammable and explosive nature, the practical application of R601a is constrained. To mitigate this issue, it is blended with the non-flammable working fluid R245fa. An in-depth investigation has been conducted on the resulting non-azeotropic mixtures. Table 1 summarizes the thermophysical properties of R601a and R245fa. The chemical name of R245fa is 1,1,1,3,3-pentafluoropropane. Its molecular formula is C2HF5. The chemical name of R601a is isopentane, with the molecular formula C5H12.

Table 1.
Characteristics of organic working fluids.
The assumptions of this research are as follows [18,19]:
- (1)
- The combined system maintains a stable operating state.
- (2)
- The temperature and pressure of the environmental conditions are 35 °C and 1.013 bar, respectively.
- (3)
- The variations in potential energy and kinetic energy are negligible.
- (4)
- The isentropic efficiencies of GT, GT2, T1, T2 and T3 are 85%, 85%, 80%, 80% and 75%, respectively.
- (5)
- The isentropic efficiencies of C1, C2, C3, and pump are 88%, 85%, 85% and 80%, respectively.
2.2. Model Description
To enable a comprehensive evaluation of the cycle system, integrated performance models based on thermodynamics, exergy analysis, compactness, and exergoeconomic analysis have been established. Key performance indicators—such as exergy efficiency, the levelized electricity cost (LEC), and the heat transfer area per unit output power (APR)—are adopted as objective functions. This section provides a comprehensive overview of the detailed models for each component. Table 2, Table 3 and Table 4 present the energy balance equations and investment cost models for each component of the combined cycle system.

Table 2.
The model of the gas turbine system [20,21,22].

Table 3.
The model of the supercritical CO2 cycle system [20,21,22].

Table 4.
The model of the ORC system [20,21,22].
2.2.1. Compactness Assessment Model
APR is expressed as:
In this equation, represents the number of heat exchangers within the system; denotes the heat-transfer area of the k-th heat exchanger; and is the net power output of the system.
2.2.2. Exergoeconomic Model
Exergoeconomic analysis integrates exergy principles with economic cost evaluation. In this approach, exergy cost rate balance equations and auxiliary relations are applied to each system component to determine the unit cost of product exergy, with the primary objective of minimizing overall exergy-related costs.
The exergy cost rate balance equation for components involving heat transfer and work interactions is expressed as:
where denote the cost rates associated with work exergy flow and heat exergy flow of the k-th component, respectively; represent the cost rates corresponding to the inlet and outlet exergy flows of the k-th component; and is the cost rate attributable to the investment, operation, and maintenance expenses of the k-th component.
The cost rate associated with capital investment is calculated as:
where is the capital investment cost of the k-th component; is the operation and maintenance correction factor, taken as 1.06 to account for inspection and repair costs; is the interest rate; is the annual operating hours of the system; is the operational lifetime of the system (in years); and R is the capital recovery factor.
The objective function in exergoeconomic analysis is the Levelized Electricity Cost (LEC), defined as:
where are the total numbers of components and product streams in the system, respectively; is the cost rate of fuel exergy; and is the exergy of the i-th product stream.
2.3. Model Validation
To validate the accuracy of the supercritical carbon dioxide–organic Rankine cycle combined system model employed in this study, a comparative analysis was conducted against relevant published data. Sun et al. [23] investigated a recompression SCO2–ORC combined system. Table 5 presents a comparative summary of the performance results obtained from the current model and those reported in ref. [23]. When identical input conditions were applied, the deviation in key performance parameters between the present model and the data from ref. [23] remained below 5%. This close agreement confirms the validity and reliability of the model proposed in this study.

Table 5.
Model verification with data from Sun [23].
3. Results
System performance parameters are dependent on operating variables. A systematic investigation of the influence of key operating parameters on system performance can provide essential theoretical support for optimizing the overall cycle efficiency and operational stability. Given that the combined cycle integrates a supercritical carbon dioxide cycle and an organic Rankine cycle, the analysis of its operating parameters is divided into two distinct components: the parametric evaluation of the SCO2 cycle and that of the ORC. In the case of the SCO2 cycle, critical operating parameters include compressor inlet temperature, pressure ratio, expander inlet temperature, and split ratio. For the ORC, the key parameters considered are evaporation temperature, degree of superheat, condensing temperature, and concentration of mixed working fluid components.
3.1. Influence Mechanisms of Supercritical CO2 Cycle Parameters
The heat source for the supercritical CO2 cycle is the exhaust gas from a gas turbine, characterized by an inlet temperature of 670 °C and a mass flow rate of 94.93 kg/s. The cold source is cooling water with an inlet temperature of 25 °C and an outlet temperature of 30 °C.
3.1.1. Analysis of the Impact of Compressor Inlet Temperature on Cycle Performance
Figure 2 depicts the influence of the inlet temperature T1 of the supercritical CO2 compressor on the exergy efficiency, APR, and LEC. As presented in Figure 2, the exergy efficiency of the supercritical CO2 recompression cycle initially increases and subsequently decreases with an increase in the compressor inlet temperature. The maximum exergy efficiency is achieved when the compressor inlet temperature is 31.15 °C. This indicates that when the compressor inlet state approaches the critical point, the compression work is minimized, and the exergy efficiency is maximized. APR first decreases and then increases as the compressor inlet temperature rises. The minimum value of APR is reached when the compressor inlet temperature is 31.05 °C. This phenomenon can be attributed to the enhanced heat transfer performance of CO2 near the critical point, which reduces the required heat transfer area. Additionally, the compression ratio work is relatively small during compression near the critical point, thus leading to the minimum APR in the vicinity of the critical point. Furthermore, the variation trend of LEC with respect to the compressor inlet temperature mirrors that of APR, decreasing first and then increasing. The minimum LEC is attained when the compressor inlet temperature is 30.8 °C. This is mainly due to the enhanced heat transfer characteristics near the critical point, which lead to reduced heat exchanger costs and lower compression work requirements.
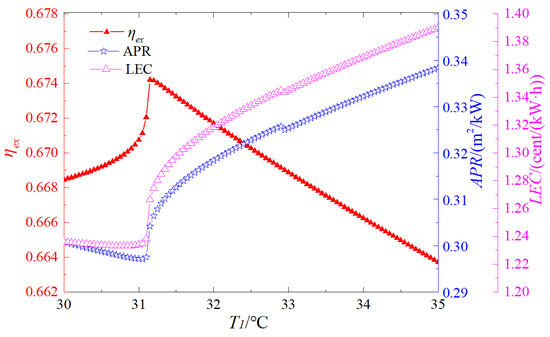
Figure 2.
Influence of compressor inlet temperature on system performance.
3.1.2. Analysis of the Influence of Pressure Ratio on Cycle Performance
The expander and compressor are critical power-generating components in the supercritical CO2 cycle system, making the pressure ratio a key parameter that significantly influences overall system performance. A thorough investigation of the pressure ratio’s impact provides essential insights for optimizing the design and operation of these components. Figure 3 illustrates the influence of the pressure ratio PRc on exergy efficiency, APR, and LEC. As shown in the figure, the exergy efficiency of the supercritical CO2 recompression cycle increases monotonically with rising pressure ratio. This trend is primarily attributed to the enhanced expansion work at higher pressure ratios, which leads to a greater net work output of the cycle. APR decreases with increasing pressure ratio, although the rate of reduction gradually diminishes. This behavior arises because an elevated pressure ratio results in a higher maximum cycle pressure, thereby improving heat transfer performance at the high-pressure sides of the heater and regenerator. Consequently, the required heat transfer area is reduced. Coupled with the increased net work output, this contributes to a lower APR. However, as the pressure ratio continues to rise, the marginal benefits diminish, leading to a slower decline in APR. Moreover, the LEC initially decreases and then increases with the increases in the pressure ratio, reaching a minimum at a pressure ratio of 3.2. The underlying reason is that while an increase in the pressure ratio is conducive to reducing the heat transfer area and increasing the net work of the cycle, it also results in an increase in the costs of the expander and heat exchanger. Hence, an optimal pressure ratio exists that minimizes the LEC by balancing performance gains against cost increments.
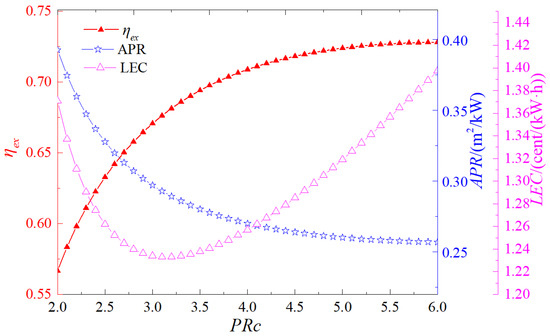
Figure 3.
Influence of pressure ratio on system performance.
3.1.3. Analysis of the Influence of the Expander Inlet Temperature on the Cycle Performance
The expander inlet temperature, constrained by the available heat source conditions and current manufacturing capabilities, represents the maximum temperature encountered in the thermodynamic cycle. As a critical operational parameter, it exerts a significant influence on the performance of both the expander and the heat absorber. Figure 4 presents the effects of the expander inlet temperature Tt on the exergy efficiency, APR, and LEC. As shown in the figure, within the investigated temperature range, the exergy efficiency of the supercritical carbon dioxide recompression cycle increases consistently with rising Tt. This trend indicates that higher inlet temperatures contribute positively to the thermodynamic performance of the cycle. Regarding the APR, it initially decreases and subsequently increases as the expander inlet temperature increases, reaching a minimum at 475 °C. This phenomenon can be attributed to the fact that the growth rate of the net cycle work is higher than that of the heat transfer area. Similarly, the LEC follows a non-linear trend, first decreasing and then increasing with the rise in Tt. The minimum LEC is observed at an expander inlet temperature of 540 °C, suggesting that this temperature represents an optimal trade-off between energy output and economic cost.
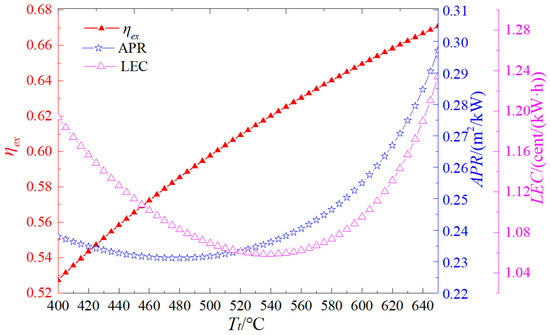
Figure 4.
Influence of turbine inlet temperature on system performance.
3.1.4. Analysis of the Influence of the Split Ratio on the Cycle Performance
Figure 5 depicts the influence of the split ratio of supercritical carbon dioxide on the exergy efficiency, the APR, and the LEC. As presented in Figure 5, the exergy efficiency of the supercritical carbon dioxide recompression cycle exhibits a decreasing trend with the increase in the split ratio. The minimum value is attained when the split ratio is equal to 1. Under this condition, the recompression cycle transforms into a regenerative cycle. Evidently, the exergy efficiency of the recompression cycle is higher than that of the regenerative cycle, indicating that an increasing split ratio is not conducive to enhancing the thermodynamic performance. Regarding the APR, it shows a declining pattern as the split ratio increases. For the LEC, it initially decreases and subsequently increases with the growth of the split ratio. The lowest value of the LEC is reached when the split ratio is 0.94. This implies that an increase in the split ratio is advantageous for improving the compactness and economic efficiency of the system.
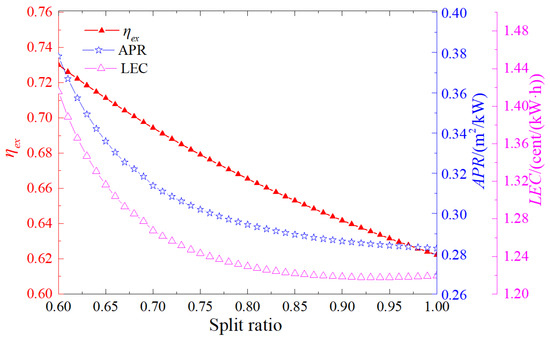
Figure 5.
Influence of the split ratio on the cycle performance.
3.2. Influence of Organic Rankine Cycle Parameters on System Performance
3.2.1. Analysis of the Impact of Evaporation Temperature on System Performance
During the isobaric heat absorption process, the organic working fluid passes through the two-phase region. Herein, the evaporation temperature specifically denotes the evaporation dew-point temperature, which is constrained by both the heat-source temperature and the critical temperature.
Figure 6 depicts the influence of evaporation temperature on exergy efficiency, APR, and LEC. As presented in Figure 6, within the selected temperature range, the exergy efficiency exhibits an upward trend with the increasing evaporation temperature. This can be primarily attributed to the fact that a higher evaporation temperature leads to an elevation in the heat-absorption temperature of the cycle, thereby enhancing the exergy efficiency. Regarding APR, it first decreases and then increases as the evaporation temperature rises. The underlying mechanism is as follows: with the increase in evaporation temperature, the average logarithmic temperature difference in the heat absorber diminishes, causing an enlargement of the heat-exchange area. Simultaneously, the increase in evaporation temperature results in a rise in the net work of the cycle. Initially, the growth rate of the cycle’s net work outpaces that of the heat-exchange area; however, subsequently, it lags behind. This sequential change gives rise to the observed pattern of APR first decreasing and then increasing with the increasing evaporation temperature. Furthermore, LEC also demonstrates a trend of first decreasing and then increasing with the growth of evaporation temperature. This is because as the evaporation temperature increases, the cycle pressure ratio escalates, leading to an augmentation in the costs of the cooler, expander, and organic working fluid pump. Concurrently, the net work of the cycle also increases. Given that LEC is defined as the ratio of the system cost to the net work of the cycle, initially, the growth rate of the cycle’s net work is greater than that of the system cost. Nevertheless, when the evaporation temperature reaches a certain threshold, the growth rate of the system cost becomes more substantial. Consequently, LEC first decreases and then increases as the evaporation temperature increases.
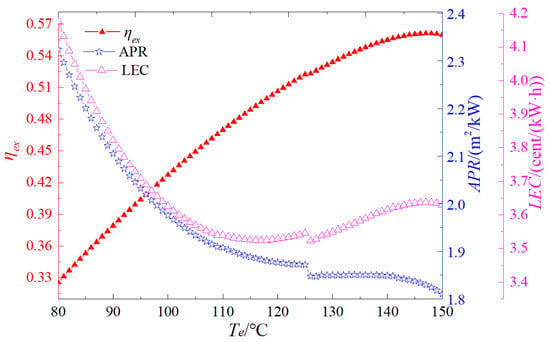
Figure 6.
Influence of evaporation temperature on system performance.
3.2.2. Effect of Condensation Temperature on System Performance
During the isobaric heat-rejection process, the organic working fluid traverses the two-phase region. Here, the condensation temperature specifically refers to the condensation dew point temperature, which is restricted by the cold source temperature. Figure 7 presents the influence of the condensation temperature on exergy efficiency, APR, and LEC. As depicted in Figure 7, within the chosen temperature range, the exergy efficiency shows a decreasing trend as the condensation temperature rises. The primary reason for this is that an increase in the condensation temperature results in a reduction in the cycle’s heat rejection temperature, thereby decreasing the exergy efficiency. Regarding APR, it initially decreases and then increases with the elevation of the condensation temperature. When the condensation temperature is 43 °C, APR attains its minimum value. Similarly, LEC follows a U-shaped trend with respect to condensation temperature, achieving its minimum value at 41 °C. This is because as the condensation temperature increases, the cycle pressure ratio decreases, which in turn reduces the costs of the cooler, expander, and pump. Simultaneously, the net work of the cycle also decreases. Given that LEC is defined as the ratio of the total system cost to the net work of the cycle, initially, the rate of decrease in the cycle’s net work is greater than that of the system cost. Nevertheless, when the condensation temperature reaches a certain threshold, the rate of decrease in the system cost becomes more significant. Consequently, LEC first decreases and then increases as the condensation temperature increases.
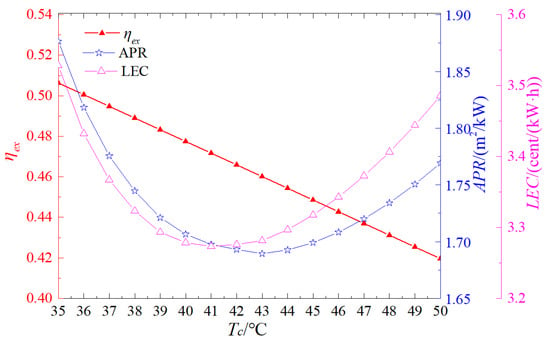
Figure 7.
Influence of condensation temperature on cycle performance.
3.2.3. Effect of Working Fluid Composition on System Performance
The Organic Rankine Cycle employs a blend of R601a and R245fa as the working fluid. Figure 8 illustrates the impact of the mass fraction x of R601a within the mixed working fluid on the performance of the ORC system. As shown in Figure 8, pure R601a (x = 1) achieves the highest exergy efficiency among all compositions, owing to its favorable thermodynamic properties for work conversion under the given operating conditions. However, it also results in higher APR and LEC values, indicating inferior volumetric and economic performance. Blending with R245fa leads to a reduction in both APR and LEC, despite a moderate decrease in exergy efficiency. An optimal composition is observed at 0.42, where APR reaches its minimum value of 1.67 m2/kW, reflecting improved system compactness. When x = 0.52, the LEC reaches its lowest point, amounting to 0.031 $/(kW·h). The reason that blending R245fa can decrease the APR and the LEC is that the mixed working fluid exhibits temperature glide during the evaporation and condensation processes. This property enables the working fluid to achieve a better thermal match with the heat source and cold sink, thereby reducing the required heat-transfer area of the heat exchanger and its associated cost rate.
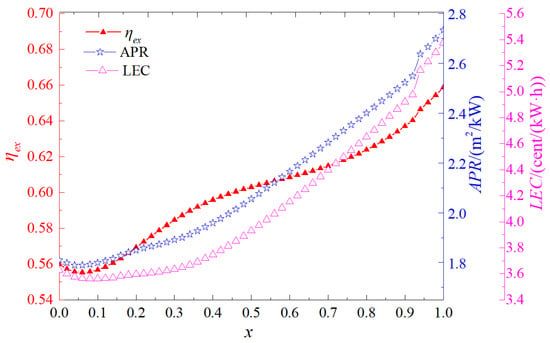
Figure 8.
Influence of components on system performance.
4. Discussion
Multi-objective optimization techniques are employed to optimize the system. The performance parameters of the combined cycle system are set as the objective functions, while the key operating parameters serve as the decision variables. Through multi-objective optimization methods, the optimal operating parameters can be derived [24,25]. A multi-objective minimization problem is defined:
The constraint conditions are given by:
In these equations, F(X) represents the vector of objective functions, where fm is the m-th objective function. X is the vector of decision variables. gj(X) and hk(X) denote the inequality and equality constraints, respectively. J and K represent the number of inequality and equality constraints, respectively. xi, min and xi, max are the lower and upper bounds of the i-th decision variable, respectively.
To attain the optimal solution, a genetic algorithm-based optimization approach is utilized during the optimization process. The core concept of the genetic optimization algorithm is to mimic the mechanisms of “natural selection” and “genetic variation” in biological evolution. By encoding to represent individuals, these individuals within a population are made to undergo operations such as fitness—based selection, genetic crossover, and random mutation. Through successive generations of evolution, it aims to approximate the optimal solution of complex optimization problems. This approach aims to find the optimal solution set of the multi-objective function, namely the Pareto-optimal frontier. All points on this frontier are feasible solutions.
The heat source for the combined cycle is the exhaust gas from the gas turbine. The system parameters of the gas turbine under rated conditions are presented in Table 6. These exhaust gas parameters of the gas turbine are used as the input parameters for the combined cycle.

Table 6.
System parameter values of gas turbine under rated conditions.
Under the fixed conditions of the heat source and heat sink, when the inlet state of the supercritical carbon dioxide compressor approaches the critical point and the condensation temperature of the organic working fluid is minimized, it is conducive to enhancing the system performance. Therefore, when optimizing the objective function of the combined cycle, the decision variables are chosen as the inlet temperature of the supercritical carbon dioxide expander, the pressure ratio of the supercritical carbon dioxide cycle, the split ratio of the supercritical carbon dioxide cycle, the evaporation temperature of the organic Rankine cycle, and the mass fraction of R601a in the mixed working fluid. These independent variables can be used to determine the parameters of the entire combined cycle.
Exergy efficiency, LEC, and APR are employed as the objective functions for multi-objective optimization. Each objective function is optimized separately, and the calculation results are presented in Table 7. As can be seen from these tables, the optimal operating parameters corresponding to each objective function vary. In practical applications, multiple indicators need to be taken into comprehensive consideration. Thus, the optimal operating parameters can be obtained through multi-objective optimization methods.

Table 7.
Optimization results of single objective function.
Figure 9 presents the Pareto frontier solutions of the optimized combined cycle. Evidently, all solutions on the Pareto frontier are optimal, enabling decision-makers to select the most suitable operating parameters according to specific requirements. Exergy efficiency, LEC, and APR are used as the objective functions for multi-objective optimization. Exergy efficiency evaluates the performance of a system from a thermodynamic perspective. The LEC assesses the system performance from the aspect of the system cost rate, while the APR evaluates the system performance from the angle of the system volume. Different performance parameters can be chosen for evaluation according to various application requirements. When considering exergy efficiency and LEC as the objective functions for dual-objective optimization of the combined cycle, the optimization results are depicted in Figure 9a. As shown in Figure 9a, at point C, the exergy efficiency is 0.565 and the LEC is 4.25 cent/(kW·h). This indicates that point C exhibits the optimal thermodynamic performance but the least favorable economic performance. In contrast, at point A, the exergy efficiency and LEC are minimized, reaching 0.575 and 4.29 cent/(kW·h), respectively. Thus, point A demonstrates the poorest thermodynamic performance yet the best economic performance. Notably, within the set of Pareto frontier solutions, no single optimal point can simultaneously maximize exergy efficiency and minimize the unit electricity cost rate. Consequently, in practical engineering applications, when choosing the optimal solution from the Pareto boundary solutions, the decision-making process involves the concept of an ideal point that does not exist in reality. This ideal point is characterized by maximum exergy efficiency and minimum unit electricity cost rate. The approach is to identify the point in the Pareto frontier solutions that is closest to the ideal point, which is point B. Point B is regarded as the optimal point. Therefore, for the combined cycle, the optimal exergy efficiency and unit electricity cost rate are 0.571 and 4.27 cent/(kW·h), respectively.
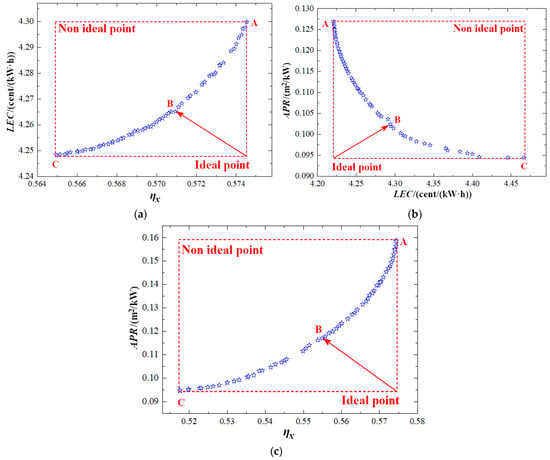
Figure 9.
Multi-objective optimization results for the combined cycle. (a) LEC-ηx; (b) APR-LEC; (c) APR-ηx.
When taking APR and LEC as the objective functions for dual-objective optimization of the combined cycle, the results are presented in Figure 9b. From Figure 9b, it can be observed that point C has the minimum APR of 0.0944 m2/kW and the maximum LEC of 4.47 cent/(kW·h). This implies that point C offers the best spatial compactness but the worst economic performance. On the contrary, point A has the maximum APR of 0.127 m2/kW and the minimum LEC of 4.22 cent/(kW·h), indicating that point A has the best economic performance but the poorest spatial compactness. Clearly, no single optimal point can simultaneously achieve the minimum APR and LEC. In light of practical engineering applications, when selecting the optimal solution from the Pareto boundary solutions, the decision—making process makes use of an ideal point that has both the minimum APR and LEC. The solution is to find point B, which is the closest to this ideal point among the Pareto frontier solutions. Point B is then considered the optimal point. As a result, for the combined cycle, the optimal values of APR and LEC are 0.104 m2/kW and 4.28 cent/(kW·h), respectively.
When using exergy efficiency and APR as the objective functions for dual-objective optimization of the combined cycle, the optimization results are shown in Figure 9c. As can be seen from Figure 9c, point C has the minimum exergy efficiency of 0.518 and the minimum APR of 0.0947 m2/kW, signifying that point C has the best spatial compactness but the worst thermodynamic performance. Conversely, point A has the maximum exergy efficiency of 0.5744 and the maximum APR of 0.1587 m2/kW, indicating that it has the best thermodynamic performance but the poorest spatial compactness. Again, no single optimal point can simultaneously achieve the minimum APR and the maximum exergy efficiency. Based on practical engineering requirements, when choosing the optimal solution from the Pareto boundary solutions, the decision-making process resorts to an ideal point with the minimum APR and the maximum. The point closest to this ideal point in the Pareto frontier solutions is point B, which is regarded as the optimal point. Hence, for the combined cycle, the optimal values of exergy efficiency and APR are 0.556 and 0.118 m2/kW, respectively. The results of the decision variables corresponding to the optimization results are presented in Table 8.

Table 8.
Multi-objective optimization results.
5. Conclusions
In this study, a novel integrated system that combines recompression supercritical carbon dioxide (SCO2) and organic Rankine cycle (ORC) for the utilization of waste heat from gas turbines is proposed. Thermodynamic, compactness, and economic models are developed to analyze the impacts of key operating parameters on the system performance, and the system performance is optimized accordingly. The detailed conclusions are presented as follows:
- The supercritical carbon dioxide cycle exhibits enhanced thermodynamic performance, compactness, and economic efficiency when compression occurs near the critical point. The thermodynamic performance of the recompression cycle improves as the inlet temperature of the expander increases. Moreover, there exists an optimal expander inlet temperature that optimizes the APR and LEC of the recompression cycle. An increase in the split ratio is beneficial to the thermodynamic performance; however, it raises the APR and the LEC of the cycle.
- In the Organic Rankine Cycle, an increase in the evaporation temperature is advantageous for the thermodynamic performance. Nevertheless, it is not necessarily beneficial for the APR and the LEC. During the evaporation and condensation processes, the mixed working fluid exhibits temperature glide, enabling a better match with the heat source and heat sink. This reduces the cost rate of the heat exchanger.
- Through single-objective and multi-objective optimization of the system, the results indicate that when the LEC is adopted as the objective function, the decision variables—namely, the inlet temperature of the SCO2 expander, the pressure ratio of the SCO2 cycle, the split ratio of the SCO2 cycle, the evaporation temperature of the ORC, and the mass fraction of R601a—are optimized to 560 °C, 3.2, 0.87, 112 °C, and 0.19, respectively. In the case of multi-objective optimization considering both the exergy efficiency and the LEC, the corresponding decision variables are determined as 585 °C, 3.8, 0.73, 135 °C, and 0.67.
Author Contributions
Conceptualization, S.H.; Methodology, S.H.; Software, Q.Y.; Validation, Q.Y.; Investigation, S.H.; Writing—original draft, S.Y.; Writing—review & editing, Q.Y. All authors have read and agreed to the published version of the manuscript.
Funding
This research was funded by the National Natural Science Foundation of China, grant number 52406023.
Data Availability Statement
The original contributions presented in the study are included in the article, further inquiries can be directed to the corresponding author.
Conflicts of Interest
The authors declare no conflict of interest.
Nomenclature
| Glossary | Subscripts | ||
| A | heat transfer area, m2 | 0 | ambient (temperature) |
| APR | heat exchanger area per unit power output, m2/kW | 1, 2… | state points |
| C1 | compressor 1 | C1 | compressor 1 |
| C2 | compressor 2 | C2 | compressor 2 |
| CC | combustion chamber | GT | gas turbine |
| GT | gas turbine | CC | combustion chamber |
| h | specific enthalpy, kJ/kg | e | exit |
| PRc | pressure ratio | F | fuel |
| Te | evaporation temperature, °C | GT | gas turbine |
| Tc | condensation temperature, °C | H1 | heat exchanger 1 |
| LEC | levelized energy cost, cent/(kW·h) | H2 | heat exchanger 2 |
| LHV | lower heating value, kJ/kg | H3 | heat exchanger 3 |
| m | mass flow rate, kg/s | i | inlet |
| ORC | organic Rankine cycle | net | net power |
| P | pressure, bar | HTR | high-temperature regenerator |
| Q | heat capacity, kW | LTR | low-temperature regenerator |
| HTR | high-temperature regenerator | T1 | turbine 1 |
| LTR | low-temperature regenerator | T2 | turbine 2 |
| T | temperature, °C | co2 | cooler2 |
| T1 | turbine 1 | Greek symbols | |
| T2 | turbine 2 | α | coefficient |
| U | heat transfer coefficient, kW/(m2·K) | ηc | isentropic efficiency of compressor |
| W | power output, kW | ηt | isentropic efficiency of turbine |
| K | coefficient | ηex | exergy efficiency |
References
- Motamed, M.A.; Genrup, M.; Nord, L.O. Part-load thermal efficiency enhancement in gas turbine combined cycles by exhaust gas recirculation. Appl. Therm. Eng. 2024, 244, 122716. [Google Scholar] [CrossRef]
- Carcasci, C.; Ferraro, R.; Miliotti, E. Thermodynamic analysis of an organic Rankine cycle for waste heat recovery from gas turbines. Energy 2014, 65, 91–100. [Google Scholar] [CrossRef]
- Parma, E.J.; Wright, S.A.; Vernon, M.E.; Fleming, D.D.; Rochau, G.E.; Suo-Anttila, A.J. Supercritical CO2 Direct Cycle Gas Fast Reactor (SC-GFR) Concept; No. SAND2011-1804C; Sandia National Lab. (SNL-NM): Albuquerque, NM, USA, 2010. [Google Scholar]
- Dostal, V.; Hejzlar, P.; Driscoll, M.J. Driscoll. High-performance supercritical carbon dioxide cycle for next-generation nuclear reactors. Nucl. Technol. 2006, 154, 265–282. [Google Scholar] [CrossRef]
- Du, Y.; Yu, Z.; Yang, C.; Wang, H.; Zhang, H. Comprehensive evaluation of part-load exergy performance of a supercritical carbon dioxide recompression cycle controlled by various strategies. Energy Convers. Manag. 2024, 301, 118013. [Google Scholar] [CrossRef]
- Li, H.; Ju, Y.; Zhang, C. Optimization of supercritical carbon dioxide recompression Brayton cycle considering anti-condensation design of centrifugal compressor. Energy Convers. Manag. 2022, 254, 115207. [Google Scholar] [CrossRef]
- Feng, J.; Cheng, X.; Yan, Y.; Zhao, L.; Dong, H. Thermodynamic and thermo-economic analysis, performance comparison and parameter optimization of basic and regenerative organic Rankine cycles for waste heat recovery. Case Stud. Therm. Eng. 2023, 52, 103816. [Google Scholar] [CrossRef]
- Fu, G.; Zhang, S.; Ge, Z.; Li, J.; Xu, J.; Xie, J.; Xie, Z.; Yao, D.; Zhao, T.; Wang, Z.; et al. Thermo-Economic Performance Analysis of a Novel Organic Flash Rankine Cycle Using R600/R245fa Mixtures. Energies 2022, 15, 8055. [Google Scholar] [CrossRef]
- Wang, X.; Dai, Y. Exergoeconomic analysis of utilizing the transcritical CO2 cycle and the ORC for a recompression supercritical CO2 cycle waste heat recovery: A comparative study. Appl. Energy 2016, 170, 193–207. [Google Scholar] [CrossRef]
- Cao, Y.; Li, P.; Qiao, Z.; Ren, S.; Si, F. A concept of a supercritical CO2 Brayton and organic Rankine combined cycle for solar energy utilization with typical geothermal as auxiliary heat source: Thermodynamic analysis and optimization. Energy Rep. 2022, 8, 322–333. [Google Scholar] [CrossRef]
- He, X.; Du, Y.; Yang, C.; Hu, C.; Zhang, H.; Zhao, B.; Gao, J.; Zhao, W. Off-design performance of supercritical carbon dioxide cycle combined with organic Rankine cycle for maritime nuclear propulsion system under different control strategies. Int. J. Energy Res. 2022, 46, 23020–23038. [Google Scholar] [CrossRef]
- Nami, H.; Mahmoudi, S.; Nemati, A. Exergy, economic and environmental impact assessment and optimization of a novel cogeneration system including a gas turbine, a supercritical CO2 and an organic Rankine cycle (GT-HRSG/SCO2). Appl. Therm. Eng. 2017, 110, 1315–1330. [Google Scholar] [CrossRef]
- Mohammadi, K.; Ellingwood, K.; Powell, K. A novel triple power cycle featuring a gas turbine cycle with supercritical carbon dioxide and organic Rankine cycles: Thermoeconomic analysis and optimization. Energy Convers. Manag. 2020, 220, 113123. [Google Scholar] [CrossRef]
- Song, J.; Li, X.; Wang, K.; Markides, C.N. Parametric optimisation of a combined supercritical CO2 (S-CO2) cycle and organic Rankine cycle (ORC) system for internal combustion engine (ICE) waste-heat recovery. Energy Convers. Manag. 2020, 218, 112999. [Google Scholar] [CrossRef]
- Ochoa, G.V.; Valencia, G.; Forero, J.D.; Rojas, J.P. Thermoeconomic analysis of a combined supercritical CO2 reheating under different configurations of Organic Rankine cycle ORC as a bottoming cycle. Heliyon 2022, 8, 12. [Google Scholar] [CrossRef]
- Besarati, S.M.; Goswami, D.Y. Analysis of advanced supercritical carbon dioxide power cycles with a bottoming cycle for concentrating solar power applications. J. Sol. Energy Eng. 2014, 136, 010904. [Google Scholar] [CrossRef]
- Arjunan, P.; Muthu, J.H.G.; Radha, S.L.S.; Suryan, A. Selection of working fluids for solar organic Rankine cycle—A review. Int. J. Energy Res. 2022, 46, 20573–20599. [Google Scholar] [CrossRef]
- Kim, Y.M.; Sohn, J.L.; Yoon, E.S. Supercritical CO2 Rankine cycles for waste heat recovery from gas turbine. Energy 2017, 118, 893–905. [Google Scholar] [CrossRef]
- Turja, A.I.; Sadat, K.N.; Khan, Y.; Ehsan, M.M. Cascading the transcritical CO2 and organic Rankine cycles with supercritical CO2 cycles for waste heat recovery. Int. J. Thermofluids 2023, 20, 100508. [Google Scholar] [CrossRef]
- Sahu, M.K. Comparative exergoeconomics of power utilities: Air-cooled gas turbine cycle and combined cycle configurations. Energy 2017, 139, 42–51. [Google Scholar] [CrossRef]
- Akbari, A.D.; Mahmoudi, S.M. Thermoeconomic analysis & optimization of the combined supercritical CO2 (carbon dioxide) recompression Brayton/organic Rankine cycle. Energy 2014, 78, 501–512. [Google Scholar]
- Ancona, M.A.; Bianchi, M.; Branchini, L.; De Pascale, A.; Melino, F.; Peretto, A.; Torricelli, N. Systematic comparison of ORC and s-CO2 combined heat and power plants for energy harvesting in industrial gas turbines. Energies 2021, 14, 3402. [Google Scholar] [CrossRef]
- Sun, X.; Liu, L.; Zhang, T.; Zhao, Y.; Dai, Y. Optimization and comparative analysis of various organic Rankine cycle-based integrated systems for cooling and power cogeneration utilizing waste heat. Energy Convers. Manag. 2025, 325, 119328. [Google Scholar] [CrossRef]
- Zhao, T.; Xu, R.; Xin, Y.; He, K.; Ma, H.; Yuan, M.; Chen, Q. A comprehensive study of a low-grade heat-driven cooling and power system based on heat current method. J. Therm. Sci. 2024, 33, 1523–1541. [Google Scholar] [CrossRef]
- Xin, Y.-L.; Sun, Q.-H.; Zhao, T.; Li, X.; Chen, Q. A categorized and decomposed algorithm for thermal system simulation based on generalized benders decomposition. Energy 2023, 282, 128954. [Google Scholar] [CrossRef]
Disclaimer/Publisher’s Note: The statements, opinions and data contained in all publications are solely those of the individual author(s) and contributor(s) and not of MDPI and/or the editor(s). MDPI and/or the editor(s) disclaim responsibility for any injury to people or property resulting from any ideas, methods, instructions or products referred to in the content. |
© 2025 by the authors. Licensee MDPI, Basel, Switzerland. This article is an open access article distributed under the terms and conditions of the Creative Commons Attribution (CC BY) license (https://creativecommons.org/licenses/by/4.0/).