1. Introduction
Currently, the management of outage maintenance schedules is primarily handled by system operators. Various levels dispatch centers optimize the combination of outage requests submitted by maintenance units based on stability guidelines, dispatch procedures, event investigation protocols, and renewable energy penetration to formulate the grid outage maintenance schedule. The key to optimizing the grid outage maintenance schedule lies in exploring the near-optimal combination of tripped equipment to be maintained within a given period. Minimizing the impact of maintenance on grid safety and stability is crucial for ensuring the security, supply, and renewable penetration of the power system. However, optimization based on manual experience suffers from issues such as misjudgments, oversights, low scheduling efficiency, and difficulties in sharing and inheriting experience. The optimization of maintenance schedules is inherently a multi-objective combinatorial optimization problem. Presently, researchers are attempting to employ optimization algorithms for the scheduling of outage maintenance schedules: Literature [
1] proposes a bi-level optimization model based on Mixed Integer Linear Programming (MILP) to address complex energy management issues in microgrids. Specifically considering preventive maintenance and demand response. Simulations were conducted on a single-node system. Literature [
2] applies an improved Particle Swarm Optimization algorithm to the annual optimization planning of distribution networks; however, the number of devices optimized for the entire year was less than the number of months, and the experimental results demonstrated limited practical engineering applicability. In [
3], a restructured Independent System Operator used a cyclic algorithm to generate a Maximum-Reliability Maintenance Scheduling (MR-MS) plan and a Maximum-Profit Maintenance Scheduling (MP-MS) plan within the grid it manages. By continuously adjusting algorithm parameters, the MP-MS plan was made to approach the MR-MS plan in terms of reliability. Providing an effective framework for formulating maintenance schedules for generation equipment in restructured power systems. Literature [
4] proposes a machine learning surrogate-based stochastic optimization method for medium-term outage scheduling in power systems. Considering multi-timescale decision-making and uncertainties. Optimizing the outage maintenance schedule through distributed computing. Ref. [
5] proposes a coordinated maintenance framework for transmission components, using a Markov model and aperiodic strategies optimizing equipment maintenance timing and reliability. In [
6] addresses maintenance issues in power systems during ice disasters by proposing a multi-stage conditional maintenance scheduling method, which considers changes in equipment state and optimizes maintenance strategies to improve system reliability. Literature [
7] presents a medium-term preventive maintenance scheduling method based on decision trees and mixed integer linear programming, which optimizes the maintenance intervals and costs for thermal power units. Ref. [
8] proposes an extended framework based on the Manufacturer Usage Description (MUD) standard. This framework enhances the expressiveness of MUD. It can automatically generate behavioral profiles. It extends security assessment results from the design phase to runtime. Thus, it achieves dynamic attack surface reduction. It also enforces mandatory execution of security policies. Ref. [
9] introduces AI-driven solutions to combat IoT-specific threats and offers practical guidance for developing adaptive IDS in resource-limited environments. Literature [
10] proposes an optimal allocation and sizing method for solar and wind power units based on the Gravitational Search Algorithm (GSA), which enhances system economic efficiency and renewable energy integration. Literature [
11] proposes an adaptive optimal control strategy based on an integral reinforcement learning (IRL) algorithm for automatic generation control in islanded microgrids, which significantly enhances frequency regulation performance under various uncertainties. Literature [
12] proposes a hierarchical game method for integrating grid-forming energy storage into multi-energy systems, employing a chaos-enhanced IMTBO algorithm that reduces voltage deviation by 23.77% and improves overall operational efficiency. Literature [
13] proposes a computational model for medium-term transmission system scheduling, and optimizes long-term performance of maintenance policies, considering manpower constraints and operational uncertainties through Monte Carlo simulation and heuristic algorithms.
However, the aforementioned research on outage maintenance scheduling shares some common issues: (1) the excessively high level of detail in algorithmic models results in long processing duration; (2) outage maintenance scheduling constitutes a non-convex optimization problem, and the use of intelligent optimization methods easily leads to convergence at local optima.
As a major branch of machine learning, reinforcement learning has demonstrated exceptional performance in numerous optimization and decision-making scenarios in recent years [
14,
15]. Literature [
16] employs a multi-agent coordinated deep reinforcement learning algorithm, designing a dual-network structure and a competitive reward mechanism to address the complex optimization challenges in distributed non-convex economic dispatch caused by grid expansion. The method enables real-time and stable optimization of power output under time-varying demands through collaborative learning of independent agents and joint reward updates, overcoming the convergence difficulties of traditional methods in non-convex scenarios. Literature [
17] investigates a model-free economic dispatch approach for multiple Virtual Power Plants (VPPs) that does not rely on accurate environmental models. It proposes an adversarial safety reinforcement learning method, which enhances the safety of actions and renders the model robust against discrepancies between the training environment and the testing environment. Literature [
18] proposes an optimal scheduling method for shared energy storage systems (SESS) that accounts for distribution network (DN) operational risks. Specifically, it develops a multi-objective day-ahead scheduling model incorporating both explicit operational costs and reliability costs, integrates an island partitioning model with “maximum island partitioning—island optimal rectification” to accurately calculate reliability costs, and employs an improved genetic algorithm to solve the complex scheduling model—ultimately achieving efficient and reliable optimization of distribution networks under dynamic operating conditions. However, reinforcement learning strategies often operate as “black boxes” lacking transparent decision-making rationale. Their application in critical domains faces significant challenges, particularly concerning interpretability issues. Literature [
19] proposes an interpretable anti-drone decision-making method based on deep reinforcement learning. By incorporating a double deep Q-network with dueling architecture and prioritized experience replay, the DRL agent was trained to intercept unauthorized drones. To enhance the transparency of the decision process, Shapley Additive Explanations (SHAP) were applied to identify key factors influencing the agent’s actions. Additionally, experience replay was visualized to further illustrate the agent’s learning behavior. Ref. [
20] introduces an interpretable compressor design method combining deep reinforcement learning (DDPG) and decision tree distillation. The approach co-optimizes 25 design variables, achieving 84.65% isentropic efficiency and 10.75% surge margin in a six-stage axial compressor. SHAP and bio-inspired decision trees provide explicit design rules, enhancing both performance and interpretability for engineering applications.
In the field of power systems, the literature [
21] proposes Deep-SHAP, a backpropagation-based SHAP explainer tailored for deep reinforcement learning models in power system emergency control. It combines Shapley additive explanations with the efficient DeepLIFT backpropagation strategy to attribute DRL decisions to individual input features. A softmax layer converts raw SHAP scores into probability distributions, enabling intuitive interpretation. Features are categorized by their temporal and spatial properties, and both global (model-wide) and local (per-instance) analyses are delivered through stacked bar charts, bee-swarm plots, and 3D visualizations, allowing operators to see exactly which voltage and load variables drive load-shedding actions. Literature [
22] proposed a green learning (GL) model for regional power load forecasting, which is structured into three modules: unsupervised representation learning, supervised feature learning, and supervised decision learning. By combining mixed feature extraction, seasonal climate features, and the Quantile Autoregressive Forest (QARF) algorithm, it optimizes parameters with seasonal aggregation and avoids the backpropagation mechanism, achieving the dual goals of reduced energy consumption and improved prediction accuracy while reducing computational complexity.
The major challenges for the current research can be concluded: (1) the optimal outage scheduling problem requests to allocate the maintenance tasks for the whole month, which is a non-convex, high dimension optimization problem; (2) due to the complexity of the problem, the traditional heuristic algorithms are with low computational efficiency; (3) interpretability and the transparency of the data-driven methods need to be enhanced.
To address the aforementioned challenges, this paper proposes an interpretable reinforcement learning-based optimization method for monthly outage maintenance scheduling in power grids. Inspired by Literature [
23], this study focuses on the key factor of reward in the reinforcement learning process and investigates a reward-level interpretability approach. First, a single-agent reward function is designed to ensure the existence of an optimal reward point within the action space. Then, the Shapley value method is employed to select the main features and reasonably decompose rewards. By leveraging the interpretability of Shapley values, we have overcome challenges such as an excessively large state space and the detrimental impact of meaningless states on optimization performance and speed. This approach enhances optimization effectiveness and model transparency, enabling its application in sensitive and confidential domains while maintaining strong engineering applicability. Next, the received monthly outage maintenance requirements are modeled as a Markov decision process, defining the corresponding state space, action space, and objective function. Finally, interpretable reinforcement learning is applied to optimize the monthly outage maintenance schedule for the power grid.
The contributions of this work can be concluded as follows: (1) A reinforcement learning (RL)-based methodology is proposed for monthly outage scheduling in power systems. (2) The rationale behind state space formulation is clarified and enhanced using Shapley values, improving the interpretability of feature selection. (3) Visual validation is conducted on the IEEE 39-bus system, demonstrating the effectiveness and transparency of the proposed approach.
The rest of this paper is constructed as follows:
Section 2 formulates the optimization model for outage maintenance scheduling, including the construction of the objective function, the definition of the optimization variable set, and the establishment of operational constraints.
Section 3 presents a reward decomposition and state shaping method based on Shapley values to enhance the interpretability of the decision process.
Section 4 describes the selection of the reinforcement learning algorithm and the design of the state and action spaces, along with a visualization of the training results.
Section 5 concludes that the integration of Shapley values with reinforcement learning contributes to a reduction in voltage violations, decreased active power losses, improved power flow convergence, enhanced operational security, and increased scheduling efficiency.
3. Reinforcement Learning Method Based on Interpretability
This paper proposes a power outage maintenance schedule optimization method based on interpretable reinforcement learning. By formalizing the power outage maintenance schedule optimization problem as a Markov decision process (MDP), we construct the state space, action space, and reward function, and optimize the scheduling strategy based on DQN.
3.1. Key Feature Interpretability
Since reinforcement learning strategies typically exist as “black boxes,” researchers face significant challenges when applied in critical fields, particularly in terms of interpretability. To address this issue, Reference [
23] proposes an interpretability analysis method based on the Shapley value. This method treats each state feature in a Markov decision process as a participant in a cooperative game. By calculating the Shapley value of each feature during the decision optimization process, it quantifies the contribution of each state feature to the final optimized result, thereby providing an intuitive and quantitative explanation. This mechanism helps enhance users’ understanding and trust in the decision-making process of the agent, thereby improving the explainability and acceptability of reinforcement learning models.
In a cooperative game with
participants, the Shapley value can be used to calculate the average marginal benefit of participant
, expressed as:
where
denotes the cooperating parties;
denotes all permutations and combinations of
participants, containing
elements;
represents the cooperative profit function, also known as the characteristic function, whose domain is all subsets of
. It satisfies
and superadditivity, for any
such that
, we have
.
The interpretability discussed in this paper pertains to the reward level. The Shapley value calculates the marginal contribution of a specific participant to the reward function, representing the importance of a particular plan or feature within the power outage maintenance schedules. Furthermore, the reward-level interpretability explored in this paper encompasses two aspects: first, reward decomposition based on the Sharpley value method; second, state shaping, which utilizes the Sharpley value to extract key states for optimizing power outage maintenance schedules, thereby enhancing the optimization efficiency of reinforcement learning agents.
3.2. State Space
Markov decision processes (MDPs) exhibit a memoryless property, meaning the system’s next-time-step state is determined solely by the current state and the action executed.
The
minus
criterion framework in power systems [
24] proposes that a system comprising
units can tolerate failures in up to
units, while the failure of
units may cause grid collapse. Based on interpretable results and the
minus
criterion this paper defines the first-dimensional state
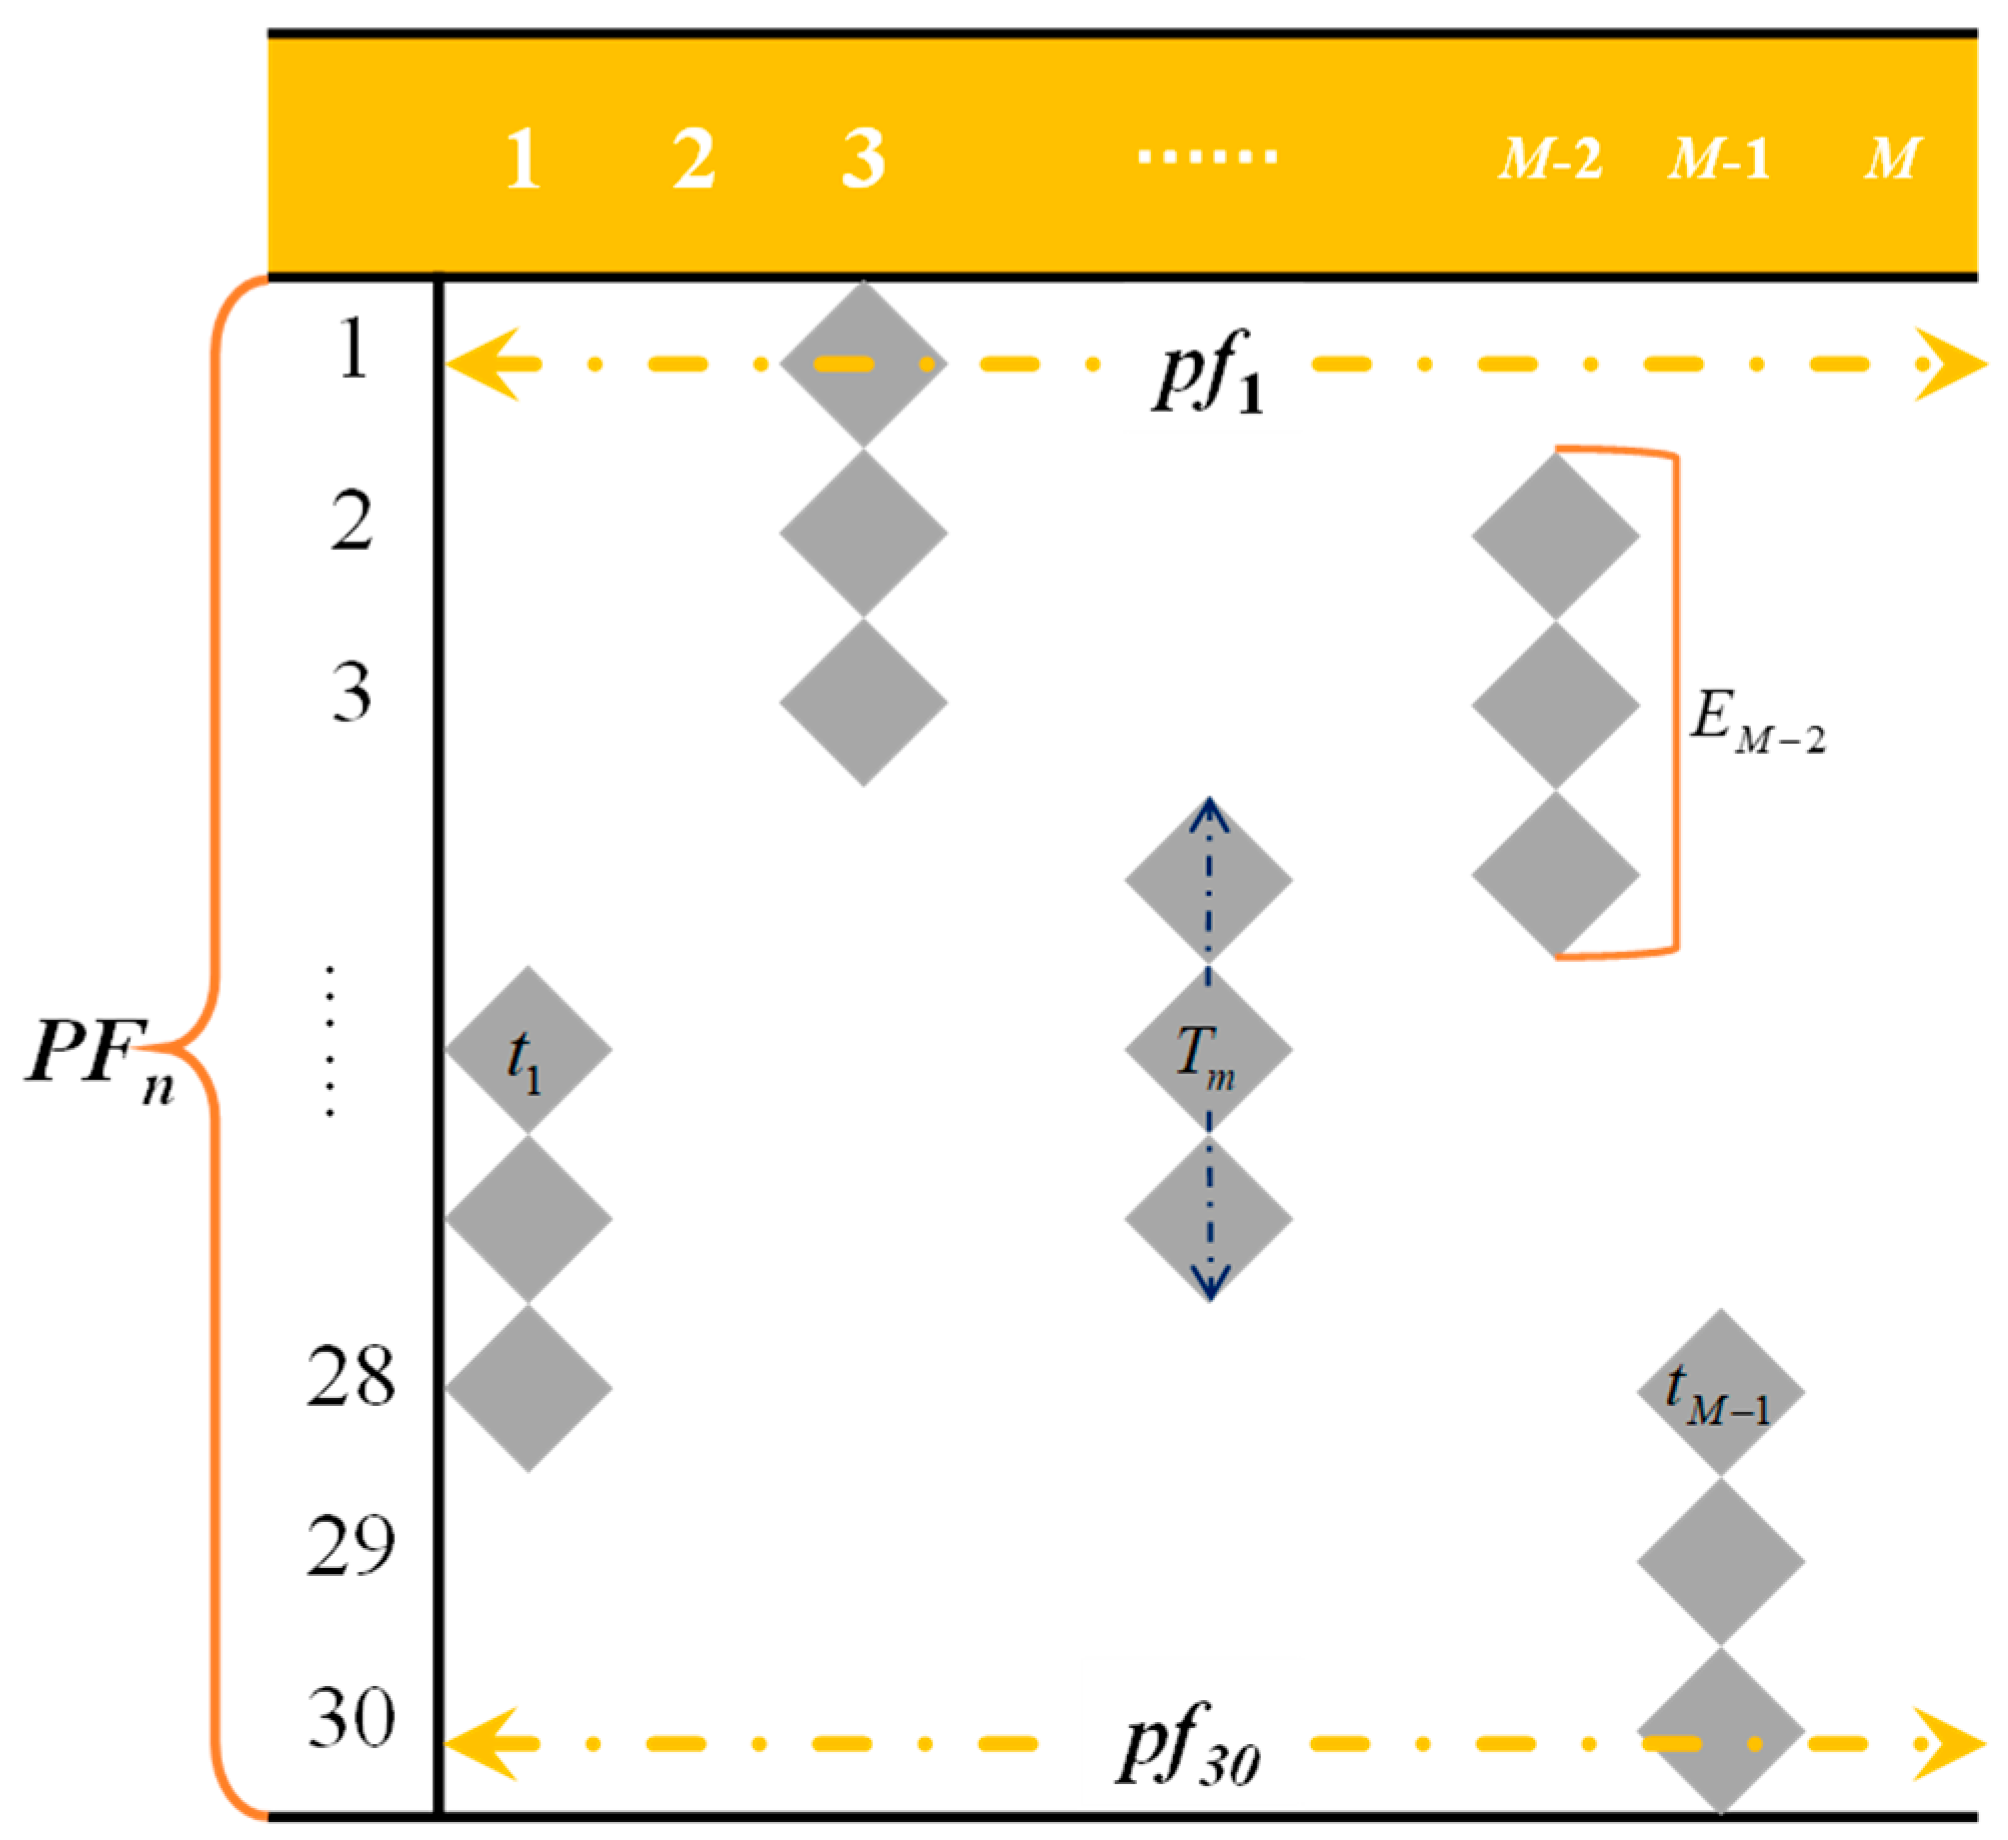
S1 as follows, using the daily set of equipment undergoing maintenance in the current month’s Gantt chart as the state:
where
denotes the element in row
i and column
m of the Gantt chart, representing the maintenance status of equipment
on day
.
Additionally, since planned power outages affect power flow, the source-load status of the power grid is also included in the state space.
where
denote the power generation and load vectors of the power grid.
The reinforcement learning state space is composed of and forming .
3.3. Action Space
For equipment
with a maintenance time window length of
, if maintenance commences at date
, the action space
for equipment
can be defined as:
Negative numbers indicate the number of days the maintenance window is advanced, while positive numbers indicate the number of days it is delayed.
The overall action space encompassing all device action spaces is defined as:
3.4. Reward Function
The reward function determines the reward an agent receives for selecting a specific action when transitioning from state
at time t to a new state
. Using Equation (8) as the mapping rule, the state evaluation function can be expressed as follows to assess the state change from
to
before and after taking an action:
In the optimization process, the number of voltage limit violations in the 39-bus system over one month is on the order of hundreds. The amount of power loss remains largely within the range of 1000 to 2000 MW. Therefore, we set a coefficient 10 in (17). Given that active network losses are typically measured in megawatts (MW) per hour and occur at the thousand-level magnitude, while the number of daily voltage exceedances in a given month is around a hundred, we set the weight for voltage exceedances to 10.
Based on the state evaluation function, the reward
can be expressed as the difference between
and
. Furthermore, to minimize labor costs in maintenance scheduling and enhance the action efficiency and reliability of the scheduling strategy, it is necessary to reduce the number of actions required to achieve optimal results.
3.5. Optimization Process Based on Deep Reinforcement Learning
To achieve intelligent optimization of power outage maintenance schedules, this paper employs a reinforcement learning approach based on Deep Q-Learning (
). First, using the method described in
Section 2.1, the raw power outage maintenance schedules submitted by operational units are converted into an initial Gantt chart
, and the corresponding power flow state
is calculated. Based on this, the outage maintenance plan is iteratively optimized through reinforcement learning. Action selection within the action space employs an ε-greedy strategy. During the action selection phase, the action index in
must be mapped to the corresponding action space and ultimately to the corresponding Gantt chart, as illustrated below.
Define
as the number of elements in the current set. The number of equipment units undergoing maintenance in the current month,
, can be expressed as:
The action index of a single device can be expressed as:
In each iteration, the current state
is computed according to Equation (2), and device
is selected. Then, an action
is chosen from the action space
of device
. Consequently, the maintenance time window for device
changes from
to
, where
can be expressed as:
At this point, the Gantt chart is iterated to based on , and the new state is computed using Equation (12).
Additionally, the reward value
is computed using Equations (16) and (17). Finally, the current state value
is calculated based on the Bellman equation, and the value function is updated, completing a full iteration of the value function.
The implementation process of deep reinforcement learning is briefly described as follows: Construct a deep neural network () based on the state space and action space to approximate the -function. The number of neurons in the output layer is 270, the network is designed with 3 hidden layers, and each layer has 256 neurons. learning rate is 0.001. The size of the replay buffer is 2000. At each time step, an action is selected using an ε-greedy policy based on the current state. The selected action is applied to the environment, observing the new state, reward, and termination status. The current experience tuple () is stored in the experience replay buffer. Randomly sample a batch of experience tuples from the experience replay buffer; compute the target -value for each tuple; update the neural network parameters via backpropagation using the mean squared error loss function to make predicted -values closer to target -values; Periodically update the parameters of the target network to align with those of the main network, stabilizing the training process; Continuously repeat the steps of sampling, storing, sampling-based updates, and target network updates until the agent converges within the environment.
4. Case Study and Result Analysis
In order to validate the effectiveness and applicability of the proposed reinforcement learning-based interpretable optimization method, this paper conducts simulation tests on the IEEE 39-node system. By comparing the reinforcement learning optimization algorithm put forward herein with the conventional Genetic Algorithm (GA) approach [
25], an assessment is made of the differences in their optimization performance with regard to the outage maintenance scheduling problem.
4.1. Simulation System Setup and Agent Training
This study utilizes the IEEE 39-bus system [
21] as the environmental platform. The system consists of 46 transmission lines and 10 generators, for a total of 56 devices (
). For the purpose of maintenance scheduling optimization simulation, the natural month length is set to 30 days (
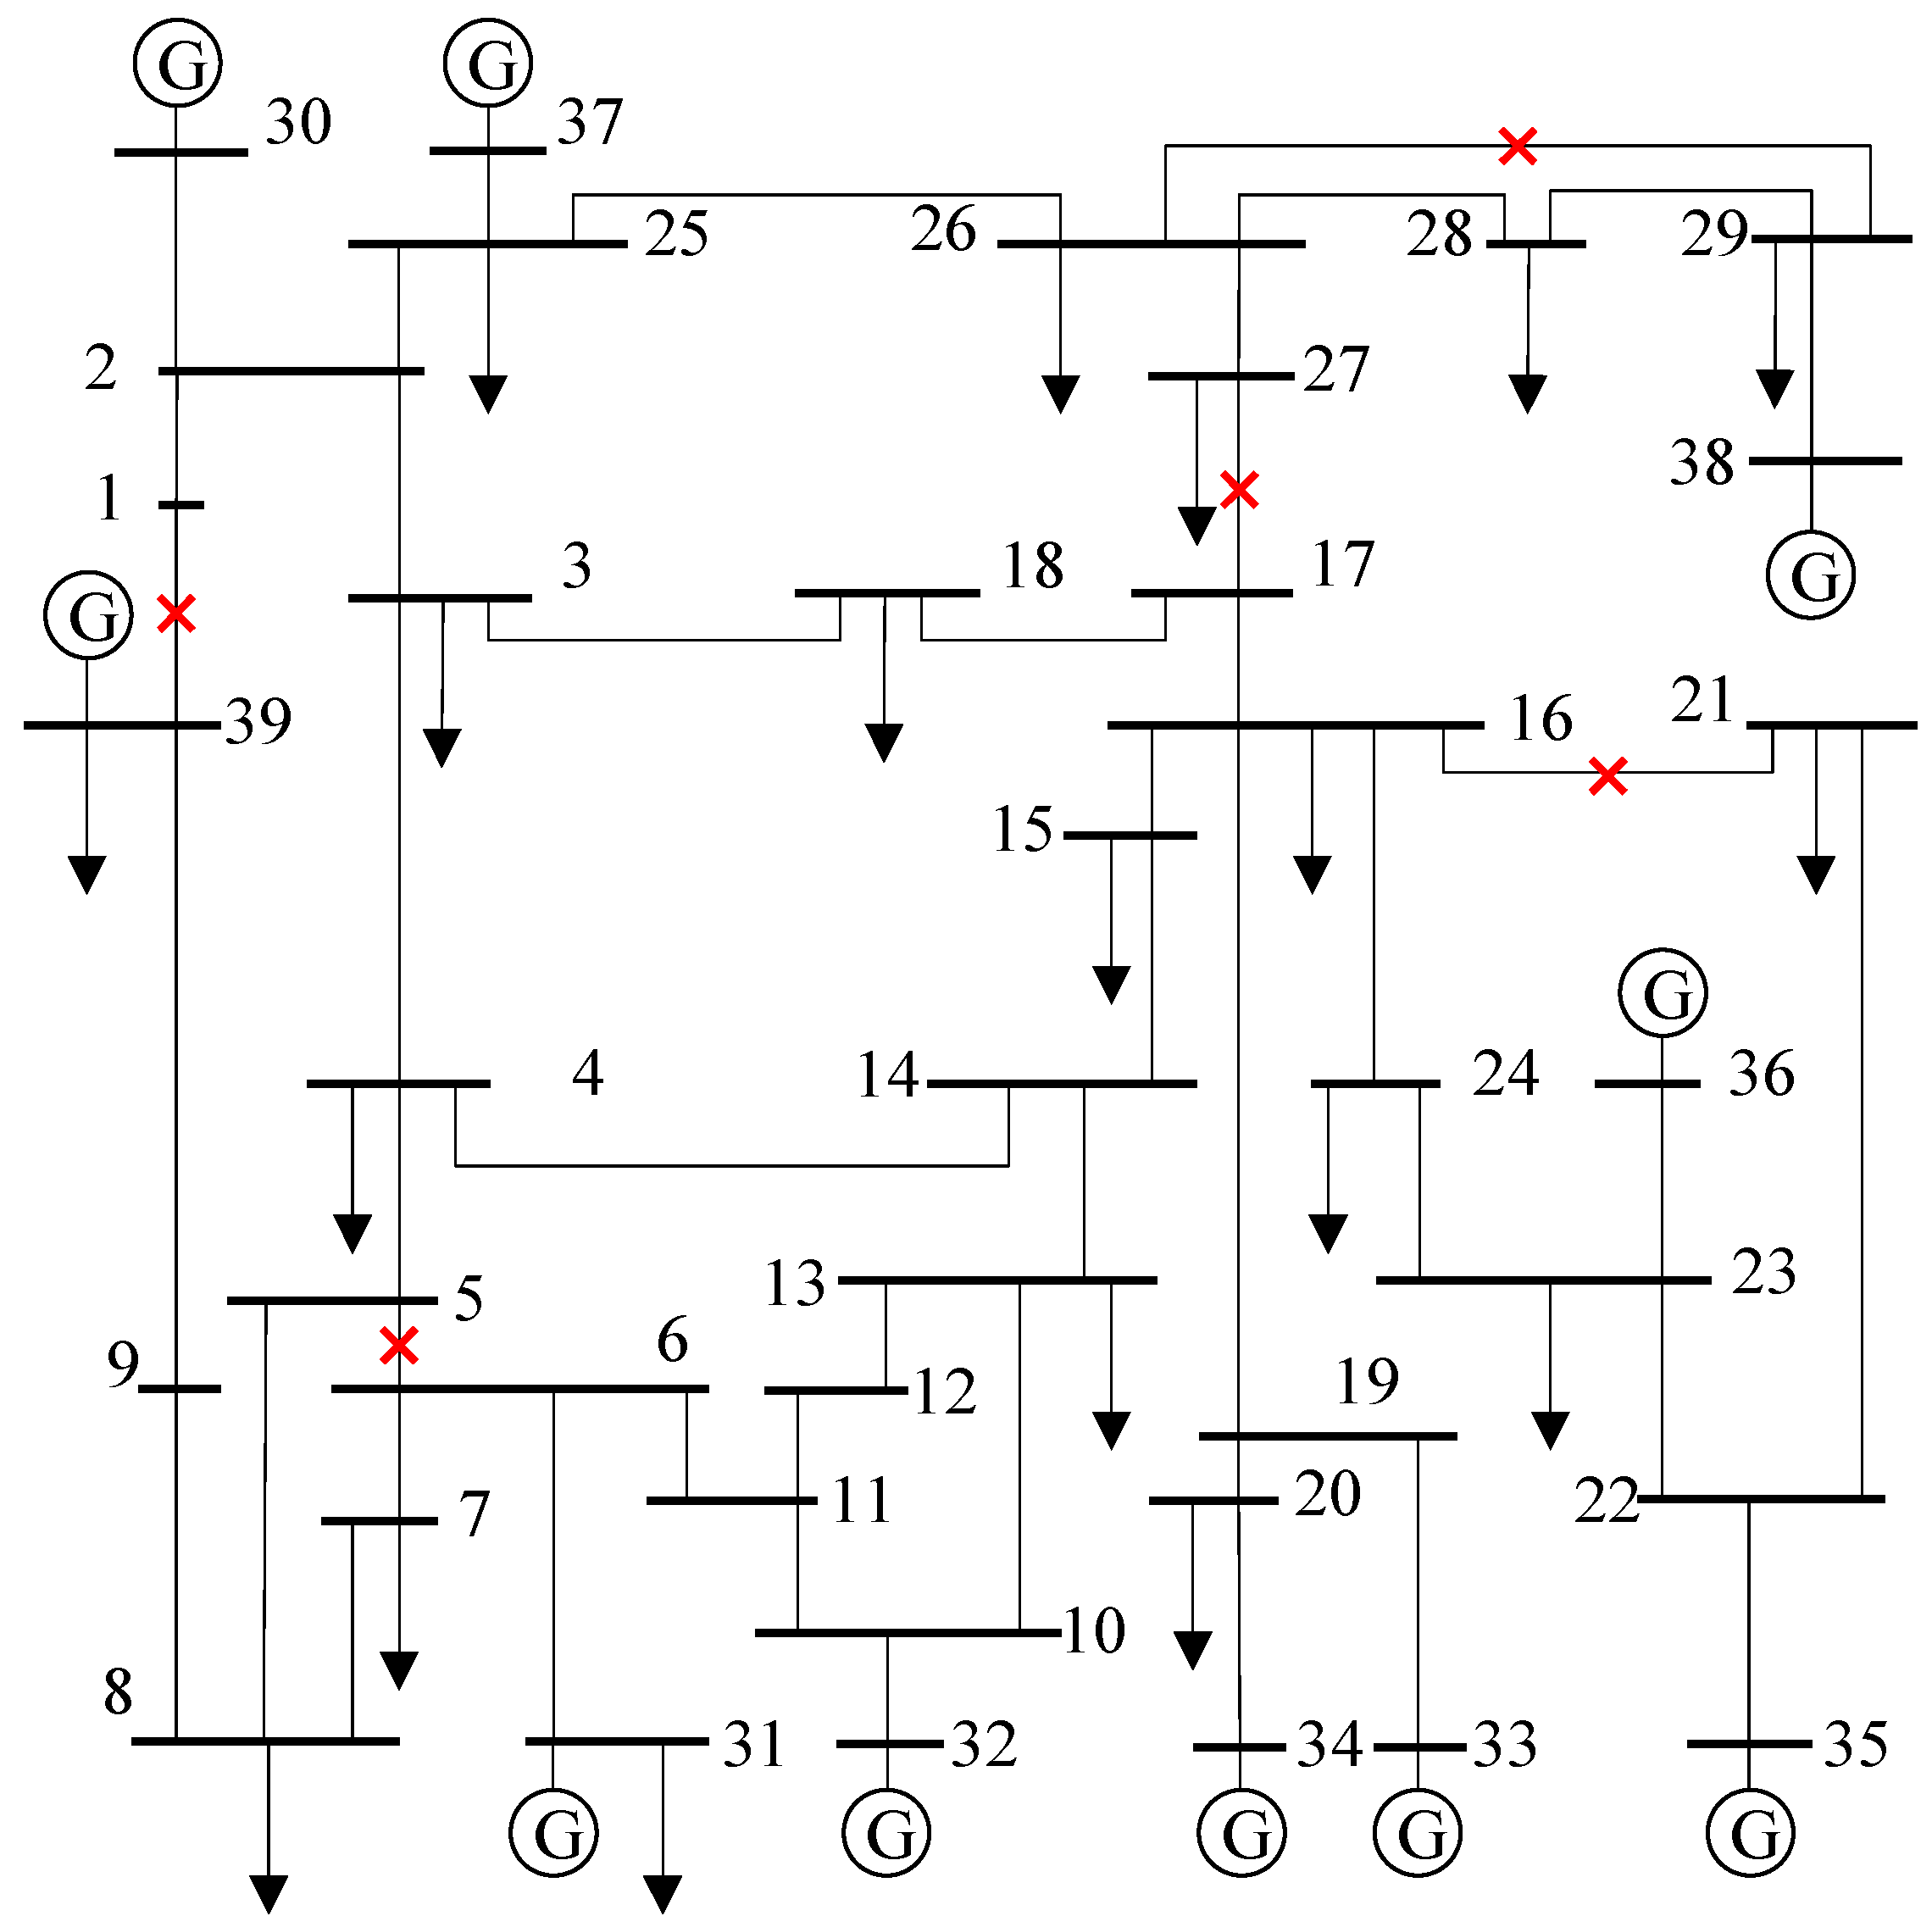
). During the simulation, five units are selected at random for maintenance. Their numbers in the system topology are designated as 2, 10, 28, 31, and 44, respectively. The system topology is illustrated in
Figure 2.
In order to standardize the maintenance conditions, the time window length for all equipment awaiting maintenance is set to days, and the initial power outage schedules are randomly assigned. The hyperparameter settings for optimization are as follows: 1200 training iterations; an initial step size of 80 for each iteration; and an exploration rate of 0.9.
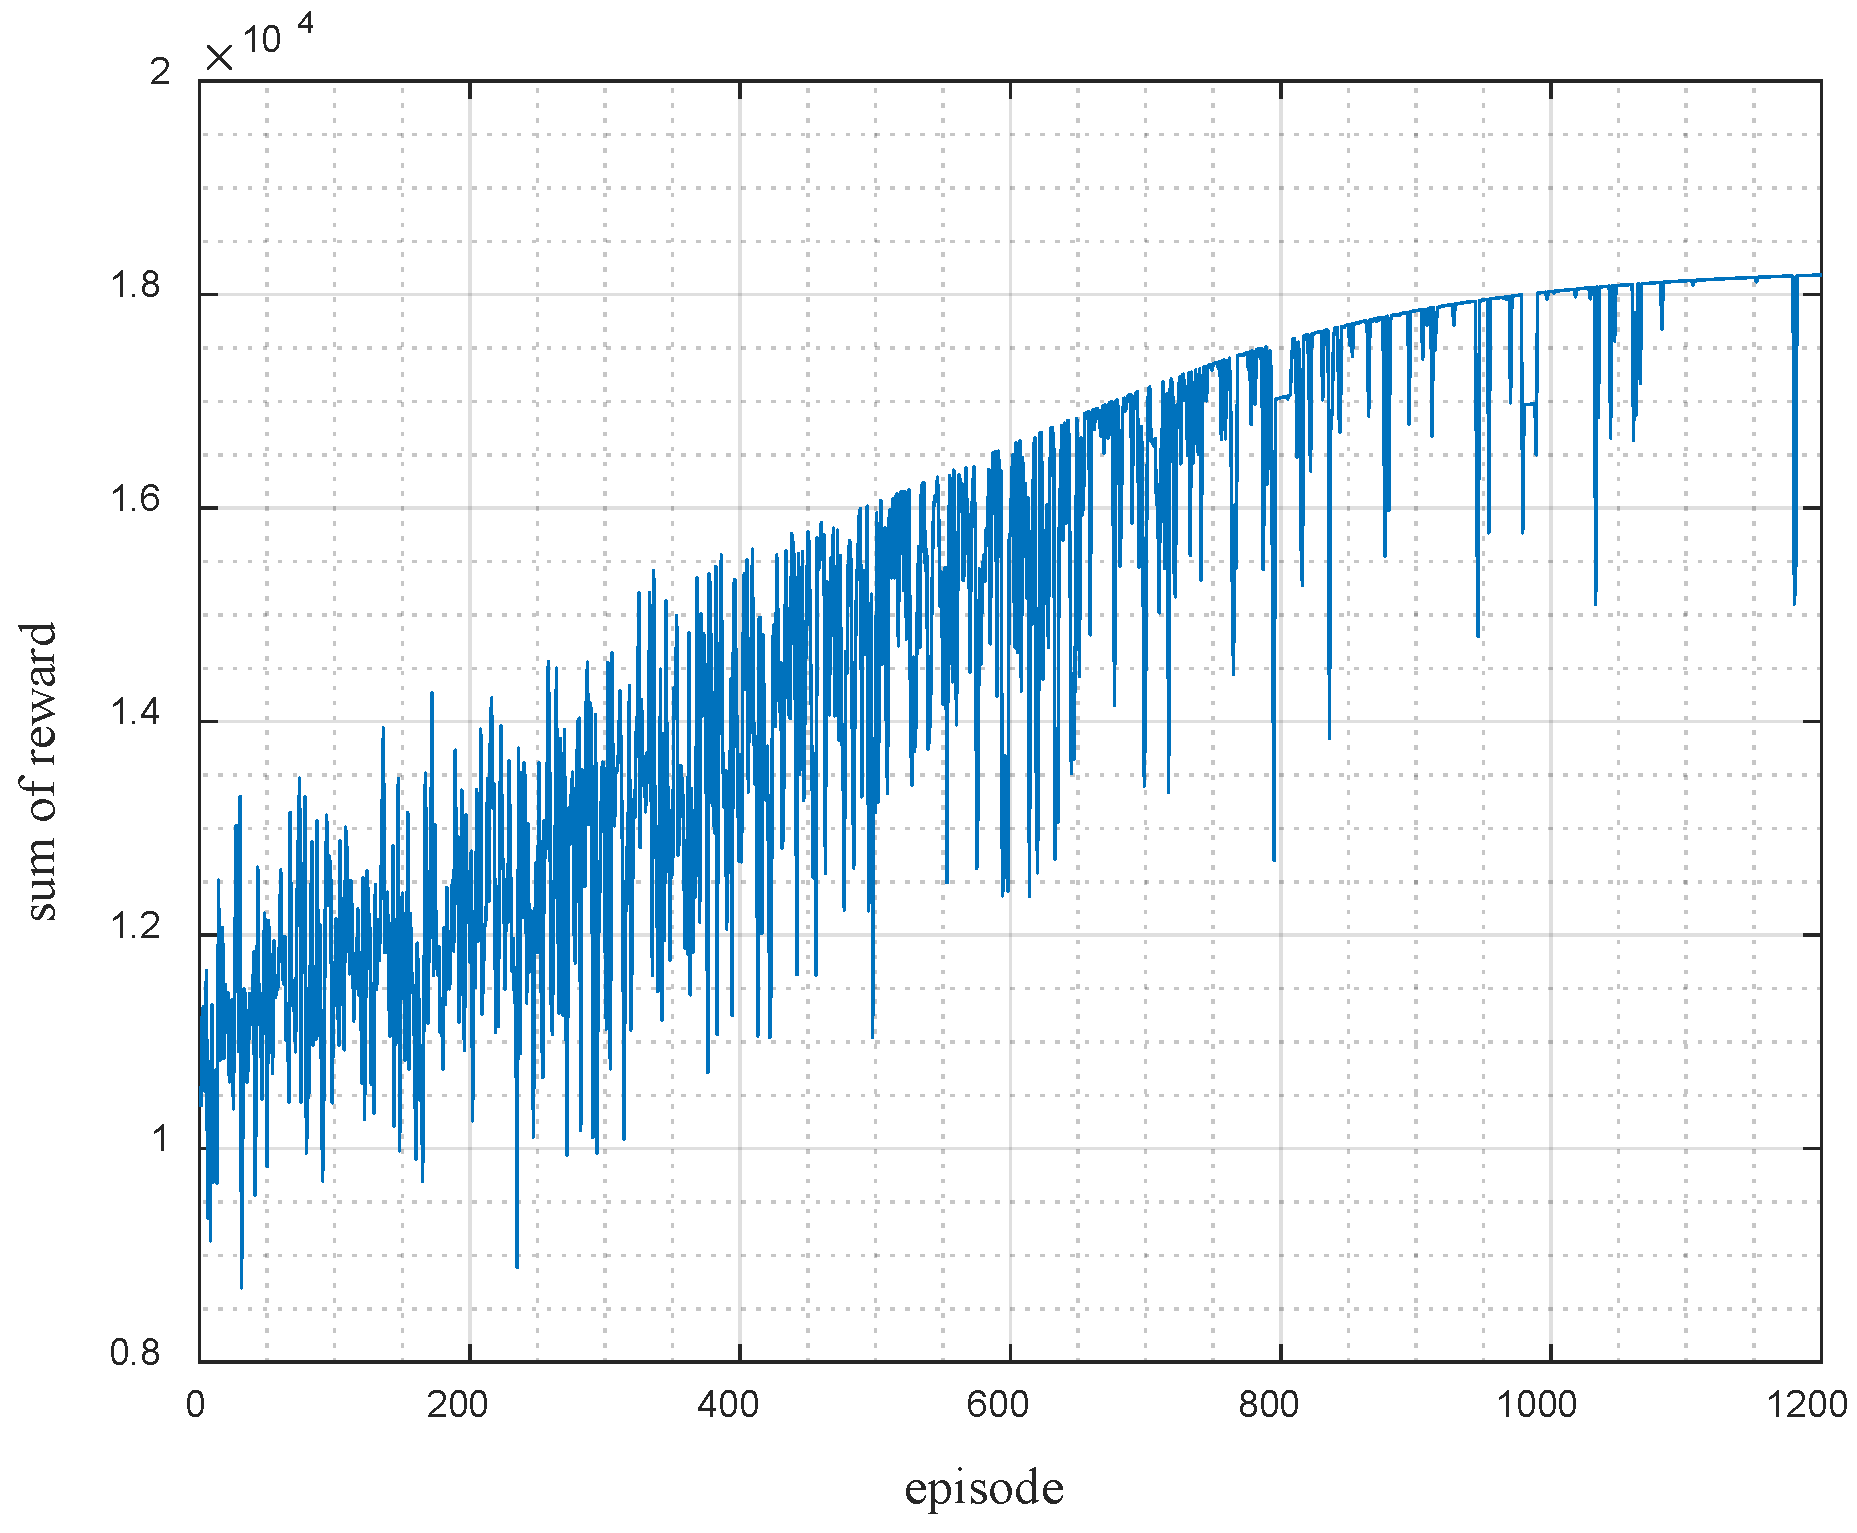
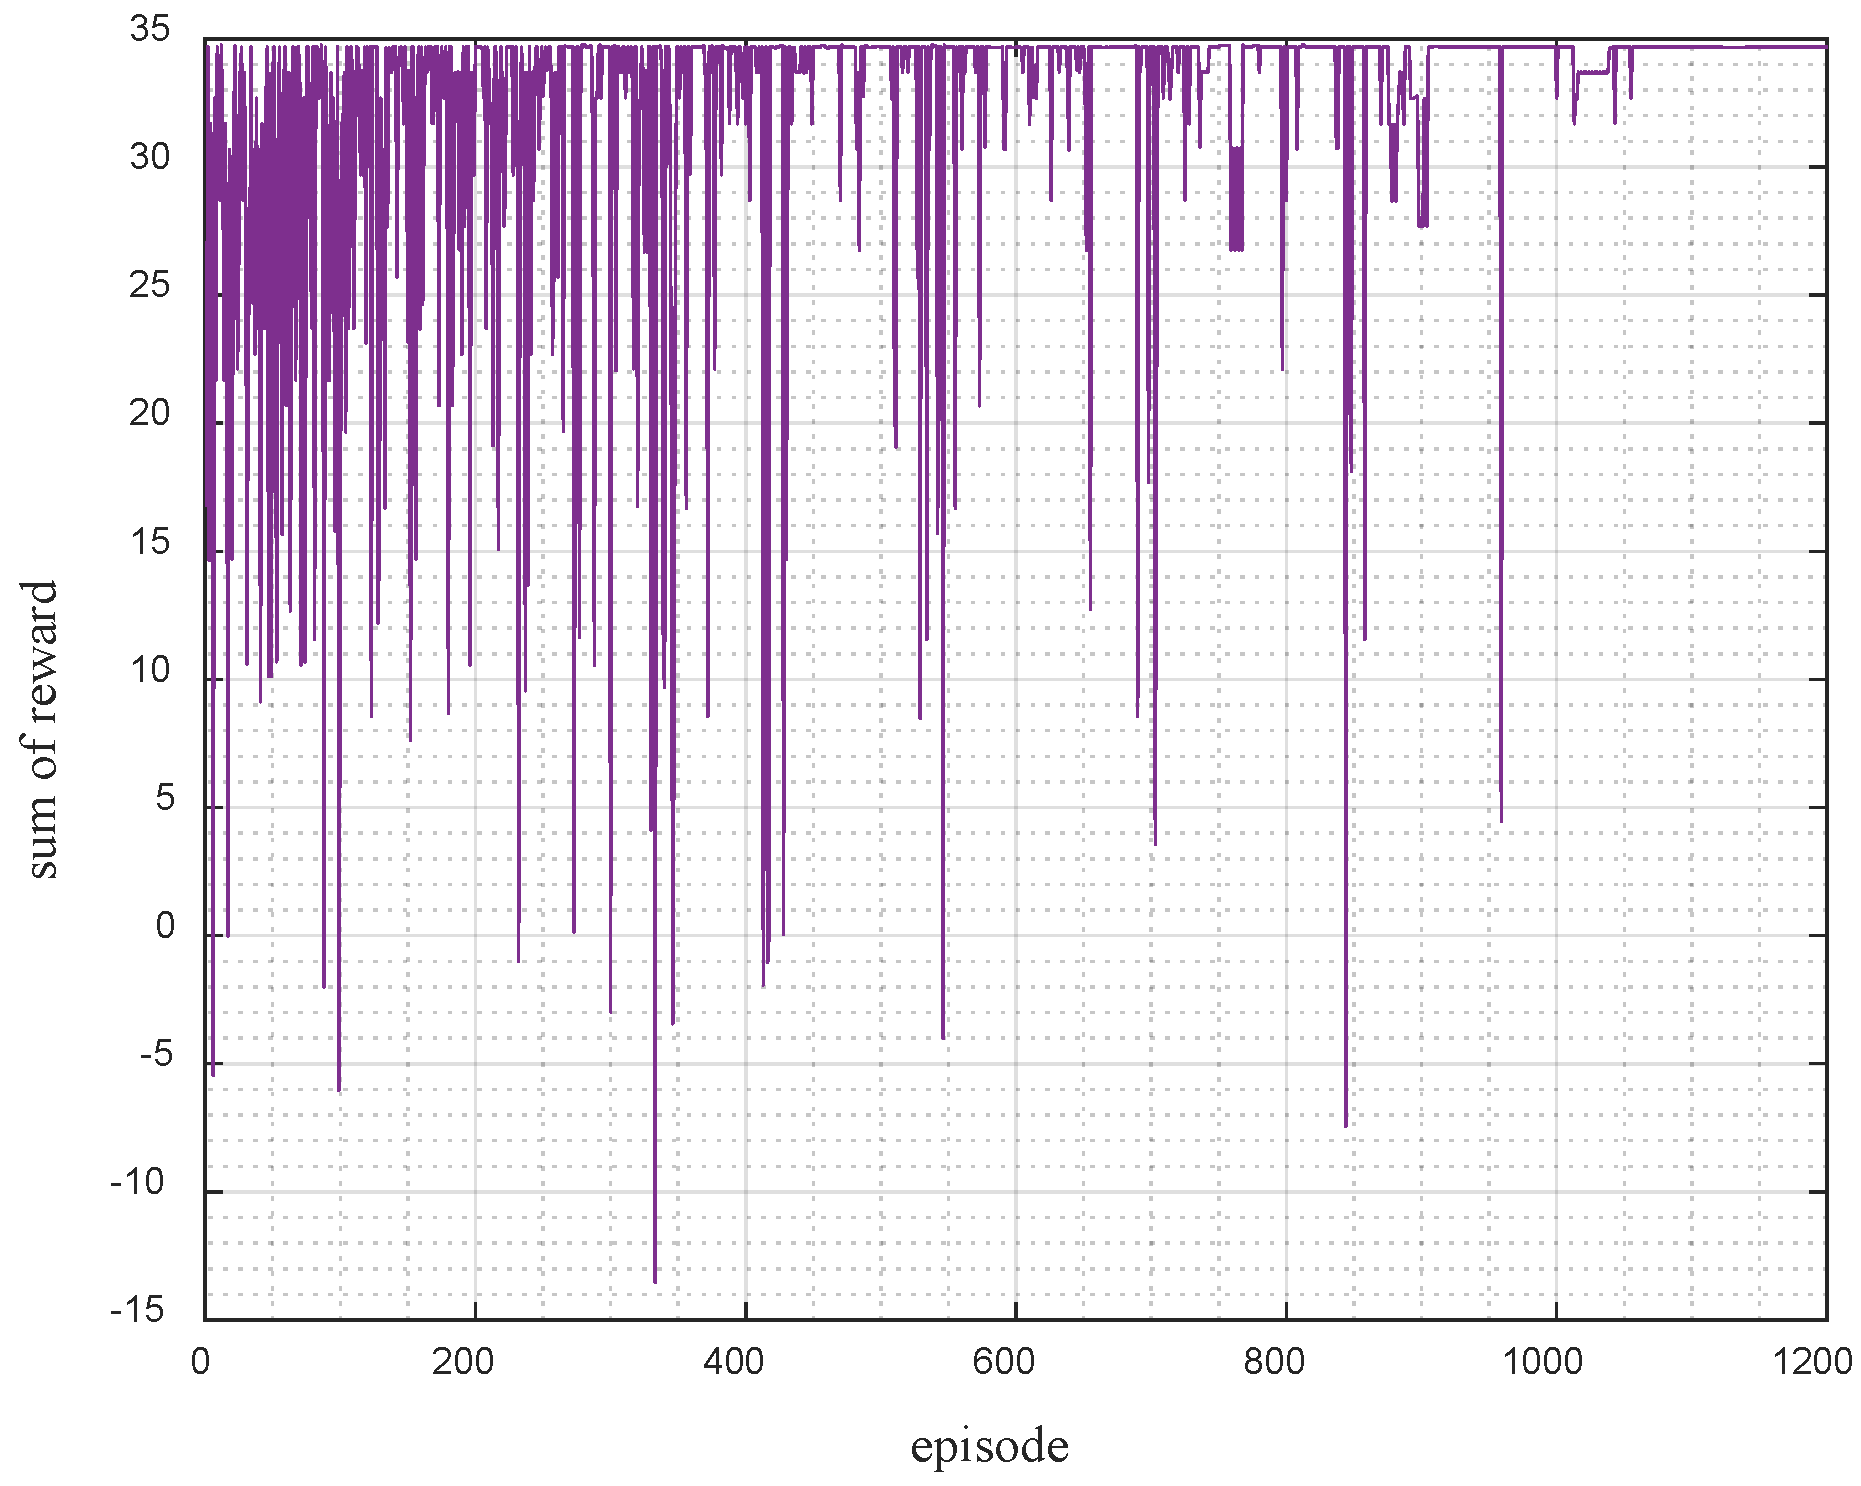
Figure 3 presents the variation trend of reward values across individual training episodes during the reinforcement learning training process. The horizontal axis represents the training episode number, and the vertical axis denotes the reward value associated with all actions performed in each episode. As observed in
Figure 3, the reward value increases consistently as training progresses and eventually stabilizes. This pattern indicates that the model gradually converges throughout the learning process, thereby achieving favorable training performance.
4.2. Interpretable Quantification Based on Shapley Value
In order to enhance the interpretability of decisions made by reinforcement learning algorithms, the present study employs the Shapley value to quantitatively analyze the marginal effects of different equipment combinations in outage scheduling.
The interpretability of key features in power outage maintenance schedules is illustrated by the following example. The selected set of maintenance equipment is represented by the following numbers:
. These numbers represent the participants in a cooperative game. According to the principles of cooperative game theory, the set of all possible cooperative combinations, denoted by
, can be expressed as follows:
where
denotes the variance of each element in the power outage maintenance schedules
;
represents the maximum number of outage facilities at any given moment within the outage plan.
The Shapley value calculation uses the composite objective function defined in Equation (8) as the cooperative benefit function . Using historical data from the existing grid topology, we evaluate the marginal contribution of each equipment combination to grid operational performance.
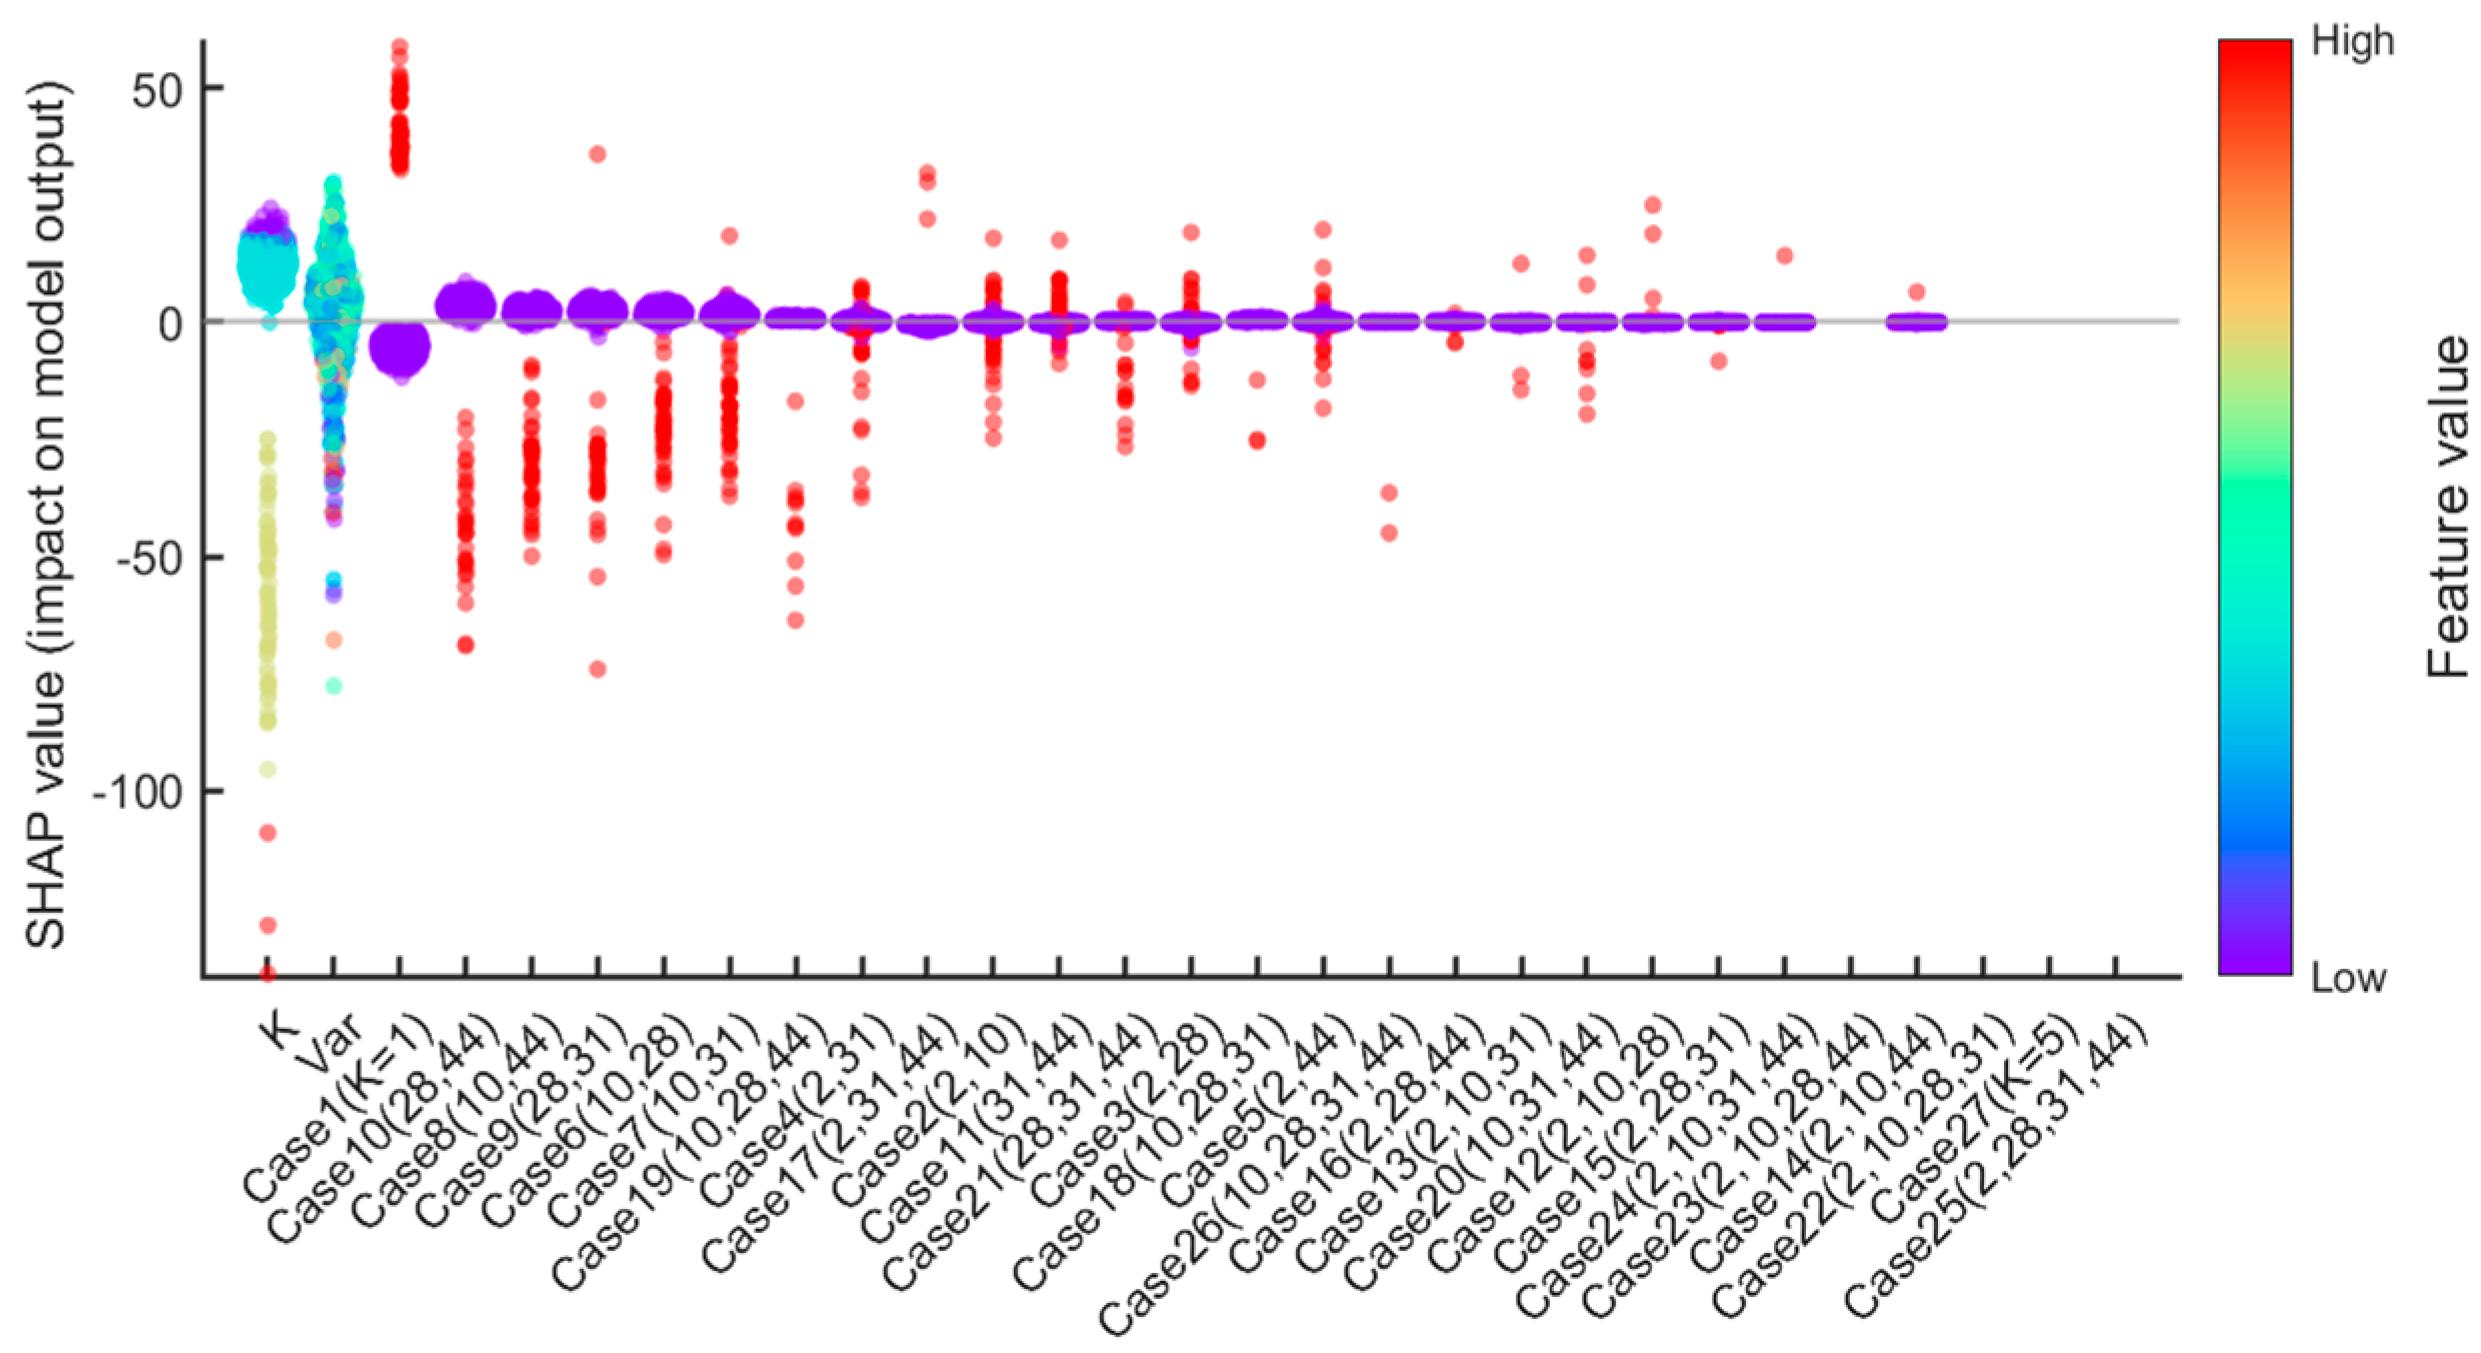
As illustrated in
Figure 4, the Shapley values for each feature are presented. The horizontal axis signifies the corresponding influencing factor, with each factor encompassing all historical samples. The vertical axis of this figure indicates the Shapley value for a given factor, while the color axis denotes the magnitude of the feature value for each historical sample. In this context, purple signifies smaller values and red indicates larger values. The greater the dispersion of data points across different colors, the more significant the feature’s impact on optimization results, warranting particular attention during the optimization process.
Figure 3 reveals that feature
exhibits the most pronounced impact, with a distinct red-purple boundary. The red data points, which correspond to larger
values, exert a negative influence on the objective function and reduce grid stability. In contrast, purple data points correspond to smaller
values, which have been shown to enhance grid stability. However, the variance of the power outage maintenance schedules
exhibits a weaker influence. The data points, which are represented by various colors, are intermingled along this feature axis, thereby obscuring the clear delineation of correlation boundaries. This finding suggests that the variance of the power outage maintenance schedules
offers a limited degree of insight into grid performance. The other operational condition features demonstrated an absence of distinct color boundaries, suggesting their negligible contribution to the objective function. The problem of optimizing the outage schedule can be conceptualized as a non-convex, high-dimensional NP-hard problem. Without extracting key features, the problem becomes significantly more difficult to solve. The present study employs the Shapley value method, a technique that has been demonstrated to enhance computational efficiency and improve interpretability of reinforcement learning.
4.3. Analysis of Optimization Results
This study employs the reinforcement learning algorithm proposed in this paper to optimize the power outage maintenance schedules for the IEEE 39-bus system. Herein, the action space for a single equipment can be formulated as follows:
The operational space of all equipment can be represented as:
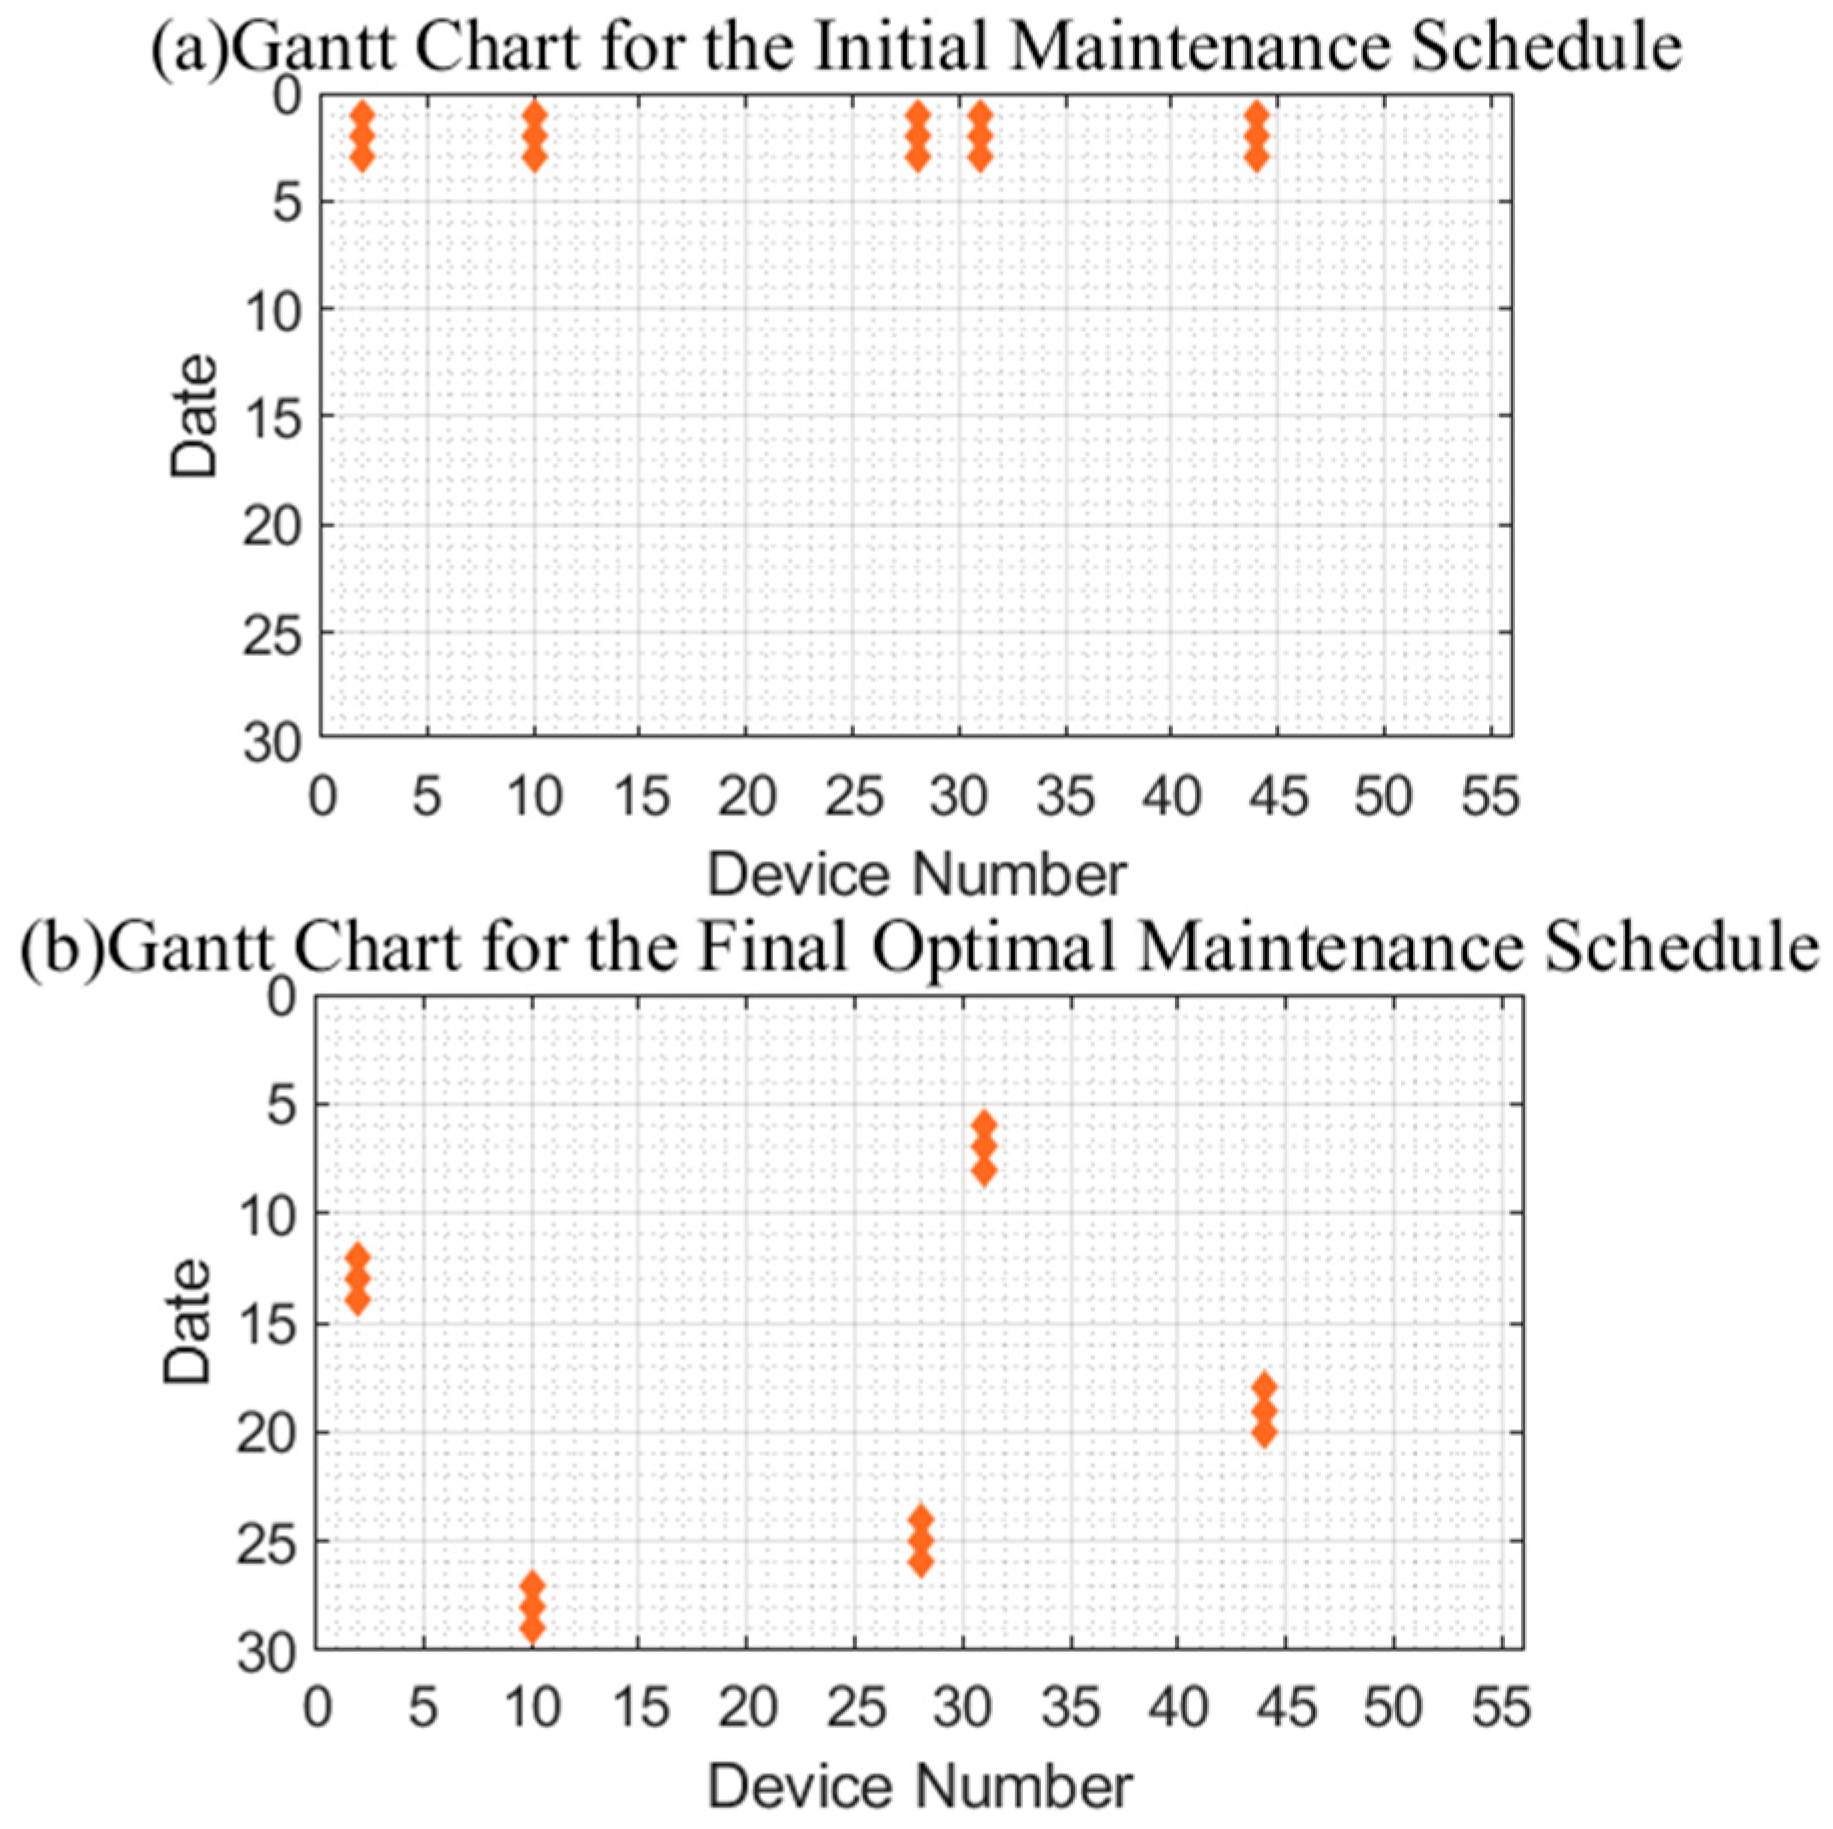
Figure 5 illustrates the differences in the equipment maintenance schedule before and after optimization;
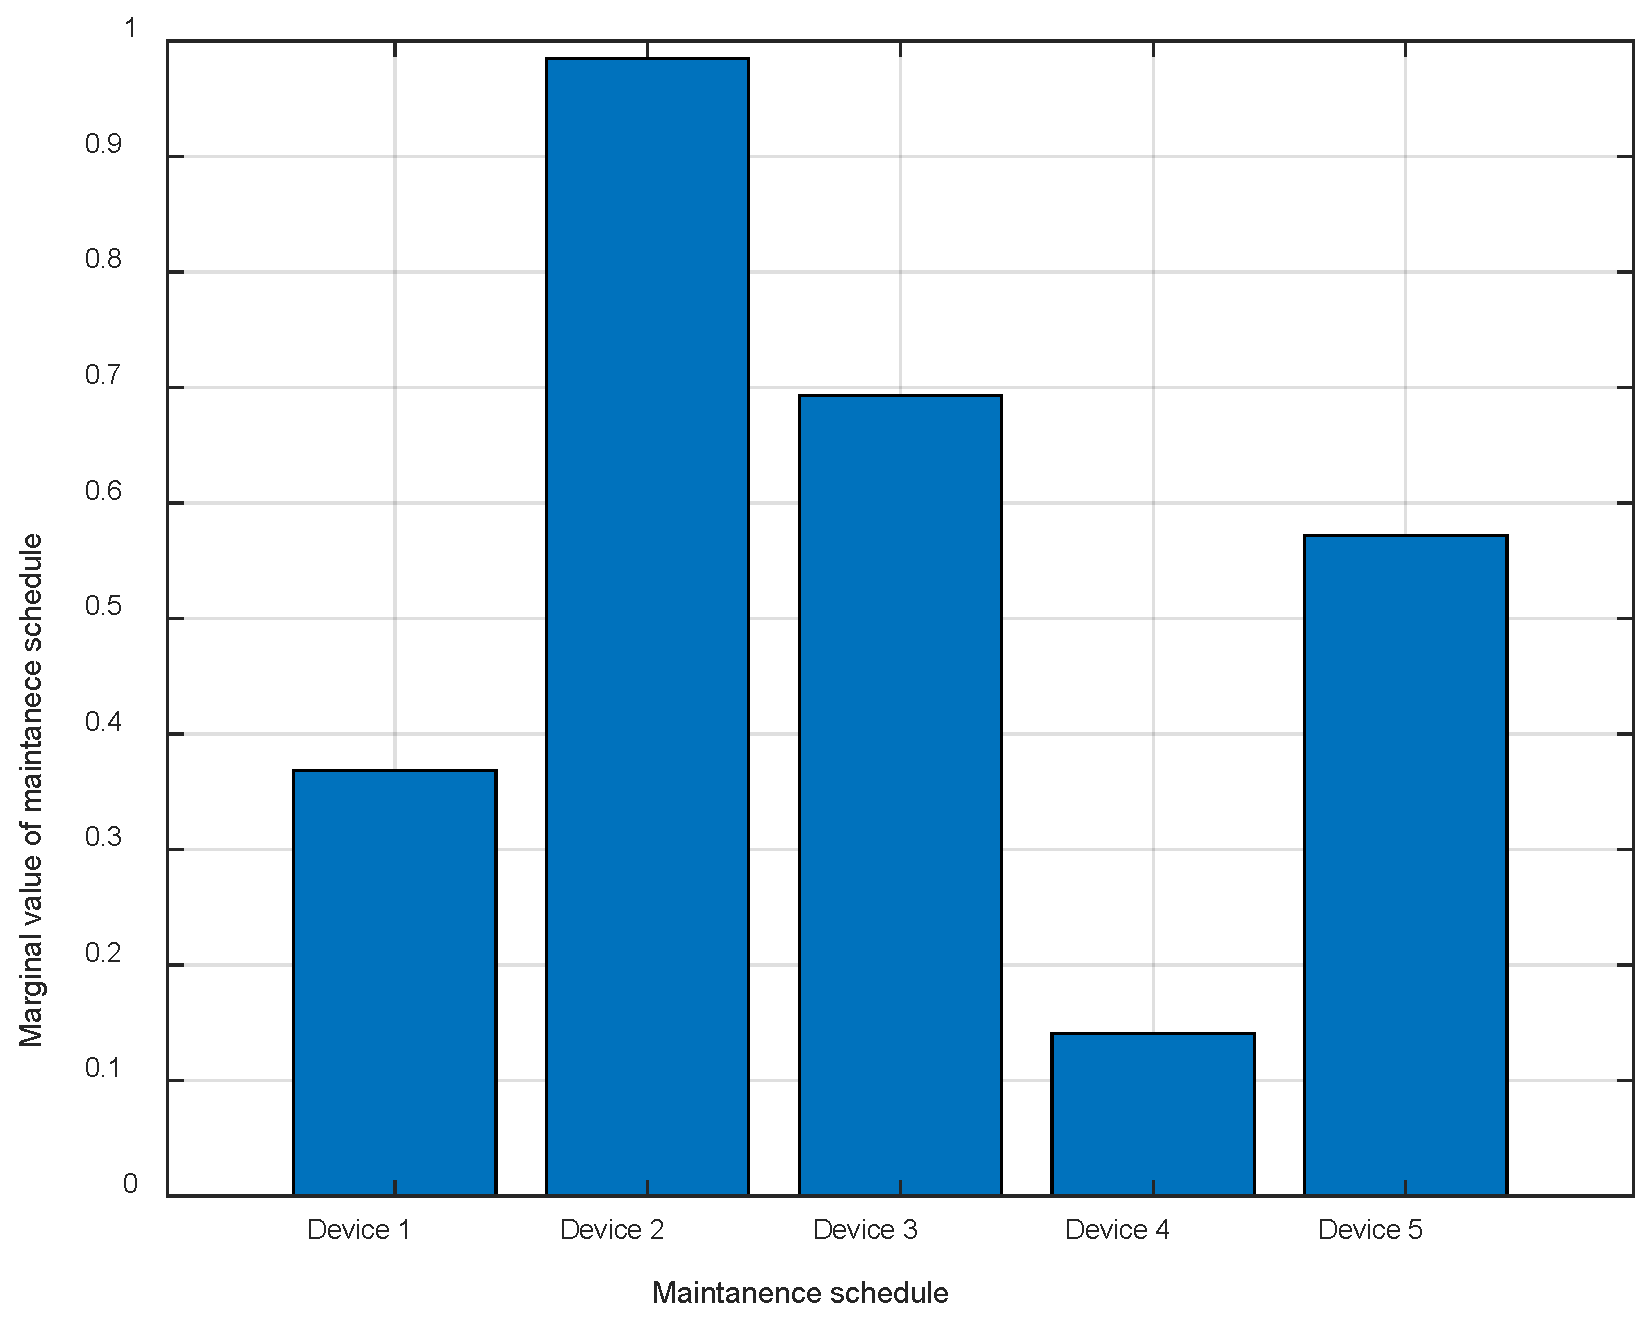
Figure 6 employs the Shapley value to demonstrate the interpretability of power outage maintenance schedules optimization.
Figure 7 and
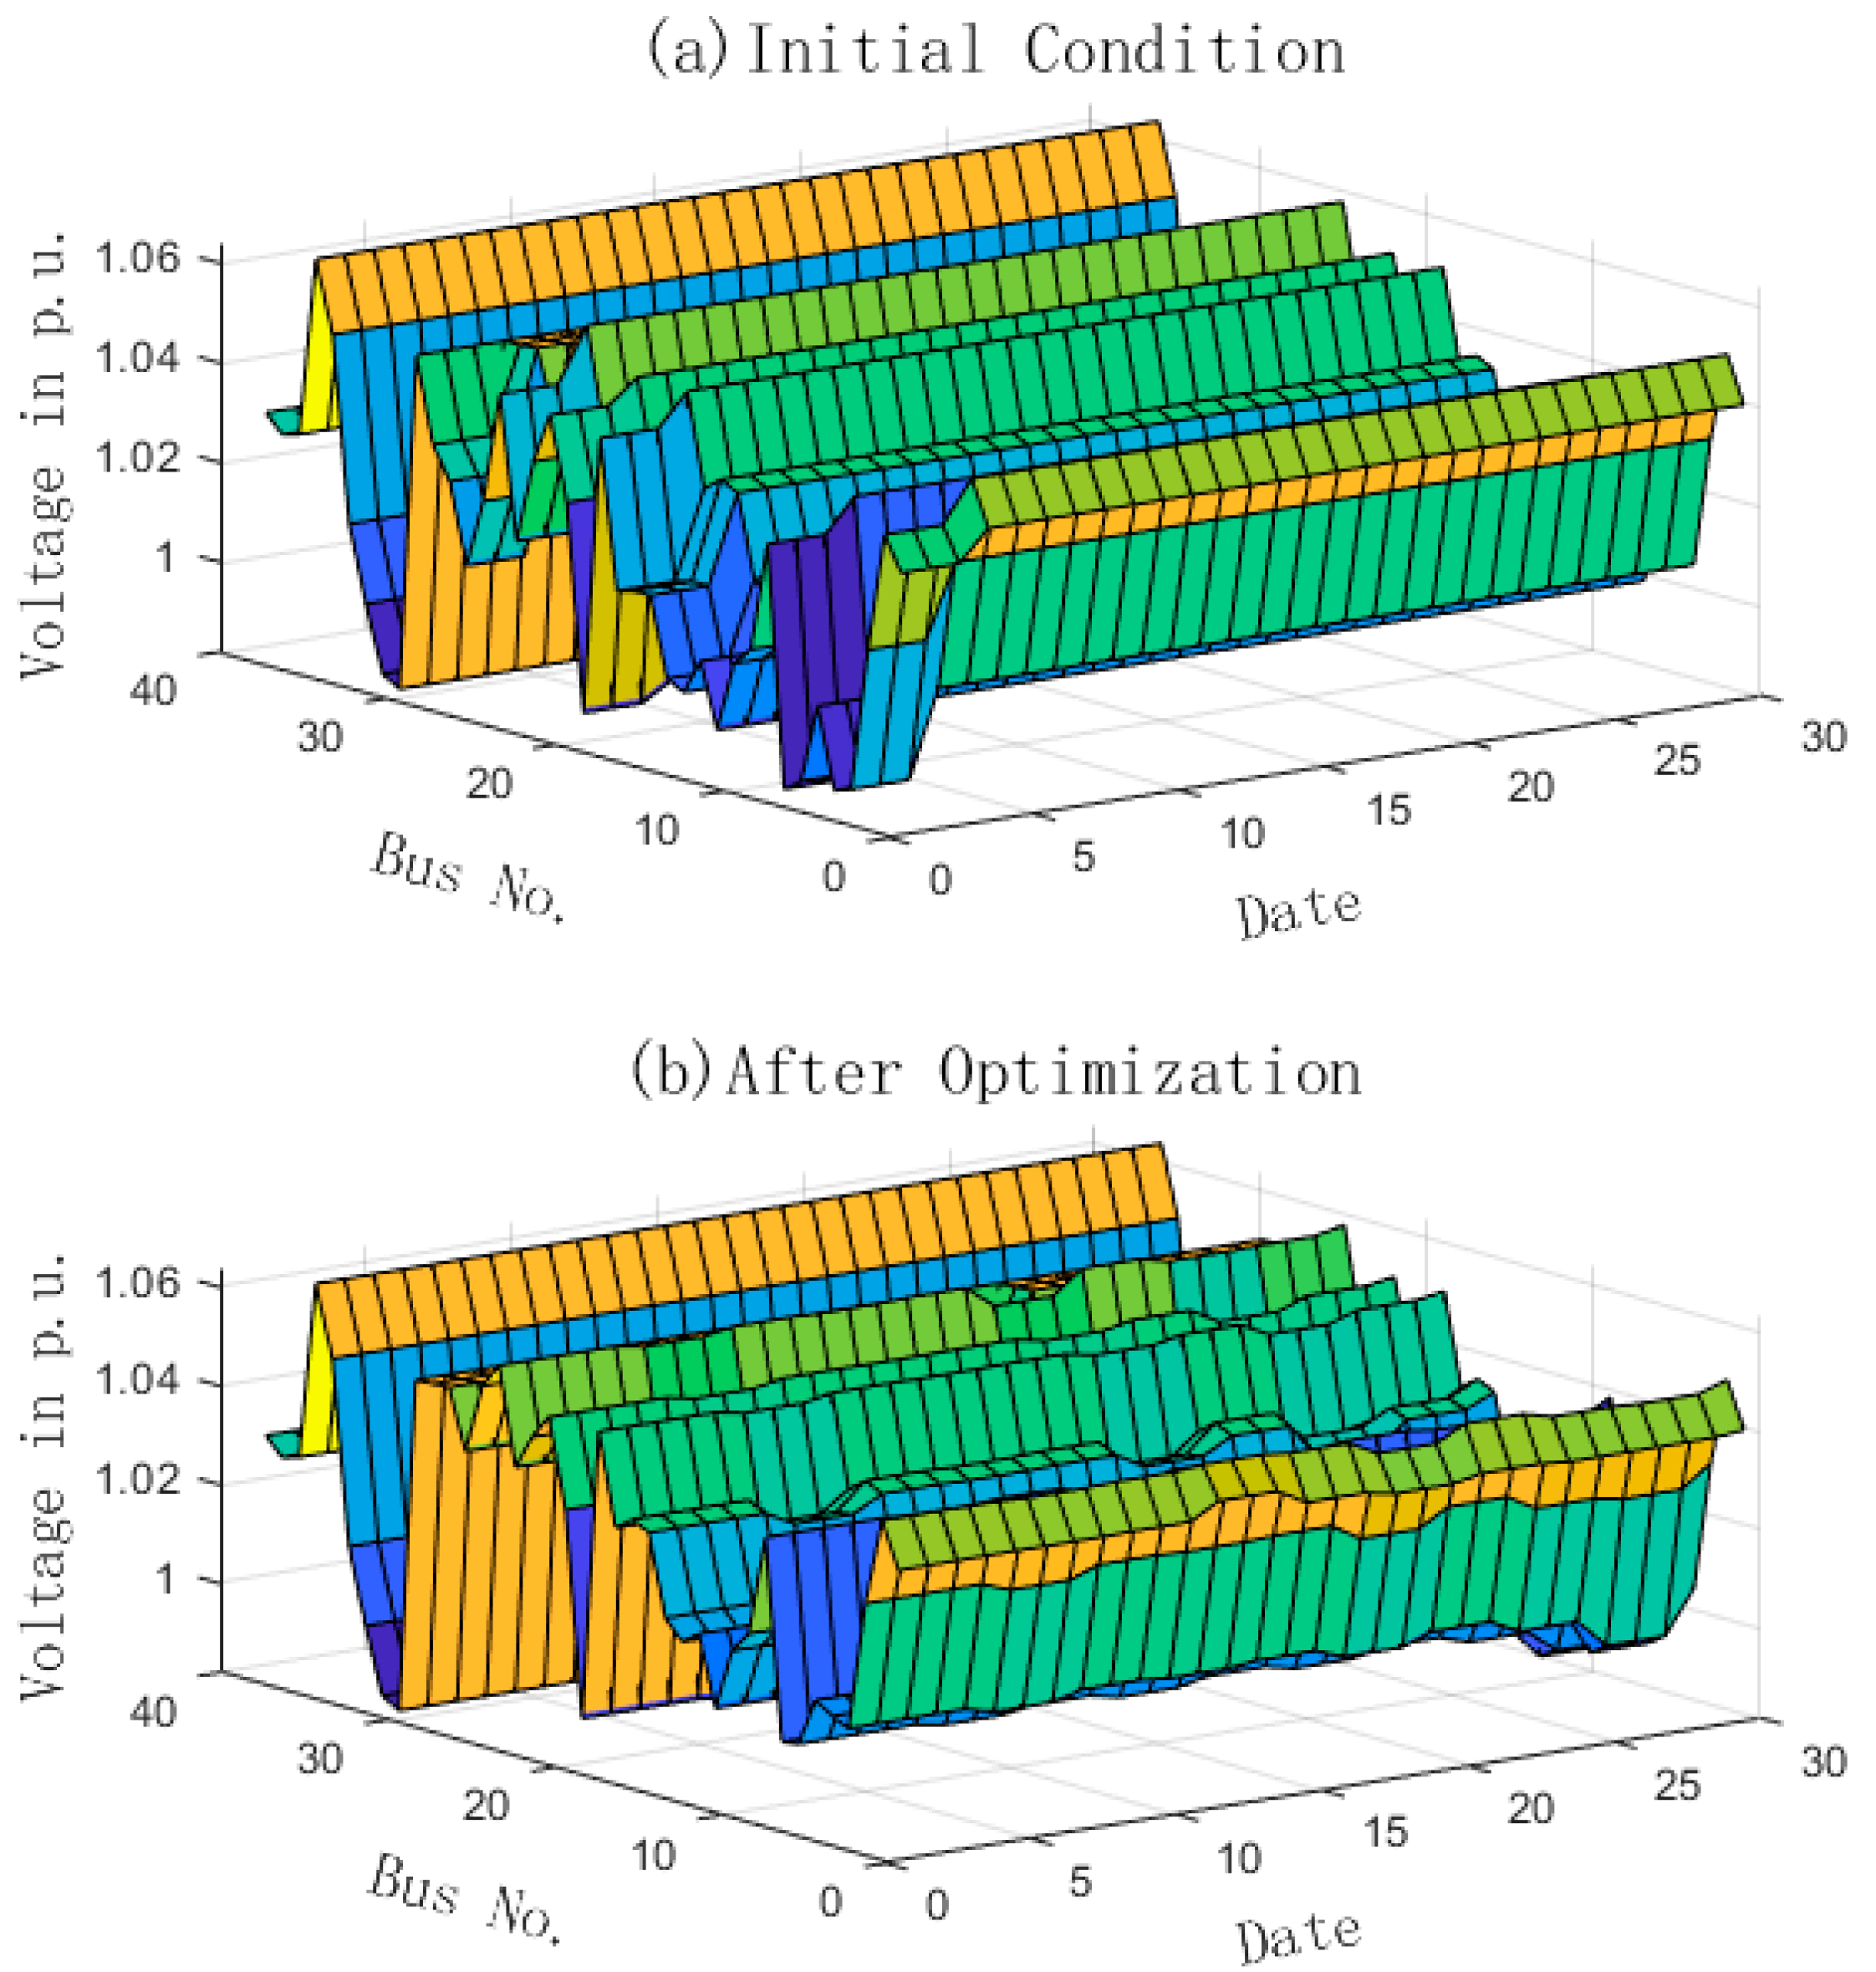
Figure 8, in turn, present the number of violation occurrences, active power losses, and the number of power flow non-convergence events.
Figure 5 provides a visual comparison of the equipment maintenance schedule before and after optimization.
Figure 5a illustrates the initial maintenance plan. The horizontal axis represents equipment IDs, and the vertical axis denotes dates within calendar months. As can be seen in the figure, all equipment outages in the original plan were concentrated at the beginning of the month, indicating significant resource congestion and operational risk.
Figure 5b shows the scheduling results after optimizing the reinforcement learning algorithm. Maintenance periods for each piece of equipment are now dispersed throughout the month, which significantly improves resource allocation and system safety. From the perspective of state variables, the pre-optimization system state was
, meaning the maximum number of equipment units undergoing maintenance on a single day was five. Post-optimization, the state decreased to
, leading to a more balanced distribution of system load. This validates the significant optimization achieved in state scheduling performance.
To demonstrate the interpretability of the power outage maintenance schedules optimization results, this paper treats each entry in the power outage maintenance schedules as a participant in a cooperative game. It randomly records the adjustment outcomes of 1000 iterations, which means, randomly adjusting each power outage plan, obtaining reward/penalty values based on the reward function, normalizing them, and then calculating the marginal effect of each entry’s contribution to the adjustment. The results are shown in
Figure 6. It can be observed that the marginal effect of contribution value for adjustment item 2 is the highest. Combined with the optimization results in
Figure 5, the second item exhibits the largest adjustment magnitude for equipment, explaining the optimization outcomes.
Figure 7 shows a comparison of active power losses across system branches before and after optimization. The horizontal axis represents the date, the vertical axis denotes branch numbers, and the depth dimension (
z-axis) shows the active power loss value for each branch on a given date.
Figure 7a is plotted based on the initial maintenance plan, showing that the active network losses of each branch across different dates are relatively scattered and generally at a high level.
Figure 7b, by contrast, is based on the optimized scheme; the active power losses of all branches are significantly reduced and more uniformly distributed, which reflects the effectiveness of the proposed method in lowering the network’s operational energy consumption. In the case study, the average daily reduction in active power losses reaches 50 MWh per month.
Figure 8 compares the voltage magnitudes at various nodes before and after optimization.
Figure 8a illustrates the voltage scaling value distribution under the original plan, revealing significant voltage violation issues in some nodes.
Figure 8b corresponds to the optimized plan. In this plan, voltages are maintained within a more stable range. This results in an improvement in system voltage quality.
To further validate the comprehensive performance of the algorithm proposed in this paper, this study selects the Genetic Algorithm (GA) optimization algorithm [
20] as a benchmark. Additionally, the reinforcement learning algorithm results presented in the table correspond to scenarios where the Shapley value is not considered—specifically, the maximum number of outage devices at a single time (denoted as
) in the outage plan is not incorporated into the state space. In contrast, the interpretable reinforcement learning algorithm accounts for the interpretable insights derived from the Shapley value. This study conducts comparative analyses on metrics, including monthly voltage violation occurrences, total active power losses, and computational time within the optimization objectives.
Table 1 presents a comparison of the results of the five algorithms. Power outage maintenance schedules optimization can be considered an NP-hard problem. By introducing the Shapley value, this research enhances the interpretability and computational efficiency.
The experimental results indicate that the explainable reinforcement learning method proposed in this paper not only outperforms traditional algorithms in terms of optimization quality but also demonstrates higher efficiency in terms of optimization time. It can complete maintenance scheduling optimization tasks in complex power grid environments more rapidly, thereby exhibiting strong potential for engineering applications.
According to
Table 1, the last column represents the method proposed in this article, and compared to the first three columns, each row represents an improvement in different aspects. The host processor used in this paper is an Intel i9 processor with an 8-core and 16-thread architecture. The memory used is 512 GB, and the GPU is GeForce RT 3070 Ti. The computational time depends on the hyperparameter tuning. Above mentioned algorithms have been tuned based on experience, but parameters can be changed in different scenarios. By integrating interpretability, the key feature of the problem is quantified and involved in the solving process, which accelerates the processing duration.
4.4. Scalability Study in IEEE 118 Bus System
To evaluate the performance of the proposed method, we implement out algorithm into IEEE 118 bus system. The accumulated reward in each episode is given in
Figure 9 and the optimization results are demonstrated in
Table 2. The computational time for IEEE 118 bus system is 1.2 h.
We select five lines to maintain in the month, whose index are 24, 118, 152, 169, 170. The initial start date is set to the first day for all selected lines. The outage duration is randomly from three days to five days. After optimization, outage schedule for device 24 is from 7th to 9th of the month, device 118 closes from 8th to 11th, device 152 maintains from 14th to 16th, device 169 trips from 24th to 26th, and the outage schedule of device 170 is from 2nd to 4th of the day. The reward results show that the agent converges to average maximum reward after 1000 episodes. The optimal maintenance outage scheduling improves the system performance in voltage violation, and losses. The number of the voltage
