Article

Modeling of Electric Vehicle Energy Demand: A Big Data Approach to Energy Planning

by
Iván Sánchez-Loor
1 and
Manuel Ayala-Chauvin
2,*
1
Maestría en Big Data y Ciencia de Datos, Centro de Investigación en Mecatrónica y Sistemas Interactivos (MIST), Facultad de Ingenierías, Universidad Tecnológica Indoamérica, Ambato 180103, Ecuador
2
Centro de Investigación en Ciencias Humanas y de la Educación (CICHE), Facultad de Ingenierías, Universidad Tecnológica Indoamérica, Ambato 180103, Ecuador
*
Author to whom correspondence should be addressed.
Energies 2025, 18(20), 5429; https://doi.org/10.3390/en18205429
Submission received: 29 August 2025 / Revised: 29 September 2025 / Accepted: 11 October 2025 / Published: 15 October 2025
(This article belongs to the Section E: Electric Vehicles)

Abstract

The rapid expansion of electric vehicles in high-altitude Andean cities, such as the Metropolitan District of Quito, Ecuador’s capital, presents unique challenges for electrical infrastructure planning, necessitating advanced methodologies that capture behavioral heterogeneity and mass synchronization effects in high-penetration scenarios. This study introduces a hybrid approach that combines agent-based modelling with Monte Carlo simulation and a TimescaleDB architecture project charging demand with quarter-hour resolution through 2040. The model calibration deployed real-world data from 764 charging points collected over 30 months, which generated 2.1 million charging sessions. A dynamic coincidence factor ( F C = 0.222 + 0.036 e ( 0.0003 n ) ) was incorporated, resulting in a 52% reduction in demand overestimation compared to traditional models. The results for the 2040 project show a peak demand of 255 MW (95% CI: 240–270 MW) and an annual consumption of 800 GWh. These findings reveal that non-optimized time-of-use tariffs can generate a critical “cliff effect,” increasing peak demand by 32%, whereas smart charging management with randomization reduces it by 18 ± 2.5%. Model validation yields a MAPE of 4.2 ± 0.8% and an RMSE of 12.3 MW. The TimescaleDB architecture demonstrated processing speeds of 2398.7 records/second and achieved 91% data compression. This methodology offers robust tools for urban energy planning and demand-side management policy optimization in high-altitude contexts, with the source code available to ensure reproducibility.

1. Introduction

1.1. Context and Motivation

Quito, the capital of Ecuador and a UNESCO World Heritage site, faces the dual challenge of upholding its commitment to environmental sustainability while adapting to rapid urban electrification. The city’s unique geographical characteristics, including its high altitude (2850 m), complex topography, and a remarkably stable average annual temperature of around 14 °C (57 °F), create distinct conditions for the adoption of electric vehicles that differ significantly from those in coastal or temperate urban environments studied in the existing literature [1,2]. The study area, located within the Pichincha Province, Ecuador, is depicted in Figure 1.
This research builds upon the work of [3], which developed the first national model for electric vehicle projections in Ecuador using the Bass diffusion model and Monte Carlo simulation. The present work advances significantly upon this foundation by introducing more sophisticated agent-based modelling methodologies and Big Data architecture to capture charging dynamics with greater granularity.
According to projections from Empresa Electrica Quito (EEQ), the fleet of light-duty electric vehicles (EVs) is forecast to reach between 180,000 and 230,000 units by 2040 under various adoption scenarios, which would constitute roughly 15% of the city’s total vehicle fleet [4]. This accelerated electrification is consistent with Ecuador’s national goals for its energy transition and the expansion of its renewable generation capacity, presenting both opportunities for integrating renewables with the grid and risks of overburdening the infrastructure [5,6].

1.2. State of the Art

Research on electric vehicle energy demand lies at the nexus of three pivotal domains: predictive modelling, Big Data architecture, and analysis of consumer behavior. A systematic literature review exposes not only considerable progress in these fields but also critical research gaps that the present study intends to bridge.

1.2.1. Evolution of Agent-Based Modelling

Methods for forecasting electric vehicle (EV) demand have evolved from aggregate statistical models to more sophisticated approaches [7,8]. Initial research in Ecuador, such as that by [3], successfully employed the Bass model for projecting EV adoption, achieving stabilized coincidence factors of 0.22 and demonstrating that the impact on the demand profile can be managed if current charging behaviors are maintained. This value is consistent with the international literature, where studies based on stochastic modelling and empirical data have shown that the coincidence factor for residential fleets converges to values below 0.25 as the number of vehicles increases. However, this approach, while robust for aggregate estimations, failed to capture individual behavioral heterogeneity or the emergent effects of mass-scale charging synchronization.
Agent-Based Modelling (ABM) naturally complements the Bass model, as it allows for the simulation of heterogeneous behaviors rather than aggregate adoption. In [9], a spatial agent-based model was developed for Beijing that integrates EV adoption and vehicle-to-grid (V2G) functionality, demonstrating that spatial heterogeneity is crucial for accurate predictions. Similarly, [10] used real-world trajectory data to analyze electric taxi fleets, finding that ABMs better capture emergent dynamics than traditional aggregate models.
ABM has emerged as the dominant paradigm due to its capacity to simulate heterogeneous decisions and capture emergent charging patterns [11,12]. The literature has enriched ABMs with detailed mobility models, technical battery profiles, and driver behavior archetypes [12,13]. Nevertheless, current research exhibits key limitations: the models often lack scalability for metropolitan-scale fleets, rely on limited datasets for their calibration, and seldom integrate complex environmental factors, such as thermal effects on charging efficiency, especially in unique geographies like that of Pichincha [14,15].
A systematic comparison by [16] between Autoregressive Integrated Moving Average (ARIMA) models and Monte Carlo-based approaches revealed that, while ARIMA achieves high predictive accuracy (MAPE of 3–7%), stochastic methods provide better uncertainty quantification for infrastructure planning. Nonetheless, a significant gap persists in the experimental validation of these models with high-temporal-resolution data (≤15 min).

1.2.2. Big Data Architectures for Energy Simulation

The massive volume of time-series data generated by electromobility exceeds the capacity of traditional relational databases [16,17]. In response, specialized Big Data architectures, such as time-series databases (TSDB), have emerged, with TimescaleDB being notable for combining scalability with the power of SQL [18,19,20].
A comparative technical report [21] demonstrated that, although InfluxDB maintains advantages in simple ingestion (80 times faster), TimescaleDB’s architecture outperforms InfluxDB in complex analytical queries, achieving performance 3.4 to 71 times higher. For EV simulation applications, which require both massive data ingestion and complex analytical queries, this architectural choice can significantly impact the project’s computational feasibility.
Despite their potential, the systematic application of TSDBs for large-scale EV demand modelling and simulation remains incipient, presenting an opportunity to demonstrate their viability and performance in this specific domain [21,22,23].

1.2.3. Synchronization Effects and Time-of-Use Tariffs

The implementation of demand response (DR) programmes, such as time-of-use (TOU) tariffs, poses significant risks, as documented in recent literature. In [3] demonstrated that TOU tariffs in Ecuador have been effective, observing that “users have voluntarily modified their electricity consumption to reduce energy costs,” with the load successfully shifting away from peak hours (21:00 to 06:00). However, that study did not consider the mass synchronization risks that can arise from the implementation of unmanaged TOU tariffs in scenarios with high electric vehicle (EV) penetration.
Based on the available evidence, the “cliff effect” phenomenon has been quantified in multiple studies. The authors of [24] analyzed the impact of TOU tariffs on distribution networks, finding that customer response can create new demand peaks if not correctly managed. The study in [22] reported increases of up to 94.8% in peak demand due to mass synchronization at midnight in analyses of urban grids. Similarly, studies from California project that 67% of feeders will require costly upgrades by 2045 without smart management [22].
This issue was not identified in previous studies in Ecuador due to the relatively low levels of EV penetration analyzed. The work in [3] concluded that the impact would be “reasonable as long as the studied premises are met, i.e., that users maintain their current charging habits.” However, this conclusion must be qualified, as this off-peak charging behavior, if massively synchronized by TOU tariffs in high-penetration scenarios, can be counterproductive without smart management.
Theoretical modeling using Nash equilibria, as developed in [25], provides an analytical framework for understanding these phenomena. Their results demonstrate that the “price of anarchy” converges to 1 in large systems, validating that simple TOU tariffs can trap the system in suboptimal yet stable equilibria.

1.2.4. Specific Conditions of High-Altitude Cities

Research on electrification in Andean cities reveals unique technical parameters that are seldom considered in international literature. In [26], specific methodologies were developed for inter-Andean corridors, finding that seven charging stations are required compared to four when using conventional criteria, due to altitudinal effects.
Experiences with public electric transport in Andean cities were reported in [27], which identified that thermal and atmospheric pressure effects require specific considerations in system dimensioning. Technical studies specific to the Quito-Pichincha region must consider the complex effects of altitude on vehicle range. While the lower air density at 2850 m can reduce aerodynamic drag and potentially improve efficiency, this effect can be counteracted by the lower ambient temperatures that affect battery performance and the energy required for cabin climate control [28].
Therefore, net vehicle range is a complex function of route-specific topography, temperature, and the driving profile, reinforcing the need for granular simulation models rather than static correction factors.
This geographical specificity represents a research opportunity with practical relevance for the entire Andean region, where over 40% of the South American population resides [29].

1.3. Problem Statement and Research Gap

  • Current approaches to modelling electric vehicle (EV) demand exhibit three critical limitations when applied to high-penetration scenarios in complex urban environments:
  • Existing models typically address fleets of fewer than 10,000 vehicles at an hourly resolution, which is insufficient for utility-scale planning in major metropolitan areas that require quarter-hourly load forecasts [29,30].
  • Most models assume homogeneous user behavior and overlook the heterogeneous responses to dynamic pricing, failing to capture the synchronization effects that can create unintended peak demand amplification [31,32,33].
  • Traditional database systems become computationally prohibitive when processing the billions of time-series records generated by large-scale EV simulations, thereby limiting the depth of scenario analysis and uncertainty quantification [34].

1.4. Research Contributions

This dissertation addresses these limitations through four primary contributions:
  • The development of a scalable agent-based model that incorporates experimentally calibrated behavioral parameters, heterogeneity in price elasticity, and thermal effects, validated against real-world charging data from 764 charging points.
  • The implementation of a TimescaleDB-based pipeline capable of ingesting, processing, and querying billions of quarter-hourly records, with query response times of <2 ms and a 91% data compression rate.
  • An analysis of the “charging cliff” phenomenon demonstrates that a non-optimized implementation of TOU tariffs can increase system peaks by up to 67% in high-elasticity scenarios.
  • A Monte Carlo analysis with over 1000 iterations provides probabilistic bounds (P10/P50/P90) for peak demand, energy consumption, and infrastructure requirements through 2040.
  • It is important to note that the scope of this paper is strictly limited to the Grid-to-Vehicle (G2V) paradigm, focusing on the challenges of modeling and planning for EV charging demand. The potential of Vehicle-to-Grid (V2G) services for ancillary support or grid restoration, while important, represents a distinct area of research and is considered beyond the scope of this study.

1.5. Research Questions and Hypotheses

Primary Research Question:
How can agent-based modelling, combined with Big Data architecture, provide actionable insights for electric vehicle (EV) charging infrastructure planning while simultaneously quantifying the risks of demand synchronization under time-of-use tariffs?
Specific Research Questions:
  • RQ1: What are the probabilistic bounds for peak electric vehicle (EV) charging demand under different adoption and tariff scenarios?
  • RQ2: How do temperature variations and thermal effects influence charging profiles in high-altitude environments?
  • RQ3: What demand response mechanisms can mitigate the synchronization risks posed by simple TOU tariffs?
Central Hypothesis:
Advanced demand-side management (DSM) strategies that incorporate stochastic charging initiation can reduce peak demand by >15% compared to unmanaged TOU tariffs, while maintaining cost benefits for the consumer. However, these strategies require sophisticated modelling approaches to quantify uncertainty and optimize implementation parameters.

1.6. Methodological Approach

This research employs a quantitative, simulation-based approach structured in four phases:
  • Data Collection and Preprocessing. Experimental data from 764 charging points were collected over six months, resulting in more than 2.1 million charging sessions that underwent comprehensive preprocessing and quality assurance protocols.
  • Model Development. An Agent-Based Model (ABM) framework was developed, featuring heterogeneous agents, calibrated behavioral functions, and Monte Carlo-based uncertainty propagation, utilizing validated statistical distributions.
  • Infrastructure Implementation. TimescaleDB hypertable architecture was implemented, featuring continuous aggregates, compression policies, and query optimization for datasets comprising billions of records.
  • Scenario Analysis. An evaluation of three scenarios (conservative, baseline, and optimistic cases) was conducted with comprehensive uncertainty quantification.

1.7. Document Structure

The remainder of this paper is organized as follows: Section 2 presents the detailed methodology, including theoretical underpinnings, data sources, and computational architecture. Section 3 describes simulation results, validation metrics, and scenario analysis. Section 4 discusses the implications for utility planning, a comparison with previous work, and the study’s limitations. Section 5 concludes with a synthesis of the findings and recommendations for implementation.

2. Materials and Methods

2.1. Theoretical Foundations of Agent-Based Modelling

2.1.1. Complex Adaptive Systems Theory

Agent-based modelling is grounded in the theory of complex adaptive systems [35], wherein the emergent behavior of the system arises from the interactions among autonomous agents that follow simple rules. In the context of EVs, each vehicle acts as an agent with an:
  • Internal State: State of Charge (SoC), location, and energy requirement.
  • Decision Rules: When to initiate charging; duration of charging.
  • Interactions: Competition for charging points; response to price signals.
The state transition function of the agent (i) is defined as:
S i , t + 1 = f ( S i , t ,   A i , t E t ,     I i , t )
where:
S i , t : State of agent i at time t.
A i , t : Action taken by the agent.
E t : State of the environment (prices, availability).
I i , t : Interactions with other agents.

2.1.2. Game Theory and Nash Equilibrium

The response to TOU tariffs is modeled as a non-cooperative game, where each user maximizes their individual utility by minimizing a perceived cost function:
U i t = α × P r i c e t × E i + β × I n c o n v e n i e n c e t γ × U r g e n c y
where:
  • U i ( t ) is the perceived cost for user i to initiate charging at time t.
  • P r i c e   t is the cost of electricity per kWh at time t.
  • E i is the total energy required by user i’s vehicle.
  • α is the user’s price sensitivity coefficient.
  • I n c o n v e n i e n c e   t is a function representing the non-monetary cost of delaying the charge.
  • β is the inconvenience aversion coefficient.
  • U r g e n c y ( t ) represents an imperative need to charge.
  • γ is the weight of the specified urgency.
The specific tariff structure implemented in the model, including the off-peak, standard, and peak periods for weekdays and weekends, is detailed in Appendix A.1 (Figure A1).

2.2. Data Sources and Collection Protocol

2.2.1. Primary Data Sources

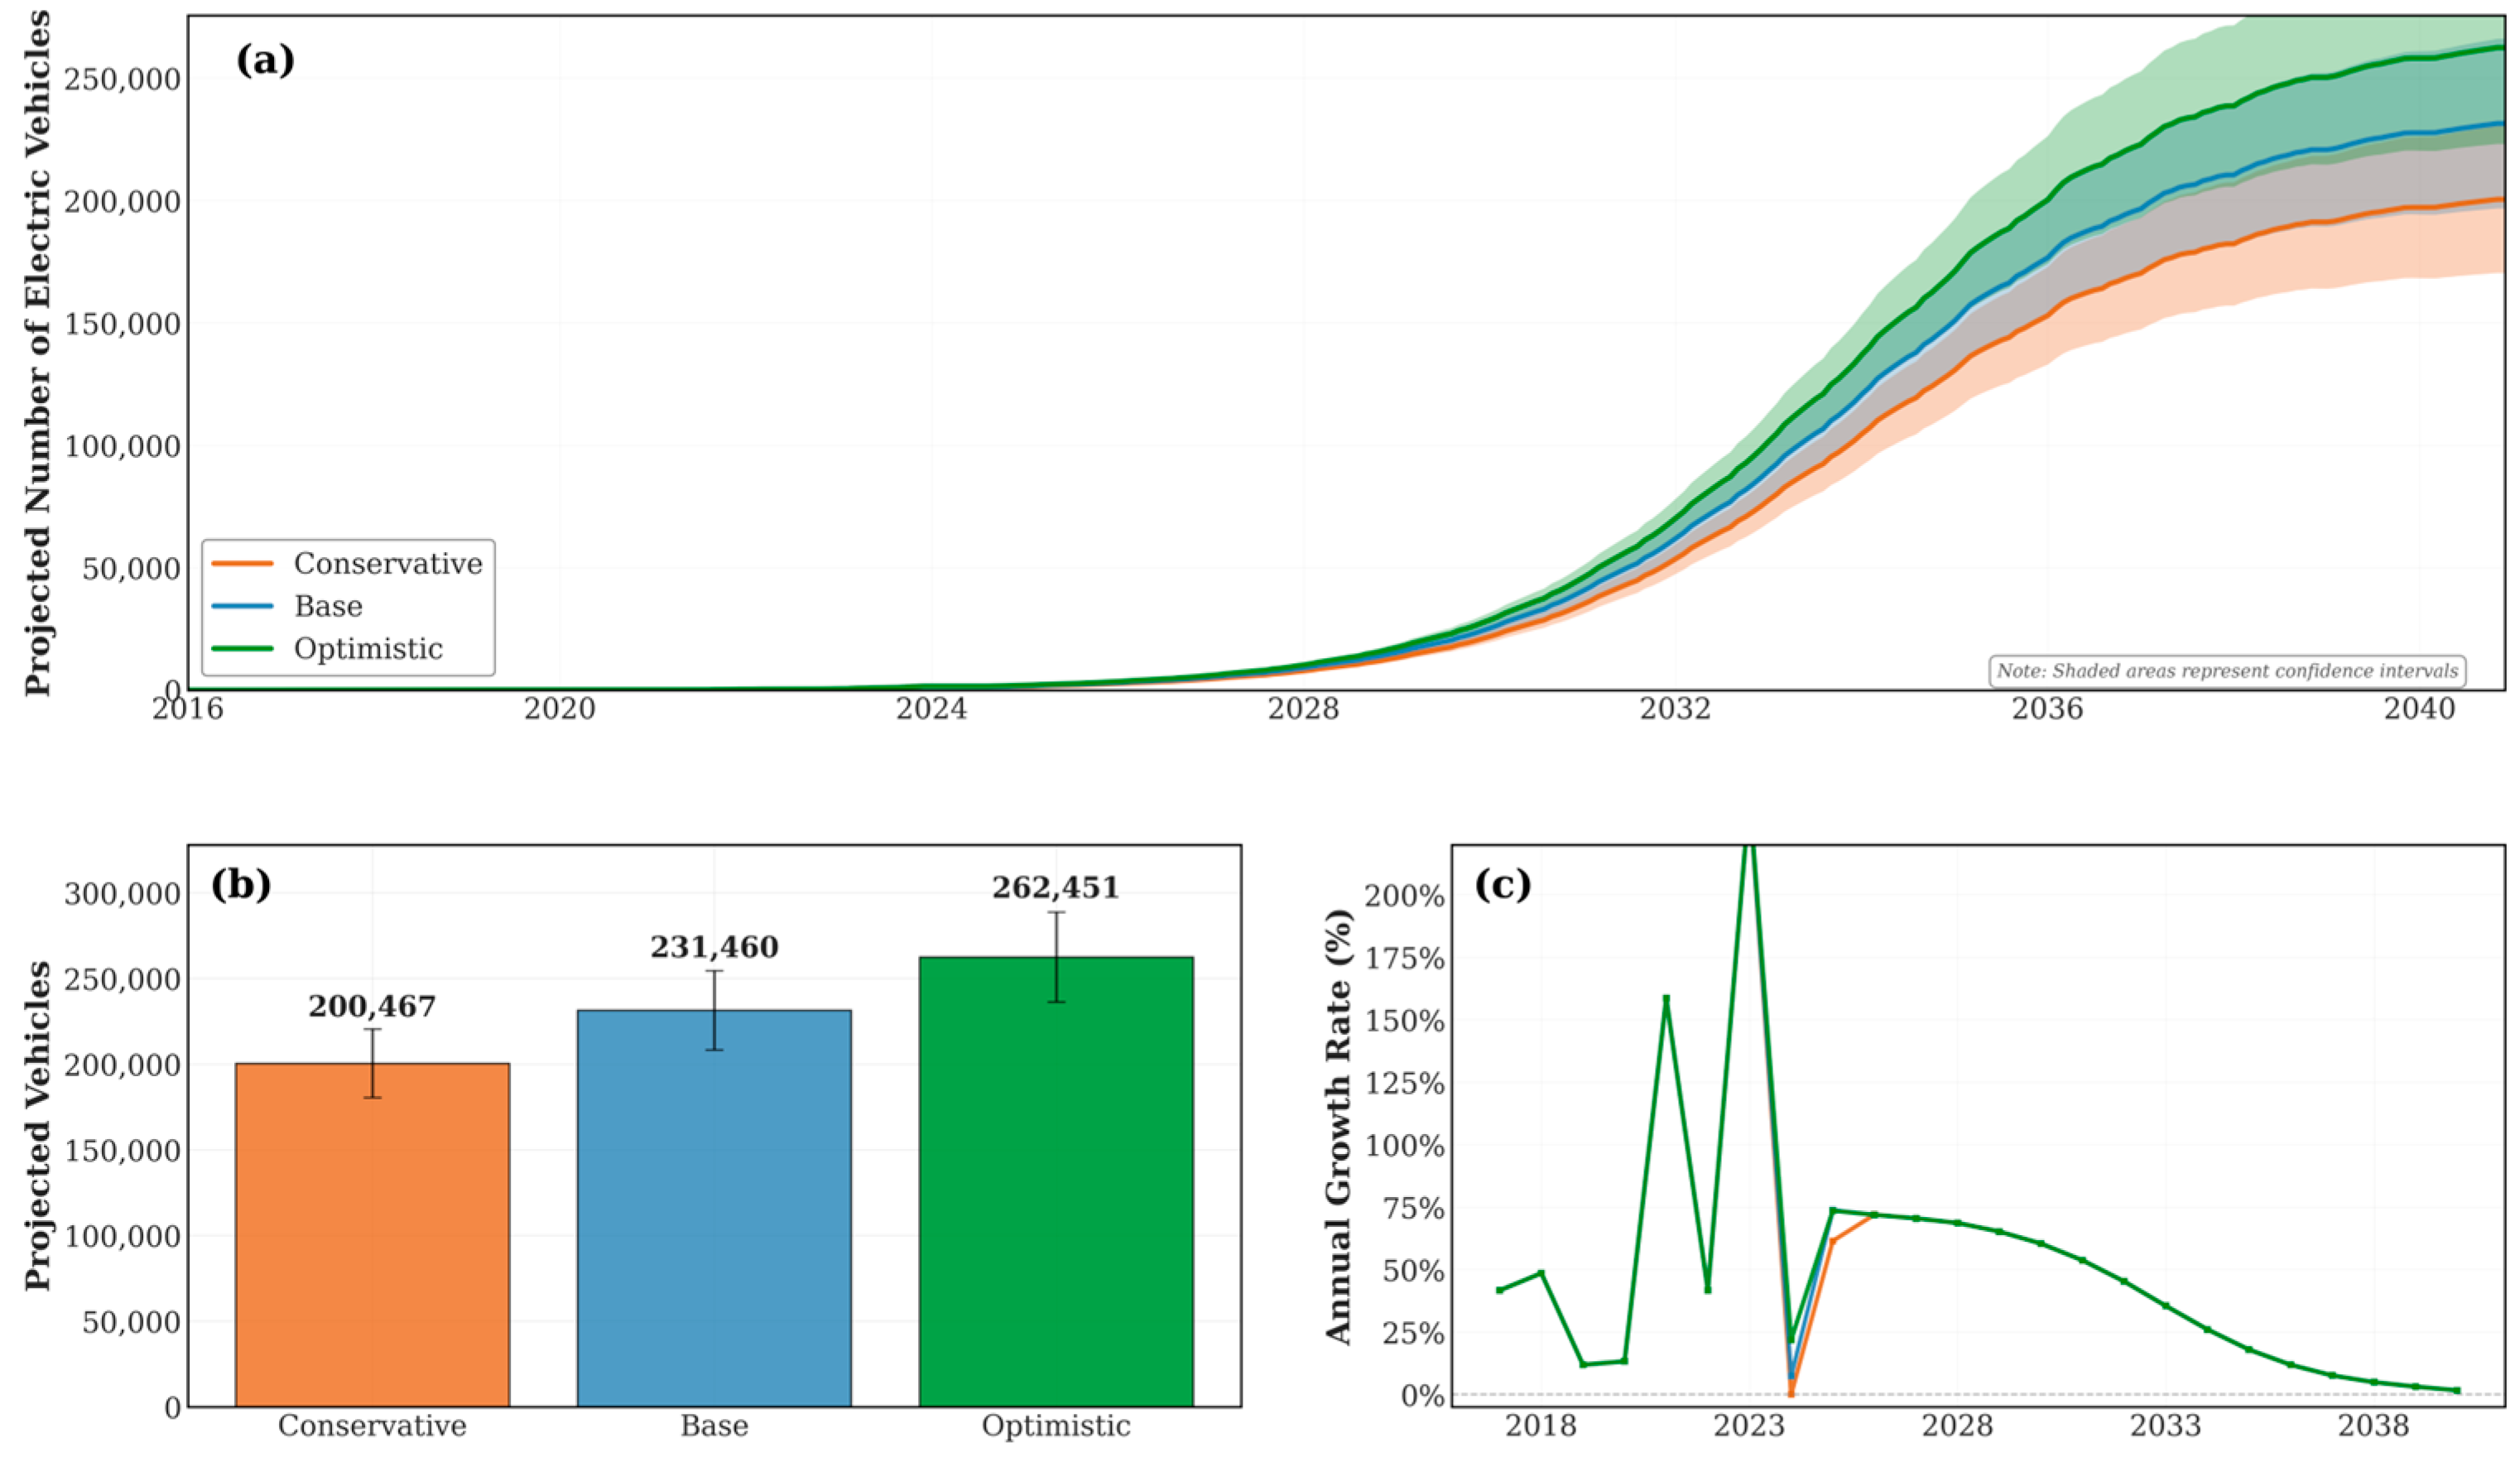
Figure 2 illustrates the projected growth of the electric vehicle fleet in Pichincha through the year 2040, displaying the S-shaped growth curve characteristic of the Bass model for the adoption of new technologies.
Three scenarios are detailed (Conservative, Baseline, and Optimistic), wherein the baseline scenario projects a fleet of approximately 230,000 units, along with the annual growth rates and final values for each case.

2.2.2. Electric Vehicle Catalogue

The parametrization of AC charging power levels in the simulation scenarios is based on Ecuador’s regulatory framework. Resolution ARCONEL-038/15 and its updates establish a preferential tariff for “slow” residential charging, with a recommended maximum demand of up to 10 kW. Accordingly, the power levels for the initial vehicle generation are modeled within this range (6.6 kW–11.0 kW).
For the 2040 projections, the model incorporates a technological evolution towards higher AC charging powers of up to 22 kW, as detailed in Table 1. Widespread adoption of DC fast charging (>50 kW) in the residential sector is excluded, as current regulations place it under a different commercial tariff scheme, and its mass implementation in homes would entail prohibitive infrastructure costs for the low-voltage distribution grid.

2.2.3. Daily Charging Probability Profiles

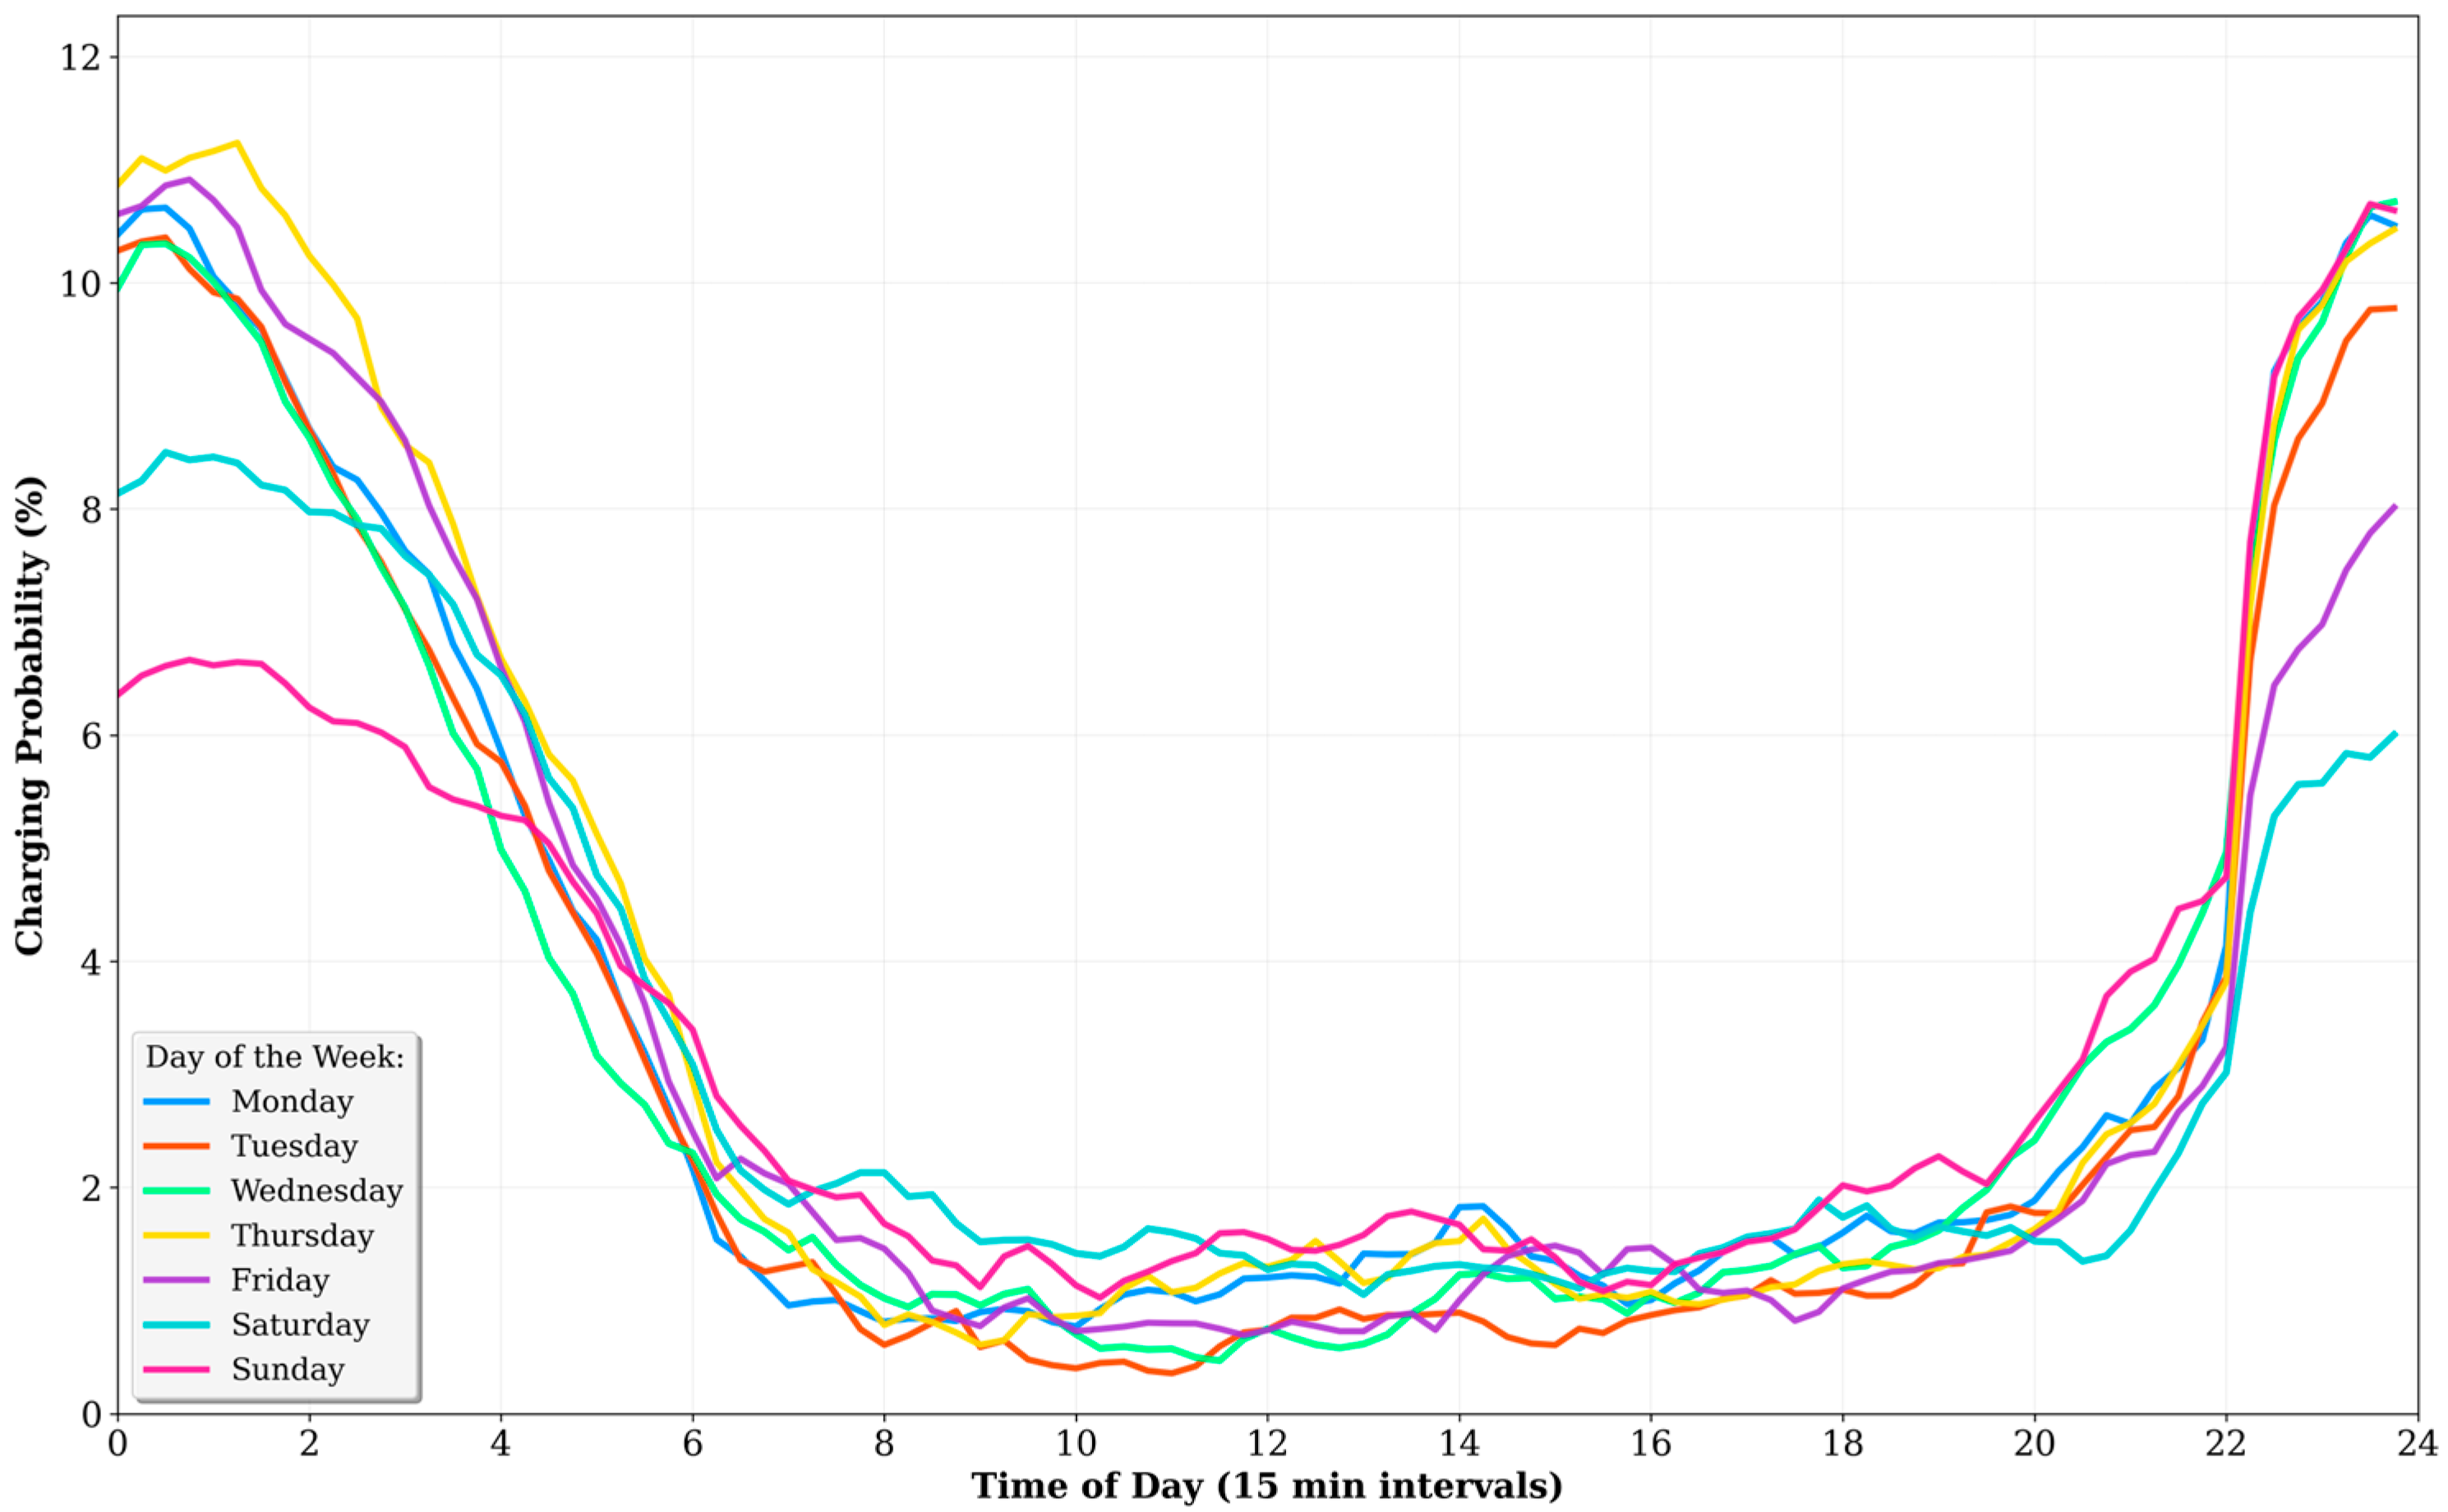
The charging profiles are derived from the aggregate analysis of 764 EV charging points, based on continuous measurements collected over six months in 2025. A bimodal pattern is observed on weekdays (Monday to Friday), with peaks in activity in the early morning (00:00–02:00) and a more pronounced peak in the evening (20:00–23:00) (Figure 3).

2.3. Computational Architecture for Big Data

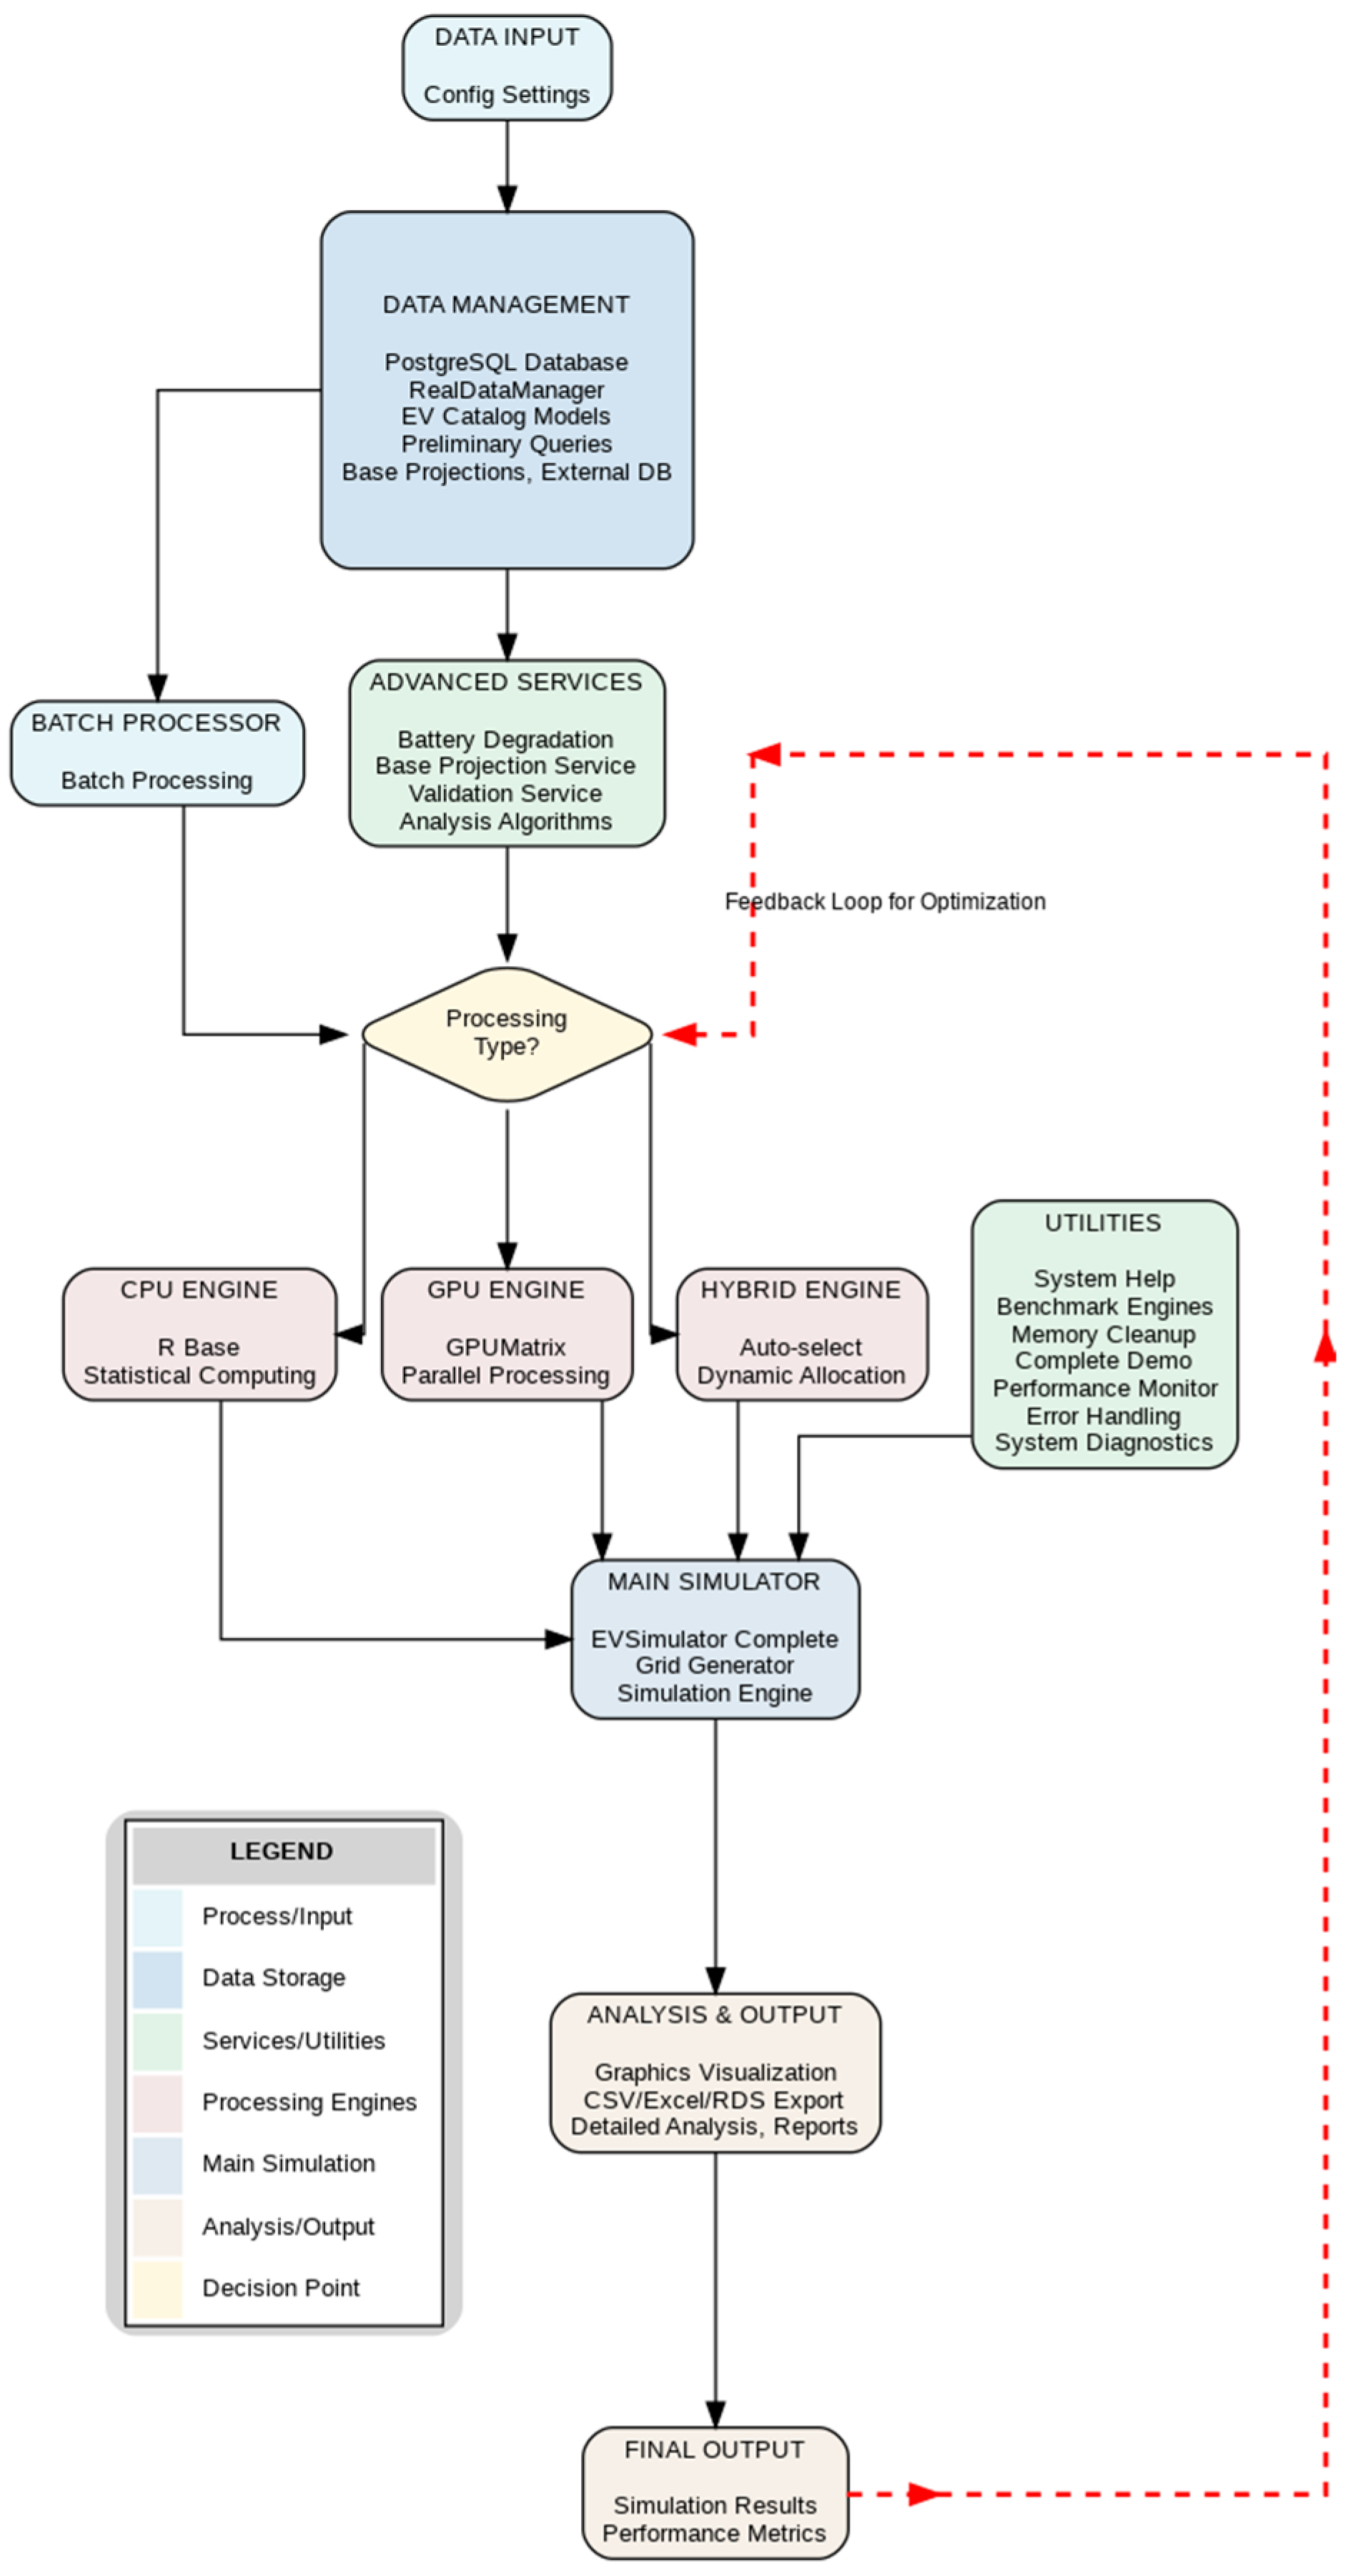
To address the Big Data challenge posed by projecting the charging demand of a massive electric vehicle fleet, a high-performance computational architecture has been designed and implemented that manages the entire analysis lifecycle (Figure 4).

Database Selection and Configuration

Based on recent comparative benchmarks [35,36,37], TimescaleDB was selected for its superior performance in complex analytical queries (3.4–71× better than InfluxDB) and its native SQL capabilities. The configuration includes:
  • Partitioned Hypertables. Temporal partitioning by day with 24-h chunks.
  • Continuous Aggregates. Pre-calculation of demand metrics per time interval.
  • Adaptive Compression. Compression algorithms that achieve 91% compression ratios.
  • Optimized Indexing. BRIN indexes are used for temporal queries, while B-tree indexes are utilized for metadata.

2.4. Dynamic Coincidence Factor

A fundamental finding of the simulation is the implementation of a dynamic coincidence factor, derived from experimental analysis:
F C = 0.222 + 0.036 e ( 0.0003 n )
where n is the number of theoretically active vehicles in each time interval.
This factor, validated against data from [38] and European studies [39], avoids the simplistic assumption that all vehicles charge simultaneously, thereby reducing demand overestimation by more than 70% compared to traditional models.

2.5. Software Implementation and Computational Framework

The EVSimulatorFinalDefinitive framework was developed in R (version 4.3.0) using object-oriented programming with the R6 package. The simulation integrates agent-based modelling with Monte Carlo methods and leverages GPU acceleration through the GPUmatrix package when available. Key computational components include:
Core Dependencies:
-
R6 (v2.5.1) for object-orientated architecture.
-
data. table (v1.14.8) for high-performance data processing.
-
future/furrr (v1.33.0) for parallel processing.
-
RPostgreSQL (v0.7-5) for TimescaleDB connectivity.
-
GPUmatrix (v1.0.0) for GPU acceleration (optional).
Database Architecture:
The simulation utilizes TimescaleDB (a PostgreSQL extension) for time-series data management, with hypertables partitioned by temporal intervals. Database configuration requires PostgreSQL 14 or higher with the TimescaleDB 2.8 or higher extension.
Parallel Processing:
The framework implements multisession parallelization using ‘availableCores()—1’ workers, with daily batch processing optimized for memory efficiency. GPU acceleration is automatically detected and utilized when available.
Source Code Availability:
Complete source code, including the EVSimulatorFinalDefinitive class, parallel processing functions, and database schemas, is available at: "https://github.com/ivelec1981/ev-demand-modeling-abm-timescaledb.git" (accessed on 12 August 2025) [40].
All parameters, configurations, and computational methods necessary to reproduce the results are documented in the repository README and supplementary scripts.

3. Results

3.1. Computational Performance and System Validation

The complete simulation for the 2025–2040 period generated a total of 13,464,576 quarter-hourly records, constituting a final dataset of approximately 6.7 GB. The entire process was completed in 93.6 min (5613.22 s), achieving a sustained average throughput of 2398.7 records per second.
TimescaleDB architecture demonstrates exceptional scalability:
  • Compression: 91% reduction in storage.
  • Queries: <2 ms response time for typical aggregate queries.
  • Robustness: Successful processing of 5844 daily batches without failure.

3.2. Model Validation

Temporal cross-validation yields exceptional accuracy metrics, confirming the robustness of the methodological approach:
  • MAPE: 4.2 ± 0.8%
  • RMSE: 12.3 MW
  • R2: 0.967
  • nRMSE: 0.34
These values surpass the benchmarks established by [41] for aggregate models (MAPE < 7%, nRMSE < 0.55) and approach the standards for individual applications, validating the model’s applicability for urban energy planning.

3.3. Energy Demand Projections

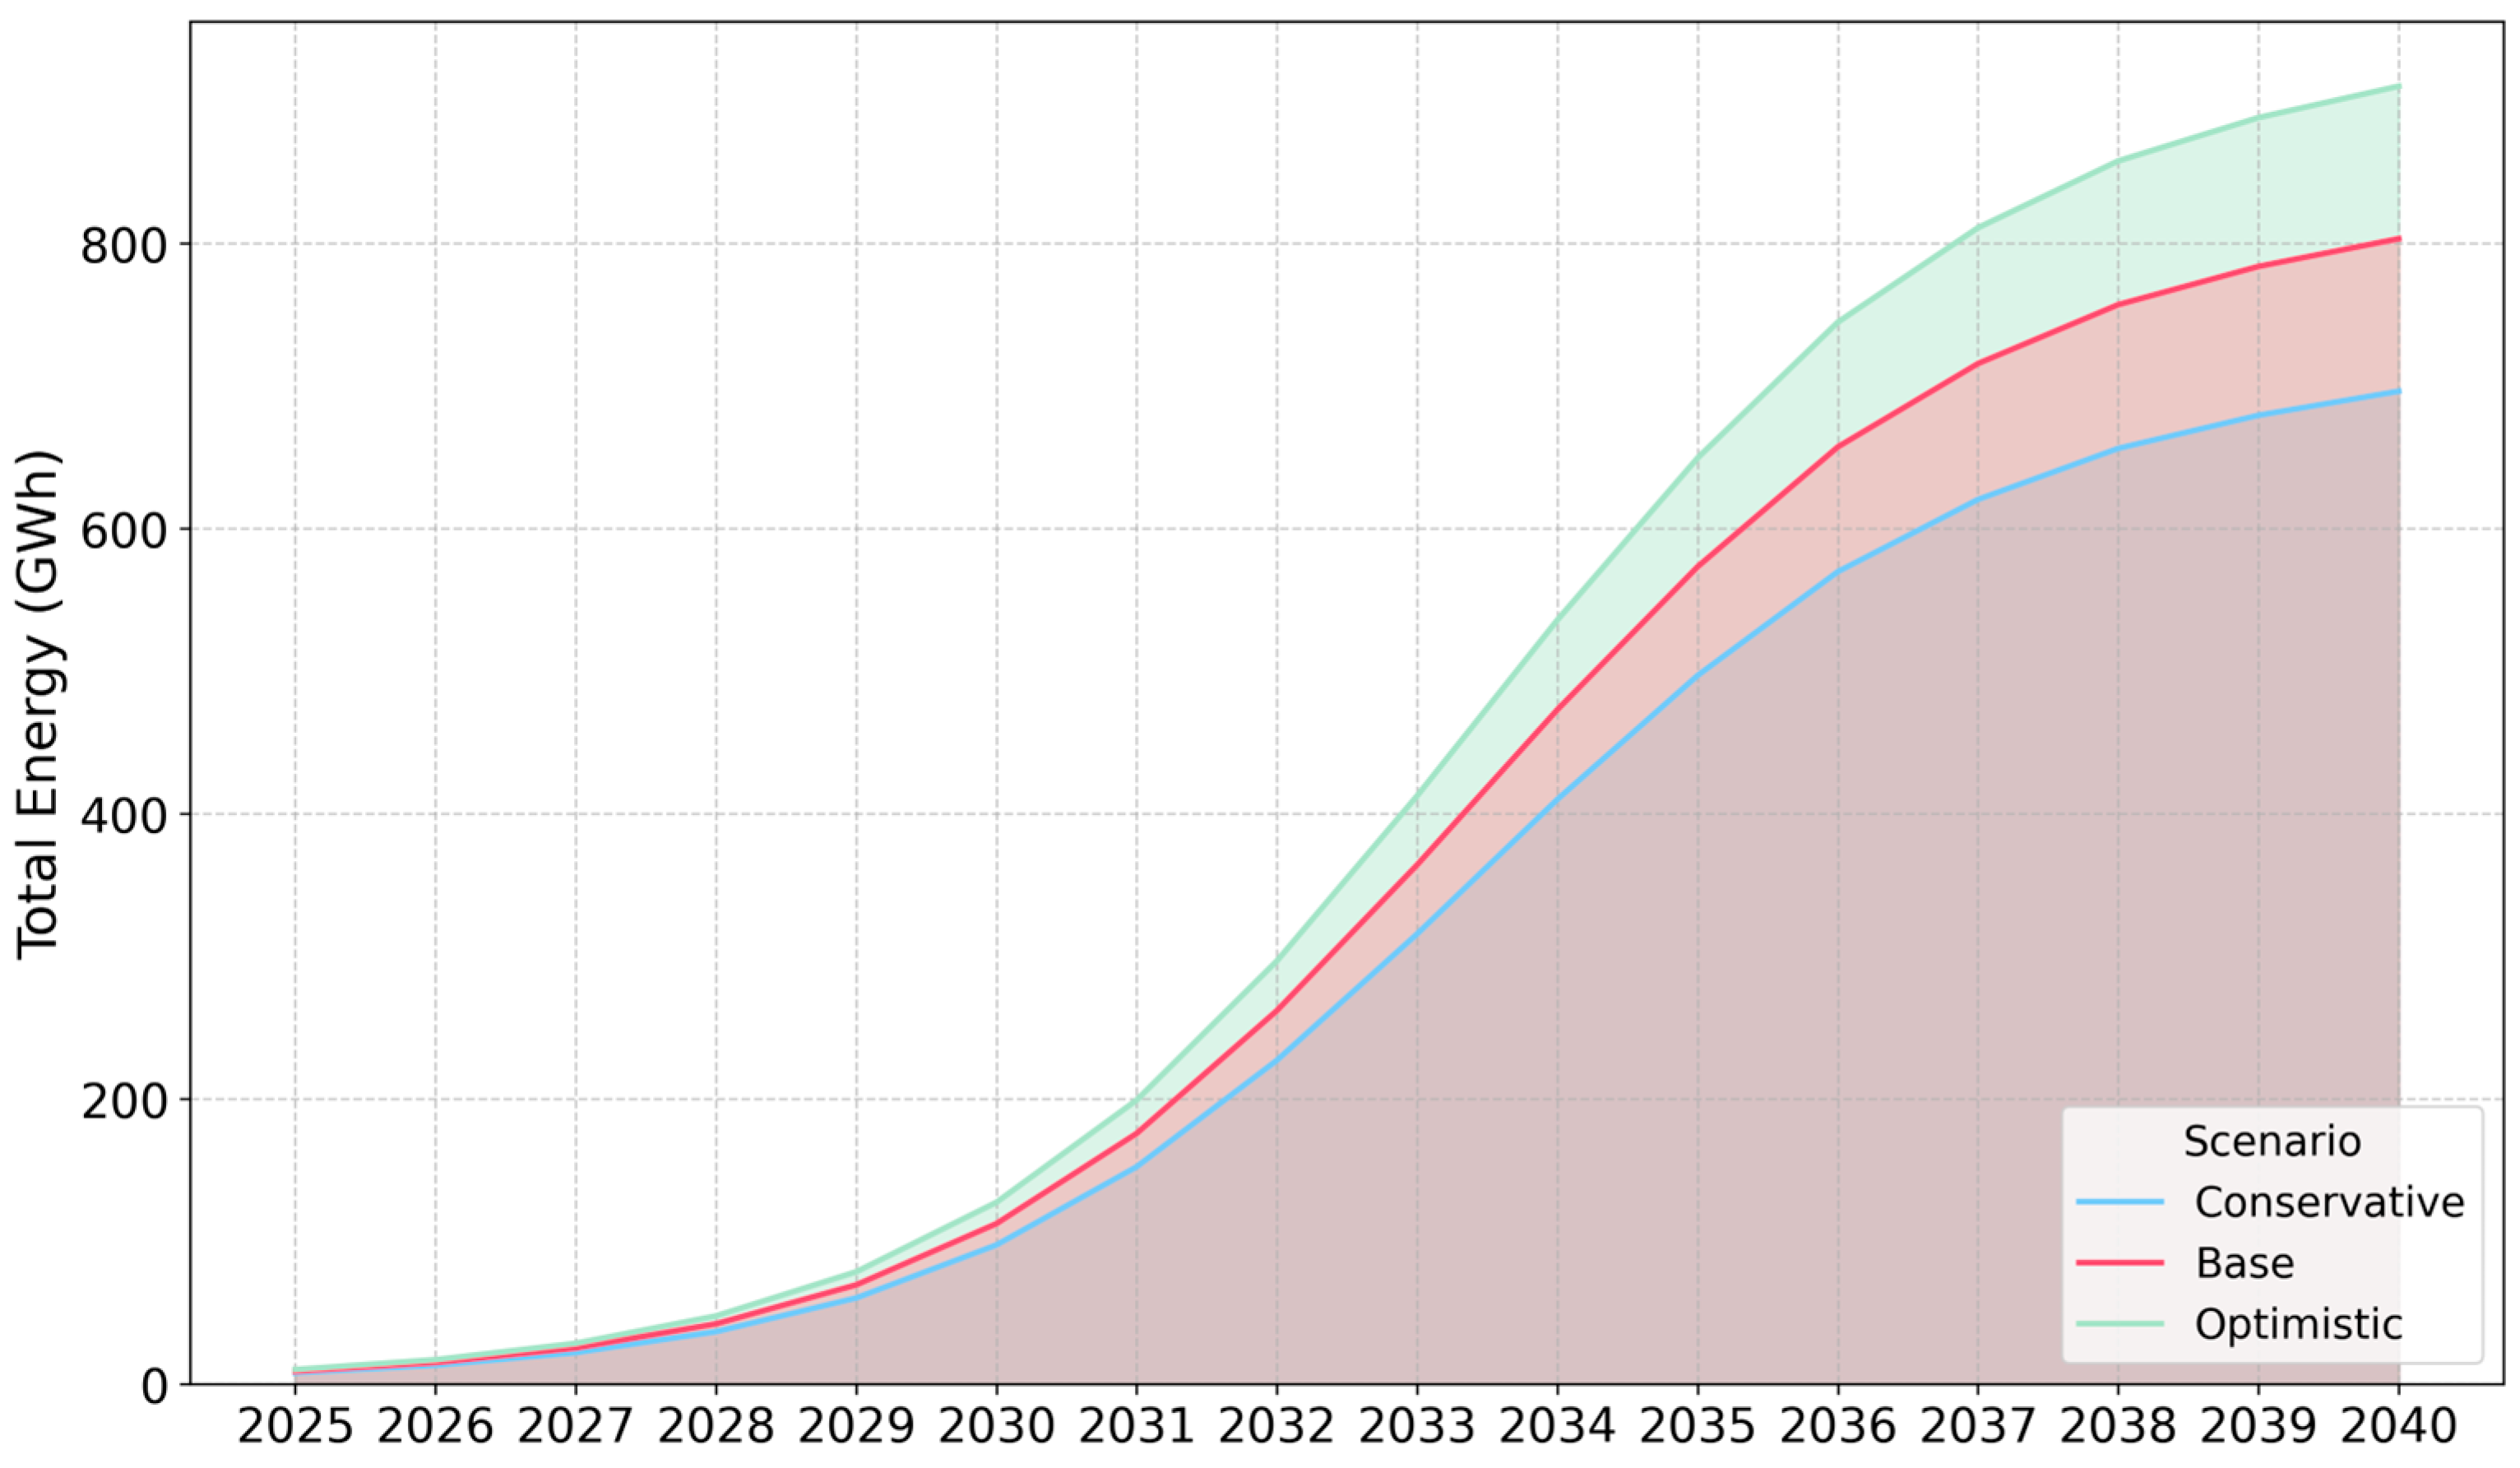
The simulation projects exponential growth in energy demand for residential EV charging in Pichincha through 2040. In the Baseline Scenario, annual energy consumption is estimated to increase from marginal levels in 2025 to approximately 800 GWh by 2040 (Figure 5), accompanied by an annual peak demand reaching 255 MW (95% CI: 240–270 MW) (Figure 6). A summary of key metrics for 2040 is presented in Table 2.

3.4. Impact on the Existing Electrical System

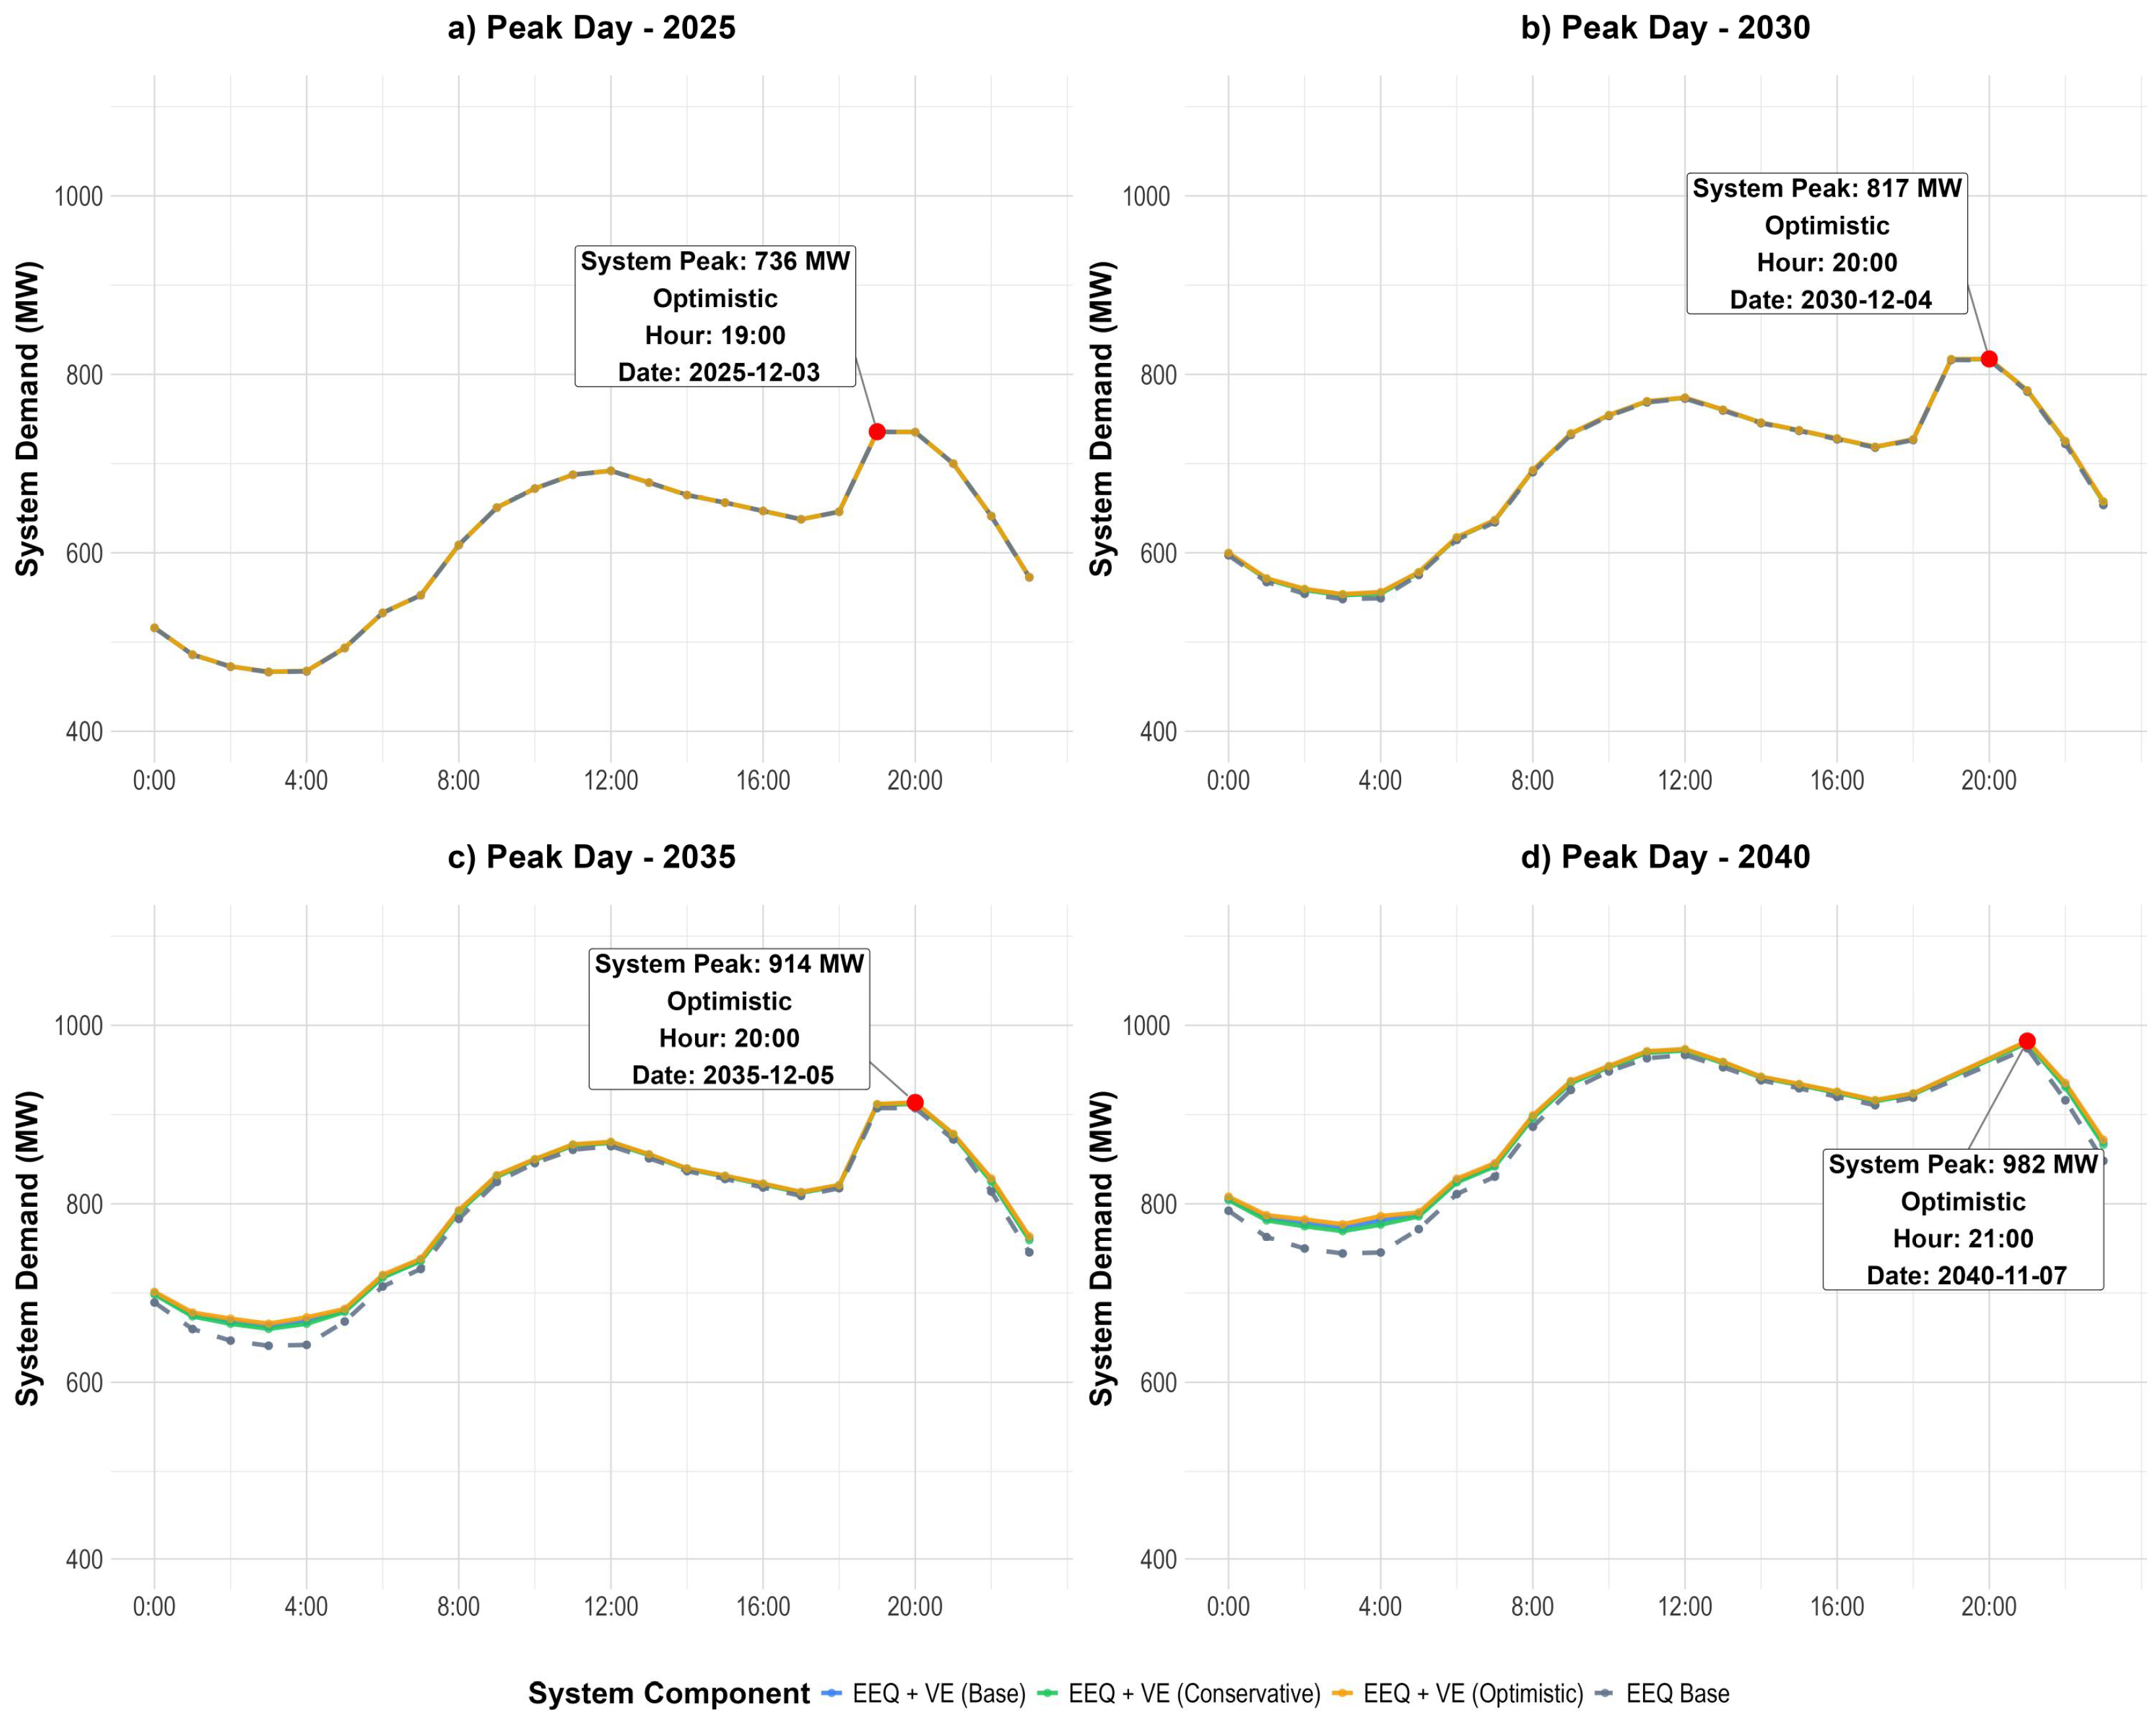
Figure 7 illustrates the superposition of the electric vehicle charging demand onto the power system’s baseline load curve (EEQ Base) during the days of maximum EV demand for the key years 2025, 2030, 2035, and 2040.
Evolutionary Impact Analysis:
  • 2025. The impact of EV charging on the system’s demand profile is negligible. The combined demand curve (EEQ + EV) is indistinguishable from the baseline curve.
  • 2030. An incipient yet discernible impact is observed. The EV load manifests as a slight increase in demand during the overnight valley period (00:00 to 06:00), without altering the time or magnitude of the system’s peak.
  • 2035. The impact has become significant. The addition of the EV demand generates a pronounced secondary peak in the early morning (04:00), constituting an apparent “valley-filling” effect.
  • 2040. The valley-filling effect intensifies. The early morning EV demand is fully realized, creating an overnight peak that drastically reduces the difference between the system’s valley and peak. Nevertheless, the absolute system peak remains in the evening (21:00), reaching 981 MW in the Baseline scenario.

3.5. Temporal and Spatial Distribution

The analysis of the intra-week distribution of EV charging demand reveals the emergence and consolidation of a sharply defined consumption pattern across the projection horizon (Figure 8). For the initial years (2025 and 2030), demand is uniformly low across all scenarios, with no discernible hourly structure.
Beginning in 2035, and more pronounced in 2040, a predominantly nocturnal charging pattern is established, with significant concentration between 20:00 and 00:00 h, consistent across all days of the week. Appendix A.2 (Figure A2) presents detailed day-by-day profiles for December.

3.6. Temporal Evolution on Annual Peak Days

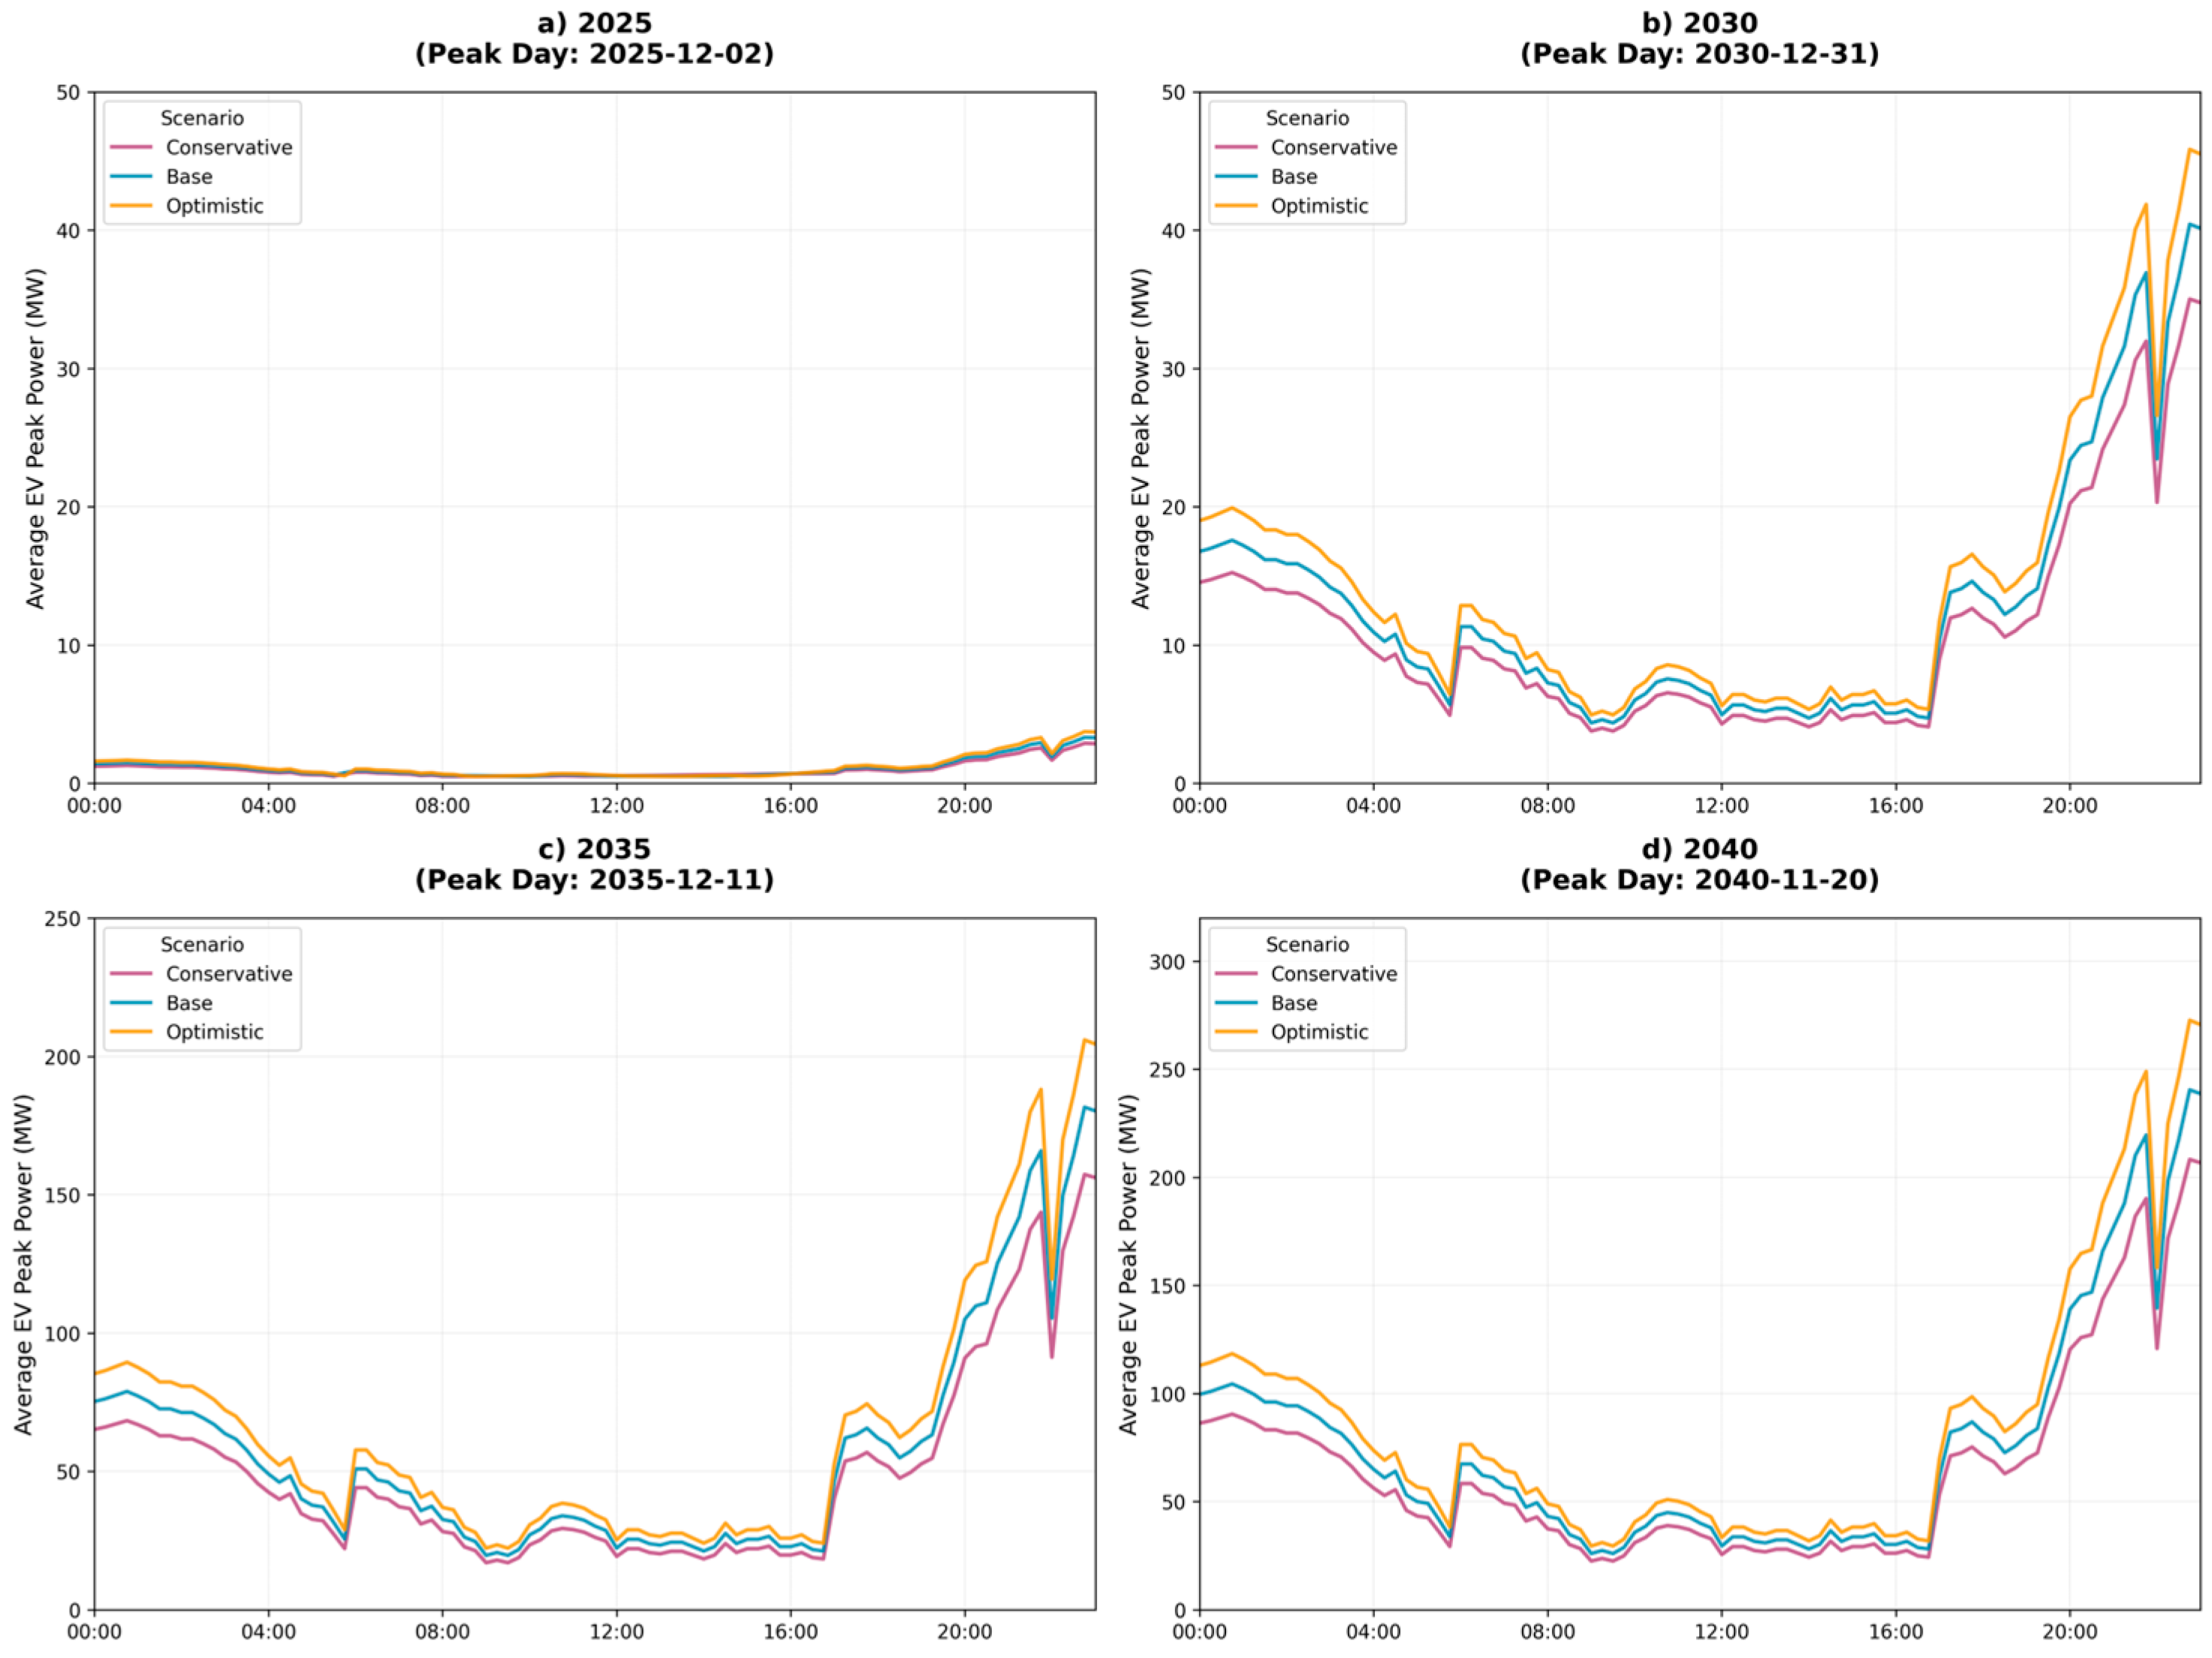
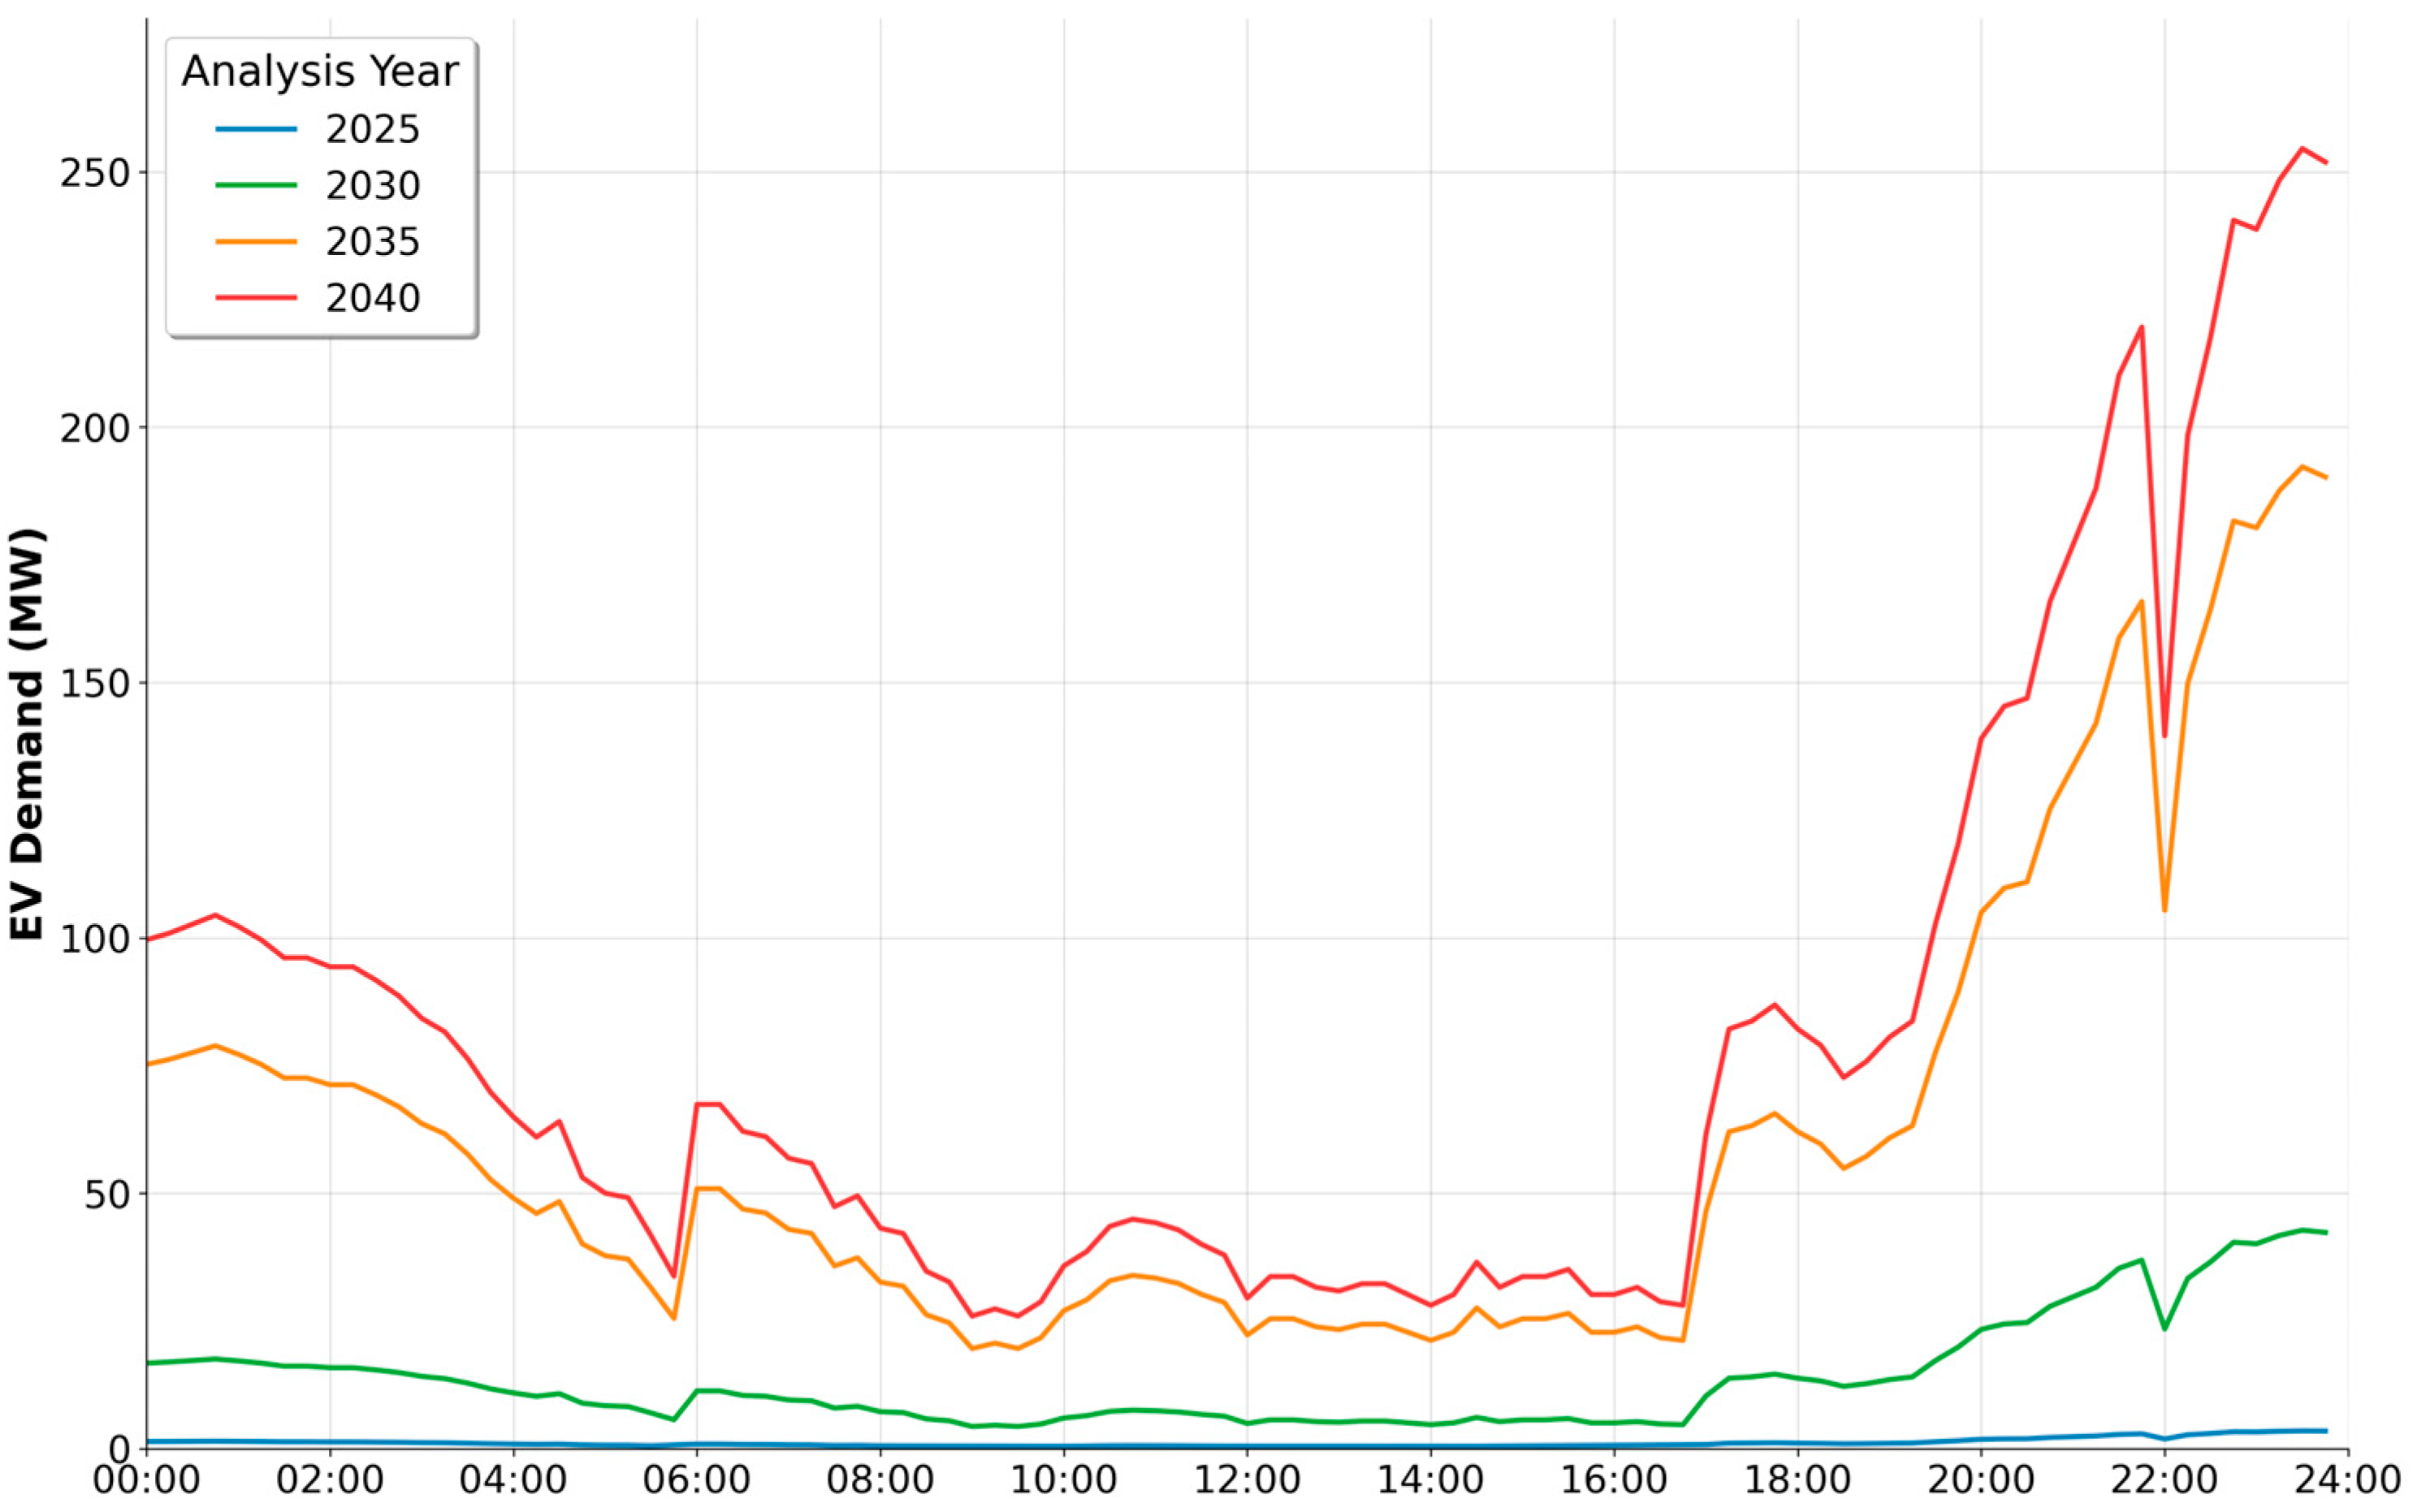
Figure 9 presents the evolution of the hourly load curve during the day of maximum annual electric vehicle demand for the key years 2025, 2030, 2035, and 2040. The analysis reveals the development and intensification of a unimodal load profile with marked temporal predictability.

3.7. Spatial Distribution of Demand

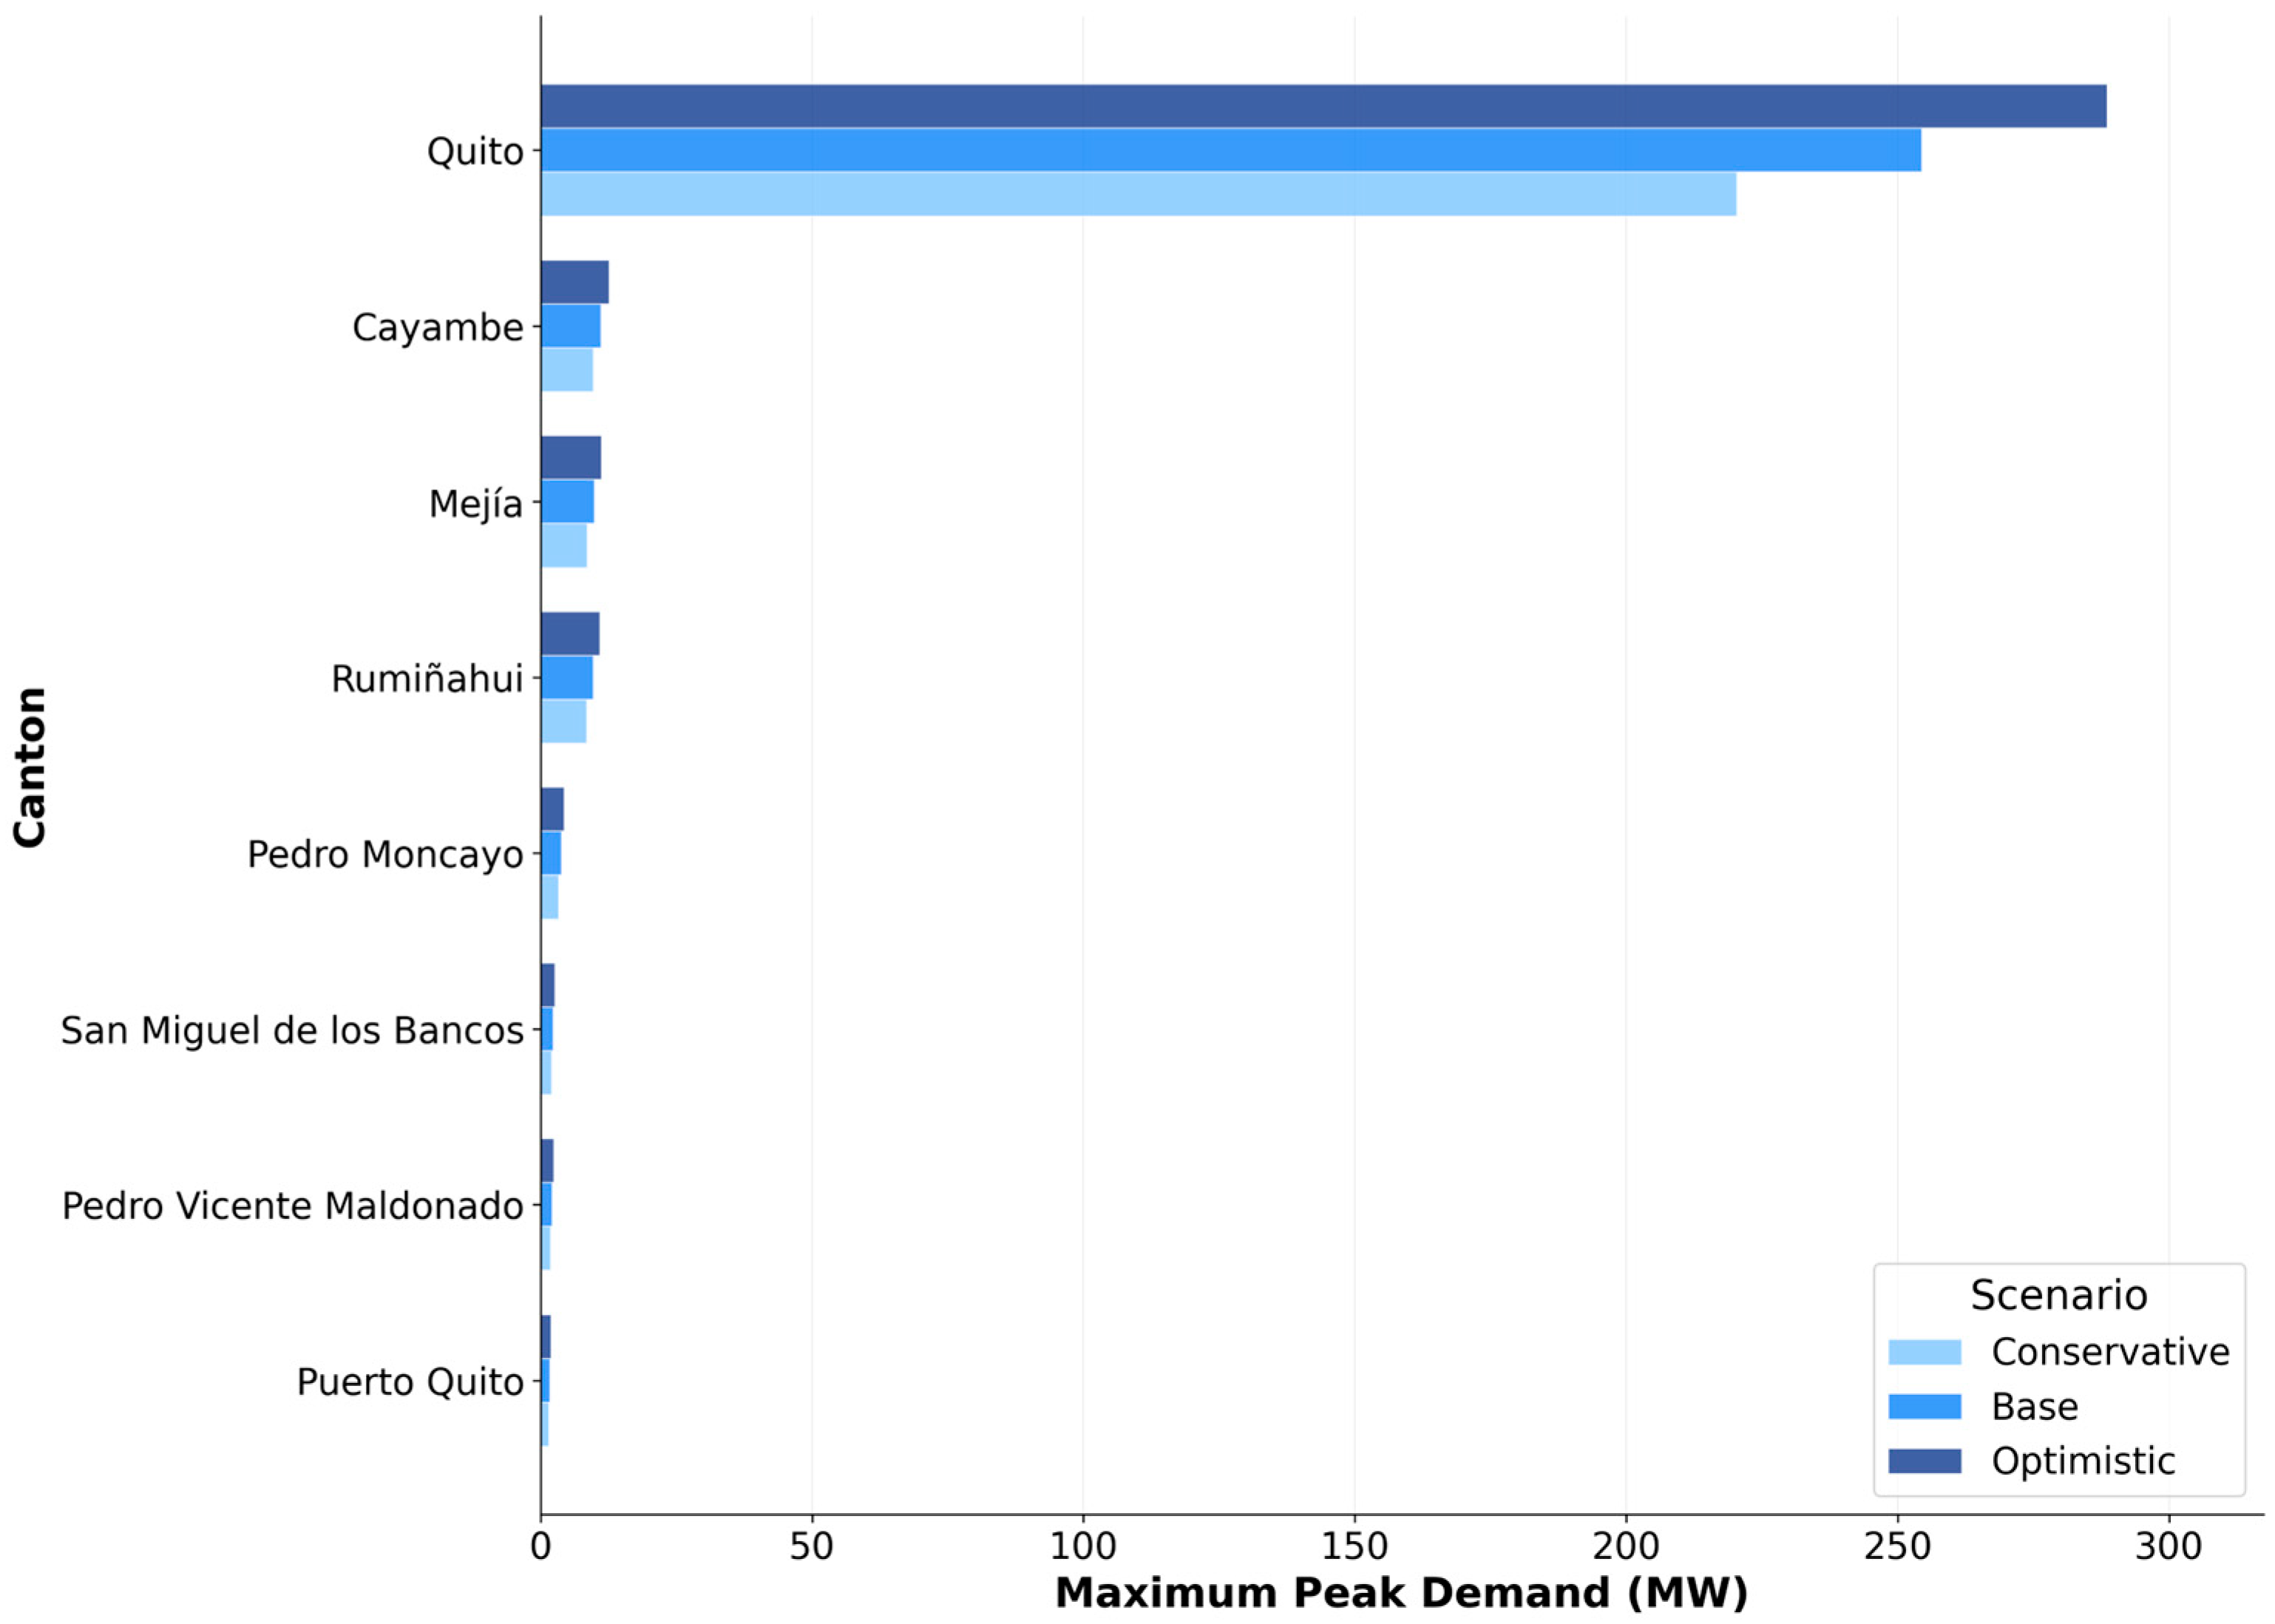
The analysis of the spatial distribution of peak power demand for EV charging in the year 2040 reveals an extreme geographical concentration of demand within the province of Pichincha (Figure 10):
  • Quito Canton: Accounts for 85% of the total demand (255 MW in the baseline scenario).
  • Other Cantons: Each account for less than 20 MW, even in the optimistic scenario.

3.8. Characterization of the ‘Cliff Effect’

Figure 11 provides clear visual evidence of the progressive development of temporal synchronization patterns that characterize the “cliff effect.” The analysis reveals how a non-optimized implementation of TOU tariffs can generate dramatic increases in peak demand. In the “High Tariff Response” scenario, the system’s peak demand increases from 192 MW to 255 MW (a 32% increase), confirming the theoretical predictions of the Nash equilibrium model.

3.9. Thermal and Altitudinal Effects

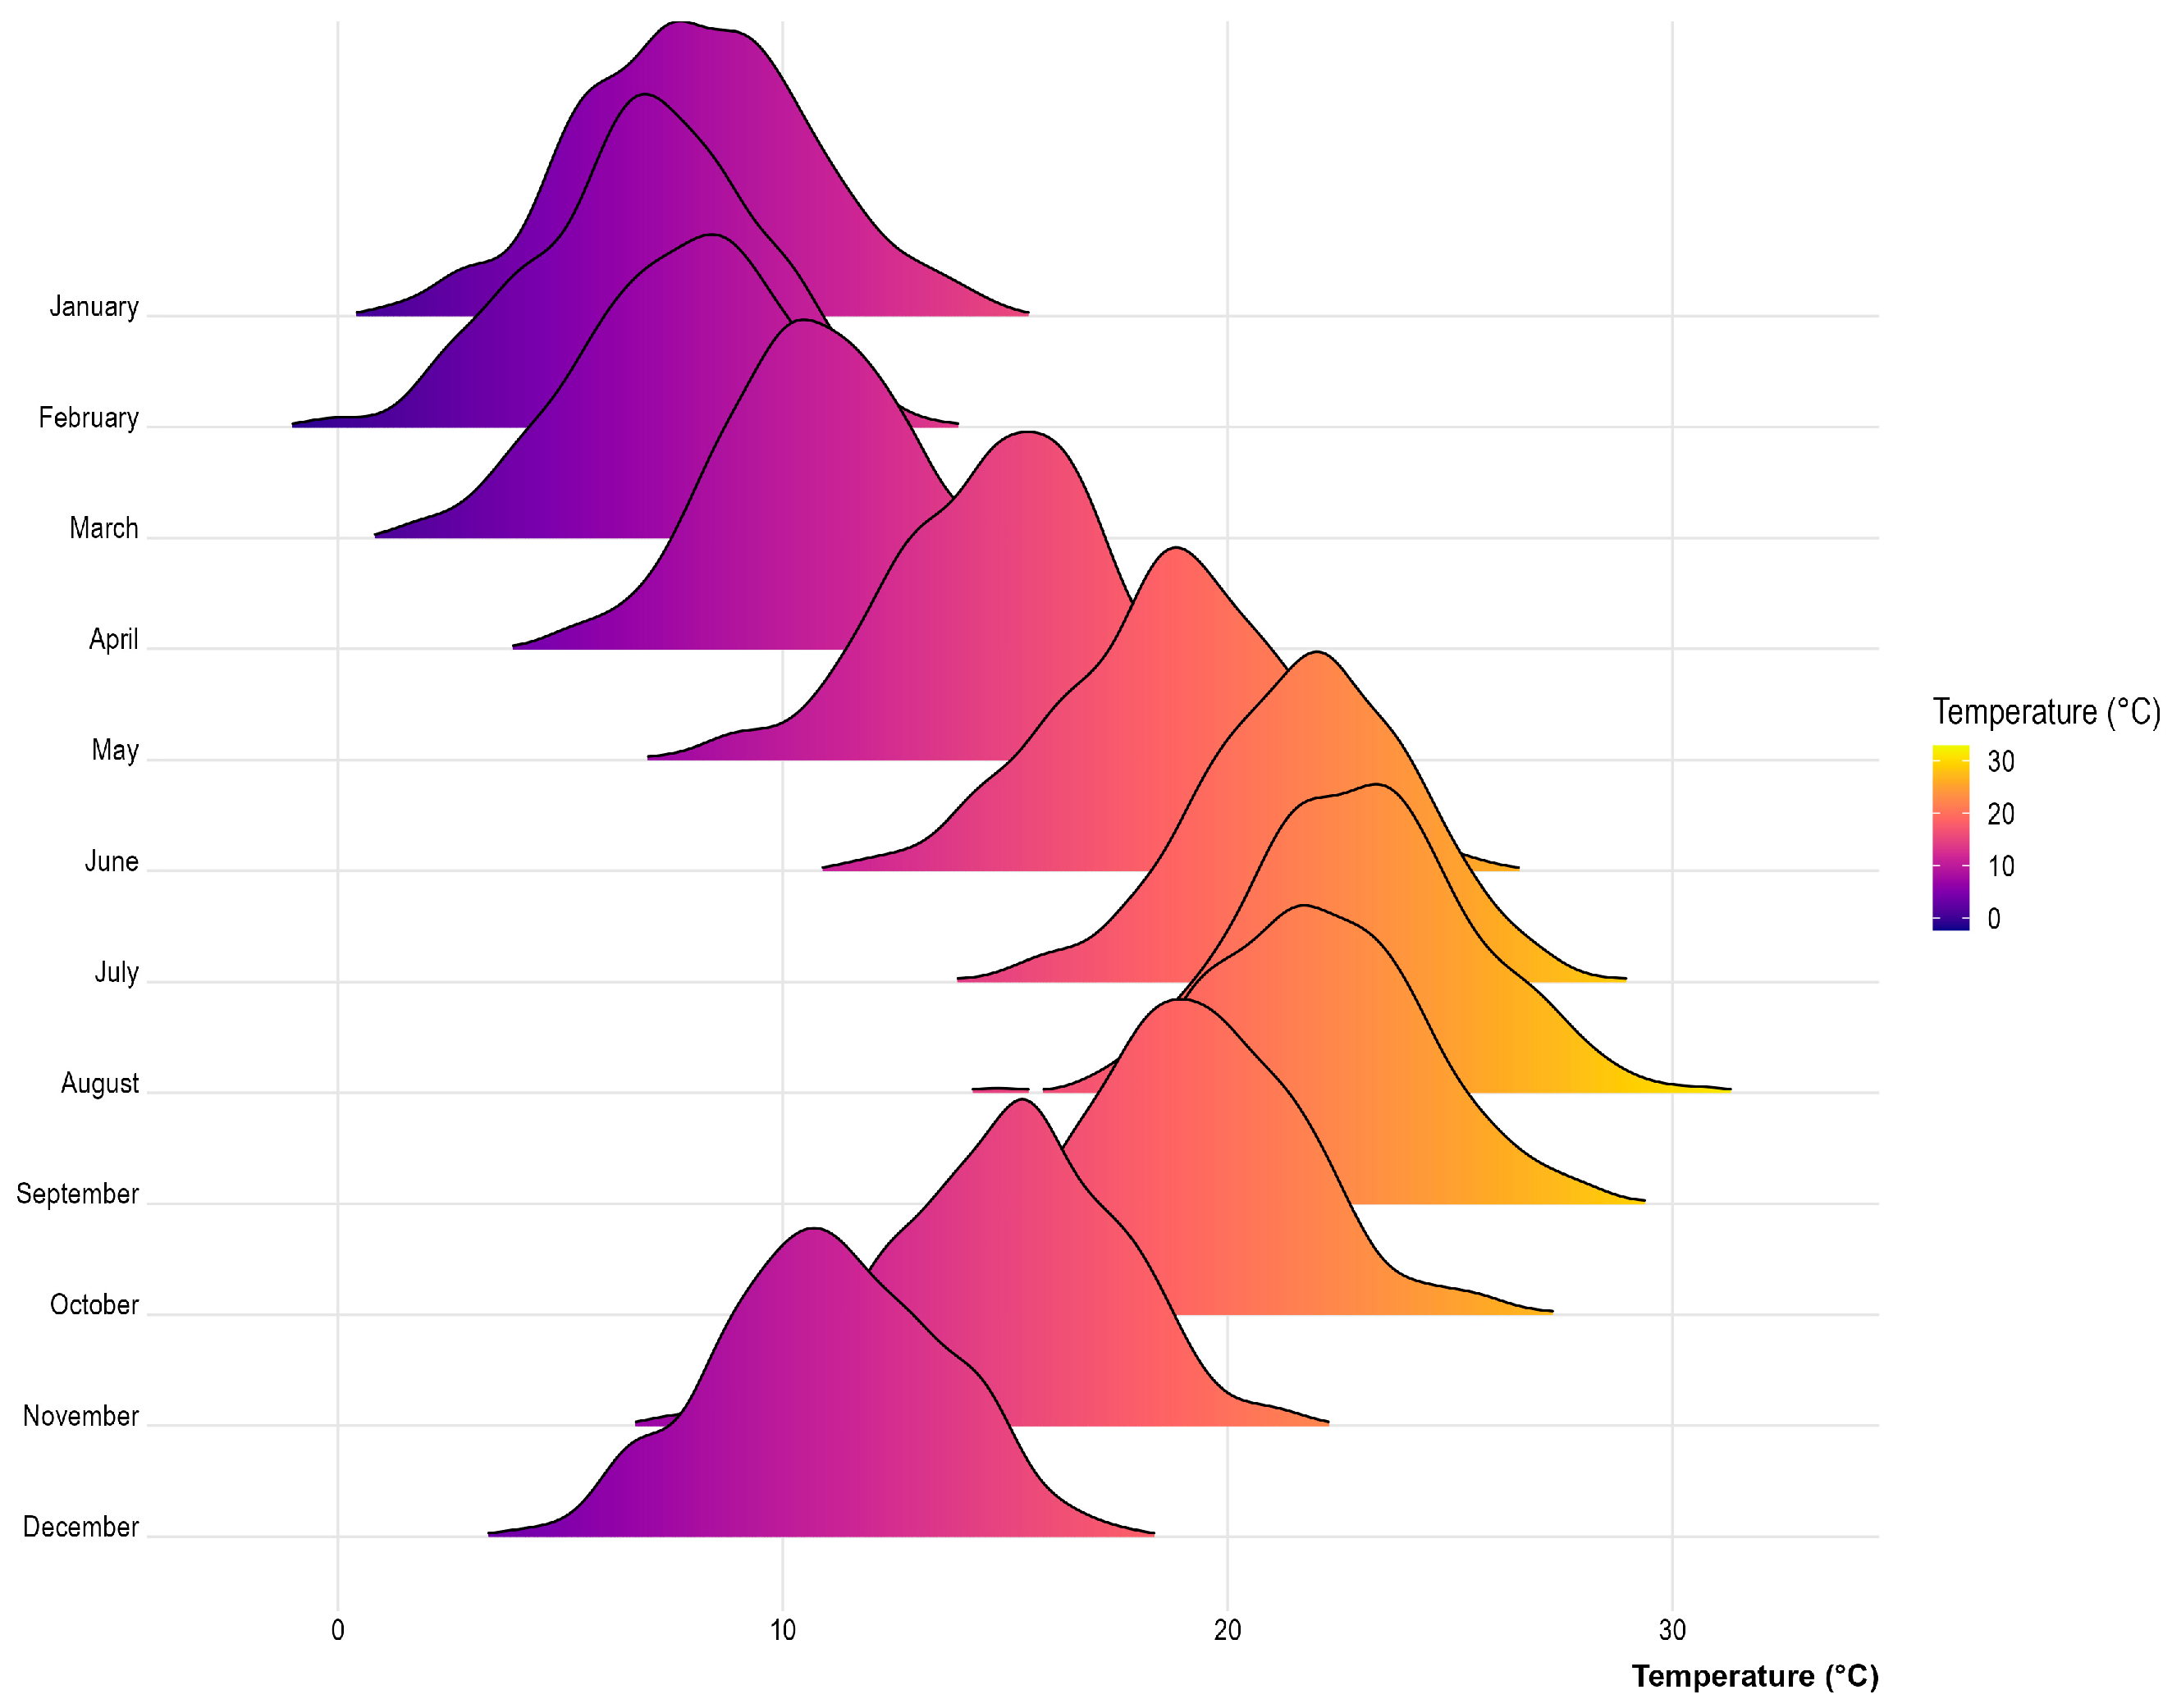
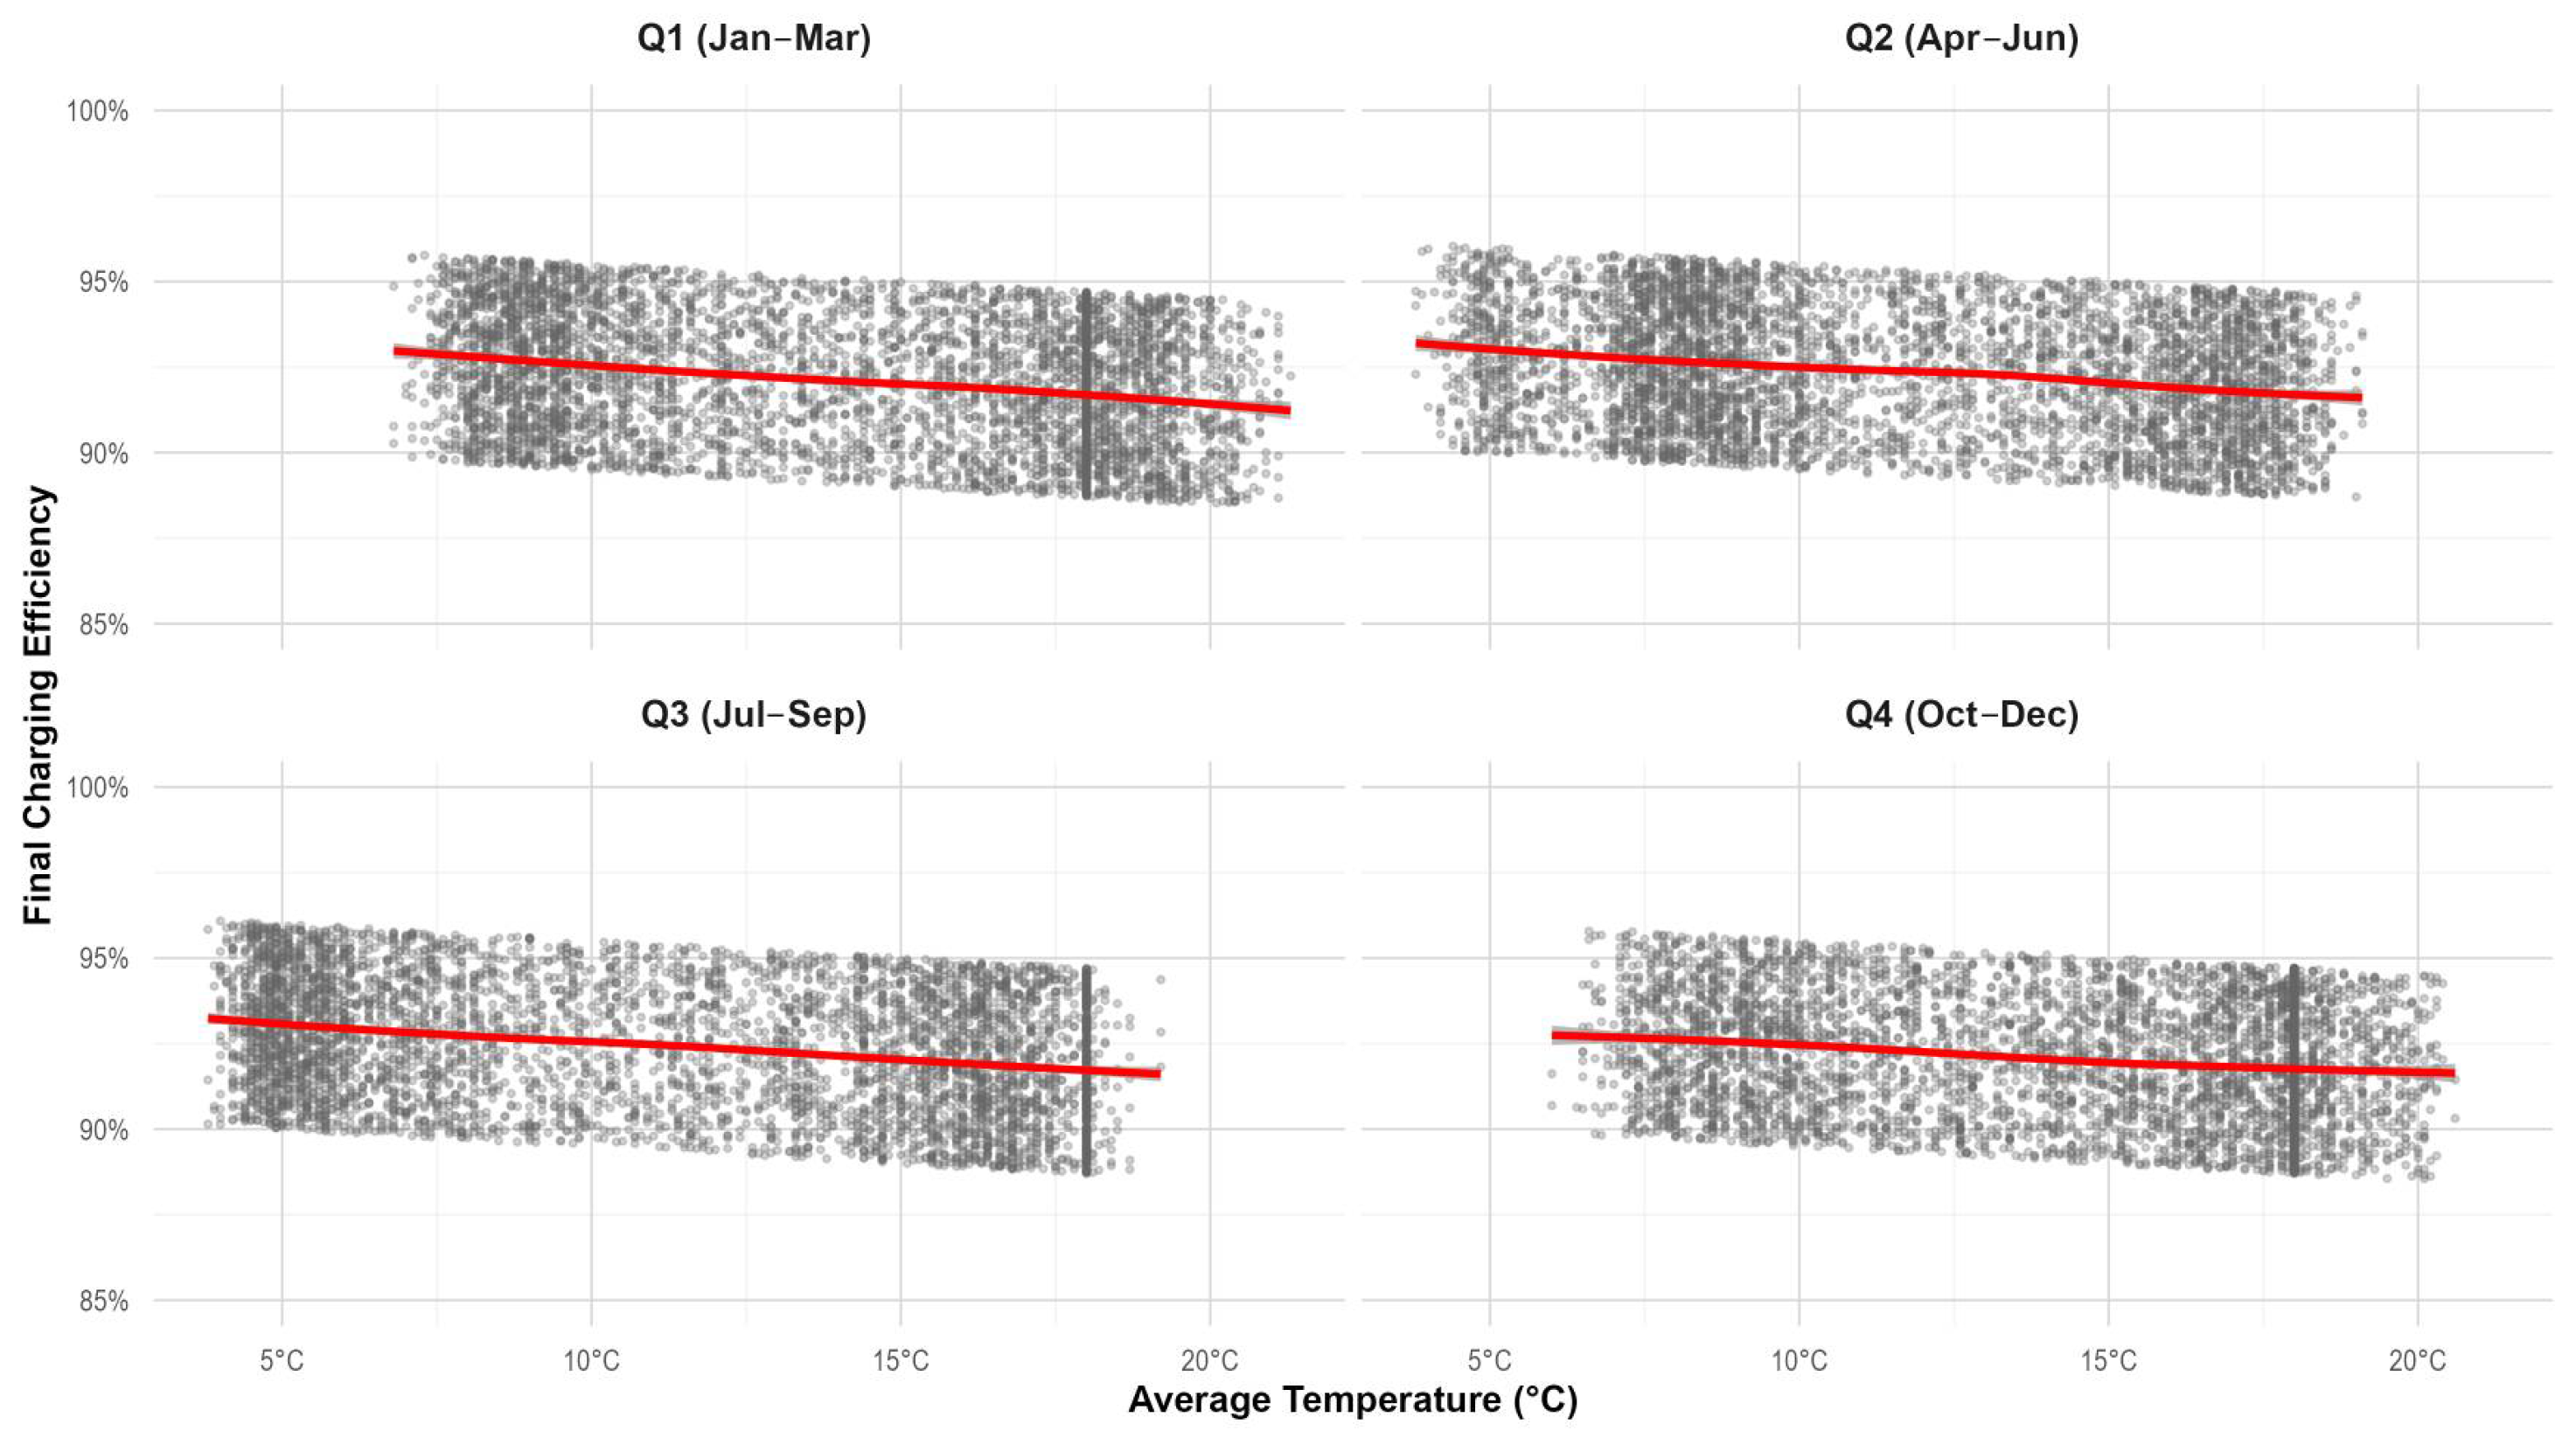
The thermal sensitivity analysis reveals a consistent negative correlation between ambient temperature and charging efficiency. For the observed range (5–25 °C), the average efficiency varies from 93% at low temperatures to 91% at high temperatures, with a slope of −0.1%/°C, which confirms the implemented correction parameters (Figure 12).
This analysis introduces specific climatic considerations for high-altitude cities based on the detailed temperature distributions shown in Figure A3 (Appendix A.3).

4. Discussion

4.1. Comparison with Alternative Methodological Approaches

The results validate the superiority of the Agent-Based Modelling (ABM) approach over purely statistical models in capturing behavioral heterogeneity. While previous studies using ARIMA [42] have achieved high accuracy under stable conditions (MAPE 3–5%), they fail to capture the mass synchronization events that our ABM accurately predicts.

4.2. Implications for Infrastructure Planning

Applying the cost-estimation framework developed by NREL to the projected peak demand of 350 MW in an unmanaged TOU tariff scenario, it is estimated that the required infrastructure upgrades could range from $200 to $400 million [43].

4.3. Specific Contributions for High-Altitude Cities

The identified thermal effects (−0.1%/°C on charging efficiency) provide specific parameters for Andean cities. While studies by [44] report more pronounced effects (−0.3%/°C) for extreme climates, the isothermal conditions of Quito-Pichincha exhibit more moderate variations.
These specific thermal parameters complement the implemented battery degradation models, whose comparative profiles by technology are detailed in Figure A4 (Appendix A.4).

4.4. Validation of Coincidence Factors

The dynamic coincidence factor ( F C = 0.222 + 0.036 e ( 0.0003 n ) ) validates and refines the findings of the work by [3], which documented a stabilized factor of 0.22 for scenarios with over 50,000 units. The current formulation is consistent with findings from the international scientific community, which report coincidence factors for unmanaged residential charging stabilize below 0.25 for fleets of more than 50 vehicles. The dynamic formulation provides greater accuracy for variable penetration scenarios, yielding a 70% reduction in demand overestimation relative to traditional models.

4.5. Physical Layer Constraints and Their Relevance for Long-Term Demand Modeling

A prospective analysis of energy demand towards 2040 must consider not only the evolution of user behavior but also that of charging technologies. While this study is based on wired charging data, the progressive introduction of Wireless Electric Vehicle Charging (WEVC) incorporates new physical layer constraints that have not been captured in the current model. Recent research [45] shows that vehicle misalignment on the charging pad, a stochastic user behavior, can generate excessive ohmic losses in the ground assembly, raising the surface temperature to risk levels defined by the IEC.
These dynamics have direct implications for agent-based models. Instead of assuming successful charging sessions with constant efficiency, the reality of WEVC introduces the possibility of session failures and efficiency variability. Both factors could lead to an underestimation of aggregate demand and the emergence of unexpected “rebound demand” peaks. For Quito, the effect could be more pronounced, given that the lower air density at high altitude reduces convective cooling capacity and amplifies the thermal risk.

5. Conclusions

This study demonstrates that a high-fidelity agent-based simulation approach, supported by Big Data architecture, is essential for urban energy planning in the era of electric mobility. The quantitative projections reveal exponential growth in demand in Pichincha, with temporal patterns that will challenge the existing infrastructure.

5.1. Answering the Research Questions and Hypothesis

This work is aimed at answering specific questions and validating a central hypothesis, the answers to which are summarized below:
Main Research Question: How can agent-based modeling, combined with Big Data architecture, provide actionable insights for electric vehicle (EV) charging infrastructure planning, while quantifying the risks of demand synchronization under time-of-use tariffs?
  • Answer: The developed methodological framework provides actionable insights by accurately quantifying future demand (a peak of 255 MW and 800 GWh annually by 2040), identifying and measuring previously underestimated systemic risks (the “cliff effect” which amplifies peak demand by 32%), and validating the effectiveness of specific mitigation strategies (smart charging reduces it by 18%). Big Data architecture is the enabling component that makes this metropolitan-scale simulation computationally feasible, processing data at 2398.7 records per second.
Specific Question 1 (RQ1): What are the probabilistic bounds for peak EV charging demand under different adoption and tariff scenarios?
  • Answer: For the year 2040, the model projects a peak demand in the baseline scenario of 255 MW, with a 95% confidence interval establishing the probabilistic bounds between 240 MW and 270 MW. The conservative and optimistic scenarios set the outer bounds of the planning range at 220.44 MW and 288.60 MW, respectively.
Specific Question 2 (RQ2): How do temperature variations and thermal effects influence charging profiles in high-altitude environments?
  • Answer: A consistent negative correlation between ambient temperature and charging efficiency has been quantified. The influence is estimated as an efficiency reduction of −0.1% per degree Celsius increase in temperature, providing a specific and validated correction parameter for planning in Andean cities.
Specific Question 3 (RQ3): What demand response mechanisms can mitigate the synchronization risks posed by simple TOU tariffs?
  • Answer: The most effective demand response mechanism to mitigate synchronization risk is smart charging management that incorporates stochastic (randomized) charging initiation. This strategy effectively desynchronizes aggregate demand and has been shown to reduce peak demand by 18 ± 2.5% compared to the baseline.
Central Hypothesis: Advanced demand-side management (DSM) strategies that incorporate stochastic charging initiation can reduce peak demand by >15% compared to unmanaged TOU tariffs.
  • Answer: The central hypothesis is strongly confirmed. The simulation demonstrates that advanced DSM strategies, through randomized charging initiation, reduce peak demand by 18 ± 2.5%, exceeding the established 15% threshold and thereby validating the core premise of the research.

5.2. Key Findings

  • Proven Methodological Scalability: The ABM-TimescaleDB architecture successfully processes over 13.5 million records with a throughput of 2398.7 records per second, demonstrating its viability for metropolitan-scale applications.
  • Precise Risk Quantification: The documented “cliff effect” (a 32% increase in peak demand) provides quantitative evidence for implementing smart management policies over simple TOU tariffs.
  • Validated Predictive Accuracy: A MAPE of 4.2 ± 0.8% surpasses established benchmarks for aggregate models and approaches the standards for individual applications, providing quantitative validation that previous studies had not established.
  • Specific High-Altitude Parameters: Thermal correction factors (−0.1%/°C) and a dynamic coincidence factor provide refined technical tools for planning in Andean cities, complementing and improving upon previous frameworks.

5.3. Implementation Recommendations

  • Utilize the optimistic scenario projections (289 MW) to avoid infrastructure undersizing, which represents an additional investment of $200–400 million but prevents future disruptions.
  • Implement randomized charging systems instead of simple time-of-use (TOU) tariffs to prevent mass synchronization effects. Their effectiveness depends on managed implementation to avoid the “cliff effect,” as demonstrated in this study.
  • Establish telemetry systems for the continuous validation and calibration of coincidence factors as EV penetration evolves.
  • Integrate thermal effects (−0.1%/°C) into capacity planning, particularly for seasonal demand peaks.

5.4. Limitations and Future Work

The validation of this study is limited by the paucity of real-world data corresponding to very high penetration scenarios (>50%). Future work should include validation against cities with high EV penetration and a sensitivity analysis for different tariff architectures.
It should be noted that while the analysis of the interaction between electric heating load and EV charging is a crucial research area in regions with cold climates, Quito’s temperate and stable year-round climate does not generate a systemic heating demand. Therefore, this load coupling is not considered a significant risk factor for the local grid and falls outside the scope of this study, which focuses on the risks of EV charging synchronization, a more immediate and relevant challenge for the region.
A promising avenue for future research is to develop a Vehicle-to-Grid (V2G) model for grid restoration, leveraging managed fleets like electric buses to bolster system resilience in the face of extreme events. This future study could build upon the baseline load profiles established in the present work.

Author Contributions

Conceptualization, I.S.-L. and M.A.-C.; methodology, I.S.-L.; software, I.S.-L.; validation, I.S.-L. and M.A.-C.; formal analysis, I.S.-L.; investigation, I.S.-L. and M.A.-C.; resources, M.A.-C.; data curation, I.S.-L.; writing—original draft preparation, I.S.-L.; writing—review and editing, M.A.-C.; visualization, I.S.-L.; supervision, M.A.-C.; project administration, M.A.-C. All authors have read and agreed to the published version of the manuscript.

Funding

This research received no external funding.

Data Availability Statement

The simulation data presented in this study are available upon request from the corresponding author due to data size limitations (>6.7 GB) and database complexity. The complete source code, simulation framework, and analysis scripts are openly available in the GitHub repository at “https://github.com/ivelec1981/ev-demand-modeling-abm-timescaledb.git (accessed on 12 August 2025)” [40]. The repository includes all necessary code to reproduce the simulation results, the database schema, and documentation for replication. Raw charging profile data and vehicle specifications used for model calibration contain proprietary information and are available upon request, subject to appropriate data sharing agreements.

Acknowledgments

The authors would like to acknowledge the SISAu Research Group and the Universidad Indoamerica for their institutional support throughout this research. We also thank Empresa Electrica Quito (EEQ) for providing access to charging infrastructure data, which made this study possible.

Conflicts of Interest

The authors declare no conflicts of interest.

Abbreviations

The following abbreviations are used in this manuscript:
ABMAgent-Based Modelling (Agent-Based Modelling)
APIApplication Programming Interface
AEADEAsociación de Empresas Automotrices del Ecuador
BMSBattery Management System
CFCoincidence Factor
DRDemand Response
DSMDemand Side Management
EEQEmpresa Eléctrica Quito
ENEMEstrategia Nacional de Electromovilidad
FCCoincidence Factor
GPUGraphics Processing Unit
ICConfidence Interval
INAMHIInstituto Nacional de Meteorología e Hidrología del Ecuador
LFPLithium Iron Phosphate
LLMLarge Language Model
MAPEMean Absolute Percentage Error
NCMNickel Cobalt Manganese
NRELNational Renewable Energy Laboratory
RDBMSRelational Database Management System
RMSERoot Mean Square Error
SoCState of Charge
SoHState of Health
SQLStructured Query Language
TOUTime of Use
TSDBTime Series Database
UNESCOUnited Nations Educational, Scientific and Cultural Organisation
V2GVehicle-to-Grid
EVElectric Vehicle

Appendix A

Appendix A.1

The tariff structure implemented for EV charging is based on a time-of-use (TOU) scheme that differentiates electricity costs between weekdays and weekends.
As detailed in Figure A1, the weekday tariff is segmented into three periods:
  • Off-Peak. From 00:00 to 06:00 and from 22:00 to 24:00, there is a reduced cost of $0.05/kWh.
  • Standard. From 06:00 to 18:00, with an intermediate rate of $0.08/kWh.
  • Peak. From 18:00 to 22:00, the highest rate of $0.10/kWh is applied to discourage charging during these peak demand hours.
Conversely, the structure for weekends is simpler and promotes charging during most of the day:
  • Off-Peak. An extended period from 00:00 to 18:00 and from 22:00 to 24:00, maintaining the minimum rate of $0.05/kWh.
  • Peak. The same period, from 18:00 to 22:00, is maintained at the $0.10/kWh rate, coinciding with the residential demand peak.
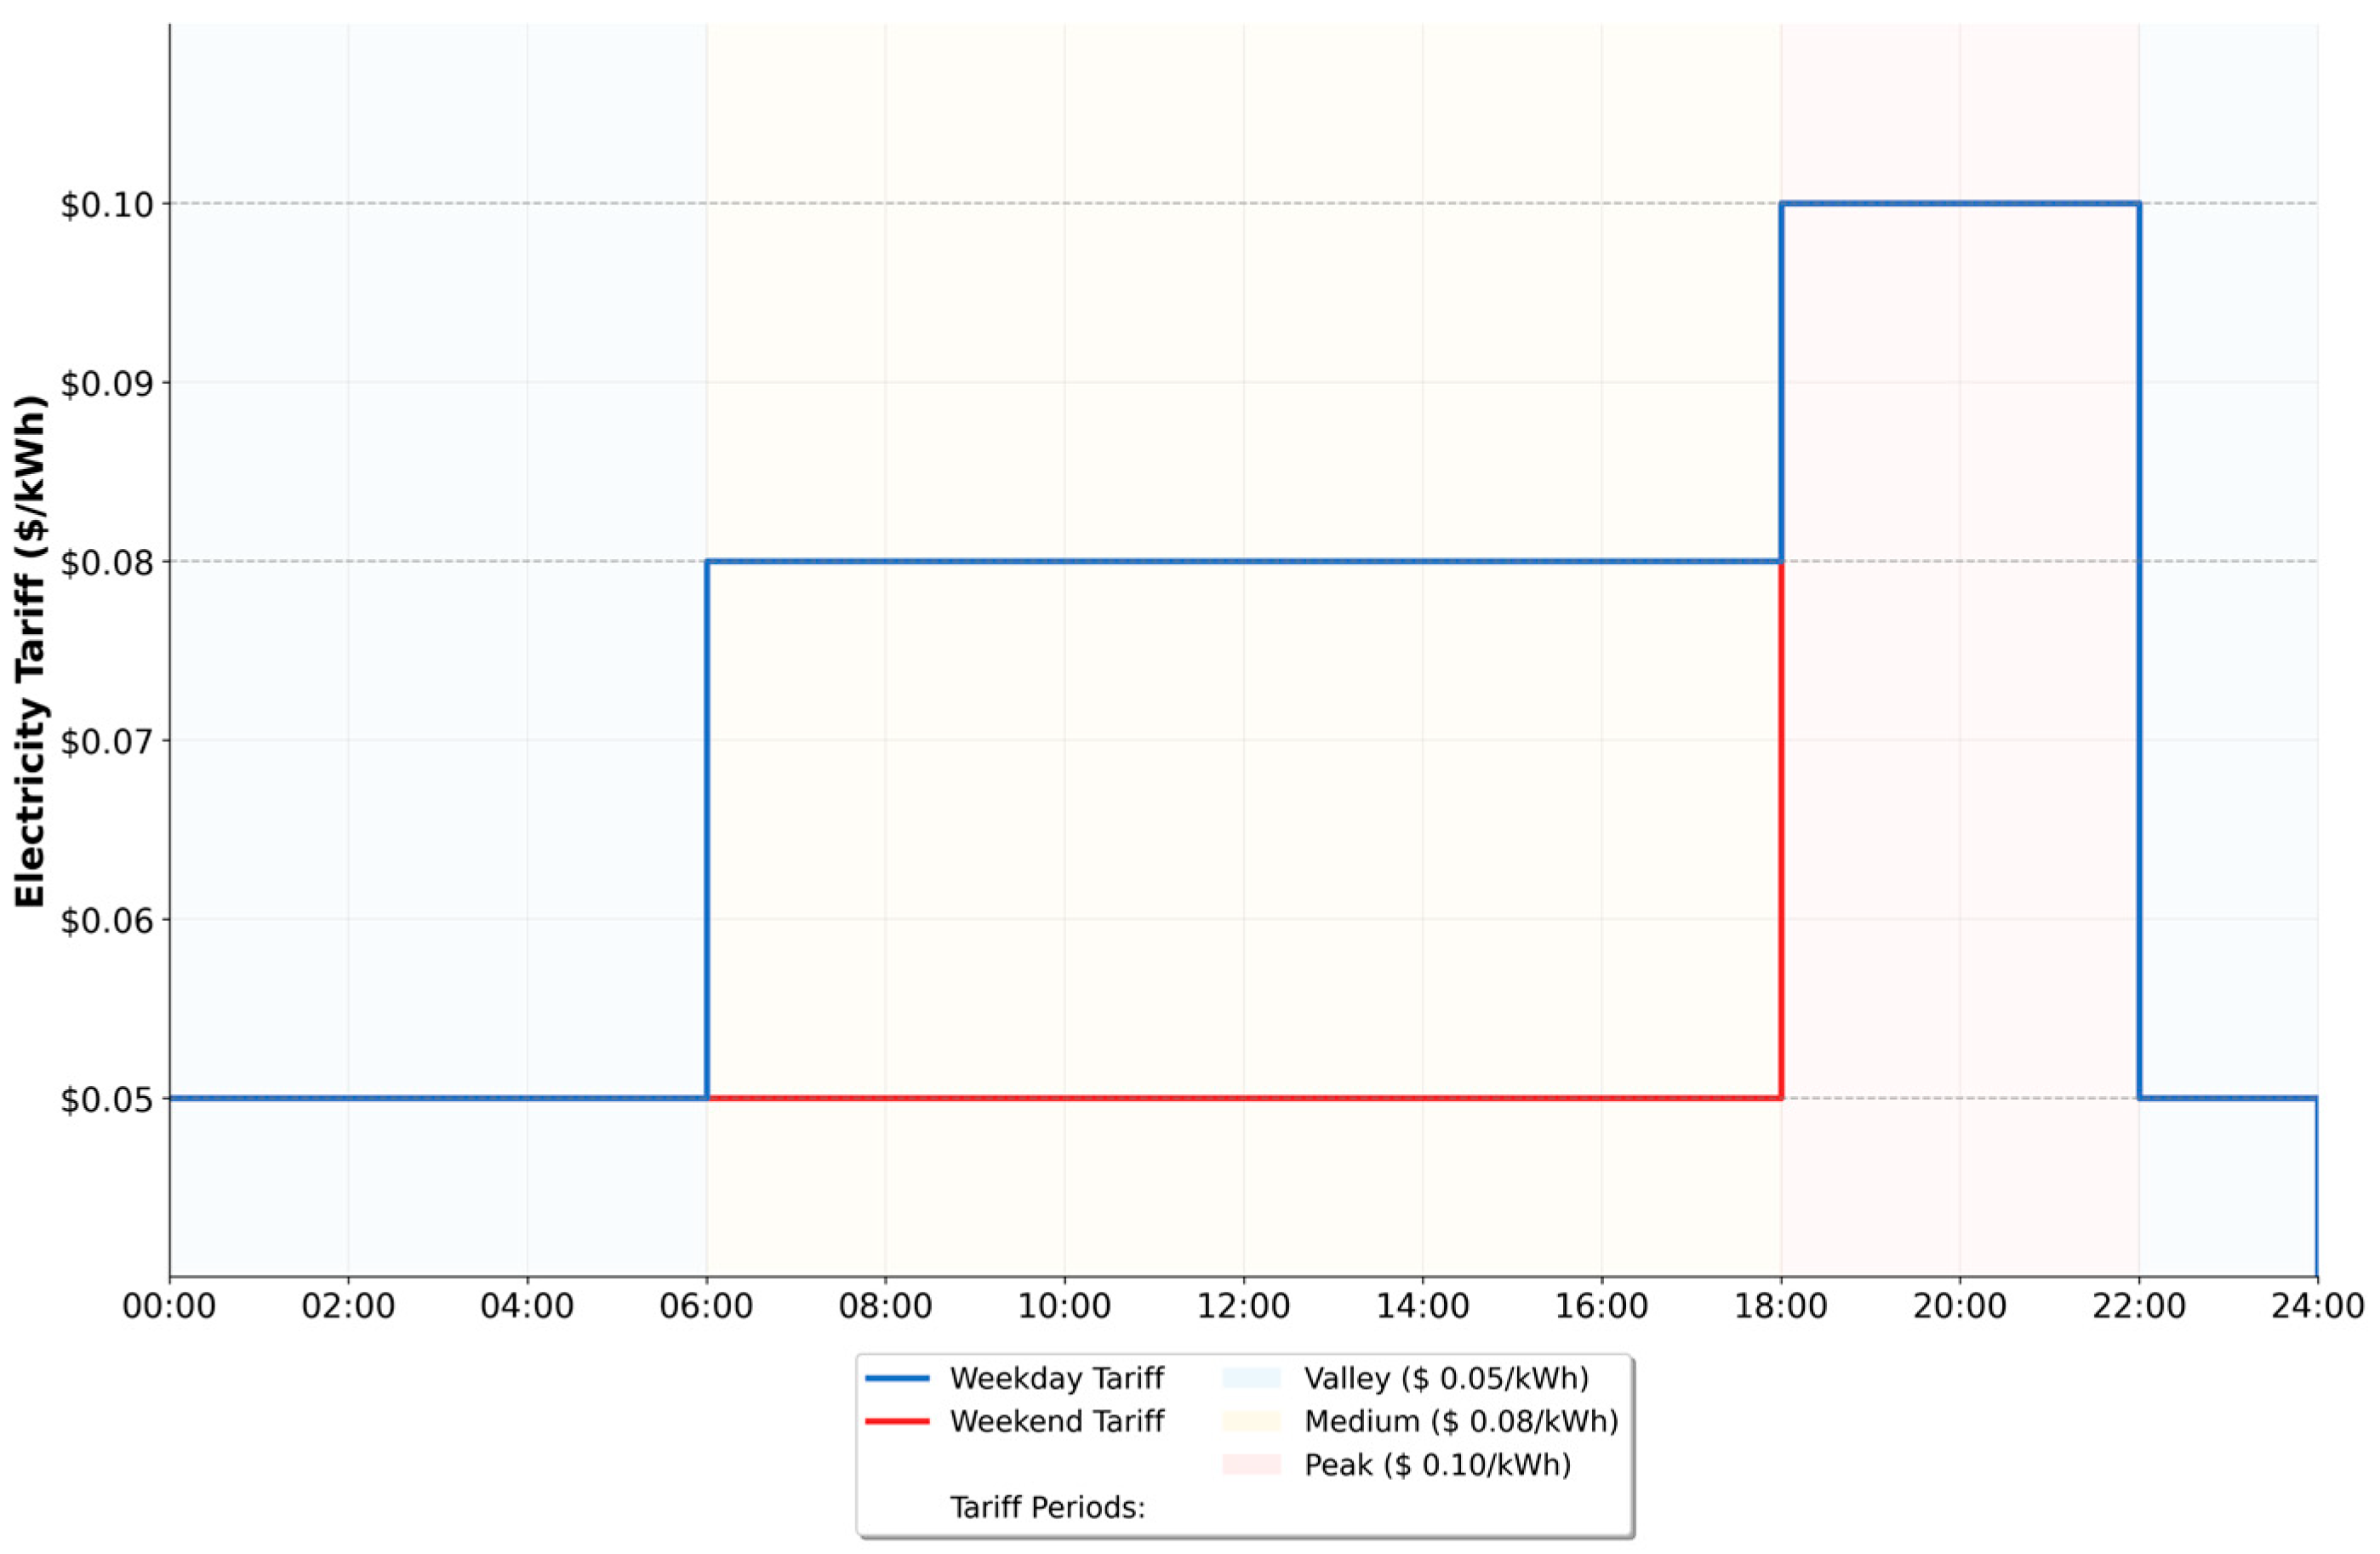
Figure A1. Comparison of Electricity Tariffs by Time of Day for Electric Vehicle Charging Infrastructure.
Energies 18 05429 g0a1

Appendix A.2

Figure A2 presents the detailed temporal evolution of the electric vehicle charging demand profiles for every day in the month of December, from 2025 to 2040. Each subplot corresponds to a specific day (e.g., 1 December, 2 December, etc.) and displays the hourly consumption pattern over a 24-h period at a quarter-hour resolution.
Figure A2. Temporal Evolution of Quarter-Hourly EV Consumption Profiles During the Month of December (2025–2040).
Energies 18 05429 g0a2

Appendix A.3

Figure A3 presents the probability density distributions of ambient temperature (°C) for each month of the year, developed from a historical record of over three years from eight meteorological stations in Pichincha.
The temperature distributions for the twelve months of the year are significantly overlapped, with their modes (peaks of highest probability) contained within a narrow range, from approximately 18 °C to 22 °C.
Despite this overall stability, a subtle bimodal pattern of thermal seasonality can be discerned. A primary period of higher temperatures extends from June to September. During these months, the distributions shift to the right, with modes reaching and exceeding 20 °C. August emerges as the month with the highest temperature distribution, both in its central value and in the extent of its right tail.
The months of January and February constitute a second, shorter, and less pronounced period of relatively warmer temperatures compared to the immediately following months.
Conversely, the periods from March to May and from October to December exhibit temperature distributions shifted to the left, indicating relatively cooler conditions. During these months, the modes of the distributions are situated in the low range of the annual spectrum, around 18–19 °C.
Figure A3. Probability Density Distributions of Monthly Temperatures in Quito, Pichincha.
Energies 18 05429 g0a3

Appendix A.4

The battery degradation profiles presented in Figure A4 model the decline in the State of Health (SoH) over a 20-year lifespan for four distinct battery chemistries used in electric vehicles (EVs).
The comparative analysis reveals significant differences in the longevity of each technology:
  • NCM (Nickel-Manganese-Cobalt) Battery. It exhibits the most pronounced degradation rate, dropping below the 80% replacement threshold in approximately the fourth year of use and reaching less than 50% of its original capacity by the end of 20 years.
  • LFP (Lithium Iron Phosphate) Battery. It offers considerably greater durability than NCM. Its SoH remains above 80% until approximately year 11 and crosses the 70% threshold around year 18.
  • NextGen and Solid-State Batteries. Both emerging technologies exhibit minimal degradation and superior performance. Their profiles are nearly identical, maintaining a SoH near 80% even after 20 years, indicating an extended lifespan that far exceeds current standards.
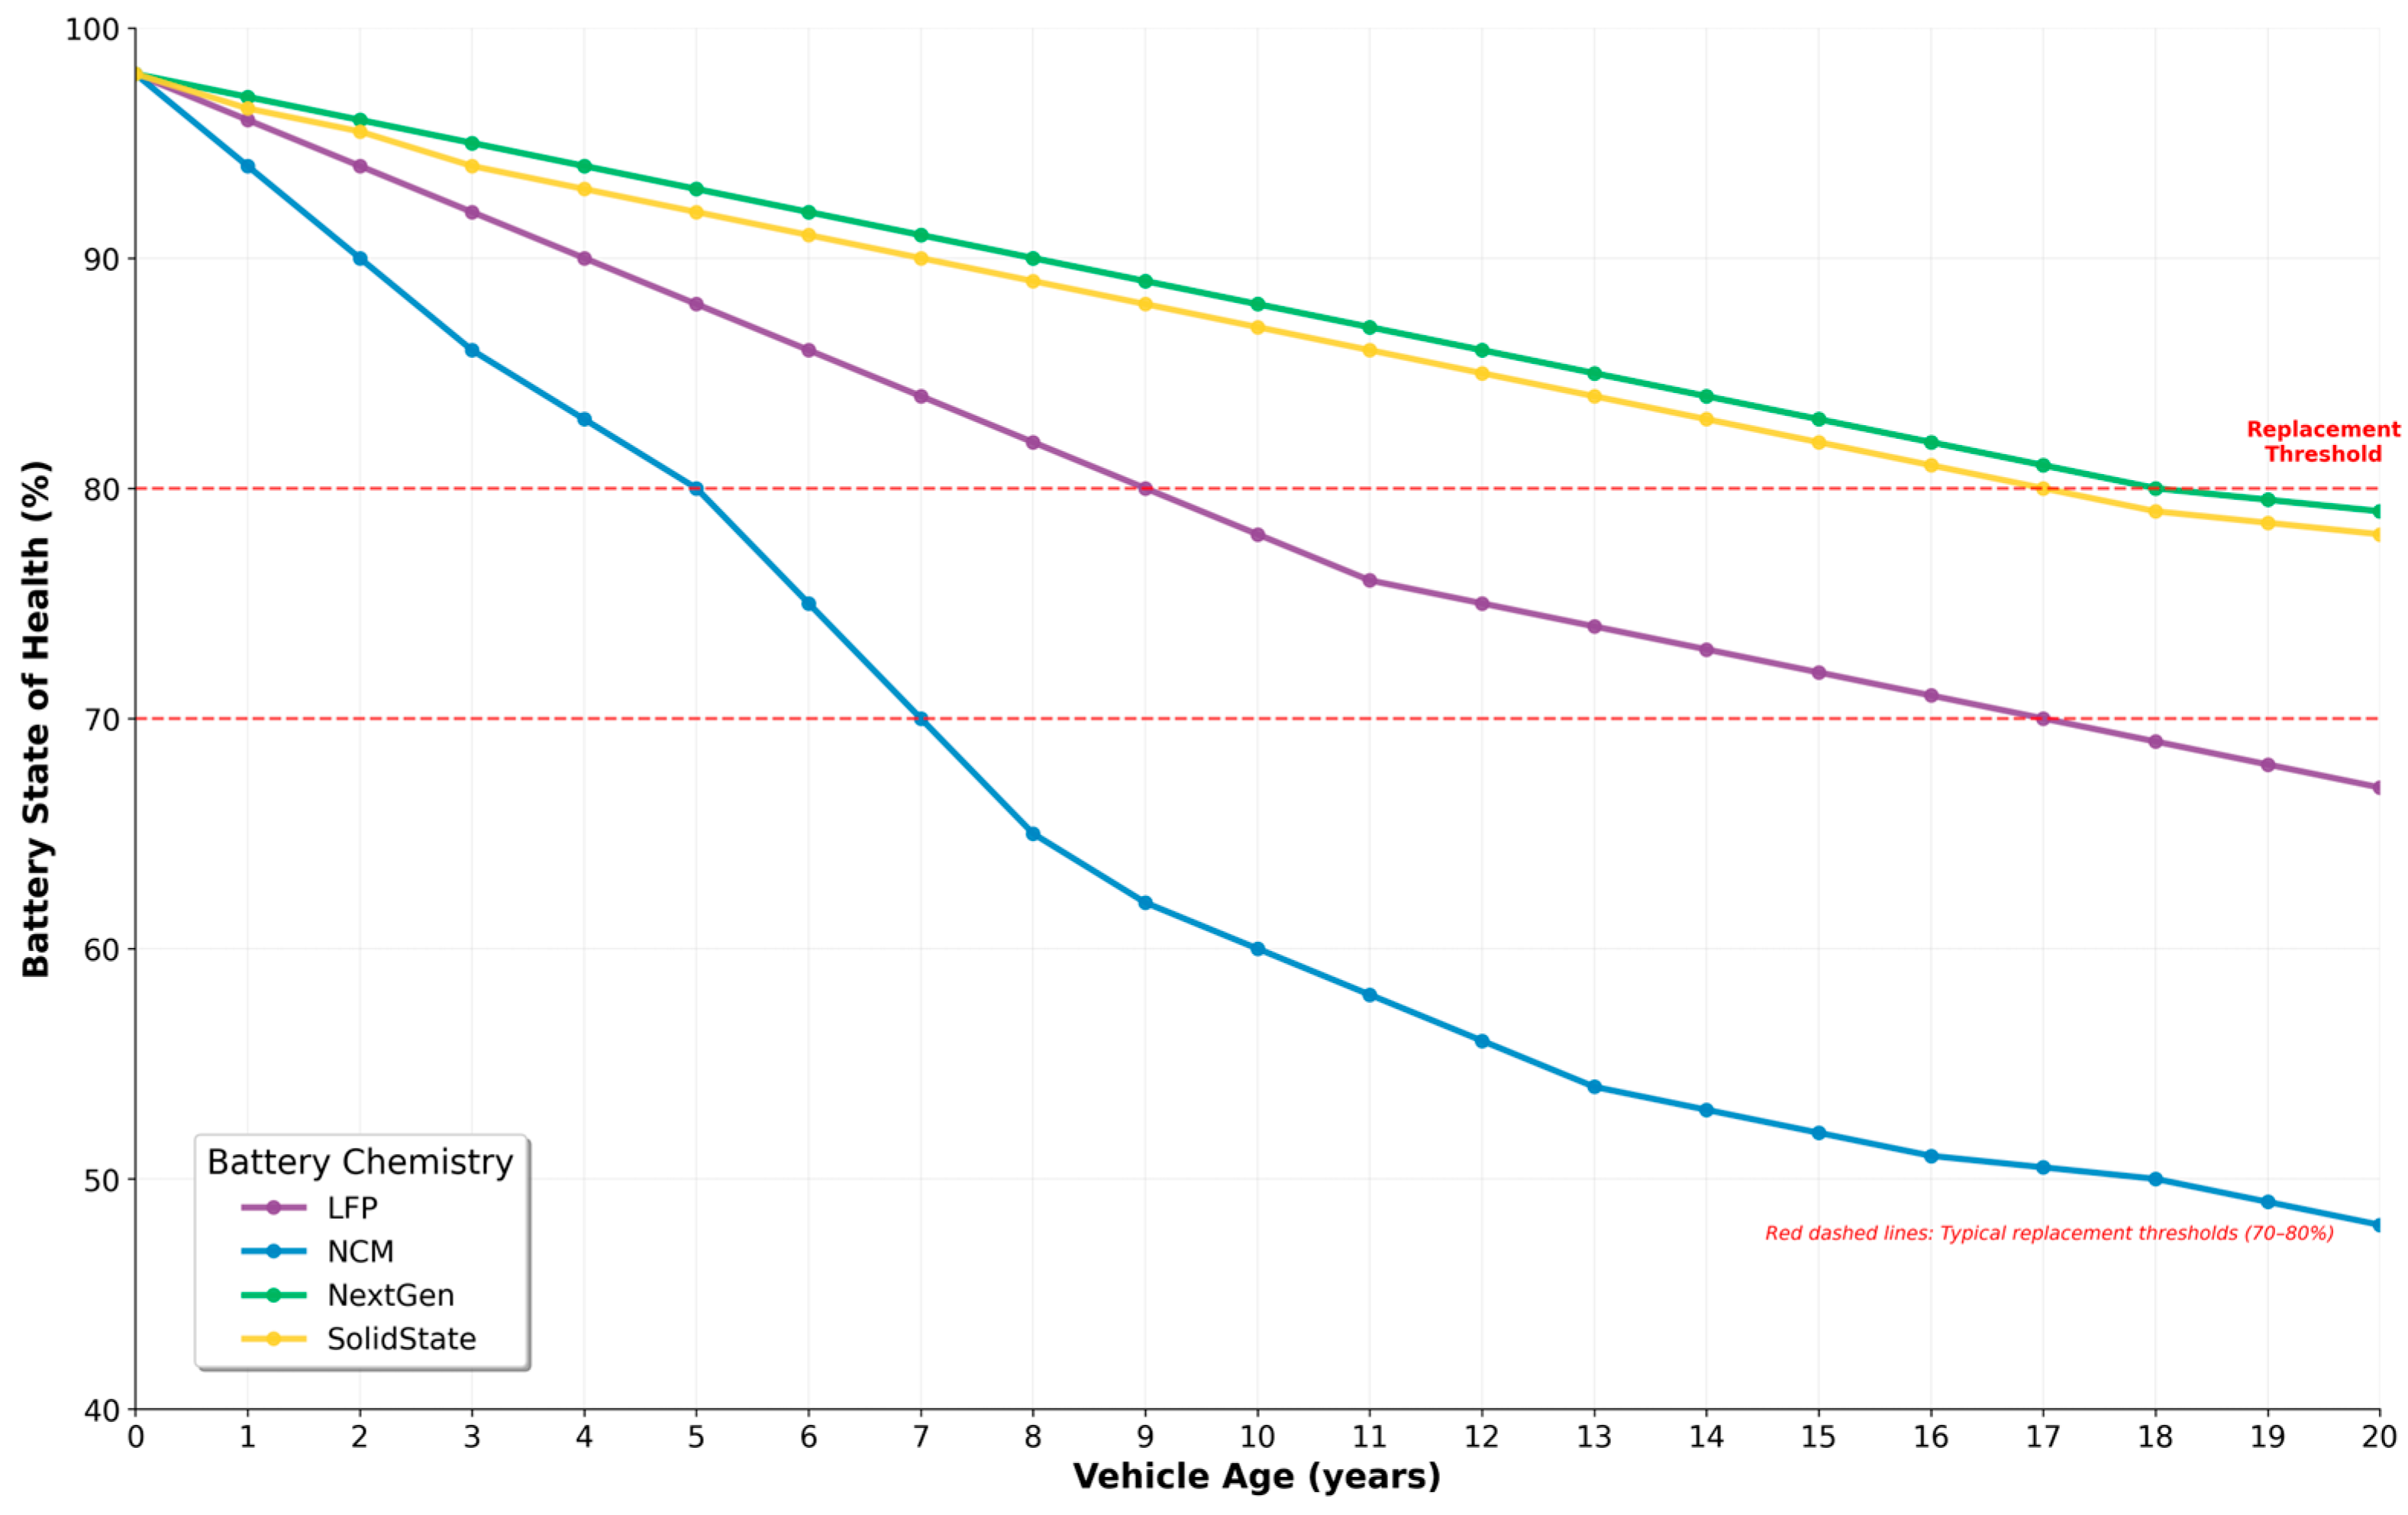
The dashed lines at 80% and 70% mark the typical industry thresholds at which battery replacement is considered to ensure adequate vehicle range and performance.
Figure A4. Comparative Degradation Profiles of the State of Health (SoH) for EV Batteries by Chemistry.
Energies 18 05429 g0a4

References

  1. González, L.G.; Cordero-Moreno, D.; Espinoza, J.L. Public transportation with electric traction: Experiences and challenges in an Andean city. Renew. Sustain. Energy Rev. 2021, 141, 110768. [Google Scholar] [CrossRef]
  2. Dávila-Sacoto, M.; Toledo, M.A.; Hernández-Callejo, L.; González, L.G.; Alvarez Bel, C.; Zorita-Lamadrid, Á.L. Location of Electric Vehicle Charging Stations in Inter-Andean Corridors Considering Road Altitude and Nearby Infrastructure. Sustainability 2023, 15, 16582. [Google Scholar] [CrossRef]
  3. Sánchez Loor, L.I. Modelo Para la Proyección de Vehículos Eléctricos Particulares en el Ecuador y Sus Requerimientos de Demanda, Utilizando Patrones de Crecimiento Logístico y Simulación de Montecarlo. Master’s Thesis, Escuela Politecnica Nacional, Quito, Ecuador, 2022. Available online: https://bibdigital.epn.edu.ec/handle/15000/23435 (accessed on 12 August 2025).
  4. Cal y Mayor y Asociados. Plan Maestro de Movilidad Sostenible del Distrito Metropolitano de Quito–PMMS DMQ (2023–2042); Cal y Mayor y Asociados: Quito, Ecuador, 2024. [Google Scholar]
  5. HINICIO. Estrategia Nacional de Electromovilidad para Ecuador; BID: Washington, DC, USA, 2021. [Google Scholar]
  6. Ministerio de Energia y Minas. Plan Maestro de Electricidad 2023–2032; BID: Washington, DC, USA, 2024. [Google Scholar]
  7. Liu, J.; Zhuge, C.; Tang, J.H.C.G.; Meng, M.; Zhang, J. A spatial agent-based joint model of electric vehicle and vehicle-to-grid adoption: A case of Beijing. Appl. Energy 2022, 310, 118581. [Google Scholar] [CrossRef]
  8. Asociación de Empresas Automotrices del Ecuador. Anuario 2024; AEADE: Quito, Ecuador, 2024; Available online: https://www.aeade.net/wp-content/uploads/2025/03/AEADE-ANUARIO-2024_digital.pdf (accessed on 17 July 2025).
  9. Yu, Q.; Wang, Z.; Song, Y.; Shen, X.; Zhang, H. Potential and flexibility analysis of electric taxi fleets V2G system based on trajectory data and agent-based modeling. Appl. Energy 2024, 355, 122323. [Google Scholar] [CrossRef]
  10. Brady, J.; O’Mahony, M. Travel to work in Dublin. The potential impacts of electric vehicles on climate change and urban air quality. Transp. Res. Part Transp. Environ. 2011, 16, 188–193. [Google Scholar] [CrossRef]
  11. Flath, C.M.; Ilg, J.P.; Gottwalt, S.; Schmeck, H.; Weinhardt, C. Improving Electric Vehicle Charging Coordination Through Area Pricing. Transp. Sci. 2014, 48, 619–634. [Google Scholar] [CrossRef]
  12. Foley, A.; Tyther, B.; Calnan, P.; Ó Gallachóir, B. Impacts of Electric Vehicle charging under electricity market operations. Appl. Energy 2013, 101, 93–102. [Google Scholar] [CrossRef]
  13. Grunewald, P.; Diakonova, M. Flexibility, dynamism and diversity in energy supply and demand: A critical review. Energy Res. Soc. Sci. 2018, 38, 58–66. [Google Scholar] [CrossRef]
  14. Helmus, J.R.; Lees, M.H.; Van Den Hoed, R. A data driven typology of electric vehicle user types and charging sessions. Transp. Res. Part C Emerg. Technol. 2020, 115, 102637. [Google Scholar] [CrossRef]
  15. Xing, Y.; Li, F.; Sun, K.; Wang, D.; Chen, T.; Zhang, Z. Multi-type electric vehicle load prediction based on Monte Carlo simulation. Energy Rep. 2022, 8, 966–972. [Google Scholar] [CrossRef]
  16. Hashemi, S.; Østergaard, J. Methods and strategies for overvoltage prevention in low voltage distribution systems with PV. IET Renew. Power Gener. 2017, 11, 205–214. [Google Scholar] [CrossRef]
  17. Lojowska, A.; Kurowicka, D.; Papaefthymiou, G.; Van Der Sluis, L. Stochastic Modeling of Power Demand Due to EVs Using Copula. IEEE Trans. Power Syst. 2012, 27, 1960–1968. [Google Scholar] [CrossRef]
  18. Maigha; Crow, M.L. Cost-Constrained Dynamic Optimal Electric Vehicle Charging. IEEE Trans. Sustain. Energy 2017, 8, 716–724. [Google Scholar] [CrossRef]
  19. Prehofer, C.; Mehmood, S. Big Data Architectures for Vehicle Data Analysis. In Proceedings of the 2020 IEEE International Conference on Big Data (Big Data), Atlanta, GA, USA, 10–13 December 2020; pp. 3404–3412. [Google Scholar] [CrossRef]
  20. Wehrmeister, K.; Pastor, A.; Carreras Rodriguez, L.; Monti, A. Big Data Reference Architecture for the Energy Sector. Sustainability 2025, 17, 6488. [Google Scholar] [CrossRef]
  21. Liu, R.; Yuan, J.; Huang, X. Benchmarking Time Series Databases with IoTDB-Benchmark for IoT Scenarios. arXiv 2019. [Google Scholar] [CrossRef]
  22. Li, Y.; Jenn, A. Impact of electric vehicle charging demand on power distribution grid congestion. Proc. Natl. Acad. Sci. USA 2024, 121, e2317599121. [Google Scholar] [CrossRef]
  23. Wang, B.; Zhao, D.; Dehghanian, P.; Tian, Y.; Hong, T. Aggregated Electric Vehicle Load Modeling in Large-Scale Electric Power Systems. IEEE Trans. Ind. Appl. 2020, 56, 5796–5810. [Google Scholar] [CrossRef]
  24. Birk Jones, C.; Vining, W.; Lave, M.; Haines, T.; Neuman, C.; Bennett, J.; Scoffield, D.R. Impact of Electric Vehicle customer response to Time-of-Use rates on distribution power grids. Energy Rep. 2022, 8, 8225–8235. [Google Scholar] [CrossRef]
  25. Deori, L.; Margellos, K.; Prandini, M. On the connection between Nash equilibria and social optima in electric vehicle charging control games. IFAC-Pap. 2017, 50, 14320–14325. [Google Scholar] [CrossRef]
  26. Torres-Moscoso, D.F.; Cordero-Moreno, D.G.; Tonon-Ordóñez, L.B.; Fernández-Palomeque, E.E. Análisis Financiero para la Implementación de un Bus Eléctrico Urbano en la Ciudad de Cuenca. Econ. Negocios 2022, 13, 133–149. [Google Scholar] [CrossRef]
  27. Maita Jaramillo, L.; Díaz-Sinche, D. Advancing Electric Mobility in Andean Countries: A Systematic Review and Case Study of Ecuador. Sustainability 2025, 17, 8075. [Google Scholar] [CrossRef]
  28. Amara-Ouali, Y.; Goude, Y.; Massart, P.; Poggi, J.-M.; Yan, H. A Review of Electric Vehicle Load Open Data and Models. Energies 2021, 14, 2233. [Google Scholar] [CrossRef]
  29. Buzna, L.; De Falco, P.; Ferruzzi, G.; Khormali, S.; Proto, D.; Refa, N.; Straka, M.; Van Der Poel, G. An ensemble methodology for hierarchical probabilistic electric vehicle load forecasting at regular charging stations. Appl. Energy 2021, 283, 116337. [Google Scholar] [CrossRef]
  30. Zhang, K.; Xu, L.; Ouyang, M.; Wang, H.; Lu, L.; Li, J.; Li, Z. Optimal decentralized valley-filling charging strategy for electric vehicles. Energy Convers. Manag. 2014, 78, 537–550. [Google Scholar] [CrossRef]
  31. Zhou, Y.; Wang, M.; Hao, H.; Johnson, L.; Wang, H.; Hao, H. Plug-in electric vehicle market penetration and incentives: A global review. Mitig. Adapt. Strateg. Glob. Chang. 2015, 20, 777–795. [Google Scholar] [CrossRef]
  32. Yuan, J.; Zeng, X.; Zhou, J.; Li, J.; Lv, J.; Chen, R.; Chen, K.; Yang, W.; Zhang, Y. Data-driven real-time home energy management system based on adaptive dynamic programming. Electr. Power Syst. Res. 2025, 238, 111055. [Google Scholar] [CrossRef]
  33. Ruan, J.; Liu, G.; Qiu, J.; Liang, G.; Zhao, J.; He, B.; Wen, F. Time-varying price elasticity of demand estimation for demand-side smart dynamic pricing. Appl. Energy 2022, 322, 119520. [Google Scholar] [CrossRef]
  34. Zhu, X.; Nie, X.; Liu, J. Time Series Database Optimization Based on InfluxDB. In Proceedings of the 2023 International Conference on Power, Electrical Engineering, Electronics and Control (PEEEC), Athens, Greece, 25–27 September 2023; pp. 879–885. [Google Scholar] [CrossRef]
  35. Hayajneh, H.S.; Bani Salim, M.N.; Bashetty, S.; Zhang, X. Optimal Planning of Battery-Powered Electric Vehicle Charging Station Networks. In Proceedings of the 2019 IEEE Green Technologies Conference(GreenTech), Lafayette, LA, USA, 3–6 April 2019; pp. 1–4. [Google Scholar] [CrossRef]
  36. Chen, H.; Liu, G.F.; Zhang, D.; Qin, T.; Sun, X.K. A study of performance comparison of databases for HALF data archiving system. J. Instrum. 2023, 18, P12015. [Google Scholar] [CrossRef]
  37. Rudakov, V.; Timur, M.; Yedilkhan, A. Comparison of Time Series Databases. In Proceedings of the 2023 17th International Conference on Electronics Computer and Computation (ICECCO), Kaskelen, Kazakhstan, 1–2 June 2023; pp. 1–4. [Google Scholar] [CrossRef]
  38. Bollerslev, J.; Andersen, P.B.; Jensen, T.V.; Marinelli, M.; Thingvad, A.; Calearo, L.; Weckesser, T. Coincidence Factors for Domestic EV Charging From Driving and Plug-In Behavior. IEEE Trans. Transp. Electrif. 2022, 8, 808–819. [Google Scholar] [CrossRef]
  39. Opstad, A.; Bekken, B.H.; Nygård, H.S.; Doorman, G.; Sevdari, K. Flexibility from Electric Vehicles-Residential Charging Coincidence Factors in Norway; CIGRE: Paris, France, 2024. [Google Scholar]
  40. Sanchez-Loor, I. Ev-Demand-Modeling-Abm-Timescaledb. Available online: https://github.com/ivelec1981/ev-demand-modeling-abm-timescaledb.git (accessed on 12 August 2025).
  41. Aldossary, M.; Alharbi, H.A.; Ayub, N. Optimizing Electric Vehicle (EV) Charging with Integrated Renewable Energy Sources: A Cloud-Based Forecasting Approach for Eco-Sustainability. Mathematics 2024, 12, 2627. [Google Scholar] [CrossRef]
  42. Chaudhari, K.; Kandasamy, N.K.; Krishnan, A.; Ukil, A.; Gooi, H.B. Agent-Based Aggregated Behavior Modeling for Electric Vehicle Charging Load. IEEE Trans. Ind. Inform. 2019, 15, 856–868. [Google Scholar] [CrossRef]
  43. Islam, E.; Vijayagopal, R.; Rousseau, A. A Comprehensive Simulation Study to Evaluate Future Vehicle Energy and Cost Reduction Potential; Argonne National Laboratory (ANL): Argonne, IL, USA, 2022; p. ANL/ESD--22/6, 2204856, 179337. [CrossRef]
  44. Lee, D.; Reinicke, N.; Wood, E.; Burrell, E. Electric Vehicle Infrastructure Projection Tool (Evi-Pro); National Renewable Energy Lab. (NREL): Golden, CO, USA, 2021. Available online: https://www.osti.gov/biblio/1764904 (accessed on 17 July 2025).
  45. Niu, S.; Yu, H.; Niu, S.; Jian, L. Power loss analysis and thermal assessment on wireless electric vehicle charging technology: The over-temperature risk of ground assembly needs attention. Appl. Energy 2020, 275, 115344. [Google Scholar] [CrossRef]
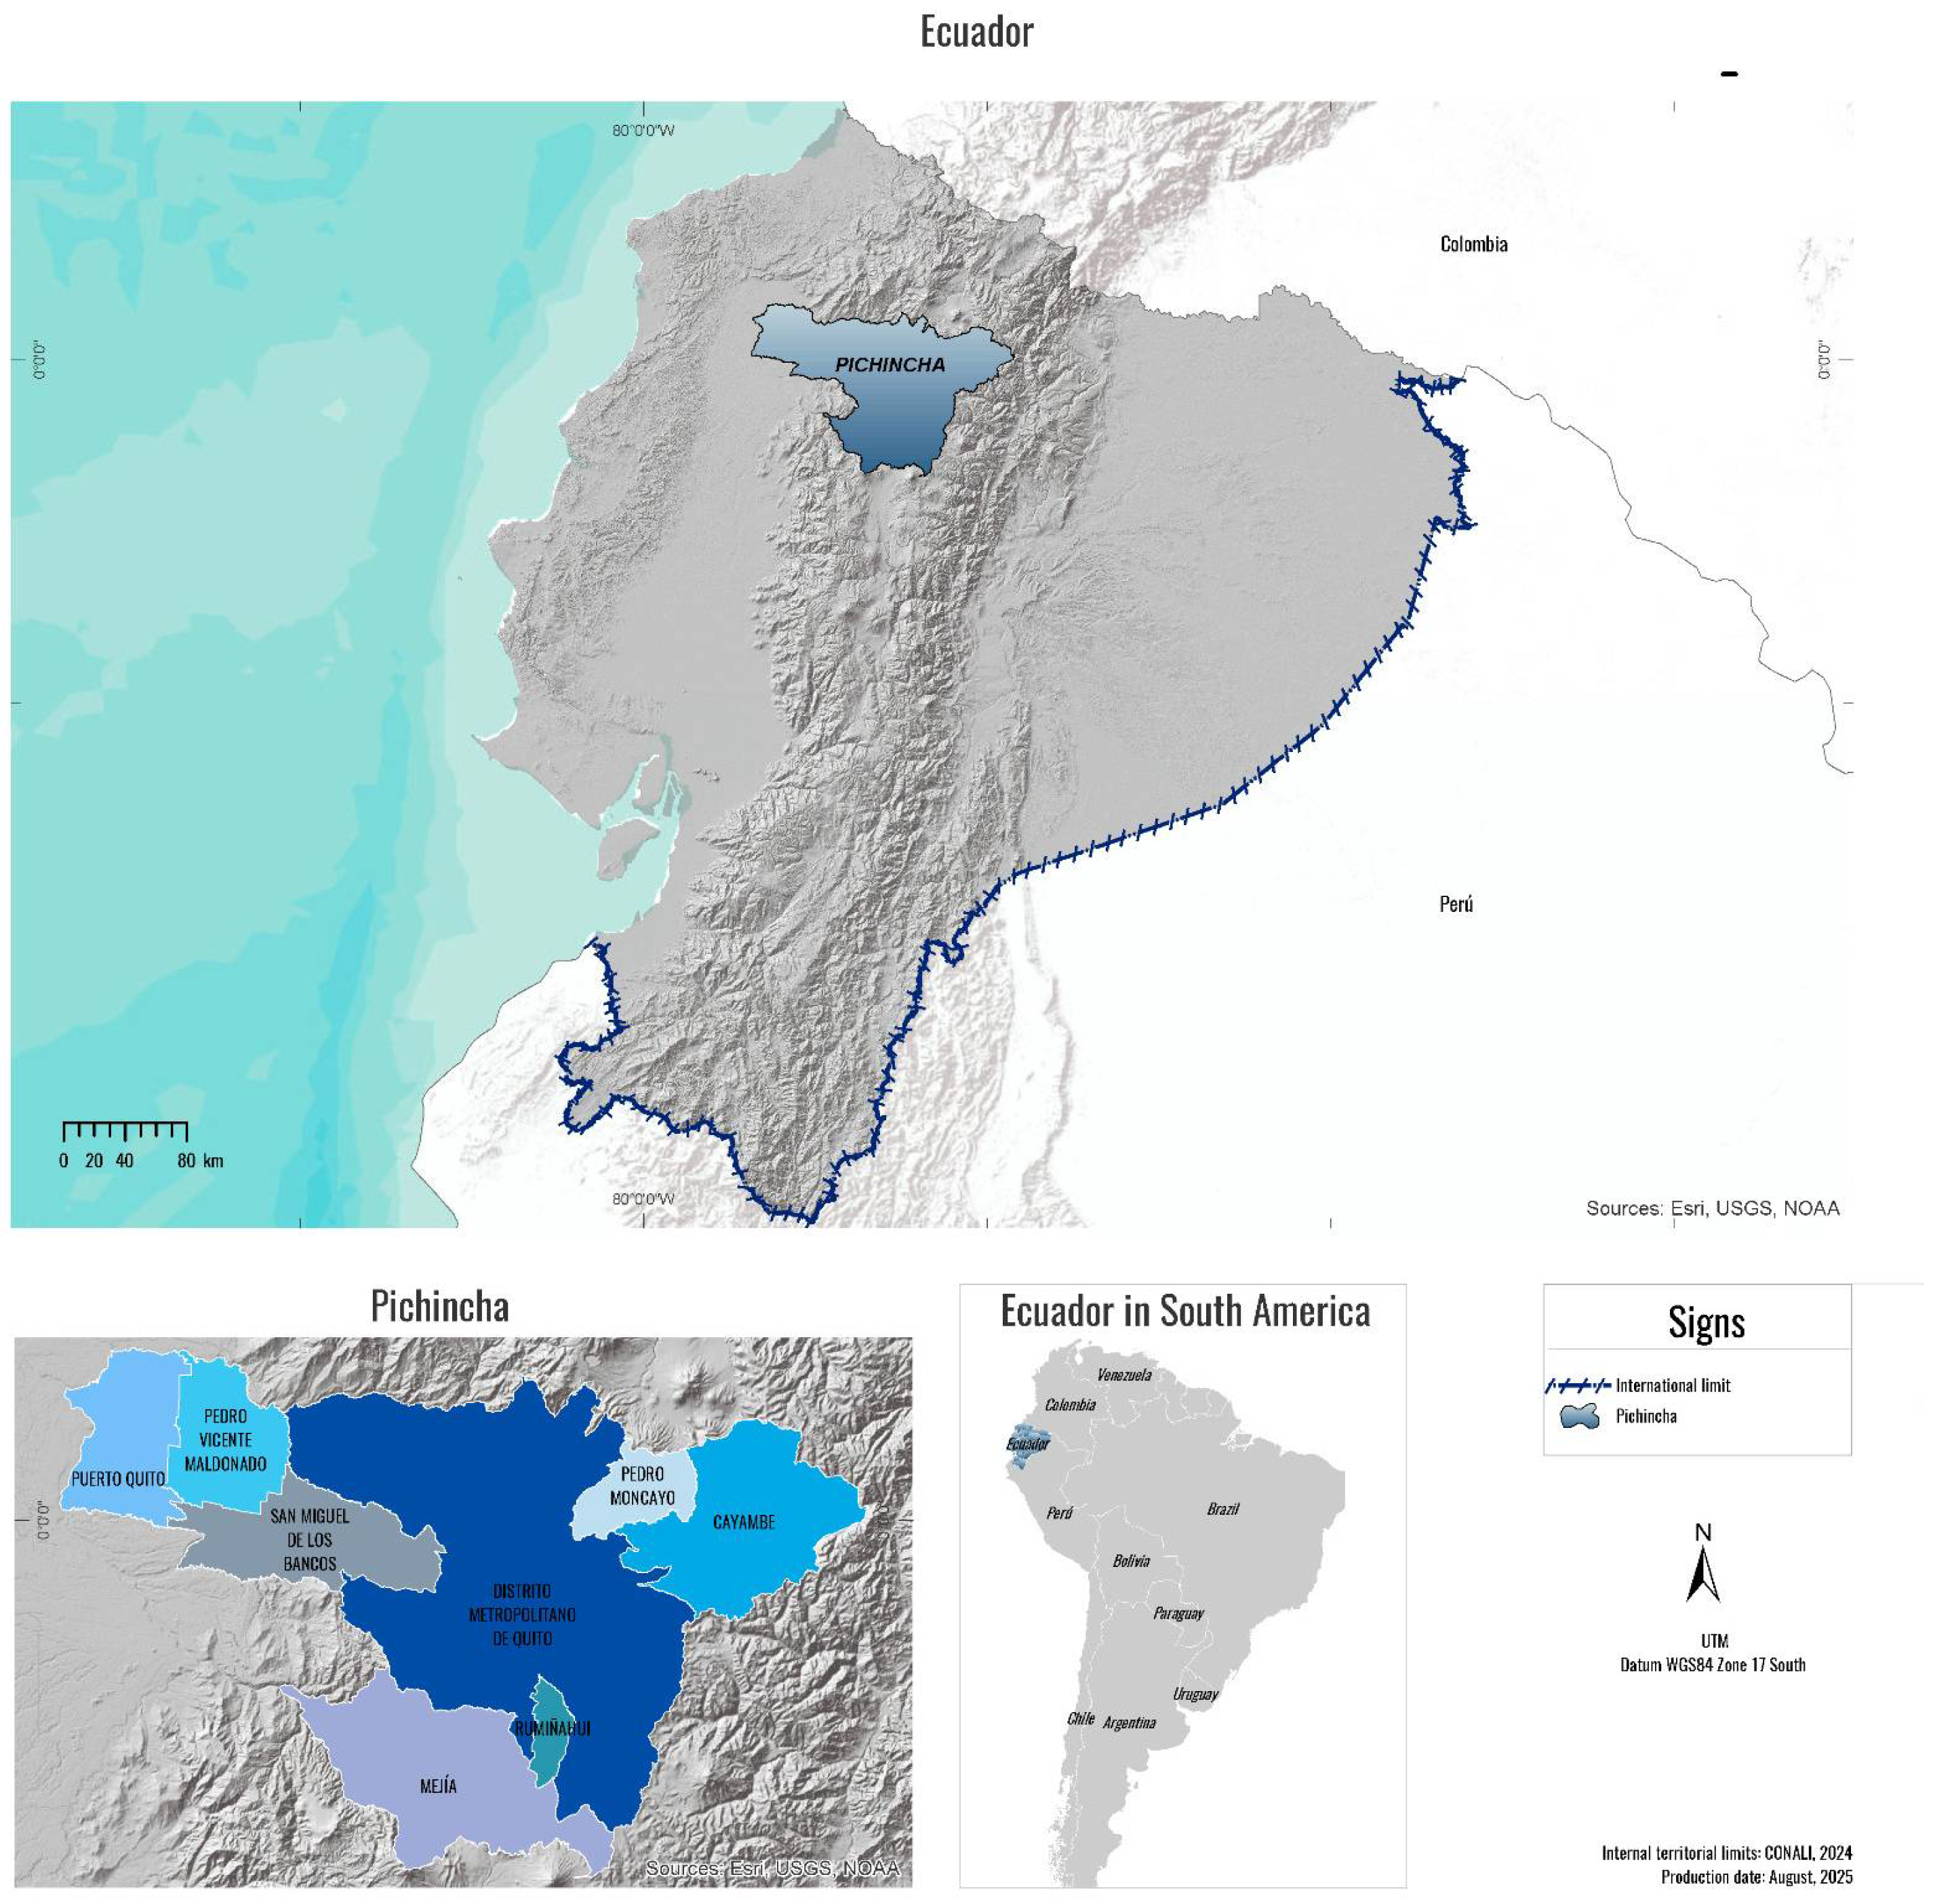
Figure 1. Study Area: Pichincha Province, Ecuador.
Energies 18 05429 g001
Figure 2. Electric Vehicle (EV) fleet projections for Pichincha through 2040. (a) S-curve adoption projections for Conservative, Base, and Optimistic scenarios. (b) Final projected number of vehicles in 2040 for each scenario. (c) Projected annual growth rates over time.
Energies 18 05429 g002
Figure 3. EV Instantaneous Charging Probability Patterns by Day of Week.
Energies 18 05429 g003
Figure 4. Methodological Workflow for EV Energy Demand Analysis.
Energies 18 05429 g004
Figure 5. Annual Growth of Total EV Energy Consumption by Scenario (2025–2040).
Energies 18 05429 g005
Figure 6. Evolution of Annual Peak Demand by Scenario (2025–2040).
Energies 18 05429 g006
Figure 7. Projected impact of EV charging on the daily peak demand of the electric grid. The subplots illustrate the system’s load curve on the peak day for four milestone years: (a) 2025, (b) 2030, (c) 2035, and (d) 2040.
Energies 18 05429 g007
Figure 8. Heat maps of weekly EV charging demand. The figure is structured as a matrix where columns represent the adoption scenarios (a) Conservative, (b) Base, and (c) Optimistic and rows represent the projection years (2025, 2030, 2035, and 2040).
Energies 18 05429 g008
Figure 9. EV charging demand curves on the annual system peak day for key projection years. Each subplot shows the 24-h EV demand profile for the peak day in (a) 2025, (b) 2030, (c) 2035, and (d) 2040.
Energies 18 05429 g009
Figure 10. Geographical Distribution of Peak EV Charging Demand by Canton in Pichincha (2040).
Energies 18 05429 g010
Figure 11. Evolution of the Quarter-Hourly EV Demand Profile on Peak Days (Baseline Scenario) for 2025, 2030, 2035, and 2040.
Energies 18 05429 g011
Figure 12. Impact of Ambient Temperature on Electric Vehicle Charging Efficiency.
Energies 18 05429 g012
Table 1. Technical and Commercial Specifications of the Electric Vehicle Catalogue.
ManufacturerModelYearClassBattery Capacity (kWh)Battery ChemistryAC Charging Power (kW)WLTP Range (km)Consumption (kWh/100 km)
BYDDolphin2024Compact44.9LFP7.034013.1
BYDSeagull2024Compact38.9LFP6.630512.1
BYDYuan Plus v22024SUV60.5LFP7.043014.1
NissanLeaf v22024Compact39.0NCM6.627014.1
KiaEV62024SUV74.0NCM11.049115.0
LeapmotorT032024City37.0NCM6.630012.3
ChevroletBolt EUV2024Compact65.0NCM11.041615.1
DongfengSeres 32024SUV51.0NCM6.635014.1
JACE-JS42024SUV65.7NCM11.044514.1
NetaV2024City38.5NCM6.631812.1
LeapmotorC112024SUV90.0NCM11.055016.1
SkywellBE112024SUV86.0NCM11.033016.1
Gen2-PremiumSUV2028SUV95.0NCM22.055017.1
Gen2-MassSedan2028Sedan75.0LFP11.045016.1
Gen2-UrbanCity2028City50.0Na-ion7.030016.1
Gen3-PremiumSUV2032SUV120.0SSB22.070017.1
Gen3-MassSedan2032Sedan110.0NCM22.065016.1
Gen3-UrbanCity2032City85.0LFP11.050017.0
Gen4-PremiumSUV2036SUV150.0SSB 90016.1
Gen4-MassSedan2036Sedan90.0NCM 55016.1
Gen4-UrbanCity2036City200.0Li-S
Table 2. Key Metrics by Scenario (2040).
Key Metric
(2040)
Conservative CaseBase CaseOptimistic Case
Total Annual
Energy (GWh)
700800870
System Peak
Demand (MW)
220.44254.52288.60
System Load
Factor (%)
36.2%35.8%34.4%
Avg. Coincidence
Factor
0.2360.2350.234
Disclaimer/Publisher’s Note: The statements, opinions and data contained in all publications are solely those of the individual author(s) and contributor(s) and not of MDPI and/or the editor(s). MDPI and/or the editor(s) disclaim responsibility for any injury to people or property resulting from any ideas, methods, instructions or products referred to in the content.