Article

Investigating Sodium Percarbonate for Upgrading Torrefied Spent Coffee Grounds as Alternative Solid Biofuel by Taguchi Optimization

1
Department of Aeronautics and Astronautics, National Cheng Kung University, Tainan 701401, Taiwan
2
Department of Chemical and Materials Engineering, Tunghai University, Taichung 407224, Taiwan
3
Department of Mechanical Engineering, National Chin-Yi University of Technology, Taichung 411030, Taiwan
*
Author to whom correspondence should be addressed.
Energies 2025, 18(20), 5384; https://doi.org/10.3390/en18205384 (registering DOI)
Submission received: 31 August 2025 / Revised: 24 September 2025 / Accepted: 9 October 2025 / Published: 13 October 2025
(This article belongs to the Special Issue Thermal Decomposition of Biomass and Waste)

Abstract

Producing solid biofuels with high calorific value and high storage stability under limited energy consumption has become a crucial focus in the global energy field. Low temperature torrefaction below 300 °C is a common method for producing solid biofuels. However, this approach limits the carbon content and higher heating value (HHV) of the resulting biochar. Sodium percarbonate is a solid oxidant that can assist in the pyrolysis of organic molecules during the torrefaction to increase carbon content of biochar. Incorporating sodium percarbonate as a strategic additive presents a viable means to address the constraints associated with the torrefaction technologies. This study blended sodium percarbonate with spent coffee grounds (SCGs) to prepare torrefied SCG solid biofuels with high calorific value and high carbon content. Based on the Taguchi method with L9 orthogonal arrays, torrefaction temperature is identified as the most influential factor affecting higher heating value (HHV). Results from FTIR, water activity, hygroscopicity, and mold observation confirmed that torrefied SCGs blended with 0.5 wt% sodium percarbonate (0.5TSSCG) exhibited good storage stability. They were not prone to mold growth under ambient temperature and pressure. 0.5TSSCG with a carbon content of 61.88 wt% exhibited a maximum HHV of 29.42 MJ∙kg−1. These findings indicate that sodium percarbonate contributes to increasing the carbon content and HHV of torrefied SCGs, enabling partial replacement of traditional coal consumption.

1. Introduction

With the advancement of industry and technology, the demand for energy has been steadily increasing each year. According to statistics from the International Energy Agency, global energy demand reached 650 EJ in 2024, which is significantly higher than the average over the past decade and represents a historical high [1]. Fossil fuels currently serve as the primary source of global energy, with global coal demand exceeding 8.7 billion tons in 2023 in particular [2]. Utilization of fossil fuels releases significant quantities of carbon dioxide into the atmosphere. Statistical data indicate that annual global carbon dioxide emissions have surpassed 40 billion tons [3], of which approximately 30% to 40% originate from coal [4]. Carbon dioxide is one of the main greenhouse gases influencing global climate change [5]. Greenhouse gases exacerbate issues such as the greenhouse effect, extreme climates, and rising sea levels [6]. The World Health Organization notes that pollutants emitted from coal combustion have caused millions of deaths [7]. Accordingly, reducing fossil fuel consumption while addressing the annually increasing global energy demand has emerged as a topic of significant international concern.
Developing alternative fuels to replace coal has emerged as a key global focus for mitigating climate change. Bioenergy, particularly solid biomass fuels, has attracted significant global attention in recent years [8,9]. Solid biofuels are derived from biomass through physical or chemical treatments [10]. Physical treatments include drying, crushing, and granulation [11], while chemical treatments involve torrefaction, pyrolysis, and gasification [12]. The raw materials for solid biofuels consist of agricultural wastes such as spent coffee grounds, tea residues, water chestnut shells, rice husks, and tree branches [13]. Among these, low-ash spent coffee grounds are considered suitable for reuse as fuel [14], primarily due to their lipid content of 10–15 wt%, which enhances their calorific value [14,15]. Spent coffee grounds are the residual product after coffee beans are ground and brewed, with an estimated over 70 wt% of coffee powder converted into spent coffee grounds [16]. According to a report released by the International Coffee Organization in June 2025, global coffee exports reached over 5 million tons as of May 2025 [17]. This is estimated to generate approximately 6 million tons of spent coffee grounds [18], which could partially substitute the fuel supply required by the coal market.
Torrefaction is a carbonization technology that produces biochar from biomass in an oxygen-free or low-oxygen environment at a temperature of 200–300 °C [19,20]. Biochar can be applied in fields such as fuel, agriculture, water treatment, and air pollution control [21,22,23,24]. Biochar produced through torrefaction exhibits characteristics including hydrophobicity, high carbon content, high calorific value, and high storability [25,26,27,28]. Tan et al. confirmed that torrefaction can significantly increase the calorific value, energy density, and carbon content of biomass, while also improving its physical and chemical stability [29]. Additionally, torrefaction can maximize the retention of lipid content in biomass, which contributes to high calorific value. Lee et al. found that when coffee grounds were torrefied at 300 °C for 30 min, the lipid content of the resulting biochar remained at 11 wt% [14]. However, when the pyrolysis temperature exceeds 300 °C, the lipid content of the biochar decreases [30].
Since torrefaction temperature is typically maintained between 200 °C and 300 °C, the carbon content and calorific value of biochar are consequently limited. Carbon content and calorific value are two important influencing factors in the field of solid fuels [31]. Maximizing the calorific value of biochar with limited energy input has thus become a key focus in the development of low-temperature torrefaction technologies in recent years. Incorporating a specific amount of co-torrefaction additives during biomass torrefaction can facilitate the pyrolysis of organic molecules, thereby increasing the carbon content and calorific value of the resulting biochar. Co-torrefaction additives aid in removing hydrogen and oxygen while retaining carbon under limited energy input. Guo et al. [32] utilized waste polypropylene plastic as a co-torrefaction additive for bacterial residue biomass; under the conditions of 230 °C and 30 min of torrefaction, the biochar’s carbon content increased from 56.73 wt% to 60.45 wt%, and its calorific value rose from 21.89 MJ∙kg−1 to 24.13 MJ∙kg−1. Fu et al. [33] employed potassium hydroxide as a co-torrefaction additive in the pyrolysis of rice husks into biochar at 750 °C; their study showed that the produced biochar had a specific surface area of 2138 m2∙g−1 and a micropore volume of 0.58 cm3∙g−1, and further evaluation revealed its maximum phenol adsorption capacity from wastewater reached 201 mg∙g−1. Chen et al. [34] added 8.3 wt% sodium bicarbonate to coffee grounds and torrefied the mixture at 300 °C for 60 min; the resulting biochar exhibited a specific surface area of 42.050 m2·g−1 and a total pore volume of 0.1389 cm3·g−1, representing a 141% increase in specific surface area and a 76% increase in total pore volume compared to raw coffee grounds, with the biochar also achieving a calorific value of 28.31 MJ∙kg−1.
Sodium percarbonate is a compound containing hydrogen peroxide. It is highly soluble in water. Its aqueous solution is alkaline. Sodium percarbonate exhibits strong oxidizing properties and decomposes slowly into sodium carbonate and hydrogen peroxide when in contact with water, where the hydrogen peroxide can oxidatively decompose organic molecular structures [35]. Currently, sodium percarbonate has been widely applied in fields such as water treatment [36], household cleaning [37], and medical care [38]. Li et al. [39] introduced sodium percarbonate into photocatalytic water treatment, finding that it can assist in generating more reactive free radicals, thereby further enhancing the degradation efficiency of sulfamethoxazole. Harrison et al. [40] used sodium percarbonate as an oxygen storage material and incorporated it into a prepared poly(D,L-lactide-co-glycolide) film; this film could continuously release oxygen for 24 h and effectively prevent tissue necrosis in a mouse ischemic tissue model for up to 3 days.
Based on a literature review, no studies have yet explored the use of sodium percarbonate to enhance the calorific value and carbon content of torrefied coffee grounds. This study employs the Taguchi method to identify the most influential factors and optimal experimental parameters for the torrefaction of coffee grounds. Due to its unique oxidizing properties, sodium percarbonate holds potential as a co-torrefaction additive, an application that remains underexplored in the fuel sector. In summary, the strategy of incorporating co-torrefaction additives can facilitate the conversion of lipid-containing organic wastes into high-calorific-value solid biomass fuels under limited carbonization energy consumption. This approach not only helps alleviate the problem of coffee grounds waste but also contributes to reducing reliance on coal, promoting carbon neutrality, and moving closer to the goal of net-zero carbon emissions.

2. Materials and Methods

2.1. TSSCG Preparation

The fresh spent coffee grounds (FSCG) used in this study were collected from convenience stores. All collected FSCG were stored uniformly in a refrigerator (SAMPO, Taiwan) at 4 °C to prevent mold growth. To ensure a uniform particle size of FSCG, they were sieved through a Tyler 35-mesh sieve. The FSCG was heated in an oven (SETON, SVO-45AD, Taiwan) at 105 °C for 24 h to prepare dried spent coffee grounds (DSCG). XTSSCG was prepared by blending FSCG with an appropriate amount of sodium percarbonate (Thermo Fisher, Waltham, MA, USA, CAS: 15630-89-4) (0–1 wt%) and then torrefying the mixture under oxygen-free conditions at 200–300 °C for 30–90 min. As shown in Figure 1. Here, X in XTSSCG represents the weight percentage of the blended sodium percarbonate. For example, the treated biochar obtained by blending FSCG with 0.5 wt% sodium percarbonate and torrefying is named 0.5TSSCG. The torrefied SCGs without blended sodium percarbonate are named 0TSSCG.

2.2. Design of Experiment

Taguchi method was an experimental design approach for optimizing experimental parameter conditions. It systematically identifies the most influential factors and optimal parameter combinations through a relatively small number of experimental runs. To identify the most influential factors and optimal experimental parameters for the preparation of torrefied SCGs when incorporating sodium percarbonate. This study employed the Taguchi method to investigate the effects of three factors on the higher heating value (HHV) of it. The three factors examined were torrefying temperature (Factor A), torrefaction time (Factor B), and sodium percarbonate blending ratio (Factor C). Factor A was set at levels of 200, 250, and 300 °C, while Factor B was tested at 30, 60, and 90 min, and Factor C at 0, 0.5, and 1 wt%. The experimental design consisted of nine runs, each performed in duplicate, with a relative error of less than 5%. Given that this study focuses on using torrefied SCGs as an alternative solid fuel to replace traditional coal, its HHV was designated as the objective function. The average signal-to-noise (S/N) ratio, calculated using the “larger-the-better” criterion, is presented in Equation (1) [41].
S N = 10 L o g 1 y 2
where y represents the objective function in the experimental results, which is defined as the HHV.

2.3. Characterization

In the proximate analysis (PA), the ash content, volatile matter (VM) content, and fixed carbon (FC) content were analyzed by ASTM D1102 [42], ASTM E872 [43], and ASTM E1534 [44] standards, respectively. A PerkinElmer 2400 Series II CHNS/O elemental analyzer (PerkinElmer, Inc., Waltham, MA, USA) was used to determine the carbon ( C ), hydrogen ( H ), and nitrogen ( N ) content in the samples. The oxygen ( O ) content was calculated by difference using the formula: O   ( w t % )   =   100     ( C   +   H   +   N ) [45]. The moisture content of the samples was analyzed under the ASTM E871 standard [46]. A water activity analyzer (Decagon Aqualab 4) was used to determine the water activity of the samples. The higher heating value (HHV) of the samples was measured using an IKA C5000 bomb calorimeter (IKA®-Werke GmbH & Co., Breisgau, Germany) by the ASTM E872 standard [43]. The functional groups of the samples were analyzed using a Fourier-transform infrared spectroscopy (PerkinElmer, Inc., Waltham, MA, USA). The thermal decomposition of the samples was analyzed using a thermogravimetric analyzer (PerkinElmer, Inc., Waltham, MA, USA). For thermogravimetric analysis, 16 ± 2 mg of sample was heated under nitrogen flow at a rate of 100 mL∙min−1. The temperature range studied was from 30 °C to 800 °C. The sample was first heated from 30 °C to 105 °C at a heating rate of 20 °C∙min−1. The temperature was then maintained at 105 °C for 5 min to remove moisture from the sample. Subsequently, the temperature was increased from 105 °C to 800 °C at the same heating rate (20 °C∙min−1) and held at 800 °C for 5 min.

3. Results

3.1. Characteristics of Torrefied SCG with and Without Sodium Percarbonate Blending
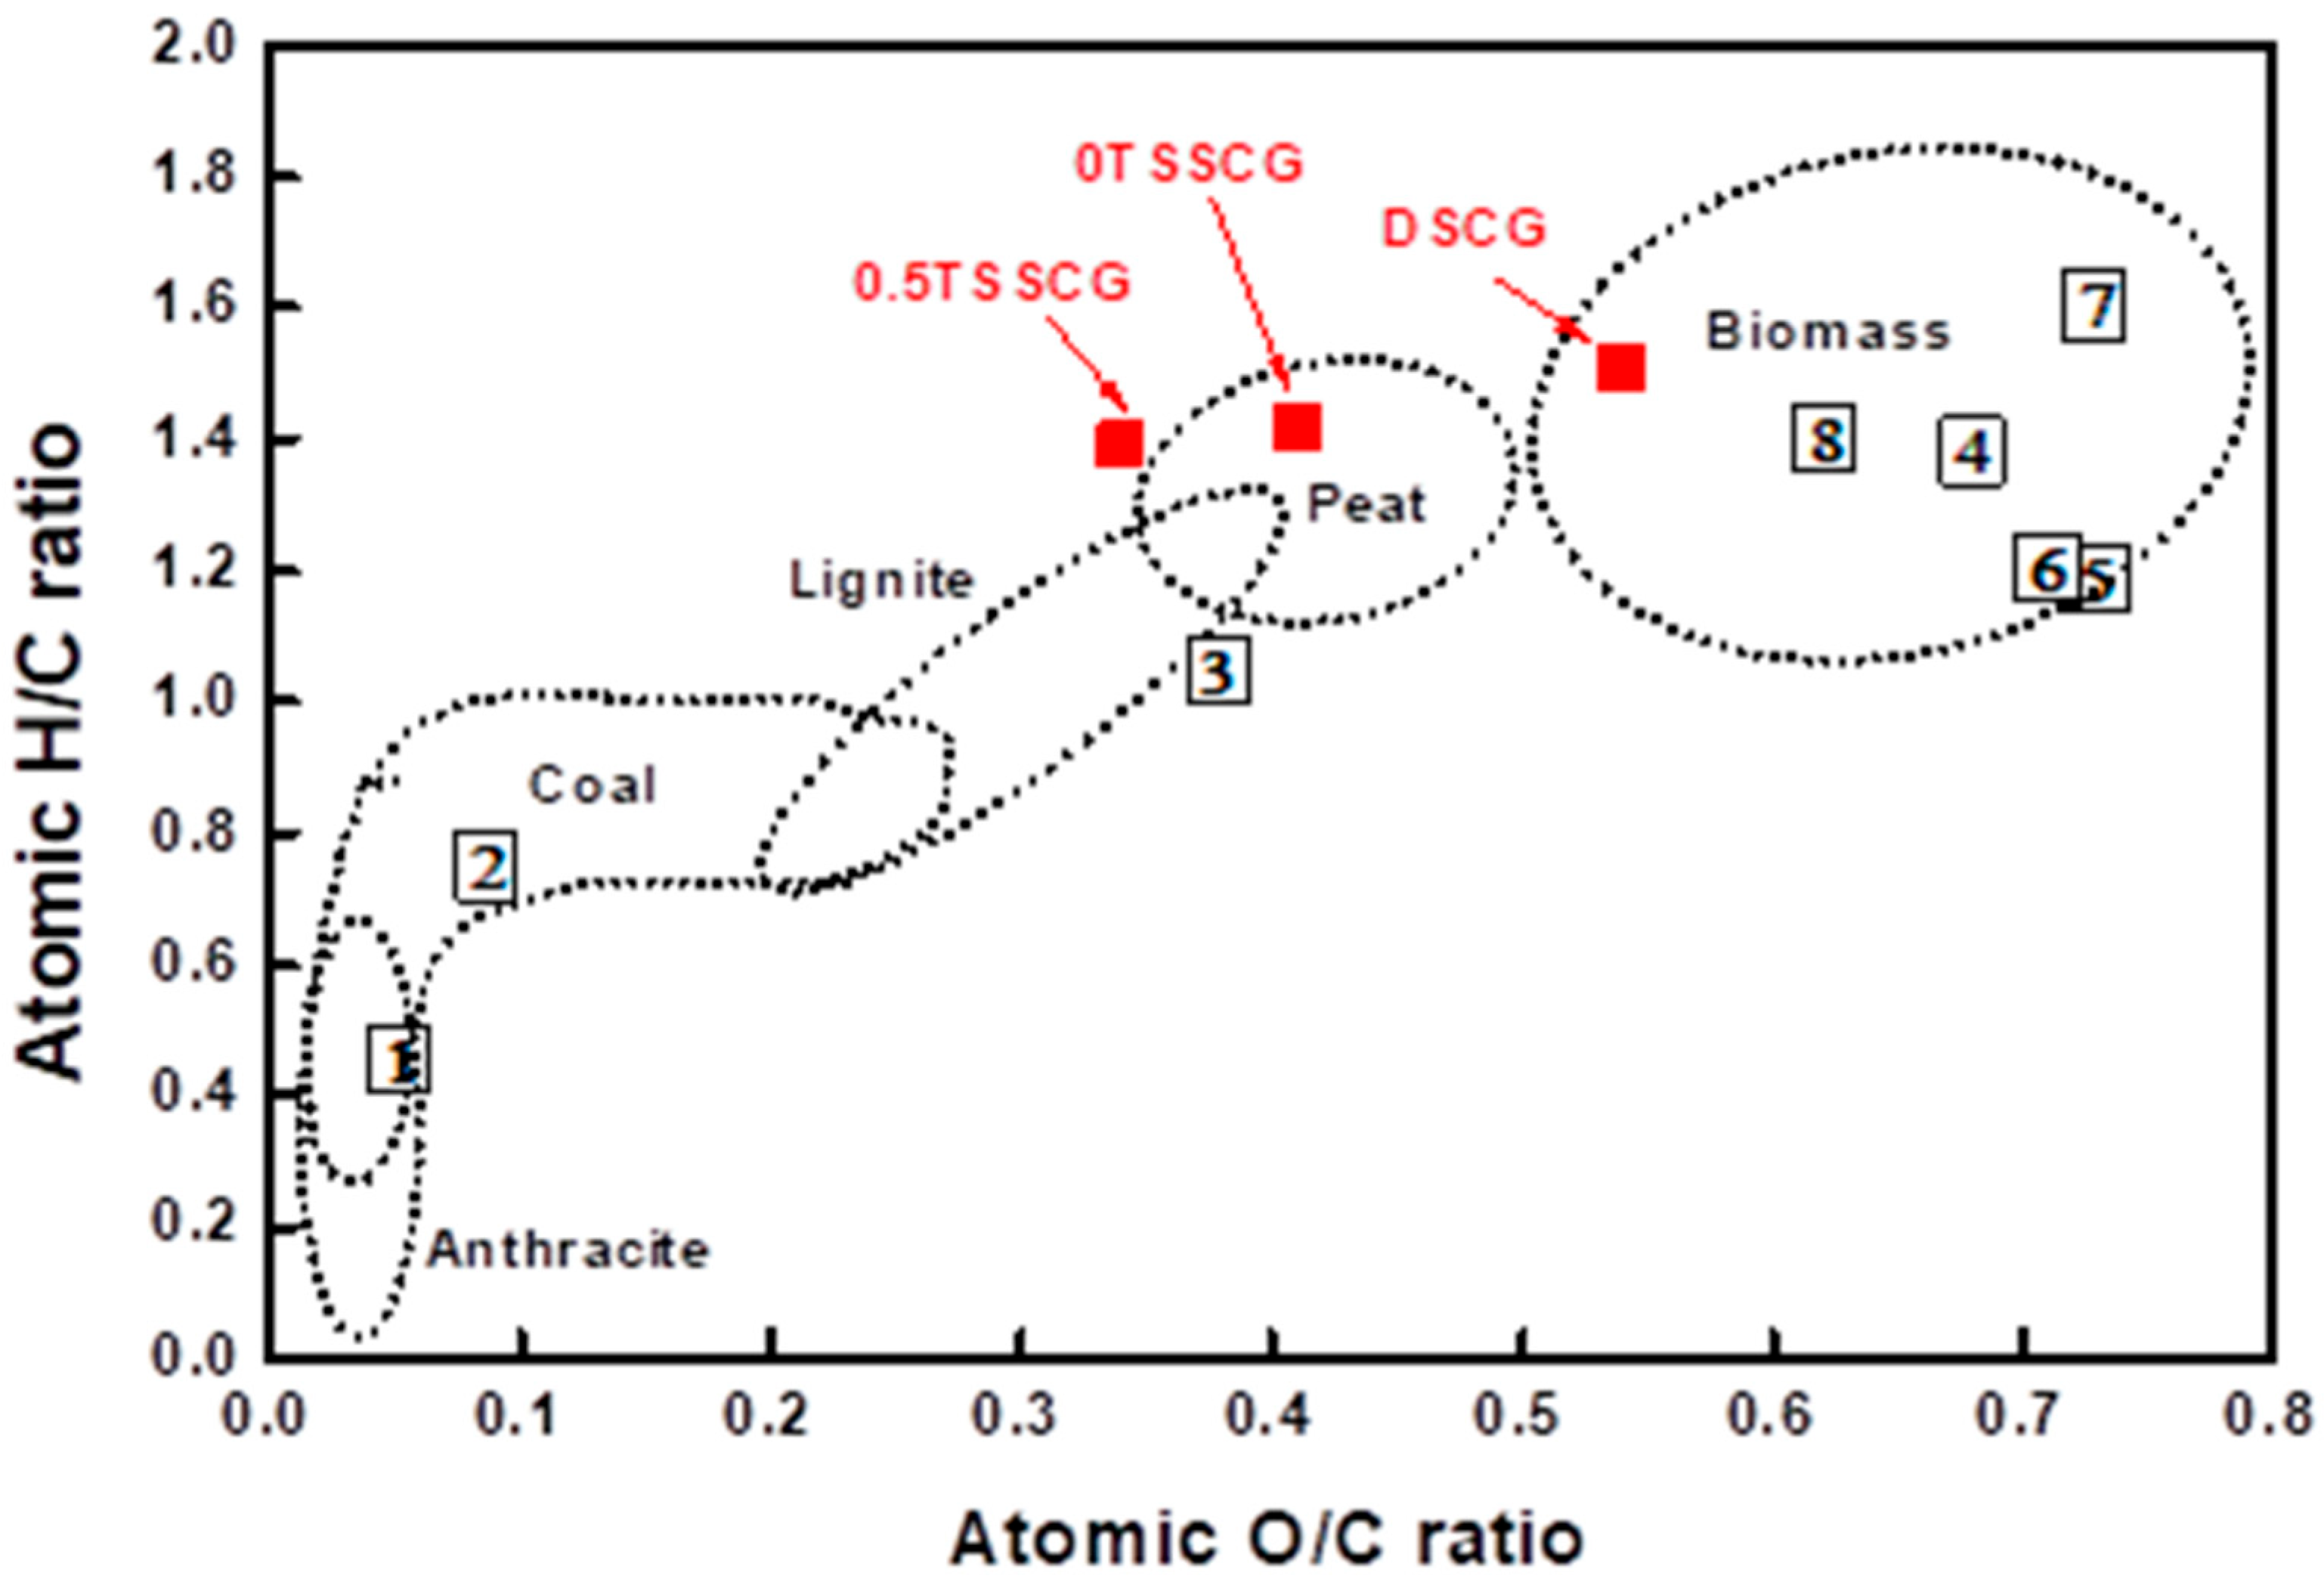
Table 1 presents the results of proximate analysis and ultimate analysis for DSCG, 0TSSCG, and 0.5TSSCG. The ash content of DSCG is 1.97 wt%, while the ash content of torrefied DSCG (0TSSCG) slightly increases to 3.14 wt%. This increase is attributed to the relative enrichment effect on the composition of torrefied biomass [47]. The ash content of 0.5TSSCG is 4.02 wt%, which is higher than that of 0TSSCG. This contribution is attributed to the blended sodium percarbonate. Torrefaction is a thermochemical carbonization technology. Carbonization reduces the volatile matter (VM) content of the sample, while conversely increasing its fixed carbon (FC) content [48]. This trend of FC is consistent with the carbon content obtained from the elemental analysis. The carbon content of 0TSSCG is 58.38 wt%, which is approximately 1.1 times that of DSCG. The carbon content of 0.5TSSCG is 61.88 wt%, which is approximately 6% higher than that of 0TSSCG. This increase in carbon content is contributed by the blended oxidative sodium percarbonate. Blending biomass with an oxidizing agent results in the release of hydrogen peroxide during torrefaction. Released hydrogen peroxide promotes the cleavage of chemical bonds in organic molecules through dehydration and decarboxylation reactions [49,50]. This reduction decreases the number of hydrogen and oxygen atoms in the molecular chain, thereby increasing the carbon content [51].
Figure 2 presents the van Krevelen diagrams of atomic H/C and O/C ratios for DSCG, 0TSSCG, and 0.5TSSCG, which are used to evaluate their potential as alternative solid fuels to replace coal [52]. Generally, lower H/C and O/C ratios correspond to higher calorific values (HHV) and carbonization levels [53]. For comparison, Figure 2 also includes the H/C and O/C ratios of eight types of biomasses such as jute stick, rice husk, bamboo, and bagasse. The H/C and O/C ratios of DSCG are 1.51 and 0.54. For 0TSSCG, these ratios are 1.42 and 0.41. For 0.5TSSCG, they decrease to the lowest values of 1.39 and 0.34. 0TSSCG falls within the peat zone, while 0.5TSSCG is situated between lignite and peat zone. Biomass treated by thermochemical processes has a lower O/C and H/C atomic ratio and it will gradually move from the biomass zone to the peat, lignite, coal or anthracite zone.
Figure 3 shows the FTIR absorption spectra of DSCG, 0TSSCG and 0.5TSSCG. All three samples exhibit a broad peak near 3200–3400 cm−1, and this peak corresponds to the hydroxyl functional group [54]. Notably the broad peak intensity of DSCG is slightly higher than that of 0TSSCG and 0.5TSSCG. This is because some oxygen and hydrogen are removed during torrefaction. This result helps to increase the HHV of the sample. Literature indicates that the intensity of the hydroxyl peak in molecular structures is inversely proportional to HHV [55]. The peaks at 2800–3000 cm−1 stand for the C-H stretching vibration [56]. The peak at 1750 cm−1 is attributed to the C=O stretching vibration [57]. The region between 1000 and 1250 cm−1 is ascribed to the C-O-C stretching [58].
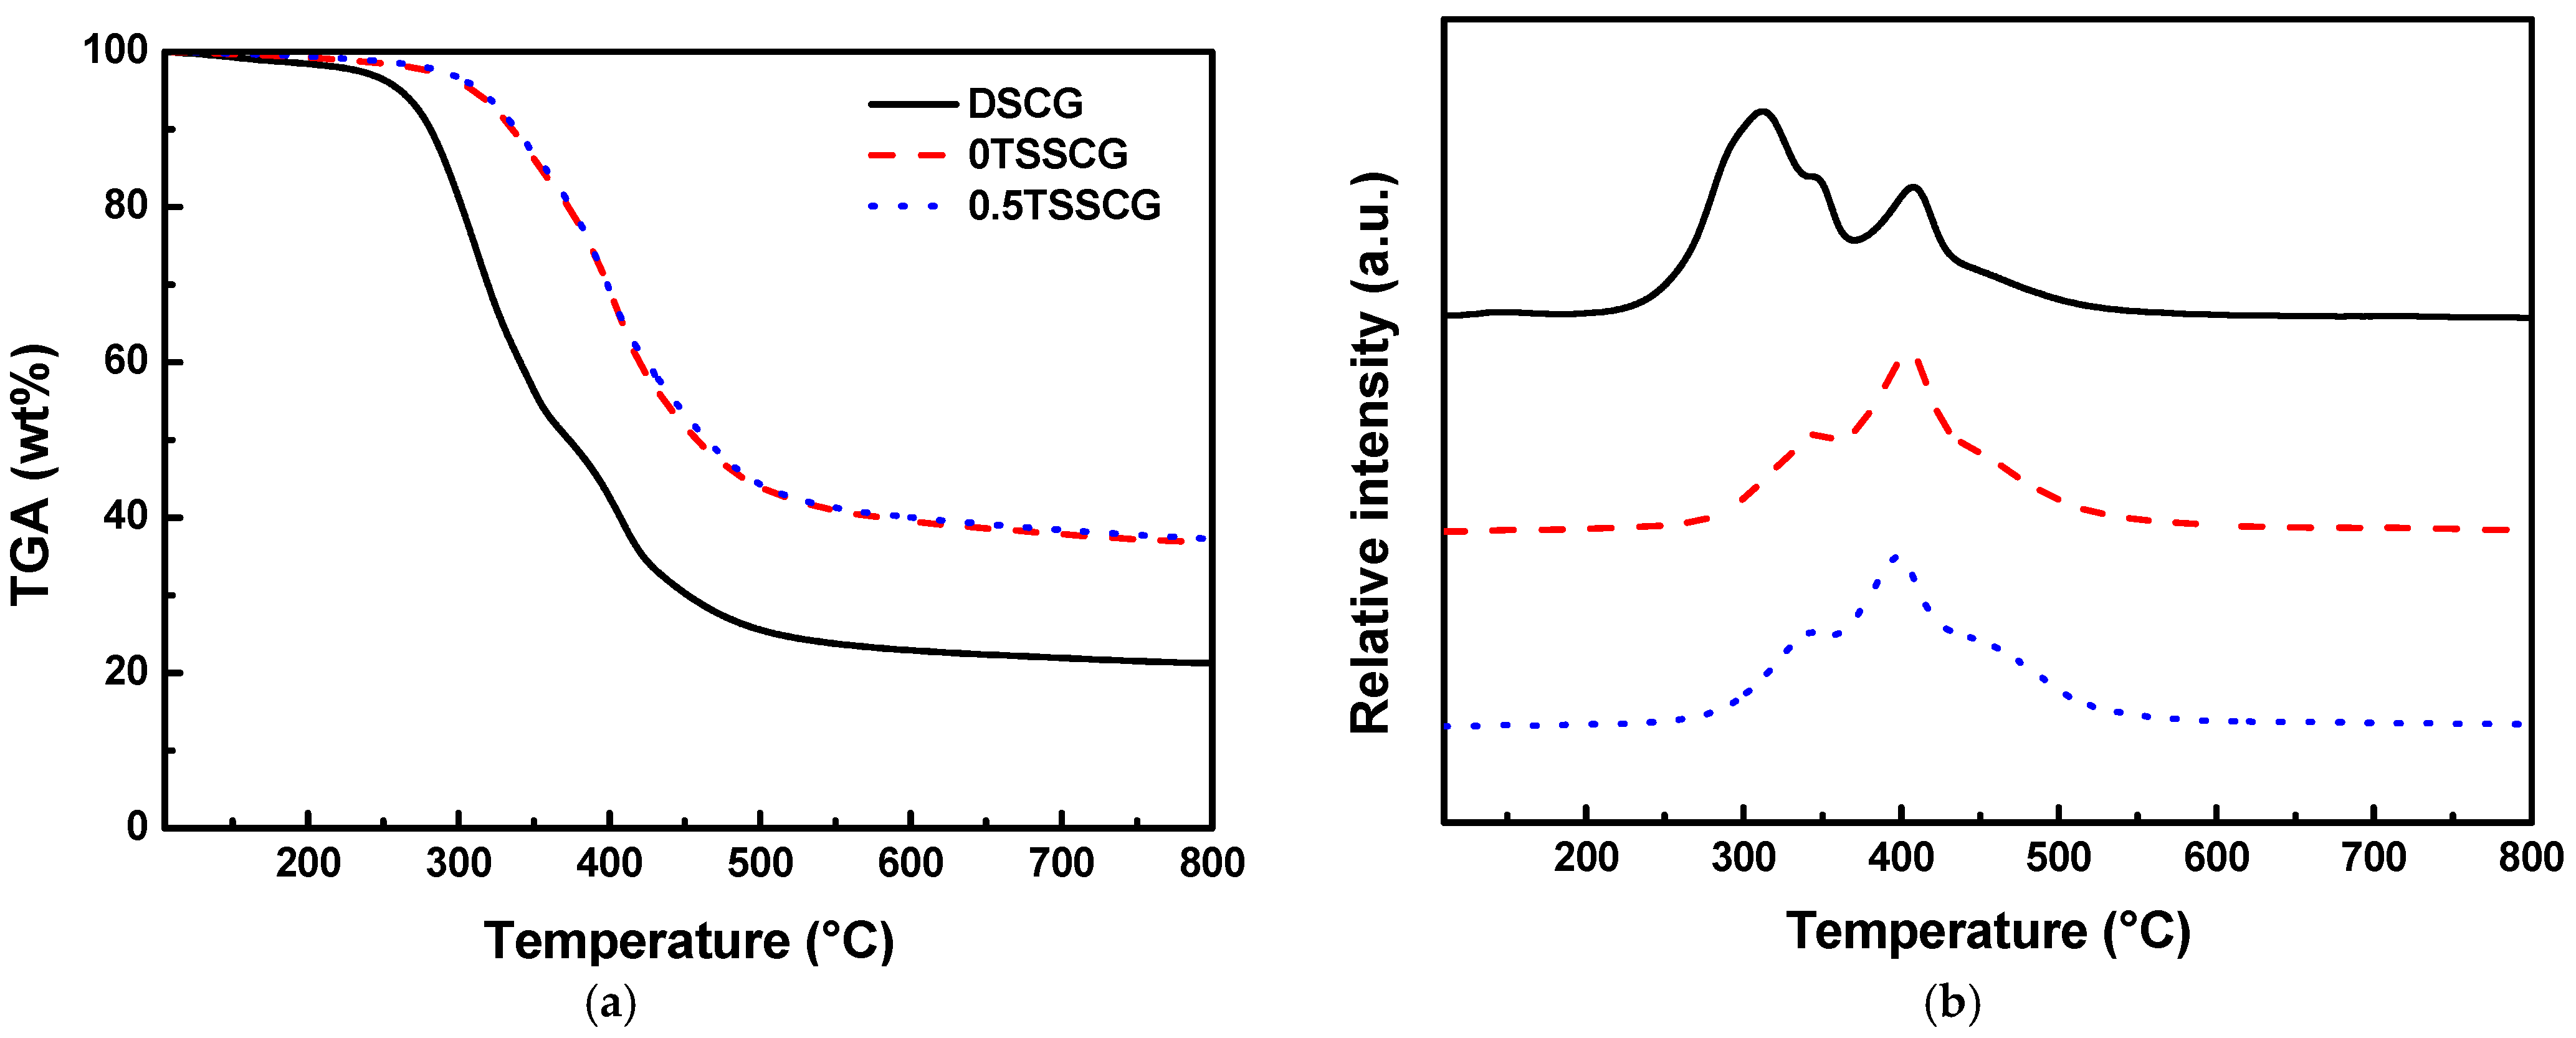
Figure 4a,b show the pyrolysis TGA and DTG curves of DSCG, 0TSSCG, and 0.5TSSCG, respectively. In Figure 4b a sharp peak and a smaller shoulder peak are observed at 315 °C and 350 °C for DSCG. These peaks are from the thermal decomposition of hemicellulose and cellulose respectively [59]. A peak appearing at 407 °C is considered to be the thermal degradation of lignin [59]. For 0TSSCG and 0.5TSSCG a small shoulder peak and a prominent peak are observed at 344 °C and 405 °C. These peaks correspond to the thermal decomposition of cellulose and lignin. Disappearance of the hemicellulose peak and the increase in the lignin peak are associated with improved HHV and thermal stability of the sample [60].
Figure 2. Van Krevelen diagram ((1) [61], (2) [62], (3) [63], (4) [64], (5) [65], (6) [66], (7) [67], (8) [68]).
Energies 18 05384 g002
Figure 3. ATR spectra of DSCG, 0TSSCG, and 0.5TSSCG.
Energies 18 05384 g003
Figure 4. Shows the curvature from pyrolysis analysis of DSCG, 0TSSCG, and 0.5TSSCG with (a) TGA and (b) DTG.
Energies 18 05384 g004

3.2. Taguchi Optimization

This study employs the Taguchi orthogonal experimental design to identify the most influential factors affecting the objective function and determine the optimal experimental conditions. The Taguchi method offers a robust approach for evaluating the primary effects of key parameters. By employing orthogonal arrays, it ensures that each parameter is systematically examined across its full range of values. The higher heating value (HHV) serves as the objective function, with nine experiments conducted and their specific configurations detailed in Table 2. Three factors with three levels each are employed, specifically torrefaction temperature (Factor A: 200 °C, 250 °C, 300 °C), torrefaction time (Factor B: 30 min, 60 min, 90 min), and sodium percarbonate blending ratio (Factor C: 0 wt%, 0.5 wt%, 1 wt%), all of which are presented in Table 2a. Table 2b details the results of nine Taguchi orthogonal experiments, with the Taguchi method conducting statistical evaluation via calculation of signal-to-noise (S/N) ratios for the “larger-the-better” characteristic [69]. Figure 5a presents the mean signal-to-noise (S/N) ratios of the three factors across their different levels. Factor A exhibits the most significant variation in mean S/N ratios across its different levels. Figure 5b indicates that torrefaction temperature (Factor A) is the most prominent factor influencing changes in HHV. Moreover, the optimal experimental parameters identified through nine Taguchi orthogonal experiments are a torrefaction temperature of 300 °C, a torrefaction time of 90 min, and a sodium percarbonate blending ratio of 0.5 wt%, which corresponds to the ninth run among the nine experiments. The highest HHV corresponding to the optimal experimental parameters is about 29.42 MJ∙kg−1.

3.3. Storage Stability

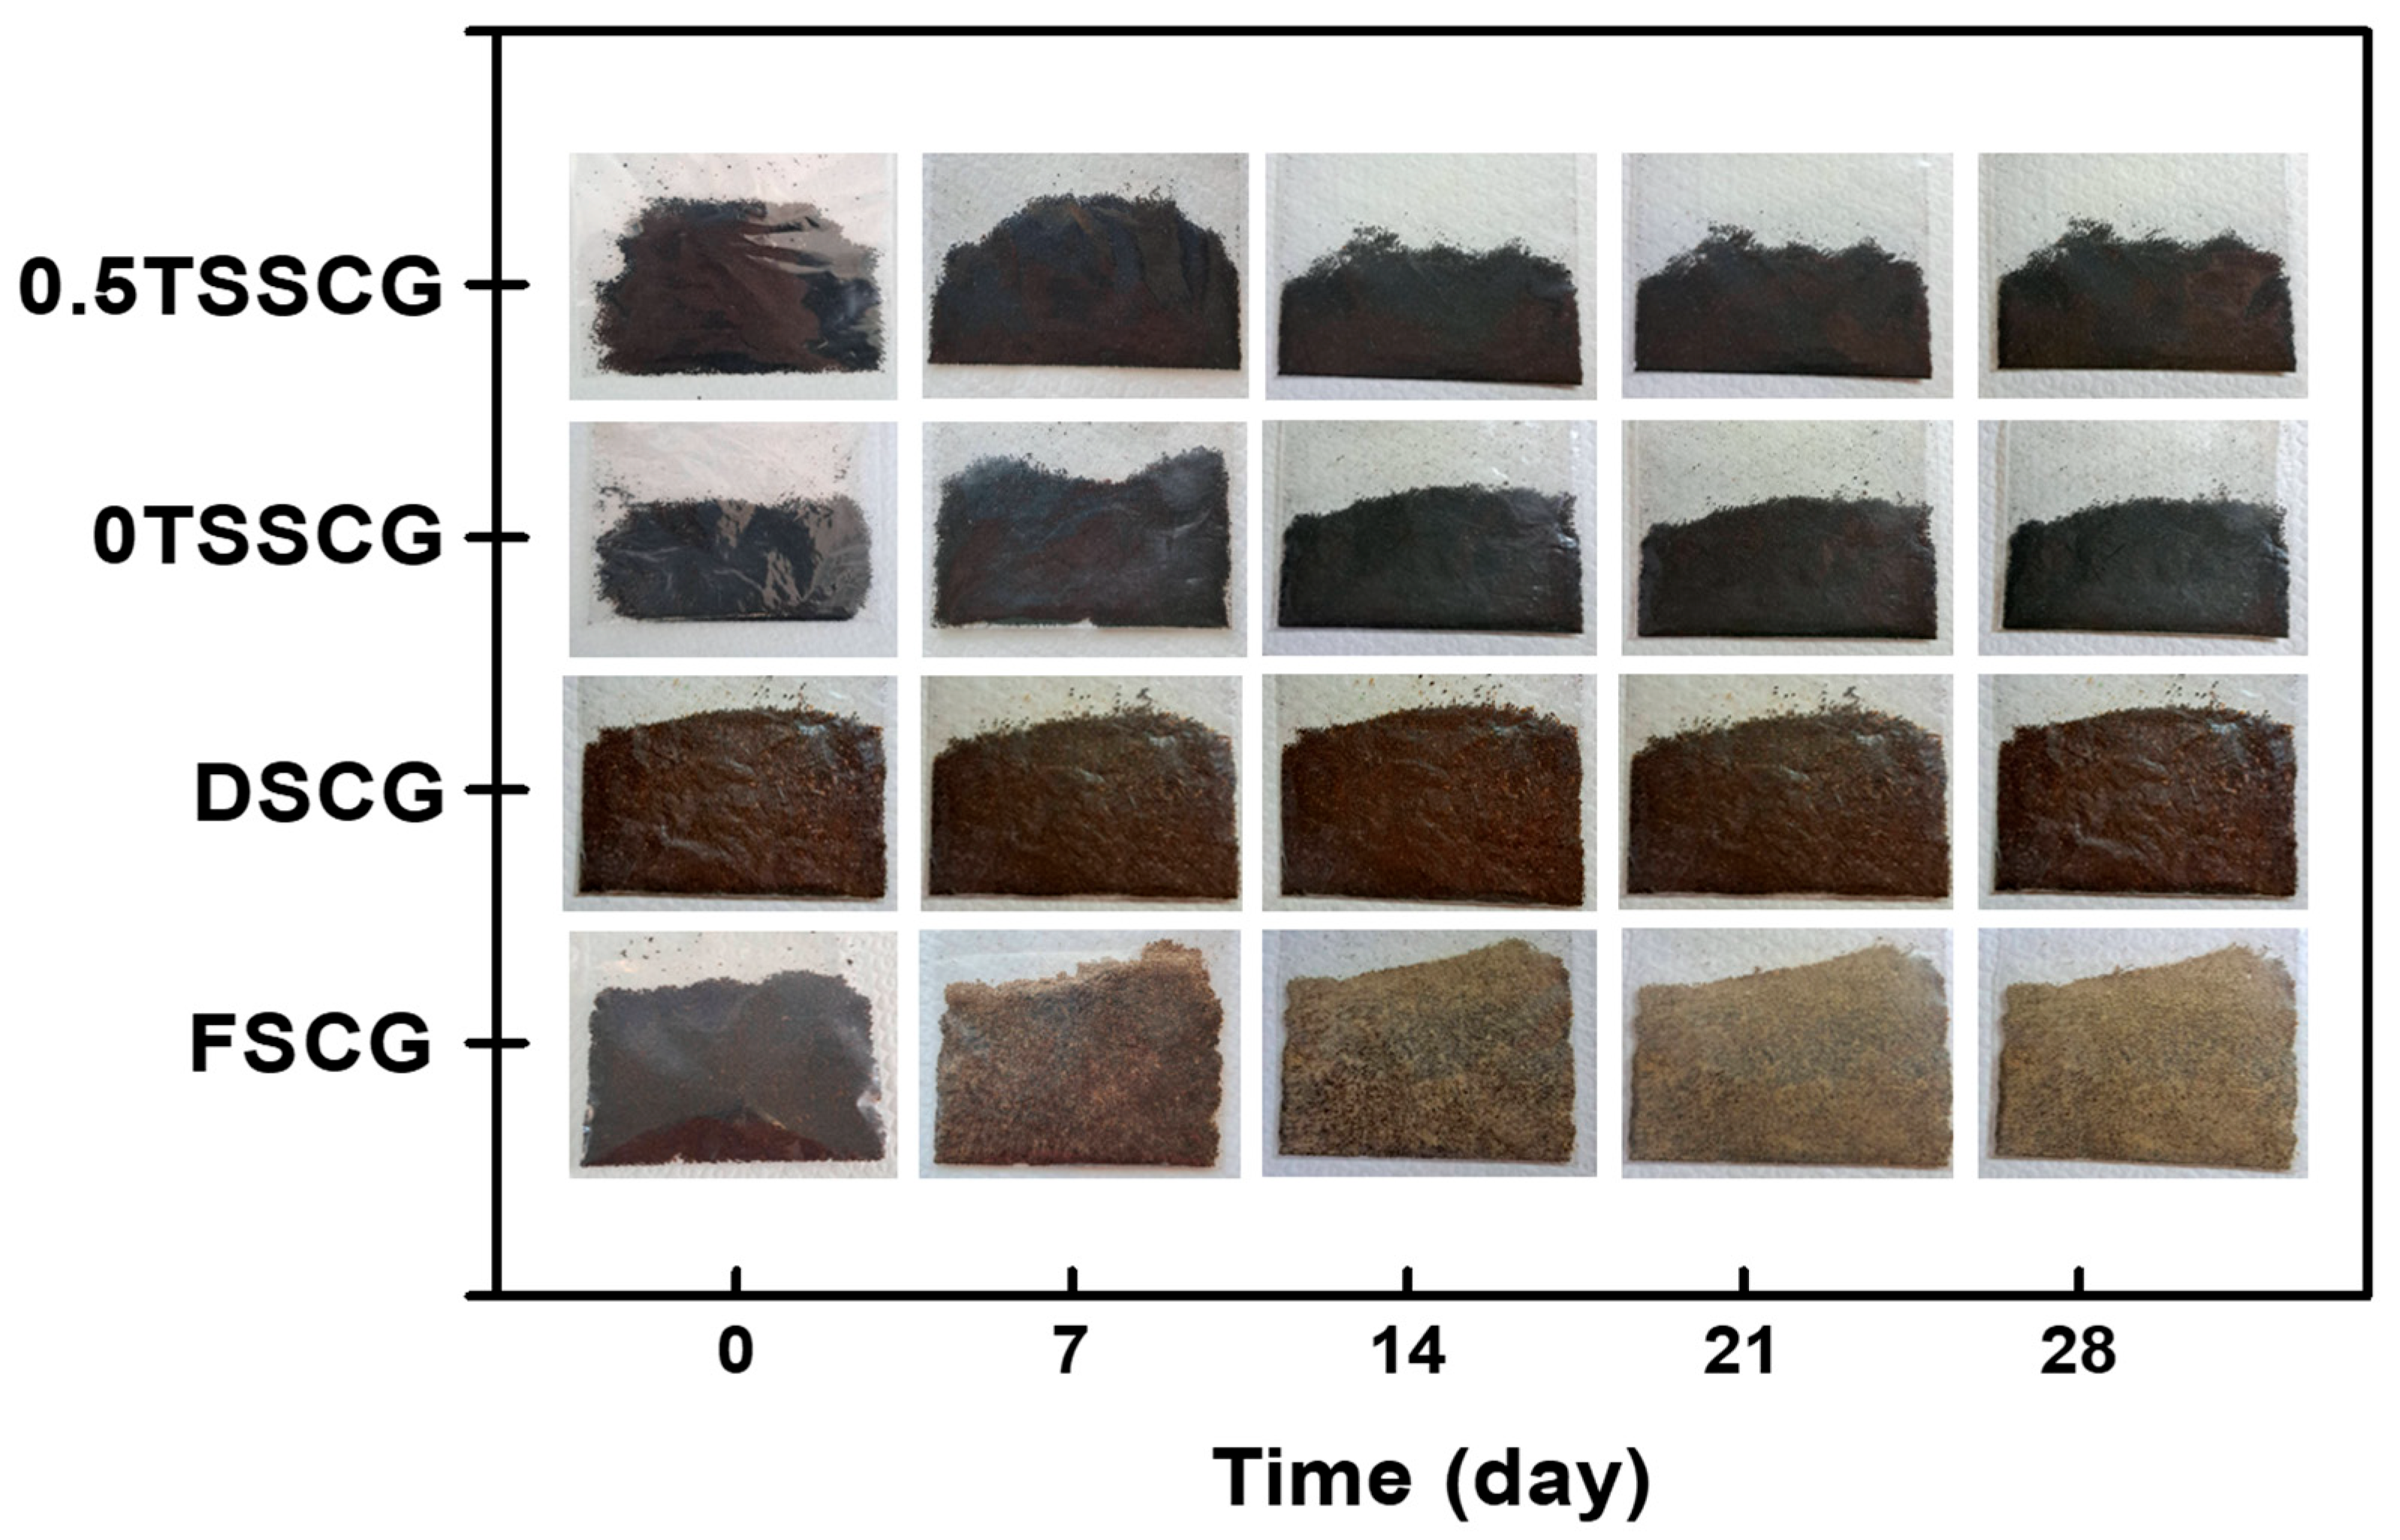
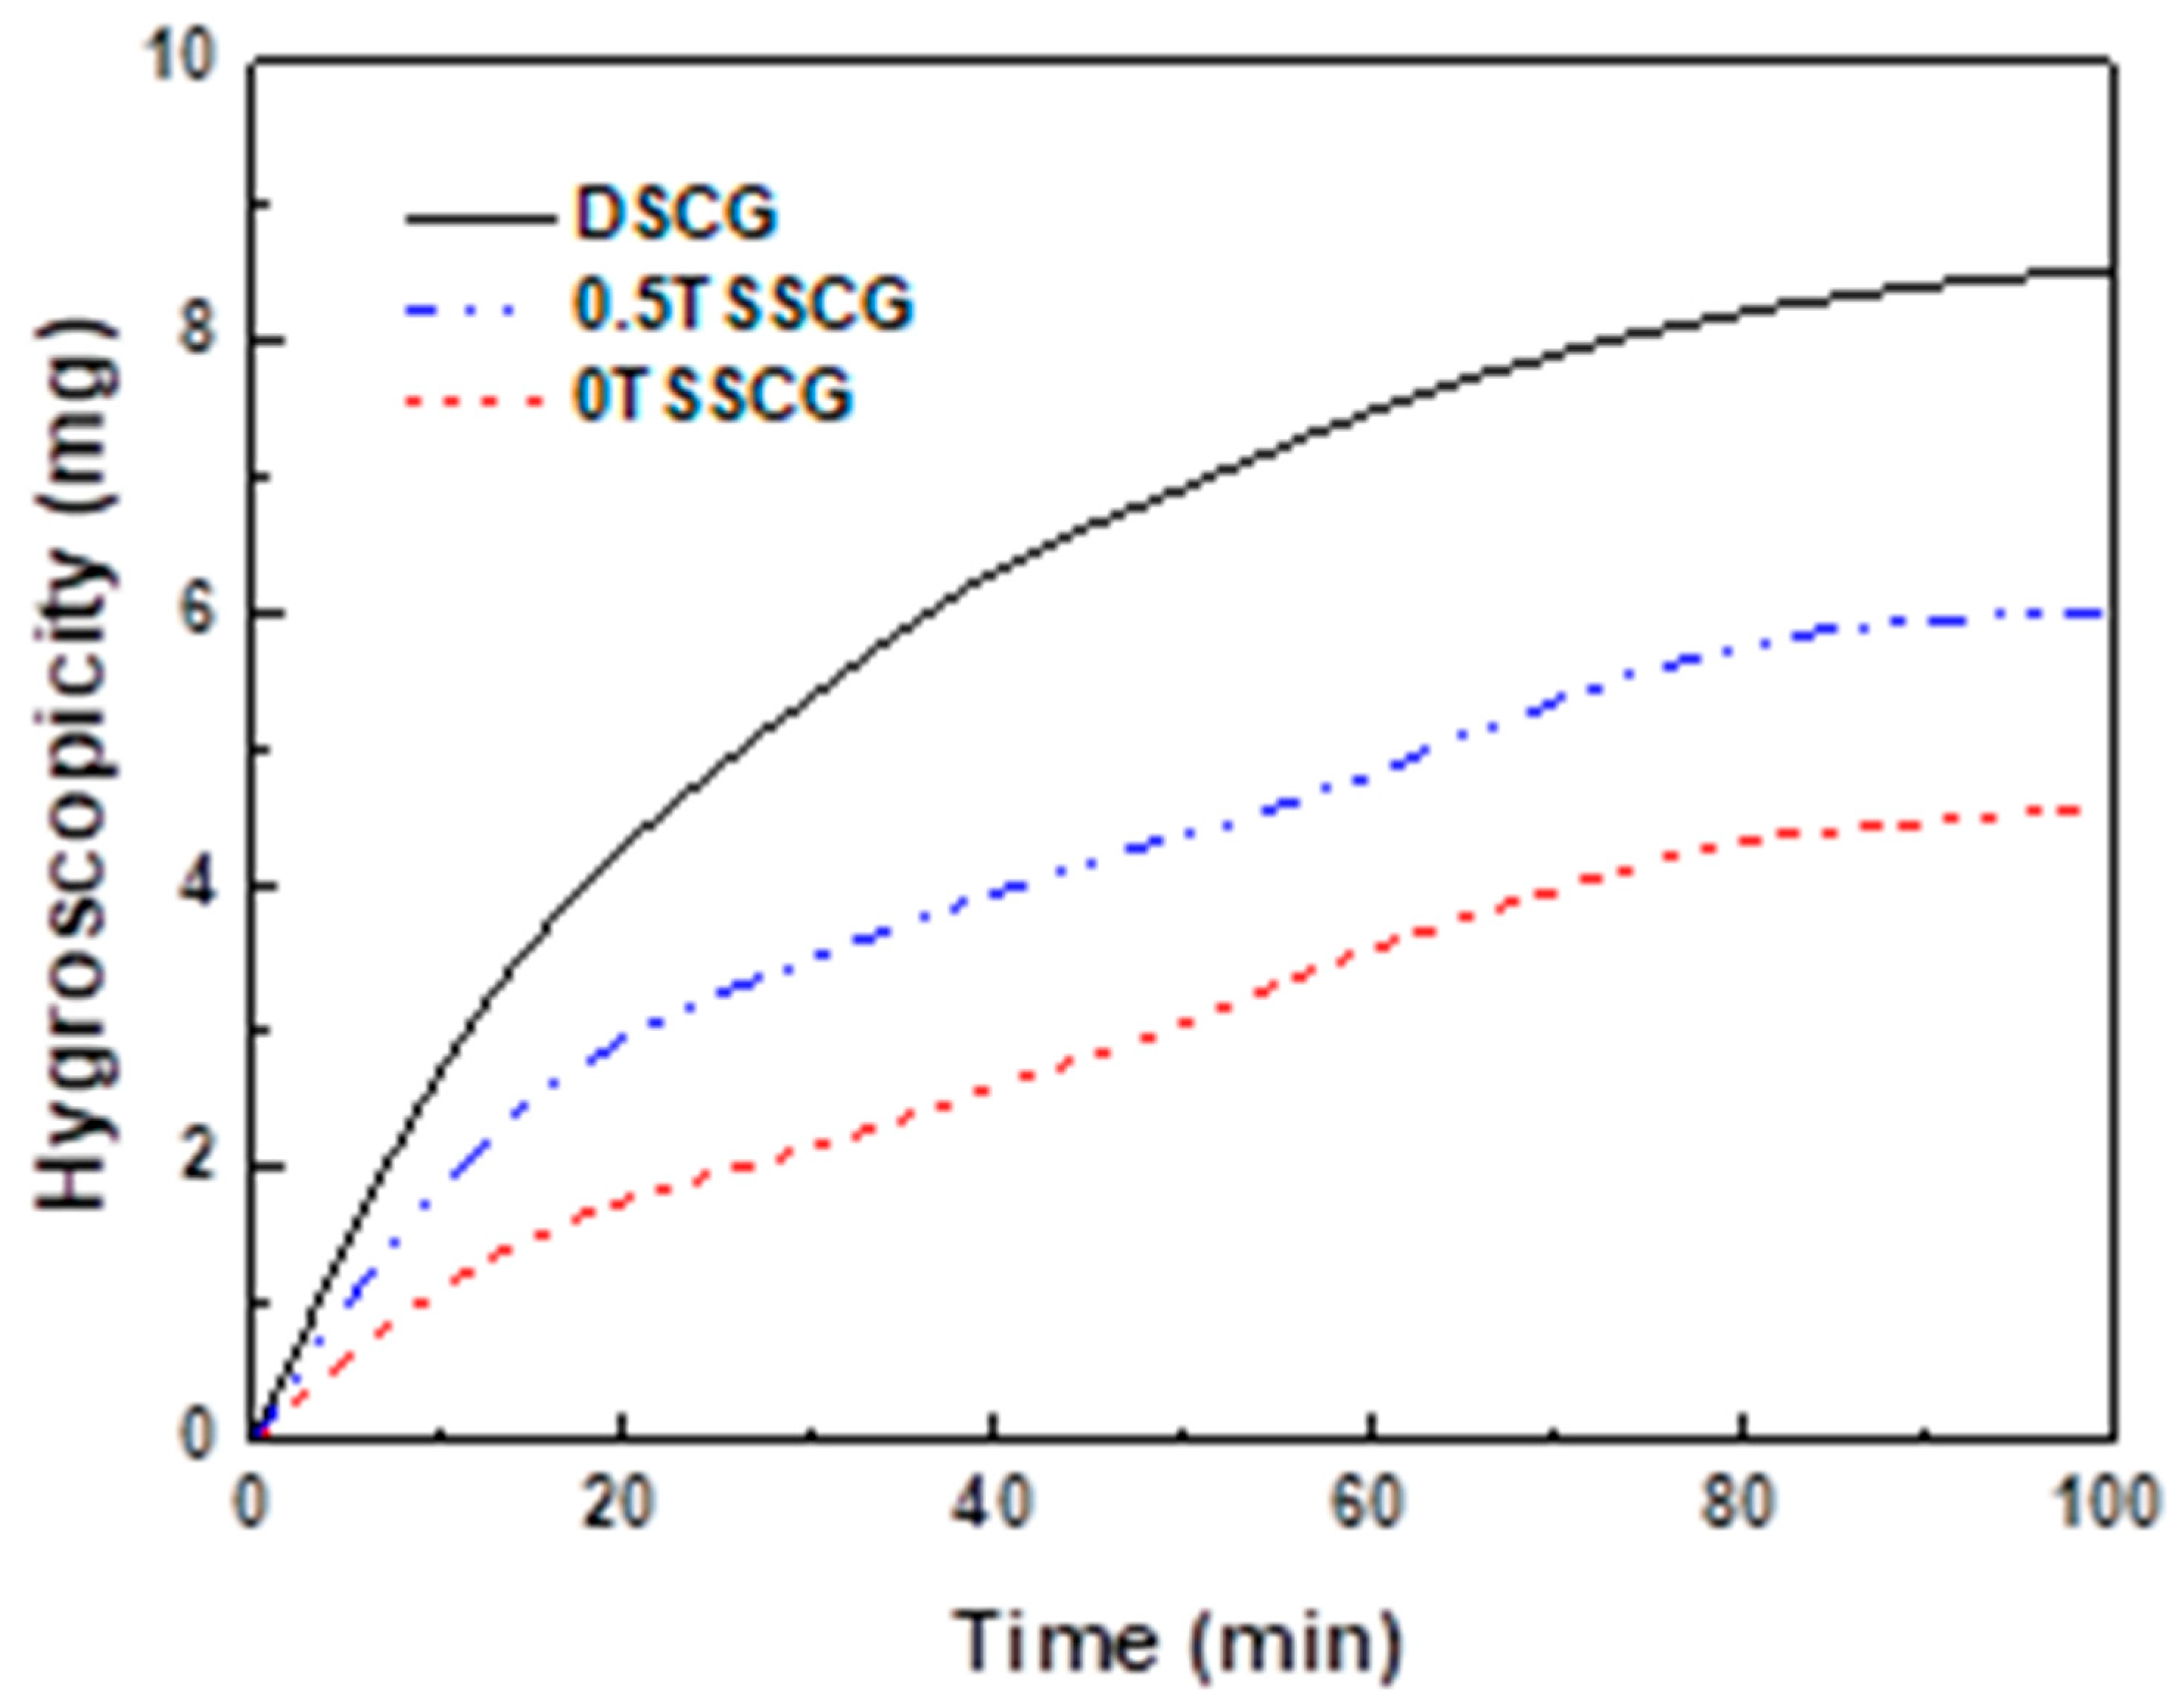
Storage stability constitutes a critical characteristic for biomass utilized as biofuels [70]. Biofuels with poor storage stability are prone to spoilage and mold growth, which in turn diminishes their HHV [71]. This study evaluates the storage stability of its solid biofuel applications through the analysis of mildew observation, water activity, moisture content, and hygroscopicity. Figure 6 presents images of mildew observation for FSCG, DSCG, 0TSSCG, and 0.5TSSCG over a 28-day period. Among them, it is observed that the surface of FSCG sample began to growth some light yellow mold from day 7, with the quantity of mold gradually increasing over time. While no mold growth is observed in the other samples throughout the 28-day period. This corresponds to the water activity results presented in Figure 7a. FSCG exhibited a water activity of approximately 0.95, while the water activity of DSCG is significantly reduced to 0.59. According to the literature, a water activity value below 0.6 indicates that microbial growth on the sample surface is inhibited [72]. The water activity of 0TSSCG and 0.5TSSCG is measured at 0.57 and 0.56, respectively. Figure 7b presents the moisture content of FSCG, DSCG, 0TSSCG, and 0.5TSSCG under conditions of 25–28 °C and 60–70% humidity. Moisture content generally exhibits a proportional relationship with the probability of mold growth within a specific range [73]. The moisture content of FSCG is approximately 70%, while that of dried SCG is reduced to about 15%. The moisture content of torrefied SCG without sodium percarbonate blending is approximately 4.5%, and that of 0.5TSSCG is slightly increased to 7.7%. Figure 8 presents the hygroscopicity of DSCG, 0TSSCG, and 0.5TSSCG under conditions of 25–28 °C and 60–70% humidity. The results indicate that DSCG exhibits the highest hygroscopicity, and its water adsorption amount stabilizes at approximately 8.5 mg at 100 min. Based on the FTIR results in Figure 3, the surface of DSCG exhibits a stronger peak corresponding to hydroxyl functional groups, which indicates that the surface of DSCG is more prone to forming hydrogen bonds with water [74]. This characteristic facilitates the adsorption of moisture from the air and thus results in DSCG exhibiting higher hygroscopicity than 0TSSCG and 0.5TSSCG.

3.4. Fuel Properties

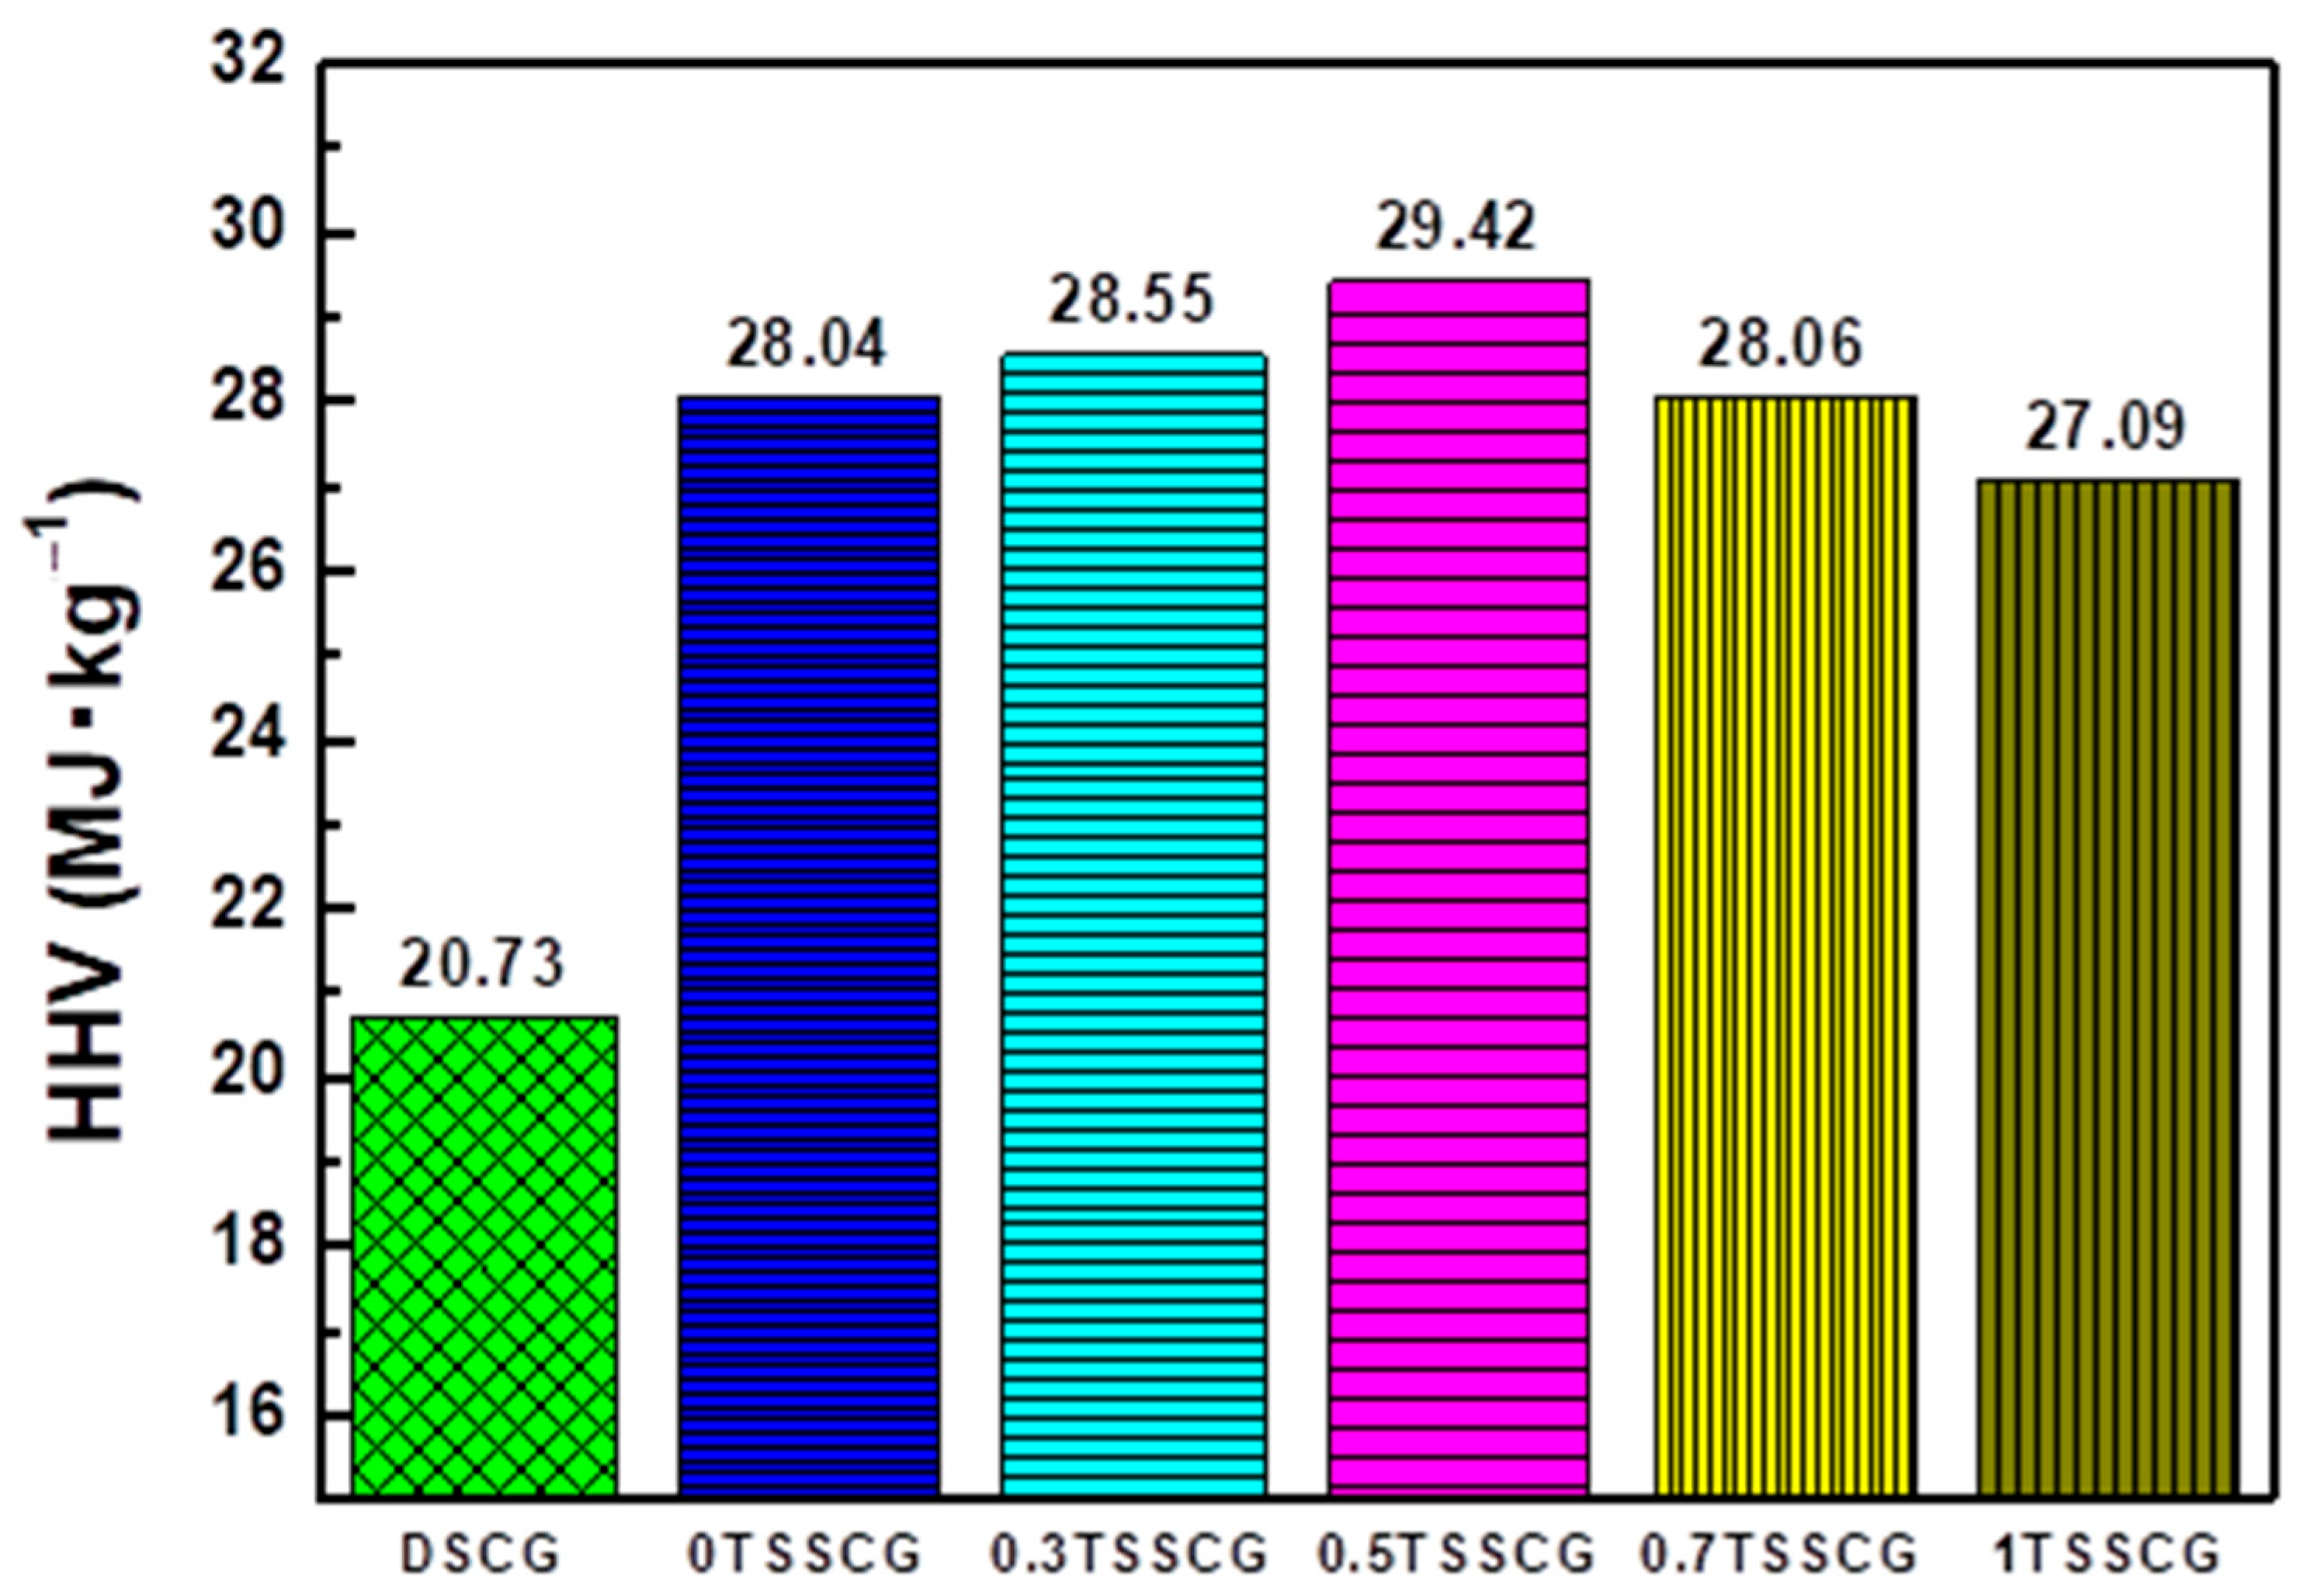
Calorific value is one of the important indicators for an ideal solid biofuel [75]. A higher calorific value means a biofuel releases more thermal energy during combustion [76]. Figure 9 presents the HHVs of DSCG 0TSSCG and torrefied SCGs with different sodium percarbonate blending amounts. The HHV of DSCG is measured to be 20.73 MJ∙kg−1. After torrefaction at 300 °C, the HHV of DSCG increased significantly to 28.04 MJ∙kg−1. When 0.5 wt% sodium percarbonate is blended to spent coffee grounds, the resulting 0.5TSSCG exhibited the highest HHV, which is 29.42 MJ∙kg−1. The increase in HHV is highly correlated with the corresponding increase in carbon content in solid biofuels [77]. Elemental analysis results in Table 1 show that the carbon content of 0TSSCG is 10.48% higher than that of DSCG, while that of 0.5TSSCG is 17.11% higher. This indicates that blending an appropriate amount of sodium percarbonate during the torrefaction helps break the bonds of organic molecules and increases both carbon content and HHV. When the sodium percarbonate concentration increased to 1 wt%, the HHV decreased slightly to 27.09 MJ∙kg−1. This is attributed to excessive carbon oxidation caused by an overabundance of additives. Table 3 presents the theoretical HHV and actual HHV calculated from the proximate analysis and elemental analysis results of the DSCG, 0TSSCG, and 0.5TSSCG. The results indicate that the difference between the theoretical HHV calculated based on EA data and the actual HHV is the smallest, with an error of less than 11%. In contrast, the error calculated using the formula based on PA exceeds 14%. This finding suggests that the formula based on EA can provide relatively accurate predictions. This accuracy is attributed to the fact that the formula takes all potential heat-generating elements into account. Past literature indicates that the theoretical HHV calculated using formulas based on EA can predict the actual HHV with relatively high accuracy [78,79]. For instance, in Table 3, the error between the theoretical HHV calculated using the EA-based formula and the actual HHV for DSCG is 7.6%. This error is close to that reported in the past literature. Putra et al. [80] converted municipal solid waste into solid biofuel using hydrothermal methods. The error between the theoretical HHV calculated via the EA-based formula and the actual HHV is only about 7.5%. Additionally, the previous study by our team similarly indicated that the error between the theoretical HHV of SCG calculated using the EA-based formula and the actual HHV is smaller than the error between the theoretical HHV calculated using the PA-based formula and the actual HHV [81].

4. Conclusions

This study demonstrates that solid biofuels with high higher heating value (HHV) and high storage stability can be successfully produced through torrefaction when spent coffee grounds (SCGs) are blended with sodium percarbonate. The Taguchi method identifies torrefaction temperature as the most influential factor affecting HHV, with optimal conditions determined as 300 °C torrefaction temperature, 90 min torrefaction time, and a sodium percarbonate blending amount of 0.5 wt%. This results in the maximum HHV of 0.5TSSCG being 29.42 MJ∙kg−1. This is attributed to the blended oxidative sodium percarbonate. It helps oxidize and pyrolyze organic molecules of SCGs, which in turn increases the carbon content of the torrefied SCGs. 0.5TSSCG, with a carbon content of 61.88 wt%, exhibited a maximum HHV of 29.42 MJ∙kg−1. This HHV is 3% higher than that of SCGs without sodium percarbonate blending. It is also 35% higher than that of SCGs without torrefaction. Results from FTIR, water activity, hygroscopicity, and mold observation confirmed that 0.5TSSCG exhibited good storage stability. The water activity of 0.5TSSCG is determined to be 0.56. In summary the 0.5TSSCG exhibits great HHV and storage stability. This strategy shows good development potential in the field of producing solid biofuels with limited energy consumption. It addresses the bottleneck of increasing the carbon content and HHV of solid biofuels. The strategy enhances the sustainability of the industrial chain and has the potential to partially replace traditional coal consumption in the future. Although the precise reaction mechanism of sodium percarbonate in the torrefaction of SCGs remains to be experimentally verified in the future, the findings of this study indicate that it plays a confirmed and important role in improving the fuel properties of SCGs.

Author Contributions

Conceptualization, K.-T.L.; methodology, K.-T.L.; validation, N.-Y.H. and Y.-S.X.; formal analysis, N.-Y.H. and Y.-S.X.; investigation, K.-T.L.; resources, K.-T.L. and W.-H.C.; data curation, J.-N.S., N.-Y.H. and Y.-S.X.; writing—original draft preparation, K.-T.L. and J.-N.S.; writing—review and editing, K.-T.L. and W.-H.C.; supervision, K.-T.L. and W.-H.C.; funding acquisition, K.-T.L. All authors have read and agreed to the published version of the manuscript.

Funding

This research was funded by National Science and Technology Council, Taiwan, R.O.C., under the grant number NSTC 113-2221-E-029-001-MY3.

Data Availability Statement

The original contributions presented in this study are included in the article. Further inquiries can be directed to the corresponding author(s).

Conflicts of Interest

The funders had no role in the design of the study; in the collection, analyses, or interpretation of data; in the writing of the manuscript; or in the decision to publish the results.

Abbreviations

SCGsSpent coffee grounds
0TSSCGTorrefied SCGs without sodium percarbonate
0.5TSSCGTorrefied SCGs blended with 0.5 wt% sodium percarbonate
HHVHigher heating value
FSCGFresh spent coffee grounds (before drying)
DSCGDried spent coffee grounds
S/NSignal-to-noise
VMVolatile matter
FCFixed carbon

References

  1. IEA. Global Energy Review 2025; IEA: Paris, France, 2025. [Google Scholar]
  2. IEA. Coal Mid-Year Update-July 2024; IEA: Paris, France, 2024. [Google Scholar]
  3. Budget, G.C. Fossil fuel CO2 emissions increase again in 2024. ScienceDaily, 12 November 2024. Available online: www.sciencedaily.com/releases/2024/11/241112191227.htm (accessed on 4 August 2025).
  4. Demirbas, A. Correlations between carbon dioxide emissions and carbon contents of fuels. Energy Sources Part B 2006, 1, 421–427. [Google Scholar] [CrossRef]
  5. Demirbas, A. Carbon dioxide emissions and carbonation sensors. Energy Sources Part A Recovery Util. Environ. Eff. 2007, 30, 70–78. [Google Scholar] [CrossRef]
  6. Santojanni, F.B.; Miner, H.; Hain, H.; Sutton, G. The Impact of Climate Change on Biodiversity in Coastal Ecosystems. J. Ilmu Pendidik. Hum. 2023, 12, 167–182. [Google Scholar] [CrossRef]
  7. World Health Organization. Ambient (Outdoor) Air Pollution; World Health Organization: Geneva, Switzerland, 2024. [Google Scholar]
  8. Malik, K.; Capareda, S.C.; Kamboj, B.R.; Malik, S.; Singh, K.; Arya, S.; Bishnoi, D.K. Biofuels production: A review on sustainable alternatives to traditional fuels and energy sources. Fuels 2024, 5, 157–175. [Google Scholar] [CrossRef]
  9. El-Araby, R. Biofuel production: Exploring renewable energy solutions for a greener future. Biotechnol. Biofuels Bioprod. 2024, 17, 129. [Google Scholar] [CrossRef] [PubMed]
  10. Ibitoye, S.E.; Mahamood, R.M.; Jen, T.-C.; Loha, C.; Akinlabi, E.T. An overview of biomass solid fuels: Biomass sources, processing methods, and morphological and microstructural properties. J. Bioresour. Bioprod. 2023, 8, 333–360. [Google Scholar] [CrossRef]
  11. Natural Resources Canada. Solid Biomass Fuels (Solid Biofuels Bulletin; No. 1); Natural Resources Canada: Ottawa, ON, Canada, 2016.
  12. Khan, S.; Irshad, S.; Mehmood, K.; Hasnain, Z.; Nawaz, M.; Rais, A.; Gul, S.; Wahid, M.; Hashem, A.; Abd_Allah, E. Biochar production and characteristics, its impacts on soil health, crop production, and yield enhancement: A review. Plants 2024, 13, 166. [Google Scholar] [CrossRef]
  13. Duque-Acevedo, M.; Lancellotti, I.; Andreola, F.; Barbieri, L.; Belmonte-Ureña, L.J.; Camacho-Ferre, F. Management of agricultural waste biomass as raw material for the construction sector: An analysis of sustainable and circular alternatives. Environ. Sci. Eur. 2022, 34, 70. [Google Scholar] [CrossRef]
  14. Lee, K.-T.; Shih, Y.-T.; Rajendran, S.; Park, Y.-K.; Chen, W.-H. Spent coffee ground torrefaction for waste remediation and valorization. Environ. Pollut. 2023, 324, 121330. [Google Scholar] [CrossRef]
  15. Go, A.W.; Pham, T.Y.N.; Ju, Y.-H.; Agapay, R.C.; Angkawijaya, A.E.; Quijote, K.L. Extraction of lipids from post-hydrolysis spent coffee grounds for biodiesel production with hexane as solvent: Kinetic and equilibrium data. Biomass Bioenergy 2020, 140, 105704. [Google Scholar] [CrossRef]
  16. Johnson, K.; Liu, Y.; Lu, M. A review of recent advances in spent coffee grounds upcycle technologies and practices. Front. Chem. Eng. 2022, 4, 838605. [Google Scholar] [CrossRef]
  17. Mordor Intelligence. Coffee Market Report; Mordor Intelligence: Hyderabad, India, 2025. [Google Scholar]
  18. Franca, A.S.; Oliveira, L.S. Potential uses of spent coffee grounds in the food industry. Foods 2022, 11, 2064. [Google Scholar] [CrossRef]
  19. Chen, W.-H.; Cheng, C.-L.; Show, P.-L.; Ong, H.C. Torrefaction performance prediction approached by torrefaction severity factor. Fuel 2019, 251, 126–135. [Google Scholar] [CrossRef]
  20. Smith, E.W.; Aniza, R.; Petrissans, A.; Quirino, R.L.; Colin, B.; Petrissans, M.; Chen, W.-H.J. Synergistic and Antagonistic Effects of Catalytic Torrefaction-Pyrolysis of Woody Biomass in a Carbon Dioxide Atmosphere for Biofuel Production. Green Energy Fuel Res. 2025, 2, 152–173. [Google Scholar] [CrossRef]
  21. Ibitoye, S.E.; Loha, C.; Mahamood, R.M.; Jen, T.-C.; Alam, M.; Sarkar, I.; Das, P.; Akinlabi, E.T. An overview of biochar production techniques and application in iron and steel industries. Bioresour. Bioprocess. 2024, 11, 65. [Google Scholar] [CrossRef]
  22. Kabir, E.; Kim, K.-H.; Kwon, E.E. Biochar as a tool for the improvement of soil and environment. Front. Environ. Sci. 2023, 11, 1324533. [Google Scholar] [CrossRef]
  23. Wang, X.; Guo, Z.; Hu, Z.; Zhang, J. Recent advances in biochar application for water and wastewater treatment: A review. PeerJ 2020, 8, e9164. [Google Scholar] [CrossRef] [PubMed]
  24. Gwenzi, W.; Chaukura, N.; Wenga, T.; Mtisi, M. Biochars as media for air pollution control systems: Contaminant removal, applications and future research directions. Sci. Total Environ. 2021, 753, 142249. [Google Scholar] [CrossRef] [PubMed]
  25. Wang, K.; Remón, J.; Jiang, Z.; Ding, W. Recent advances in the preparation and application of biochar derived from lignocellulosic biomass: A mini review. Polymers 2024, 16, 851. [Google Scholar] [CrossRef] [PubMed]
  26. Tomczyk, A.; Sokołowska, Z.; Boguta, P. Biochar physicochemical properties: Pyrolysis temperature and feedstock kind effects. Rev. Environ. Sci. Bio/Technol. 2020, 19, 191–215. [Google Scholar] [CrossRef]
  27. Azzi, E.S.; Li, H.; Cederlund, H.; Karltun, E.; Sundberg, C. Modelling biochar long-term carbon storage in soil with harmonized analysis of decomposition data. Geoderma 2024, 441, 116761. [Google Scholar]
  28. Al-Awadhi, Y.M.; Pradhan, S.; McKay, G.; Al-Ansari, T.; Mackey, H.R. Coffee waste biochar: A widely available and low-cost biomass for producing carbonaceous water treatment adsorbents. Chem. Eng. Trans. 2022, 92, 319–324. [Google Scholar]
  29. Tan, X.; Zhang, F.; Wang, H.; Ho, S.-H. The magic of algae-based biochar: Advantages, preparation, and applications. Bioengineered 2023, 14, 2252157. [Google Scholar] [CrossRef]
  30. Mukherjee, A.; Patra, B.R.; Podder, J.; Dalai, A.K. Synthesis of biochar from lignocellulosic biomass for diverse industrial applications and energy harvesting: Effects of pyrolysis conditions on the physicochemical properties of biochar. Front. Mater. 2022, 9, 870184. [Google Scholar] [CrossRef]
  31. Parikh, J.; Channiwala, S.; Ghosal, G. A correlation for calculating HHV from proximate analysis of solid fuels. Fuel 2005, 84, 487–494. [Google Scholar] [CrossRef]
  32. Guo, S.; Liu, L.; Zhao, D.; Zhao, C.; Li, X.; Li, G. Optimization of briquette fuels by co-torrefaction of residual biomass and plastic waste using response surface methodology. Molecules 2023, 28, 2568. [Google Scholar] [CrossRef]
  33. Fu, Y.; Shen, Y.; Zhang, Z.; Ge, X.; Chen, M. Activated bio-chars derived from rice husk via one-and two-step KOH-catalyzed pyrolysis for phenol adsorption. Sci. Total Environ. 2019, 646, 1567–1577. [Google Scholar]
  34. Chen, W.-H.; Du, J.-T.; Lee, K.-T.; Ong, H.C.; Park, Y.-K.; Huang, C.-C. Pore volume upgrade of biochar from spent coffee grounds by sodium bicarbonate during torrefaction. Chemosphere 2021, 275, 129999. [Google Scholar] [CrossRef]
  35. Mikutta, R.; Kleber, M.; Kaiser, K.; Jahn, R. Organic matter removal from soils using hydrogen peroxide, sodium hypochlorite, and disodium peroxodisulfate. Soil Sci. Soc. Am. J. 2005, 69, 120–135. [Google Scholar] [CrossRef]
  36. Ksibi, M. Chemical oxidation with hydrogen peroxide for domestic wastewater treatment. Chem. Eng. J. 2006, 119, 161–165. [Google Scholar] [CrossRef]
  37. Sanderson, W.R. Cleaner industrial processes using hydrogen peroxide. Pure Appl. Chem. 2000, 72, 1289–1304. [Google Scholar] [CrossRef]
  38. Falagas, M.; Thomaidis, P.; Kotsantis, I.; Sgouros, K.; Samonis, G.; Karageorgopoulos, D. Airborne hydrogen peroxide for disinfection of the hospital environment and infection control: A systematic review. J. Hosp. Infect. 2011, 78, 171–177. [Google Scholar] [CrossRef]
  39. Li, L.; Niu, X.; Zhang, D.; Ye, X.; Zhang, Z.; Liu, Q.; Ding, L.; Chen, K.; Chen, Y.; Chen, K.; et al. A systematic review on percarbonate-based advanced oxidation processes in wastewater remediation: From theoretical understandings to practical applications. Water Res. 2024, 259, 121842. [Google Scholar] [CrossRef]
  40. Ke, D.; Kengla, C.; Lee, S.J.; Yoo, J.J.; Zhu, X.; Murphy, S.V. Release kinetics and in vitro characterization of sodium percarbonate and calcium peroxide to oxygenate bioprinted tissue models. Int. J. Mol. Sci. 2022, 23, 6842. [Google Scholar] [CrossRef]
  41. Lee, K.-T.; Gabriela, S.; Chen, W.-H.; Rajendran, S.; Selvarajoo, A. Optimizing dispersion of torrefied spent coffee grounds for enhanced biochar-EVA composite properties through sodium percarbonate-assisted treatment. J. Ind. Eng. Chem. 2025, 150, 758–770. [Google Scholar] [CrossRef]
  42. ASTM D1102; Standard Test Method for Ash in Wood. ASTM International: West Conshohocken, PA, USA, 2021.
  43. ASTM E872; Standard Test Method for Volatile Matter in the Analysis of Particulate Wood Fuels. ASTM International: West Conshohocken, PA, USA, 2021.
  44. ASTM E1534; Standard Test Method for Determination of Ash Content of Particulate Wood Fuels. ASTM International: West Conshohocken, PA, USA, 2021.
  45. Adebiyi, F.M.; Ore, O.T.; Aderibigbe, O.E. Thermogravimetric characteristics and predictive modelling of oil sand bitumen pyrolysis using artificial neural network. Discov. Energy 2024, 4, 17. [Google Scholar] [CrossRef]
  46. ASTM E871; Standard Test Method for Moisture Analysis of Particulate Wood Fuels. ASTM International: West Conshohocken, PA, USA, 2021.
  47. Oboirien, B.; Thulari, V.; North, B. Enrichment of trace elements in bottom ash from coal oxy-combustion: Effect of coal types. Appl. Energy 2016, 177, 81–86. [Google Scholar] [CrossRef]
  48. Li, F.; Jiang, Z.; Ji, W.; Chen, Y.; Ma, J.; Gui, X.; Zhao, J.; Zhou, C. Effects of hydrothermal carbonization temperature on carbon retention, stability, and properties of animal manure-derived hydrochar. Int. J. Agric. Biol. Eng. 2022, 15, 124–131. [Google Scholar] [CrossRef]
  49. Seki, Y.; Kıilıinç, A.Ç.; Dalmıiş, R.; Köktaş, S.; Çelik, E. Characterization of flax, jute, and sisal fibers after sodium perborate modification. AATCC J. Res. 2019, 6, 25–31. [Google Scholar] [CrossRef]
  50. Fujitani, K.; Mizutani, T.; Oida, T.; Kawase, T. Oxidative cleavage with hydrogen peroxide: Preparation of polycarboxylic acids from cyclic olefins. J. Oleo Sci. 2009, 58, 37–42. [Google Scholar] [CrossRef]
  51. Huang, Z.; Jiang, S.; Guo, J.; Wang, X.; Tan, M.; Xiong, R.; Wang, Z.; Wu, Z.; Li, H. Oxidative torrefaction of phragmites australis: Gas-pressurized effects and correlation analysis based on color value. Energy Fuels 2020, 34, 11073–11082. [Google Scholar] [CrossRef]
  52. Lozano, D.C.P.; Jones, H.E.; Reina, T.R.; Volpe, R.; Barrow, M.P. Unlocking the potential of biofuels via reaction pathways in van Krevelen diagrams. Green Chem. 2021, 23, 8949–8963. [Google Scholar] [CrossRef]
  53. Nizamuddin, S.; Jayakumar, N.S.; Sahu, J.N.; Ganesan, P.; Bhutto, A.W.; Mubarak, N.M. Hydrothermal carbonization of oil palm shell. Korean J. Chem. Eng. 2015, 32, 1789–1797. [Google Scholar] [CrossRef]
  54. Fengel, D. Characterization of cellulose by deconvoluting the OH valency range in FTIR spectra. Holzforschung 1992, 46, 283–288. [Google Scholar] [CrossRef]
  55. Tahir, M.H.; Zhao, Z.; Ren, J.; Naqvi, M.; Ahmed, M.S.; Shah, T.-U.-H.; Shen, B.; Elkamel, A.; Irfan, R.M.; Rahman, A.U. Fundamental investigation of the effect of functional groups on the variations of higher heating value. Fuel 2019, 253, 881–886. [Google Scholar] [CrossRef]
  56. Nandiyanto, A.B.D.; Ragadhita, R.; Fiandini, M. Interpretation of Fourier transform infrared spectra (FTIR): A practical approach in the polymer/plastic thermal decomposition. Indones. J. Sci. Technol. 2023, 8, 113–126. [Google Scholar]
  57. Mawhinney, D.B.; Yates, J.T., Jr. FTIR study of the oxidation of amorphous carbon by ozone at 300 K—Direct COOH formation. Carbon 2001, 39, 1167–1173. [Google Scholar] [CrossRef]
  58. Tavadi, A.R.; Basheer, D.; Melese, K.G.; Kumaresan, K.; Mohan, N.; Kerur, M.R.H.; Shashidhara, L. Experimental analysis of mechanical properties and FTIR analysis of areca fiber-reinforced epoxy composites incorporating Al2O3. J. Ind. Text. 2025, 55, 15280837241313217. [Google Scholar] [CrossRef]
  59. Chen, W.-H.; Ho, K.-Y.; Lee, K.-T.; Ding, L.; Lin, K.-Y.A.; Rajendran, S.; Singh, Y.; Chang, J.-S. Dual pretreatment of mixing H2O2 followed by torrefaction to upgrade spent coffee grounds for fuel production and upgrade level identification of H2O2 pretreatment. Environ. Res. 2022, 215, 114016. [Google Scholar] [CrossRef] [PubMed]
  60. Demirbaş, A. Relationships between lignin contents and heating values of biomass. Energy Convers. Manag. 2001, 42, 183–188. [Google Scholar] [CrossRef]
  61. Zhao, D.; Wu, Y.; Jia, J. Analysis of gas phase products and free radical formation mechanism in anthracite spontaneous combustion process. Thermochim. Acta 2025, 748, 179981. [Google Scholar] [CrossRef]
  62. Okuyama, N.; Komatsu, N.; Shigehisa, T.; Kaneko, T.; Tsuruya, S. Hyper-coal process to produce the ash-free coal. Fuel Process. Technol. 2004, 85, 947–967. [Google Scholar] [CrossRef]
  63. Diao, W.; Zhu, L.; Yao, Q.; Li, X.; Gong, C.; Wang, H.; Huang, Z. Enhancing biomethan generation of lignite with blue-green algae as an additive. Fuel 2025, 384, 133961. [Google Scholar] [CrossRef]
  64. Liu, Z.; Hu, W.; Jiang, Z.; Mi, B.; Fei, B. Investigating combustion behaviors of bamboo, torrefied bamboo, coal and their respective blends by thermogravimetric analysis. Renew. Energy 2016, 87, 346–352. [Google Scholar] [CrossRef]
  65. Chen, W.-H.; Du, S.-W.; Tsai, C.-H.; Wang, Z.-Y. Torrefied biomasses in a drop tube furnace to evaluate their utility in blast furnaces. Bioresour. Technol. 2012, 111, 433–438. [Google Scholar] [CrossRef] [PubMed]
  66. Pedroso, D.T.; Machin, E.B.; Cabrera-Barjas, G.; Flores, M.; Urra, H.G.; De Carvalho, F.S.; Santos, M.I.S.d.; Machin, A.B.; Canettieri, E.V.; Perez, N.P.; et al. Sugarcane bagasse torrefaction for fluidized bed gasification. Appl. Sci. 2021, 11, 6105. [Google Scholar] [CrossRef]
  67. Fadhil, A.B.; Alhayali, M.A.; Saeed, L.I. Date (Phoenix dactylifera L.) palm stones as a potential new feedstock for liquid bio-fuels production. Fuel 2017, 210, 165–176. [Google Scholar] [CrossRef]
  68. Alauddin, Z.A.B.Z.; Lahijani, P.; Mohammadi, M.; Mohamed, A.R. Gasification of lignocellulosic biomass in fluidized beds for renewable energy development: A review. Renew. Sustain. Energy Rev. 2010, 14, 2852–2862. [Google Scholar] [CrossRef]
  69. Rashid, K.M.J. Optimize the Taguchi method, the signal-to-noise ratio, and the sensitivity. Int. J. Stat. Appl. Math. 2023, 8, 64–70. [Google Scholar] [CrossRef]
  70. Wzorek, M.; Król, A.; Junga, R.; Małecka, J.; Yilmaz, E.; Kolasa-Więcek, A. Effect of storage conditions on lignocellulose biofuels properties. Sci. Rep. 2024, 14, 15192. [Google Scholar] [CrossRef]
  71. Franca, A.S.; Oliveira, L.S. Coffee processing solid wastes: Current uses and future perspectives. Agric. Wastes 2009, 9, 155–189. [Google Scholar]
  72. Tapia, M.S.; Alzamora, S.M.; Chirife, J. Effects of Water Activity (aw) on Microbial Stability as a Hurdle in Food Preservation; John Wiley & Sons, Inc.: Hoboken, NJ, USA, 2020; pp. 323–355. [Google Scholar]
  73. Glass, S.; Zelinka, S.L. Moisture Relations and Physical Properties of Wood; U.S. Department of Agriculture Forest Service: Washington, DC, USA, 2021; pp. 4-1–4-22.
  74. Berthomieu, C.; Hienerwadel, R. Fourier transform infrared (FTIR) spectroscopy. Agric. Biol. Sci. 2009, 101, 157–170. [Google Scholar] [CrossRef] [PubMed]
  75. Obernberger, I.; Brunner, T.; Bärnthaler, G. Chemical properties of solid biofuels—Significance and impact. Biomass Bioenergy 2006, 30, 973–982. [Google Scholar] [CrossRef]
  76. Bhaskar, T.; Bhavya, B.; Singh, R.; Naik, D.V.; Kumar, A.; Goyal, H.B. Thermochemical conversion of biomass to biofuels. In Biofuels; Elsevier: Amsterdam, The Netherlands, 2011; pp. 51–77. [Google Scholar]
  77. Wang, Y.; Qiu, L.; Zhu, M.; Sun, G.; Zhang, T.; Kang, K. Comparative evaluation of hydrothermal carbonization and low temperature pyrolysis of eucommia ulmoides oliver for the production of solid biofuel. Sci. Rep. 2019, 9, 5535. [Google Scholar] [CrossRef] [PubMed]
  78. Channiwala, S.; Parikh, P. A unified correlation for estimating HHV of solid, liquid and gaseous fuels. Fuel 2002, 81, 1051–1063. [Google Scholar] [CrossRef]
  79. Chen, W.-H.; Cheng, W.-Y.; Lu, K.-M.; Huang, Y.-P. An evaluation on improvement of pulverized biomass property for solid fuel through torrefaction. Appl. Energy 2011, 88, 3636–3644. [Google Scholar] [CrossRef]
  80. Putra, H.E.; Djaenudin, D.; Damanhuri, E.; Dewi, K.; Pasek, A.D. Hydrothermal carbonization kinetics of lignocellulosic municipal solid waste. J. Ecol. Eng. 2021, 22, 188–198. [Google Scholar] [CrossRef]
  81. Lee, K.-T.; Gabriela, S.; Chen, W.-H.; Ong, H.C.; Rajendran, S.; Tran, K.-Q. Co-torrefaction and synergistic effect of spent coffee grounds and tea waste for sustainable waste remediation and renewable energy. Renew. Energy 2024, 233, 121181. [Google Scholar] [CrossRef]
Figure 1. Illustration of the preparation for torrefaction of spent coffee grounds blended with sodium percarbonate using a tubular high-temperature furnace.
Energies 18 05384 g001
Figure 5. Shows the profiles of (a) mean signal-to-noise (S/N) ratio; (b) response value in terms of effects.
Energies 18 05384 g005
Figure 6. Shows the photos of mildew observation for FSCG, DSCG, 0TSSCG, and 0.5TSSCG.
Energies 18 05384 g006
Figure 7. Shows the (a) water activity; and (b) moisture content of FSCG, DSCG, 0TSSCG, and 0.5TSSCG.
Energies 18 05384 g007
Figure 8. Shows the hygroscopicity of DSCG, 0TSSCG, and 0.5TSSCG.
Energies 18 05384 g008
Figure 9. Comparison of HHV for torrefied Spent Coffee Grounds before and after sodium percarbonate blending.
Energies 18 05384 g009
Table 1. Basic properties of DSCG, 0TSSCG, and 0.5TSSCG.
AnalysesDSCG0TSSCG0.5TSSCG
Proximate Analysis (wt%), dry basis
Volatile matter (VM)84.5571.3471.13
Fixed carbon (FC)13.4825.5424.85
Ash1.973.134.02
Elemental analysis (wt%, dry basis)
C52.8458.3861.88
H6.676.897.18
N2.562.833.17
O (by difference)37.9331.9027.77
Atomic H/C ratio1.511.421.39
Atomic O/C ratio0.540.410.34
Table 2. (a) Factors and levels of Taguchi and (b) the L9 orthogonal array and output responses of Taguchi method.
(a)
FactorsParametersLevels
123
ATorrefaction temperature (°C)200250300
BTorrefaction time (min)306090
CBlending ratio (wt%)00.51
(b)
RunFactorsHHV (MJ∙kg−1)
ABC
111122.61
212223.68
313322.85
421225.05
522325.06
623125.07
731327.72
832126.06
933229.42
Table 3. Theoretical and actual HHV of DSCG, 0TSSCG and 0.5TSSCG.
Formulas of HHV (MJ∙kg−1)DSCG0TSSCG0.5TSSCG
HHV a22.3025.0927.06
HHV b17.9320.1319.84
HHV c20.7328.0429.42
a HHV = 0.3491C + 1.1783H + 0.1005S − 0.1034O − 0.0151N − 0.0211Ash. b HHV = 0.3536FC + 0.1559VM − 0.0078Ash. c Actual HHV by using IKA C6000 bomb calorimeter (IKA®-Werke GmbH & Co., Breisgau, Germany).
Disclaimer/Publisher’s Note: The statements, opinions and data contained in all publications are solely those of the individual author(s) and contributor(s) and not of MDPI and/or the editor(s). MDPI and/or the editor(s) disclaim responsibility for any injury to people or property resulting from any ideas, methods, instructions or products referred to in the content.