1. Introduction
Electricity supply is essential for community development, serving as a cornerstone of human well-being, social progress, and economic growth [
1]. However, conventional fossil fuel-based power generation systems have proven to be unsustainable due to their reliance on finite resources that are progressively being depleted [
2]. Global energy demand is expected to increase at an average annual rate of 3.4% through 2026 [
3]. In this context, factors such as rising oil prices, technological advances and growing concerns about climate change have significantly driven the search for renewable energy sources (RES) as viable and sustainable alternatives to the current energy model [
4]. By the end of 2024, RES accounted for 46% of the world’s total electricity generation capacity [
5]. This expansion not only reflects significant progress in the global energy transition but also reinforces energy security and contributes to reducing the environmental impacts associated with conventional energy sources. Despite significant advances in renewable energy deployment, 675 million people still lack access to electricity, especially in remote regions where extending the grid is often economically impractical [
6]. Renewable energy sources including wind, solar, and hydropower offer promising solutions to meet the electricity demand in these regions [
7]. However, solar and wind energy are subject to limitations such as intermittent generation, weather-related uncertainty, and high initial investment costs [
8]. A viable option for addressing these challenges is the incorporation of multiple RES into a hybrid energy system (HES), which leverages the complementarity of resources to ensure greater reliability in electricity supply [
9]. In Brazil, several initiatives have demonstrated the capability of hybrid energy systems (HESs) in electrifying isolated communities. Projects that combine renewable sources such as photovoltaic solar energy, wind power, and diesel generators have been successfully integrated into remote regions of the Amazon, coastal islands, and rural areas with limited accessibility [
10]. These configurations, often supported by public policies and energy access programs such as the Luz para Todos (Light for All) Program, facilitate the reduction in fossil fuel dependence, enhancing supply reliability, and promoting sustainable local development. However, the optimal sizing of HES components remains a challenge owing to the intrinsic variability of renewable resources, the variability of electricity demand, and the nonlinear behavior of various system elements [
11]. Oversizing may lead to excessive investments and economic inefficiency, whereas undersizing can hinder meeting the load demand and compromise energy security [
12]. Therefore, it is essential to adopt sizing strategies that combine the integration of multiple energy sources with accurate meteorological forecasting models, with the objective of reducing costs and ensuring operational reliability, and increasing environmental benefits compared to conventional or single-source systems [
13].
The key contributions of this study are as follows:
The development of an innovative and integrated methodological framework that combines long-term meteorological forecasting using Discrete Wavelet Transform and Long Short-Term Memory (DWT-LSTM) with metaheuristic optimization using Genetic Algorithm (GA) and Particle Swarm Optimization (PSO) for the optimal sizing of off-grid HES. While previous studies have often addressed forecasting models or optimization algorithms independently, this research bridges these two areas into a unified and synergistic approach, validated under real-world conditions.
The use of long-term hourly real meteorological data covering a ten-year period (2012–2021), as opposed to the more common use of monthly averages or simplified synthetic datasets. This allows for a more accurate and robust simulation of the system’s long-term operational behavior.
The execution of a comprehensive case study in the remote Brazilian region of Guanambi, demonstrating the practical applicability of the proposed methodology for providing sustainable and decentralized energy solutions in regions facing energy vulnerability. The study not only advances scientific knowledge but also offers concrete contributions to decentralized energy planning.
The organization of this article is as follows:
Section 2—Literature Review;
Section 3—Methodology, which presents the procedures adopted in the development of the study;
Section 4—Results and Discussion, presenting the outcomes obtained through the implementation of the algorithms in MATLAB; and
Section 5—Conclusions, which presents the main findings and proposes directions for future research.
2. Literature Review
According to Bade et al. [
14], the methods employed for sizing HESs can be classified into classical methods, software tools, and modern approaches based on Artificial Intelligence (AI). Classical methods such as graphical [
15], probabilistic [
16], interactive [
17] and analytical techniques [
18], despite their simplicity, they have limitations in multivariate problems and in complex search spaces [
19]. Tools like HOMER, RETScreen, and TRNSYS are widely used and stand out for their detailed simulation capabilities, but they have restrictions regarding the flexibility for adjustments to their internal optimization algorithms [
20,
21]. Modern approaches have explored both AI-based algorithms [
22] and hybrid models [
23]. Among these approaches, metaheuristic optimization algorithms stand out because they are inspired by natural, behavioral, or physical processes. These algorithms are effective in finding approximate solutions to computationally complex problems [
24]. These techniques demonstrate enhanced performance over classical methods and software tools, especially regarding computational efficiency and convergence speed, making them the preferred choice for optimizing the sizing and operation of HESs [
25,
26]. Among them, the GA and PSO are widely applied to address the nonlinear and complex challenges inherent to this type of system [
27].
Articles like those of Khatri et al. [
28], Lazaar et al. [
29] and Namrata et al. [
30] applied the GA to the sizing of HESs, demonstrating technically feasible solutions. On the other hand, PSO has proven to be more stable and has converged faster, as shown by [
31] and [
32] in applications involving solar, wind, battery systems, and diesel generators.
Despite the advances in optimization techniques, most studies still rely on historical meteorological data or monthly averages, without considering hourly forecasting models [
33].
This approach can introduce significant errors, as pointed out by Sharma et al. [
34] and De Jong et al. [
35], who emphasize the importance of hourly variability in renewable energy generation. Abazari et al. [
36] highlight that hourly meteorological forecasting techniques based on AI can substantially enhance component sizing and the operational reliability of HESs. However, the efficacy of these techniques is largely determined by the availability of consistent historical data, which remains a challenge in regions with limited or inadequate measurement infrastructure [
37]. This issue becomes more critical when long-term datasets are unavailable, since such data are essential for training predictive models capable of identifying complex patterns over extended time horizons. As a result, many studies remain constrained to short-term forecasting, as noted by Singla et al. [
38]. Moreover, Wang et al. [
39] emphasize that noise and instability in meteorological data further undermine the accuracy of forecasts. In this context, data preprocessing becomes a critical step to improve model accuracy and reduce computational load [
40], although few studies have focused specifically on this stage [
41]. Wavelet Transform has proven to be effective in this process, enabling the decomposition of time series, noise filtering, and the identification of patterns across time-frequency scales [
42,
43]. Studies such as those by Alizamir et al. [
44] and Singh et al. [
45] demonstrate that combining the Wavelet Transform with deep learning models significantly improves forecasting accuracy.
Recent studies have successfully integrated weather forecasting with optimization algorithms. Zhang et al. [
46] combined algorithms such as chaotic search, harmony search, and simulated annealing with Artificial Neural Networks (ANN) to incorporate weather forecasts, reducing the Loss of Power Supply Probability as well the life cycle cost. Maleki et al. [
47] also used ANN to forecast meteorological variables in an HES designed for water supply, achieving better results with a hybrid approach. Other studies, such as those by Gurubel et al. [
48] and Gupta et al. [
49], reinforced the importance of accurate forecasting to minimize the total annual cost (CT), using neural networks and metaheuristic algorithms. In addition, recent advances have highlighted the application of risk-averse stochastic optimization in shipboard multi-energy microgrids, addressing operational uncertainties and enhancing system resilience [
50]. Likewise, the N-1 evaluation of integrated electricity and gas systems considering cyber-physical interdependence emphasizes the importance of robustness and reliability in modern energy optimization frameworks [
51].
Moreover, machine learning techniques such as Gaussian Process Regression, Extreme Gradient Boosting, Decision Trees, and Support Vector Regression were tested for hourly forecasting and were combined with algorithms like Tunicate Swarm Algorithm (TSA) and Aquila Optimization, with TSA standing out as the best performer [
34]. Anand et al. [
19] validated this approach with real-world data in India. However, ANN models have limitations when applied to long-term forecasting, which has led to the increasing adoption of deep learning techniques such as Recurrent Neural Networks (RNNs), particularly their LSTM and Gated Recurrent Units (GRU) variants, which are capable of capturing long-term temporal dependencies [
52,
53].
Examples include the work of Medina-Santana and Cárdenas-Barrón [
54], who used LSTM models to forecast climate variables and optimize HESs, taking into account economic, social, and environmental criteria. Additionally, in another study [
55], RNNs with LSTM and GRU cells were applied to perform weather forecasting and optimize an HES engineered to cover the energy requirements of a desalination system.
The review highlights that the accuracy of meteorological forecasts has a direct impact on optimization effectiveness. However, no previous study has integrated, within a single framework, data preprocessing using DWT, forecasting with LSTM, and optimization using PSO and the GA for off-grid systems. In this context, the present study proposes an innovative approach that combines long-term hourly forecasting through a DWT-LSTM model with optimization using PSO and the GA, validated through a case study in the city of Guanambi, Brazil.
3. Methodology
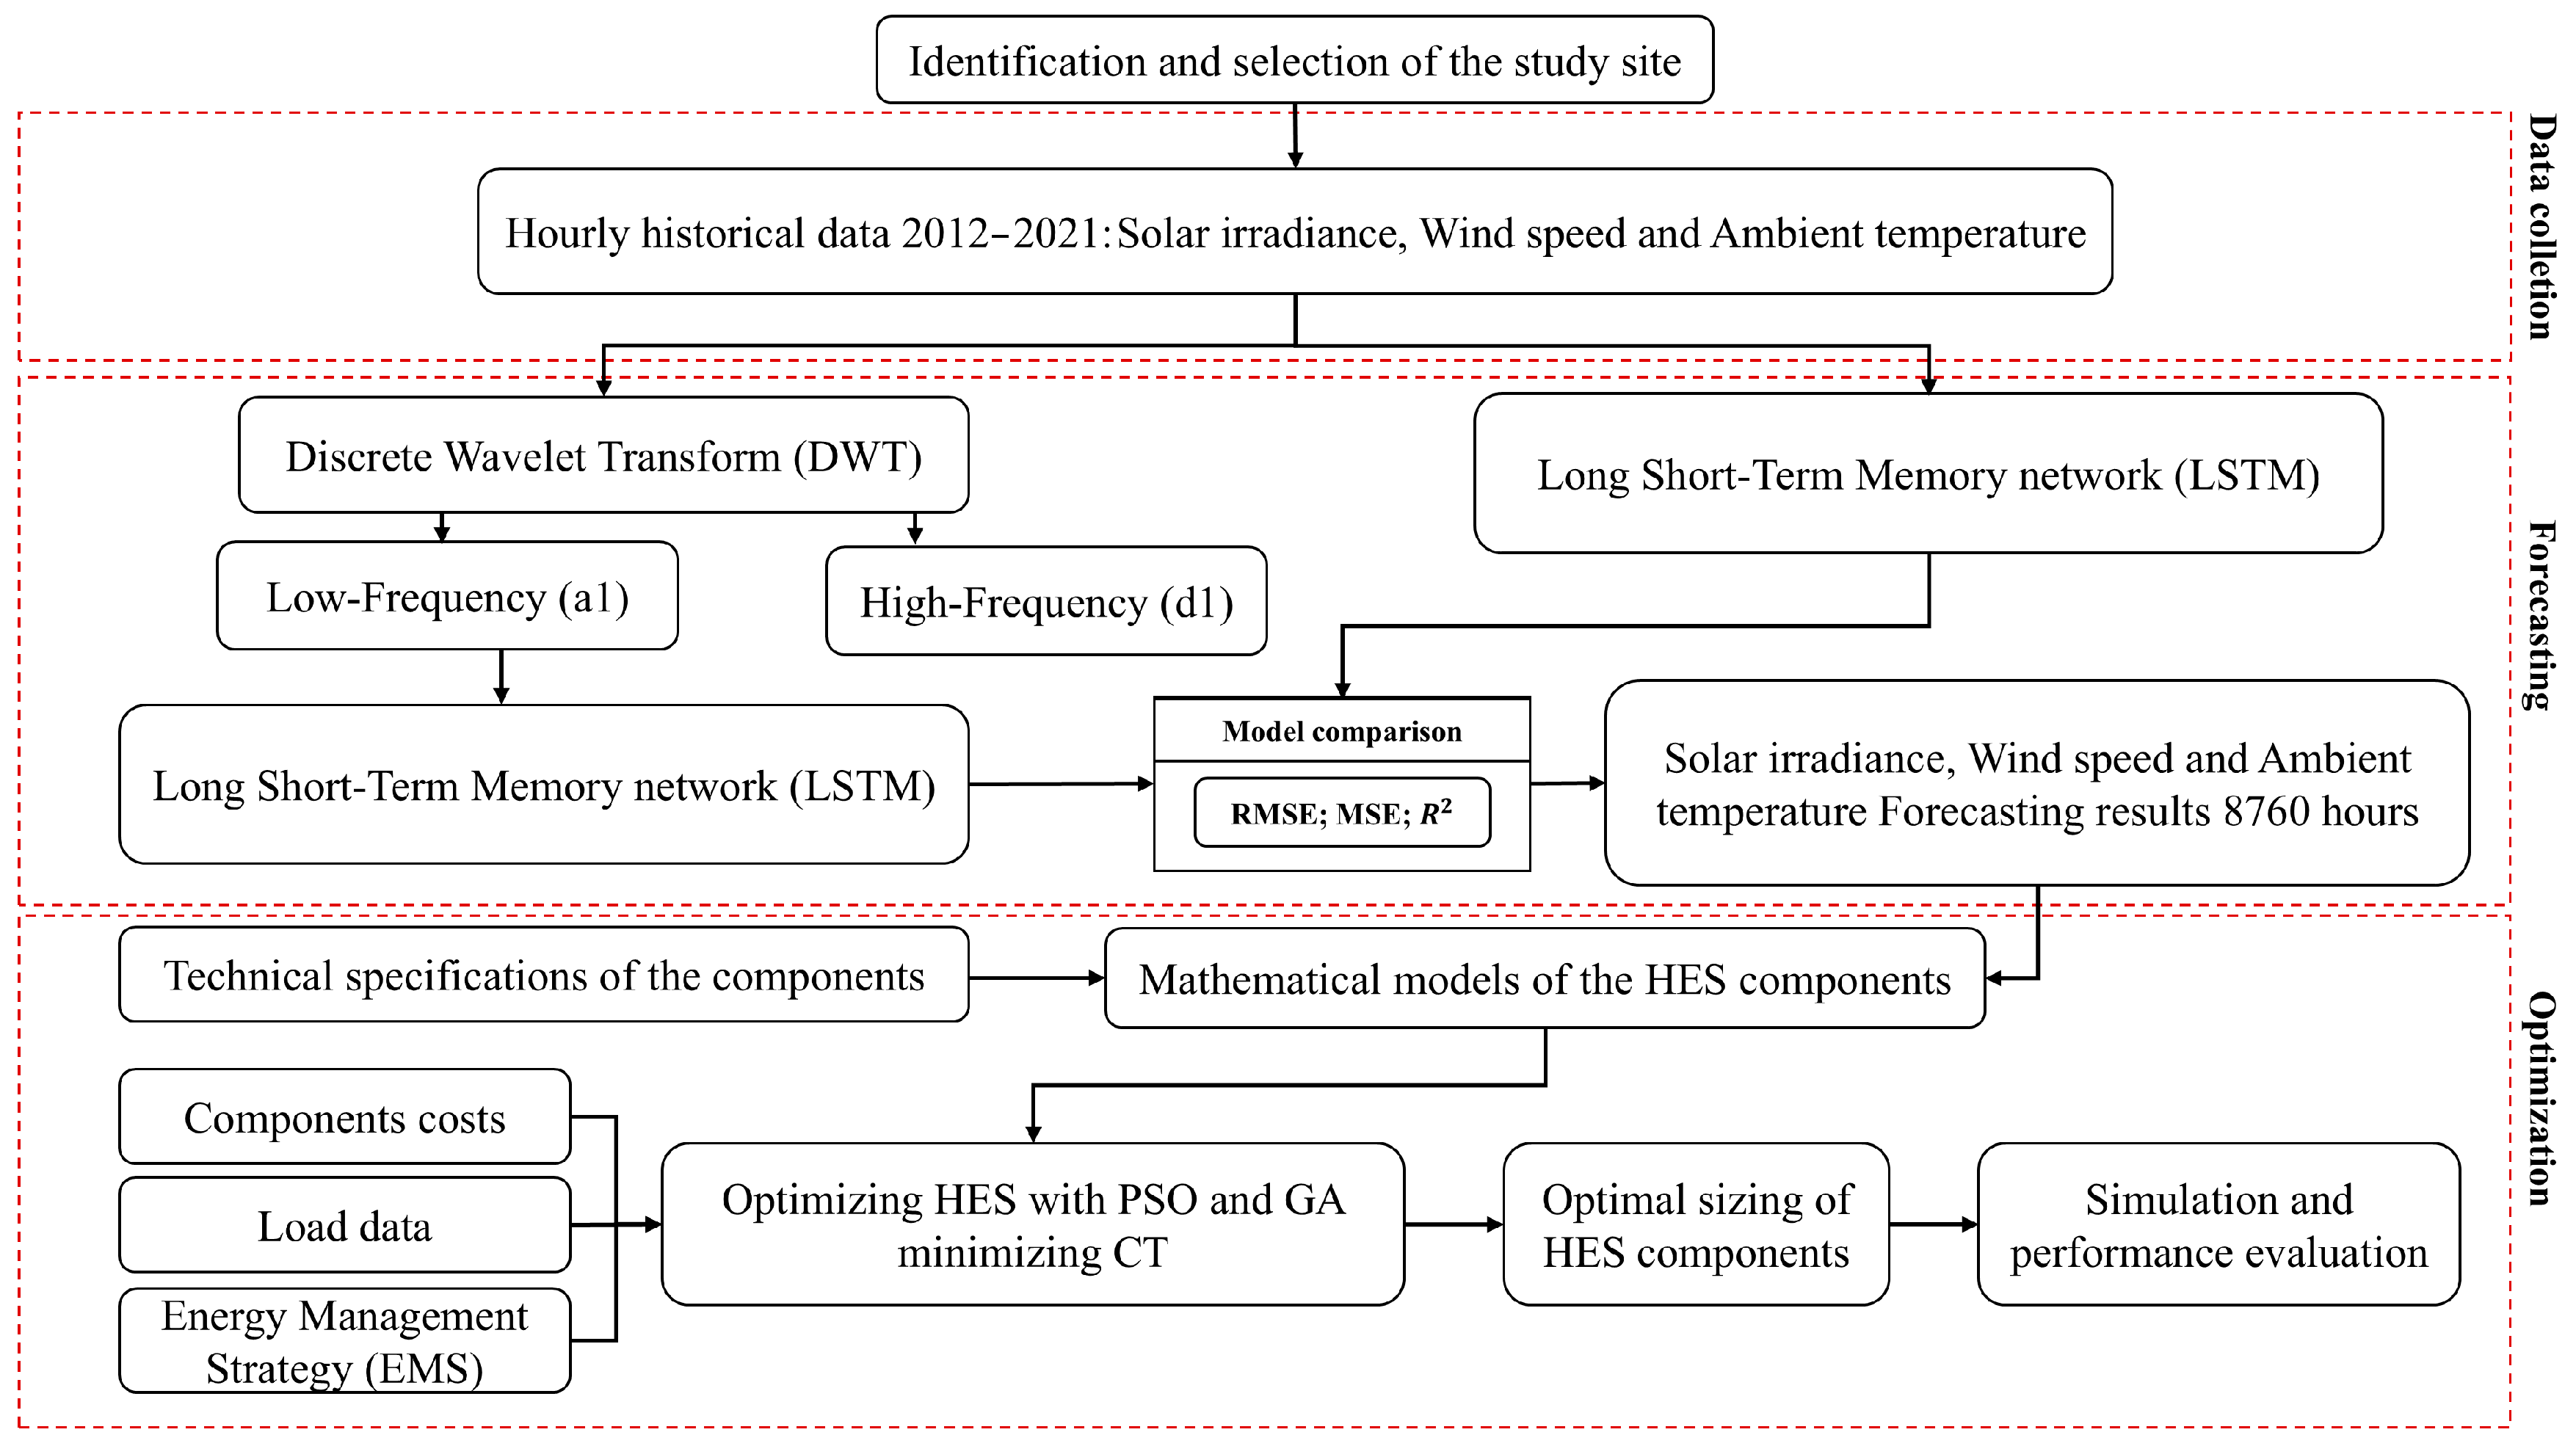
The methodology for the optimal sizing of the off-grid HES consists of three main stages: data collection, meteorological forecasting, and optimization. Initially, hourly data on solar irradiance, wind speed, and ambient temperature (2012–2021) are collected for the study location. These meteorological variables are used in the forecasting stage, in which two LSTM-based models are compared: one incorporating DWT-based preprocessing and the other without it. The model that exhibits the best performance, evaluated through the Root Mean Square Error (RMSE), Mean Squared Error (MSE), and the coefficient of determination (R
2), will be used to estimate the 8760 hourly values for the year. With the forecasted data, the optimization phase begins, involving the definition of the technical specifications and costs of system components, load profile, and an Energy Management Strategy (EMS). Based on these inputs, mathematical models of the HES components are developed, and PSO and the GA are applied to minimize the system’s CT, optimizing the number of photovoltaic panels, wind turbines, and batteries. The PSO algorithm and the GA are compared using metrics such as the minimum value of the objective function and the standard deviation, with the purpose of identifying the most efficient, stable, and cost-effective technique, which is further validated through the application of the Wilcoxon rank-sum statistical test. The optimal configuration, identified by the best-performing algorithm is then simulated for an entire year, assessing load coverage, the contribution of each source, and the fuel cost associated with the diesel generator, to verify the practical and economic feasibility of the proposed system in the study region. The entire process was implemented in MATLAB R2024a and executed on a computer powered by an 11th-generation Intel Core i5 processor with 8 GB of RAM.
Figure 1 presents the complete methodological flow, while the following section details each stage.
3.1. Study Site Selection and Data Collection
The selected site for implementing the proposed methodology was the municipality of Guanambi, located in the state of Bahia, Brazil, at the coordinates −14.1521° S latitude and −42.7262° W longitude. This region was chosen particularly due to its high solar irradiance and wind speed potential. Additionally, the availability of reliable meteorological data and the energy challenges typical of remote areas make Guanambi a highly relevant location for assessing the feasibility of the proposed HES.
The hourly meteorological data used in the analysis, solar irradiance (kW/m
2), wind speed (m/s at 50 m height), and ambient temperature (°C), were obtained from the official MERRA-2 NASA POWER database [
56], widely recognized for its accuracy and reliability. The historical series spans the period from 2012 to 2021, offering a solid and representative foundation for the weather forecasting stage of the study.
3.1.1. DWT-LSTM Model for Weather Forecasting
This section presents the proposed DWT-LSTM forecasting method, which combines data preprocessing and predictive modeling techniques in two main stages:
Data preprocessing: The hourly time series of solar irradiance, wind speed, and ambient temperature from 2012 to 2021 was processed using DWT. This technique decomposes the signals into two components: low-frequency approximation and high-frequency detail. The purpose of this decomposition is to reduce noise and emphasize the underlying patterns that may be hidden in the original signal, thereby improving the quality of the forecast.
Forecasting using LSTM network: Only the approximation component, representing smoothed versions of the original series, were employed as input to the LSTM prediction model. These components effectively capture both short- and long-term dependencies in the data [
57]. Each series consists of 87,672 hourly values, which were randomly partitioned into 80% for training, 10% for validation, and 10% for testing. This distribution ensures robust model training, allows for tuning of hyperparameters through validation, and provides an unbiased performance evaluation on unseen data [
58]. These forecasts provide consistent and accurate hourly inputs for the optimization stage, ensuring that system sizing accounts for renewable variability based on realistic scenarios rather than historical averages or synthetic datasets, which often underestimate the stochastic nature of renewable resources. While the methodology does not fully eliminate uncertainty in renewable generation, it substantially mitigates its effects, improving both the economic viability and operational reliability of the hybrid system.
3.1.2. Data Decomposition Using Wavelet Transform
There are two principal types of Wavelet Transforms: the Continuous Wavelet Transform and the Discrete Wavelet Transform (DWT). The DWT was chosen for its computational efficiency and suitability for time series forecasting. It is mathematically defined by Equation (1) [
59]:
with
and
representing the scale and translation factors, respectively,
represent the length of the signal
,
indicates the mother wavelet,
is the discrete-time sampling index and the asterisk
denotes the complex conjugate.
The optimal number of decomposition levels can be determined by comparing the approximation signal to the original signal [
60].
Following Arseven and Çınar [
61], a single-level decomposition was adopted, as it has been shown to provide sufficient predictive performance. The Daubechies wavelet of order 6 (db6) was selected due to its demonstrated effectiveness in detecting discontinuities in temporal signals. Moreover, its consistent performance in the analysis of complex dynamic signals, as reported by [
62,
63], further underscores its suitability for forecasting applications. Only the approximation signal (a1) was retained for use in the LSTM model, while the detail component (d1) was discarded [
41,
46,
63]. Alternative wavelet families and decomposition levels were not considered, as they fall outside the scope of this study.
3.1.3. Forecasting Using LSTM
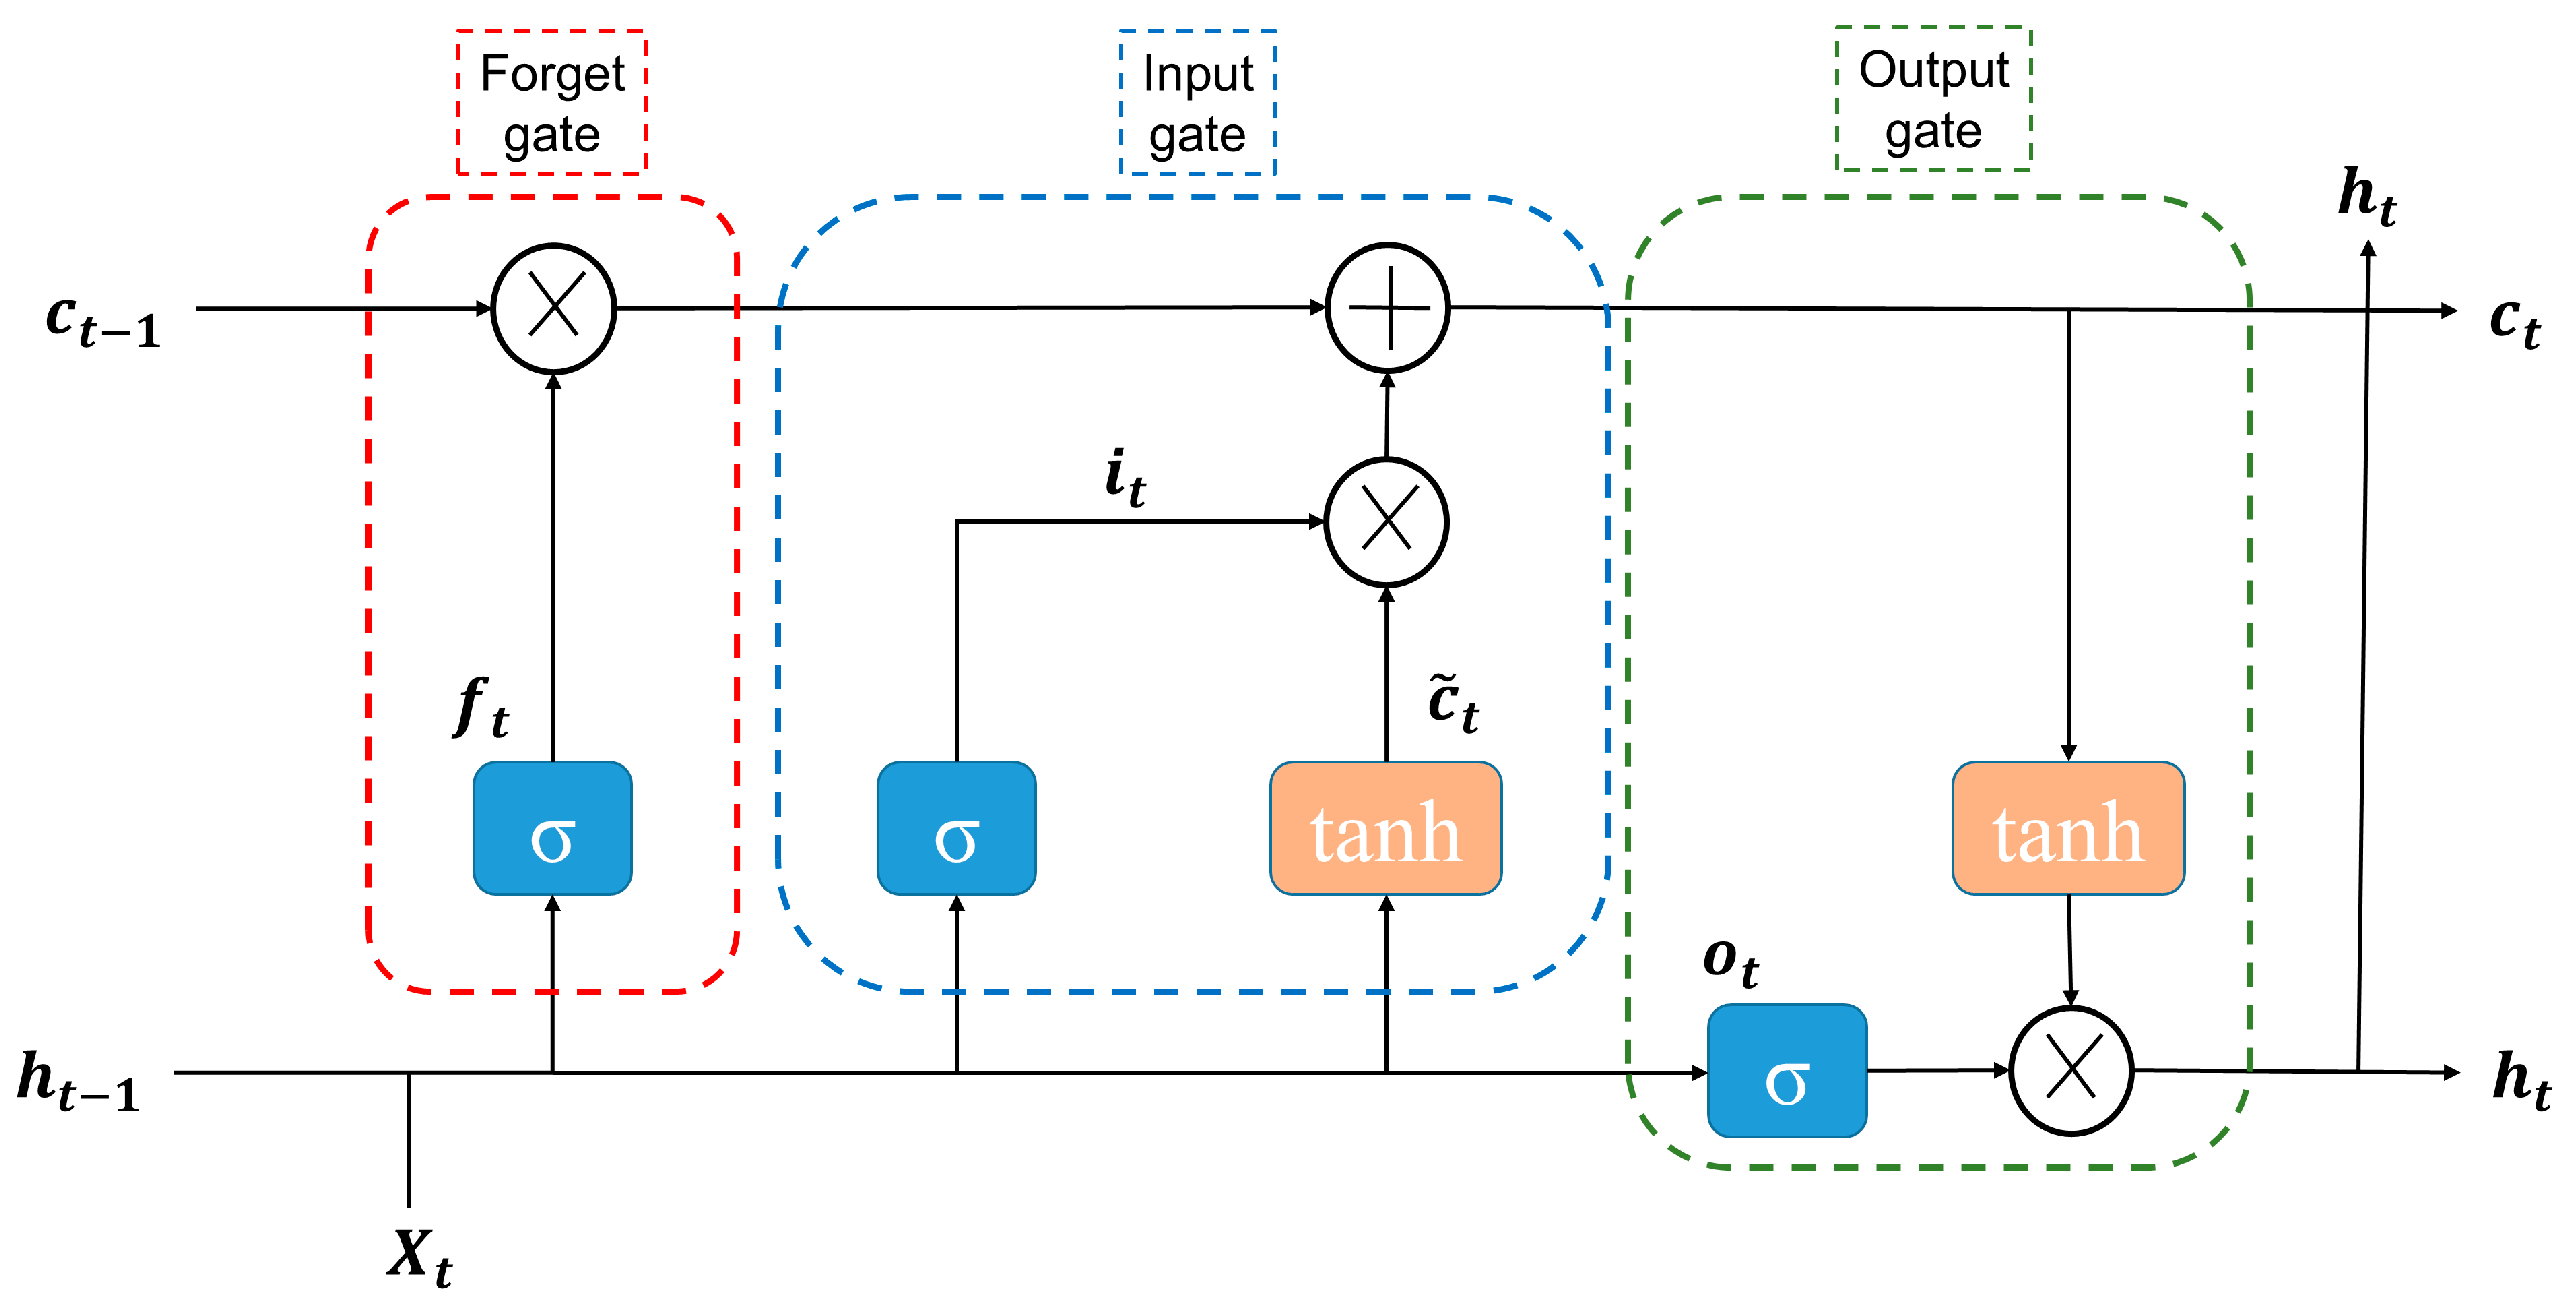
The core component of the LSTM network is the memory cell, which can retain temporal state information. The LSTM cell can add or remove information from the cell state through three control gates: the forget gate, the input gate, and the output gate. The forget gate determines which information should be discarded from the cell state, retaining only the relevant content. The input gate manages the flow of new information into the cell, updating its state, while the output gate controls the information flow from the cell state to the output [
64].
Figure 2 illustrates the structure of the LSTM cell. The variable
represents the internal cell state,
,
, and
are the activation vectors for the forget gate, input gate, and output gate, respectively;
is the input vector;
is the previous hidden state;
is the previous cell state; and
is the candidate cell state. The output of the LSTM cell is the hidden state
. The mathematical formulation describing the LSTM structure is presented in Equations (2)–(7) [
65]:
where
denotes the sigmoid activation function,
represents the hyperbolic tangent activation function,
refers to the weight matrices,
is the bias vector, and
denotes the multiplication operation of corresponding elements of matrix.
The model was trained over 160 epochs using a single hidden layer composed of 200 units, facilitating the network’s ability to capture complex patterns in the time series data. The training process employed the Adam optimizer, designed to adaptively tune the learning rate for each parameter, improving convergence efficiency [
44]. The initial learning rate was set at 0.005 and followed a piecewise schedule, being reduced by a factor of 0.2 every 125 epochs to support progressive model adaptation. Additionally, a gradient clipping threshold of 1 was employed to prevent gradient explosion and preserve training stability.
Table 1 presents the hyperparameters used during the LSTM model training.
3.1.4. Statistical Metrics for Accuracy Assessment
To evaluate the performance of the proposed DWT-LSTM forecasting model in comparison with the standard LSTM model, the predicted data from both models were evaluated against the actual historical meteorological data from the year 2021. Performance metrics such as
RMSE,
MSE and
R2, were calculated to quantify the forecasting accuracy, as defined by Equations (8)–(10). [
66]:
where
,
,
and
represent the actual value, predicted value, mean of actual values, and the number of samples, respectively. Lower
MSE and
RMSE values indicate greater model efficiency, while
R2 close to 1 reflects better fit quality.
3.2. Mathematical Model of Hes Components
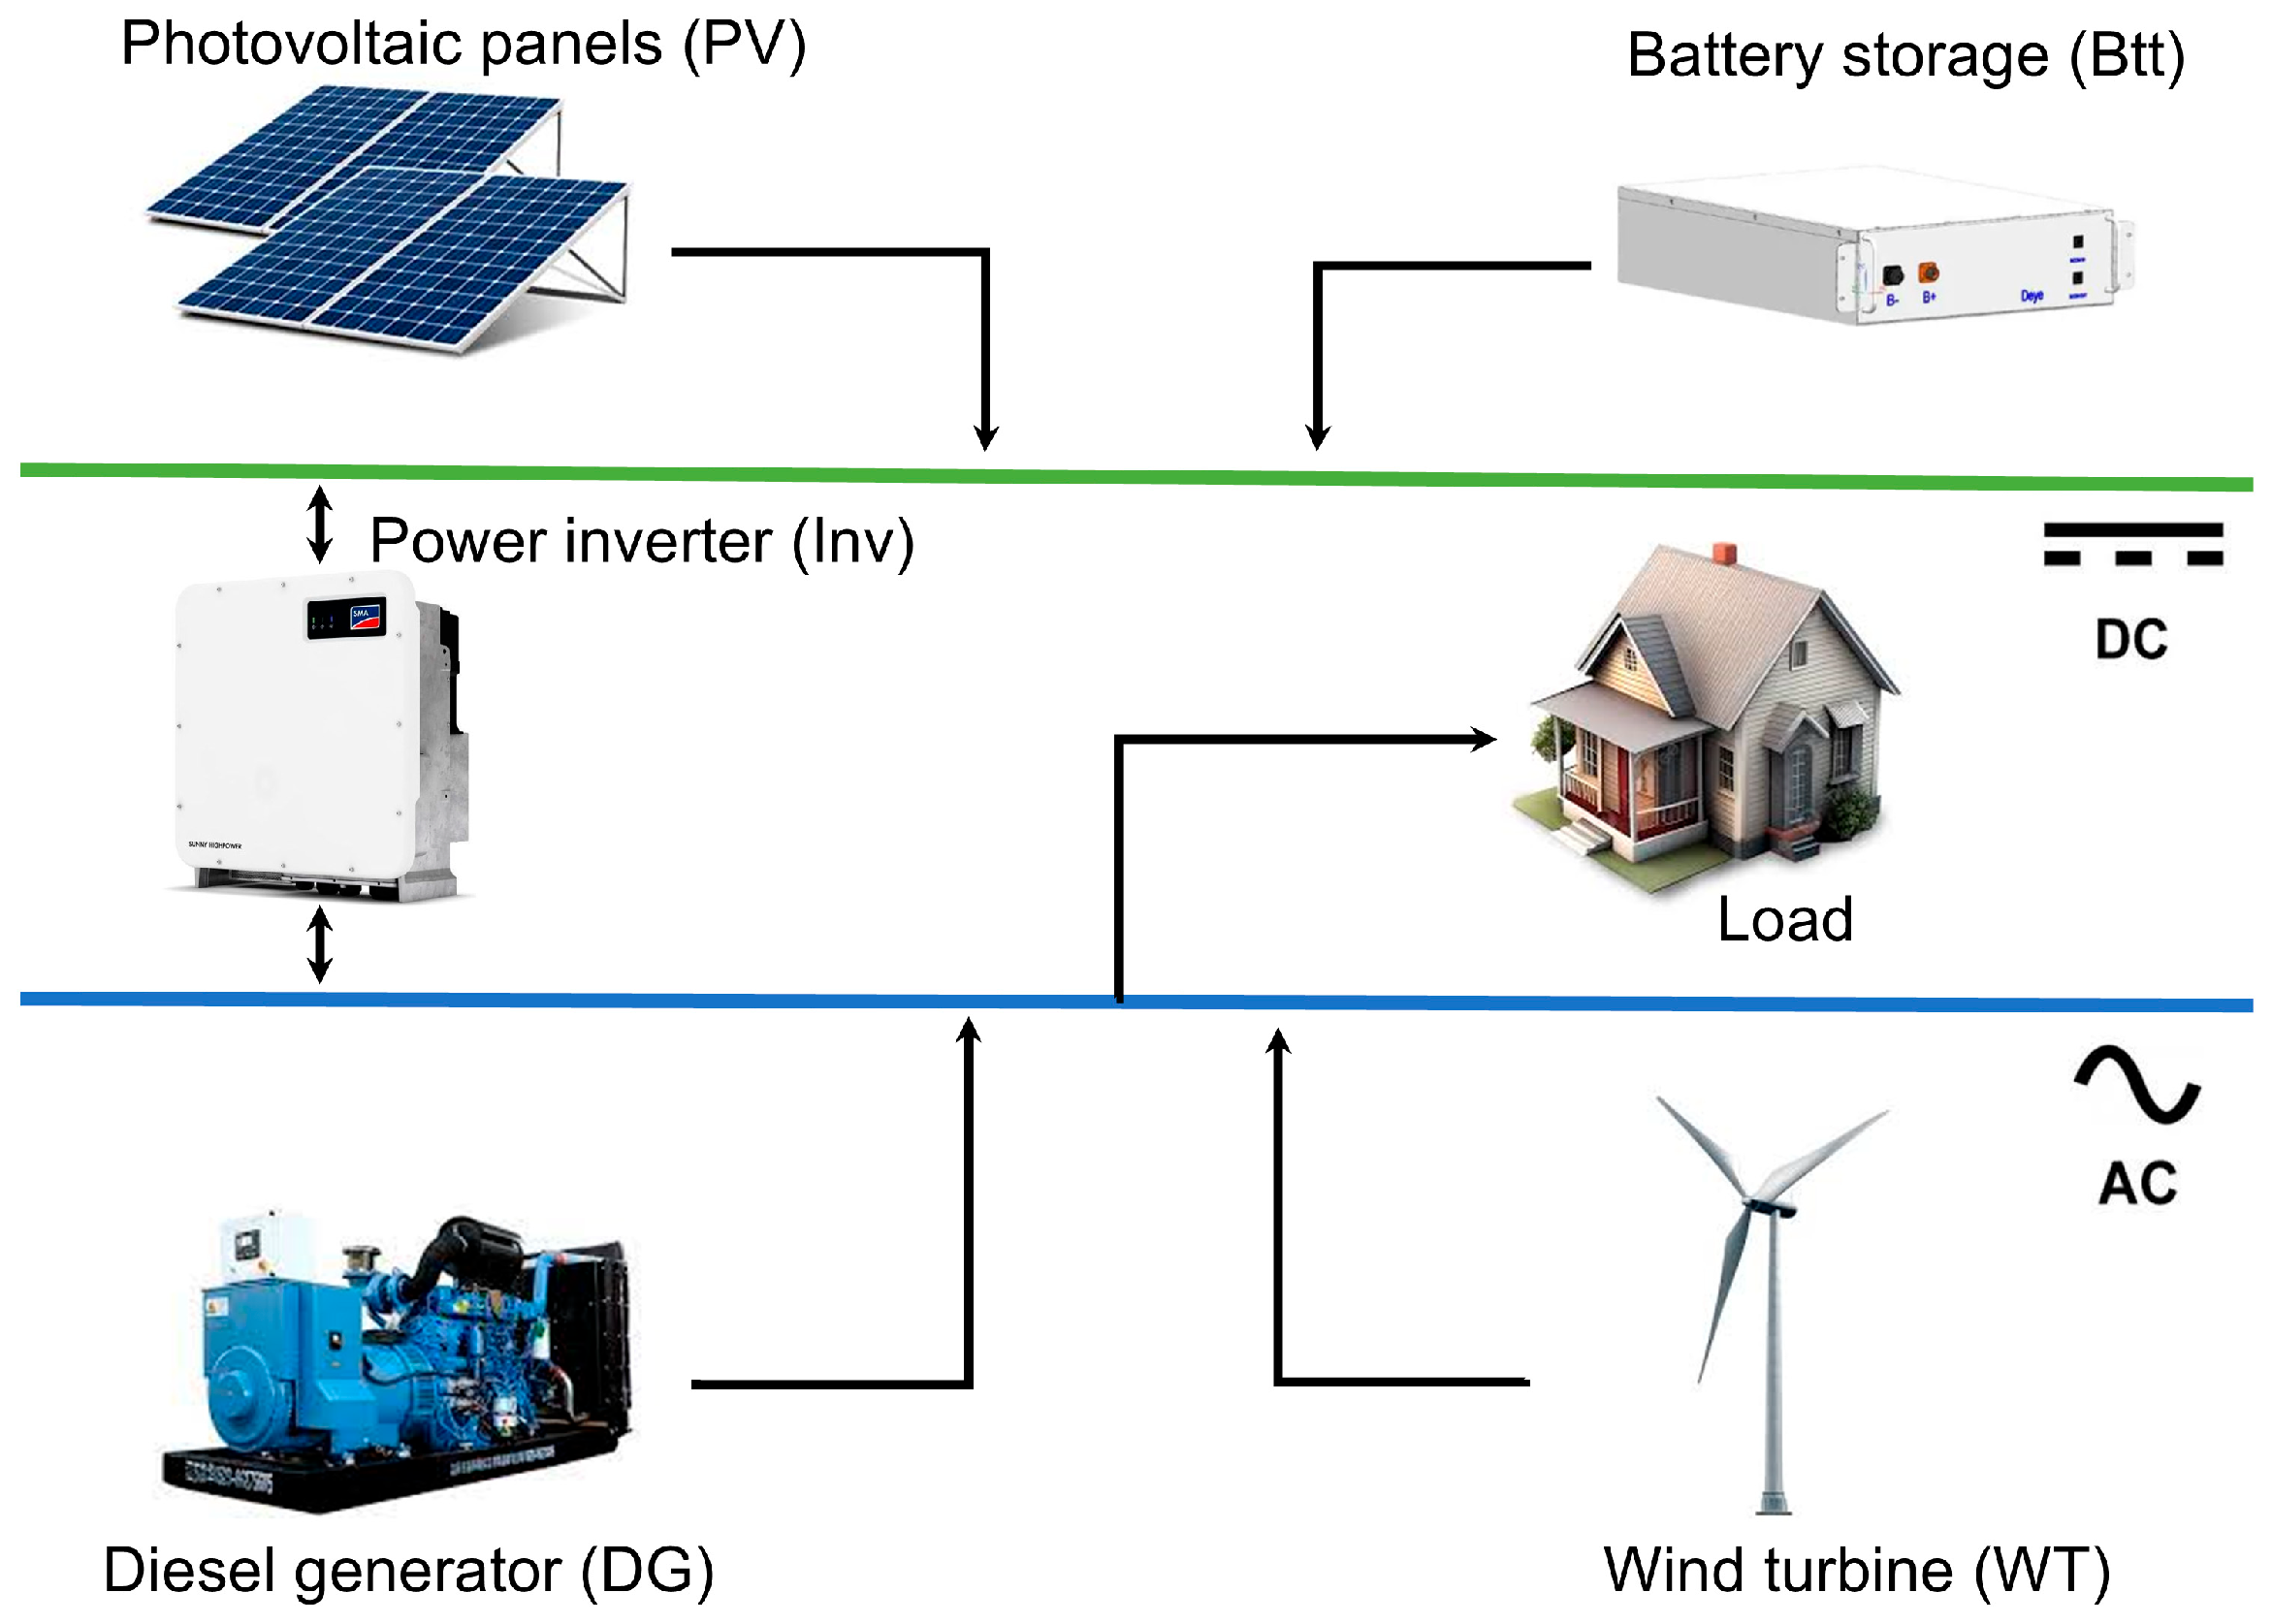
As depicted in
Figure 3, the HES consists of a combination of photovoltaic (PV) panels, wind turbine (WT), battery storage (Btt), a diesel generator (DG), and an inverter (Inv). The following subsections concisely present the mathematical models that describe the dynamics of each of these components, followed by the EMS responsible for coordinating the operation of the system components.
3.2.1. Mathematical Formulation of the Photovoltaic (PV) System
In this study, a simplified model was adopted to estimate the hourly power output of the photovoltaic panels, using only ambient temperature and solar irradiance as input variables, as shown in Equation (11) [
7].
with
representing the PV output power in (kWh),
is the rated PV power in kW,
refers to the predicted solar irradiance in kW/m
2,
denotes the solar irradiance under standard test conditions (STC) in kW/m
2,
denotes the cell surface temperature under STC in °C and
is the temperature coefficient associated with the maximum power output, with a value of −3.7 × 10
−3 (°C
−1) for both monocrystalline and polycrystalline silicon (Si) solar cells [
7].
The cell temperature
is given by Equation (12) [
67].
where
is the predicted ambient temperature in °C and
represents the nominal operating cell temperature of the panel in °C.
The total energy produced by a PV array is given by Equation (13) [
68], where
is the number of PV panels.
This study considers photovoltaic modules from the manufacturer Sunova, model SS-550-72-MDH [
69]. The technical specifications of the selected PV panel are presented in
Table 2.
3.2.2. Mathematical Formulation of the Wind Turbine (WT)
Since wind speed data is typically measured at heights different from the turbine hub height, this study applies the Power Law to extrapolate wind speed to the turbine’s hub height of the turbine, as presented in Equation (14) [
70].
where
represents the wind speed at the turbine hub height
at time t (m/s), and
is the wind speed at a reference height
of 50 m at time t (m/s). The exponent
, known as the Hellmann coefficient, accounts for wind shear and depends on terrain characteristics and atmospheric stability. The most commonly used value is 1/7 (approximately 0.143), particularly in areas with low surface roughness and good wind exposure [
71].
The hourly output power of each wind turbine
, in kWh, is determined by Equation (15) [
72].
where
, represents the rated power of the wind turbine (kW),
is the rated wind speed (m/s) at which the turbine reaches its maximum output,
is the cut-in wind speed (m/s), from which energy generation begins, and
is the cut-off wind speed (m/s), above which the turbine is shut down for safety reasons.
The total energy generated by a set of wind turbines can be expressed by Equation (16) [
68], where
is the number of WT.
The wind turbine selected for this study is the E20-HAWT model [
73], and its technical specifications are presented in
Table 3.
3.2.3. Mathematical Formulation of the Battery Storage (Btt)
The state of charge (SOC) of the battery is a critical parameter that directly influences system performance and indicates the available battery capacity. Within this framework, the SOC operates under two modes: charging and discharging. The battery enters charging mode when the energy generated by renewable sources exceeds the demand, while it enters discharging mode when the generated energy is insufficient to meet the load. The amount of energy charged and discharged at a given time t is determined by Equations (17) and (18), respectively [
27]:
where
and
are the battery charge levels at times
and
, respectively (kWh),
represents the hourly self-discharge rate,
is the hourly load demand (kWh),
refers to the energy generated from renewable sources (
) in kWh,
and
denote the battery charging and discharging efficiencies, respectively, while
represents the inverter efficiency.
Equation (19) defines the SOC limits [
7].
where
and
represent the minimum and maximum battery charge levels, respectively. The maximum charge level is defined based on the battery’s rated capacity
while the minimum charge level is assumed to be 10% of the maximum state. The battery adopted in this study is a Lithium Iron Phosphate (LiFePO
4) type [
74], known for its safety, long lifespan, and thermal stability. This battery technology is widely used in residential energy systems and electric vehicles [
75]. Technical specifications are provided in
Table 4.
3.2.4. Mathematical Formulation of the Diesel Generator (DG)
For the DG, a generator with a maximum power output of 150 kW is considered capable of fully meeting the load demand. It operates as a backup source to cover energy deficits not met by solar, wind, or battery sources. The fuel consumption of the diesel generator
in L/h can be calculated using Equation (20) [
76].
where
represents the actual power generated (kW),
is the rated power of the generator (kW), and
and
are the coefficients of the diesel generator’s fuel consumption curve, with values of 0.246 L/kWh and 0.08145 L/kWh, respectively [
27,
76].
3.2.5. Mathematical Formulation of the Inverter (Inv)
The number of inverters required for the HES is determined using Equation (21) [
77].
where
represents the maximum power generated by the components connected to the inverter, expressed in kW, and
corresponds to the rated capacity of the inverter (kW). The inverter parameters include a maximum efficiency of 90% and a rated power of 300 kW [
78].
3.3. Energy Management Strategy (EMS)
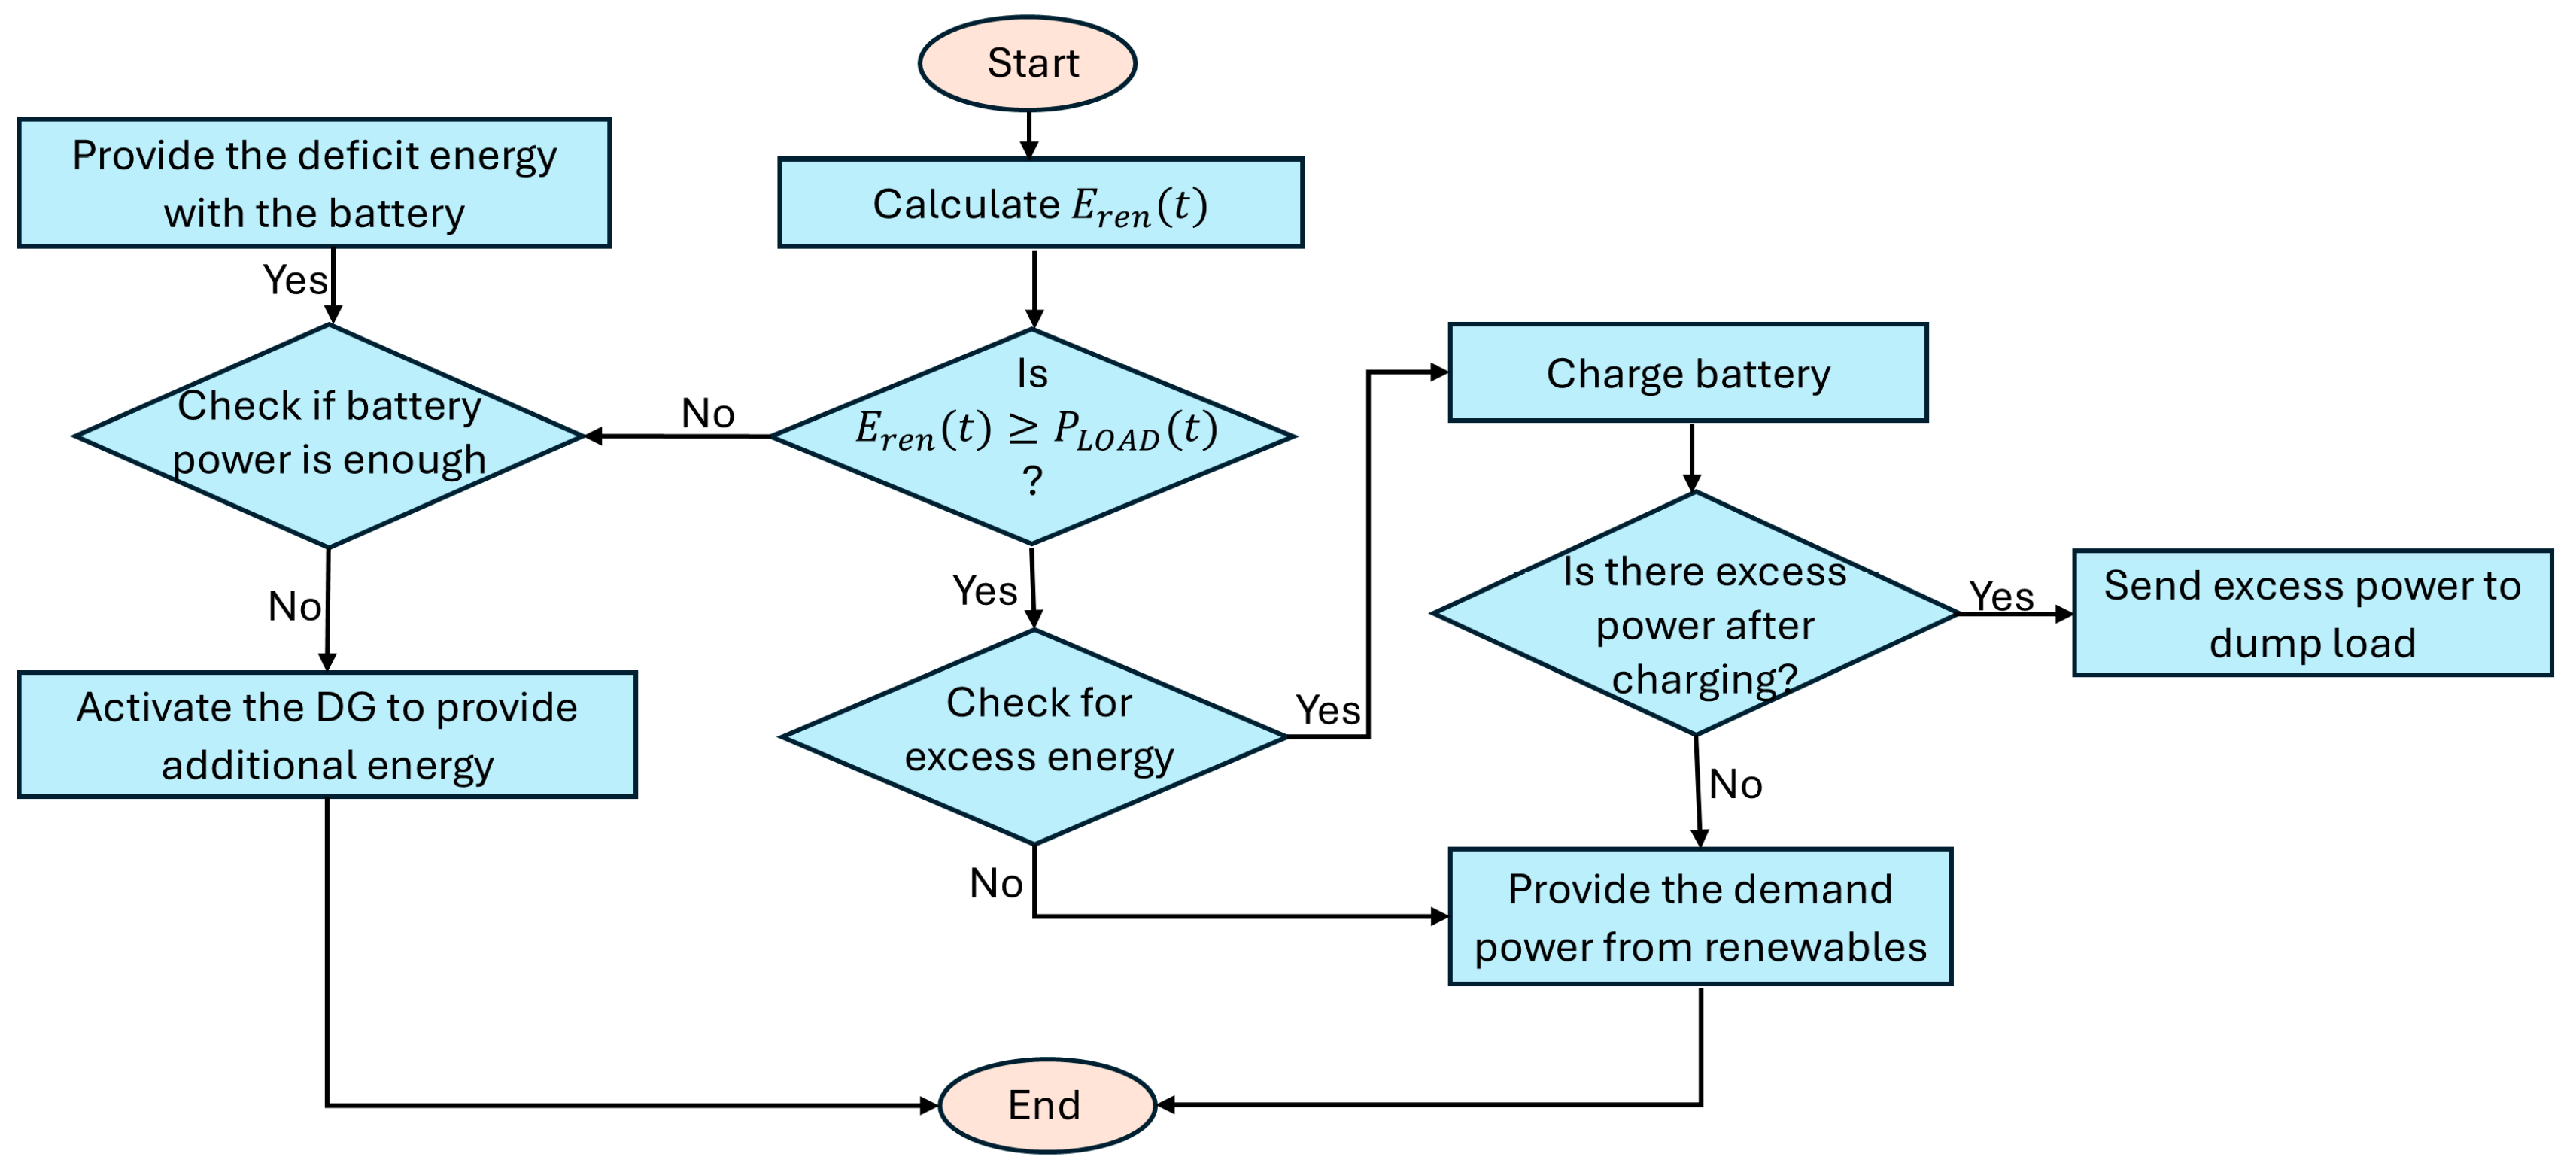
The EMS adopted in this study, as shown in
Figure 4, aims to efficiently coordinate the operation of the hybrid system components, prioritizing the use of renewable sources to meet the load demand while reducing dependence on the diesel generator. When renewable generation (solar and wind) is sufficient, the energy is consumed directly to satisfy the demand, and excess energy is stored in the batteries. If the batteries are fully charged, the excess energy is directed to a dump load. When renewable generation is inadequate to meet the load, the batteries supply the stored energy, and if a deficit still remains, the diesel generator is activated. This strategy ensures continuous power supply, maximizes the utilization of available resources, and contributes to reducing operational costs and emissions.
3.4. Assumptions, Limitations, and Uncertainties
3.4.1. Assumptions
Fixed costs: The values associated with the initial investment, system operation and maintenance, DG fuel price, as well as interest and inflation rates, are assumed to remain constant throughout the analysis period.
Constant load profile: A daily constant load profile is assumed across the entire simulation horizon, disregarding seasonal or behavioral variations in energy demand.
3.4.2. Limitations
Lack of sensitivity analysis: No sensitivity analysis was conducted to assess the impact of variations in system design and operational parameters.
Scalability constraints: The optimization framework was adapted to the specific characteristics of the selected case study location and may require methodological or parametric adjustments for application in other regions or in systems of substantially different scales.
Restricted comparison of forecasting models: The forecasting stage was compared only to the conventional LSTM model, an intentional choice to highlight the incremental contribution of integrating the Discrete Wavelet Transform (DWT) into LSTM.
Lack of dedicated seasonal analysis: Despite the use of ten years of hourly data, which implicitly capture seasonal and interannual variability, no specific analysis was carried out to evaluate system performance under different seasonal conditions.
Simplified load profile: The load profile was modeled as variable over 24 h but kept constant throughout the year, not adequately reflecting seasonal variations in demand.
Unmodeled component degradation: The natural degradation of equipment over time was not explicitly considered, which may compromise the accuracy of long-term performance and cost estimates, although replacement times for critical components such as batteries and the inverter were included in the economic analysis.
The last two assumptions were adopted to keep the model transparent and focused on the proposed forecasting and optimization methodology, avoiding additional complexity related to demand-side uncertainties and long-term degradation modeling.
3.4.3. Uncertainties
Exchange rate variability: Currency fluctuations pose a significant uncertainty, especially since many system components and materials may be tied to international markets.
Unforeseen events: The model does not account for unexpected events, such as critical equipment failures or changes in regulatory policies, which could compromise system operation or economic feasibility.
Forecasting and optimization models: The choice of forecasting and optimization models, along with the estimation of their parameters, may introduce uncertainties affecting the predictive performance and accuracy of the results.
3.5. Hes Optimization Problem
3.5.1. Objective Function and Decision Variables
In this study, the CT is defined as the objective function to be minimized, as indicated in Equation (22). To achieve this, three decision variables—the number of photovoltaic panels (
), wind turbines (
), and batteries (
)—must be optimized.
The optimization is subject to predefined lower and upper bounds for each decision variable, aiming to ensure technical feasibility and computational efficiency, as described in Equation (23).
where
represents the quantity of system component type
, and
and
are the minimum and maximum allowed values, respectively, as defined in
Table 5.
3.5.2. Cost Functions
The CT is the objective function of this study and comprises the sum of the following components: Annual capital
, annual operation and maintenance cost
, and annual fuel cost (
) consumed by the DG, as expressed in Equation (24) [
79].
The capital cost annualizes the initial investment, which includes the acquisition, transportation, and installation of system components, through the capital recovery factor (CRF), calculated using Equations (25) and (26) [
36].
where
is the real annual interest rate;
is the project lifetime, assumed as 20 years;
is the nominal interest rate (11.75%) [
80];
is the annual inflation rate (4.51%) [
81]. The PV, WT, and DG systems are assumed to last for the entire project duration. However, batteries, with a 16-year lifespan, are replaced once over the study horizon. The present cost of batteries (
) is calculated using the present value factor for a single payment, as shown in Equation (27) [
82].
where
represents the cost of the battery (
$/kWh) and
is the initial cost of the battery (
$/kWh).
Similarly, the inverter, assumed to have a 10-year lifespan, is also replaced once as per Equation (28):
where
represents the cost of the inverter (
$/kW) and
is the initial cost of the inverter (
$/kW).
The total annual capital cost of the HES is then calculated using Equation (29):
where
,
, and
are the unit costs (
$/kW) of PV, WT, and DG, respectively;
,
,
,
,
are the rated power or capacity (kW or kWh) of PV, WT, DG, inverter, and battery, respectively.
The
of the HES is calculated using Equation (30):
where
and
are the O&M costs per kW/year for PV and WT;
is the O&M cost per battery unit per year;
is the O&M cost per kWh for DG and
is output power of DG at hour t. The inverter’s O&M cost is excluded as per Maleki and Pourfayaz [
82] and Yimen et al. [
68].
The
for the diesel generator is calculated using Equation (31) [
7].
where
is the cost of diesel fuel per liter and
is the fuel consumption at time t.
The COE generated by the system is a key indicator for evaluating the project’s economic viability. It is calculated using Equation (32) [
78].
where
is the yearly demand energy (kWh/year).
Table 6 provides the costs related to the components of the HES.
3.6. Optimization Methods
The optimal sizing of an HES is a complex problem that requires robust algorithms to ensure reliable results. In this context, metaheuristic algorithms such as PSO and GA stand out as some of the most widely used approaches for HES optimization [
7]. This section presents the operation of these techniques.
3.6.1. Particle Swarm Optimization (PSO)
The PSO algorithm begins with a group of particles randomly positioned within the search space, seeking the optimal value by updating two best-known positions in each iteration. The first is the
, which represents the best value reached so far by each individual particle, and the second is the best value found by the entire population, known as the global best or
[
23]. With these two values determined, each particle updates its velocity and position using Equations (33) and (34) [
87].
where
is the velocity of particle
at iteration
,
is the velocity at iteration
,
is the inertia weight,
and
are the cognitive and social acceleration coefficients, respectively,
and
are random numbers between 0 and 1,
is the position of particle
at iteration
,
is the best previous position of particle
at iteration
and
is the best global position found by the swarm at iteration
.
The implementation of the PSO algorithm follows a sequence of systematic steps. Initially, the algorithm’s parameters are defined, such as swarm size, inertia weight, and cognitive and social acceleration coefficients. Next, the particles are randomly initialized with positions and velocities within the defined search space. Each particle has its fitness value evaluated using the objective function, which represents the CT of the hybrid system. Based on these values, each particle updates its personal best position () and the swarm’s global best position (). Using this information, the velocity and position vectors of each particle are recalculated according to the model equations. This process is repeated iteratively until the stopping criterion is met, which may be the maximum number of iterations or convergence of the solution. Finally, the algorithm returns the best solution found for the optimization problem.
3.6.2. Genetic Algorithm (GA)
This algorithm is a metaheuristic technique inspired by the theory of natural evolution, utilizing the principles of selection, crossover, and mutation to find optimal or near-optimal solutions for complex optimization problems [
88]. In the GA, an initial population is randomly generated, and individuals evolve over generations to search for solutions that minimize the objective function. The evolution process is driven by genetic operators that simulate biological mechanisms: the selection of the fittest individuals, the exchange of genetic material (crossover), and the introduction of variability through mutation.
Implementation of the GA involves a sequence of steps designed to iteratively improve candidate solutions. Initially, the algorithm’s control parameters are configured, including population size, crossover rate, mutation rate, and the maximum number of generations. The process begins with the random generation of an initial population within the defined search space. Each individual is then evaluated using the objective function—in this case, the CT to be minimized. Based on fitness values, the best-performing individuals are selected to pass their genetic material to the next generation. The crossover operator is applied to these selected individuals to produce offspring, followed by a mutation step where small random changes are introduced to preserve genetic diversity and avoid premature convergence. The current population is then replaced by the new generation. After each cycle, the algorithm checks whether the stopping criterion has been met, which may be the maximum number of iterations or convergence of the solution. Finally, the algorithm returns the best solution found for the optimization problem.
Table 7 presents the parameters employed in the proposed optimization techniques. The selection of these parameters was based on an empirical tuning approach.
4. Results and Discussion
4.1. Meteorological Data
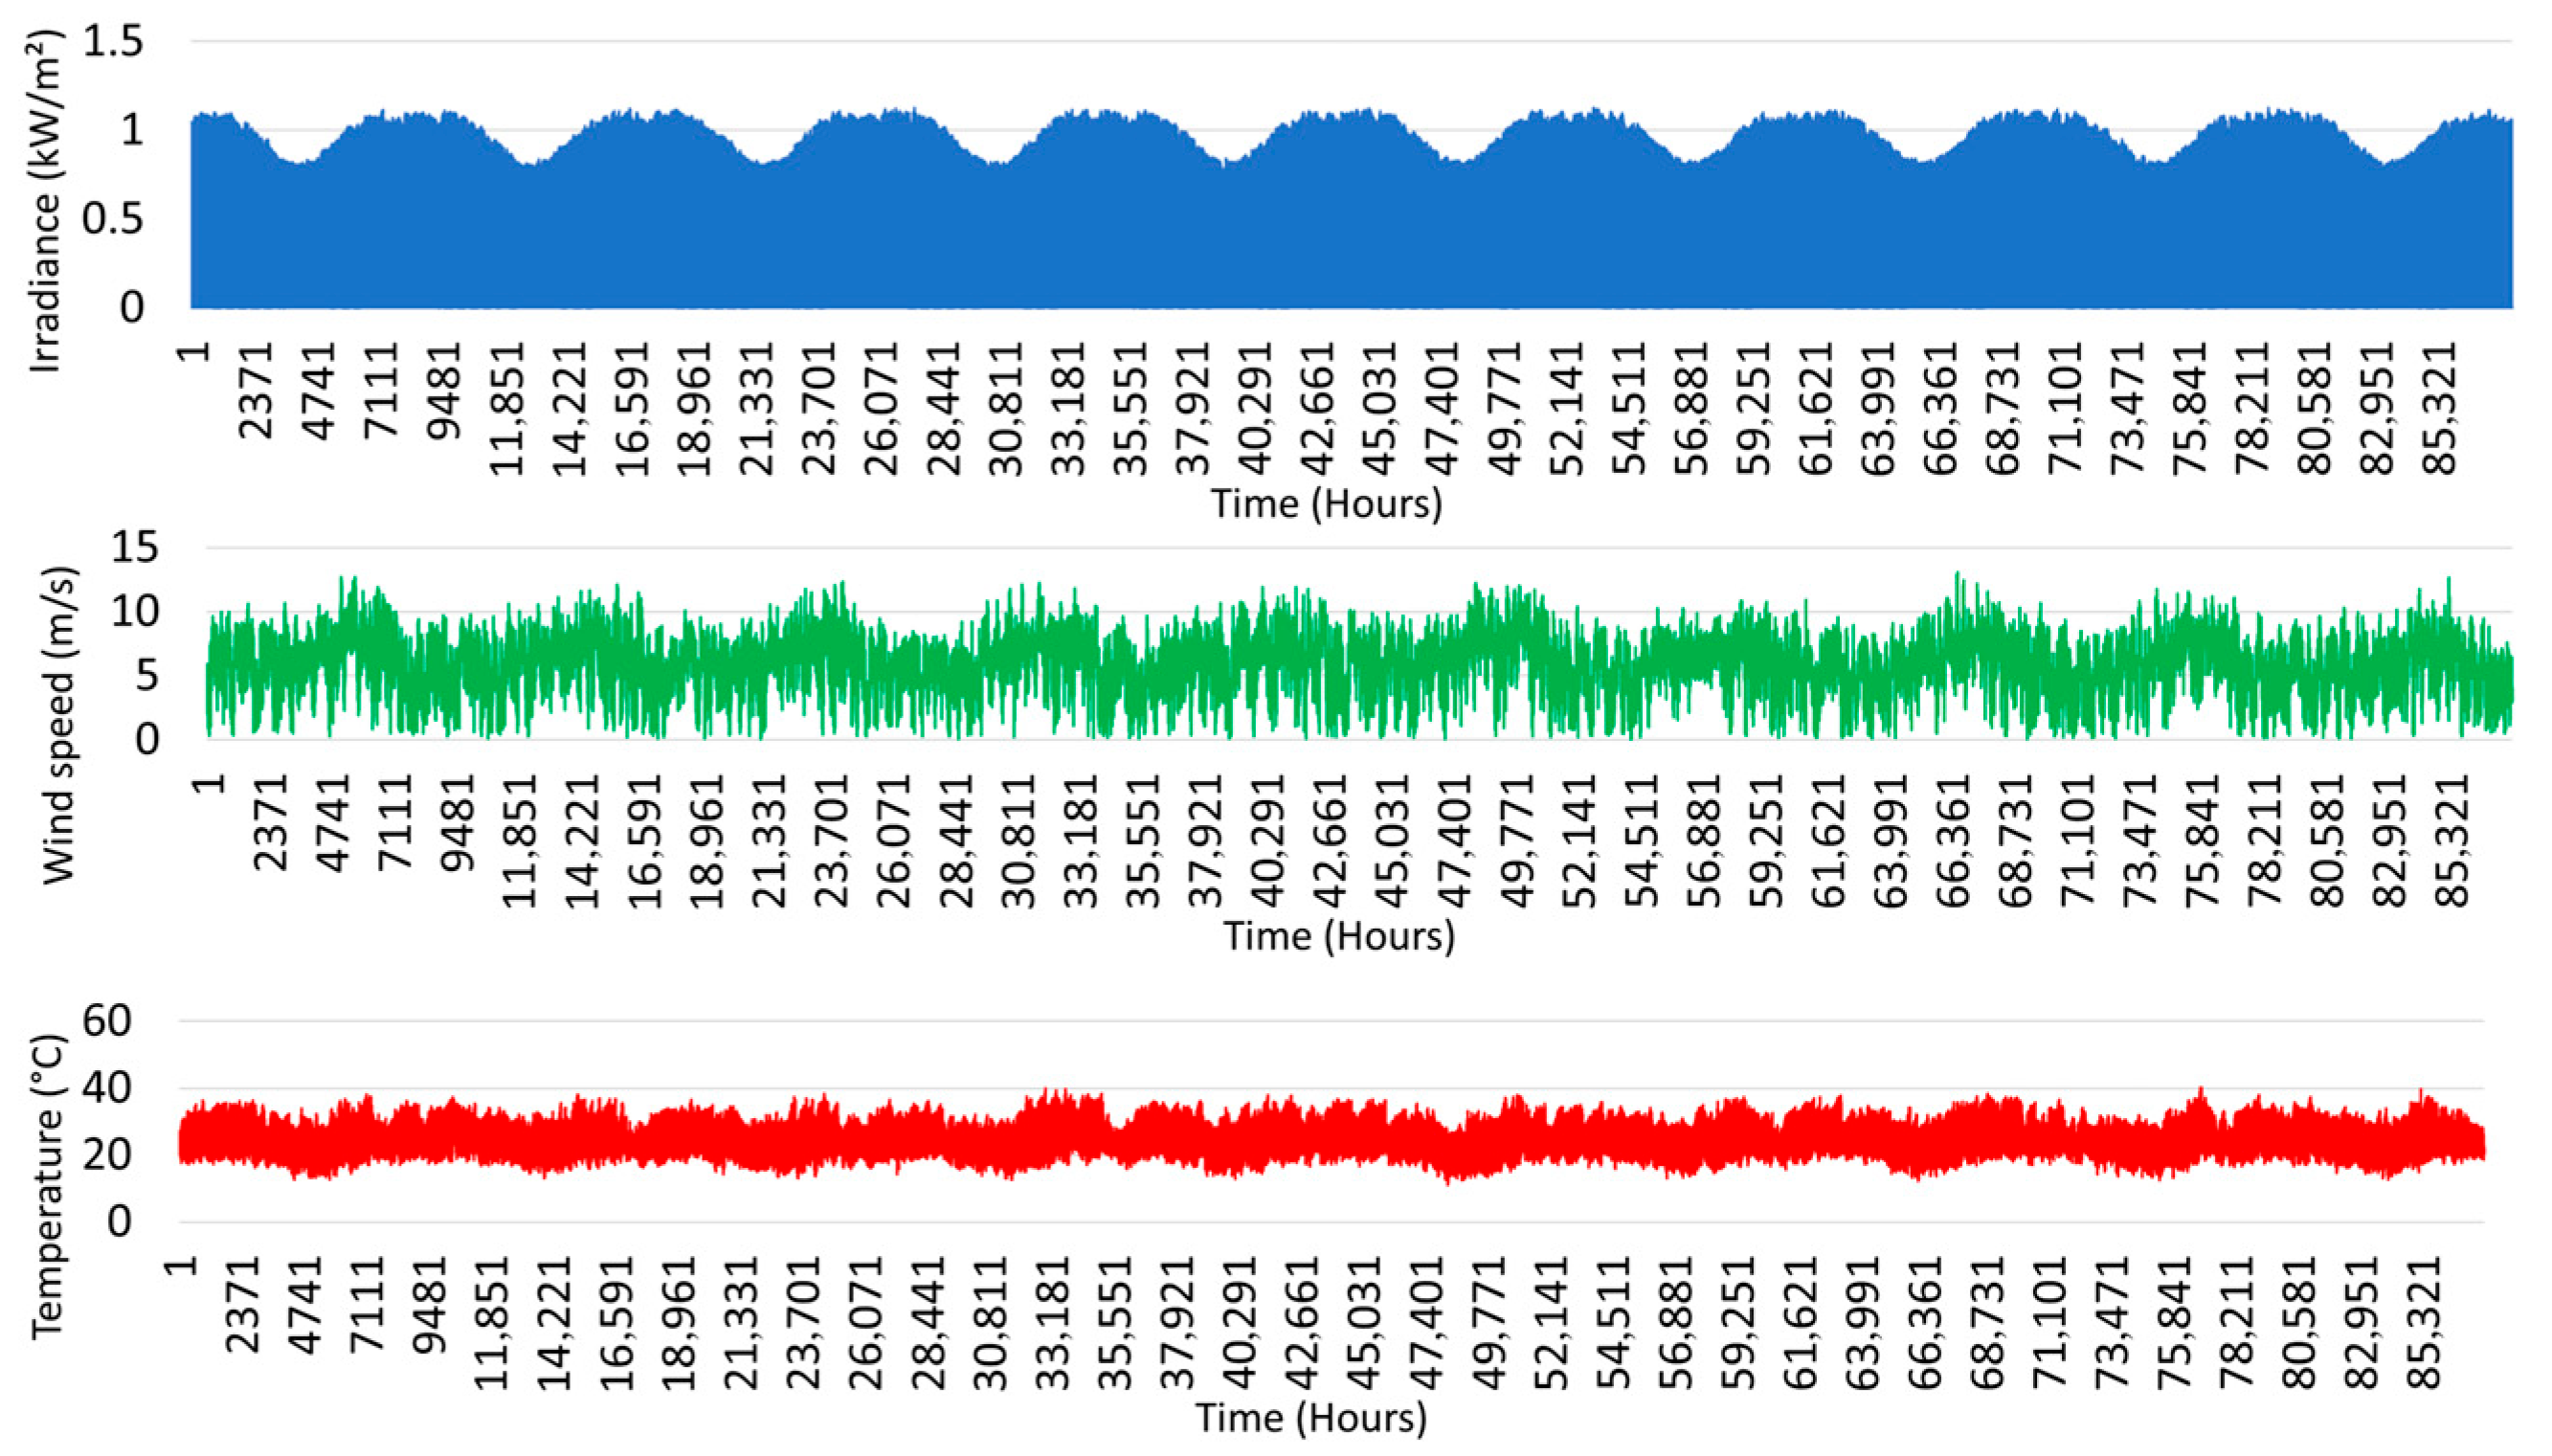
The average annual values recorded in Guanambi were 7.14 kWh/m
2/day for solar irradiance, 5.91 m/s for wind speed, and 26.17 °C for temperature, highlighting the region’s potential for solar and wind energy generation.
Figure 5 shows the variation in these parameters over the analyzed decade, emphasizing seasonal trends and fluctuations due to local climatic factors.
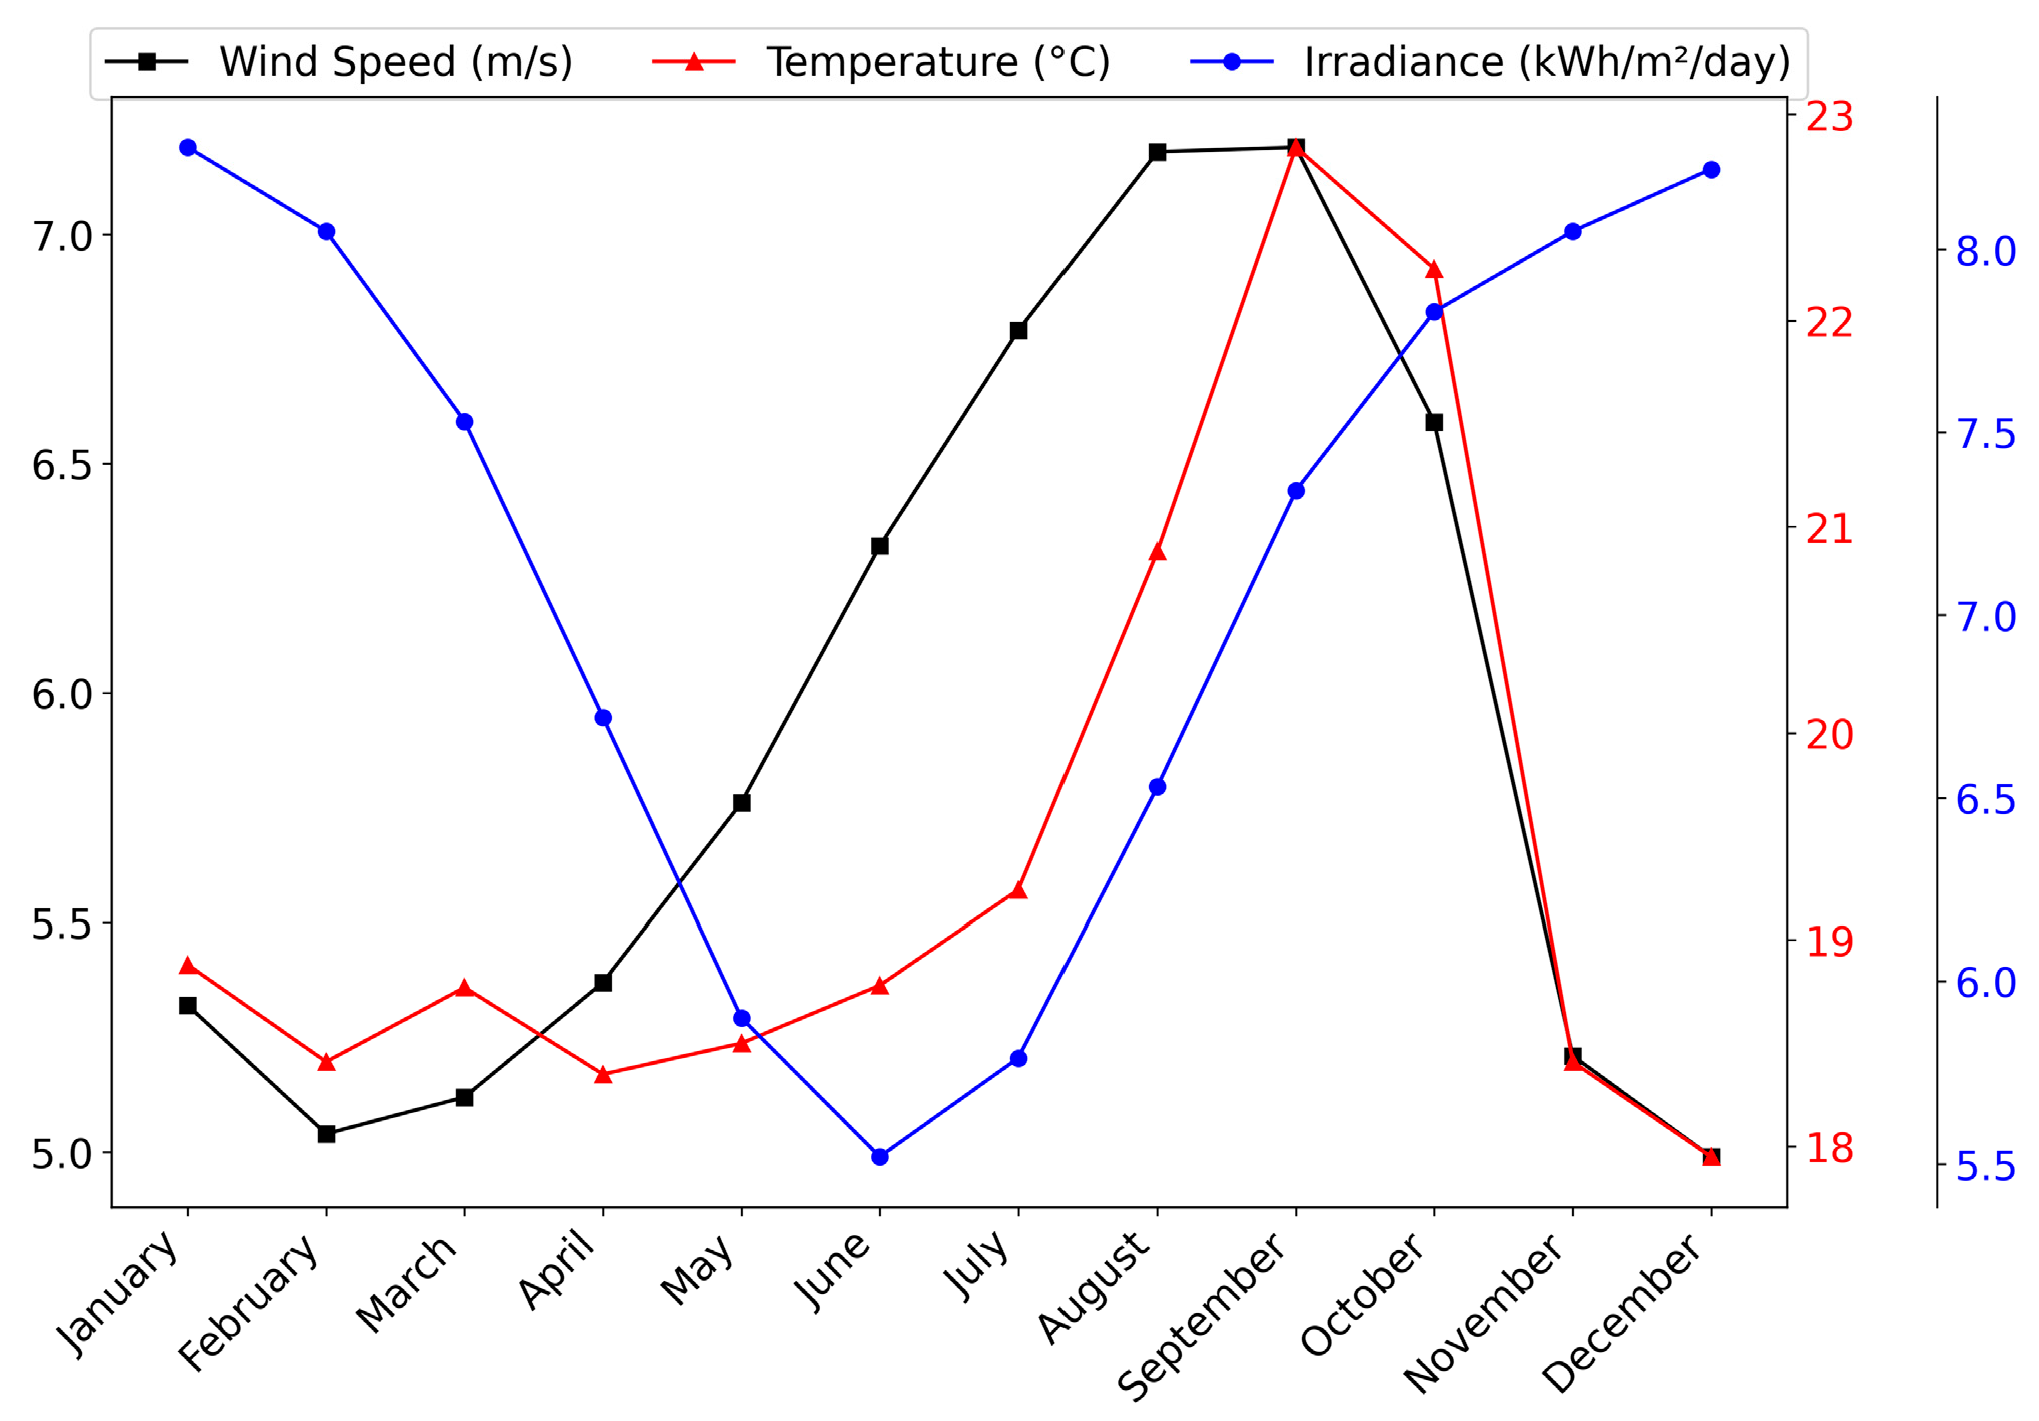
To provide a deeper analysis,
Figure 6 presents the monthly averages of the variables studied over the ten-year period. It can be observed that solar irradiance, represented by blue circles, is highest from December to February, making these months the most favorable for solar energy generation.
Conversely, from May to July, solar irradiance is lower, indicating reduced solar efficiency during this darker period of the year. Wind speed, shown as black squares, suggests that July to September are the most suitable months for wind energy generation, corresponding to the windiest season, while the period from October to April shows less favorable conditions due to lower wind speeds, marking the calmer season. Temperature, represented by red triangles, gradually increases from May, peaks in September, and then decreases toward the end of the year. The complementarity between solar irradiance and wind speed strengthens the system’s viability, enabling efficient and uninterrupted use of renewable sources year-round. However, the seasonal variability underscores the importance of optimized system sizing and the potential integration of batteries or auxiliary generators to mitigate fluctuations during periods of lower energy generation, ensuring a stable and reliable energy supply.
4.2. Load Profile
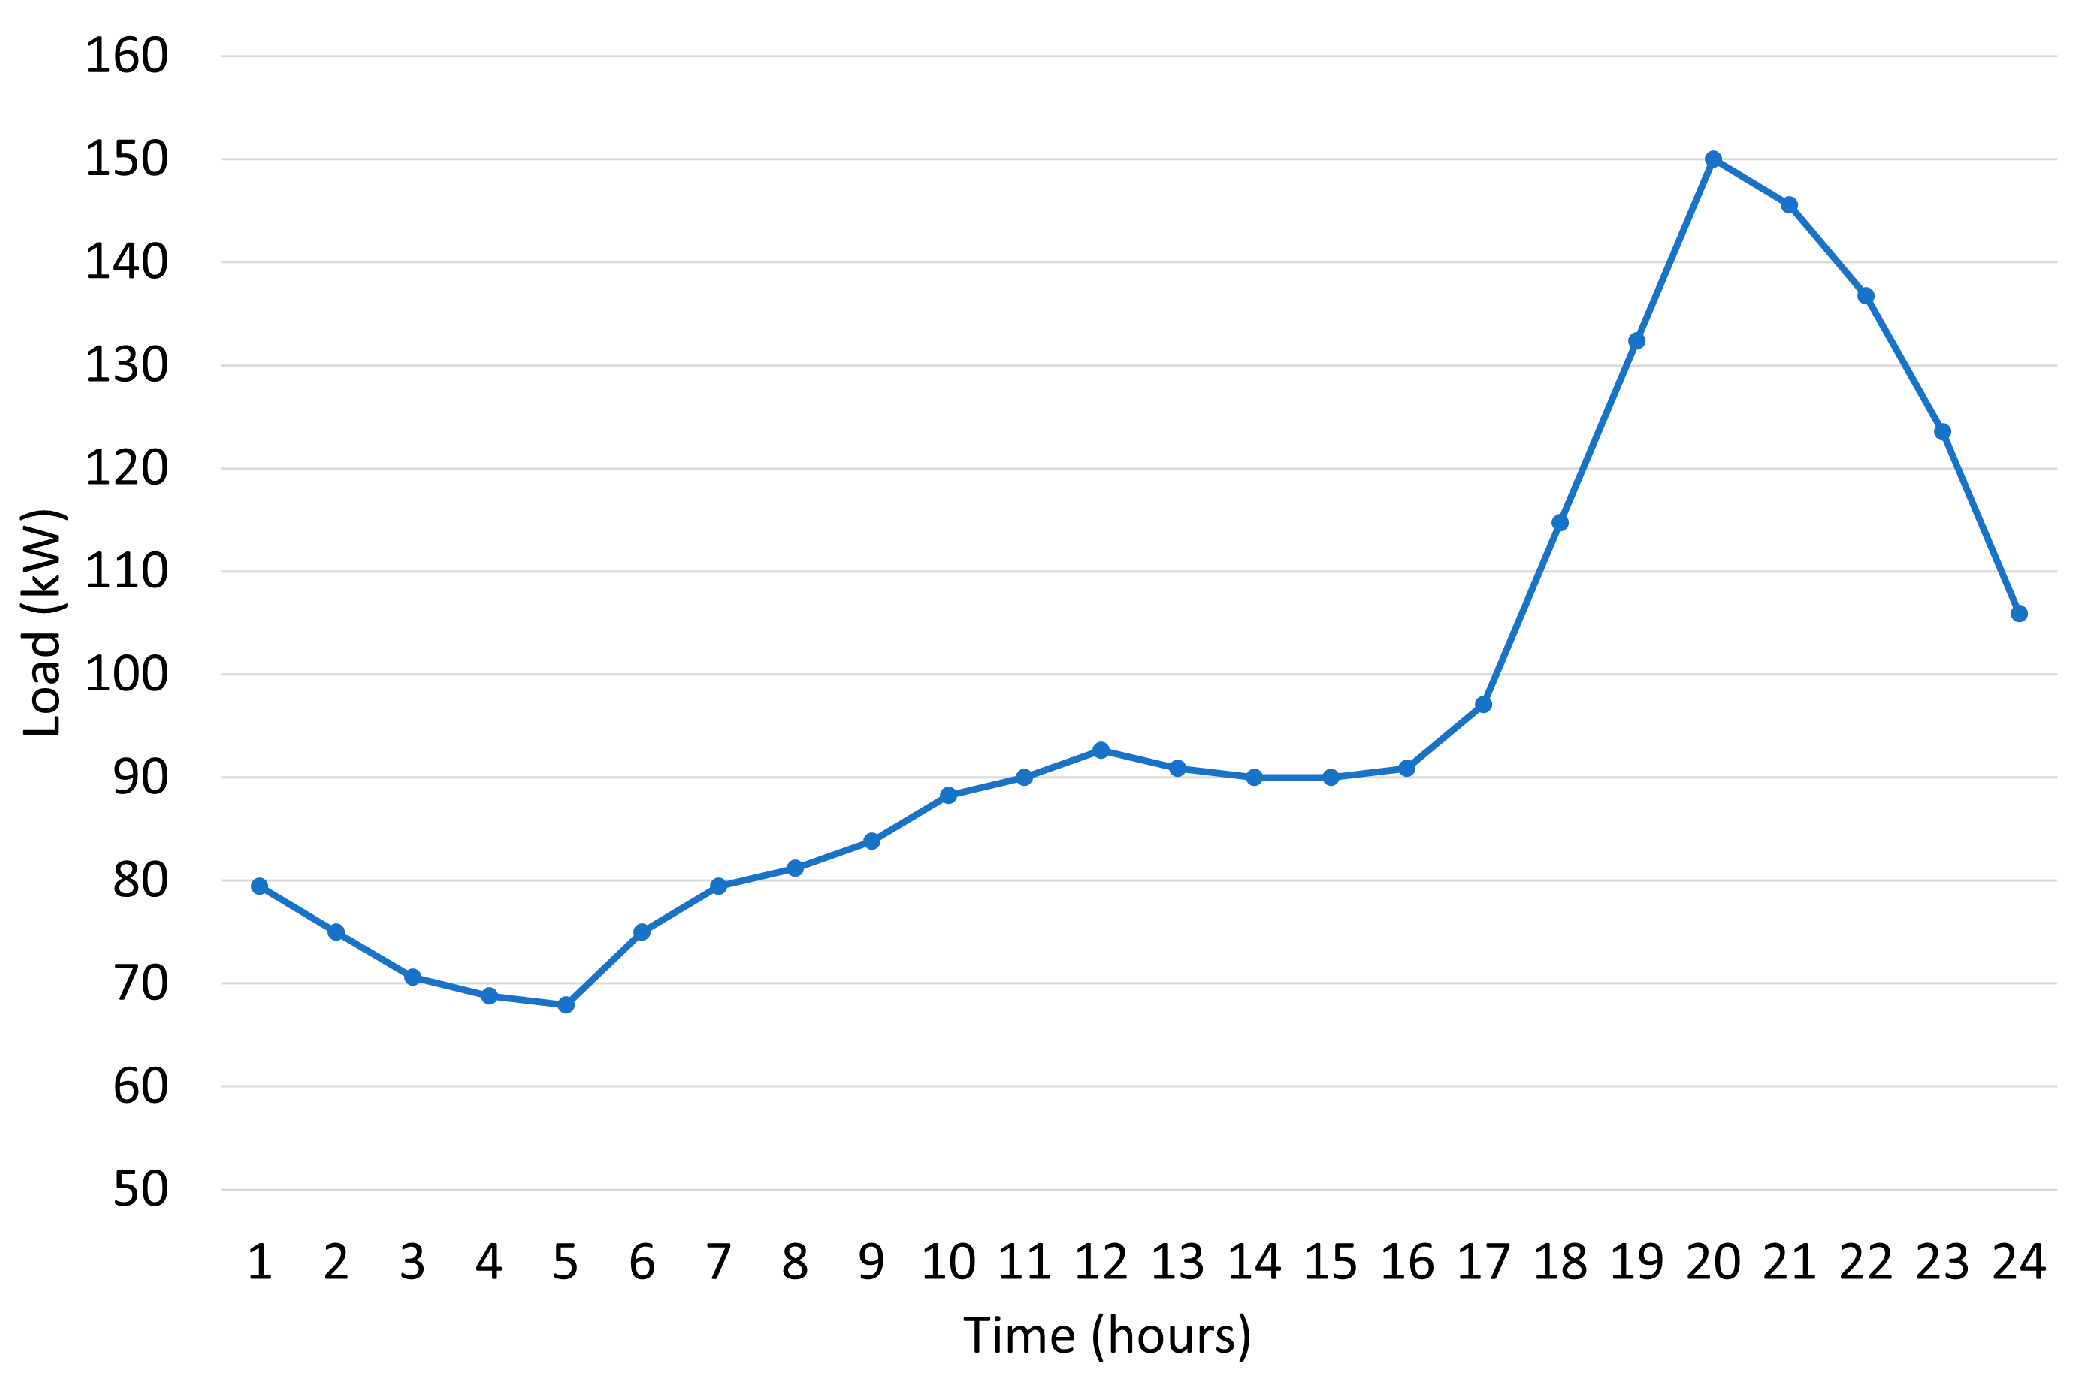
Load demand variability is one of the main challenges in the optimal sizing of HESs, as it is influenced by climatic conditions, consumption patterns, and the introduction of new technologies. Due to the unavailability of real hourly data for the study area, a typical daily load profile was adopted [
89], which was converted into a synthetic series of 8760 h, representing the consumption of 30 residential units. The simulated average annual load was 96.65 kW, with a peak demand of 150 kW.
Figure 7 shows the estimated load curve for a typical day.
4.3. Results of Meteorological Variable Forecasting
4.3.1. Data Decomposition Using DWT
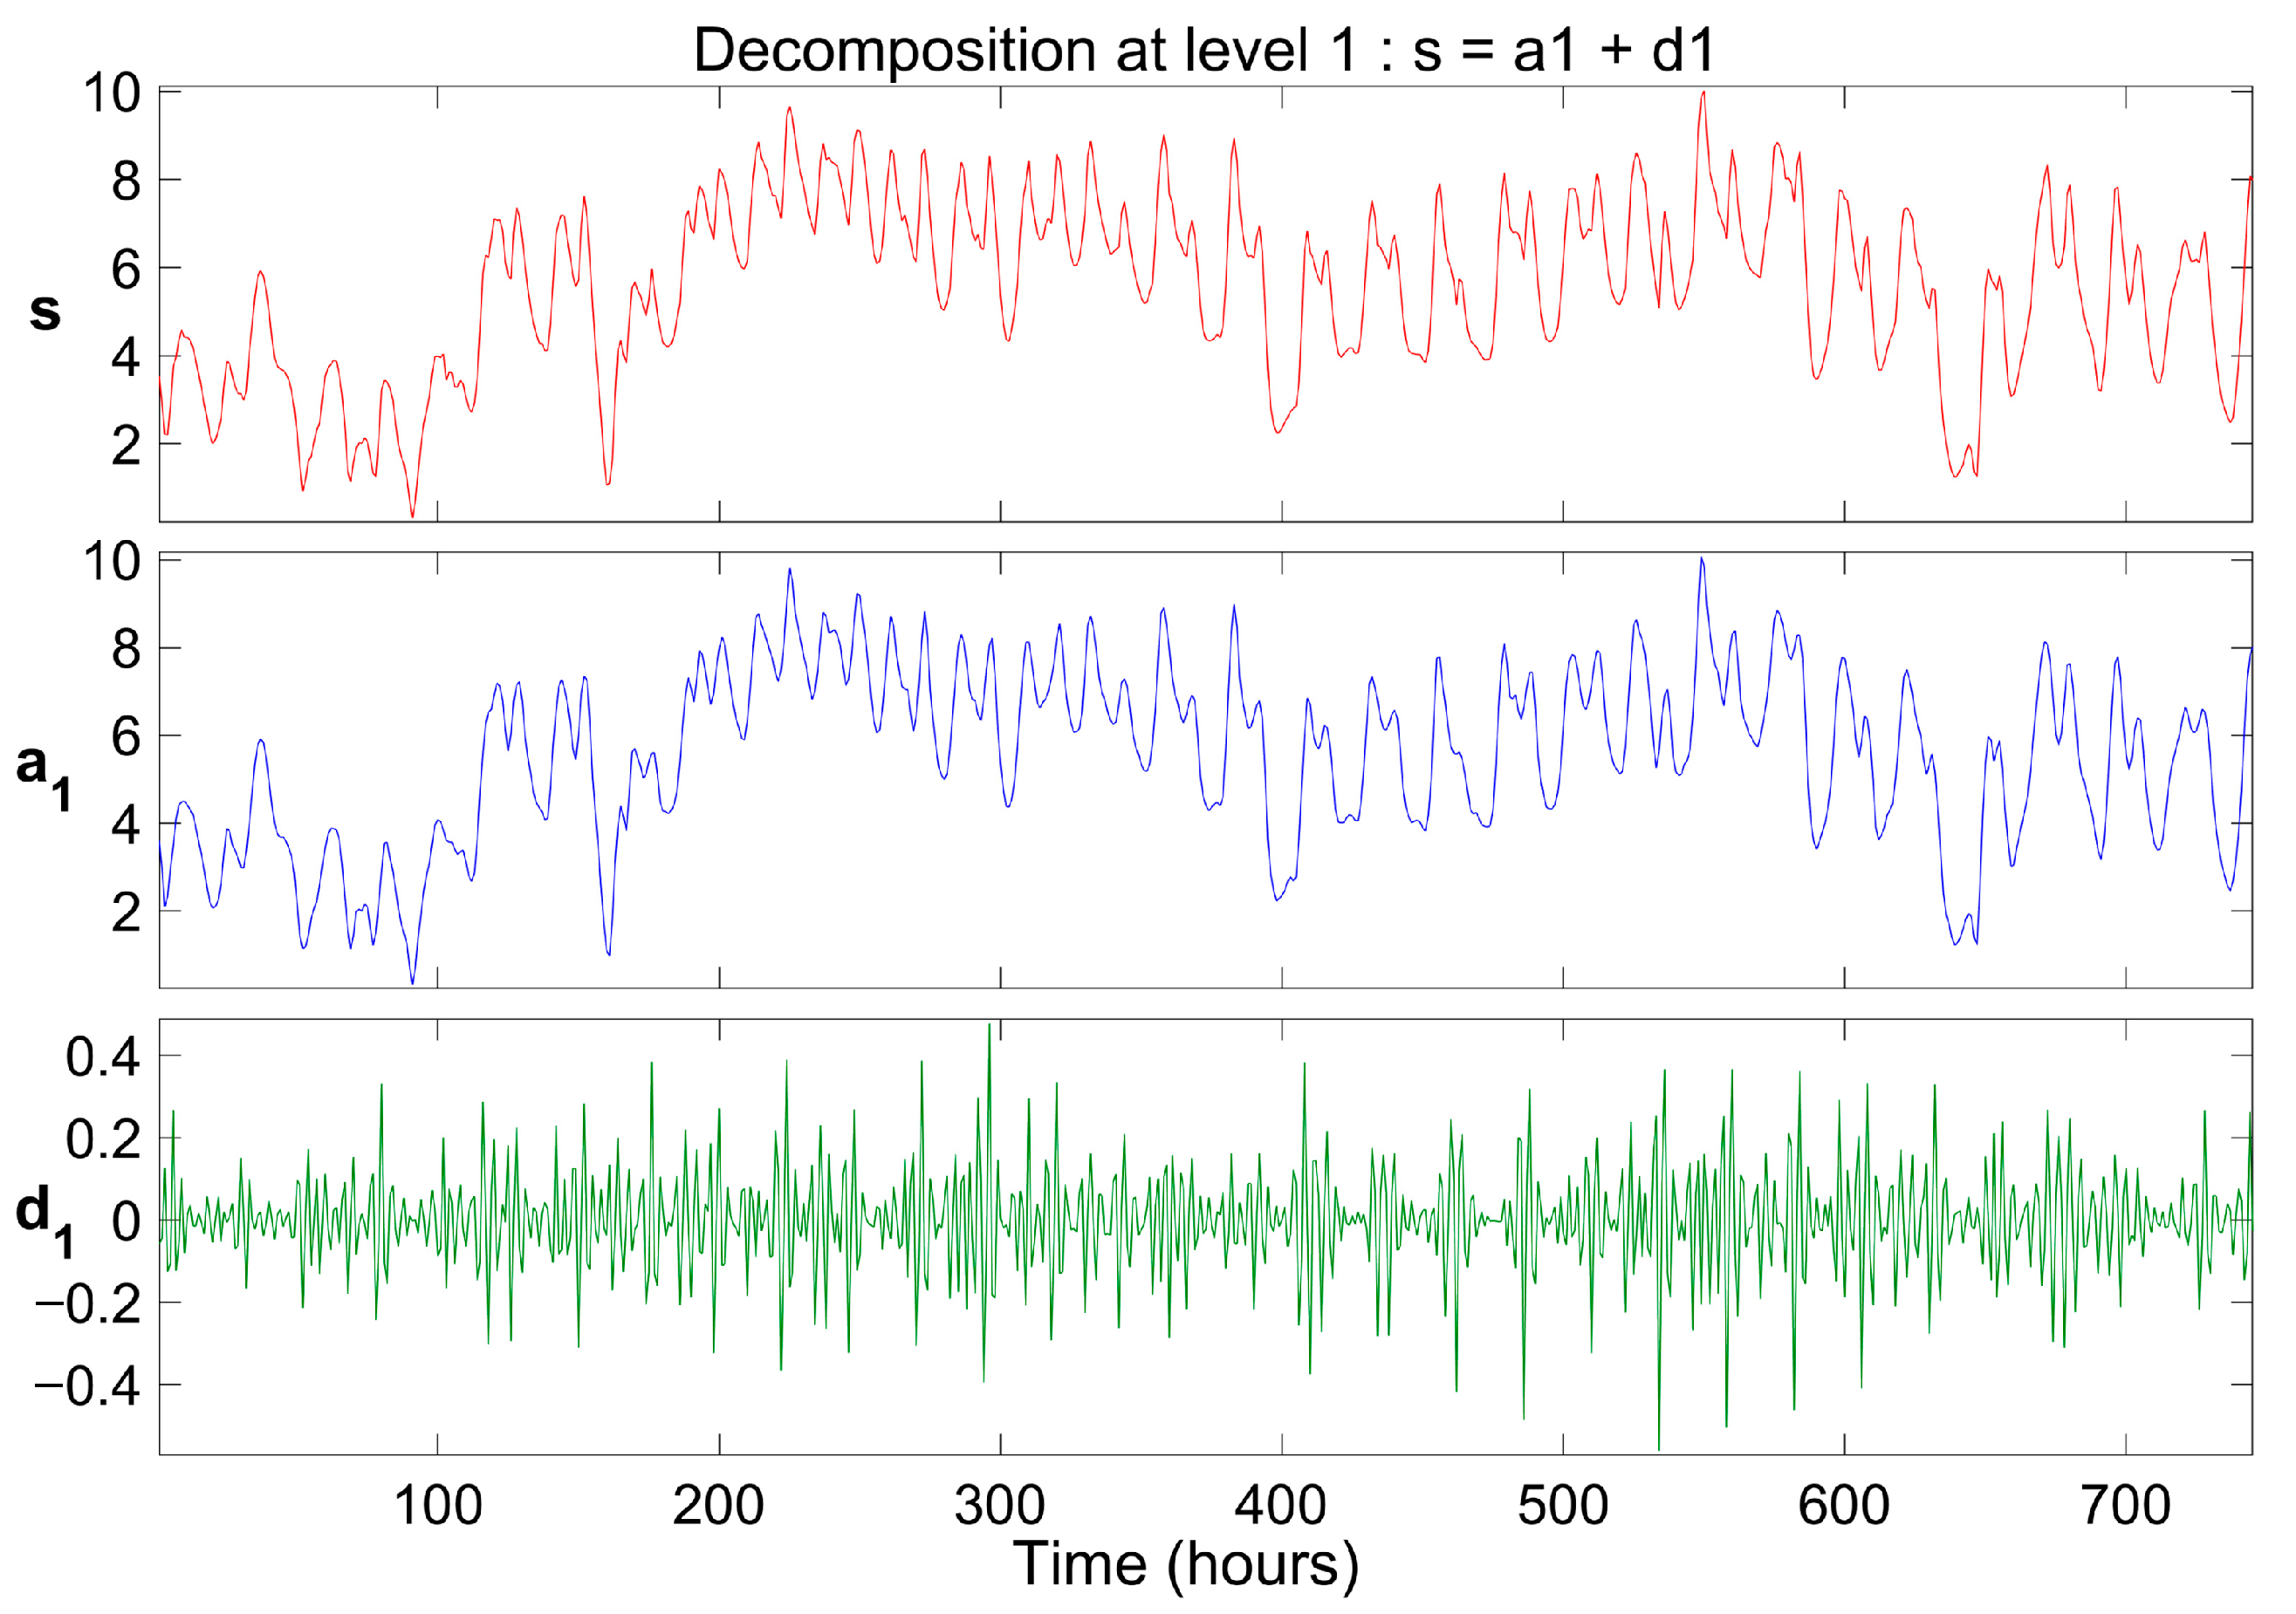
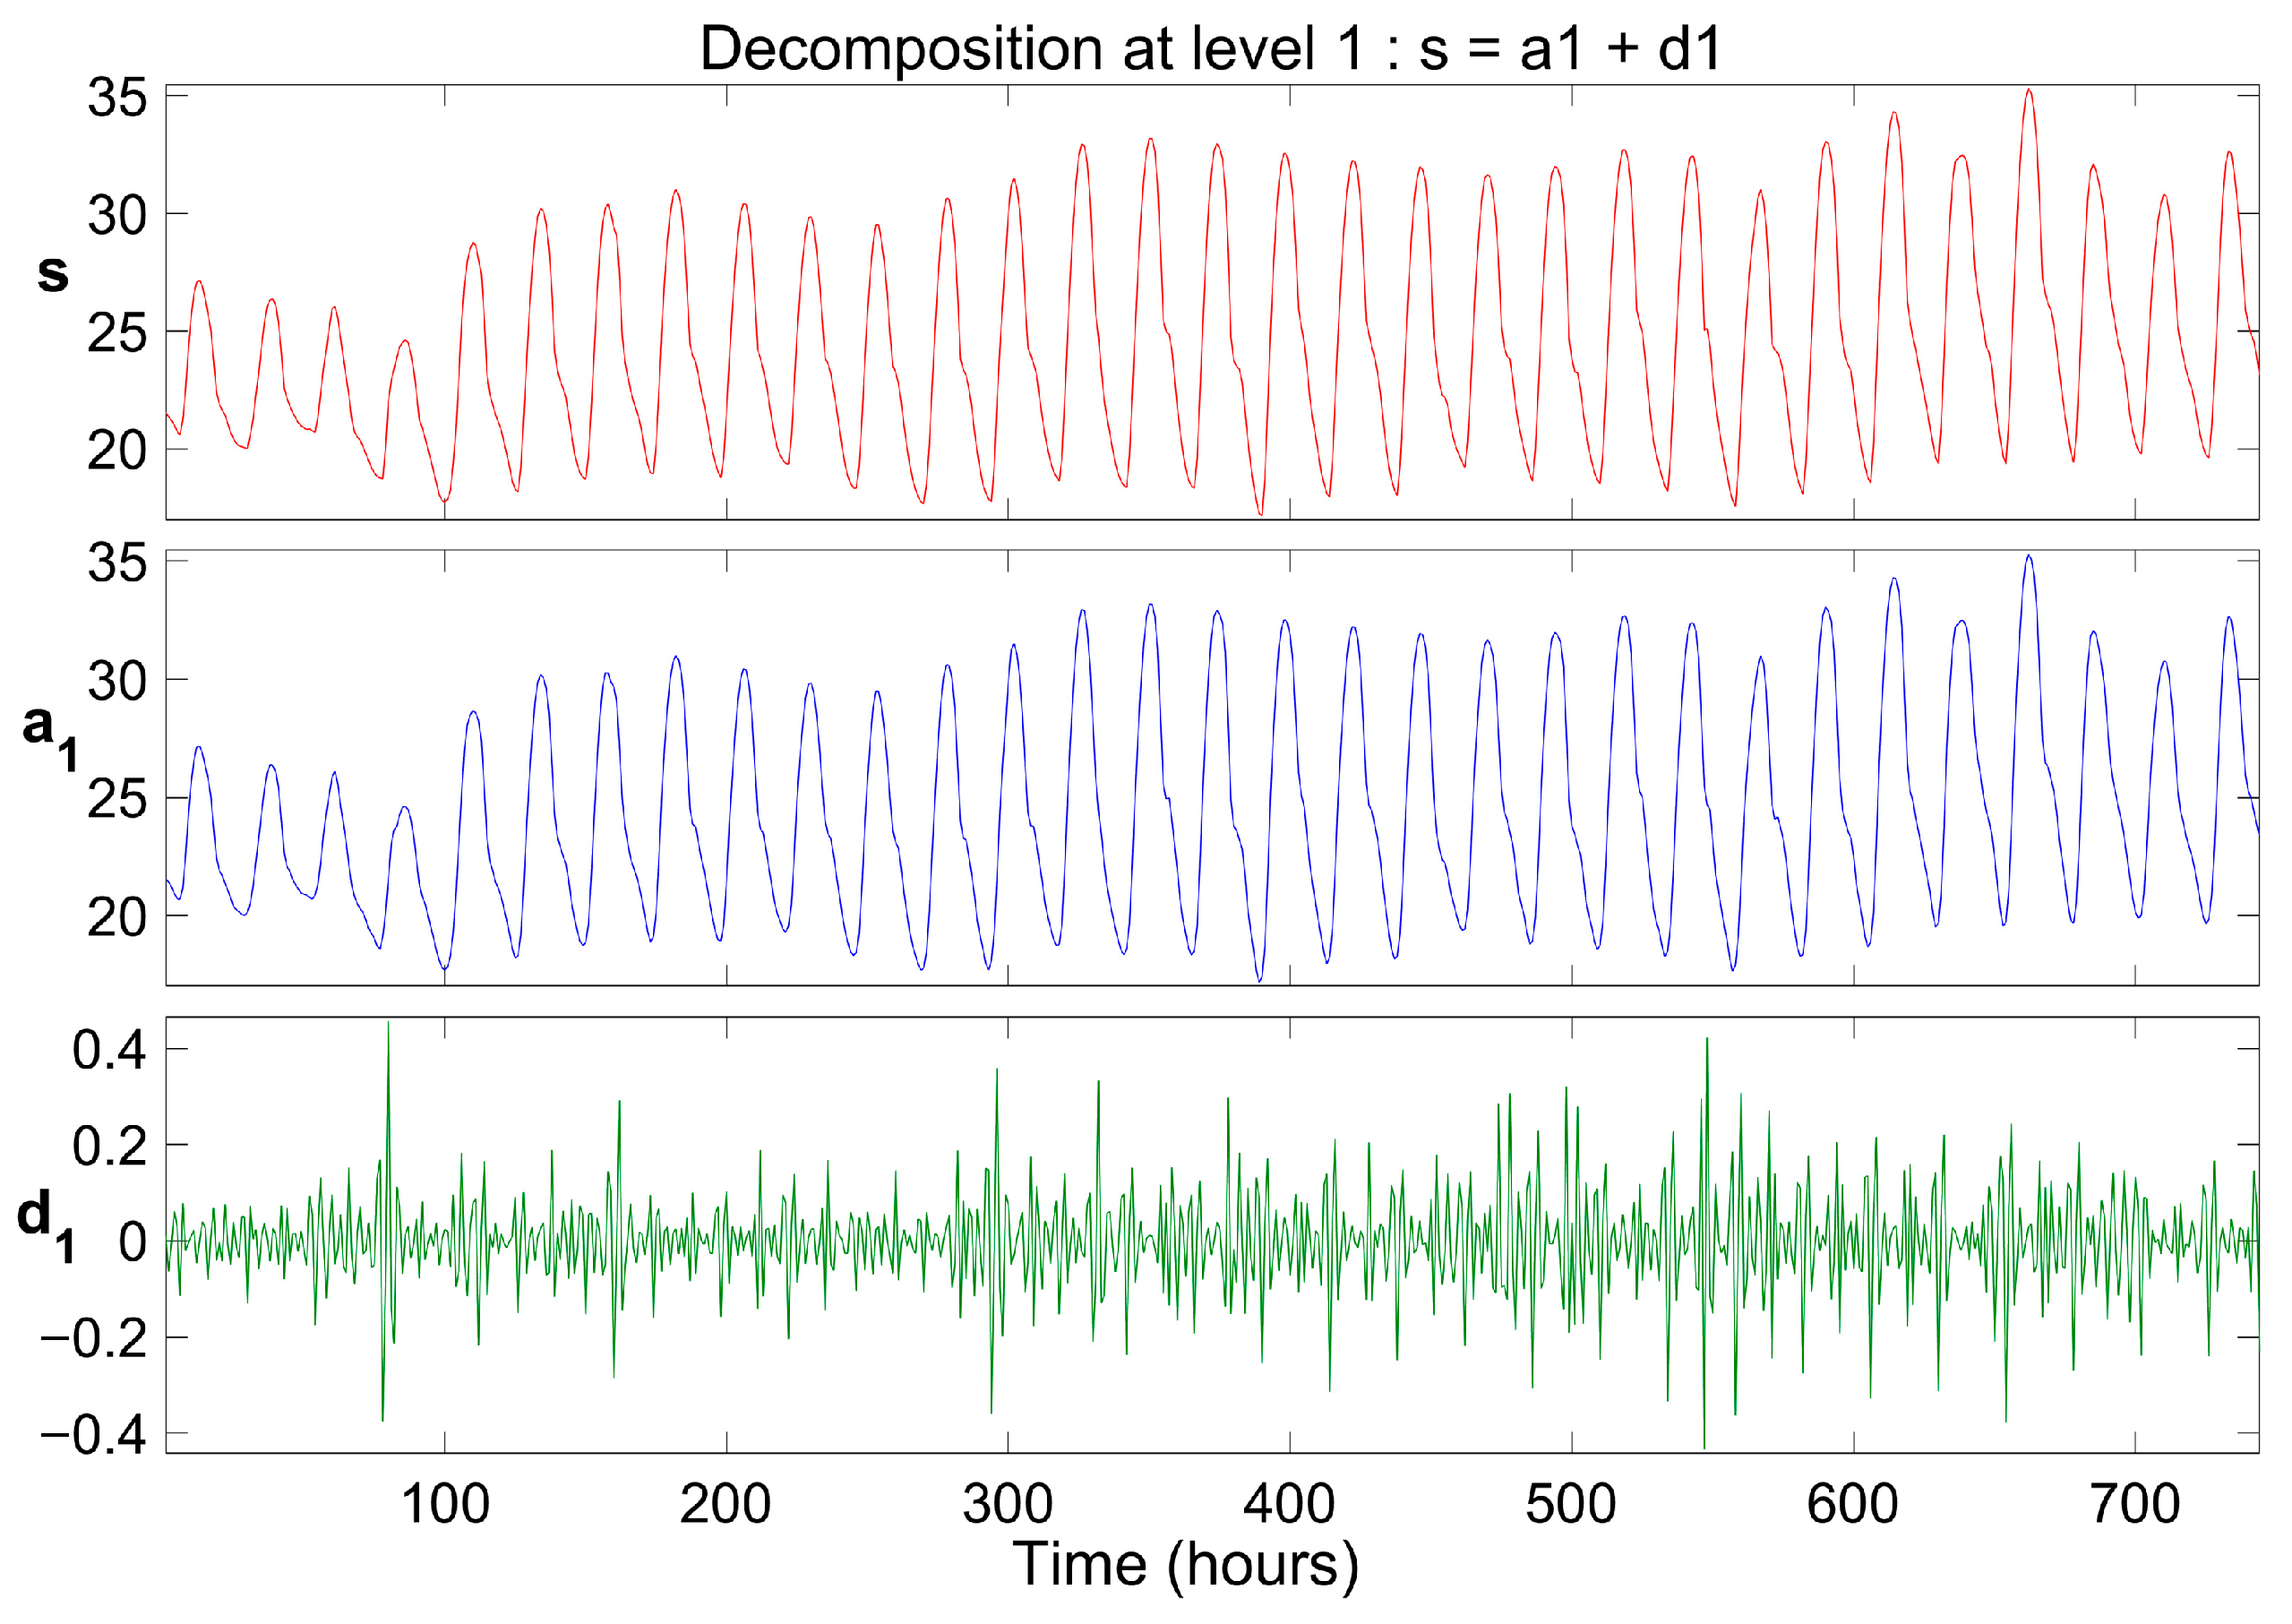
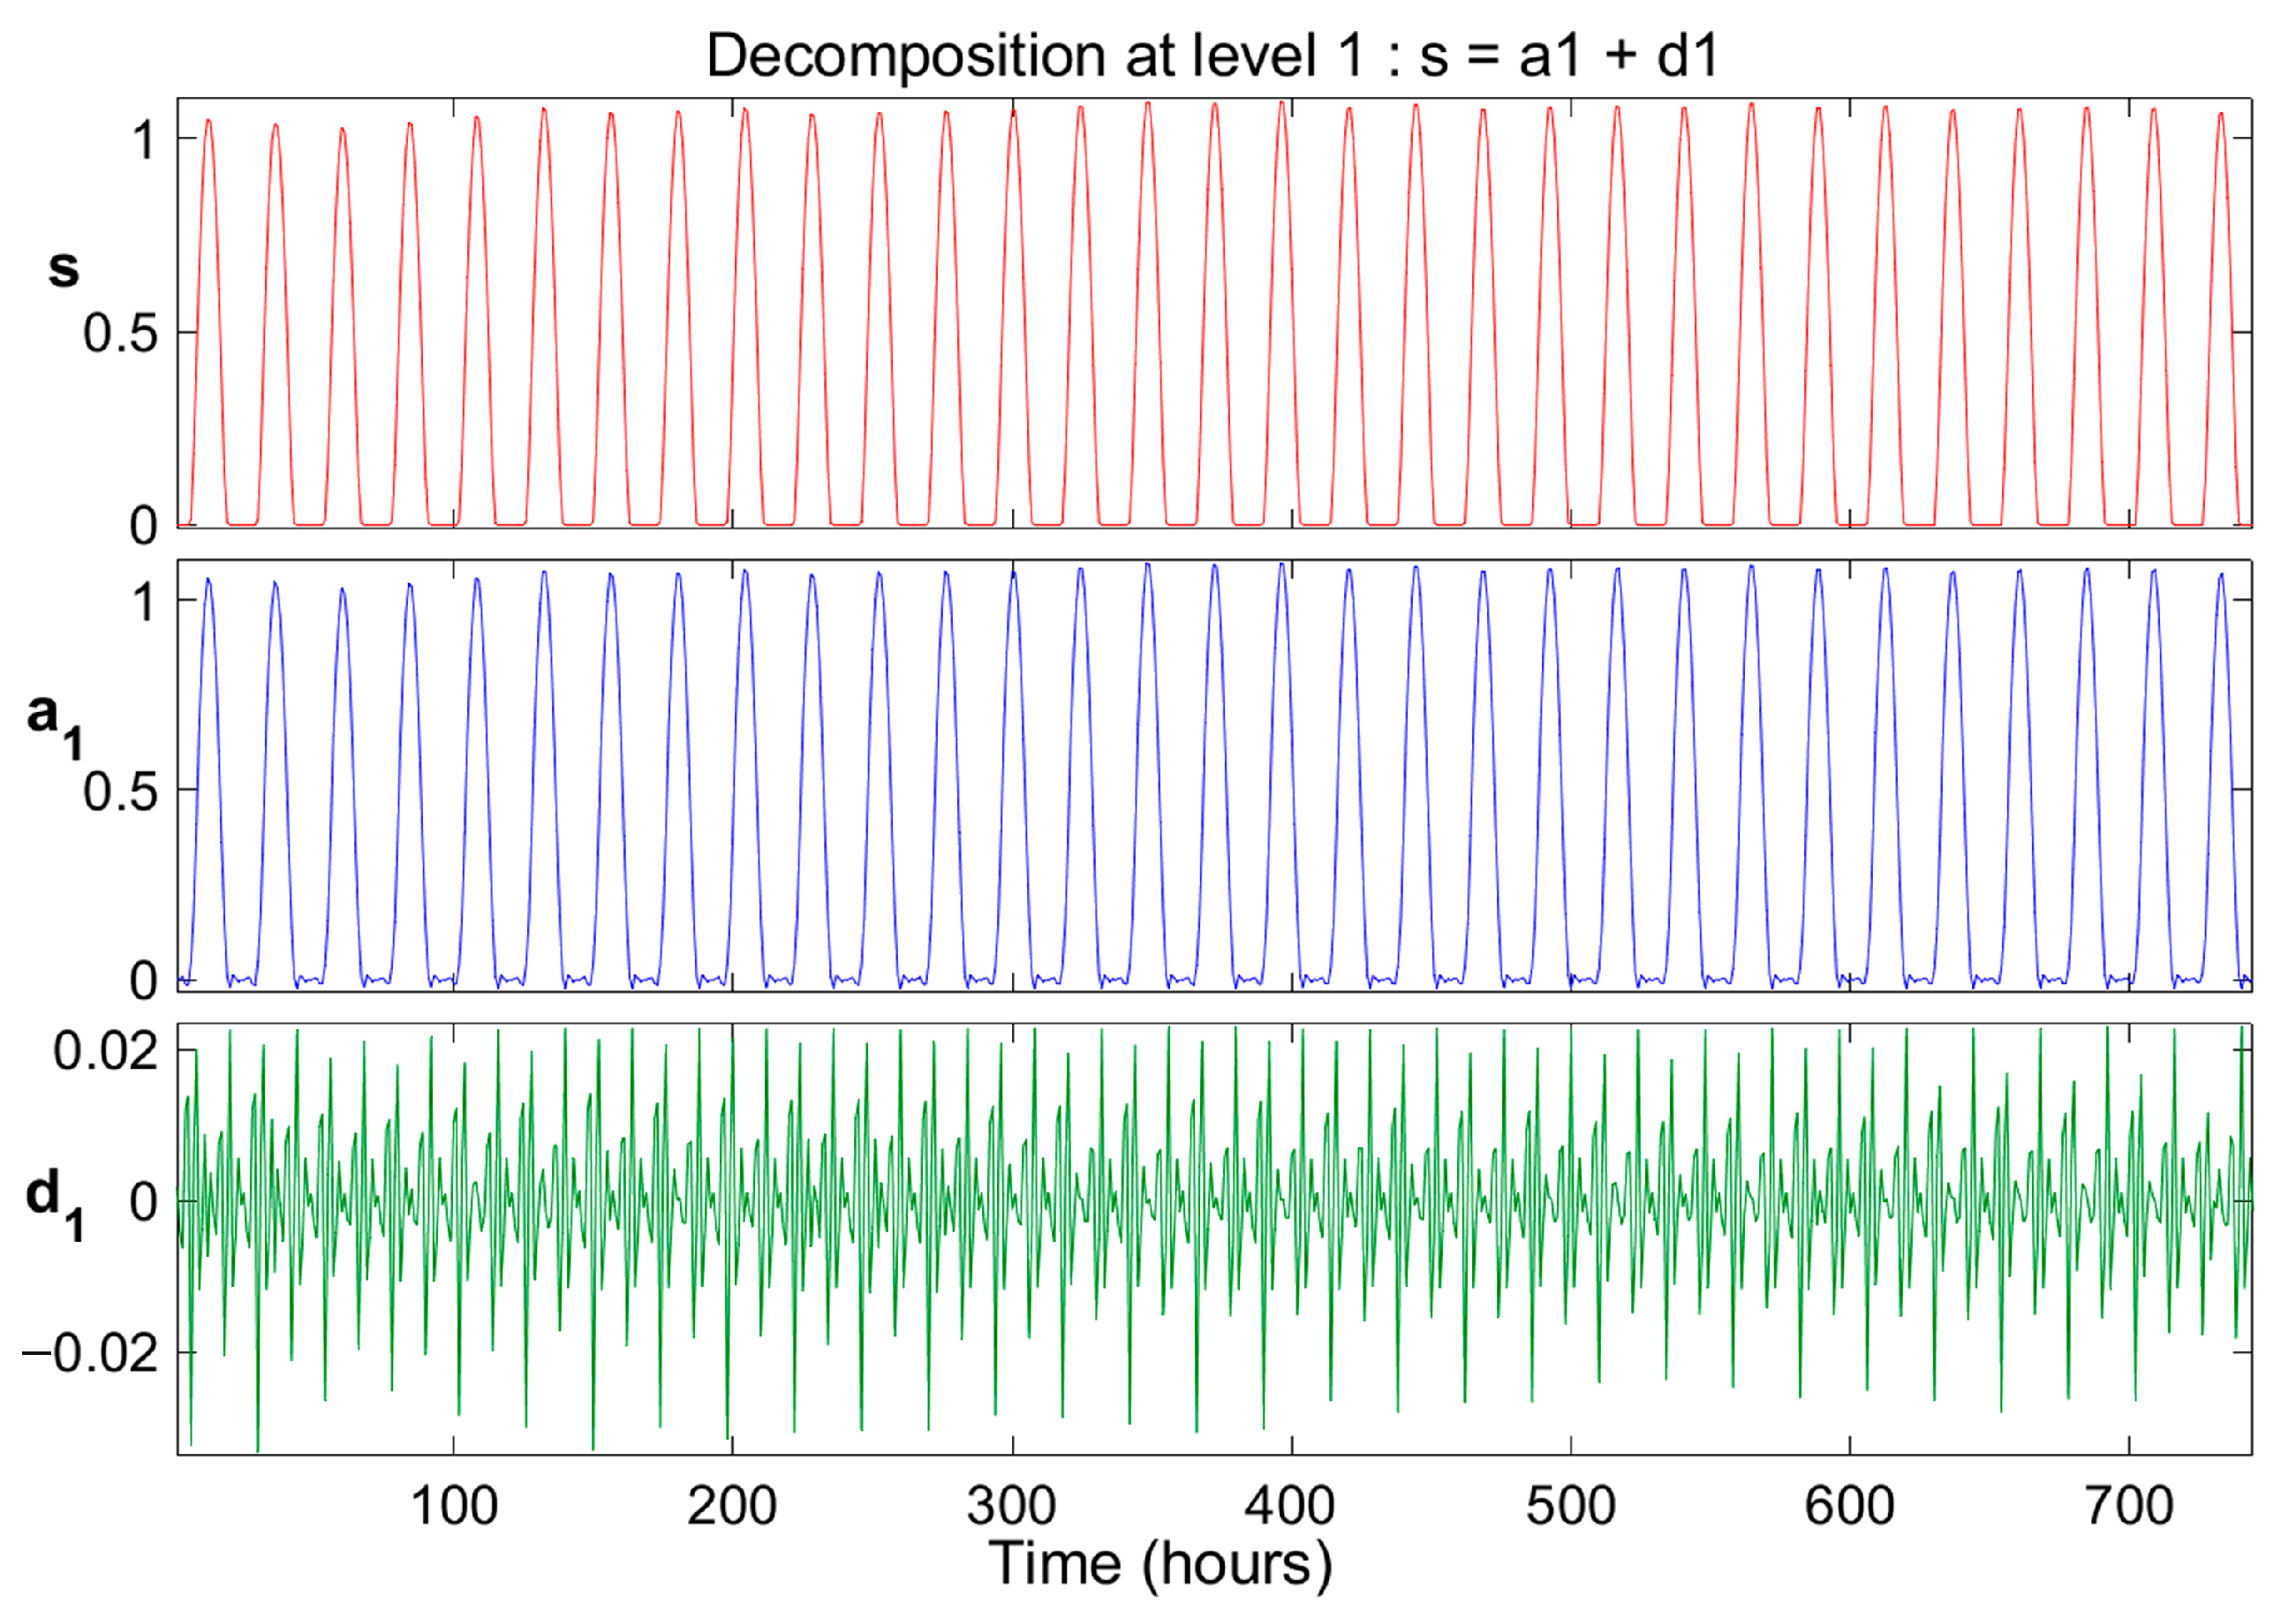
The original hourly time series data for solar irradiance, wind speed, and ambient temperature were processed using the DWT with the Daubechies wavelet (db6), applying a single level of decomposition. To illustrate this process, data from January 2012 were used, as shown in
Figure 8,
Figure 9 and
Figure 10. Each original signal, denoted as “S”, was decomposed into two components: the approximation signal (“a1”), which preserves long-term variations and reduces noise, and the detail signal (“d1”), which captures peaks and stochastic fluctuations. As evidenced in
Figure 8,
Figure 9 and
Figure 10, the main oscillations in solar irradiance, wind speed, and ambient temperature are reflected in the approximation component, which maintains a high similarity to the original signal. Therefore, the approximation signals were used as input for modeling and forecasting with the LSTM model.
4.3.2. Validation and Evaluation of the DWT-LSTM Model
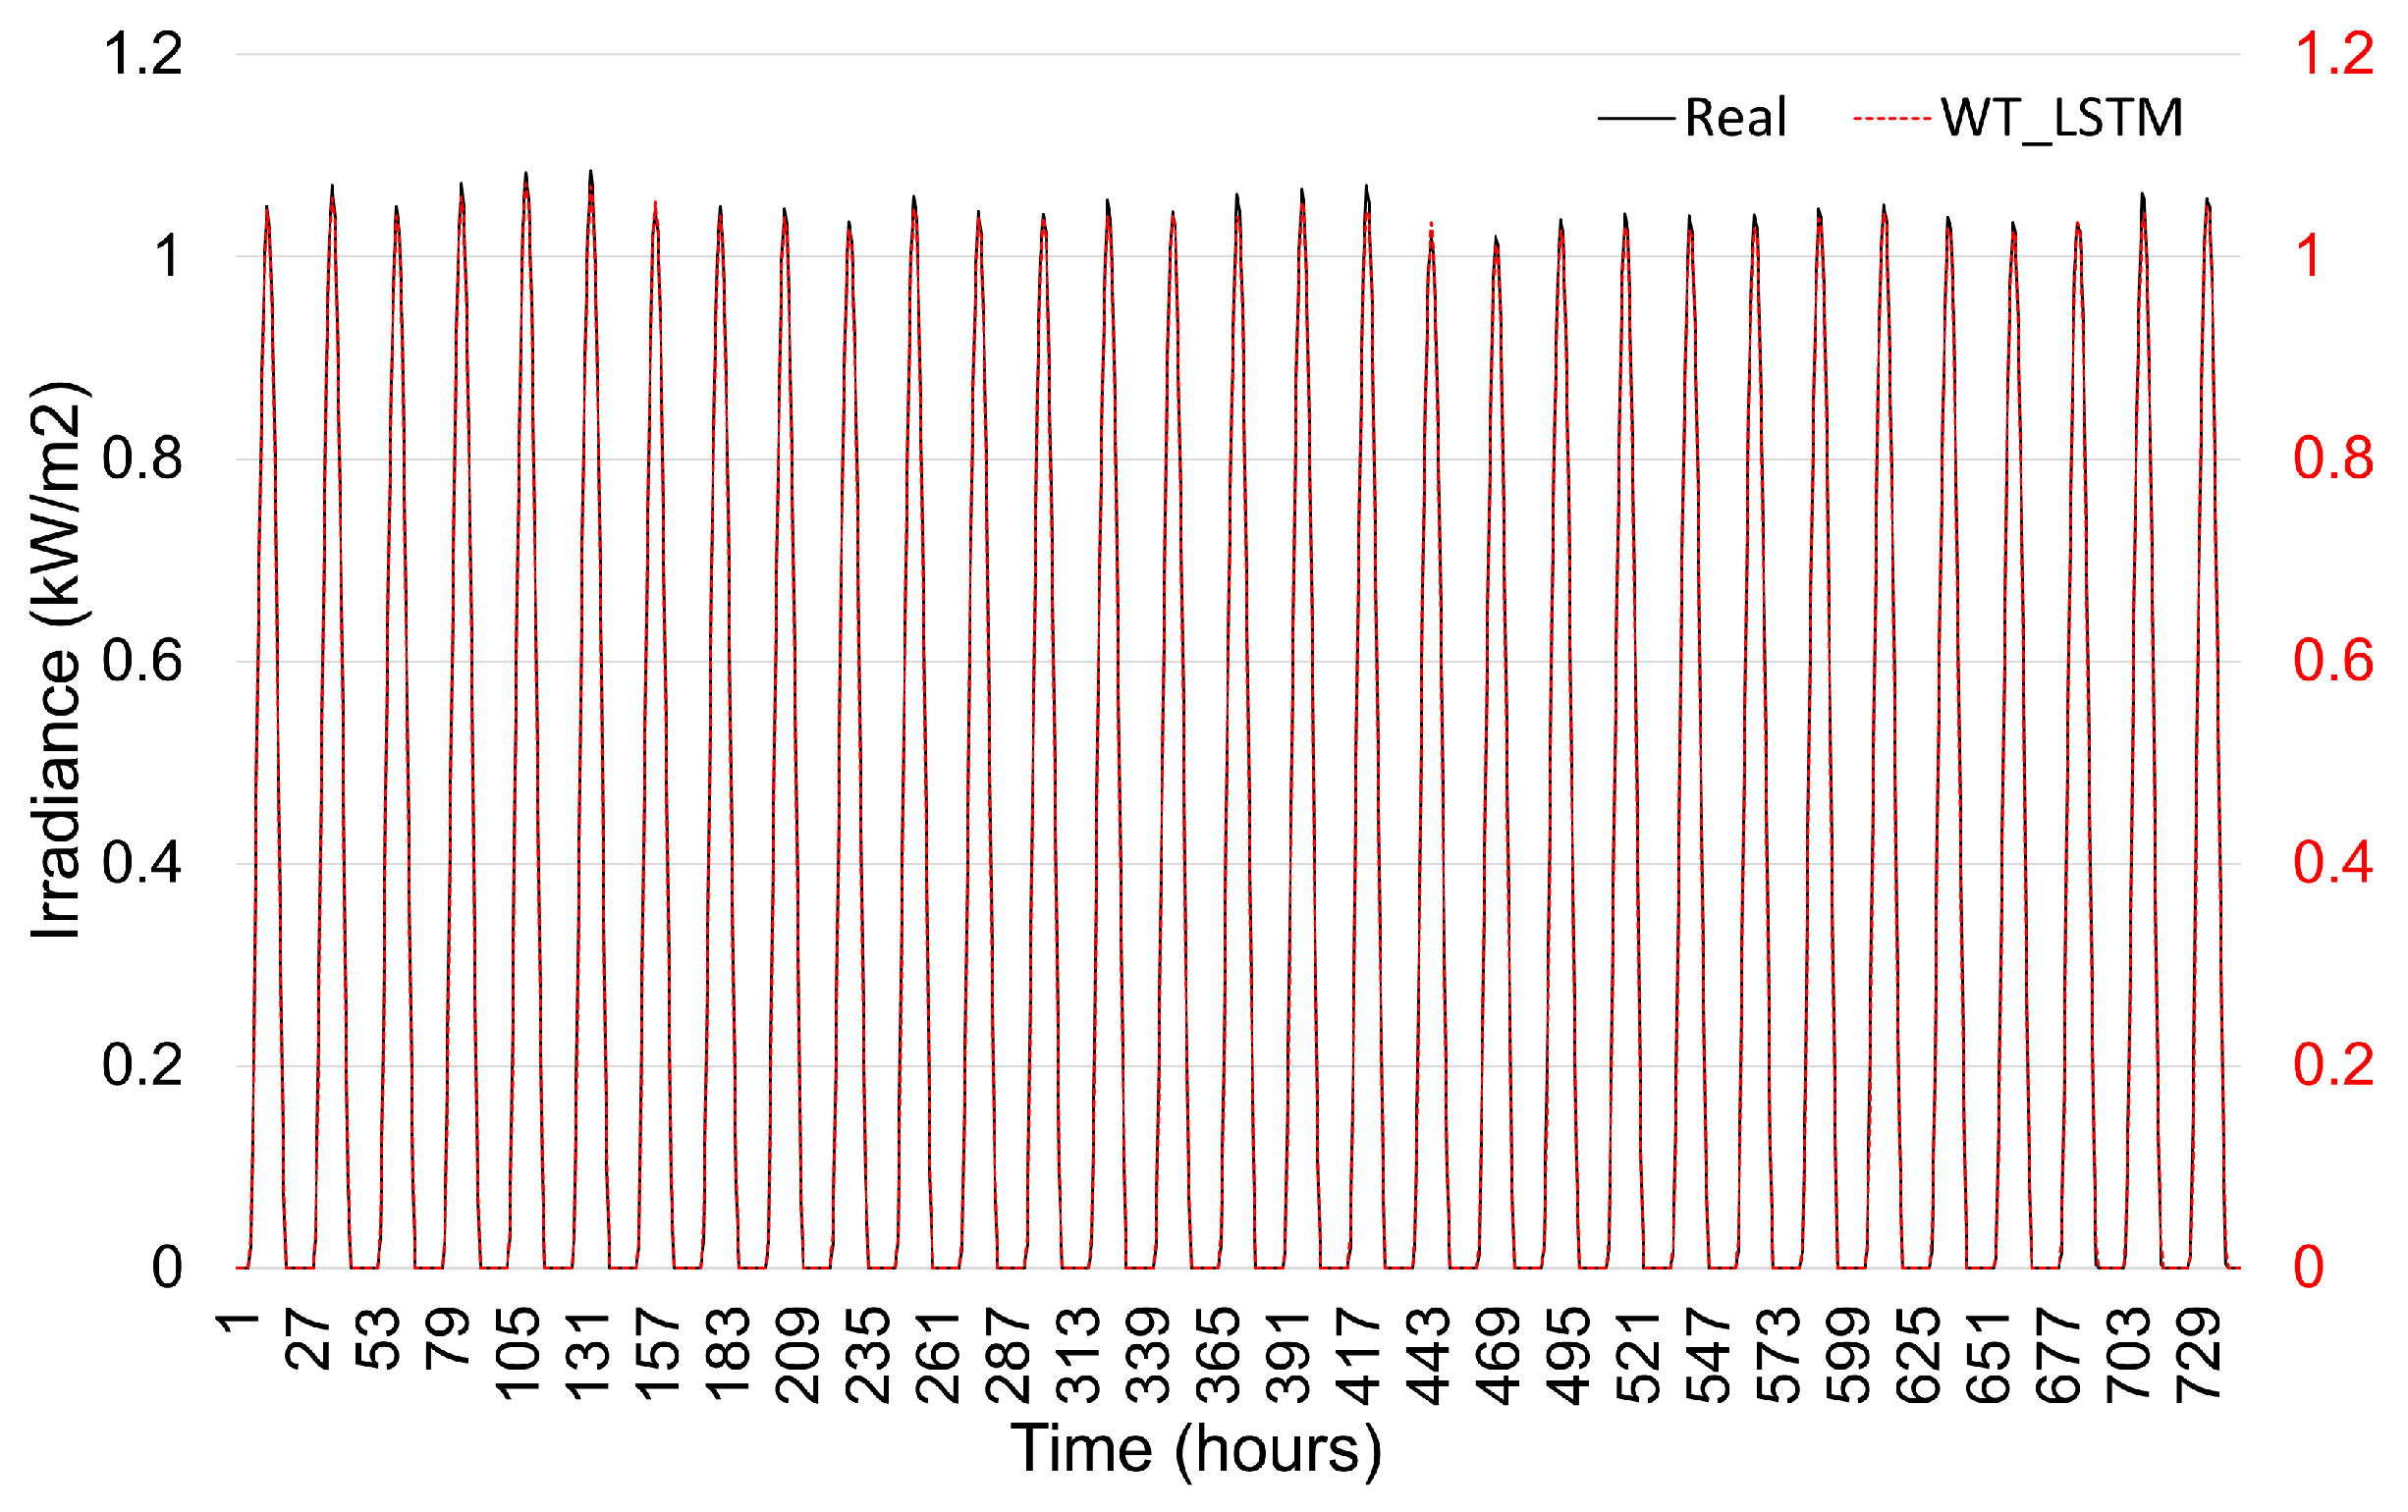
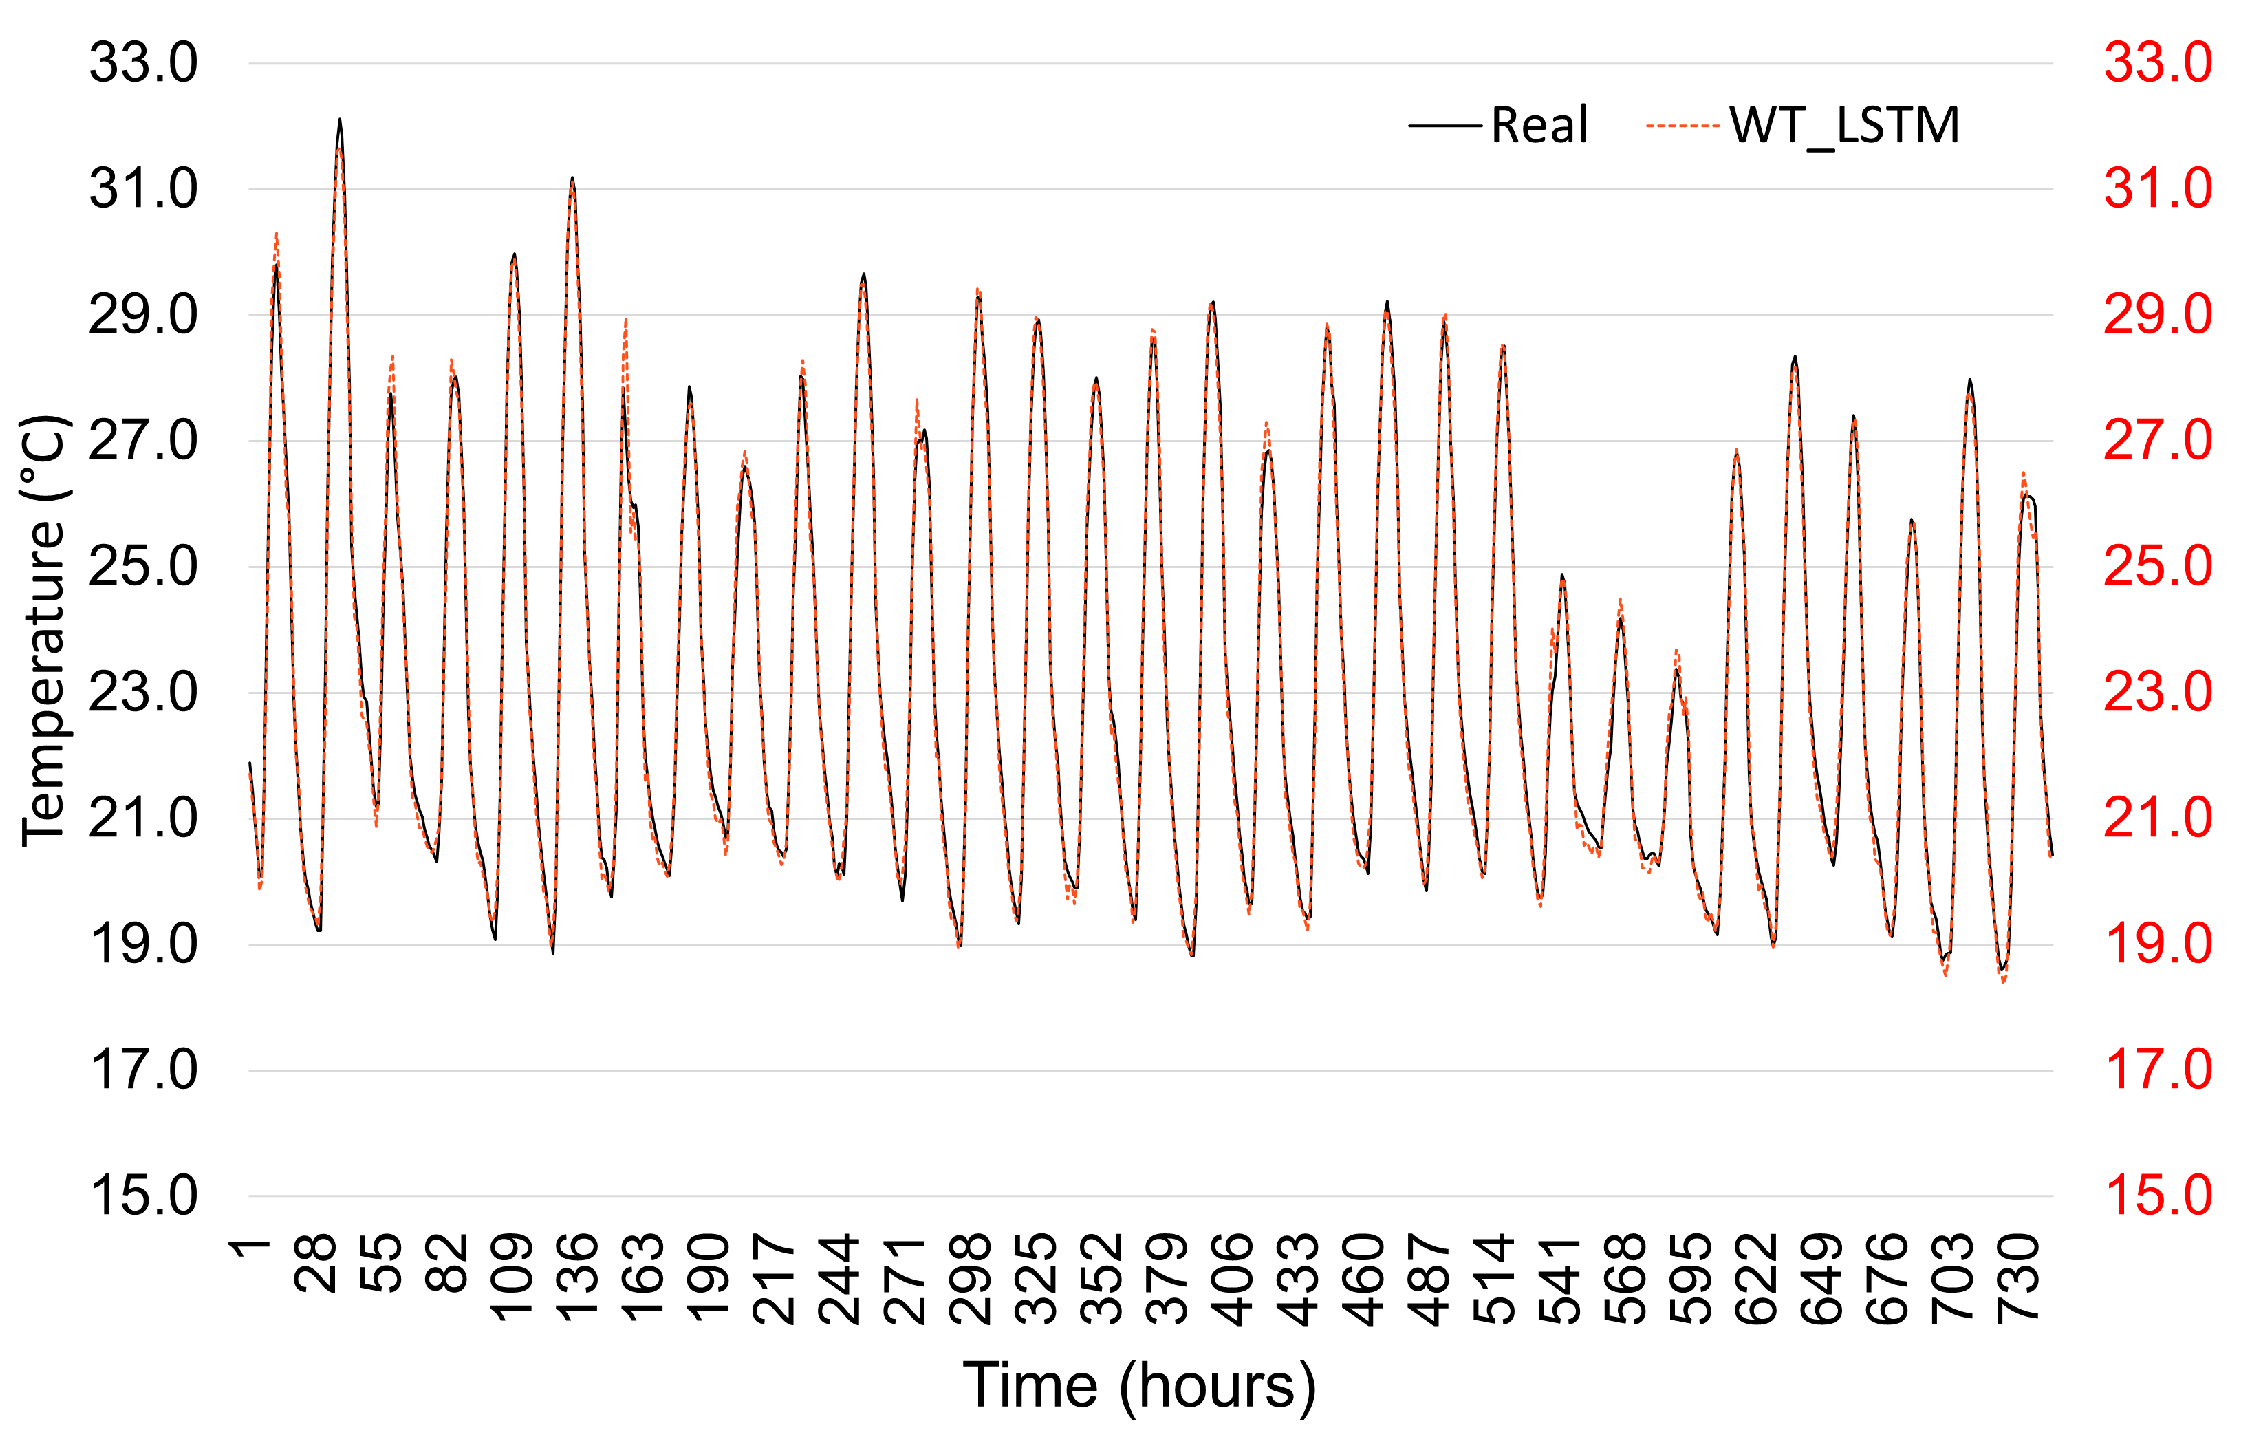
Figure 11,
Figure 12 and
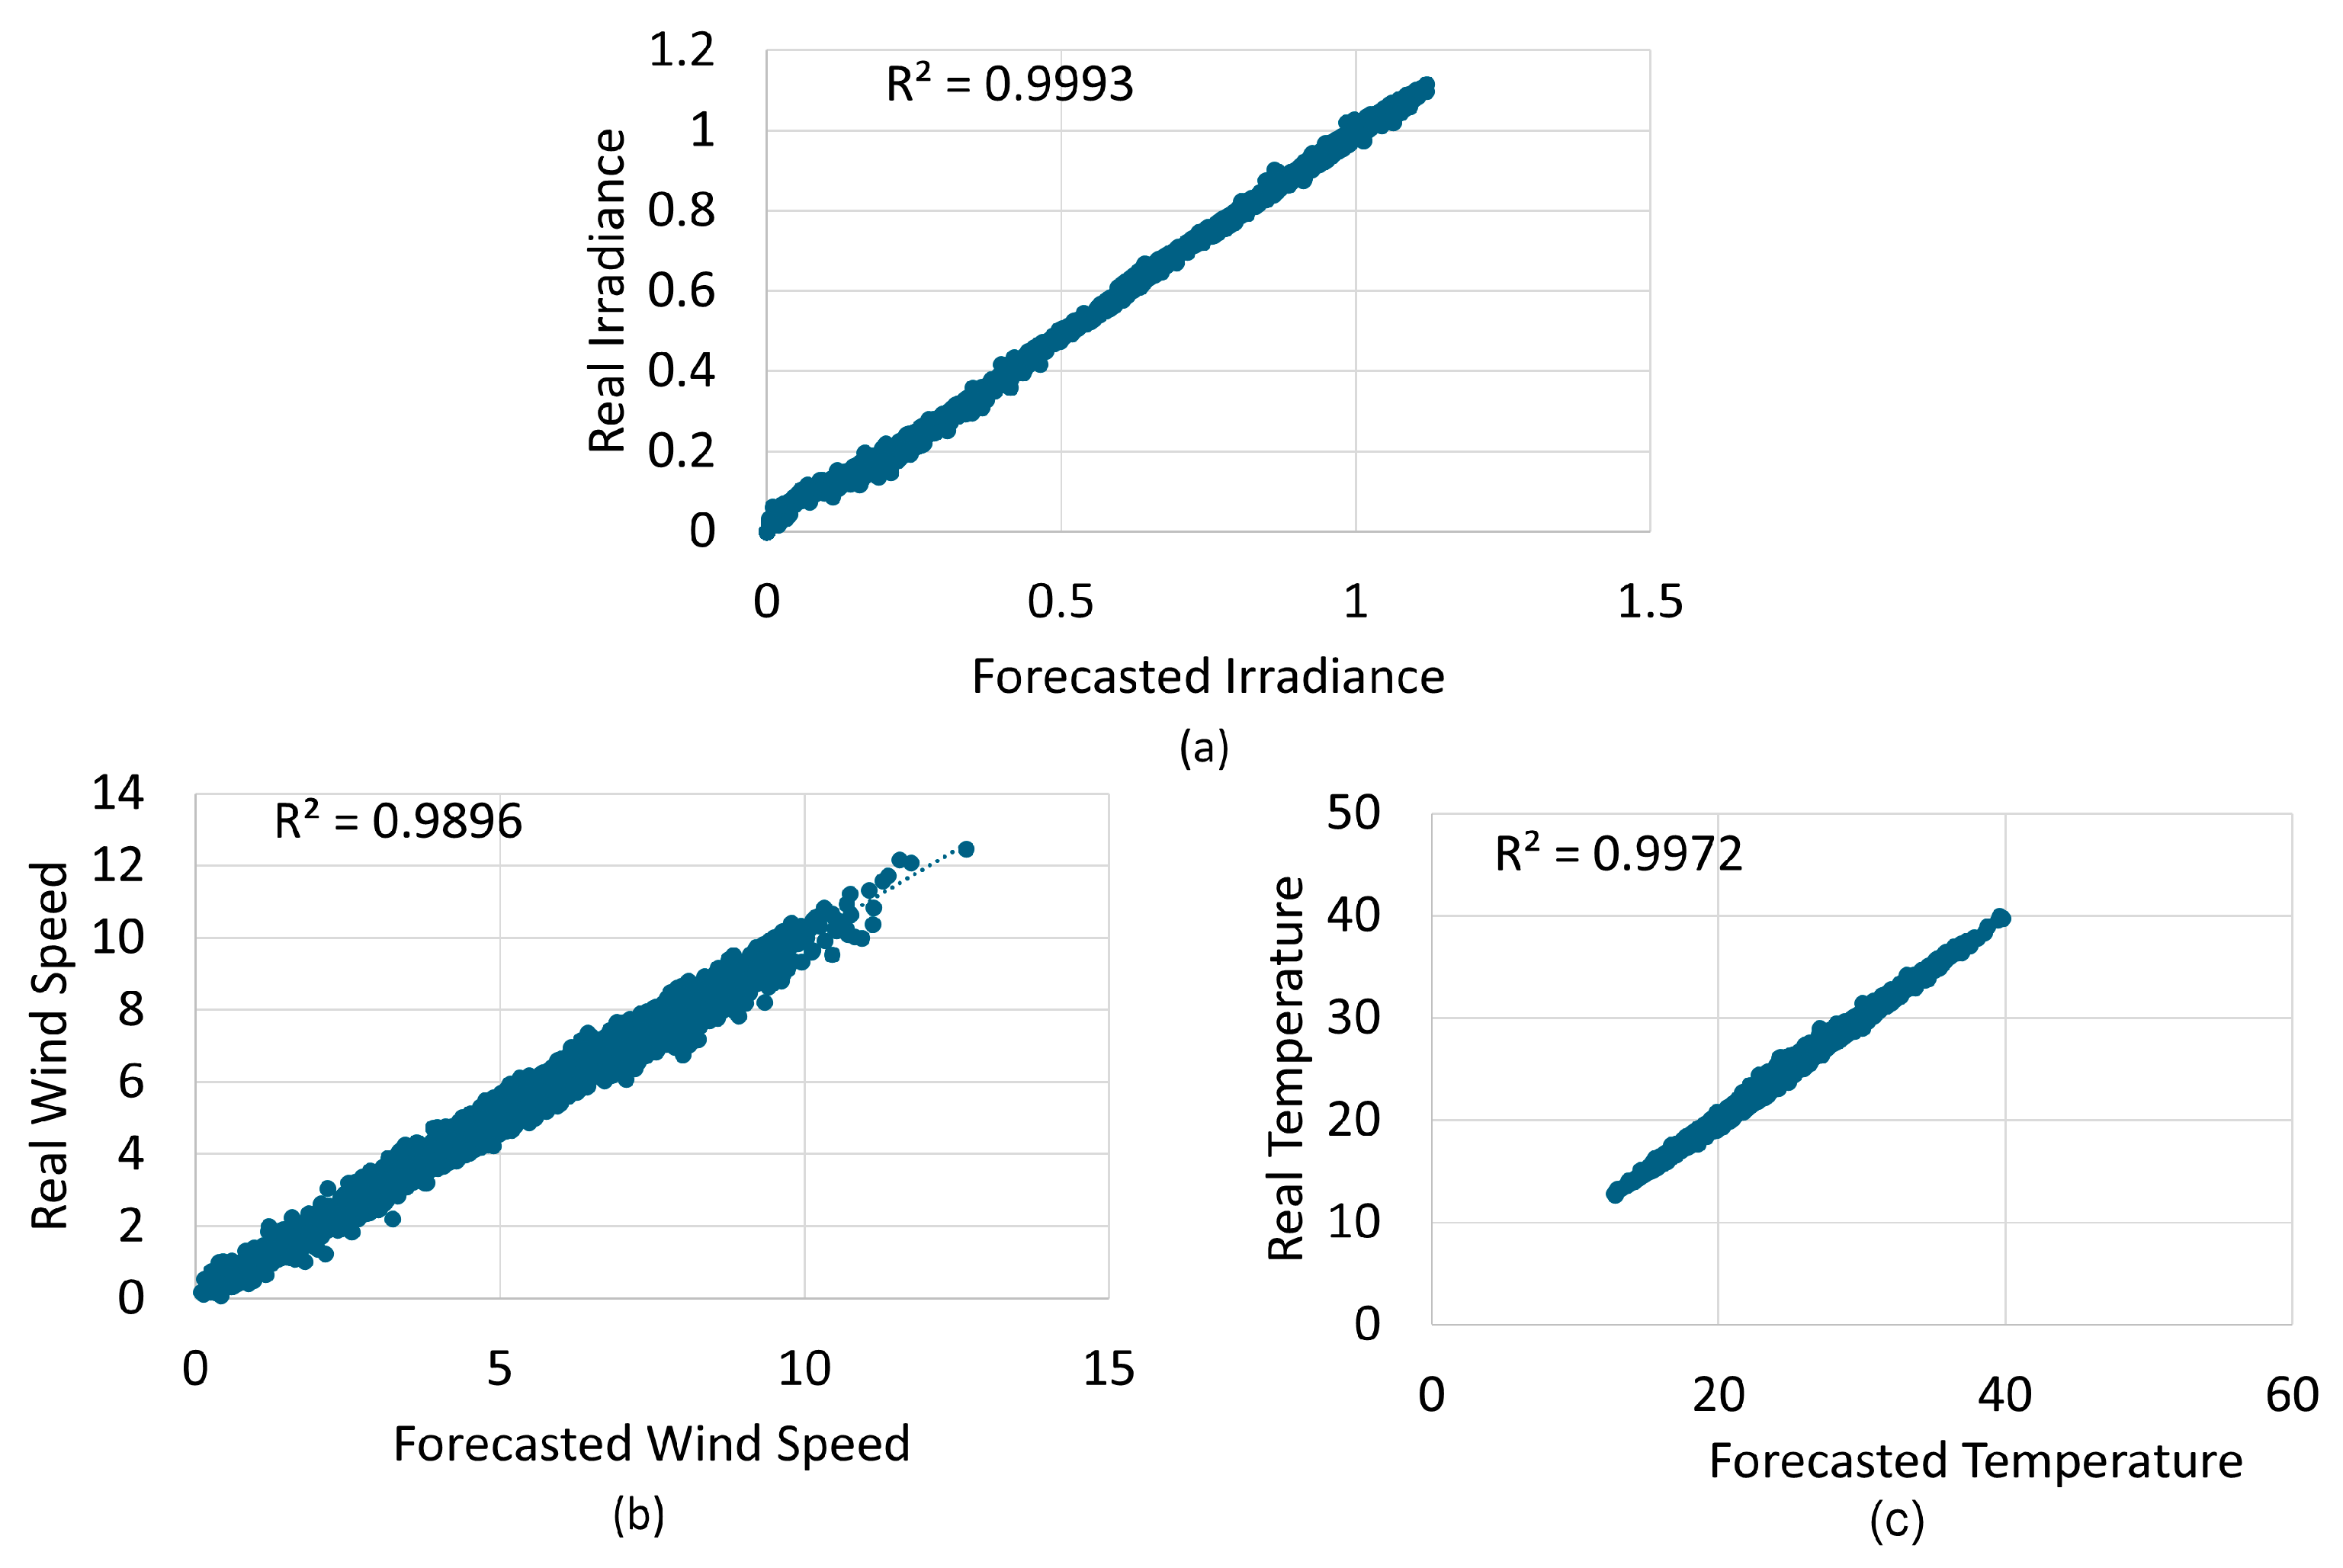
Figure 13 compare the actual and predicted values of solar irradiance, wind speed, and ambient temperature using the DWT-LSTM model for December 2021. The visual alignment between the predicted and actual data demonstrates the model’s high accuracy.
As summarized in
Table 8, the DWT-LSTM outperformed the standard LSTM based on the RMSE and MSE metrics, confirming the effectiveness of wavelet-based preprocessing in enhancing forecasting performance.
Figure 14 reinforces these findings by showing a strong correlation and high R
2 values, above 0.98 for all variables. These improvements in forecasting accuracy directly contributed to the reliability and efficiency of the HES optimization stage.
4.4. Hes Optimization Results
After the meteorological variable forecasting stage, the optimal sizing of the off-grid hybrid energy system was carried out considering three distinct configurations: PV/WT/Btt/DG, PV/Btt/DG, and WT/Btt/DG. For this purpose, the metaheuristic algorithms PSO and the GA were applied, each executed 30 times with identical control parameters to ensure a fair comparison between the methods. The computation time required by each algorithm was not considered a selection criterion. The optimal solution was defined as the one that yielded the lowest value of the objective function, represented by the CT.
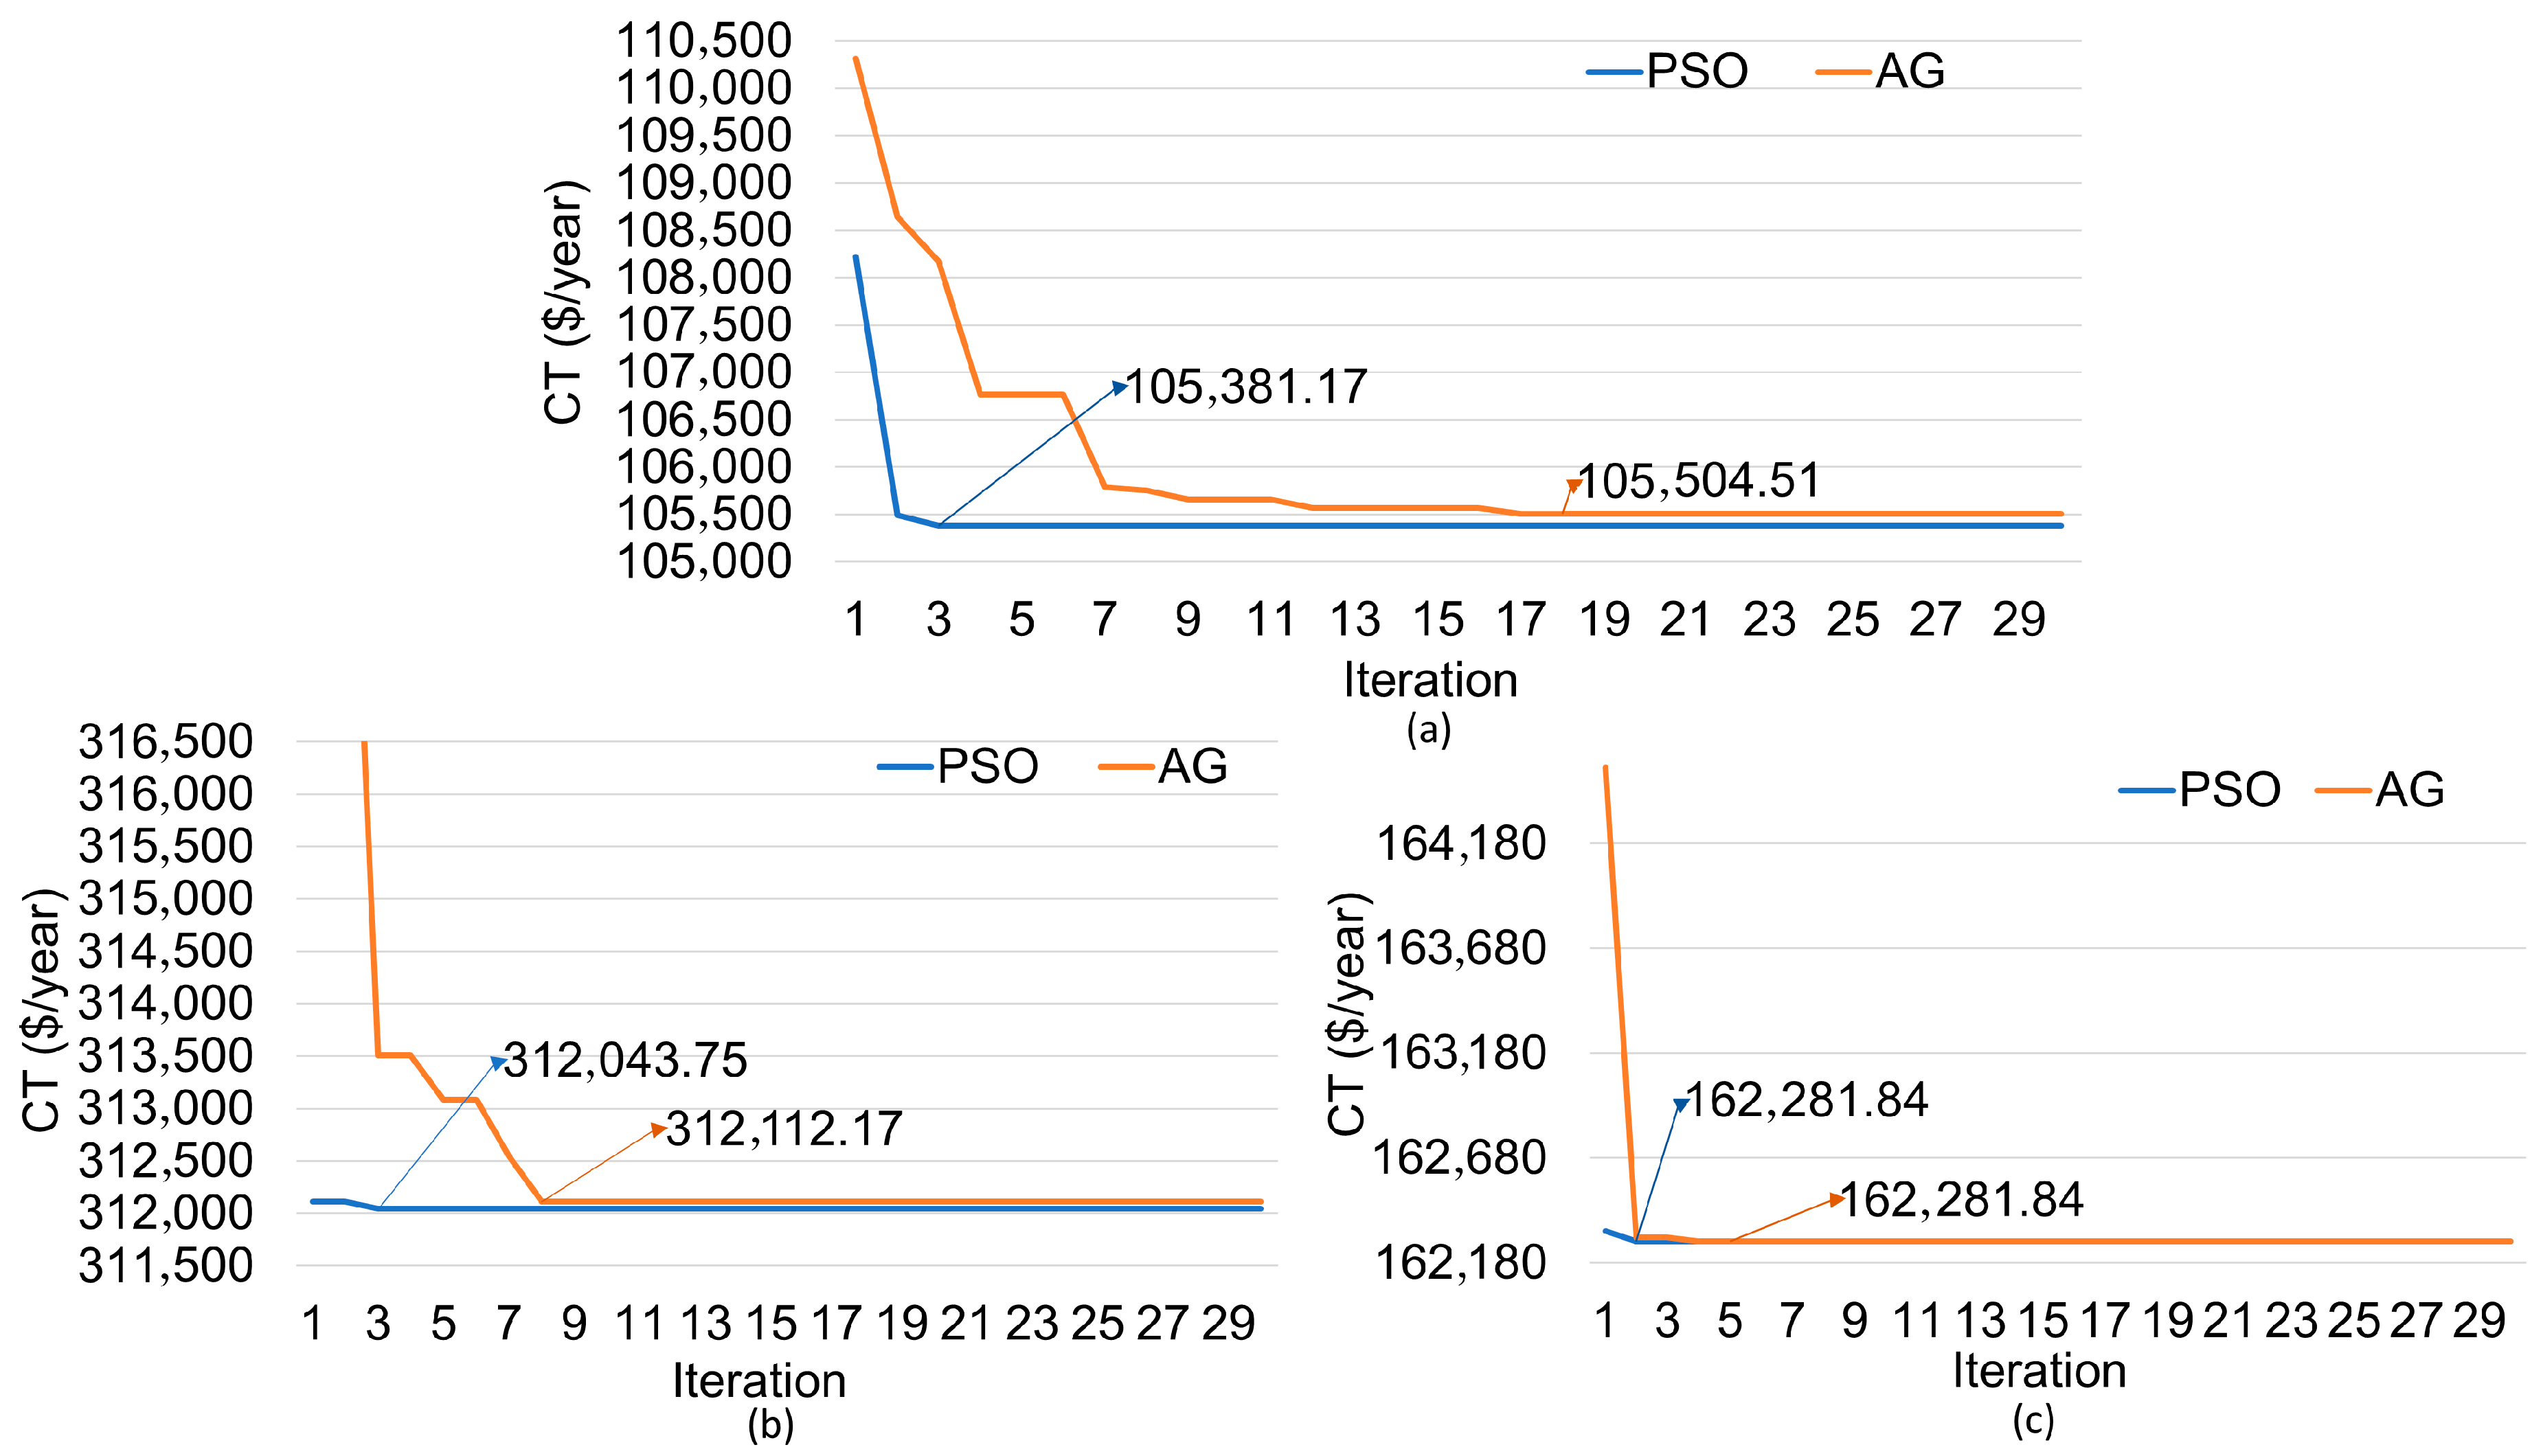
Figure 15 presents the convergence curves of the PSO algorithm and the GA for the three configurations analyzed. In all cases, PSO demonstrated superior performance, quickly reaching the minimum value of the objective function and maintaining stability throughout the iterations. Specifically, PSO converged to the optimal solution within the first few iterations (between the 2nd and 3rd), while GA showed greater variability and required more iterations to stabilize. Although the comparison between methods is based on the minimum CT, the results confirm the superior efficiency and consistency of PSO across all evaluated configurations.
A comparison of the results from the PSO algorithm and the GA for various HES configurations is presented in
Table 9. It is important to note that all analyzed configurations considered the use of a 150 kW diesel generator (DG). The PV/WT/Btt/DG configuration achieved the lowest values for CT and COE when optimized with the PSO algorithm, reaching
$105,381.17 per year and
$0.1243 per kWh, respectively. The optimal sizing found by PSO includes 450 PV systems, 10 WTs, and 66 Btt units. In comparison, the GA resulted in a configuration with slightly fewer PV systems (448) and Btt units (65), while maintaining the same number of WTs (10).
For the WT/Btt/DG configuration, the PSO algorithm yielded slightly lower CT and COE values than those obtained by the GA, with $162,281.84 per year and $0.1915/kWh, respectively. Both algorithms converged to the same number of WTs (16), but differed in the number of batteries: 45 units for PSO and 47 for the GA.
In the PV/Btt/DG configuration, PSO also outperformed the GA, with slightly lower CT and COE values of $312,043.75 per year and $0.3682/kWh, respectively. Both algorithms converged to the same number of PV systems (450), differing only in the number of batteries: 50 units for PSO and 49 for the GA.
As shown in
Table 9, the CT ranged from
$105,381.17 per year to
$312,112.17 per year. The lowest value was achieved with the PV/WT/Btt/DG configuration using the PSO algorithm, while the highest was recorded in the PV/Btt/DG configuration with the GA. Similarly, the COE ranged from
$0.1243/kWh to
$0.3683/kWh, with the minimum and maximum values also corresponding to these respective configurations. The PSO algorithm achieved the lowest CT values in all configurations analyzed:
$105,381.17 per year,
$162,281.84 per year, and
$312,043.75 per year for the PV/WT/Btt/DG, WT/Btt/DG, and PV/Btt/DG configurations, respectively. Likewise, it presented the lowest COE values:
$0.1243/kWh,
$0.1915/kWh, and
$0.3682/kWh.
Figure 16 compares the annual fuel costs of the three HES configurations. PSO achieved better results in reducing these costs for the PV/WT/Btt/DG and PV/Btt/DG configurations, with only minor differences compared to the GA. In the WT/Btt/DG configuration, the GA showed a slightly lower fuel cost, possibly due to the smaller number of batteries recommended by PSO, which led to greater reliance on the diesel generator. Notably, the PV/WT/Btt/DG configuration presented the lowest fuel cost in both algorithms, confirming its energy efficiency and suitability for the case study.
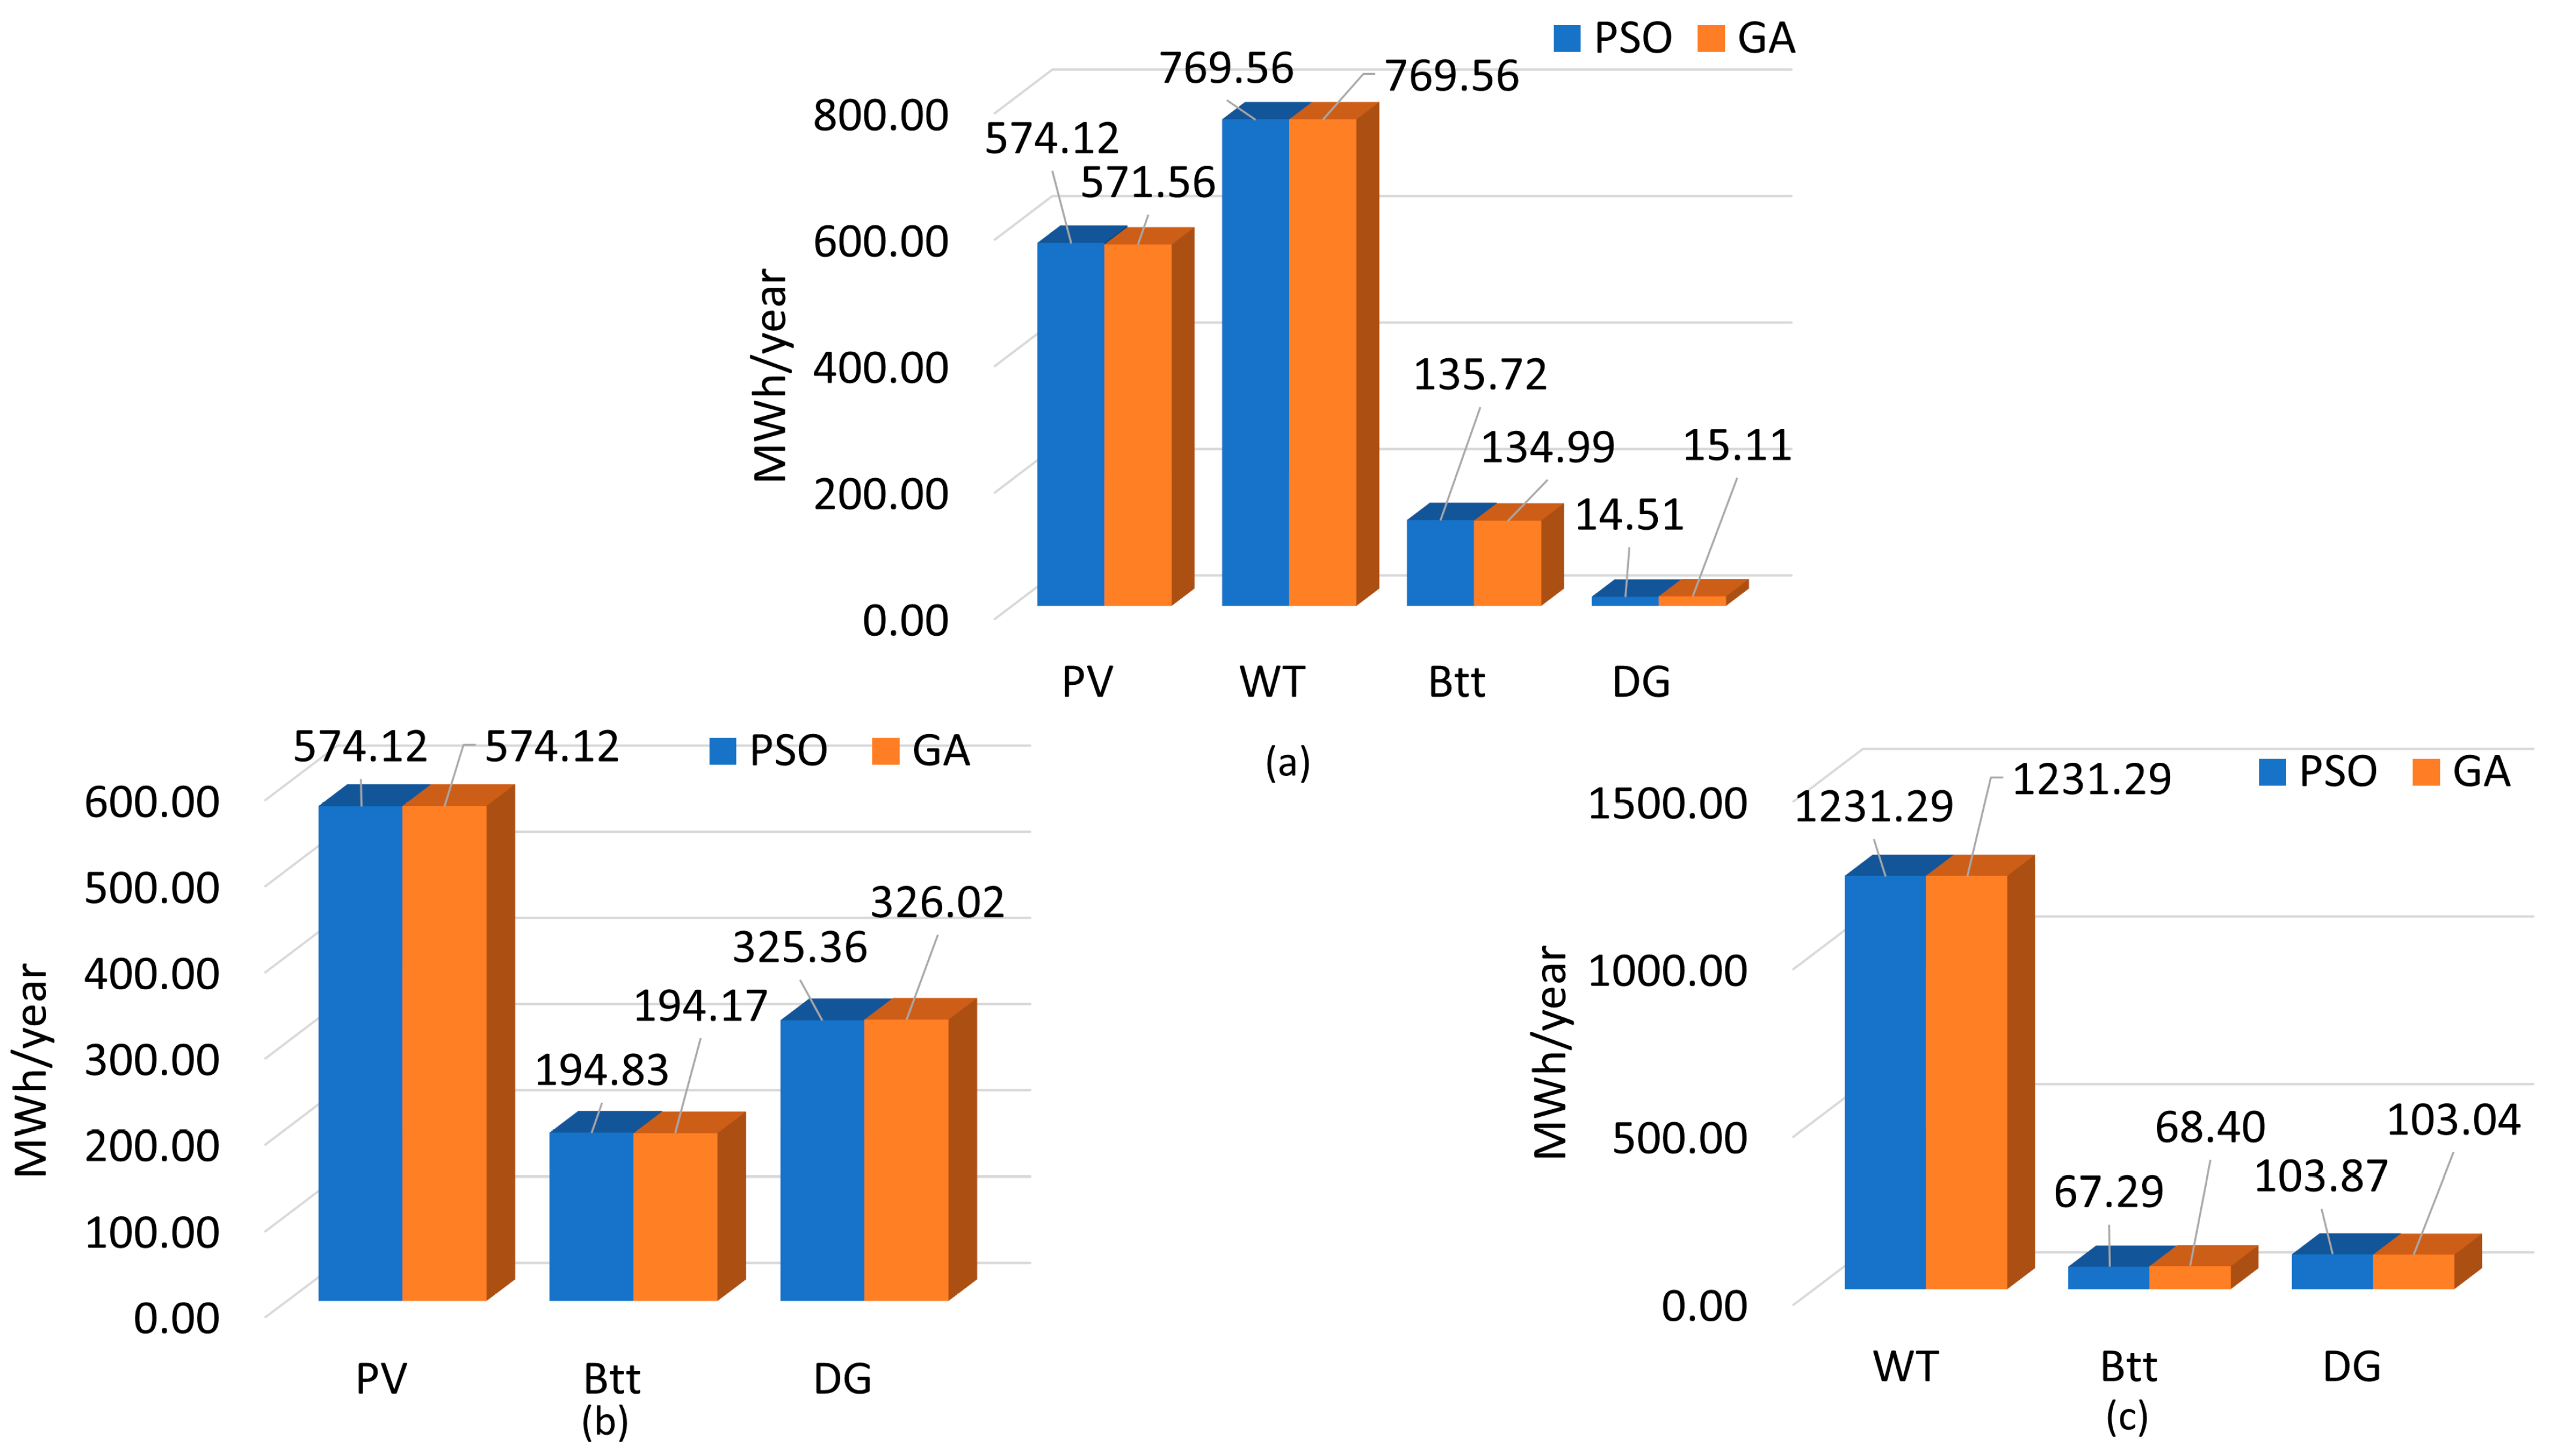
Figure 17 shows the annual energy contribution of each HES component across the three configurations. The PV/WT/Btt/DG setup delivered the highest total energy output due to its integration of four complementary sources. In this configuration, PV and WT are the primary renewable generators, while Btt and DG serve as backup. Both PSO and the GA produced similar results, with PSO yielding slightly higher total generation. The PV/Btt/DG configuration had the lowest energy output, limited by the absence of wind power, making the system more dependent on storage and diesel generation. Again, both algorithms produced comparable results, with minor differences in battery and generator contributions. The WT/Btt/DG configuration performed better than PV/Btt/DG but remained below the PV/WT/Btt/DG setup, reflecting the importance of hybrid diversification. Overall, PSO consistently delivered slightly better energy contributions across all configurations, confirming its effectiveness. Among the scenarios, PV/WT/Btt/DG optimized with PSO stood out as the most efficient solution, especially in regions with abundant renewable resources.
4.5. Statistical Analysis
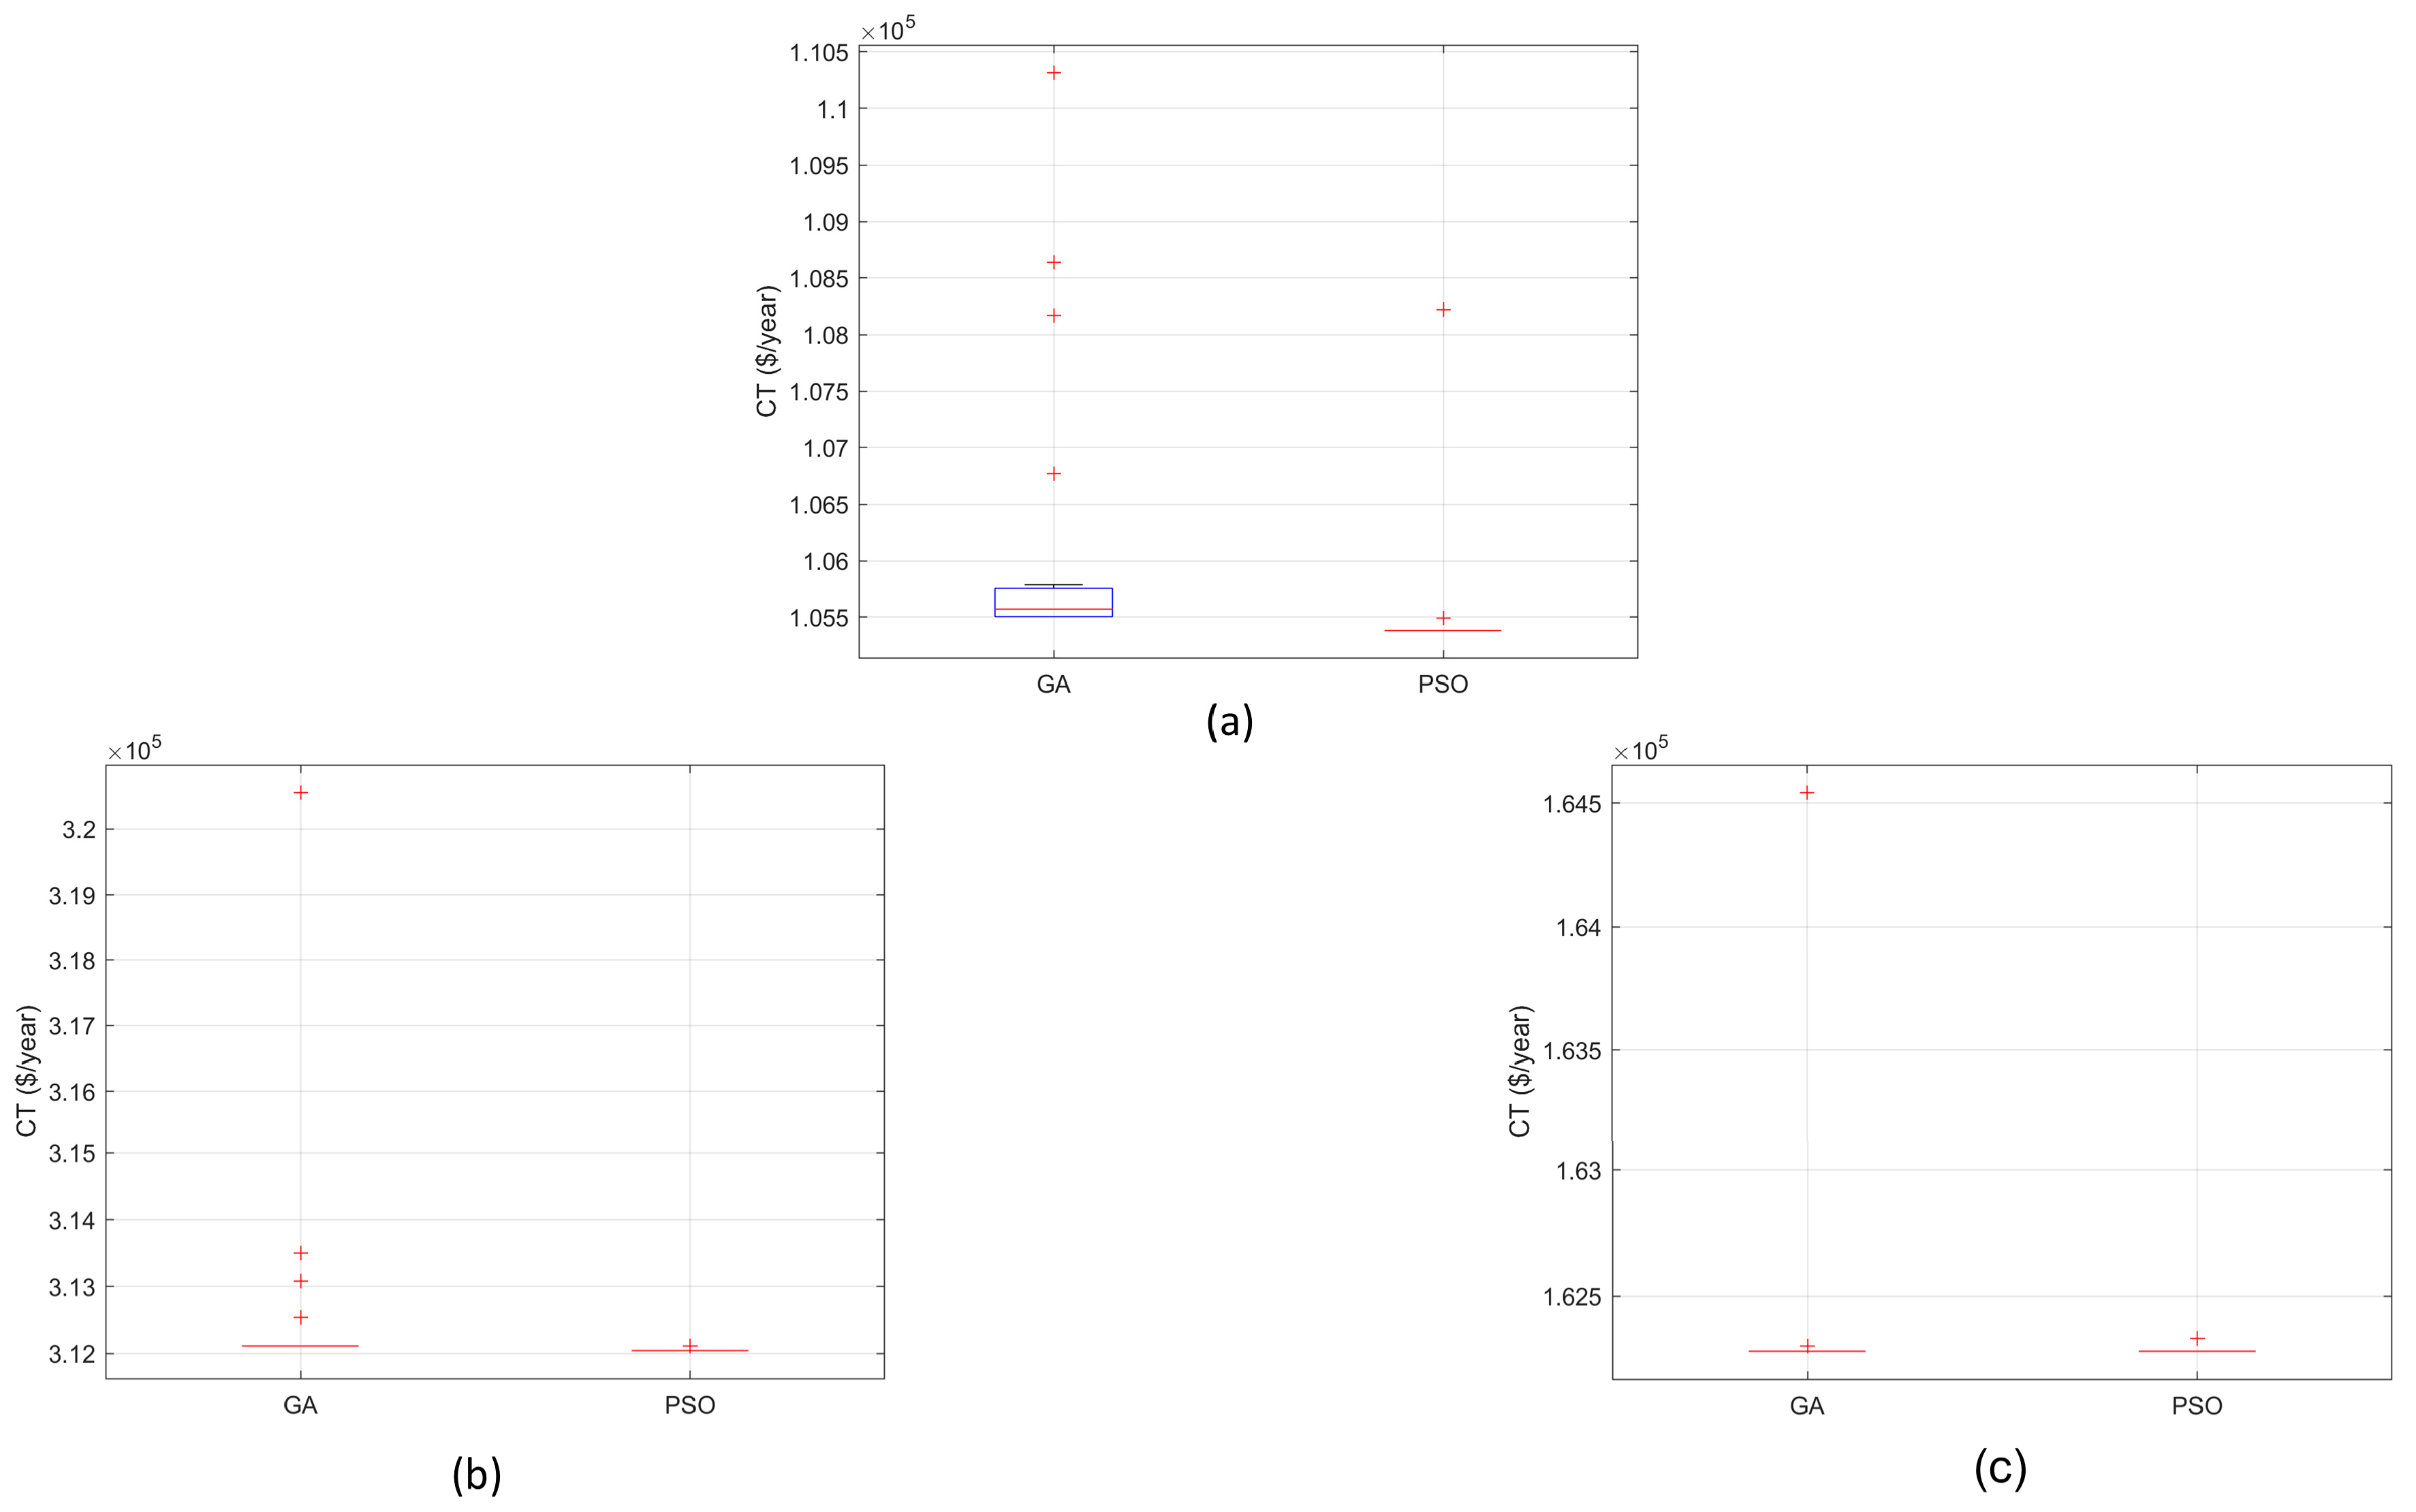
Table 10 presents the statistical analysis of the performance of the PSO algorithm and the GA in optimizing the three HES configurations, considering 30 independent runs. The results show that PSO was consistently more efficient and reliable, achieving lower CT values with low dispersion, while the GA exhibited higher variability and greater average costs, especially in the PV/Btt/DG configuration. To assess the significance of the observed differences, the Wilcoxon rank-sum test was applied, following [
90]. The results confirm statistically significant differences in favor of PSO for the PV/WT/Btt/DG and PV/Btt/DG configurations (
p < 0.01), highlighting its superiority in terms of accuracy and stability. For the WT/Btt/DG configuration, although PSO demonstrated much lower variability (SD = 9.07 compared to 412.48 for GA), the
p-value (0.6627) indicates that there is no statistically significant difference between the average costs obtained by the two algorithms.
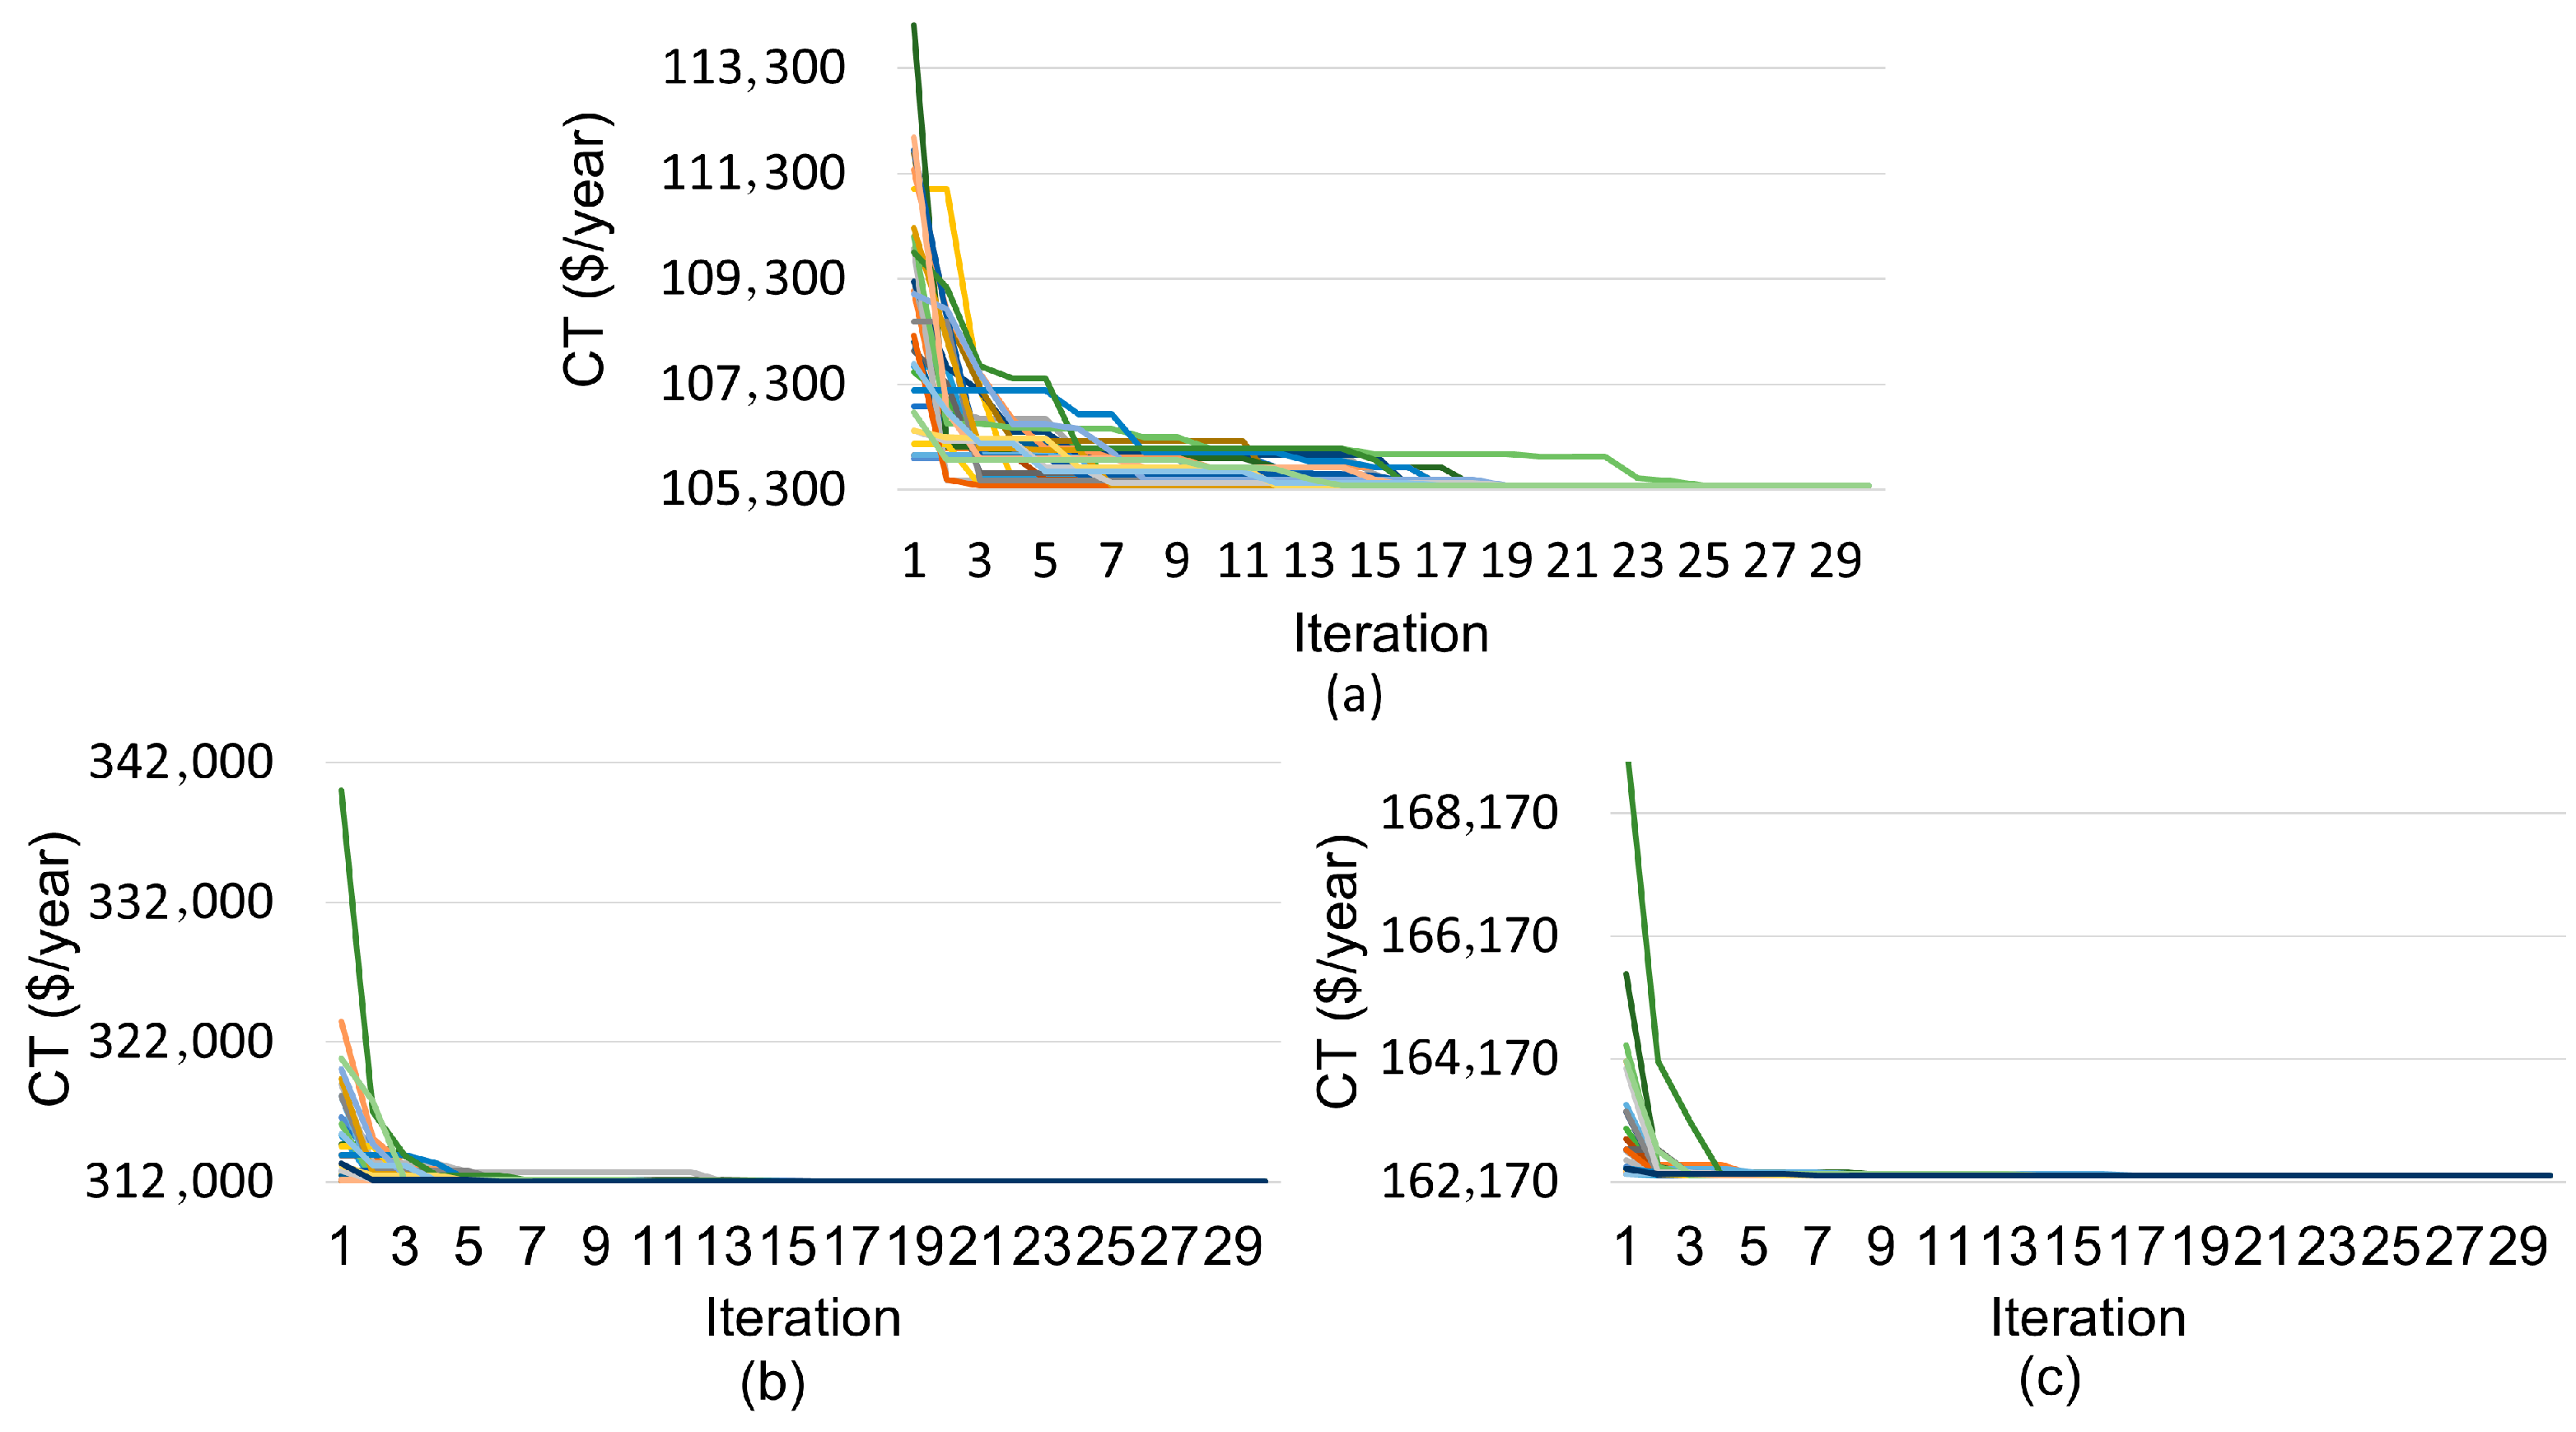
Figure 18 and
Figure 19 present the convergence curves of the 30 runs for each algorithm in the different configurations, while
Figure 20 reinforces this evidence by demonstrating the superior convergence and stability of PSO. These results confirm that PSO is more robust, stable, and effective in solving the optimal sizing problem, with particular emphasis on the PV/WT/Btt/DG configuration.
4.6. Application of the Optimal Solution
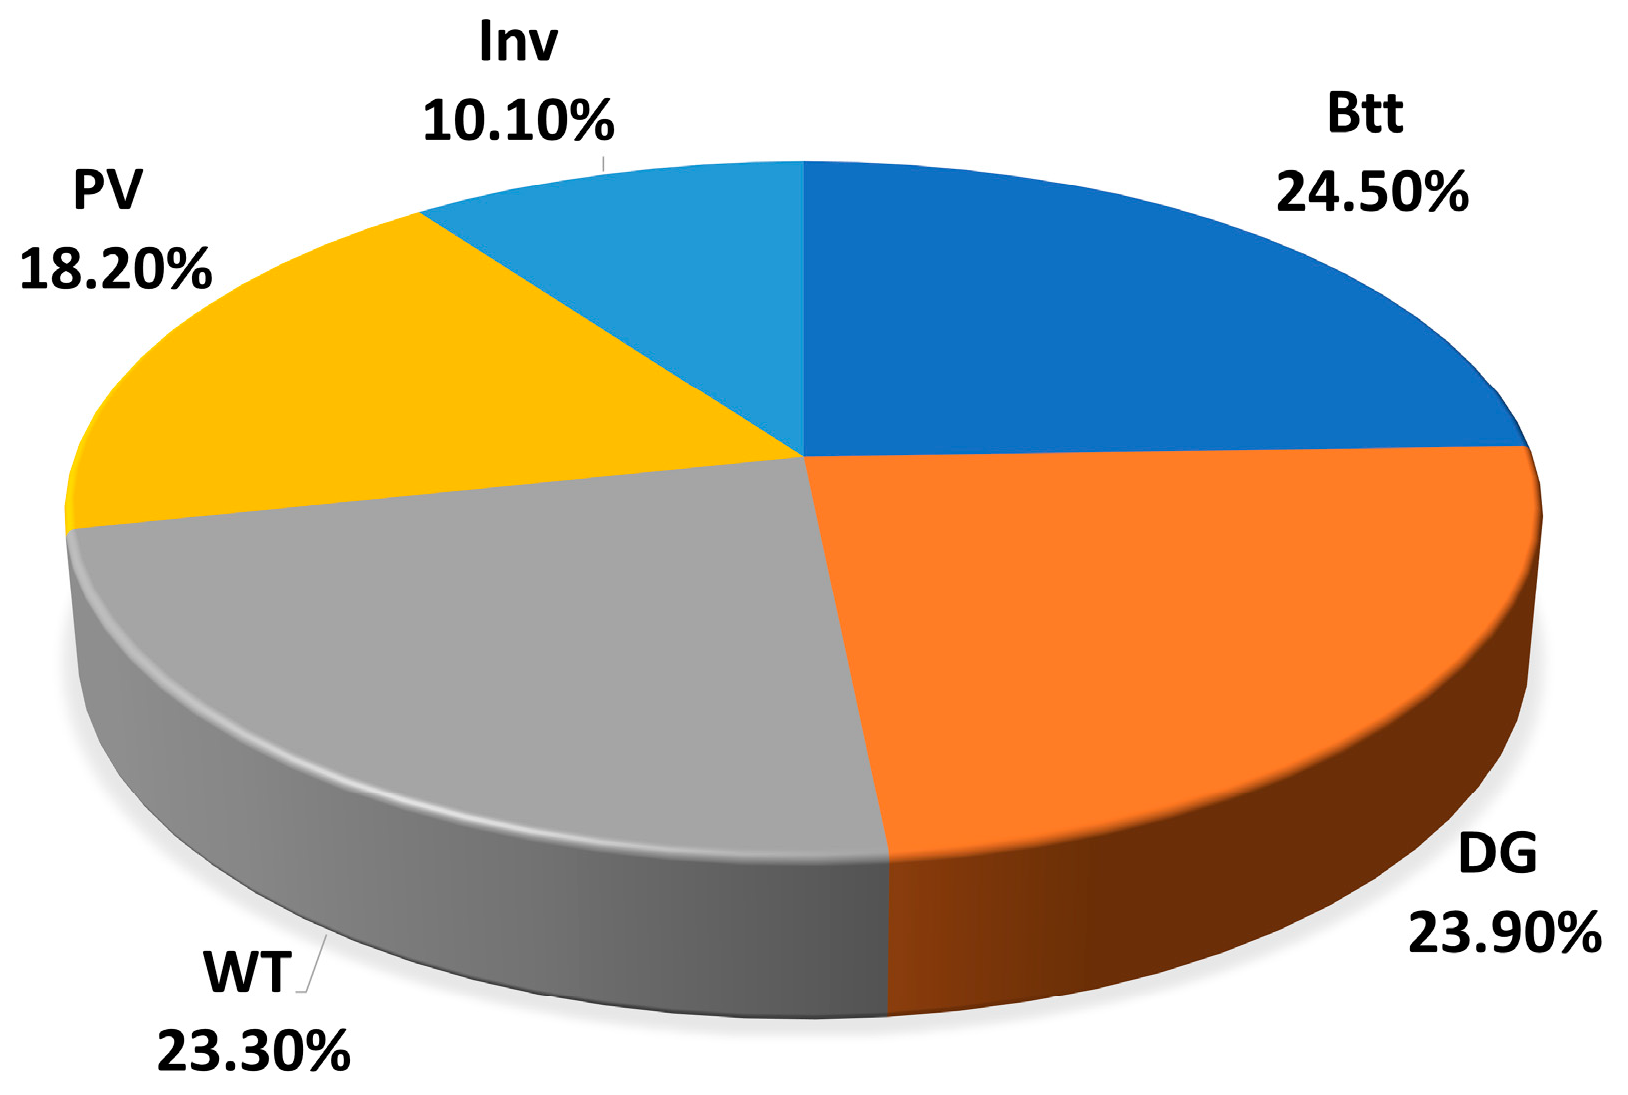
Figure 21 illustrates the percentage distribution of the CT among the components of the HES in the PV/WT/Btt/DG configuration, as optimized by the PSO algorithm. It is observed that the Btt accounts for the largest share of the cost, at 24.50%, reflecting both the initial investment and the replacement costs over time. The DG accounts for 23.90% of the CT, primarily due to ongoing fuel and maintenance expenses. WT contributed 23.30%, which is significant given their high installation and maintenance costs. PV panels represent 18.20%, showing a lower impact due to their durability and low operational and maintenance costs. Finally, the inverter accounts for 10.10% of the CT, being essential for energy conversion within the system. This cost distribution highlights the importance of carefully considering the economic contribution of each component to achieve efficient and financially viable system sizing.
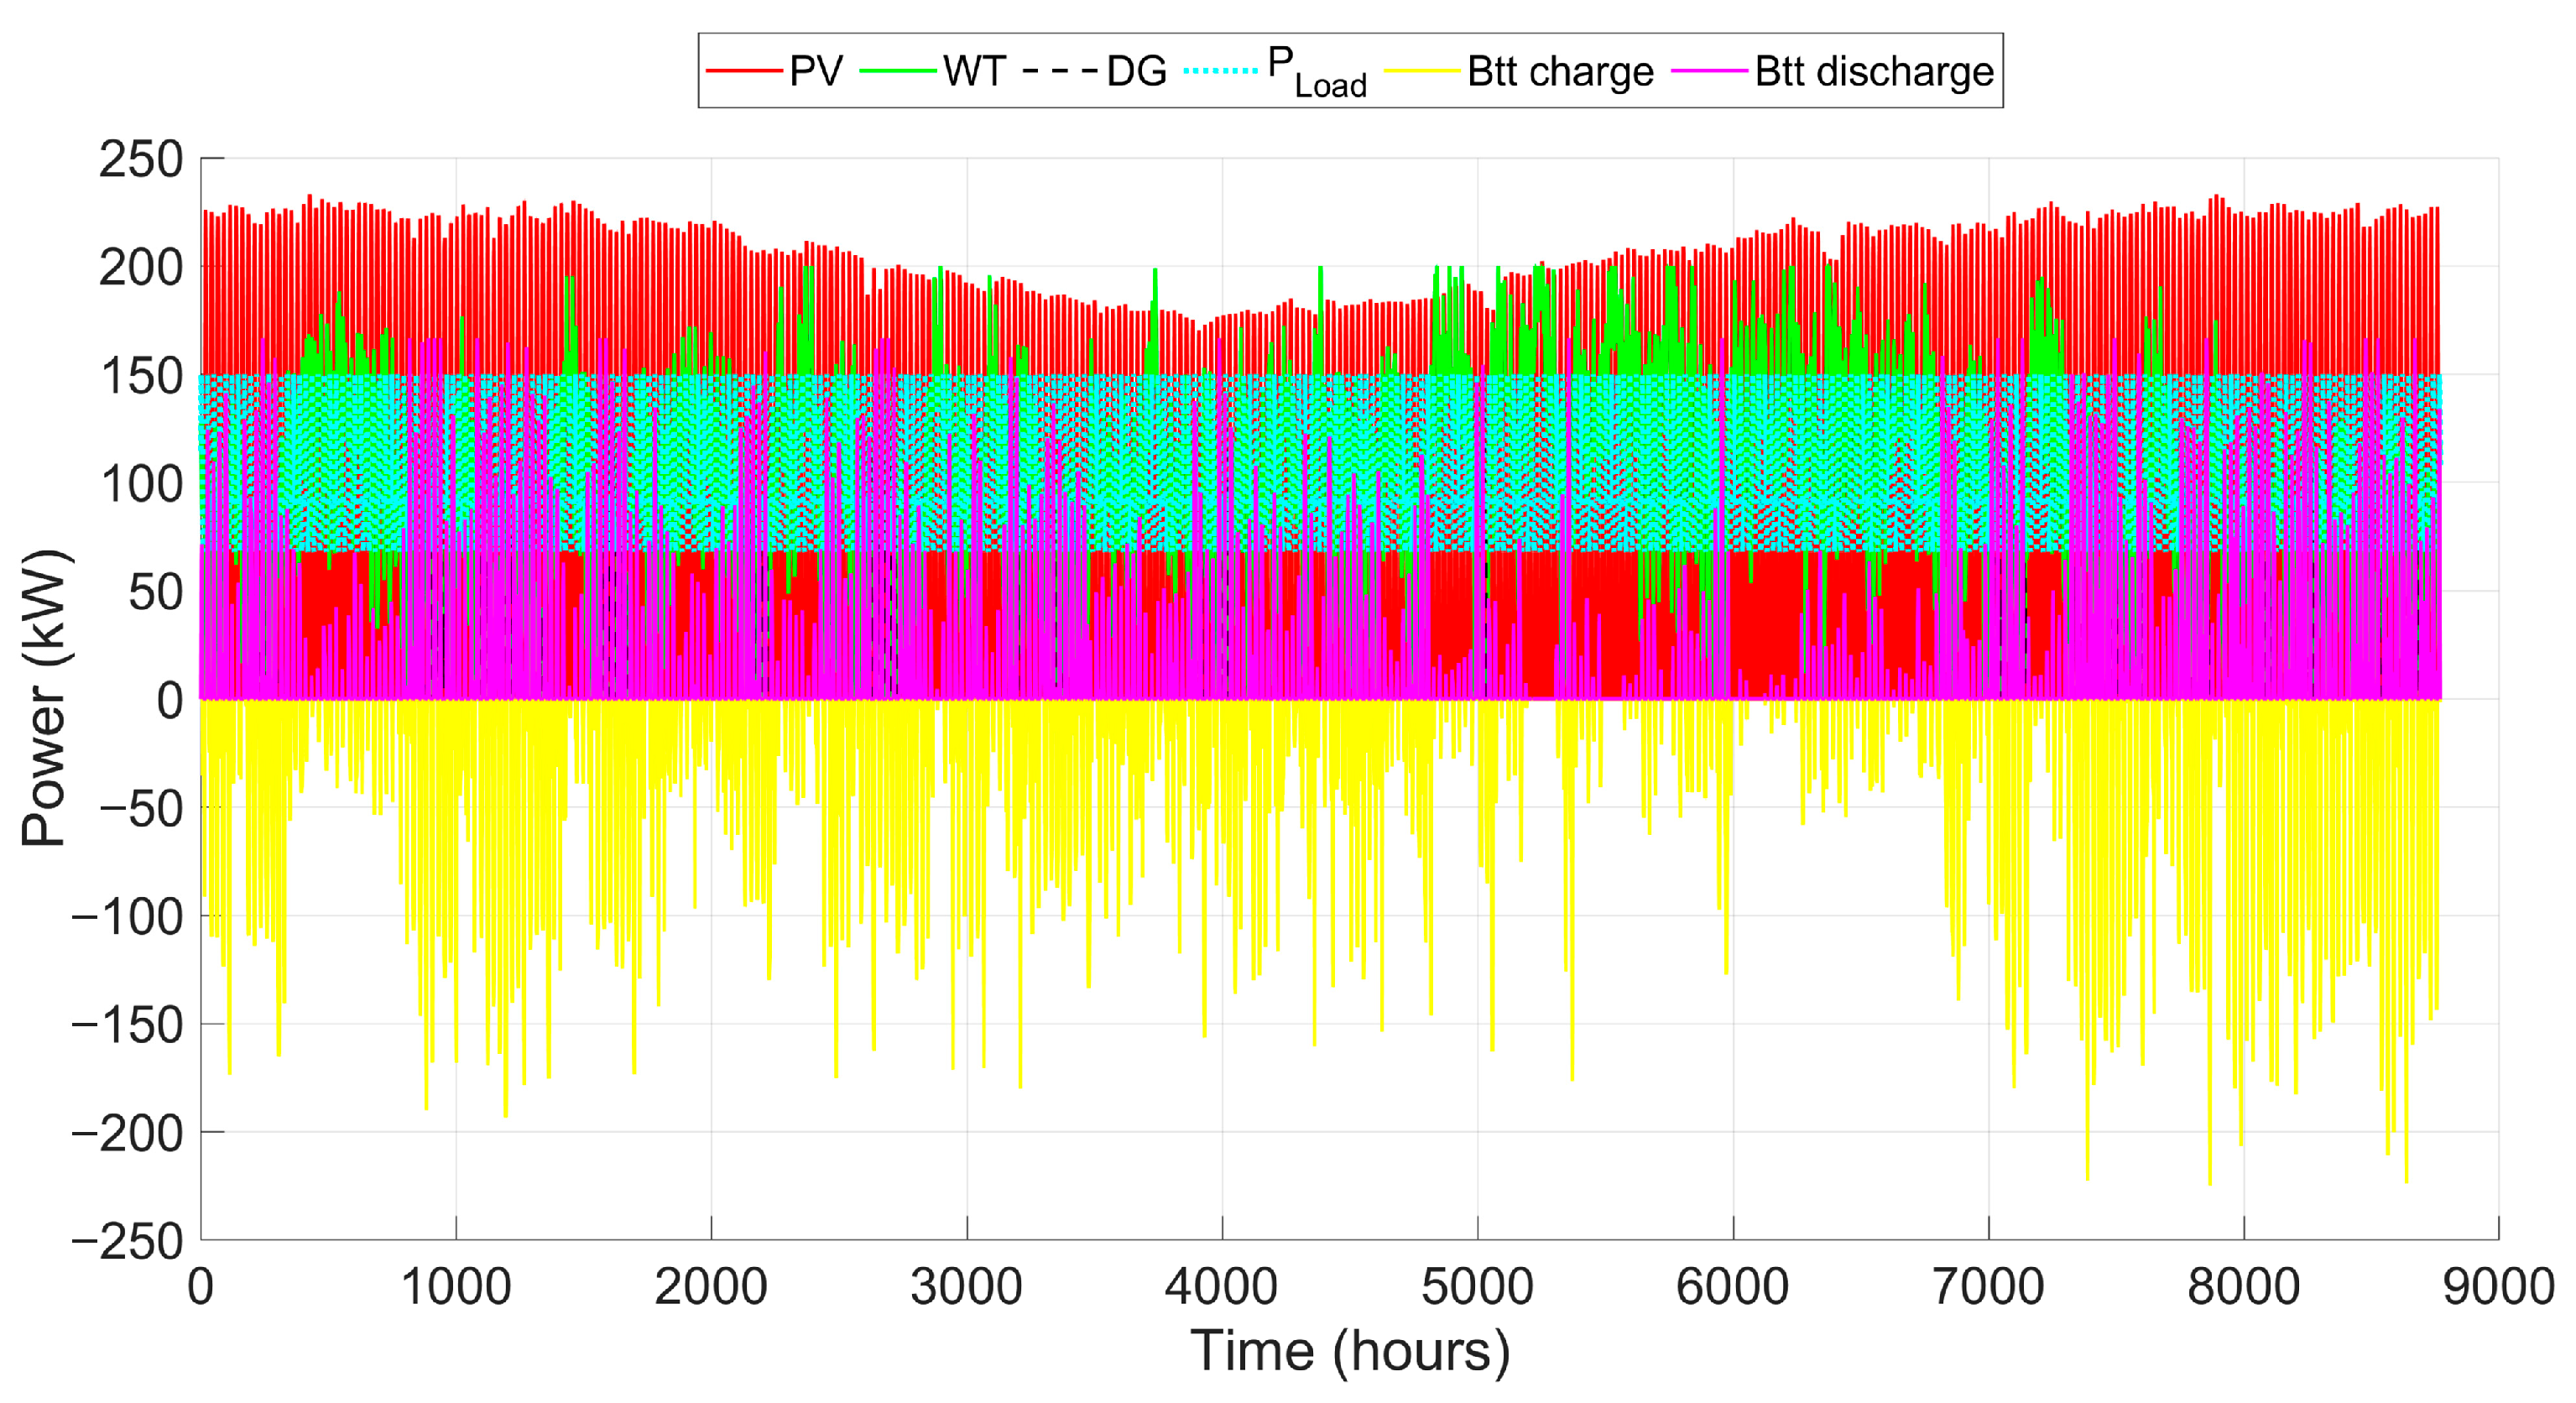
Figure 22 presents the annual energy generation cycle of the HES components in the configuration optimized by the PSO algorithm, along with the load demand profile. Throughout the year, the total energy generation by the system was estimated at 1493.91 MWh.
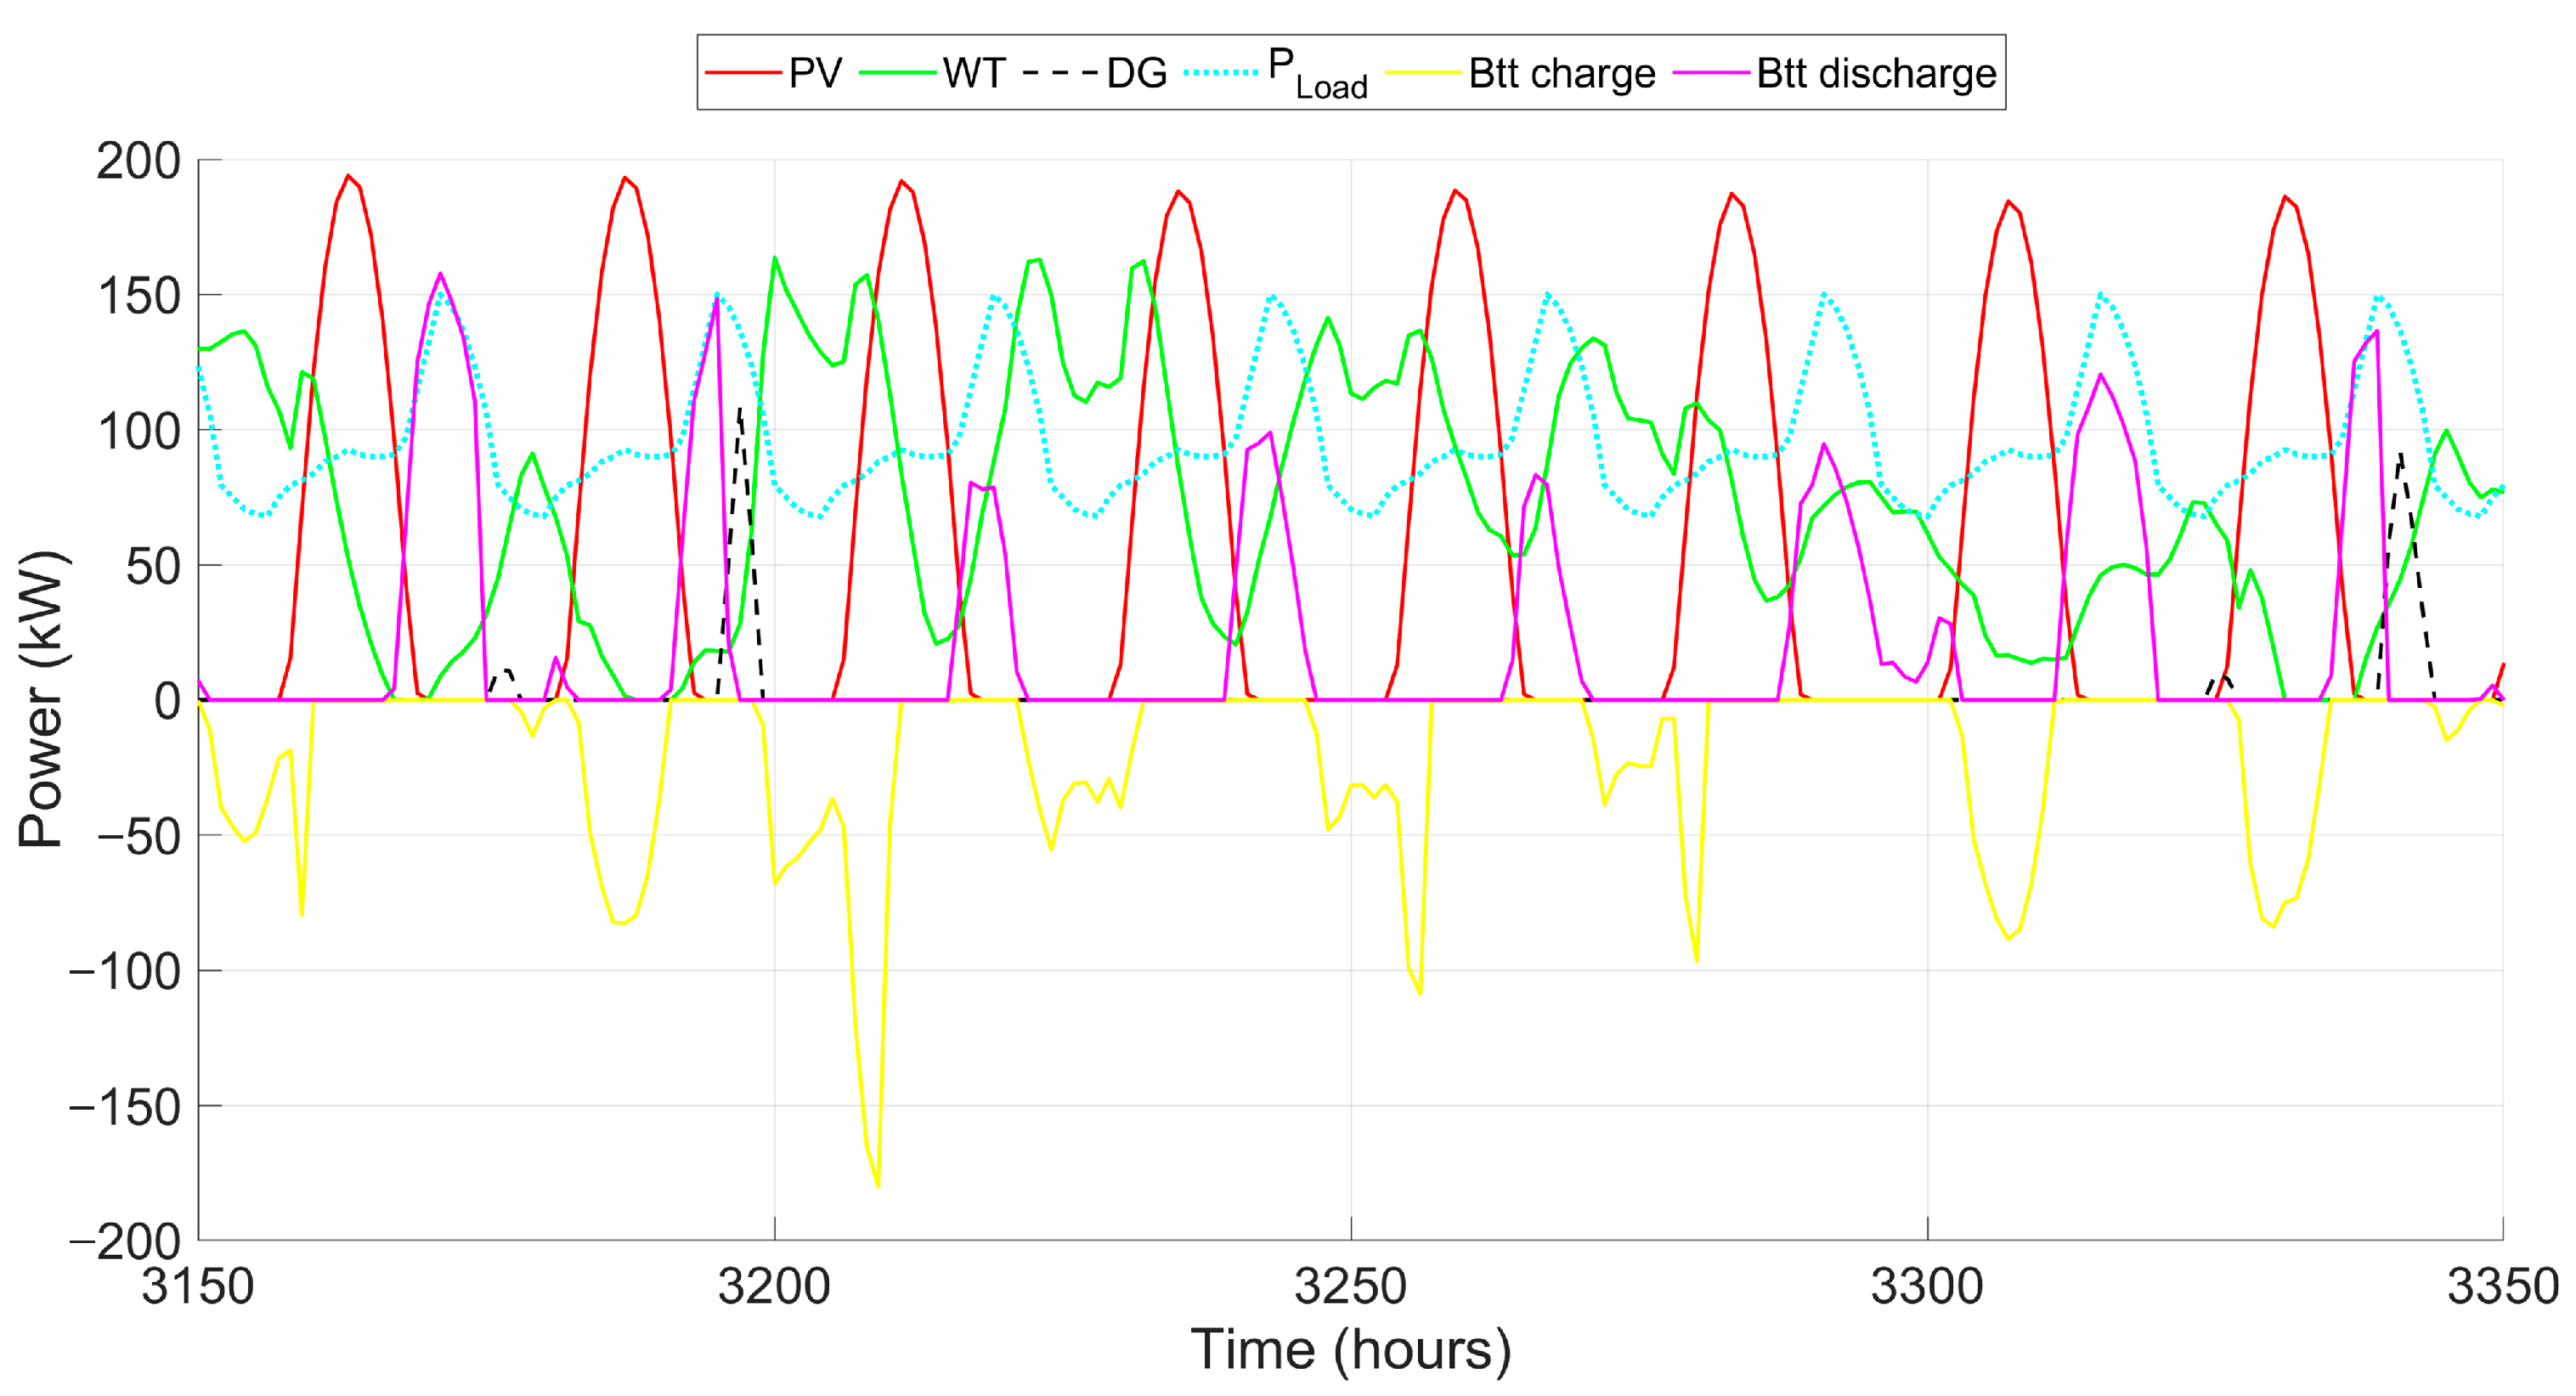
To improve the understanding of the system components’ operation, a 200 h sample was extracted from
Figure 22 and is shown in
Figure 23. In this interval, the combined operation of the four components (PV, WT, Btt, and DG) is illustrated to meet the energy demand (
curve). The photovoltaic power output (red line) varies according to solar irradiance, peaking during the day and dropping to near zero at night. Similarly, wind power generation (green line) fluctuates with wind speed and may occasionally exceed the demand. When the sum of solar and wind power exceeds the load, the surplus is allocated to battery charging (yellow curve, representing charging). In periods where renewable sources do not fully meet the load, the batteries discharge (pink curve) to supply part of the energy. If a deficit still exists, the diesel generator (black dashed line) activates to bridge the gap, ensuring uninterrupted power supply. This graph highlights the synergy between renewable sources (PV and WT), battery storage, and DG. The load is consistently met throughout the period while minimizing DG usage during high renewable availability, which contributes to reducing fuel costs.
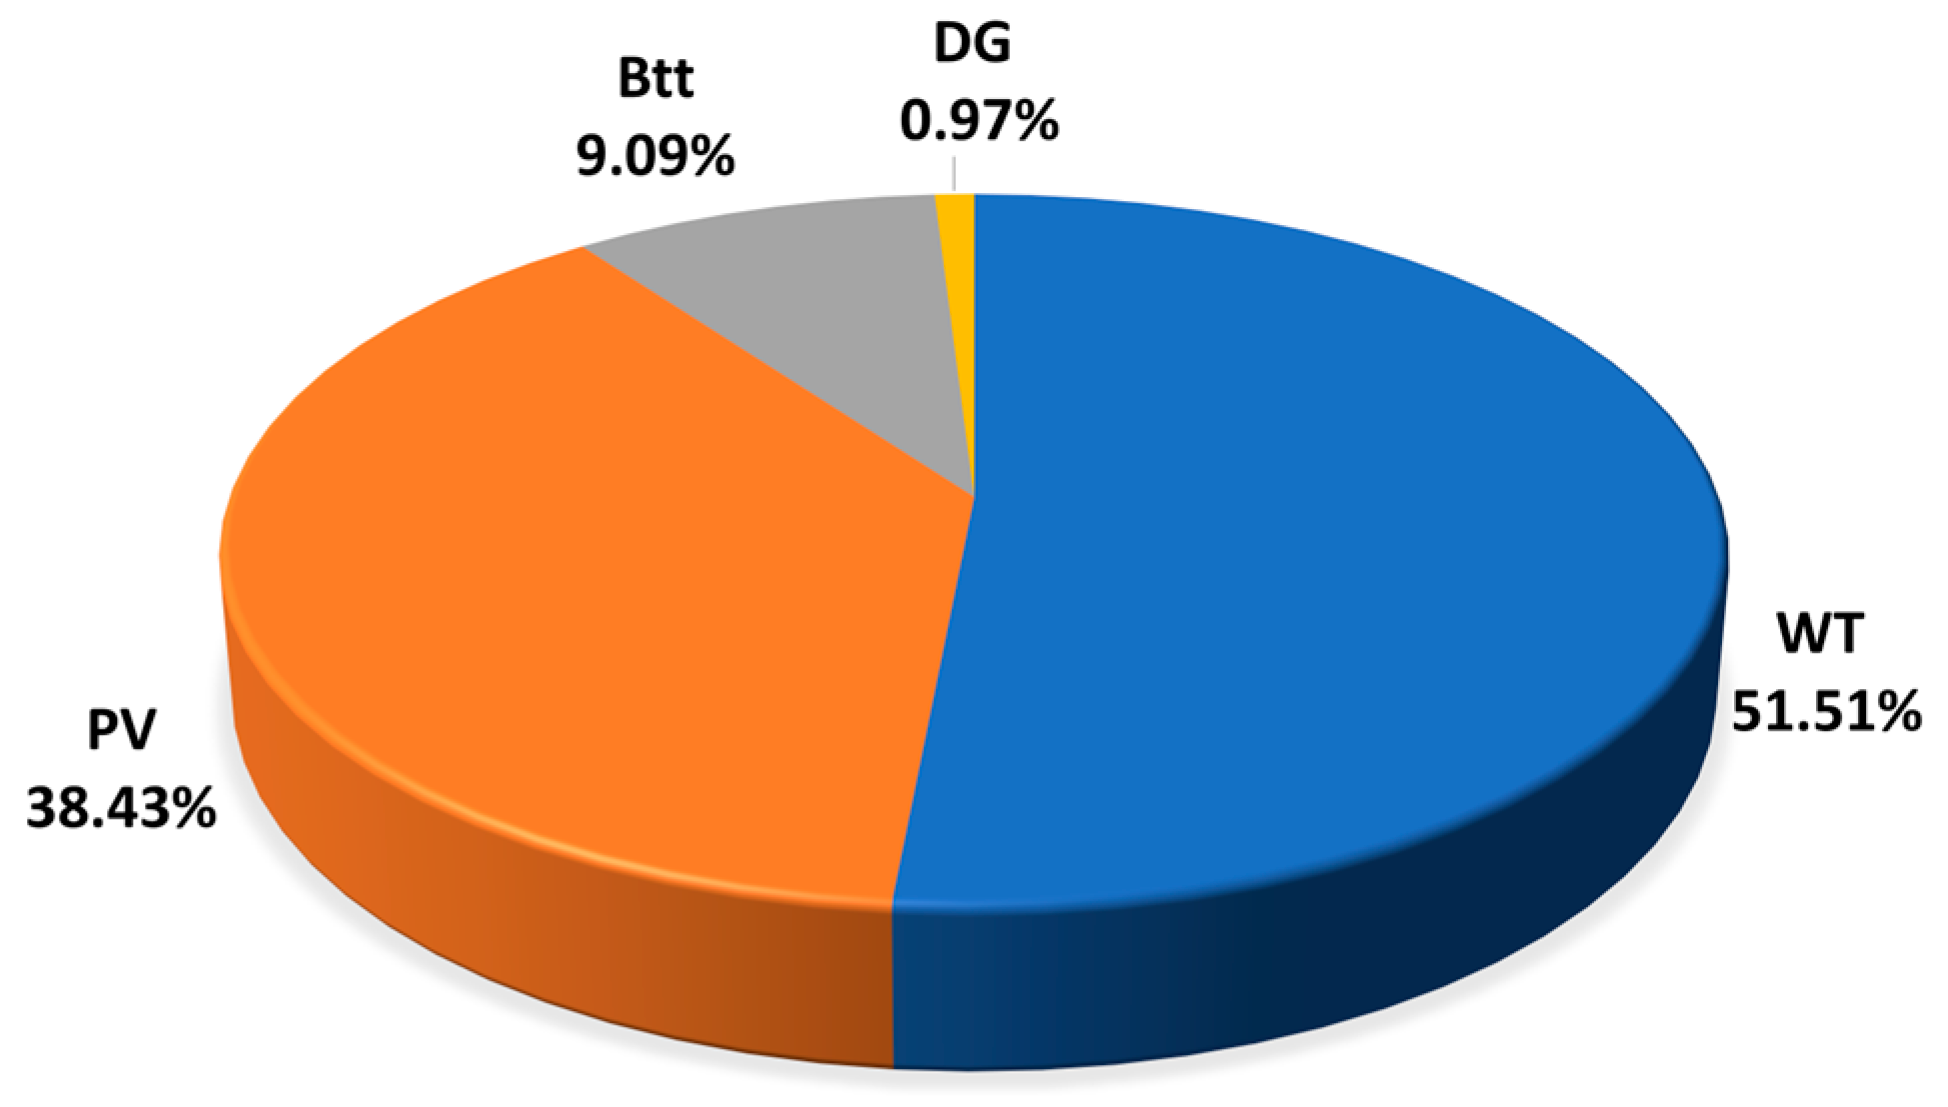
Figure 24 shows the percentage contribution of each HES component in the configuration optimized by PSO. Wind energy was the main source, accounting for 51.51% of the annual generation, followed by solar energy with 38.43%. The battery system contributed 9.09%, while the diesel generator accounted for only 0.97%. Despite the dominance of wind power, the results highlight the essential role of PV and storage in ensuring uninterrupted power delivery and effectively compensating for the variability of renewable sources throughout the year.
Figure 25 shows the variation in the SOC of the batteries, expressed as a percentage, throughout the year. The SOC fluctuates between 10% and 100%, indicating that the control system effectively prevents the batteries from being fully discharged, thus preserving their lifespan. Over the year, the batteries operate dynamically, frequently charging up to nearly 100% during periods of high renewable generation (PV and/or WT) and discharging down to approximately 10% when energy demand exceeds renewable generation. This operating range reflects the efficient and continuous utilization of the storage system, keeping the batteries within safe limits and playing a crucial role in ensuring energy supply stability.
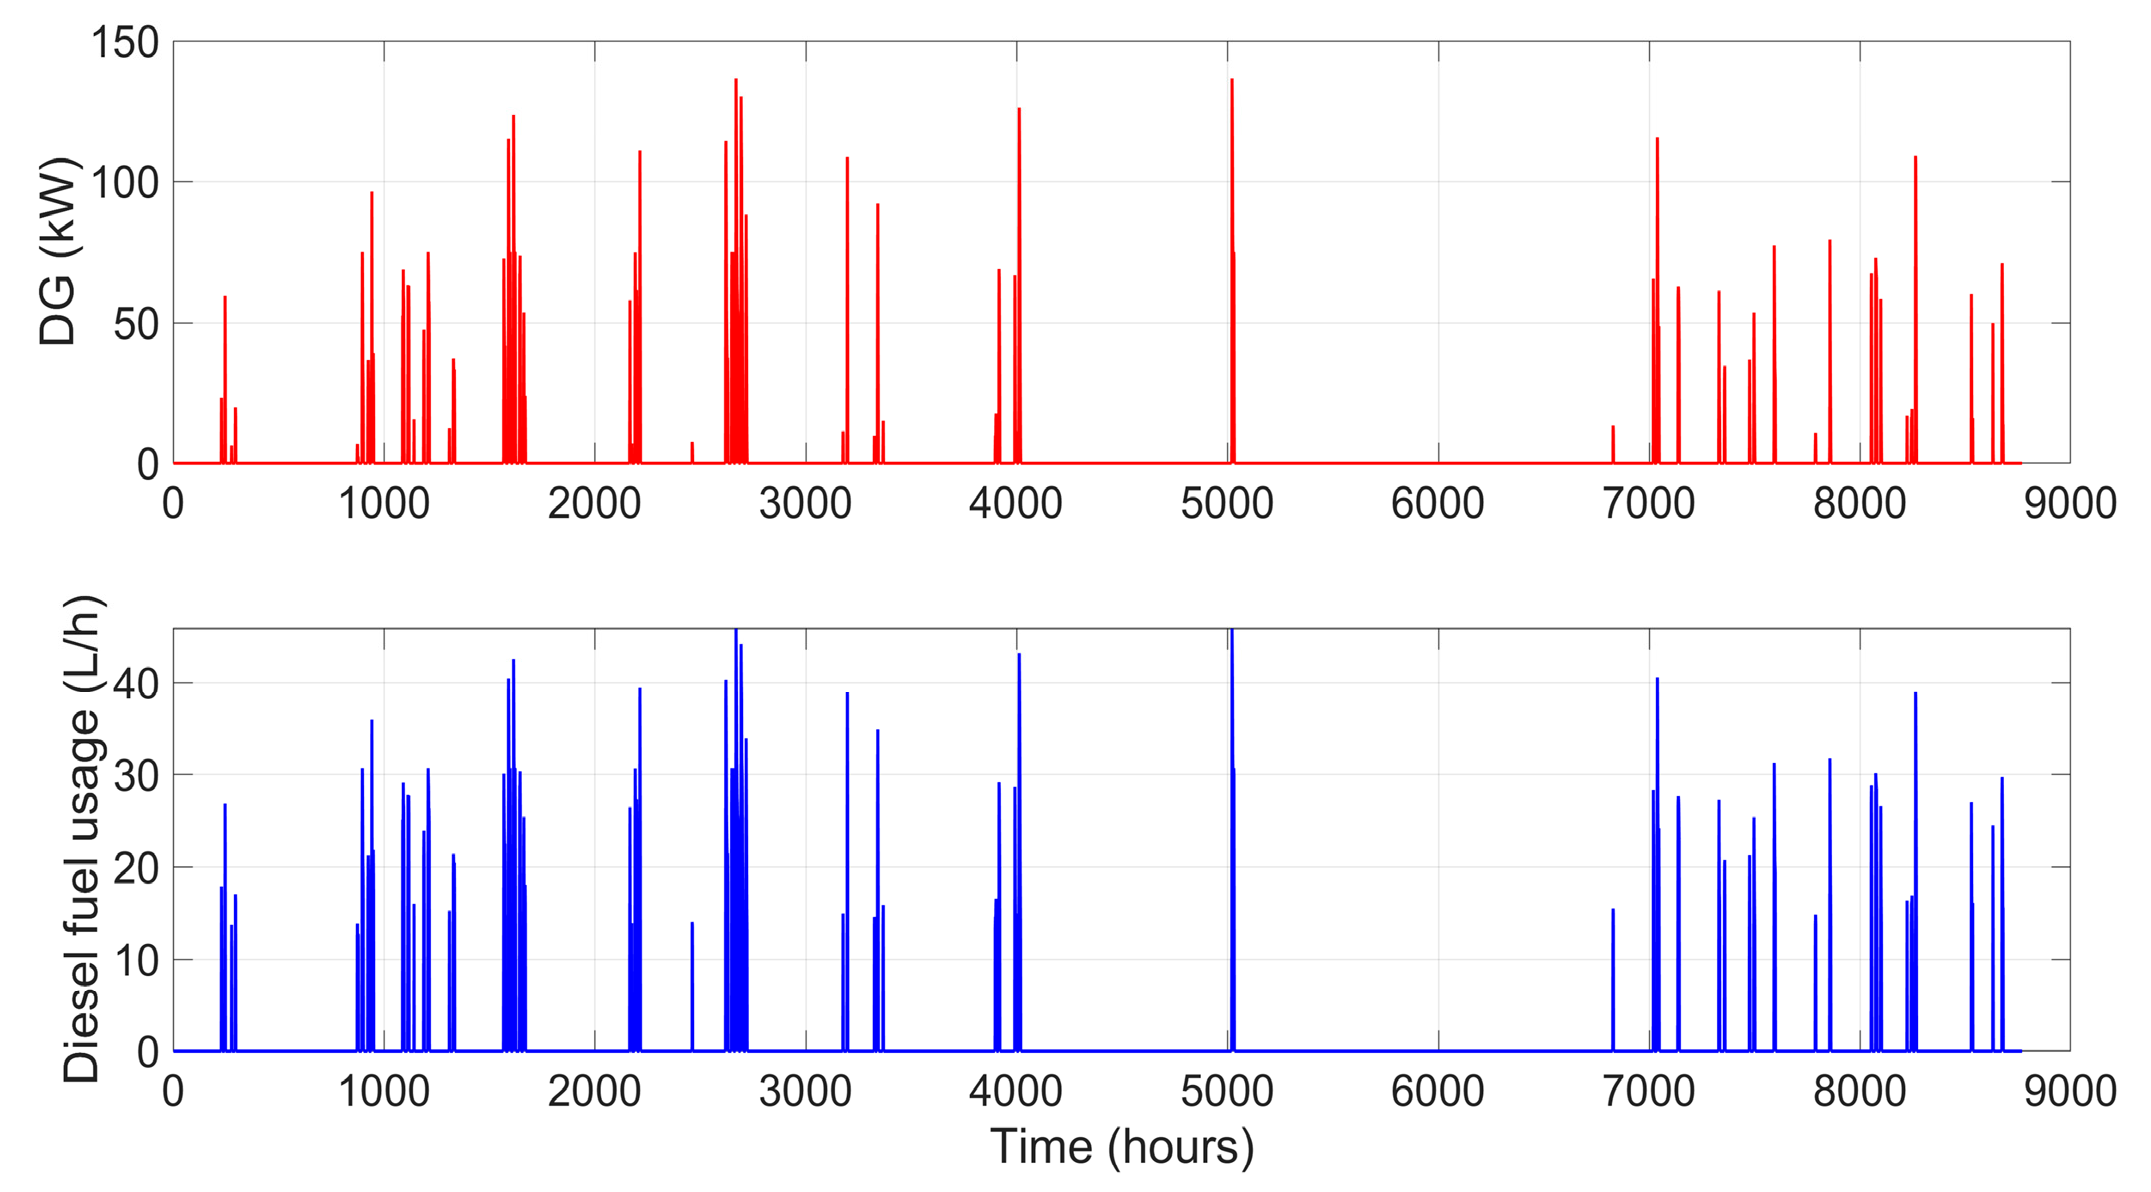
Figure 26 illustrates the annual operation of the DG in the optimized HES, with the upper graph showing power output (kW) and the lower graph indicating fuel consumption (L/h). The DG operates intermittently, being activated only when renewable sources (PV and WT) and the battery system are unable to meet the load demand. Power output peaks can reach up to 150 kW, while diesel consumption follows a similar trend, reaching approximately 50 L per hour during periods of highest demand. For most of the year, the generator remains off, highlighting its role as a backup resource. These results demonstrate the efficiency of the optimized configuration, which prioritizes renewable energy and storage use, significantly reducing dependence on the DG as well as operational and environmental costs.
5. Conclusions
This study proposed an integrated and innovative methodology for the optimal sizing of off-grid HESs, combining long-term meteorological forecasting using a DWT-LSTM model with metaheuristic optimization algorithms (PSO and GA). The application of this methodology to the region of Guanambi, in Bahia, Brazil, demonstrated its effectiveness both in forecasting and in system optimization, highlighting the importance of using advanced forecasting models to enhance HES performance.
The DWT-LSTM forecasting model outperformed the conventional LSTM network, presenting lower RMSE and MSE values, along with R2 coefficients exceeding 0.98, which confirms the advantages of wavelet-based preprocessing in improving predictive accuracy. These improvements directly impacted the quality of the optimization, enabling more reliable energy planning.
Among the three configurations analyzed, the PV/WT/Btt/DG system optimized with PSO achieved the best results in terms of total annual cost (CT = $105,381.17) and cost of energy ($0.1243/kWh). This configuration also delivered the highest total annual generation (1493.91 MWh), with minimal reliance on the diesel generator, leading to reduced fuel consumption and, consequently, lower greenhouse gas emissions and environmental impact. The optimal configuration consisted of 450 PV panels, 10 WT, 66 Btt, and 1 DG. The PSO algorithm showed superior performance over the GA in terms of convergence, accuracy, and repeatability, reinforcing its suitability for HES sizing problems. However, it is important to note that this study assumed a constant daily load profile and did not account for equipment degradation over time, which may limit its real-world applicability.
From a practical standpoint, the proposed methodology is promising for the development of cost-effective and low-emission energy systems in remote or vulnerable areas. To enhance its robustness and applicability, future work should include the following:
Conduct sensitivity analyses to evaluate the impact of uncertainties in input data.
Include component degradation and aging over the system’s lifetime.
Adapt the methodology to different geographic contexts and consumption scales.
Explore multi-objective optimization, balancing economic, environmental, and reliability criteria.
Validate the results through pilot projects or experimental environments.
Expand the analysis to include comparisons with other advanced forecasting models, such as GRU, CNN-LSTM, and hybrid approaches, providing more robust evidence of performance.
Evaluate system performance under different seasonal conditions to enhance the robustness of the methodology.
Incorporate state-of-the-art metaheuristics developed in the last 3–5 years.
