Abstract
The randomness and volatility of wind power increase peak regulation pressure, leading to wind curtailment despite the deep peak regulation efforts of thermal power units. By integrating conventional power source dispatch and high-energy-consuming load configuration, a two-layer optimization model is developed to maximize wind curtailment absorption and minimize thermal power deep peak regulation costs. The model first analyzes the fused magnesium load’s operating characteristics and its dispatch-participation model, then combines with the thermal power deep peak regulation model for hierarchical joint peak regulation. Applying the method to an actual regional system via CPLEX shows that it reduces wind curtailment, optimizes thermal power deep peak regulation, and improves power generation economic efficiency.
1. Introduction
To achieve the “30·60” dual carbon goals and meet the growing electricity demand, China’s wind power industry has developed rapidly, with an average annual growth rate of installed capacity exceeding 20% (data from the National Energy Administration). It is estimated that by 2030, the installed capacity of wind power will reach 800 million kilowatts, accounting for 20% of the country’s total installed capacity [1]. As wind power penetration increases, its randomness, intermittency, volatility, and anti-peak regulation characteristics significantly amplify the peak–valley difference in the system equivalent load (load power minus wind power output) after large-scale grid integration [2,3,4]. The lack of flexible regulation capability in the system further exacerbates the peak regulation pressure on the power system [5].
Research has been conducted both domestically and internationally on integrating high-energy-consumption electrically fused magnesium loads into power grid optimization operations. The literature [6] states that the dispatching of high-energy-consuming loads can be combined with price signals in the power market to achieve the goals of peak shaving and valley filling, as well as reducing system operation costs. The literature [7,8] proposes a method considering the participation of electric-fused magnesium loads in optimal dispatching to reduce carbon emissions. The literature [9] addresses high-energy-consumption loads, such as direct reduction iron furnaces and electric arc furnaces. This study develops a low-carbon integrated energy system model tailored for steel industrial parks. A corresponding park-level scheduling methodology is proposed to coordinate the optimization of multi-energy flows with flexible industrial processes. The aforementioned studies collectively demonstrate that high-energy-consumption loads play a significant role in enhancing the operational flexibility of power systems and promoting decarbonization. In contrast, the two-layer collaborative optimization model for electric-fused magnesium high-energy-consumption loads and thermal power units proposed in this paper deeply integrates such loads into the dispatch framework of power systems with high penetration of wind power.
At present, thermal power units remain the main peak regulation resources in China’s power system [10,11]. In recent years, thermal power units have achieved significant deep peak regulation capabilities through flexibility retrofits, thermal power decoupling, and other technologies [12,13,14]. Although the literature [15,16] proposes a day-ahead market and optimal dispatch model considering deep peak regulation to reduce costs, and the literature [17,18] investigates the deep peak regulation characteristics of coal-fired power plants to develop a low-carbon economic dispatch model that simultaneously improves system economy and reduces carbon emissions, the existing studies exhibit insufficient modeling of thermal power units’ participation in deep peak regulation. They fail to systematically account for the multi-stage cost composition during deep peak regulation processes and overlook the actual operating conditions of thermal power units in peak regulation scenarios. The comparison of this article with existing articles is shown in Table 1.

Table 1.
Comparison with the existing literature.
2. Analysis of Electric-Fused Magnesium Load-Absorbing Wind Power Principle
2.1. Operation Mode of Electric-Fused Magnesium Furnace
The electric-fused magnesium furnace is a high-energy-consuming industrial device. As shown in Figure 1, it converts electrical energy into thermal energy via an electric arc for smelting. Its core control objective is to maintain constant smelting current and power by adjusting the electrode position. Therefore, its operating power can be adjusted quickly and accurately within a certain range without affecting product quality. This adjustable power characteristic makes it a high-quality, flexible industrial load resource.
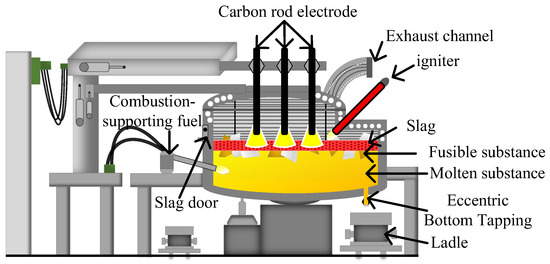
Figure 1.
Structure and flexible regulation principle of the electric-fused magnesium furnace load.
2.2. Model of the Load Regulation Characteristics of Electric-Fused Magnesium Furnace
The formulas of the high-energy-consuming load model of the electric-fused magnesium furnace are shown in Formula (1) and (2) as follows:
Equation (1) describes the active power consumed by each electric-fused magnesium furnace. Equation (1): PtMg,k is the operating power of the k-th electric-fused magnesium furnace at time t; UtMg,k and ItMg,k are the smelting voltage and smelting current values of the k-th electric-fused magnesium furnace at time t, respectively; cos φ is the power factor of the electrical system of the electric-fused magnesium furnace.
Equation (2) defines the total power of all electric-fused magnesium furnace loads in the system, where PtMg base is the normal operating power of a single furnace at time t; NMg is the total number of operational furnaces in the enterprise; NtMg,adj is the number of furnaces available for regulation; ΔPtMg,k represents the power regulation margin of a single electric-fused magnesium furnace (ΔPtMg,k > 0 for power increase, ΔPtMg,k < 0 for decrease); StMg,k is a state variable (StMg,k = 1, indicates active regulation, StMg,k = 0, indicates no regulation).
In the electric-fused magnesium furnace smelting process, dynamic interval constraints on single-furnace active power, with upper and lower limits as shown in Formula (3), are required to prevent power overload-induced splashing accidents and ensure product qualification:
In Formula (3), PtMg,kmax and PtMg,kmin are the maximum and minimum values of the active power of the k-th electric-fused magnesium furnace, respectively.
2.3. Analysis of the Principle of Electric-Fused Magnesium Load-Absorbing Wind Power
Figure 2 illustrates the principle of the high-energy-consuming load of the electric-fused magnesium furnace participating in the consumption of wind power.
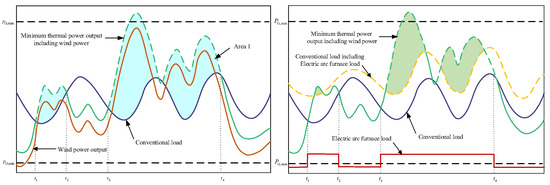
Figure 2.
Electric-fused magnesium load participating in wind power absorption.
In Figure 2, PG,max and PG,min denote the thermal power plant’s output limits, with its adjustable range between the upper and lower black dotted lines. The grid’s wind power accommodation capacity depends on the difference between load and thermal output, shown as the area between the sum of wind power and the minimum output of thermal power (the green curve) and the load.
During peak consumption (e.g., daytime), wind speed is often low or unstable, while at night or in the windy season, it is stronger, but load levels are low, creating wind power’s reverse regulation characteristic. As shown in t1~t2 and t3~t4 of Figure 2, low-load periods have the lowest wind accommodation and are prime times for curtailment. When large-scale wind power exceeds thermal plants’ regulation range, fully absorbing it increases thermal units’ deep peak regulation pressure, risking shutdowns. To ensure system safety and economy, grids cannot always absorb all wind power, causing curtailment, especially during low-load and high thermal output. By comparison, when the sum of minimum thermal power and wind power exceeds load consumption, the high-energy-consuming electric-fused magnesium furnace load’s participation in regulation reduces the power system’s wind curtailment area from the left light blue region to the right light green region, as Equation (4) shows:
In the formula, PtMg = 0 indicates that the high-energy-consuming load of the electric-fused magnesium furnace does not participate in the consumption of wind power, and PtMg = 1 indicates that the high-energy-consuming load of the electric-fused magnesium furnace participates in the consumption of wind power.
The high-energy-consuming load of the electric-fused magnesium furnace has enormous adjustment potential and consumption benefits. When conventional power sources fail to meet the fluctuations in wind power output and the load demand, the high-energy-consuming load of the electric-fused magnesium furnace can be activated to ensure power balance. As a result, it can enhance the wind power consumption capacity and reduce wind curtailment.
3. Two-Layer Source–Load Coordination Optimization Model
3.1. The Upper-Layer Model
The main objective of the upper-layer optimal scheduling model is to minimize the wind curtailment power in the system as much as possible, based on satisfying various constraints, such as those of thermal power plants, wind power plants, and loads. The objective function of the upper-layer optimal model is Equation (5):
In Equation (5), T is the number of time periods in the day-ahead scheduling cycle, and its value is taken as 24; PtW is the total active power output of all wind power plants in time period t; PtG is the total active power output of all thermal power plants in time period t; PtL is the active power of the system’s conventional load in time period t; NMg is the number of electric-fused magnesium furnaces.
The constraint conditions include the day-ahead power balance constraint of the system, the operation constraint of the thermal power plant, the upper and lower limit constraints of the day-ahead output of wind power, the upper and lower limit constraints of the adjustment power of the electric-fused magnesium load, and the number of load adjustment times of the electric-fused magnesium furnace, etc.
- 1
- The active power balance constraint within the system:
- 2
- The constraint conditions for the day-ahead output of wind power:
In the formula: Ptfore is the predicted total active power output of the wind farm in time period t.
- 3
- The constraint conditions for the output of the thermal power plant.
The upper and lower limit constraints of the day-ahead output power of thermal power:
The ramp rate constraint of the day-ahead output of thermal power:
In the formula: PtG is the total active power output of all thermal power plants in the time period t; PtGcli,max and PtGcli,min are, respectively, the maximum value and the minimum value of the total ramp rate of all thermal power plants on a day-ahead basis.
- 4
- The upper and lower limit constraints of the adjustment power of the electric-fused magnesium load:
In the formula, ΔPtMg,max and ΔPtMg,min are the maximum and minimum allowable power, respectively, for the electric-fused magnesium furnace’s high-energy-consuming load.
- 5
- The constraint on the number of adjustment times of the electric-fused magnesium load:
In the formula, during the production process of the electric-fused magnesium furnace, the number of adjustments should be less than its maximum number of adjustments M.
3.2. The Lower-Layer Model
3.2.1. The Deep Peak Regulation Cost Model of Thermal Power Units
Figure 3 presents the schematic diagram for the deep peak regulation of thermal power units, where Pi,max denotes the maximum technical output, Pi,a represents the minimum technical output for conventional operation, and Pi,b and Pi,c correspond to the minimum outputs for the first and second stages of deep peak regulation, respectively.

Figure 3.
Schematic diagram of deep peak regulation of thermal power units.
When the output of the thermal power unit is between Pi,max and Pi,a, the thermal power unit is in the conventional peak regulation state; when the output is between Pi,a and Pi,b, the thermal power unit is in the first stage of deep peak regulation state; an output between Pi,b and Pi,c indicates the second deep peak regulation stage, while zero output signifies a shutdown state.
- Coal consumption cost.
When the thermal power unit operates within the conventional peak regulation load range (usually within the range of 50% to 100% of the rated load), its operating characteristics are mainly manifested as the fuel consumption rate under the reference operating condition. Under this operating condition, only the conventional coal consumption cost is considered, and the calculation is as follows:
In the formula, ai, bi, and ci are the coal consumption characteristic coefficients of unit i after economic conversion; Pi,t is the generated power of the thermal power unit.
- 2.
- Additional costs in the deep peak regulation stage.
When a thermal power unit enters a deep peak regulation state, its operating costs are no longer limited to conventional coal consumption. A comprehensive deep peak regulation cost model should integrally consider the following four components: (1) equipment wear cost (Equations (13) and (14)); (2) auxiliary fuel cost (Equation (15)); (3) environmental additional cost (Equation (16)); and (4) electricity quantity loss cost (Equation (17)). Therefore, the total additional cost for deep peak regulation of a single unit is the sum of the above items (Equation (18)).
When the thermal power unit is in the deep peak regulation stage, due to the low-cycle fatigue loss and creep loss under the action of alternating stress, there exists the wear cost of the unit. The wear cost of the i-th thermal power unit at time t can be calculated according to Formula (13):
In Formula (13), Fi,tabr is the wear cost for deep peak regulation; Ni,t(Pi,t) is the number of cycles causing rotor cracking, which can be calculated by the Manson–Coffin formula [19]; Funit is the purchase cost of the unit; τ is the actual operation loss coefficient of the unit; in this paper, when considering the two-stage deep peak regulation of the unit, τ1 and τ2 are the wear coefficients of the first stage and the second stage, respectively.
Moreover, when thermal power units enter the second-stage deep peak regulation mode, boiler combustion stability may be affected, requiring auxiliary combustion (e.g., oil injection or plasma ignition) and increasing combustion-supporting costs. While most units incur no such costs at 35% peak regulation depth due to flexibility retrofits, deeper regulation depths and a complete cost system necessitate accounting for combustion-supporting costs during deep peak regulation:
In Formula (15), Fioil is the combustion-supporting cost for deep peak regulation; Hioil is the fuel oil consumption of unit i; poil is the oil price in the current season.
China requires coal-fired plants to install efficient desulfurization and denitrification devices during flexibility retrofits to comply with “Thermal Power Plant Air Pollution Emission Standards” for SO2 and NOX. However, in second-stage deep peak regulation, environmental equipment efficiency may decrease, leading to excessive emissions and fines. Thus, the i-th unit’s additional environmental cost at time t is described by Formula (16):
In Formula (16), Fi,tev is the additional environmental cost; pS and pN are, respectively, the fines for excessive emissions of SO2 and NOX per unit volume of gas; VS and VN are, respectively, the emission standards for SO2 and NOX per unit volume of gas; ΔλSi,t and ΔλNi,t are, respectively, the rates of excessive emissions of SO2 and NOX.
Notably, the revenue loss of thermal power units during deep peak regulation is often overlooked. This loss should be treated as an opportunity cost and included in thermal power generation’s cost system, calculated as follows [20]:
In Formula (17), Fi,tloss is the cost of lost electricity revenue; Cprice,GC is the on-grid electricity price of the thermal power unit; Ti,dp represents the set of time periods during which the i-th thermal power unit conducts deep peak regulation.
Therefore, the additional cost of deep peak regulation of the thermal power unit can be calculated as follows:
In Formula (18), Fi,tdp is the total deep peak regulation cost of thermal power units.
- 3.
- Compensation revenue during the deep peak regulation stage.
At the same time, due to the participation of the thermal power unit in deep peak regulation, it can receive compensation from the power grid company according to the compensation price per unit of electricity Ccom. Then the compensation revenue is as follows:
3.2.2. Objective Function
The lower-layer model, based on minimizing the wind power curtailment in the upper-layer model, optimally arranges the peak regulation structure of each thermal power unit according to the optimized wind power consumption, the power of the high-energy-consuming load of electric-fused magnesium, and the total output of thermal power. The objective is to minimize the system operation cost, which is as follows:
3.2.3. Constraints
The constraints include the power balance of each thermal power unit, the output constraints, and the ramp rate constraints.
- Power balance constraint of thermal power units:
- 2.
- Output constraint of thermal power units:
In the formula: Pi,min and Pi,max are, respectively, the minimum output and the maximum output of the thermal power unit i. In this paper, the lower limit of the output of the thermal power unit takes into account its two-stage deep peak regulation.
- 3.
- Ramp rate constraint of thermal power units:
In the formula, Pi,up and Pi,down are, respectively, the upward ramp rate and the downward ramp rate of the thermal power unit i during conventional peak regulation. Pi,gramp and −Pi,gramp are, respectively, the upward ramp rate and the downward ramp rate of the thermal power unit i participating in deep peak regulation.
- 4.
- Output constraint of units for deep peak regulation:
4. Solution Method
Two-layer optimization is a nested optimization that involves two layers of optimization tasks with a hierarchical relationship, where the lower-layer optimization optimizes its own objective function based on the solution provided by the upper-layer decision-making. This paper establishes a two-layer optimization model to describe the source–load coordination optimization problem of high-energy-consuming electric-fused magnesium loads participating in wind power consumption. The proposed hierarchical relationship model between the upper and lower layers is shown in Figure 4.
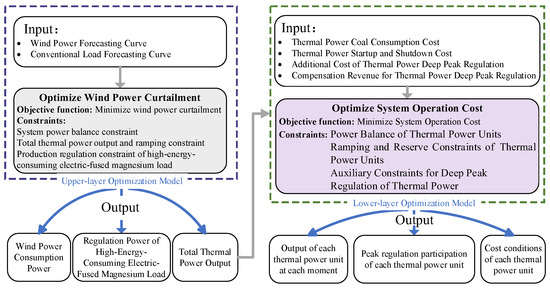
Figure 4.
Bi-level optimization model for synergizing renewable integration capacity and economic efficiency.
The left part of the figure represents the upper-layer optimization model: Inputs include wind power and conventional load forecasts. The objective is to minimize wind curtailment, with constraints encompassing power balance, upper and lower limits of wind power output, thermal power unit output, and ramp rate restrictions. The outputs are the system’s wind curtailment and total thermal power output.
The right part of the figure corresponds to the lower-layer optimization model: It takes the total thermal power output from the upper-layer model as input. The goal is to minimize the total cost of thermal power units, and the final output includes the breakdown of various cost components and the total cost.
The hierarchical optimization model established in this paper belongs to a mixed-integer nonlinear programming (MINLP) problem at the lower level. In order to reduce the difficulty of solving the problem, linearization is required. Equation (12) of the lower-layer model is processed by piecewise linearization [21]. This transformation converts the original MINLP formulation into a mixed-integer linear programming (MILP) model. Finally, the commercial solver CPLEX 12.10 is used for solving it based on the Python 3.7 environment.
5. Analysis of Calculation Examples
5.1. Assumptions Section
Taking an actual regional system as an example to verify the effectiveness of the proposed model. The power supply structure of the system is shown in Table 2, and some operational parameters of the thermal power units are presented in Table 3.

Table 2.
Composition structure of the source and load.

Table 3.
Partial operational parameters of thermal power units.
All dispatched thermal power units, G1 through G10, have completed flexibility retrofitting and now possess two-stage deep peak regulation capability. Their minimum technical output Pi,a, first-stage deep peak regulation minimum output Pi,b, and second-stage deep peak regulation minimum output Pi,c are consistently maintained at 50%, 40%, and 30% of the rated power, respectively. The retrofitted units exhibit no degradation in peak regulation capacity due to equipment aging, ensuring reliable long-term participation in deep peak regulation operations.
The wear cost calculation during deep peak regulation of thermal power units employs fixed wear coefficients. For the first-stage deep peak regulation, the wear coefficient τ1 is 1.2, while for the second-stage deep peak regulation, the wear coefficient τ2 is 1.5 [22,23]. This methodology is derived from the Manson–Coffin fatigue life theory. The current model does not account for dynamic effects of unit operational history or start–stop cycles on wear coefficients. Future research should incorporate long-term operational data to develop optimized time-varying wear models.
All thermal power units have been equipped with high-efficiency desulfurization and denitrification systems. During conventional operation and first-stage deep peak regulation, the environmental protection equipment efficiency complies with the Thermal Power Plant Air Pollutant Emission Standards, incurring no additional emission penalties. Only during second-stage deep peak regulation does the efficiency of environmental protection equipment decrease, resulting in fixed exceedance rates of 5% for both SO2 and NOX emissions, denoted as ΔλSi,t and ΔλNi,t, respectively. The corresponding penalty rates for emission exceedance are set at pS = 667 yuan/(mg/m3) for SO2 and pN = 842 yuan/(mg/m3) for NOX [24,25]. The compensation standards for the two-stage deep peak regulation are set at Ccom-1 = 250 yuan/(MWh) for the first stage and Ccom-2 = 500 yuan/(MWh) for the second stage. The feed-in tariff for thermal power units is 0.372 yuan/(kWh).
All electric-fused magnesium loads within the region are centrally dispatched and managed by a unified load aggregator, enabling synchronized response to power regulation commands with a response delay of no more than 5 min. All electric-fused magnesium furnaces operate under 24 h continuous production mode, with coordinated production schedules across all magnesium plants. This ensures no refusal or delay in peak regulation due to individual enterprise production requirements. The power regulation range for a single electric-fused magnesium furnace is fixed at 85% to 120% of its rated capacity. During regulation processes, the molten pool temperature is maintained within the feasible temperature range, preventing product quality issues or production safety accidents caused by power fluctuations.
The typical daily load forecast curve is shown in Figure 5.
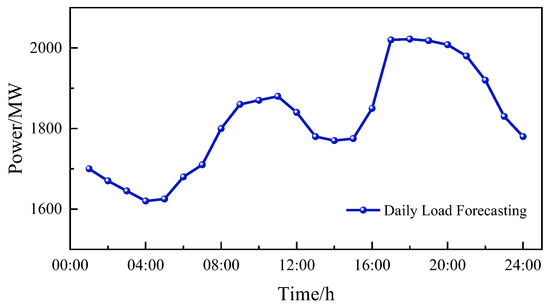
Figure 5.
Daily Load Forecast Curve.
To further analyze the impact of the proposed model on the system, this study establishes three schemes:
Scheme 1: A bi-level model that considers neither wind power uncertainty nor the regulation of fused magnesium load.
Scheme 2: A bi-level model that considers only the impact of wind power uncertainty, without incorporating fused magnesium load regulation.
Scheme 3: A bi-level model that considers both wind power uncertainty and fused magnesium load regulation.
5.2. Typical Wind Power Scenario Generation
Figure 6 illustrates the wind power uncertainty set, which encompasses the various uncertainty factors that must be considered in wind power generation. To estimate the potential range of wind power output, multiple methods can be employed to construct such an uncertainty set. Commonly used approaches include statistical methods based on historical data and numerical simulation techniques. The process typically begins by deriving predicted values from historical wind speed data. These values are then used in Latin Hypercube Sampling (LHS) to generate multiple plausible wind speed scenarios, thereby further refining the prediction range for wind power generation.
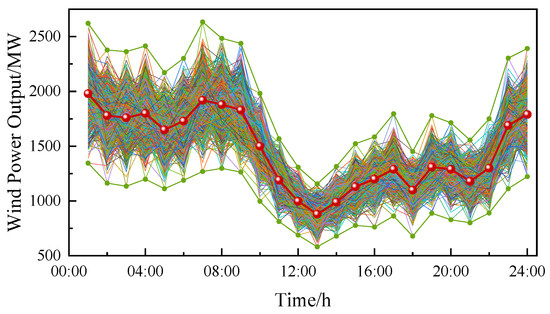
Figure 6.
Wind Power Uncertainty Set.
The scenario reduction method based on the Kantorovich distance was employed to eliminate scenarios with high redundancy and low probability, ultimately yielding five typical scenarios, as illustrated in Figure 7. Since the five generated typical scenarios exhibit broadly similar characteristics, this chapter selects the first typical scenario, which demonstrates the highest occurrence probability, to analyze wind power integration.
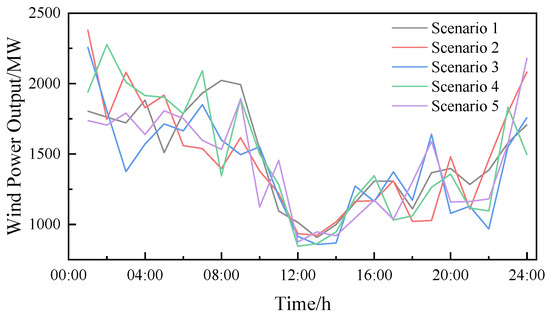
Figure 7.
Five typical wind power output scenarios diagram.
5.3. Analysis of Results
The comparison of the system’s overall peak regulation effect indicators under different schemes is presented in Table 4. When comparing Scheme 1 and Scheme 2, after incorporating wind power uncertainty, both the thermal power coal consumption cost and the system operation cost increase to a certain extent. When comparing Scheme 2 and Scheme 3, after introducing the regulation of high-energy-consuming electric-fused magnesium loads, the thermal power coal consumption cost decreases by 7.33%, and the system cost decreases by 8.85%.

Table 4.
Comparison of system total peak regulation costs and wind curtailment rates among different schemes.
Figure 8 shows the absorption situation of the system’s wind power under different schemes. Wind curtailment mainly occurs during the 1–10 time periods across all three schemes. By comparing Scheme 1 and Scheme 2, it is evident that after incorporating wind power uncertainty, the wind power accommodation rate during the 1–10 time periods decreases significantly. Additionally, wind curtailment also emerges in the 22nd time period. When comparing Scheme 2 and Scheme 3, it is obvious that after considering the regulation of high-energy-consuming electric-fused magnesium loads, the wind curtailment volume during the 1–10 time periods is drastically reduced.
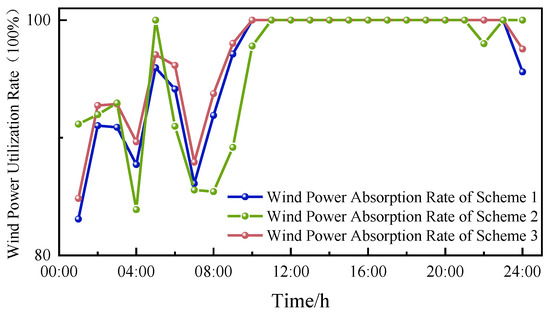
Figure 8.
Comparison of wind power absorption at different times under different schemes.
Figure 9, Figure 10 and Figure 11 respectively show the overall output of the system and the situation of wind curtailment for Schemes 1, 2, and 3. It can be observed that during the period from 00:00 to 09:00, thermal power units maintained a low output level to accommodate wind power and participated in deep peak regulation on multiple occasions. When comparing Scheme 1 and Scheme 2, after considering wind power uncertainty, thermal power units reduced their power output more frequently. This is not conducive to the stable operation of thermal power units and also has a negative impact on economic efficiency. By comparing Scheme 1 and Scheme 3, it can be seen that even when the impact of wind power uncertainty is taken into account, the output characteristics of thermal power units can still maintain a good state after the introduction of electric-fused magnesium loads. Furthermore, the wind curtailment situation has also been improved, which is intuitively reflected in the complete accommodation of wind power during the period from 06:00 to 09:00.
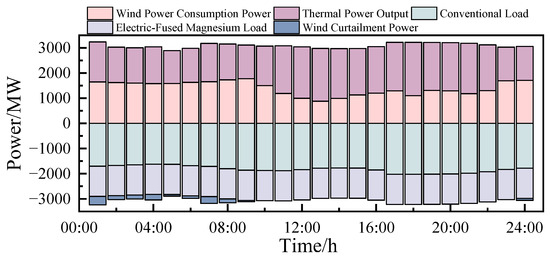
Figure 9.
The overall output of the system and the situation of wind curtailment of Scheme 1.
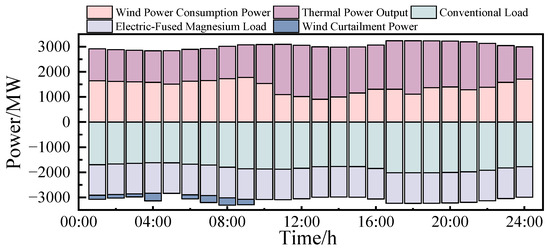
Figure 10.
The overall output of the system and the situation of wind curtailment of Scheme 2.
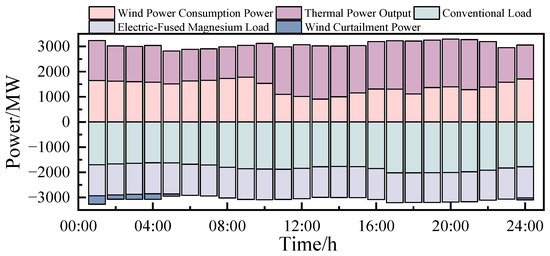
Figure 11.
The overall output of the system and the situation of wind curtailment of Scheme 3.
The power curve of the high-energy-consuming electric-fused magnesium load after it participates in regulation is shown in Figure 12.
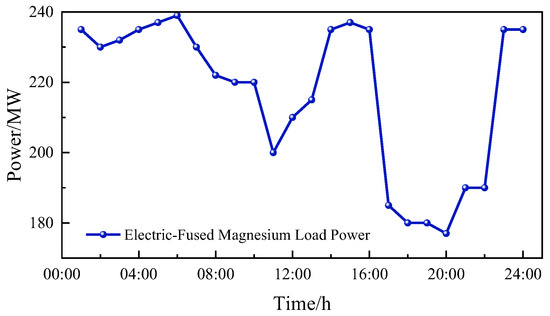
Figure 12.
The regulation curve of the electric-fused magnesium load.
In Scheme 3, the electric-fused magnesium load is actively regulated to complement system dynamics. During the late-night wind peak and load valley (01:00–06:00), its power is increased to absorb surplus wind energy. This increase is maintained during the morning load peak (07:00–11:00) to stabilize the system. The load remains elevated in the afternoon (13:00–17:00) to offset rising wind generation. Finally, during the evening peak (18:00–22:00) when thermal units are near maximum output, the load is strategically decreased to alleviate regulation pressure.
Figure 13 and Figure 14 show the situations of thermal power units participating in deep peak regulation in each time period under Scheme 1 and Scheme 3. Through comparative analysis, at 01:00, in Scheme 1, four thermal power units are dispatched to participate in deep peak regulation, among which one unit participates in the deep peak regulation of the first stage and three units participate in the deep peak regulation of the second stage. While in Scheme 2, it is optimized to have two thermal power units participating in deep peak regulation, and the numbers of thermal power units participating in the first and second deep peak regulations are one unit and one unit, respectively. At the moments of 02:00, 03:00, 09:00, 10:00, and 11:00, Scheme 3 correspondingly reduces the number of thermal power units participating in deep peak regulation. Due to the participation of the high-energy-consuming electric-fused magnesium load in Scheme 3, the deep peak regulation structure of the thermal power units is further optimized, enabling more efficient and economical allocation and utilization of the deep peak regulation resources of the thermal power units.
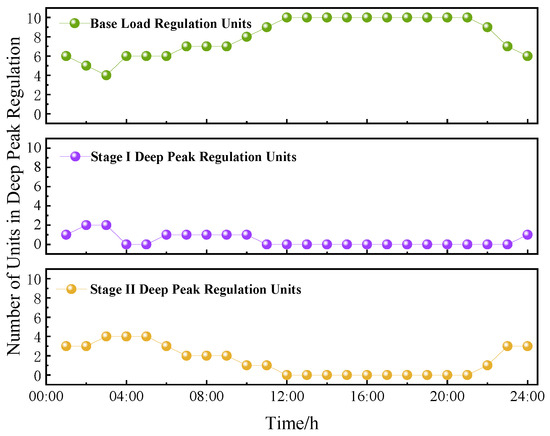
Figure 13.
The situations of thermal power units participating in Scheme 1.
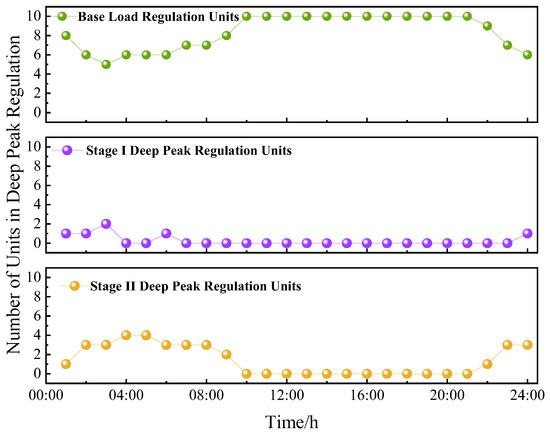
Figure 14.
The situations of thermal power units participating in Scheme 3.
In order to evaluate the impact on the peak regulation economy of each thermal power unit in a more detailed manner, Table 5 presents the economic indexes of the deep peak regulation of thermal power units under different schemes.

Table 5.
The economic situation of the deep peak regulation.
It can be seen from the analysis of the results in the table that Scheme 2 has the highest costs in all categories among all schemes. This is because after incorporating wind power uncertainty, the fluctuations in wind power output impose an additional burden on the system, preventing the units within the system from generating power according to the scheduled plan and thus increasing costs. Compared with Scheme 1, the deep peak regulation cost of Scheme 2 increases by 3.55%. When comparing Scheme 2 and Scheme 3, it is obvious that after considering demand response, all cost categories under Scheme 3 have decreased significantly. Specifically, the deep peak regulation cost of Scheme 3 is 4.93% lower than that of Scheme 2.
5.4. Sensitivity Analysis
We analyzed the impact of model outputs with respect to the frequency of wind power fluctuation periods. In this sensitivity analysis, the maximum duration of wind power fluctuation periods was set to 12 h. The sensitivity analysis results are shown in Figure 15. As seen in Figure 15, there is a strong correlation between the total cost and the frequency of wind power output fluctuations, indicating that the number of wind power output fluctuations affects the total cost. When wind power output fluctuates significantly, frequent grid adjustments are required to maintain a stable power supply, which may involve activating more reserve generation units or adopting other methods to stabilize the power supply. These additional costs are incorporated into the total cost, leading to an increase in the overall cost.
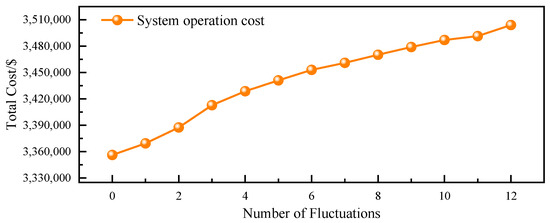
Figure 15.
Sensitivity analysis.
5.5. Comparison of Solution Times Across Different Schemes
The comparison of model solution times across different schemes is presented in Table 6. As shown in the Table, the total solution time of Scheme 2,3 is significantly longer than that of Scheme 1; however, the solution efficiency of the three schemes falls within an acceptable range. From the perspective of practical application scenarios for day-ahead scheduling, both can quickly meet the computational efficiency requirements, which ensures the timeliness of scheduling decisions.

Table 6.
Simulation time for different schemes.
6. Conclusions
This paper explores the inclusion of the high-energy-consuming electric-fused magnesium load in the optimized dispatching of the power grid, and its joint participation in the system peak regulation operation together with the deep peak regulation of thermal power units. A hierarchical optimization model is established with the aim of minimizing the wind curtailment volume and the operation cost of the system. Finally, taking an actual regional system with a relatively high proportion of wind power as an example, this paper verifies the effectiveness of the proposed strategy and conducts an in-depth analysis of the economic and technical impacts on the deep peak regulation of thermal power units. Through the research, the following conclusions are drawn:
(1) The proposed hierarchical optimization strategy significantly enhances wind power absorption capacity, improves the overall peak regulation performance of the system, and reduces system operation costs.
(2) The study investigates the impact of wind power uncertainty, adopts the scenario method to simulate wind power uncertainty, and uses CPLEX for solution in combination with the case study. Simulation results show that wind power uncertainty exerts a significant impact on the system: it substantially increases the system’s economic costs and wind curtailment volume, which is detrimental to the stable operation of thermal power units. However, after considering the high-energy-consuming electric-fused magnesium loads, the negative impacts caused by wind power uncertainty can be effectively mitigated, thereby enhancing the system’s wind power absorption capacity and reducing system operation costs.
(3) This study directly contributes to the achievement of emission reduction targets by mitigating wind curtailment and optimizing the operational efficiency of coal-fired power units. Although the emission intensity of coal-fired units increases during deep peak regulation due to reduced combustion efficiency and the use of auxiliary fuels, the proposed strategy indirectly reduces SO2 and NOX emissions by shortening the duration of deep peak regulation and lowering its depth. These characteristics strongly align with China’s “Dual Carbon” goals and air quality improvement requirements, fully demonstrating the environmental feasibility of the strategy. Furthermore, the research findings provide an implementable framework for the “source-load coordination” mechanism emphasized in national policies such as the Action Plan for the Low-Carbon Transformation of Coal-Fired Power (2024–2027).
Discussion
Although this study validated the hierarchical optimization strategy using electric-fused magnesium loads, the proposed two-layer source–load coordination framework can be extended to other high-energy-consuming industrial processes. By leveraging the adjustable power characteristics of high-energy-consuming loads and coordinating them with the deep peak-shaving capabilities of thermal power, the framework effectively mitigates renewable energy fluctuations in a cost-efficient manner. It is applicable to flexible industrial loads such as steel-making electric arc furnaces, which require consideration of stricter power variation rates and batch-specific constraints based on “heats”, and aluminum electrolysis, where narrow-range slow adjustment and its impact on current efficiency and product quality must be accounted for. This study provides a generalized modeling framework for industrial load dispatch in systems with high penetration of renewable energy.
For future research, the following directions can be explored: first, expand multi-energy coupling scenarios by incorporating energy storage and hydrogen energy equipment into the model, and study the “wind-thermal-storage-load-hydrogen” coordinated peak-shaving strategy; second, optimize the dynamic parameter model, construct a time-varying cost function by integrating the service life of thermal power units and fluctuations in the prices of raw materials for electric-fused magnesium.
Author Contributions
Conceptualization, Y.W. and S.W.; methodology, K.R. and Y.W.; validation, X.Z.; investigation, C.L. and S.W.; resources, C.L. and X.Z.; data curation, Y.W.; writing—original draft, K.R.; writing—review and editing, K.R. and Y.W.; supervision, C.L. and S.W. All authors have read and agreed to the published version of the manuscript.
Funding
This research is funded by the National Natural Science Foundation of China under the project “Novel Power System Stability Analysis Method and Control Theory Based on Data-Mechanism Fusion” (Project No. U24B2084).
Data Availability Statement
The original contributions presented in this study are included in the article. Further inquiries can be directed to the corresponding author.
Conflicts of Interest
Author Shunjiang Wang was employed by the State Grid Liaoning Electric Power Co., Ltd. The remaining authors declare that the research was conducted in the absence of any commercial or financial relationships that could be construed as a potential conflict of interest.
References
- Anika, O.C.; Nnabuife, S.G.; Bello, A.; Okoroafor, E.R.; Kuang, B.; Villa, R. Prospects of low and zero-carbon renewable fuels in 1.5-degree net zero emission actualisation by 2050: A critical review. Carbon Capture Sci. Technol. 2022, 5, 100072. [Google Scholar] [CrossRef]
- Mansouri, S.A.; Ahmarinejad, A.; Nematbakhsh, E.; Javadi, M.S.; Jordehi, A.R.; Catalao, J.P.S. Energy Hub Design in the Presence of P2G System Considering the Variable Efficiencies of Gas-Fired Converters. In Proceedings of the 2021 International Conference on Smart Energy Systems and Technologies (SEST), Virtual Conference, 6–8 September 2021; IEEE: Piscataway, NJ, USA, 2021; pp. 1–6. [Google Scholar]
- Nasir, M.; Jordehi, A.R.; Tostado-Véliz, M.; Tabar, V.S.; Amir Mansouri, S.; Jurado, F. Operation of energy hubs with storage systems, solar, wind and biomass units connected to demand response aggregators. Sustain. Cities Soc. 2022, 83, 103974. [Google Scholar] [CrossRef]
- Liang, Z.; Chen, H.; Chen, S.; Wang, Y.; Zhang, C.; Kang, C. Robust transmission expansion planning based on adaptive uncertainty set optimization under high-penetration wind power generation. IEEE Trans. Power Syst. 2021, 36, 2798–2814. [Google Scholar]
- Huang, J.; Du, Z.; Yu, Y.; Zhao, H.; Chen, Y. A two-layer optimal dispatch model for thermal unit deep peaking shaving and dynamic line rating. Int. J. Electr. Power Energy Syst. 2025, 172, 111098. [Google Scholar] [CrossRef]
- Zhou, X.; Cai, C.; Li, Y.; Wu, J.; Zhan, Y.; Sun, Y. A robust optimization model for demand response management with source-grid-load collaboration to consume wind-power. Glob. Energy Interconnect. 2023, 6, 738–750. [Google Scholar]
- Zhao, X.; Wang, Y.; Liu, C.; Cai, G.; Ge, W.; Zhou, J.; Wang, D. Low carbon scheduling method of electric power system considering energy-intensive load regulation of electrofused magnesium and wind powerfluctuation stabilization. Appl. Energy 2024, 357, 122573. [Google Scholar]
- Zhao, X.; Wang, Y.; Liu, C.; Cai, G.; Ge, W.; Wang, B.; Wang, D.; Shang, J.; Zhao, Y. Two-stage day-ahead and intra-day scheduling considering electric arc furnace control and wind power modal decomposition. Energy 2024, 302, 131694. [Google Scholar]
- Gan, L.; Yang, T.; Chen, X.; Shen, J.; Wang, B.; Yu, K. Low-carbon Scheduling of Integrated Energy System in Iron & Steel Industrial Park Considering Low-carbon Techniques and Process Control. Power Syst. Technol. 2023, 47, 3099–3113. [Google Scholar]
- Lin, L.; Tian, X.Y. Analysis of deep peak regulation and its benefit of thermal units in power system with large scale wind power integrated. Power Syst. Technol. 2017, 41, 2255–2263. [Google Scholar]
- Deng, T.T.; Lou, S.H.; Tian, X. Optimal Dispatch of Power System Integrated with Wind Power Considering Demand Response and Deep Peak Regulation of Thermal Power Units. Autom. Electr. Power Syst. 2019, 43, 24–41. [Google Scholar]
- Liu, X.; Chen, H.; Yao, C. Economic dispatch considering deep peak-regulation and interruptible loads for power system incorporated with wind farms. Electr. Power Autom. Equip. 2012, 32, 95–99. [Google Scholar]
- Nosratabadi, S.M.; Hooshmand, R.A.; Gholipour, E. A comprehensive review on microgrid and virtual power plant concepts employed for distributed energy resources scheduling in power systems. Renew. Sustain. Energy Rev. 2017, 67, 341–363. [Google Scholar] [CrossRef]
- Riveros, J.Z.; Bruninx, K.; Poncelet, K.; D’haeseleer, W. Bidding strategies for virtual power plants considering CHPs and intermittent renewables. Energy Convers. Manag. 2015, 103, 408–418. [Google Scholar] [CrossRef]
- Yan, S.; Zhang, Y.; Yin, W.; Li, B.; Ye, J.; Wu, Y.; Zhang, Y. Flexibility enhancement of renewable-penetrated power systems coordinating energy storage deployment and deep peak regulation of thermal generators. Electr. Power Syst. Res. 2024, 231, 110354. [Google Scholar] [CrossRef]
- Zhao, Y.; Dong, K.; Chen, L.; Cheng, T.; Cai, Q.; Zhang, Q. Optimal dispatching considering the participation of flexible resources on the load side in deep peak regulation market. In Proceedings of the 2023 IEEE/IAS Industrial and Commercial Power System Asia (I&CPS Asia), Chongqing, China, 7–9 July 2023; pp. 2166–2171. [Google Scholar]
- Guan, H.; Feng, Y.; Yang, X.; Du, Y.; Feng, D.; Zhou, Y. Optimization strategy of combined thermal-storage-photovoltaic economic operation considering deep peak load regulation demand. Energy Rep. 2022, 8, 112–120. [Google Scholar]
- Guo, X.; Liao, Y.; Li, G.; Han, Y.; Ma, X. Low-carbon economic dispatch of Photovoltaic-Carbon capture power plant considering deep peak regulation. J. Clean. Prod. 2023, 420, 138418. [Google Scholar]
- Wang, Y.; Susmel, L. The Modified Manson–Coffin Curve Method to estimate fatigue lifetime under complex constant and variable amplitude multiaxial fatigue loading. Int. J. Fatigue 2016, 83, 135–149. [Google Scholar] [CrossRef]
- Song, Y.; Wang, G.; Li, H.; Sun, Y.; Jin, H.; Su, T.; Wu, X.; Zhang, Q. New Energy and CCUS Thermal Power Synergistic Peaking Cost Model and Apportionment Optimization Strategy. IEEE Access 2025, 13, 132501–132513. [Google Scholar] [CrossRef]
- Carrión, M.; Arroyo, J.M. A computationally efficient mixed-integer linear formulation for the thermal unit commitment problem. IEEE Trans. Power Syst. 2006, 21, 1371–1378. [Google Scholar] [CrossRef]
- Wang, S.; Lou, S.; Wu, Y.; Cao, K.; Zhou, K. Robust optimal dispatch of large-scale wind power integration considering deep peak regulation cost of thermal power units. Autom. Electr. Power Syst. 2020, 44, 118–125. [Google Scholar]
- Lin, L.; Zou, L.; Zhou, P.; Tian, X. Multi-angle economic analysis on deep peak regulation of thermal power units with large-scale wind power integration. Autom. Electr. Power Syst. 2017, 41, 21–27. [Google Scholar]
- Zhang, G.; Chen, Y.; Zhang, J.; Tang, N.N.; Niu, Y. Research on optimization of day-ahead dispatching of wind power-photovoltaic-hydropower-thermal power-pumped storage combined power generation system. Acta Energiae Solaris Sin. 2020, 41, 79–85. [Google Scholar]
- Yan, S.; Gu, B.; Ai, S.; Tian, D. The Environmental Cost Accounting and Sensitivity Analysis for Thermal Power Plants. Electr. Power Sci. Eng. 2016, 32, 62. [Google Scholar]
Disclaimer/Publisher’s Note: The statements, opinions and data contained in all publications are solely those of the individual author(s) and contributor(s) and not of MDPI and/or the editor(s). MDPI and/or the editor(s) disclaim responsibility for any injury to people or property resulting from any ideas, methods, instructions or products referred to in the content. |
© 2025 by the authors. Licensee MDPI, Basel, Switzerland. This article is an open access article distributed under the terms and conditions of the Creative Commons Attribution (CC BY) license (https://creativecommons.org/licenses/by/4.0/).