1. Introduction
New energy storage technologies are essential for improving the efficiency of renewable energy utilization and are important for achieving the “dual-carbon” goal [
1]. New energy storage technologies can be categorized into lithium-ion battery energy storage, supercapacitor energy storage, flywheel energy storage, etc., according to their energy storage principles [
2,
3,
4]. From the cumulative installed capacity of emerging energy storage technologies, lithium-ion batteries have obvious advantages, and the installed capacity far exceeds other energy storage technologies. This phenomenon is mainly attributed to the combined advantages of Libs, such as high energy density, low cost, technological maturity, and wide applicability [
5,
6,
7].
Despite the fact that Libs are widely used and show good prospects for development, there are still some pressing challenges in their practical applications, especially in accurately predicting the state of charge (SOC). Achieving high-precision prediction of the SOC of Libs is critical for preventing overcharging and overdischarging, optimizing charging and discharging strategies, and improving overall energy efficiency [
8,
9,
10]. In practice, Libs are usually assembled into battery packs through series-parallel connections to meet specific power and voltage requirements [
11,
12]. Lib packs have been widely used in electric vehicles, spacecraft, and ships as an important form of advanced energy storage devices. Accurately predicting the SOC of a lithium-ion battery pack is a core task in the operation of a battery management system (BMS) [
13]. The SOC of a battery pack is defined as the ratio of the remaining charge to the rated capacity at a given moment. It is an important indicator for evaluating the operational status of a battery pack. SOC plays a crucial role in performance evaluation, lifetime prediction, and safety management [
14,
15,
16]. The SOC of Libs is affected by the inherent nonlinear characteristics of the battery, the variability of the actual operating conditions, and the complex interactions between multiple factors. Direct observation can be challenging. At the same time, because Lib packs contain multiple cells, differences in manufacturing processes can lead to different rates of performance degradation for individual cells as the number of charge/discharge cycles and usage time increase. When the characteristics of some cells are significantly different from those of others, the overall SOC estimate for the battery pack may be subject to large errors [
17,
18,
19].
Several methods have been developed for estimating the SOC of lithium-ion battery packs. Representative methods can be broadly categorized into two groups: One category is to indirectly estimate the SOC of the entire battery pack by selecting representative cells within the pack and utilizing their state information [
20]. Another class of methods consists of analyzing the combined information of all cells within a battery pack to efficiently estimate the overall SOC [
21].
The charging and discharging boundaries of a battery pack are usually determined by the worst-performing cell in the pack. The end of the charging process is determined by the cell with the highest voltage in the battery pack, while the end of the discharging process is determined by the cell with the lowest voltage. The representative cell refers to the single cell or single cell group that can effectively reflect the overall characteristics of the whole battery pack, and the appropriateness of the representative cell selection is directly related to the accuracy of the SOC prediction results [
22,
23,
24]. Yu proposed a Bayesian multi-branch fusion method that integrates resistance estimation, temperature-compensated OCV-SOC modeling, and weighted fusion, achieving accurate online SOC estimation in parallel lithium-ion battery packs [
25]. Docimo proposed an estimation and balancing control method based on the LTV model, which combines RC modeling, EKF estimation, and LQR balancing, alleviating multi-state inconsistencies in Lib packs, reducing SOC errors, lowering computational complexity, and improving real-time performance [
26]. Liu proposed an active balancing strategy for Lib packs using the NSGA-II optimization algorithm, which dynamically switches between SOC and voltage indicators. This strategy achieves faster balancing speed, better SOC consistency, and lower energy loss [
27]. The SOC estimation method based on representative battery cells is limited by its reliance on individual battery cells. It cannot capture multi-state inconsistencies such as SOC, diffusion, and temperature changes across the entire battery pack. This method is sensitive to voltage nonlinearity and temperature effects, resulting in reduced accuracy under dynamic or aging conditions. It cannot ensure balance between battery cells, thereby reducing energy utilization and shortening battery life.
The estimation method using representative monomers reduces the model complexity, but ignores the initial differences in capacity and internal resistance between monomers, and the heterogeneity caused by uneven aging. Therefore, the SOC values estimated by this model cannot accurately reflect the overall state of the battery pack [
28,
29]. In order to effectively address cell inconsistencies within a battery pack, an alternative approach is to estimate the SOC of the battery pack using the combined information from all cells. Directly utilizing the combined information of all cells in the battery pack for SOC estimation significantly increases the computational complexity. In addition, noise and redundant information in the dataset can negatively impact model performance and reduce estimation accuracy [
30,
31]. Therefore, it is crucial to efficiently extract key features from a large amount of raw battery pack data or perform appropriate dimensionality reduction on the input data. The key challenge of this approach is to maintain or improve the predictive accuracy and generalization performance of the model while reducing computational complexity [
32,
33,
34]. Qi proposed an enhanced machine learning method for predicting the SOC of battery packs. The method integrates multi-source field data fusion, Pearson correlation coefficient feature selection, and a CNN-BiGRU based on an attention mechanism and optimized by particle swarm optimization. It achieves high-precision online SOC estimation for lithium-ion battery packs [
35]. Manoharan proposed a parallel artificial neural network (PANN) method. It utilizes parallel layers based on BiLSTM to fuse multi-source time series data. It also integrates large battery and extreme battery methods. Even under extreme operating conditions, it can achieve accurate SOC estimation for battery packs [
36]. Hu proposes a performance evaluation strategy that combines online SOC estimation based on DEKF with offline consistency evaluation based on MCPE. This solves the problems of Lib pack SOC estimation accuracy and input parameter sorting. It achieves high precision, higher stability, and reliable monitoring of lithium-ion battery packs [
37].
Recent research on SOC estimation has increasingly utilized artificial neural networks (ANNs) and placed greater emphasis on hybrid model architectures. Paolini provides a comprehensive classification of ANN-based SOC estimators, covering feedforward, attention-based, and hybrid architectures [
38]. It also highlights the strengths and limitations of each model. This provides insights for our research on integrating temporal attention mechanisms with recurrent models to fuse historical SOC and multi-sensor signals by integrating historical SOC trajectories with multi-sensor measurements. The proposed hybrid estimator mitigates the limitations of uncertainty handling and existing hybrid fusion methods, as identified in prior research. Ria describes the practical limitations of automotive BMS, including estimator placement, sensor fidelity, and availability; latency and computational budget; and safety compliance requirements under typical duty cycles [
39]. These insights inform the selection of input features and sampling strategies for our model. Dr. Dini conducted a systematic review of model-based, data-driven, and hybrid SOC estimation strategies [
40], thereby providing the theoretical foundation for the hybrid architecture adopted in this study. Meanwhile, Paolini investigated the impact of constant current/constant voltage charging strategies and on-board charger constraints on SOC dynamics, extending the architecture to incorporate degradation-aware gating. To capture seasonal drift, a joint SOC modeling framework was adopted [
41,
42]. These insights provide guidance and inspiration for our training and evaluation protocols. Our objective is to enhance the model’s sensitivity to seasonal drift and long-term performance degradation, thereby laying the groundwork for future SOC modeling.
In order to more comprehensively represent the SOC of the battery pack, both overall battery pack information and individual battery data are used as model inputs. This method may lead to redundant information and increase the computational complexity of the model. One of the core challenges of this study is to effectively extract features from these input variables that show a strong correlation with battery pack SOC. In addition, identifying and extracting these key features also poses equally daunting challenges.
To overcome these limitations, it is crucial to develop effective feature engineering strategies. Not only is minimizing data redundancy critical, but preserving the most informative signals related to SOC dynamics is also critical. Methods such as correlation analysis, redundancy minimization, and nonlinear feature selection can promote the elimination of irrelevant variables. It is necessary to strengthen the model’s ability to capture the relationship between the SOC of cells and the SOC of the battery pack. By considering time-related interactions, degradation trends, and actual operating conditions, combining time information from battery cells can enhance the characterization of battery pack status. In summary, the main contributions of this study are as follows:
- (1)
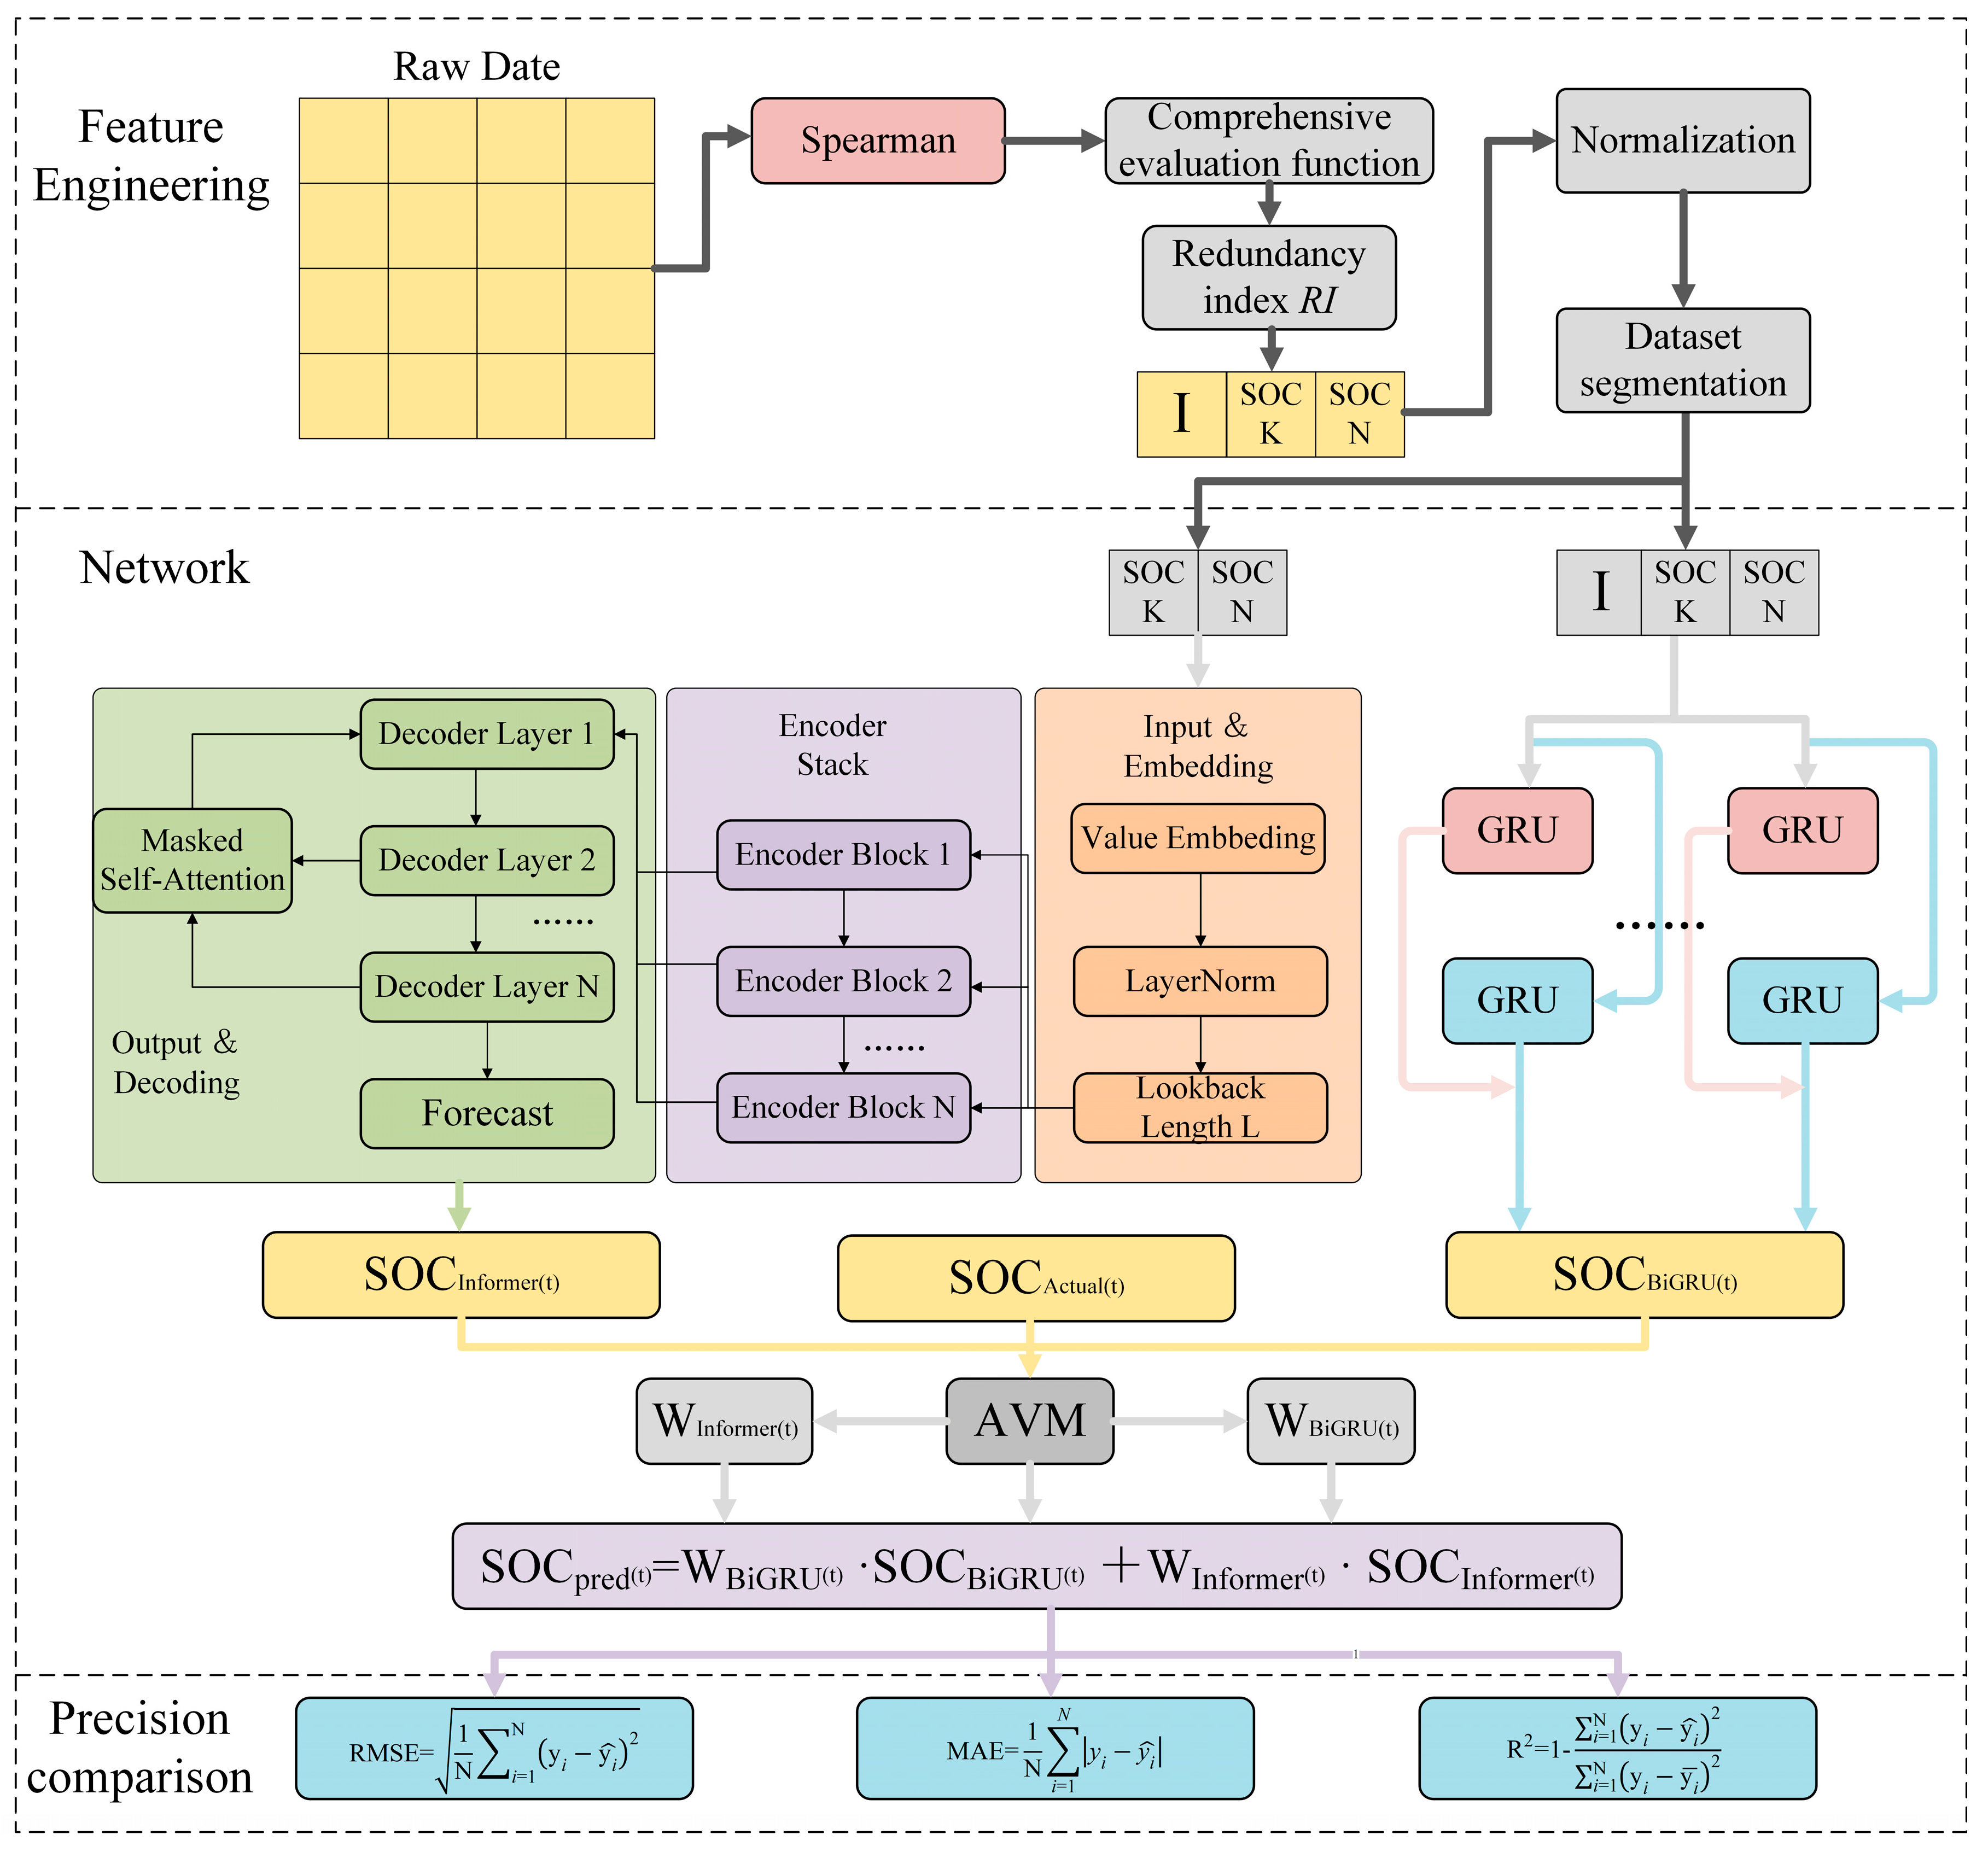
A new feature selection formula was developed by considering redundancy indicators, prediction accuracy, and model lightweight requirements. Global sensitivity analysis and grid search were employed to optimize redundant feature selection and the parameters of the feature selection formula. The objective was to determine a feature subset that maximizes information content while maintaining compactness, thereby enabling accurate estimation of the battery pack’s SOC.
- (2)
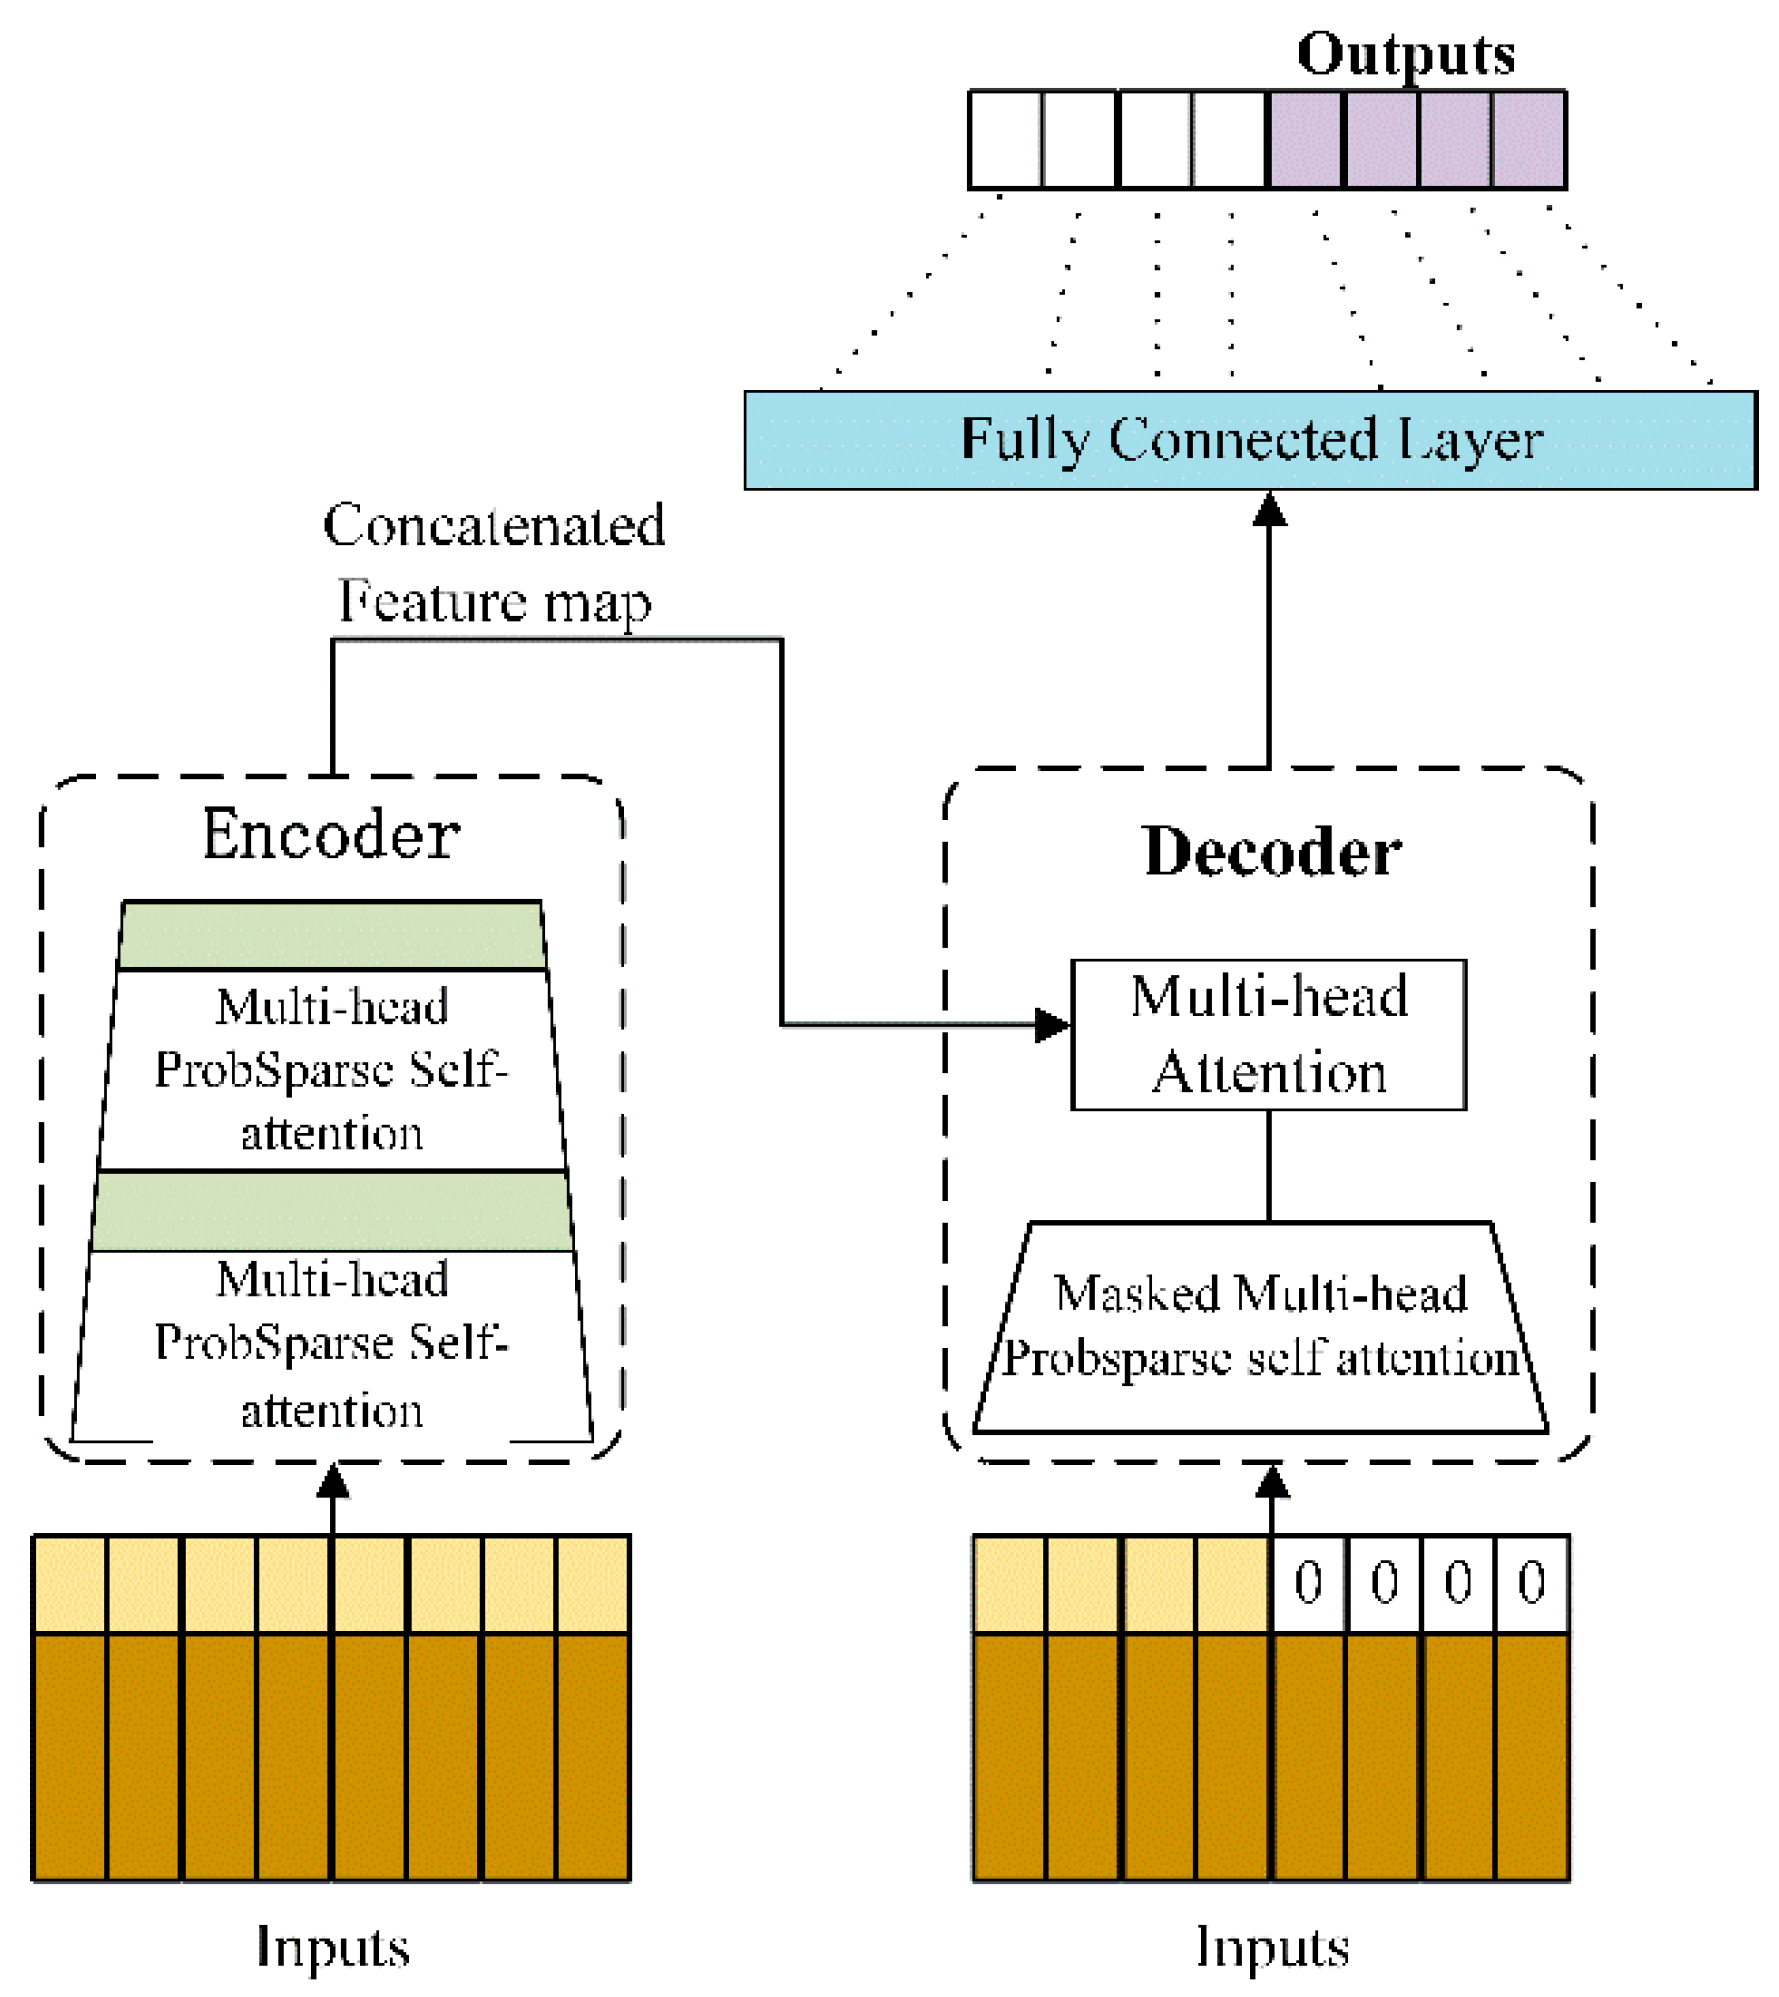
In order to improve the accuracy of battery pack SOC estimation, a fusion model was developed. The Informer network was used to capture the intrinsic correlation between the SOC of the battery pack and the SOC of cell batteries, extracting the most significant relationship features across multiple scales. By integrating contextual information about the past and future SOC of the battery pack, the BiGRU network was used to capture dynamic evolution patterns in time series. By combining correlation extraction between battery packs and battery cells with time series learning, the fusion model can achieve highly accurate and reliable SOC predictions.
- (3)
An adaptive error fluctuation weighting strategy has been proposed. This strategy dynamically adjusts the relative contributions of the Informer and BiGRU networks based on the error fluctuations observed during the prediction process. This strategy ensures consistent and accurate SOC estimates across different experimental environments.
3. Results
3.1. Experimental Setup
3.1.1. Dataset and Experimental Conditions
LiFePO
4 battery packs integrated into a photovoltaic energy storage system are used in this study. Each module consists of six lithium-ion cells connected in series, and sixteen such modules are connected in series to form a complete battery pack. The detailed electrical and environmental parameters are presented in
Table 2. The battery pack is mainly charged during low tariff hours (00:00 to 08:00) and PV ramp-up hours (06:00 to 09:00), adopting the typical strategy of “valley electricity plus morning PV replenishment”. Discharge occurs primarily during high load hours (08:30 to 11:30 and 18:00 to 22:00) to alleviate morning and evening peak demand and to provide instantaneous backup power for the Uninterruptible Power Supply (UPS). These data were collected at 5 min intervals over the course of a year. Overall, the battery pack exhibits operational characteristics typical of domestic and small industrial and commercial energy storage systems. “Shallow cycling and high SOC float charging.” It meets the dual requirements of home and small commercial and industrial energy storage systems by providing peak shaving and critical load backup capabilities.
In addition, to ensure consistency and fairness in experimental validation, the data were divided chronologically. The data from the first 20 days of each month is used as the training set, and the data from the last 10 days is used as the test set.
The fusion model hyperparameters are shown in
Table 3. The hyperparameters for the BiGRU and Informer networks are shown in
Table 4 and
Table 5. All the experiments were conducted using Python 3.9, PyTorch 2.0, and TorchVision 0.15.0. Computations were performed on a computer equipped with an NVIDIA GeForce RTX 4070 Ti GPU and an Intel Core i5-12400F CPU. Divide 20% of the data within the training set into a validation set. The training protocol employed early stopping based on validation set loss with patience = 10.
3.1.2. Data Preprocessing
Due to the different numerical scales of variables external to the battery pack, direct use of unprocessed data may cause the model to over-rely on features with larger values while ignoring features with smaller values. This imbalance may seriously affect the predictive performance of the model, thus reducing its generalization ability.
To solve this problem, the raw data were preprocessed in this experiment. Normalization is a common technique used to scale different features to the same range, thus preventing features with larger values from dominating the model training process. In this study, minimum-maximum standardization was used to scale the data to the (−1, 1) range.
The normalization formula is shown in Equation (14). x represents the original data and denotes the normalized data. and represent the maximum and minimum values in the dataset, respectively.
3.1.3. Evaluation Criteria
According to the requirements of this experiment, the following three commonly used evaluation metrics were used: root mean square error (RMSE), mean absolute error (MAE), and coefficient of determination (R
2). The combined analysis of these three metrics provides a comprehensive assessment of the model’s predictive performance.
The network assessment formulas are shown in Equations (15)–(17). is the true SOC value, is the predicted SOC value, and N is the total number of samples.
3.2. Feature Selection
Spearman correlation analysis was used to assess the correlation between the variables and the SOC of the battery pack, as shown in
Figure 3. The variables bat_V (battery pack voltage) and SOC1 (SOC of battery cell 1) have the highest correlation with the overall SOC. It is shown that they make a substantial contribution to the battery pack SOC prediction. However, it is worth noting that these two variables also show a strong correlation, suggesting that the information they convey may be overlapping or redundant. In addition, significant inter-correlations were observed between the individual currents (bat_c1 to bat_c6) and between the individual SOCs (soc1 to soc6) for each cell. This suggests that the direct use of all these variables in a predictive model may introduce redundant information, which may reduce the predictive performance of the model or even lead to overfitting.
In order to minimize redundancy between the selected output features while maintaining the accuracy of the battery pack SOC prediction, a subset of features was optimized to retain as much relevant information as possible. We set the objective function to Equation (8).
Table 6 lists the values of each parameter corresponding to different redundancy control thresholds; all the values are normalized using the Min-Max normalization method.
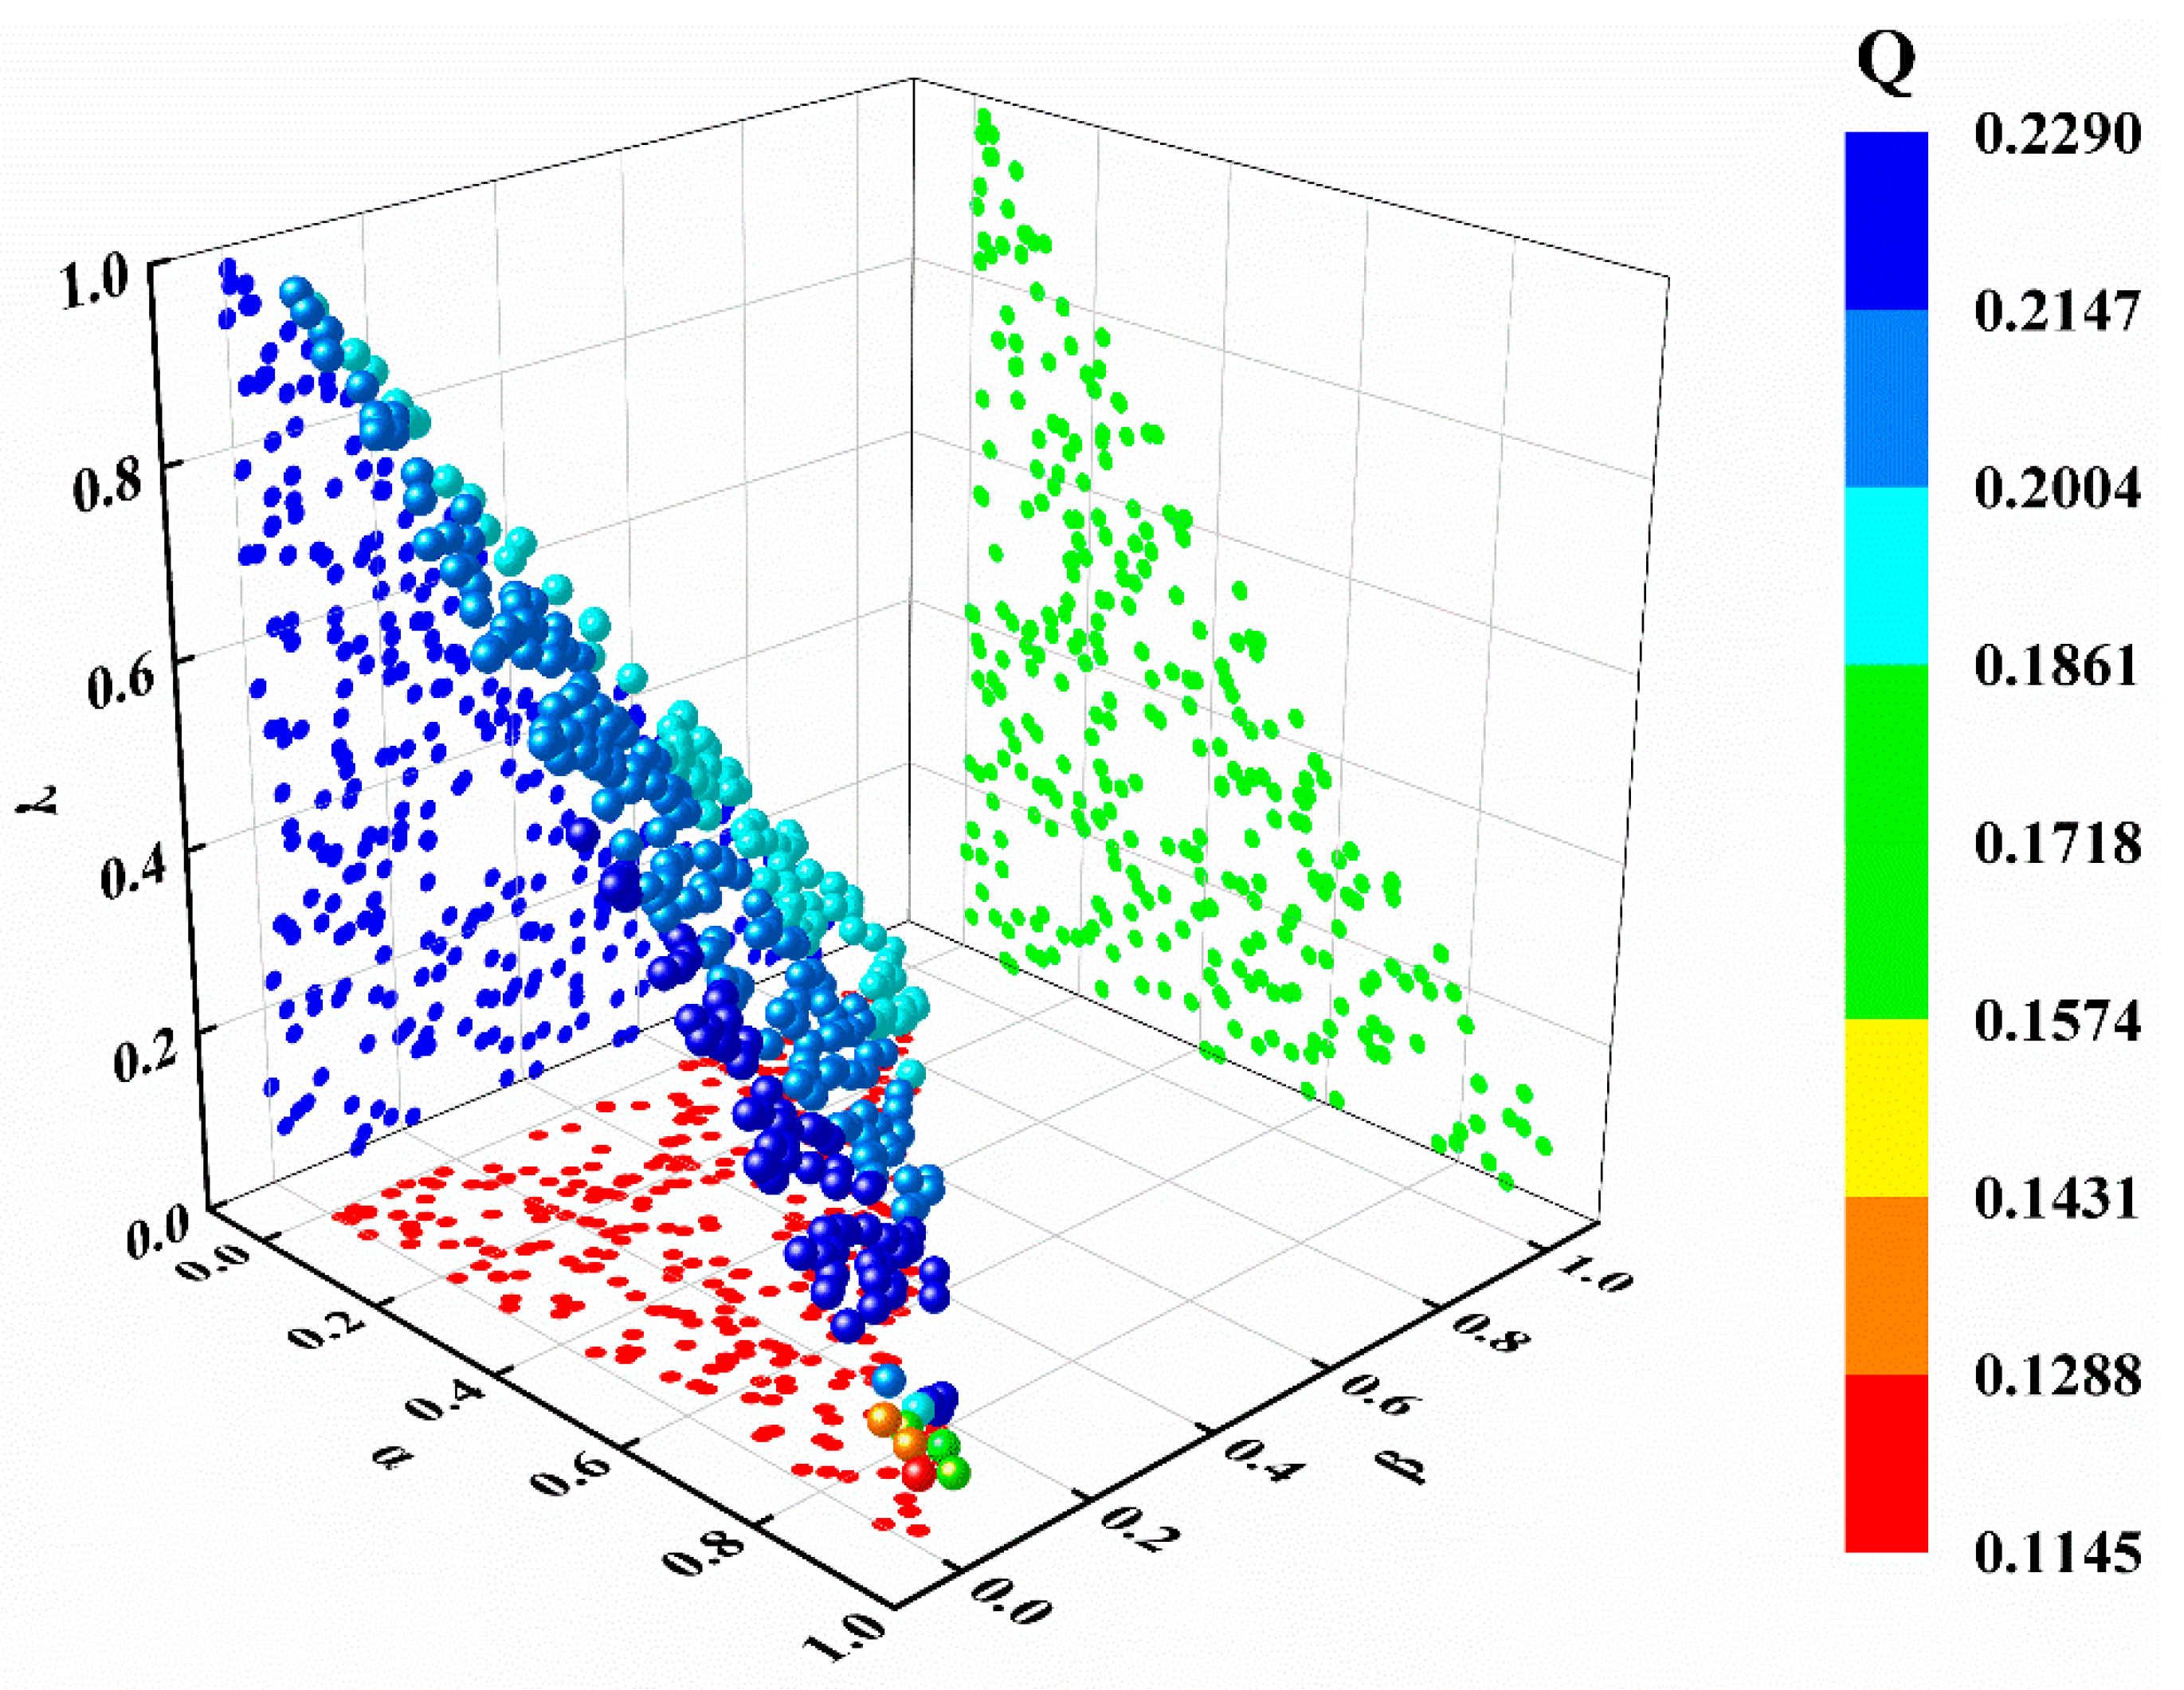
To simultaneously enhance estimation accuracy, feature set compactness, and computational efficiency in the battery SOC modeling process, we employed global sensitivity analysis. This framework quantifies the relative influence of candidate inputs on model outputs, thereby guiding the construction of minimal feature sets while limiting computational costs. We drew weight coefficients (α, β, γ) from a Dirichlet distribution over a 3-simplex to systematically generate 300 normalized combinations (where α + β + γ = 1). The comprehensive Q-value corresponding to each combination was calculated, and the optimal RI was selected at different redundancy levels.
As shown in
Figure 4. As the α value increases, the model’s sensitivity to errors becomes significantly heightened, which enables the model to produce a lower Q-value under high-precision requirements. When β is large, the reduction in the number of features leads to a decrease in computational cost. Although it may slightly increase the margin of error, it generally improves the model’s efficiency. The Q-value is relatively stable. When γ is large, the reduction in computational overhead results in lower Q values. Excessively high computational overhead may compromise accuracy, leading to degraded model performance.
To ensure adequate predictive precision and stability, a minimum value constraint was imposed on α (α ≥ 0.4). Based on the sensitivity analysis results, a grid search method was employed to systematically exhaust all the possible weight combinations. A = 0.4, β = 0.1, and γ = 0.5 were selected as the optimized weight combination. The final input features for the network are soc1, bat_c, and soc5. This approach effectively reduces computational overhead while ensuring high precision and maintaining moderate feature selection compactness.
3.3. Ablation Experiments
As shown in
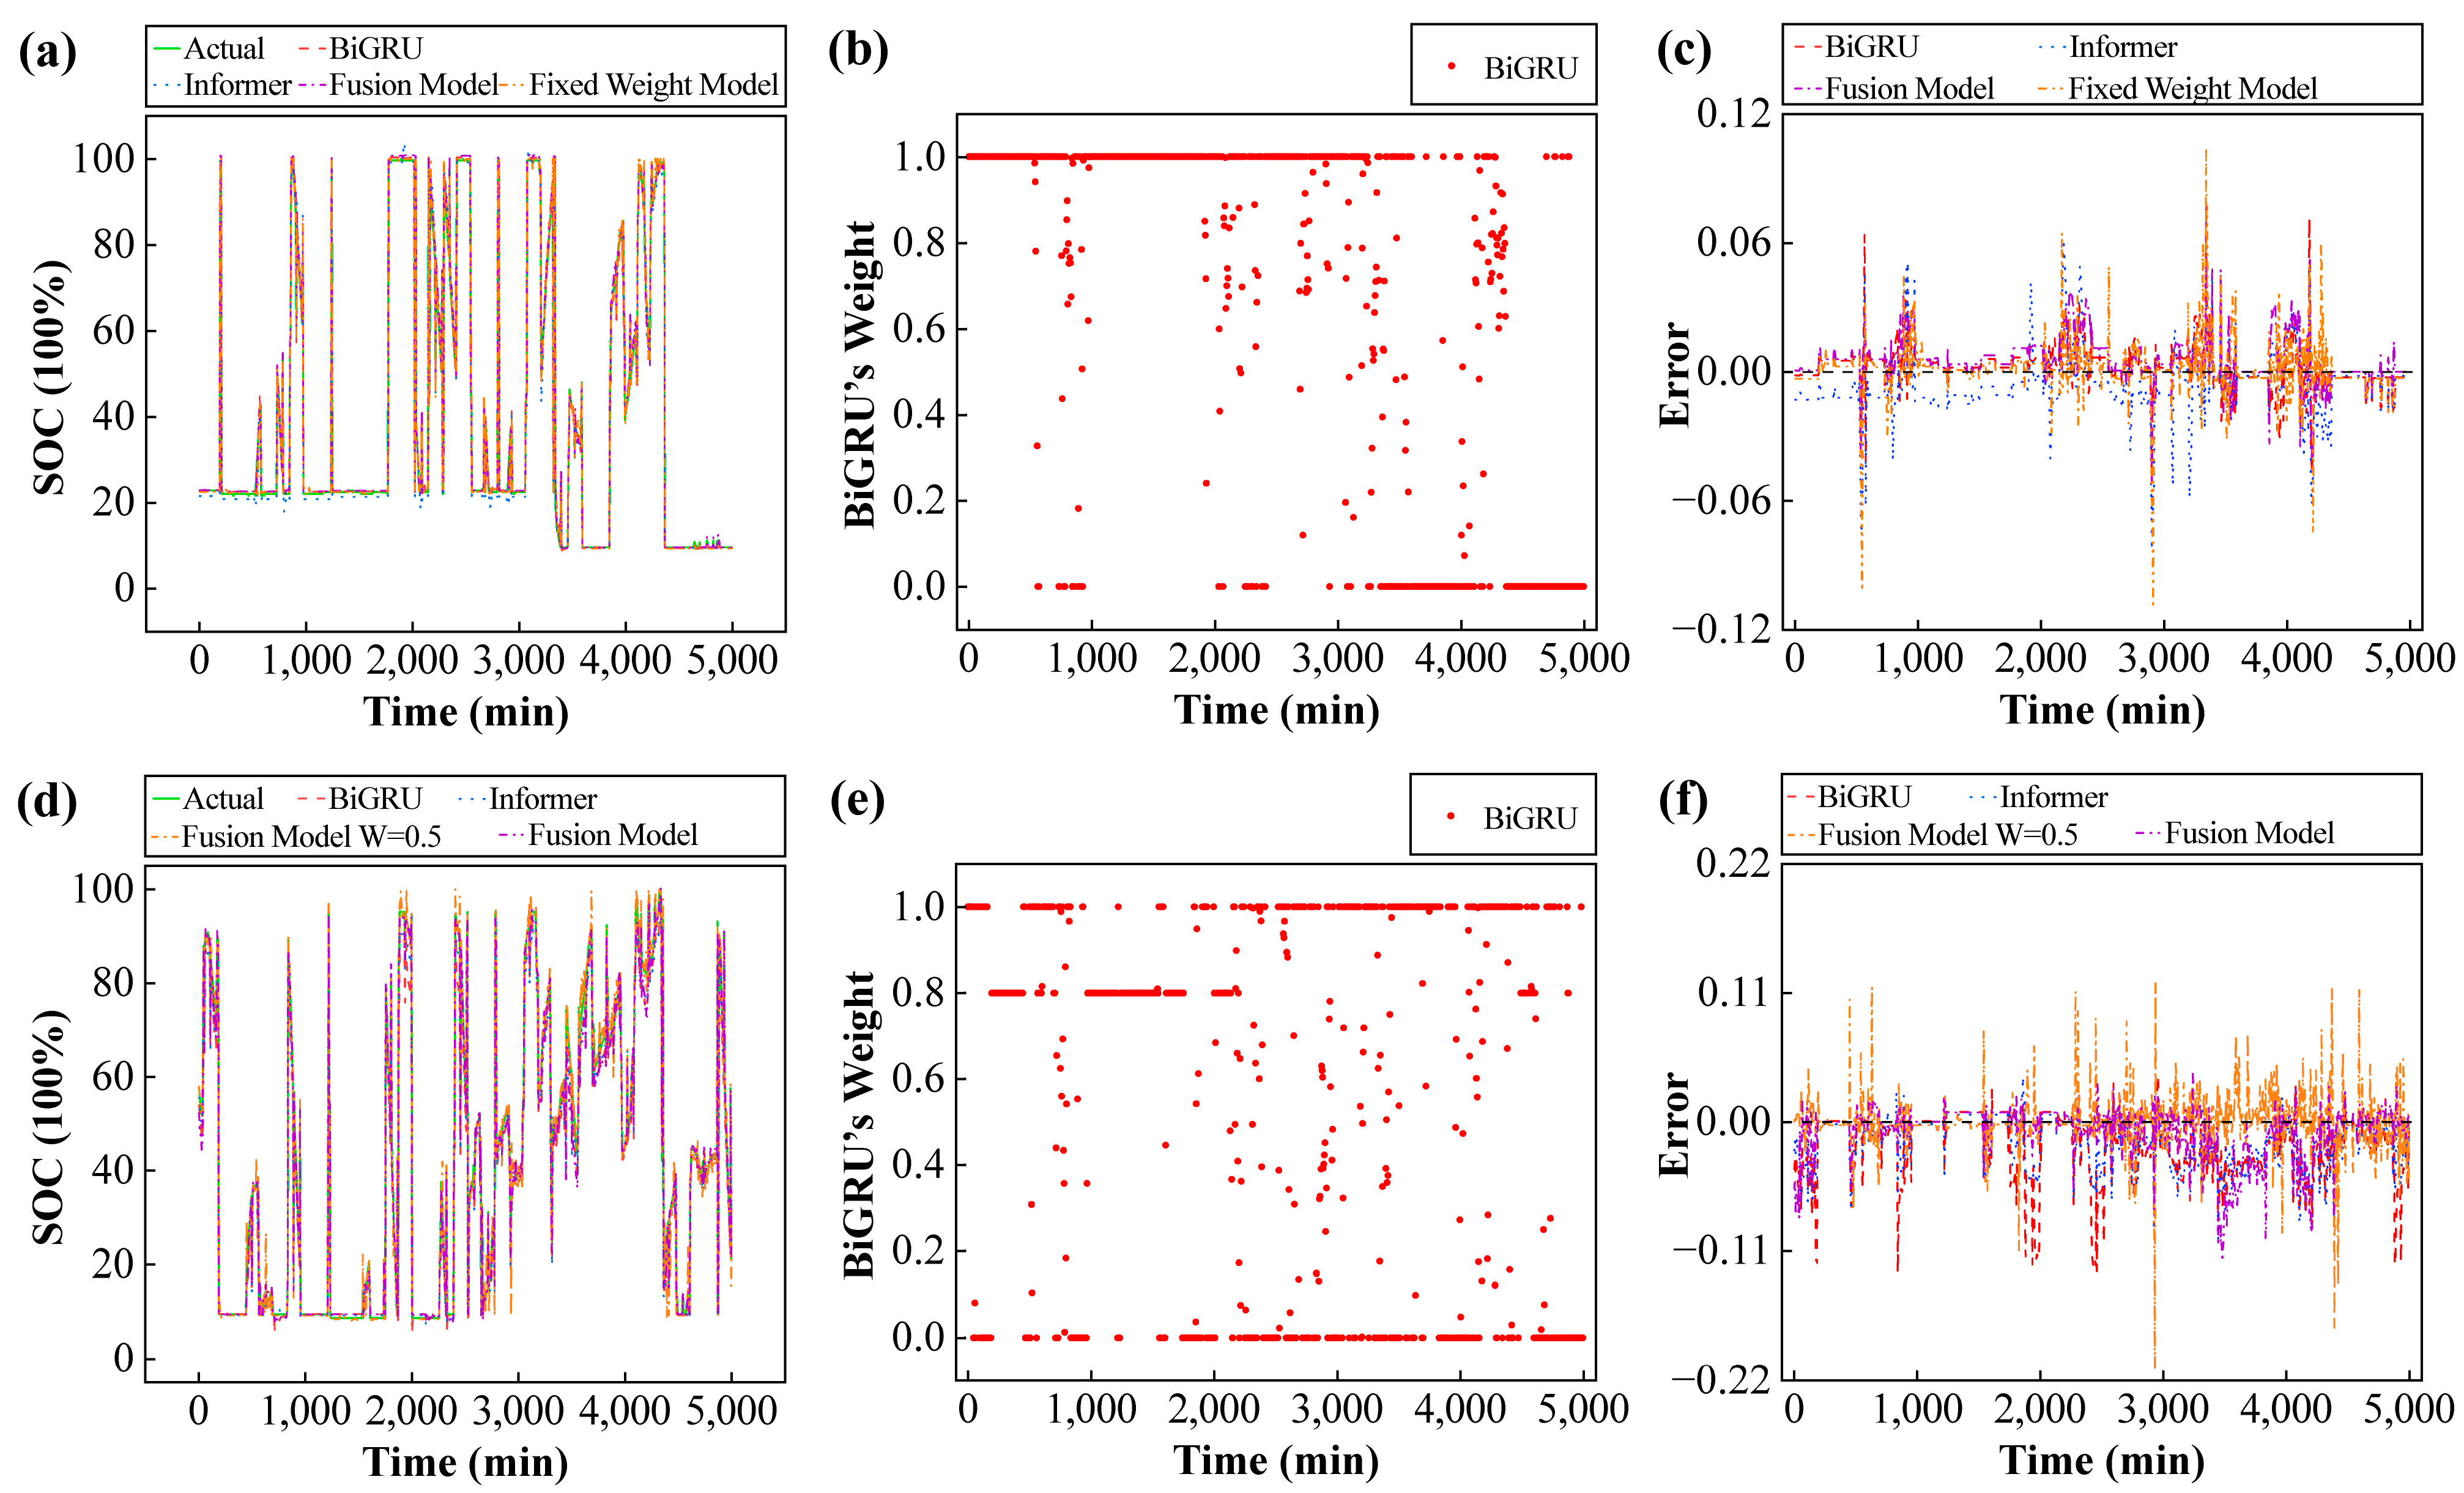
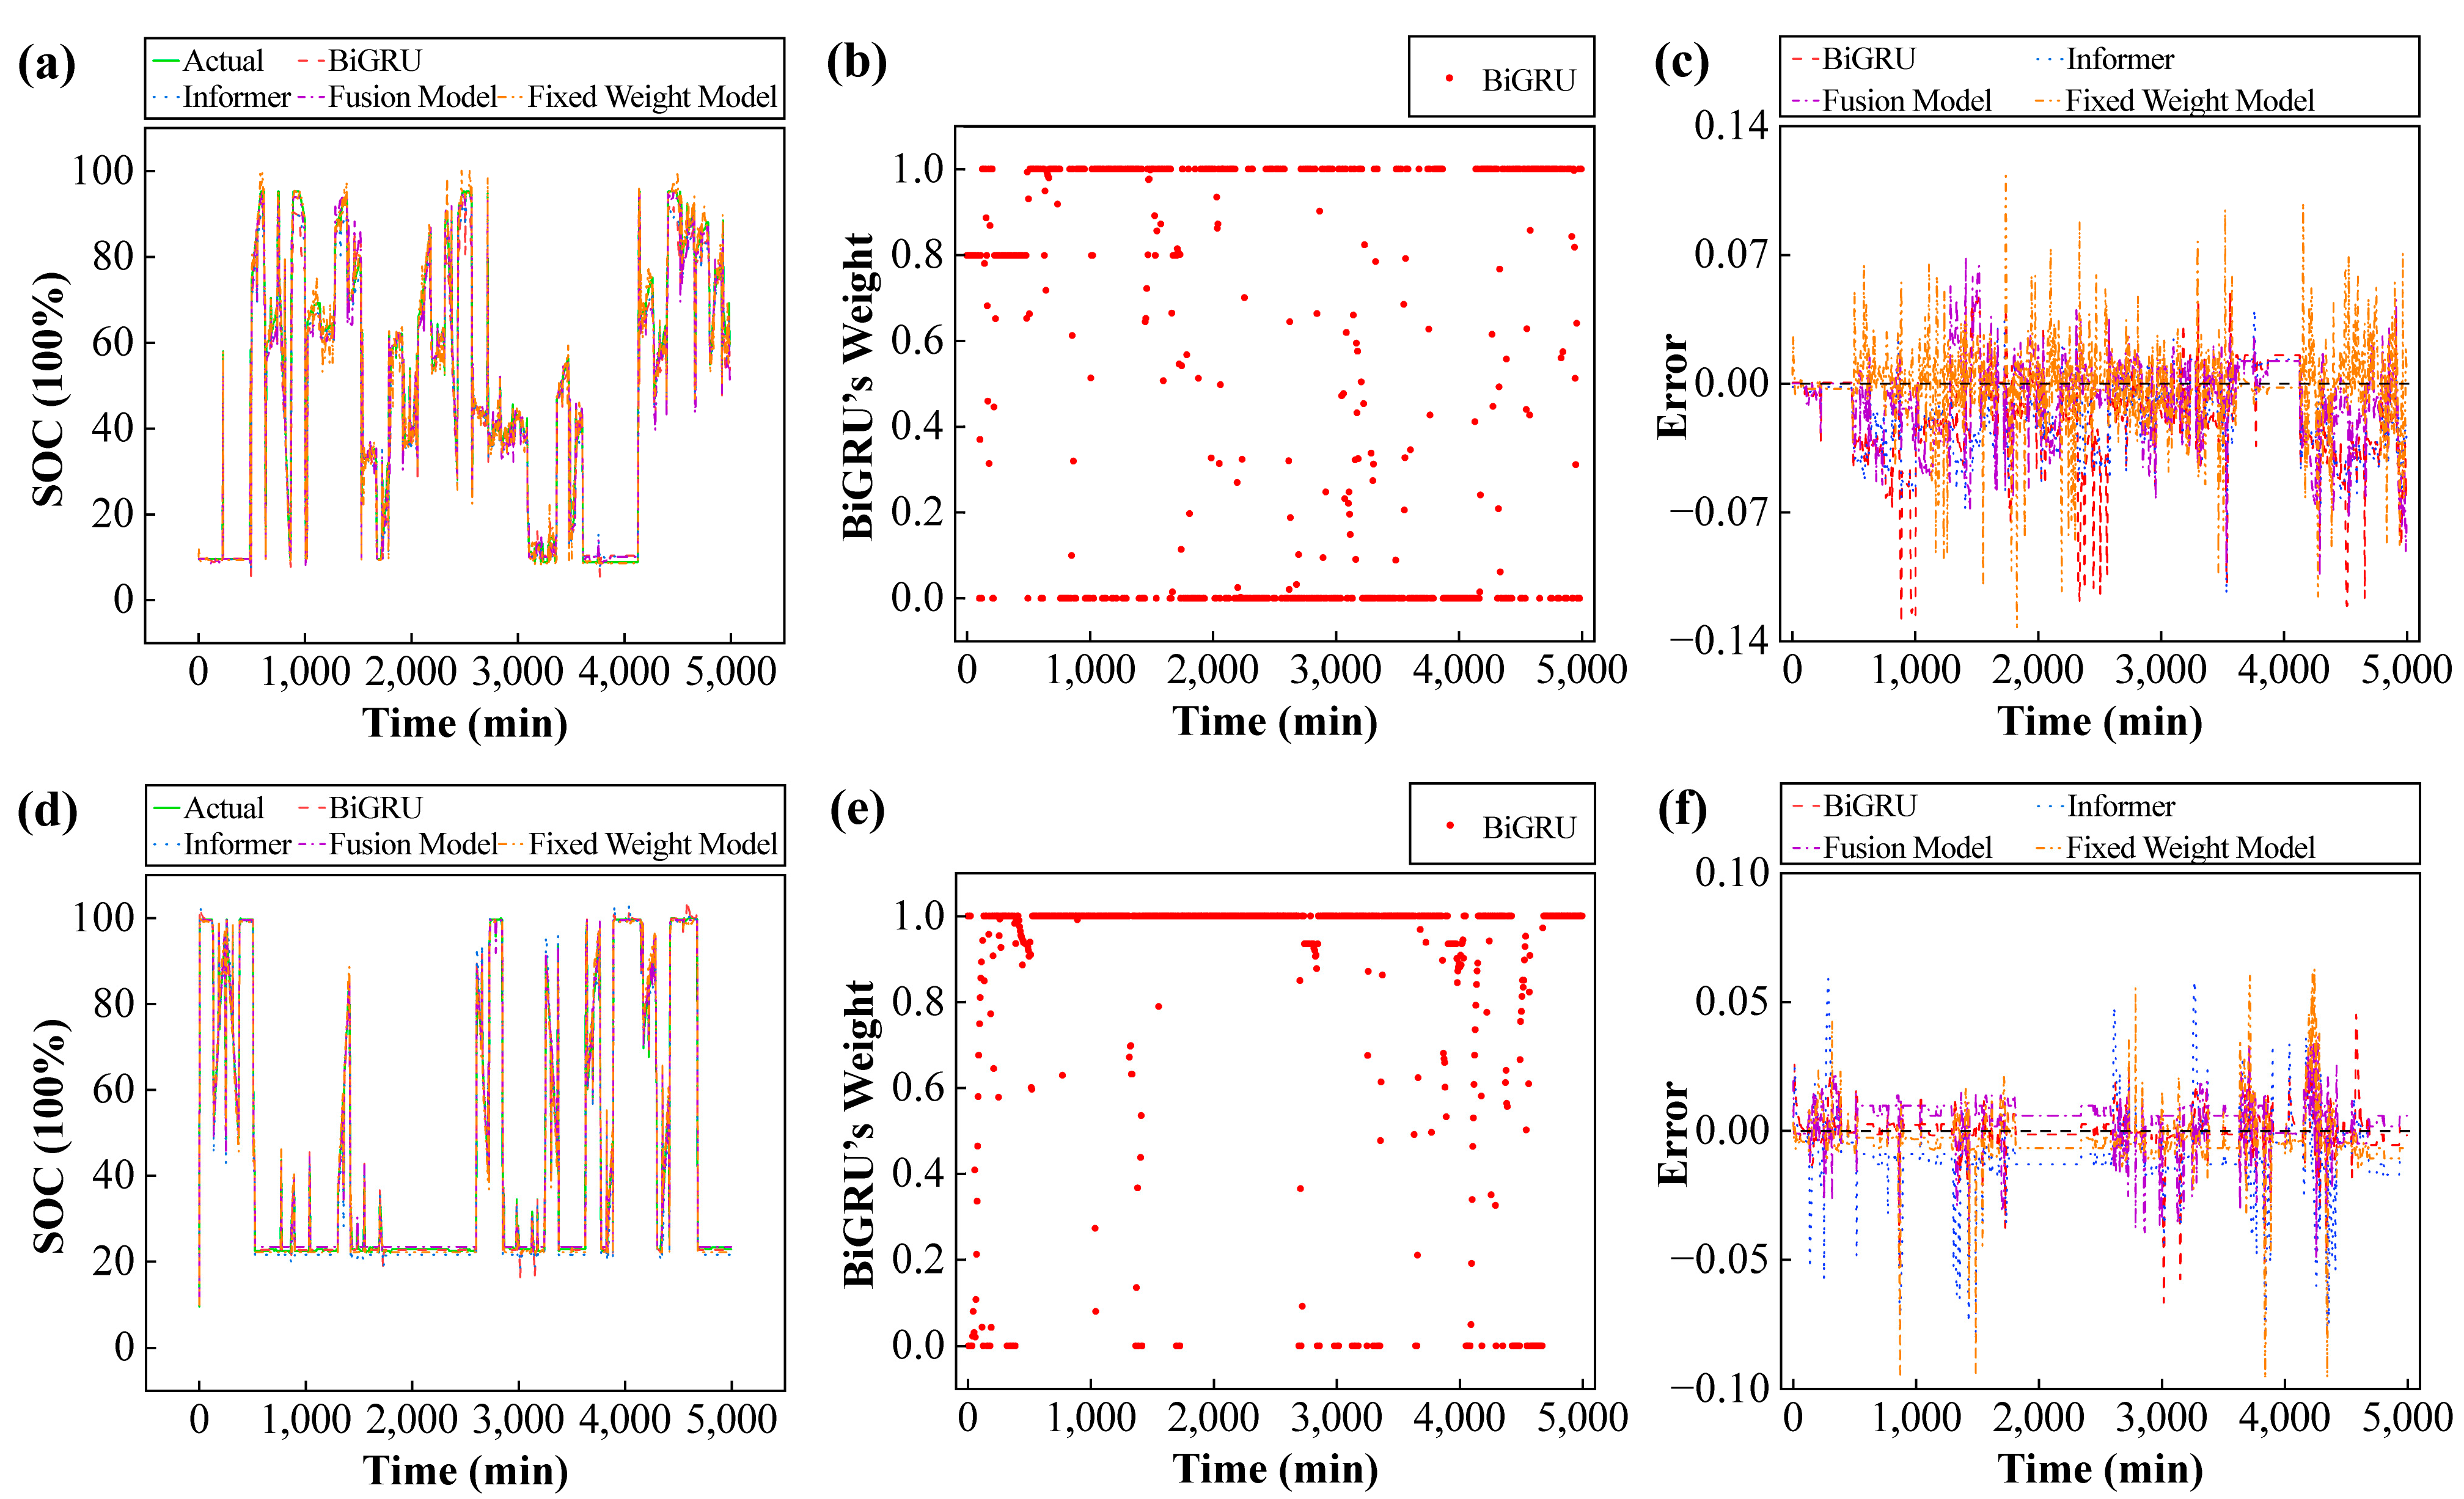
Figure 4, in the first quarter scenario, all four model categories closely track the reference SOC trajectory in a combined figure of BiGRU’s Weight Distribution Over Time. The weight exhibits abrupt jumps between 0, the midpoint, and 1 over the time dimension. To adopt a neutral and balanced strategy, the BiGRU weights are set to 0.5 in the fixed-weight model. This configuration ensures equal weighting for both branches of the model, thereby enhancing the consistency of the experimental setup. Their error patterns exhibit significant differences. For example, in
Figure 5a, the discrepancies between models become apparent between 500 and 2000 min. BiGRU exhibits higher sensitivity to step changes in the SOC and rapidly suppresses transient deviations; a slight overshoot is subsequently observed. The Informer demonstrated relatively stable peak control during this period, though a visible phase lag was present. The fusion model assigns higher weights to the BiGRU branch within this interval while correspondingly reducing the weight of the Informer branch. This adjustment minimizes peak error and shortens stabilization time without compromising response speed. The fixed-weight model lacks adaptive control, thus providing only a compromise response. In
Figure 5b, within 2000 to 3000 min. The Informer demonstrates significant advantages in modeling low-frequency components and long-range dependencies, evidenced by its SOC predictions exhibiting lower steady-state bias and reduced drift. BiGRU exhibits slight baseline drift during this phase. The fusion model increases the weight of the Informer branch within this interval, thereby achieving robust alignment with the long-term trend. Its error is lower than that of using either branch individually. The fixed-weight model cannot dynamically adjust their weights to balance transient response and steady-state accuracy. At this stage, the drift and fluctuation of the model’s SOC estimate typically fall between those of its two component branches. In
Figure 5c, BiGRU’s gated recurrent structure exhibits greater plasticity for short-term correlations and nonlinear transients. This behavior manifests as rapid convergence to the measured SOC within 2000 min. The ProbSparse attention mechanism in the Informer model is particularly effective at modeling long-range dependencies and low-frequency components of SOC. Within the first 2000 min, this mechanism exhibits low error drift but experiences a brief phase lag. The fusion model dynamically reweights the contributions of both branches through a time-step gating mechanism to balance transient response and steady-state accuracy. This enables simultaneous peak suppression and long-term trend adjustment.
The second quarter section in
Figure 5 shows that the measurement results exhibit more complex operating patterns, driven by the BMS in response to changes in environmental conditions. The system primarily operates in high SOC float charging and shallow cycle modes. Charging is concentrated during the early morning hours, while discharging occurs mainly during morning and evening peak periods. Owing to BiGRU’s sensitivity to local changes, it often overreacts to segments exhibiting significant SOC fluctuations, particularly at high SOC levels. The Informer model maintains robust trend-following performance over extended charge–discharge cycles. When subjected to abrupt or non-periodic disturbances, it exhibits transient, observable phase lags. In contrast, the fusion model dynamically reweights the contributions of both branches. It prioritizes the BiGRU branch during fast-switching intervals and the Informer branch during low-gradient intervals. Thereby reducing overshoot and phase lag. The fixed-weight model lacks adaptive capabilities. Under such circumstances, maintaining optimal balance proves extremely challenging, often compromising steady-state accuracy and transient alignment. In
Figure 5d, around 1500 min. BiGRU rapidly aligns with the measured SOC through its gating mechanism but remains susceptible to minor cumulative overshoots. The SOC prediction from Informer exhibits consistent phase lag. The fusion model rapidly adjusts branch weights near the disturbance frequency, thereby reducing the error envelope and accelerating convergence speed. Its steady-state prediction accuracy outperforms the fixed-weight model. In
Figure 5e, at approximately 3500 min, excessively high SOC levels cause battery pack temperatures to rise, leading to drift in equivalent circuit parameters such as resistance. This coupling effect exacerbates the trade-off between trend consistency and rapid step response in battery pack-level estimators. Informer exhibits the lowest steady-state bias at this stage but demonstrates transient phase lag in step responses. BiGRU shows slight baseline drift but rapidly readjusts after step changes. The fusion model increases the weight of the Informer branch within this interval and rapidly boosts the BiGRU branch weight during step transitions, followed by rebalancing the distribution.
As shown in
Figure 6, the third quarter featured high irradiation intensity and frequent charging–discharging conversion switching. During morning and afternoon periods, BMS control actions combined with minor load fluctuations resulted in a series of small step changes in the SOC. In
Figure 6a, over the interval 1500–3000 min. BiGRU employs a gating mechanism to promote rapid local nonlinear responses during this interval, thereby enhancing consistency between predicted and measured SOC while exhibiting a reduced tendency for cumulative overshoot. Informer is particularly effective at modeling long-range dependencies and low-frequency components, but it often exhibits consistent phase lag when responding to high-frequency, low-amplitude SOC fluctuations. The fusion model rapidly switches weights between two branches as the SOC changes. During transitions and perturbations, it biases weights toward the BiGRU branch. During stationary intervals, it biases weights toward the Informer branch. The peak error and lag decrease synchronously, with the error converging significantly. Fixed-weight models lack adaptive mechanisms and thus cannot update their predictions in a timely manner, and thus cannot update their predictions in a timely manner. In
Figure 5b, over the interval of 3000–4000 min during SOC stable intervals, the Informer exhibits low steady-state bias and reduced drift. BiGRU may exhibit slight baseline fluctuations. The fusion model increases the weight of the Informer branch within the SOC steady-state interval to enhance long-term trend consistency and suppress steady-state bias. Compared to the fusion model, the fixed-weight model exhibits poorer trend fidelity in this interval.
In the fourth quarter. The drop in ambient temperature caused an increase in equivalent internal resistance, resulting in a decrease in available capacity. During charge–discharge mode transitions. Peak morning electricity demand was pronounced, prolonging the voltage recovery time. In
Figure 6d, over the interval of 500–1500 min, BiGRU exhibits rapid step responses to SOC changes, but often shows slight overshoot under low-temperature and time-varying operating conditions. During this interval, the Informer model exhibits a big transient phase lag. The fusion model increases the weight of the BiGRU branch during step transitions and allocates resources toward the Informer branch during stationary intervals. Thereby simultaneously reducing peak amplitude and phase lag. In contrast, the fixed-weight model fails to adequately adapt to the non-stationary dynamics in this state.
As shown in
Figure 6e, under lower ambient temperatures, evening peak load periods are typically accompanied by longer discharge durations and greater depths of discharge. The reduction in load-related parameters and temperature-induced hysteresis is associated with an increase in the nonlinearity of the system’s time-domain dynamics. Over the 2500 min timeframe, the Informer maintains robust trend tracking and limited cumulative error. However, a transient phase lag was observed during load pulse events. BiGRU exhibits faster pulse tracking and reduced peak error, but it demonstrates gradual baseline drift over extended time intervals. During extended discharge intervals, the fusion model exhibits a bias toward the Informer branch. By temporarily increasing the weights of the BiGRU branch during pulse transitions, this model achieves the lowest overall error within this interval.
3.4. Generalization Experiments
In order to validate the sensitivity of the model to the effects of different seasonal temperatures on the SOC of the battery pack, and to assess the changes in charging and discharging behavior under seasonal variations, the experiments were designed to better replicate real-world BMS operating conditions. In addition to the intra-month cutoff experiment, a seasonal leave-one-out ablation experiment was conducted. The method divides the annual data into four seasons, each containing three months, selecting three seasons as the training set while using the remaining seasons as the test set. Compared to slicing by month, slicing by season resulted in greater differences in data distribution between the training and test sets.
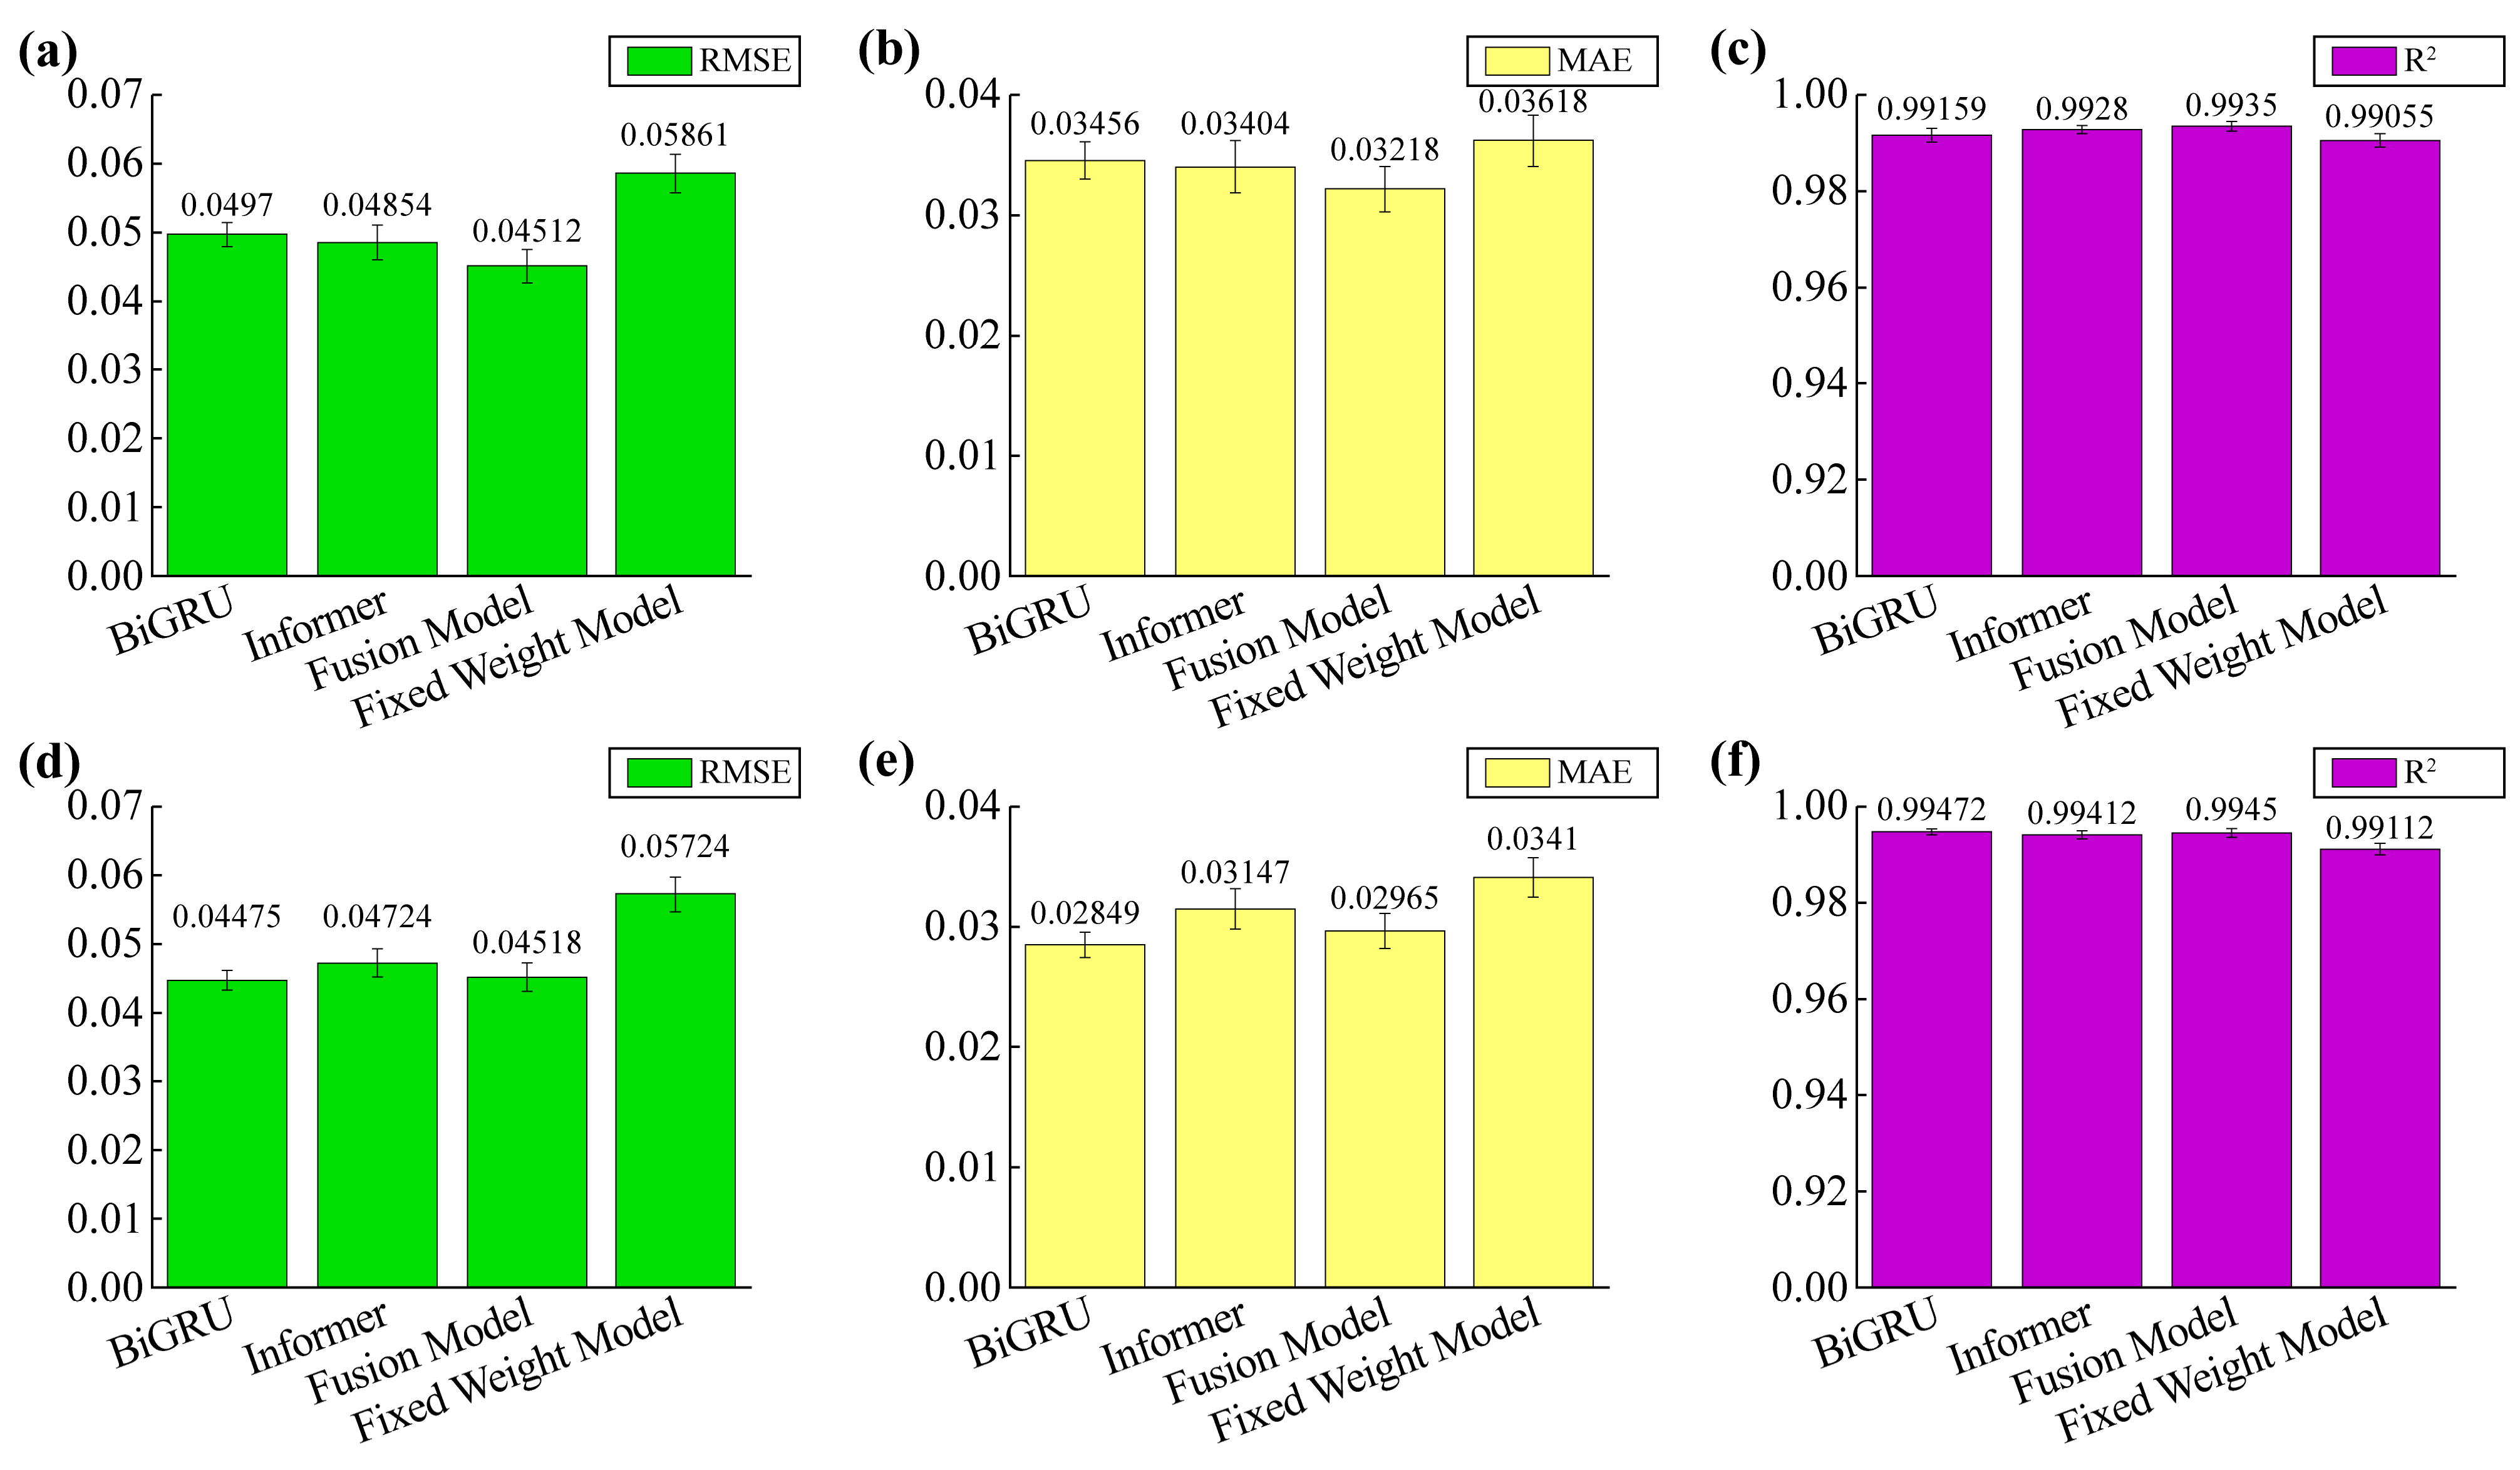
As shown in
Figure 7, from a holistic perspective, the integrated model demonstrated lower error rates and higher robustness compared to any individual submodels across both analysis quarters. Specifically, the fusion model achieves lower RMSE and MAE than any of its constituent submodels, with a smaller error line. Taken together, these results not only indicate lower average errors but also reduced variation between runs. Although all the models performed well in the first quarter, the performance gap widened further under the more complex operating conditions of the second quarter. As shown in
Figure 7a,d, compared to the first quarter, all the models exhibit higher overall RMSE in the second quarter, with longer error bars indicating increased variability during the run. This reflects the more challenging and non-steady pattern observed in photovoltaic integrated energy storage systems this quarter. Under these more challenging non-stationary conditions, the advantages of adaptive fusion become more pronounced because it dynamically reweights branch contributions based on the temporal context.
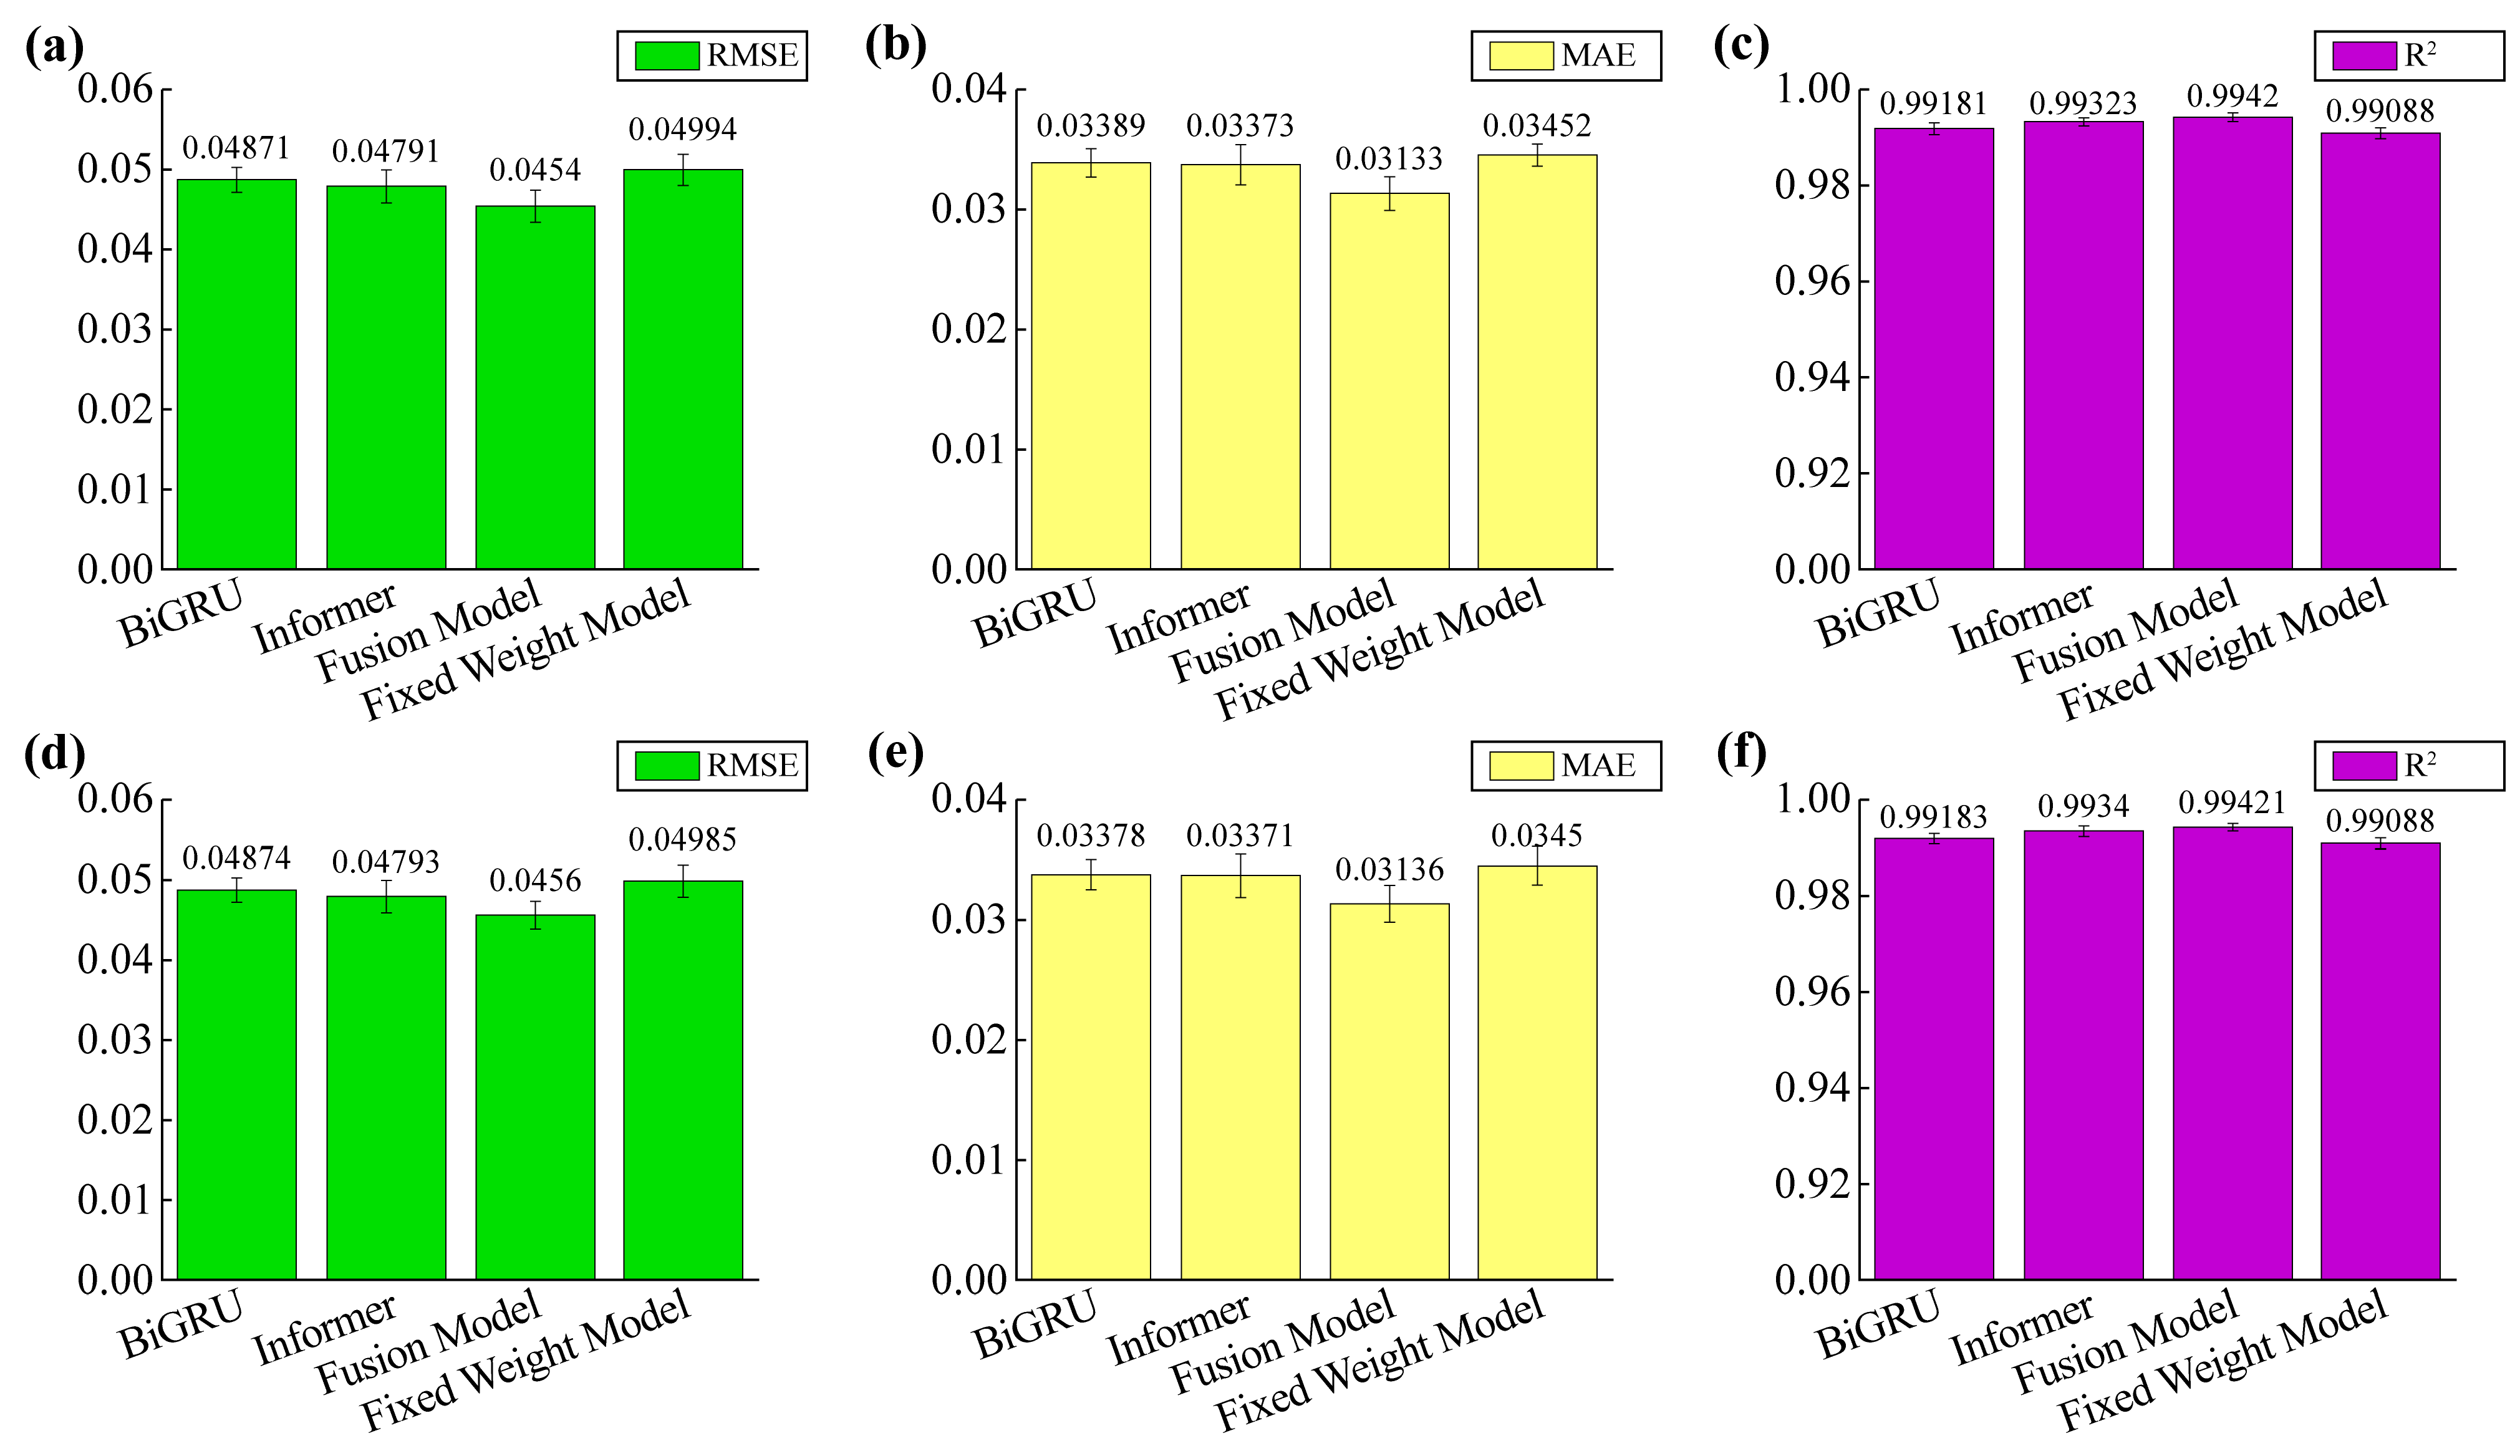
As shown in
Figure 8, in the third quarter and fourth quarter, the fusion model achieved the best performance among the compared models across all three performance metrics. Lower average errors and narrower error bands indicate reduced variability between runs. These results indicate that the model exhibits higher predictive accuracy and greater robustness. Among the models compared, the Informer model achieved the second-best performance, outperforming the other two models. As shown in
Figure 8b,e, it is worth noting that according to the report’s metrics, the independent model experienced a greater decline in performance from the third quarter to the fourth quarter compared to other models. In particular, BiGRU’s MAE exhibits greater volatility, as evidenced by the amplified standard deviation bars in the fourth quarter. These results indicate that under more pronounced seasonal variations, the model exhibits increased output variability and reduced estimation stability. The fusion model maintains a consistently low error state and exhibits reduced inter-run variability, demonstrating remarkable generalization capabilities under seasonal variations.
Comparative analysis of the two plots further confirms that the fusion model exhibits higher stability under changing seasonal generalization conditions and can effectively mitigate the effects of drifting data distributions due to seasonal changes. In contrast, the BiGRU and Informer networks exhibit significant volatility, with a large increase in errors observed in certain seasonal test scenarios. These results demonstrate that fusion models are better suited for complex real-world cross-seasonal scenarios, validating both the necessity and effectiveness of integrating the strengths of different network architectures.
3.5. Comparative Experiments
In this section, we compare the performance of different network models for battery pack SOC prediction under different data partitioning strategies. The results in
Table 7 show that the fusion model achieves optimal performance regardless of whether monthly segmentation or seasonal segmentation with quarterly test sets is used. These findings suggest that AVM fusion strategies exhibit strong generalization capabilities.
Specifically, the performance of the individual single models varied across the month-by-month experiments. Among them, Informer [
48], TCN [
48], BiGRU [
48], BiLSTM-PANN [
36], and CNN-BiGRU [
35] networks perform well in terms of RMSE and R
2. This demonstrates the superior ability of these sequence models to capture time dependence. Among these models, Informer and BiLSTM-PANN show particularly strong performance. This is attributed to Informer’s ability to capture long-range dependencies and the attention mechanism within the BiLSTM-PANN fusion model.
In the cross-quarter generalization experiments, the overall performance of the models degraded when a single quarter was used as the test set, but the magnitude of the degradation varied significantly between models. In these models, the D-Linear [
49] and LSTM-EKF [
24] networks perform significantly worse than the other networks, especially in terms of RMSE and MAE metrics. This suggests that simple linear and classical filtering models are not capable of predicting the SOC of battery packs in generalized scenarios across seasons. When using the second quarter as the test set, the N-Beats [
48] model has an RMSE of 9.26%, which is much higher than its RMSE in other quarters (about 5% to 7%). This indicates that the battery pack data characteristics in the second quarter are more complex or exhibit seasonal patterns, making it difficult for the N-Beats network to learn effectively.
Notably, BiLSTM-PANN, Informer, and CNN-BiGRU show consistently stable performance in seasonal tests. The relatively small variation in RMSE and R2 metrics across seasons suggests that these models are robust to seasonal variation. The TCN and BiGRU networks also show strong performance across seasons, although their results exhibit slightly larger fluctuations between seasons.
It is particularly noteworthy that the BiLSTM-PANN model showed the best performance when the first and fourth quarters were used as the test set. This can be explained by the operating characteristics of the two quarters. In the first and fourth quarters, electricity demand is relatively low, and the charging and discharging cycles are relatively regular. In this case, the BiLSTM structure excels at modeling sequential dependencies, while the PANN module further enhances feature representation by adaptively emphasizing salient temporal patterns.
Overall, the fusion model consistently achieved the best performance in the cross-seasonal experiments, significantly outperforming each individual model. These results suggest that fusing the predicted outputs of different model architectures using the AVM is an effective way to enhance model generalization. As a result, it is better equipped to meet the challenges posed by seasonal environmental changes in battery pack SOC forecasting. In the monthly segmentation experiment, the fusion model reduces RMSE by 9.18% and MAE by 12.21% compared to the BiGRU network. Relative to the Informer network, the converged model achieves an 8.69% reduction in RMSE and an 11.01% reduction in MAE. In the seasonal segmentation experiment, the fusion model reduces the RMSE by an average of 5.38%, respectively, compared to the BiGRU network, and 5.37% lower RMSE and 6.39% lower MAE compared to the Informer network. These results show that the AVM fusion strategy significantly improves the accuracy of battery pack SOC prediction. In addition, it enhances the generalization of the model across different seasons.
4. Discussion
Wang combined the first-order equivalent circuit model (ECM) with the EKF. Fuzzy logic correction was introduced to address battery heterogeneity and voltage hysteresis in NMC and LFP chemical systems [
50]. Zhang developed a nonlinear system of differential-algebraic equations based on the ECM. By combining observability analysis with a Luenberger-type observer, the SOC of individual cells can be estimated using only battery pack-level measurements [
51]. This method explicitly incorporates physical knowledge such as electrochemistry and equivalent circuits, offering excellent interpretability, and possesses a certain degree of extrapolation capability under moderate operating condition variations. Such models typically require explicit model identification, parameter calibration, and expert tuning. When significant changes occur in battery configuration, chemical composition, or operating conditions, these tasks become computationally costly and inflexible. They rely too heavily on simplified physical assumptions, which limit their accuracy in complex or highly nonlinear real-world scenarios.
In contrast, our proposed method adopts a purely data-driven framework that directly learns the time-dependent mapping from battery pack current and cell SOC to battery pack SOC using deep learning from the dataset. This approach eliminates the need for physics-based parameterization, enhances adaptability to different system dynamics, and reduces engineering overhead. By training on large-scale historical data, the model can capture lagged effects, aging behavior, and multi-factor interactions that are typically difficult to explicitly model, making it more suitable for actual BMS operating in complex and constantly changing environments.
A limitation of the current approach lies in its validation and optimization being primarily conducted within the LFP chemical system. This focus imposes several constraints. LFP typically exhibits a very flat open-circuit voltage plateau, with minimal voltage variation across a wide SOC range. Reduced sensitivity to voltage characteristics introduces greater uncertainty in SOC estimation. Other chemical systems (NMC and NCA) often exhibit steeper OCV–SOC curves, resulting in stronger correlation between voltage signals and SOC. LFP typically exhibits differences from other chemical systems in terms of internal resistance behavior, aging trajectories, and temperature sensitivity.
In future work, our approach will require some adjustments to be adapted to other chemical systems:
- (1)
The input feature set can be enhanced by incorporating characteristics such as differential voltage, incremental resistance, and impedance-derived signals, which offer greater distinguishability on steep OCV curves.
- (2)
The network architecture or hyperparameters must be retrained or fine-tuned for the target chemical system.
- (3)
Transfer learning may be employed by pre-training the model on a large-scale LFP dataset, then fine-tuning it on NMC/NCA system data.
Previous studies have demonstrated this adaptability across chemical systems. Zheng proposed an adaptive SOC estimation method for LFP–NMC hybrid battery packs. The internal model can be dynamically adjusted to accommodate variations in chemical systems [
52]. Barik systematically reviewed SOC estimation methods for various lithium-ion chemical systems, emphasizing the urgent need for more flexible, chemistry-agnostic strategies in real-world BMS scenarios [
53]. Inspired by these works, the methods described in this paper, after adaptation and optimization, are feasible and hold potential for extension to other chemical systems.
This study primarily focuses on the offline evaluation of the model we propose. In the actual deployment of BMS, real-time feasibility is critical. A key factor in real-time deployment is inference time. It directly impacts the system’s ability to provide timely SOC estimates during battery operation. In this study, the inference time for each batch of the tested models was as follows: the BiGRU model averages 4.05 s per batch, the Informer model takes 4.61 s, while the fusion model requires 8.18 s.
Although these times are reasonable in offline experiments and suitable for batch processing, they exceed the typical real-time requirements in BMS applications. BMS reasoning typically needs to be completed within milliseconds. Reducing inference time is critical during real-time deployment. This can be achieved through model pruning, quantization, or the use of lightweight models.
Furthermore, computational requirements are another important factor that must be considered. The models we tested in this study are computationally intensive. In particular, the fusion model combines multiple model branches with the stability of time series, and has greater complexity. In real-time deployment scenarios, strategies such as distributed computing and edge processing can be explored to ensure the system meets real-time constraints.
Future work will focus on optimizing inference time and computational efficiency to make fusion models more suitable for real-time BMS applications. This will involve reducing model size, optimizing the inference process, and testing on hardware platforms capable of handling real-time requirements.
5. Conclusions
In this paper, we propose a battery pack SOC prediction framework that combines redundant control-related downscaling with AVM fusion mechanisms. The method effectively reduces the input dimension by 81.25% through redundant control while maintaining the prediction accuracy. The AVM combines BiGRU’s ability to model short-term time series with Informer’s strength in extracting long-term features, resulting in an effective fusion of individual cell coupling information and battery pack estimation. In monthly segmentation experiments, this fusion model reduces the RMSE and MAE of BiGRU by 9.18% and 12.21%, respectively. The RMSE and MAE are 8.69% and 11.01% lower than the Informer network, respectively. The fusion model achieved an R2 of 99.72%. In the seasonal segmentation experiment, the fusion model reduces the RMSE by 5.38%, respectively, compared to the BiGRU network. RMSE and MAE are 5.37% and 6.39% lower than the Informer network, respectively. The fusion model achieved an average R2 of 99.41%. The results show that the proposed dimensionality reduction strategy combined with the AVM fusion mechanism significantly improves the SOC prediction accuracy of the battery pack. Furthermore, it enhances the model’s ability to generalize across seasons.
All the experiments in this study were conducted offline using battery pack data. The reported accuracy should be understood as the upper limit of performance in an offline environment, not the performance expected from a real-time online BMS. The current experimental setup demonstrates high accuracy under offline conditions. However, it fails to fully reflect the real-time constraints encountered in online deployments, such as processing latency and data availability. In future work, we plan to implement a strictly causal online deployment version. Rigorously validate its performance under practical operational constraints. This will involve addressing challenges such as processing real-time data streams, ensuring low-latency inference, and adapting to the dynamic use of batteries in real-world environments.
Overall, the model proposed in this paper provides reliable technical support for battery pack SOC estimation and demonstrates its potential for energy storage applications. In the future we plan to further extend the applicability of the model. This includes extending the framework to accommodate a wider range of battery pack types and exploring in depth the coupling mechanisms between battery cells and battery packs. In addition, we will examine other key factors that affect battery state estimation. We are committed to developing a more professional and accurate BMS.
