Article

Deep Reinforcement Learning-Based Optimization of Mobile Charging Station and Battery Recharging Under Grid Constraints

ConnectSmart Research Laboratory, University of Tennessee at Chattanooga, Chattanooga, TN 37403, USA
*
Author to whom correspondence should be addressed.
Energies 2025, 18(20), 5337; https://doi.org/10.3390/en18205337
Submission received: 28 August 2025 / Revised: 27 September 2025 / Accepted: 3 October 2025 / Published: 10 October 2025

Abstract

With the rise in traffic congestion, time has become an increasingly critical factor for electric vehicle (EV) users, leading to a surge in demand for fast and convenient charging services at locations of their choosing. Mobile Charging Stations (MCSs) have emerged as a new and practical solution to meet this growing need. However, the limited energy capacity of MCSs combined with the increasing volume of charging requests underscores the necessity for intelligent and efficient management. This study introduces a comprehensive mathematical framework aimed at optimizing both the deployment of MCSs and the scheduling of their battery recharging using battery swapping technology, while considering grid constraints, using the Deep Q-Network (DQN) algorithm. The proposed model is applied to real-world data from Chattanooga to evaluate its performance under practical conditions. The key goals of the proposed approach are to maximize the profit from fulfilling private EV charging requests, optimize the utilization of MCS battery packages, manage MCS scheduling without causing stress on the power grid, and manage recharging operations efficiently by incorporating photovoltaic (PV) sources at battery charging stations.

1. Introduction

1.1. Motivation and Problem Statement

The increasing demand for EVs is reshaping the transportation landscape by offering a cleaner and more sustainable alternative to traditional fossil fuel-powered vehicles. The electrification of the transportation sector has become a global priority as nations seek to reduce their carbon footprints and mitigate the effects of climate change. EVs have been widely adopted as an alternative to internal combustion engine vehicles, offering significant reductions in greenhouse gas emissions and fossil fuel dependency. However, with the rapid growth of EV adoption, several critical challenges have emerged, particularly concerning the charging infrastructure. Issues such as limited access to charging stations, long waiting times, high operational costs, congestion during peak demand time, the inability to service remote or populated urban areas, and uneven distribution of charging locations have made it difficult for EV users to fully embrace the technology. These challenges also contribute to range anxiety, a major concern for EV drivers [1,2,3,4]. One promising solution to these challenges is the development of MCSs. Unlike fixed charging stations (FCSs), which are geographically bound and can become congested during peak hours, MCSs offer flexibility by providing on-demand charging at various locations. MCSs are particularly valuable in urban areas where space is limited for permanent charging infrastructure and for addressing the spatiotemporal heterogeneity of EV charging demand [5,6,7,8]. These MCSs can be dispatched to specific areas based on real-time demand, offering an adaptable and scalable solution to EV charging, thus reducing charging times and alleviating range anxiety. Ref. [9] presents a framework for optimizing the operation of MCS for EVs, using a mixed-integer linear programming (MILP) model and a genetic algorithm (GA) to maximize profits and enhance user satisfaction. The authors in [10] introduce a profit-maximizing assignment strategy for idle MCSs, using heat maps to track EVs in need of charging. This approach enhances MCS assignment efficiency and increases profitability by targeting high-demand areas. A self-scheduling model for smart parking lots with MCSs is developed in [11], prioritizing EV charging demands based on social equity factors and optimizing energy generation and storage.
Although the allocation of MCSs to EVs for charging addresses many challenges related to energy supply, incorporating precise planning for charging the batteries of these MCSs, as well as scheduling timely battery replacements, can significantly enhance this allocation process. To achieve optimal allocation and maximize the profit for MCSs, it is essential to develop an efficient schedule and location plan for charging the batteries. Additionally, forecasting suitable times and locations for battery replacements when necessary can prevent time and cost waste, thereby enhancing the system’s overall stability and profitability. The integration of renewable energy resources, such as solar with EV charging infrastructure, has been recognized as a critical step toward creating sustainable charging systems. FCSs can incorporate photovoltaic (PV) systems along with battery energy storage systems (BESSs) to store excess energy and provide power during peak demand periods. BESSs enable FCSs to store excess PV energy generated during off-peak hours, which can then be used for MCS charging during high-demand periods, thereby reducing the strain on the power grid. This approach not only supports the use of clean energy but also improves the resilience of the energy supply [12,13,14,15].

1.2. Related Work

Ref. [16] proposes an optimal power dispatch model for a grid-connected EV charging station with renewable energy and battery storage to enhance reliability and reduce costs. Ref. [17] addresses the optimization of mobile renewable energy charging station locations, aiming to support EV adoption and reduce carbon emissions.
Time-of-Use (ToU) pricing is widely adopted in EV charging management studies as it provides an effective incentive to shift demand from peak to off-peak hours, thereby reducing operational costs and alleviating stress on the distribution grid [6,18].
Robust planning of MCSs for EV charging requires advanced optimization methods. Classical optimization methods are limited in addressing complex, dynamic problems. They rely on fixed objective functions and lack adaptability to changing environments. Additionally, they cannot dynamically interact with or learn from the environment and are unable to utilize neural networks for multidimensional problem-solving, often focusing only on short-term gains. In recent years, MCSs have evolved with the integration of advanced optimization techniques such as Deep Reinforcement Learning (DRL) to improve their scheduling and routing. DRL allows MCSs to make real-time decisions based on the locations of EVs with low battery levels, dynamically dispatching MCSs to areas with higher demand. This not only improves charging efficiency but also ensures better utilization of MCSs, reducing idle times and maximizing service coverage. The use of DRL has shown significant promise in managing complex EV charging scenarios, especially in smart cities where the charging demand fluctuates based on the time and location [19,20,21]. Ref. [22] proposes a multi-agent reinforcement learning framework to optimize EV charging in smart cities, enhancing coordination among stations, reducing wait times and failure rates, and improving user satisfaction. Ref. [23] presents a DRL model to solve the EV routing problem with time windows, optimizing routes effectively for large-scale cases.
The rapid expansion of smart distribution networks, increased utilization of PV systems, and the growing presence of EV charging stations have significantly increased the complexity of power network management. Due to their variable nature and high power demand, charging stations contribute to increased losses, voltage drops, and fluctuations within the network. On the other hand, PV systems, due to their intermittent generation and dependence on weather conditions, lead to voltage fluctuations and power backflow into the grid. Energy storage systems, with their controllable charging and discharging capabilities, play a crucial role in voltage regulation, load balancing, and improving network efficiency. Therefore, the coordinated integration of these resources and the application of effective management strategies are essential for maintaining stability and enhancing the reliability of power systems. Load flow monitoring is one of the fundamental issues in power systems, aimed at determining the optimal distribution of active and reactive power within a network. The primary objective of load flow analysis is to determine the voltage, phase angle, current, and power at each point in the network to ensure optimal and stable system performance [24,25,26,27,28].
Various studies have proposed effective solutions to enhance power flow management in distribution networks with high penetration of EVs and renewable energy sources. The authors in [29] utilized probabilistic power flow analysis in combination with machine learning, enabling the accurate prediction of network congestion and improved power management. The authors in [30] applied an optimal power flow formulation, which increased the EV hosting capacity and reduced voltage fluctuations and power losses by controlling power injection at the connection points. The Newton–Raphson (NR) load flow method that incorporates Weak Bus Placement is presented in [31] to identify the optimal locations for installing distributed generators, leading to improved network stability and reduced voltage fluctuations. As presented in [32], power flow management in DC fast charging stations integrated with the power grid, PV systems, and BESS has been optimized using linear active disturbance rejection control and a modified Maximum Power Point Tracking algorithm. Using the Enhanced Coati Optimization Algorithm, the probabilistic optimal power flow problem has been solved in [33], considering uncertainties in solar and wind energy generation as well as EV charging. Power flow management in distribution networks with high penetration of EVs and renewable energy sources has been improved in [34,35,36,37,38] through the use of optimization methods and control strategies.
To the best of our knowledge, none of the existing studies simultaneously address profit maximization, battery swap technology, PV integration, and demand uncertainty management for MCSs within a unified framework. Unlike the studies in [2,9], which primarily focus on optimizing MCS scheduling to maximize profits, this study expands its scope by integrating PV, as highlighted in [14,17], to reduce reliance on the grid and operational costs. Unlike [11], which emphasizes social equity in EV charging, this study adopts a broader perspective by combining economic, environmental, and technological dimensions to create a unified, sustainable framework for MCS operations. Furthermore, while ref. [17] employs the differential evolutionary Q-learning (DEQL) method to tackle demand uncertainty, this study extends the approach by exploring the potential application of the DQN algorithm to enhance real-time adaptability. Ref. [39] studies the coordinated operation of multi-energy microgrids with hydrogen integration and congestion management through a safe policy learning approach. While their work addresses congestion management in multi-energy microgrids, our study focuses on MCSs for EVs, where the challenge lies in the real-time scheduling of services and managing the impact of MCS battery charging on the distribution grid. Moreover, in contrast to [6], which focuses on urban EV management through MCS scheduling, and [10], which uses profit-maximizing strategies for idle MCSs, this study also evaluates the feasibility of battery swap technology as a solution to improve operational efficiency.

1.3. Proposed Approach and Contributions

To address the research gaps, this paper proposes a scheduling model for MCSs as a complex multi-agent scheduling problem, aiming to maximize profits, optimize the EV charging process, and reduce stress on the power grid during peak hours. Given the uncertainty in charging demand, the DQN algorithm is applied to provide optimal responses and effective scheduling to address fluctuations. Additionally, the use of battery swap methods to meet a higher number of charging requests and incorporating PV as an auxiliary source enhance the efficiency of these stations. The major contributions of this paper are summarized as follows:
  • A decision-making framework that schedules MCSs and EVs charging to maximize profits, reduce grid stress at peak hours, and address demand uncertainty using the DQN algorithm.
  • Integration of PV with MCS as an auxiliary source to increase income and minimize reliance on the grid during peak consumption hours.
  • Implementation of MCS battery swapping to efficiently respond to more EV charging requests and improve overall service performance.
  • Analysis of the impact of MCS battery charging on grid constraints, and the introduction of a scheduling approach to ensure safe and efficient operation.

2. Overview

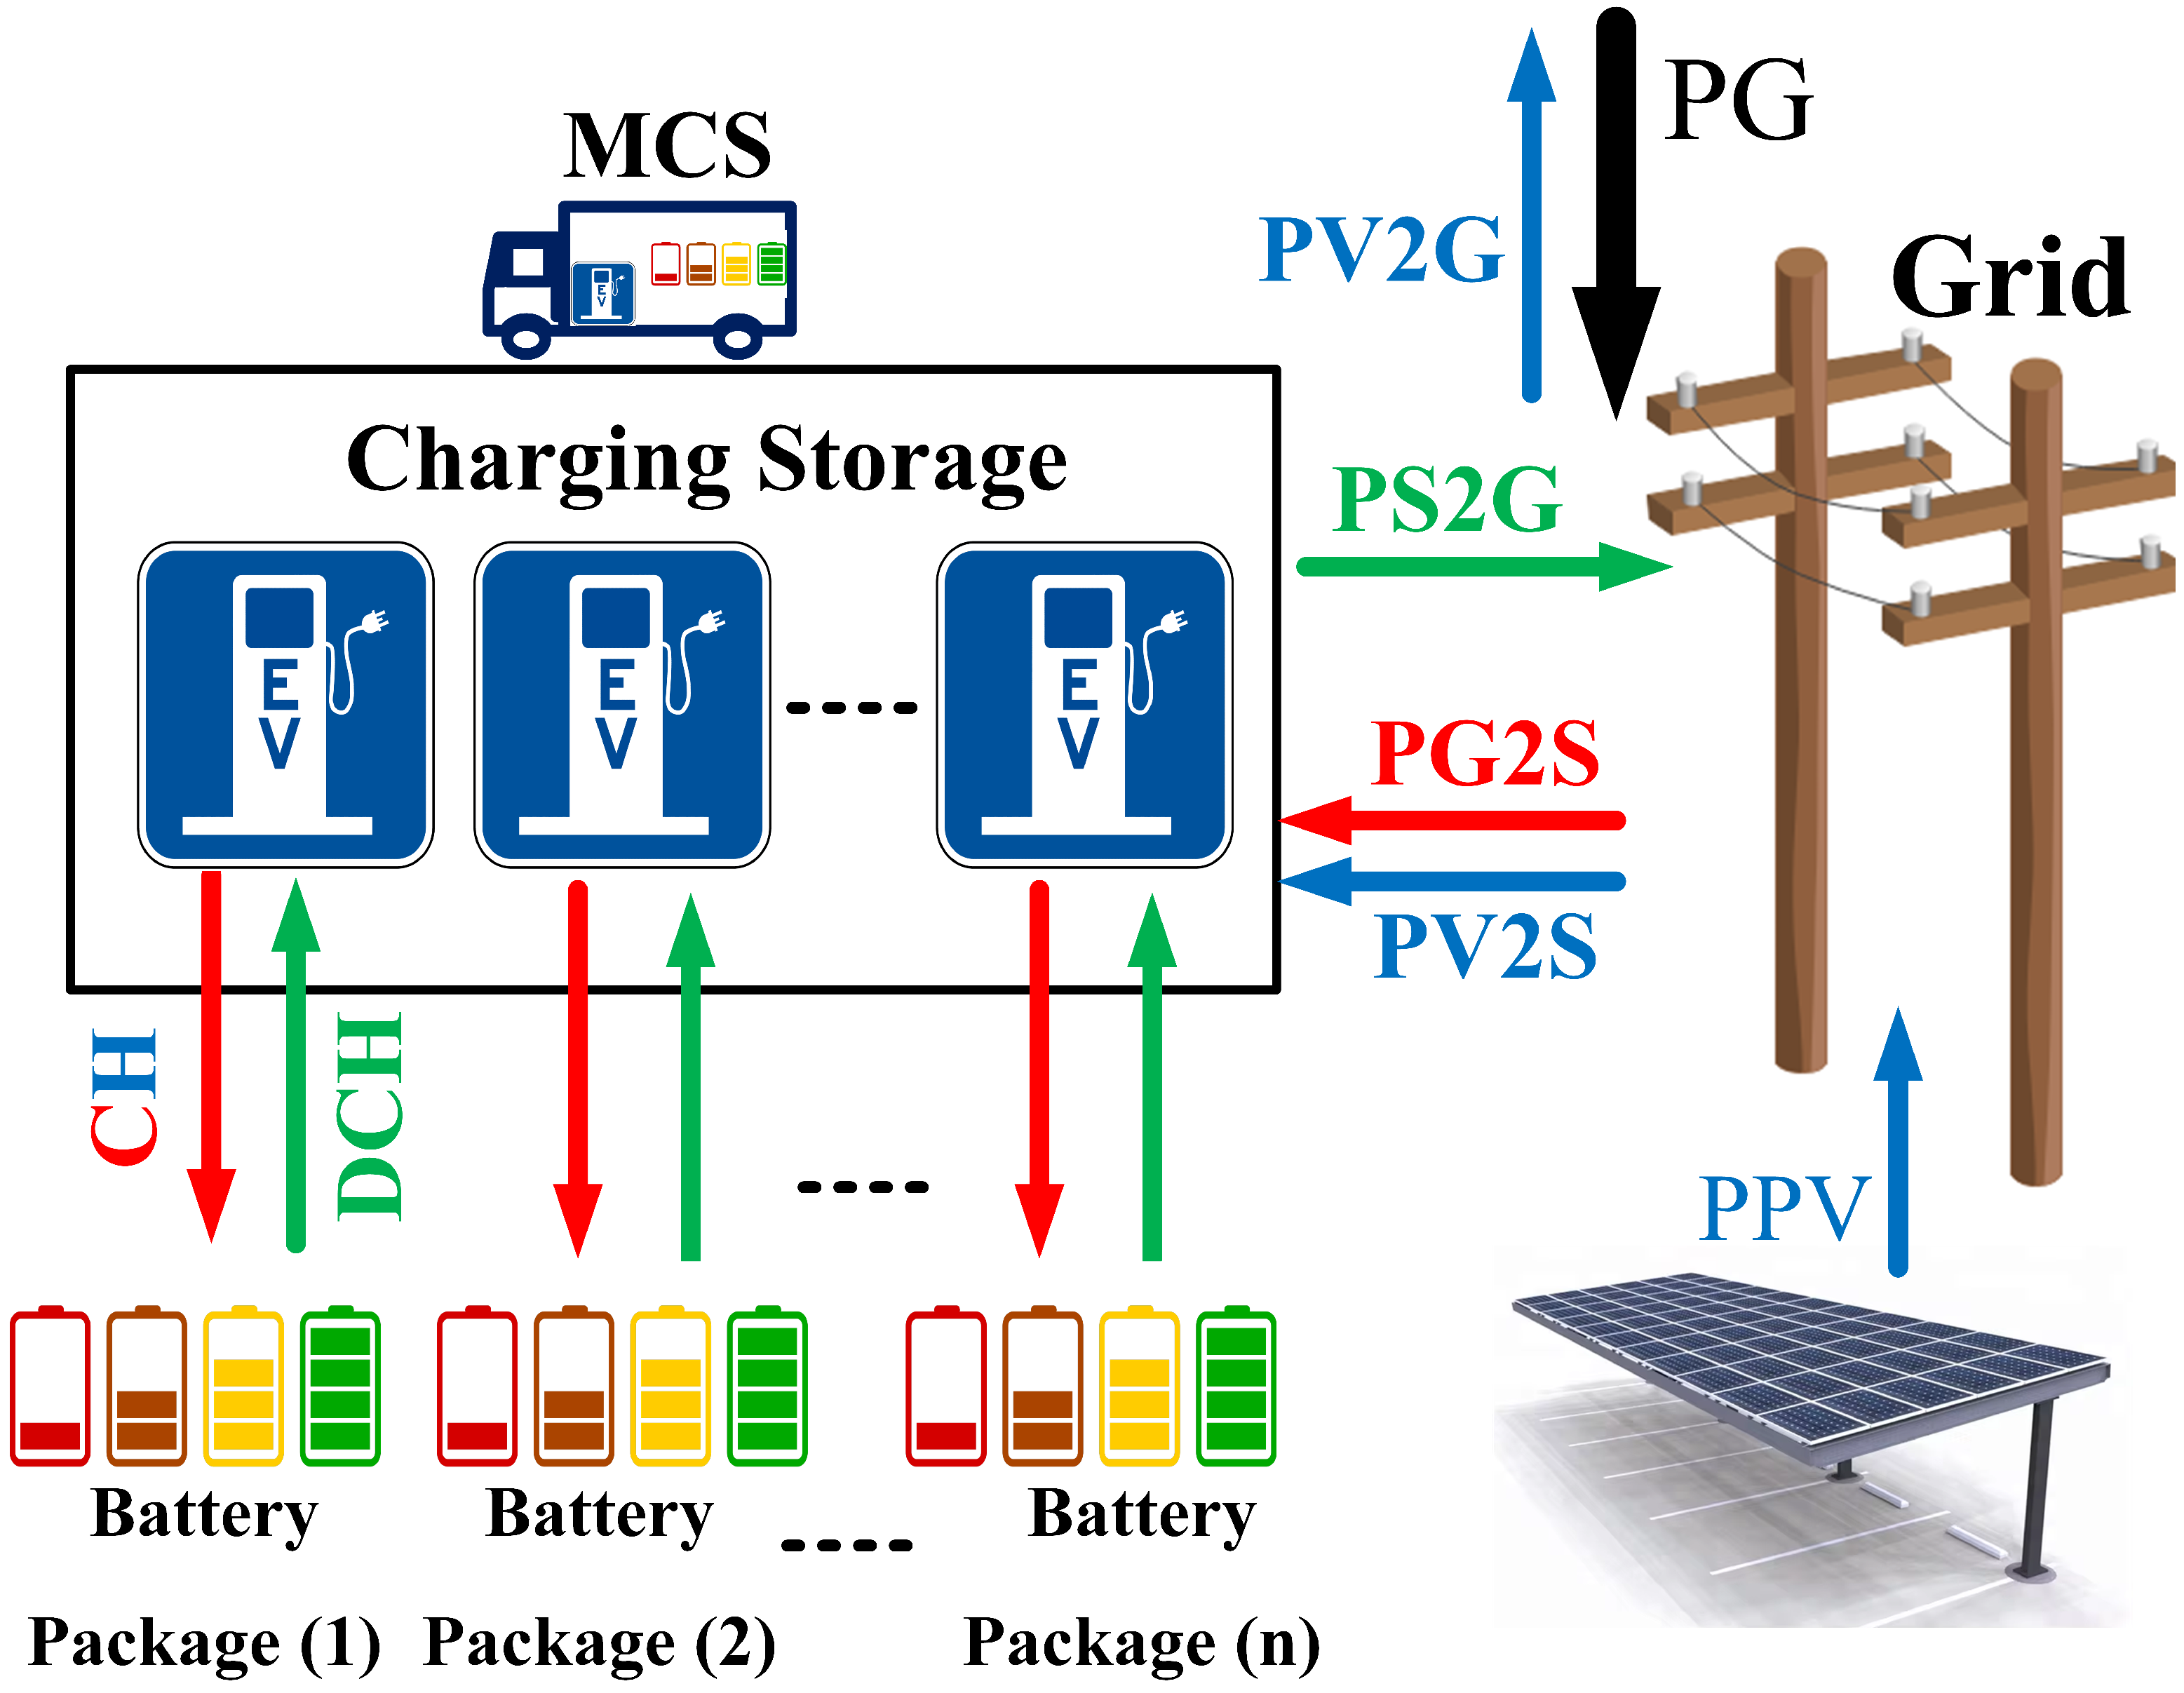
As a new component in the transportation system, MCSs play a key role in EV charging schedules. To meet demand efficiently, a strong mathematical model based on customer history is essential. MCSs face two main challenges: optimizing service timing to cover maximum EV requests and refilling energy storage promptly. This study explores two scheduling stages: first, optimal MCS scheduling for EV requests, and second, managing battery recharges in BESS stations to meet MCS energy needs. Then, the limitations of the power grid are considered for this scheduling. Figure 1 shows the proposed scheduling model. The scheduling framework is built on a few simplifying assumptions. We limit the analysis to charging requests from private passenger EVs. MCSs are modeled as plug-in service units that can handle only one vehicle within each decision interval. Incoming requests are assumed to be known slightly in advance, which enables timely scheduling decisions. The power network is represented by a standard radial distribution test system, and electricity costs follow a time-varying tariff structure.

3. Mathematical Model

3.1. Optimizing the Distribution of MCSs to EV Charging Requests

The objective function of this research consists of two parts: the first part maximizes the MCS revenue from delivering energy to EV requests, and the second part is the optimal managing and charging of portable battery packages for MCSs.
F 1 = max j Ω m c s i Ω e v t T C i , j t o t a l
Equation (1) aims to maximize the income generated from charging EVs by MCSs.
The income generated from charging EVs is shown as follows:
C i , j , t t o t a l = P i , j , t     λ j , t m c s + α j     P i , j , t 2 + λ i , j , t d e l     U i , j , t m c s   t o   e v
In Equation (2), each part respectively determines the income generated from the power sold by each MCS to the EVs, the battery depreciation cost, and the delivery cost; α i , P i , j , t , λ i , j , t d e l and U i , j , t represent the Battery Depreciation Cost (BDC) coefficient, the requested power of each EV at time t, the delivery cost considering the relocating cost of MCS, and the connection binary variable of M C S j to E V i at time t, respectively. It should be noted that these terms are not internal operating expenses of the MCS but rather the service charges that are collected from the EVs in exchange for receiving energy, compensating battery usage, and covering transportation.
The constraints related to connecting the EV to the MCS are shown as follows:
U i , j , t m c s   t o   e v A ¯ i , t i , j , t
P i , j , t = U i , j , t m c s   t o   e v     P i , t R e q u e s t η j t r j , t
Equation (3) states that each connection status of MCS must be based on the request from an EV during the day ( A ¯ i , t ). Equation (4) states that the delivered power from MCS to EV must be based on the requested power ( P i , t R e q u e s t ), the efficiency coefficient ( η j t r ) and MCS status at that time interval.
W j , t 1 i Ω e v U i , j , t m c s   t o   e v
U j , b , t m c s   t o   b W j , t
Equations (5) and (6) show that the MCS can proceed with battery replacement ( U j , b , t m c s   t o   b { 0 , 1 } ), and the variable W j , t { 0 , 1 } is set to 1 only if no EV service has been scheduled during that time interval.
U j , b , t m c s   t o   b S O C k , b , t 1
Equation (7) shows that the possibility of replacing the MCS battery with battery b is allowed when the state of charge related to the battery b in the storage station k ( S O C k , b , t 1 ) is equal to 1. This constraint does not govern the overall SOC evolution; rather, it serves as a binary signaling condition to ensure that only fully charged batteries are eligible for swapping, since the fully charged packs deliver only to MCSs in practice.
E ̲ j , t m c s E j , t m c s E ¯ j , t m c s
E N j , t m c s E ¯ j , t m c s E j , t 1 m c s
E N j , t m c s ( E ¯ j , t m c s E ̲ j , t m c s )     b Ω B U j , b , t m c s   t o   b
E j , t R e q u e s t = Δ t     i Ω e v P i , j , t
E j , t m c s = E N j , t m c s + E j , t 1 m c s E j , t R e q u e s t
Equations (8)–(11) represent the constraints related to the amount of energy reduction from the MCS’s total energy. Equation (12) shows the final energy level of the MCS at the end of the time interval t, considering whether energy has been delivered to the vehicle or the battery has been replaced.

3.2. Charging Optimization at Storage Station

Figure 2 shows that the batteries placed at each station can obtain energy based on their current energy levels from the upstream grid, the available PV power, and the energy discharged from neighbor batteries. The optimal power scheduling is aimed at quickly preparing a fully charged BESS. Simultaneously, the charging schedule aims to minimize storage station costs while maximizing energy exchange between BESSs, considering the grid exchange price. The objective functions of battery storage stations are shown as follows:
F 2 = m i n [ k Ω K t T ρ t     ( P G 2 S k , t P S 2 G k , t P V 2 G k , t ) k Ω K t T P S 2 B P k , t ]
In this equation, ρ t represents the exchange energy price of the grid at each time t.

3.2.1. Grid Constraints

The grid constraints are shown as follows:
P G k , t = P G 2 S k , t P S 2 G k , t P V 2 G k , t
| P G k , t |   P G k M a x
Equations (14) and (15) show the maximum exchangeable power with the upstream grid. In these equations, P G k , t , P G 2 S k , t , P S 2 G k , t and P V 2 G k , t represent the exchanged power by each charging station to the upstream grid, the power purchased from the upstream grid by each storage station, the power sold to the upstream grid by each storage station, and the power sold to the upstream grid by the PV, respectively.

3.2.2. PV Constraints

The constraints related to PV production are shown as follows:
P V 2 S k , t + P V 2 G k , t P P V k M a x
In this equation, P V 2 S k , t and P P V k M a x represent the power transferred to the storage station by the PV and the maximum generated power of the PV at each time t, respectively.

3.2.3. Storage Constraints

The constraints related to exchanging power in the storage system are shown as follows:
P G 2 S k , t + P V 2 S k , t + P S 2 B P k , t P C H S k , t
Equation (17) shows the total power provided to charge the batteries. In this equation, P C H S k , t and P S 2 B P k , t represent the charging power of the storage station and the power exchange between BESSs, respectively.
P S 2 G k , t + P S 2 B P k , t P D C H S k , t
Equation (18) shows the total power delivered from the discharging of the batteries. In this equation, P D C H S k , t represents the discharging power of the storage station.
P S 2 G k , t Z k , t     P S G k M a x
P G 2 S k , t + P V 2 S k , t V k , t     P S k M a x
Z k , t + V k , t 1
Equation (19) shows the maximum power that can be delivered from the storage system to the upstream grid ( P S G k M a x ). Equation (20) shows the maximum energy that can be provided to the storage system ( P S k M a x ). Equation (21) shows that each set of batteries either receives power from the system or delivers it to the system during a time interval, and these two states do not occur simultaneously ( Z k , t   , V k , t { 0 , 1 } ).
P C H S k , t b Ω B B P C H k , b , t
P D C H S k , t b Ω B B P D C H k , b , t
B P C H k , b , t X k , b , t     δ c h     C A P k , b
B P D C H k , b , t Y k , b , t     δ d c h     C A P k , b
Equations (22) and (23) illustrate that the total charge and discharge of the storage system are the sum of the individual charges and discharges of each battery package. Equations (24) and (25) represent the maximum power at which each BESS can be charged and discharged, respectively. In these equations, δ c h , δ d c h , and C A P k , b represent the maximum allowable charging and discharging percent and battery package capacity, respectively.
X k , b , t + Y k , b , t ( 1 U j , b , t m c s   t o   b )
Equation (26) shows that the BESS is not being charged or discharged when called for replacement. Each BESS is either in charge or discharge state at a time interval and these two states do not happen simultaneously ( X k , b , t   , Y k , b , t { 0 , 1 } ).
S O C k , b , t = max ( U j , b , t m c s   t o   b · E j , t 1 m c s C A P k , b ,   ( 1 U j , b , t m c s   t o   b ) · ( S O C k , b , t 1 + B P C H k , b , t · η k , b c h B P D C H k , b , t η k , b d c h C A P k , b ) )
S O C k , b , t E j , t 1 m c s   t o   b C A P k , b + S O C k , b , t 1 U j , b , t m c s   t o   b + B P C H k , b , t · η k , b c h B P D C k , b , t η k , b d c h C A P k , b
E j , t 1 m c s   t o   b C A P k , b U j , b , t m c s   t o   b
E j , t m c s   t o   b E j , t 1 m c s
Equation (27) shows the SOC of the BESS at each time interval depending on the SOC from the previous interval. Equation (27a), which is nonlinear, is reformulated using the auxiliary linear constraints (27b27d) to ensure compatibility with the MILP framework. It is possible to replace the battery if the SOC is equal to 1. If the SOC reaches 1, the battery can be replaced. When a battery is replaced, its status is updated to match that of the most recently replaced battery.

3.3. DQN Approach with New Decision-Making Process and Reward Design

DQN extends Q-learning, a widely used model-free reinforcement learning algorithm, by approximating Q-values through a neural network, which enables the agent to learn effective policies in complex environments [40]. Although actor–critic and policy gradient methods are well-suited for continuous action spaces, the inherently discrete nature of the MCS scheduling problem makes DQN a more efficient and effective choice for this study. The proposed Multi-Agent MCS Scheduling Problem (MAMCSP) is formulated such that each agent (each MCS is considered as an independent agent) executes an action at each time step according to its local state, obtains an immediate reward, and then transfers to the next scheduling time interval.

3.3.1. State Design

The state vector at time t consists of the EV request, the status of each battery package, and the status of the local MCS, which is expressed as follows:
S t     [   EV i t   [ E i ,   x i ,   y i ] ,     B b t   [ SOC b ,   R b ] ,   MCS j t   [ E j ,   x j ,   y j ] ]
The EV i t vector consists of the needed energy of the EV and the requested location, the B b t vector consists of the state of charge of the battery storage and the ready-for-change status, and the MCS j t vector consists of the remaining energy of the MCS and the MCS location.

3.3.2. Action Configuration

The action vector Act t for the M C S j at time t selects one of the three possible actions, either not acting, delivering energy to one of EV requests, or taking action, to replace the battery, illustrated as follows:
Act j t     [ Act N t ,   Act EV i t ,   Act B b t ]
Here, Act N t corresponds to the no-action (idle) decision, where the M C S j remains inactive during time t. Act E V i t represents the charging action, in which the M C S j delivers energy to the selected EV request E V i , subject to capacity and time constraints. Act B b t denotes the battery replacement action, where the M C S j returns to the depot to swap its depleted battery with a fully charged one, ensuring continued service in subsequent time steps.

3.3.3. Reward Design

The reward function is the immediate benefit obtained by M C S j at the time t to take the action Act j t based on the state S t , which is expressed as follows:
r ( r τ )   =   t τ [ ( j Ω mcs i Ω e v C i , j , t total ) + β A , C t ]
In this equation, β A , C t is related to the judgment term, which is determined based on the criteria in each action connection.
In order to model DQN, it is necessary to design a reward and penalty structure for the performance of MCS as the problem agent. Each MCS in each time step takes the appropriate decision according to the requests of EVs in that time step (the EV request was sent to the control center one time step earlier) and the information received from the charging batteries.
  • Action 1: MCS does nothing to service the EV or replace its battery (no action).
    In this situation, according to the system conditions of this decision, the agent has a possible reward or penalty as follows: If the service request is from the EV side, no battery is ready to be replaced and the energy stored in the MCS is able to supply the vehicle’s energy. In this case, the agent will be fined for not providing the power of the EV. If the battery is ready for replacement and the energy stored in the MCS is less than its maximum possible energy, failure of the MCS to refer for battery replacement will result in a penalty. There is a service request from the EV, the battery is ready for replacement, and the energy stored in the MCS is less than the energy requested by that EV, but the MCS does not replace the battery. Failure of the vehicle to refer for battery replacement will result in a penalty; this penalty is twice the first and second cases. If there is no service request from the EV, the battery is not ready for replacement, or there is a service request from the EV, but the amount of energy stored in the MCS is less than the requested energy of the EV, and no battery has announced that it is ready for replacement. In this case, the no agent’s act is correct and it will receive a reward.
    β A 1 , C t = β A 1 , C 1 t if   [ E e v > 0   &   R b = 0   &   E MCS > E e v ] β A 1 , C 2 t if   [ R b = 1   &   E MCS < E MCS Max ] β A 1 , C 3 t if   [ E e v > 0   &   R b = 1   &   E MCS < E e v ] β A 1 , C 4 t if   [ E e v > 0   &   R b = 0   &   E MCS < E e v ] or   [ E e v = 0   &   R b = 0 ]
  • Action 2: The agent selects one of the EVs for servicing ( EV i ).
    If the energy available in the MCS is less than the requested energy of the EV, in this case, the agent will be subject to a penalty. If the EV-requested energy is zero, in fact, the EV has no demand. In this case, the agent will be fined. If it is none of the above cases, in this case, the agent will receive a reward due to the correct action.
    β A 2 , C t = β A 2 , C 1 t if   E MCS < E e v β A 2 , C 2 t if   E e v = 0 β A 2 , C 3 t if   E e v > 0
  • Action 3: The agent refers to one of the batteries to replace the battery ( B b t ).
    If the battery is not ready for replacement or the energy stored in the MCS is equal to the maximum possible energy, the agent will be fined. If the battery has announced its readiness for replacement (battery readiness has been sent to the control center one time step earlier) and the MCS energy is lower than the maximum MCS value, in this case, the agent will receive a reward due to the correct action.
    β A 3 , C t = β A 3 , C 1 t if   R b = 0   or   E MCS = E MCS Max β A 3 , C 2 t if   R b = 1   &   E MCS < E MCS Max

4. Branch Flows Model

The branch flow model represents the distribution power flow problem by the following conic program. The objective function in this power flow model is minimizing the total active power injection imported from the upstream grid at the substation. The constraints of the power flow are given in Equation (34a34h) [41].
( V ̲ m ) 2 V m , t s q ( V ¯ m ) 2 , m M
f : f m P f , m , t r f , m I f , m , t s q n : m j P m , n , t = P m , t d ,   m M
f : f m Q f , m , t x f , m I f , m , t s q n : m n Q m , n , t = Q m , t d ,   n M
P t grid = n : 1 n P 1 , n , t
Q t grid = n : 1 n Q 1 , n , t
V n , t s q = V m , t s q 2 ( r P m , n , t + x Q m , n , t ) + ( r 2 + x 2 ) I , t s q , m n = L
I , t s q 0 , L
P m , n , t 2 + Q m , n , t 2 V m , t s q I , t s q ,   = m n L
Disciplined convex programming syntax does not allow for the product of two optimization variables. The rotated conic constraint in Equation (34h) can be implemented as follows:
P m , n , t 2 + Q m , n , t 2 + V m , t s q I , t s q 2 2 norm 2 P m , n , t Q m , n , t ( V m , t s q I s q ) / 2 V m , t s q + I , t s q 2 , = m n L
Regardless of the implementation, commercial solvers such as MOSEK will work with the equivalently converted quadratically second order cone.

5. Numerical Results and Discussion

In order to simulate the vehicle request time and the amount of energy requested by private EVs, according to Chattanooga Area Regional Transportation Authority (CARTA) EV request information, the probability distribution function has been obtained as a Normal Distribution. Given the uncertainty in EV requests and the need for training the DQN model, the CARTA data have been utilized to improve the accuracy and reliability. MCSs are prioritized in high-demand urban zones where user time is valuable. Table 1 shows the simulation parameters.
The EV requests are sent to a control center, and based on the location of the request within each MCS zone, the corresponding requests are forwarded to the relevant MCS. Through optimal agent scheduling, the MCS swaps its battery at the charging station for a full recharge. The charging station is equipped with two pieces of charging equipment for MCS batteries, with the capability to obtain power from both a PV system and the upstream grid. The power exchange scheduling of the internal components within this charging station is formulated as an MILP problem and optimized using Python Optimization Modeling Objects (Pyomo, version 6.9.2) with the GLPK solver. For the parameter settings of the DQN algorithm, the custom policy network consists of four hidden layers with sizes set to 64, 128, 128, and 64, respectively. Each hidden layer uses the Rectified Linear Unit (ReLU) activation function. The Adam optimizer is employed for updating the network with a learning rate of α = 10 4 .
A sample scenario involving EV requests is implemented to assess the proposed model’s performance. Figure 3 illustrates the specific actions made by MCS either to select an EV for charging services or access to a battery swapping station (purple filled cell). Additionally, the requested energy of EVs is shown by red numbers which are asked for the next time interval.
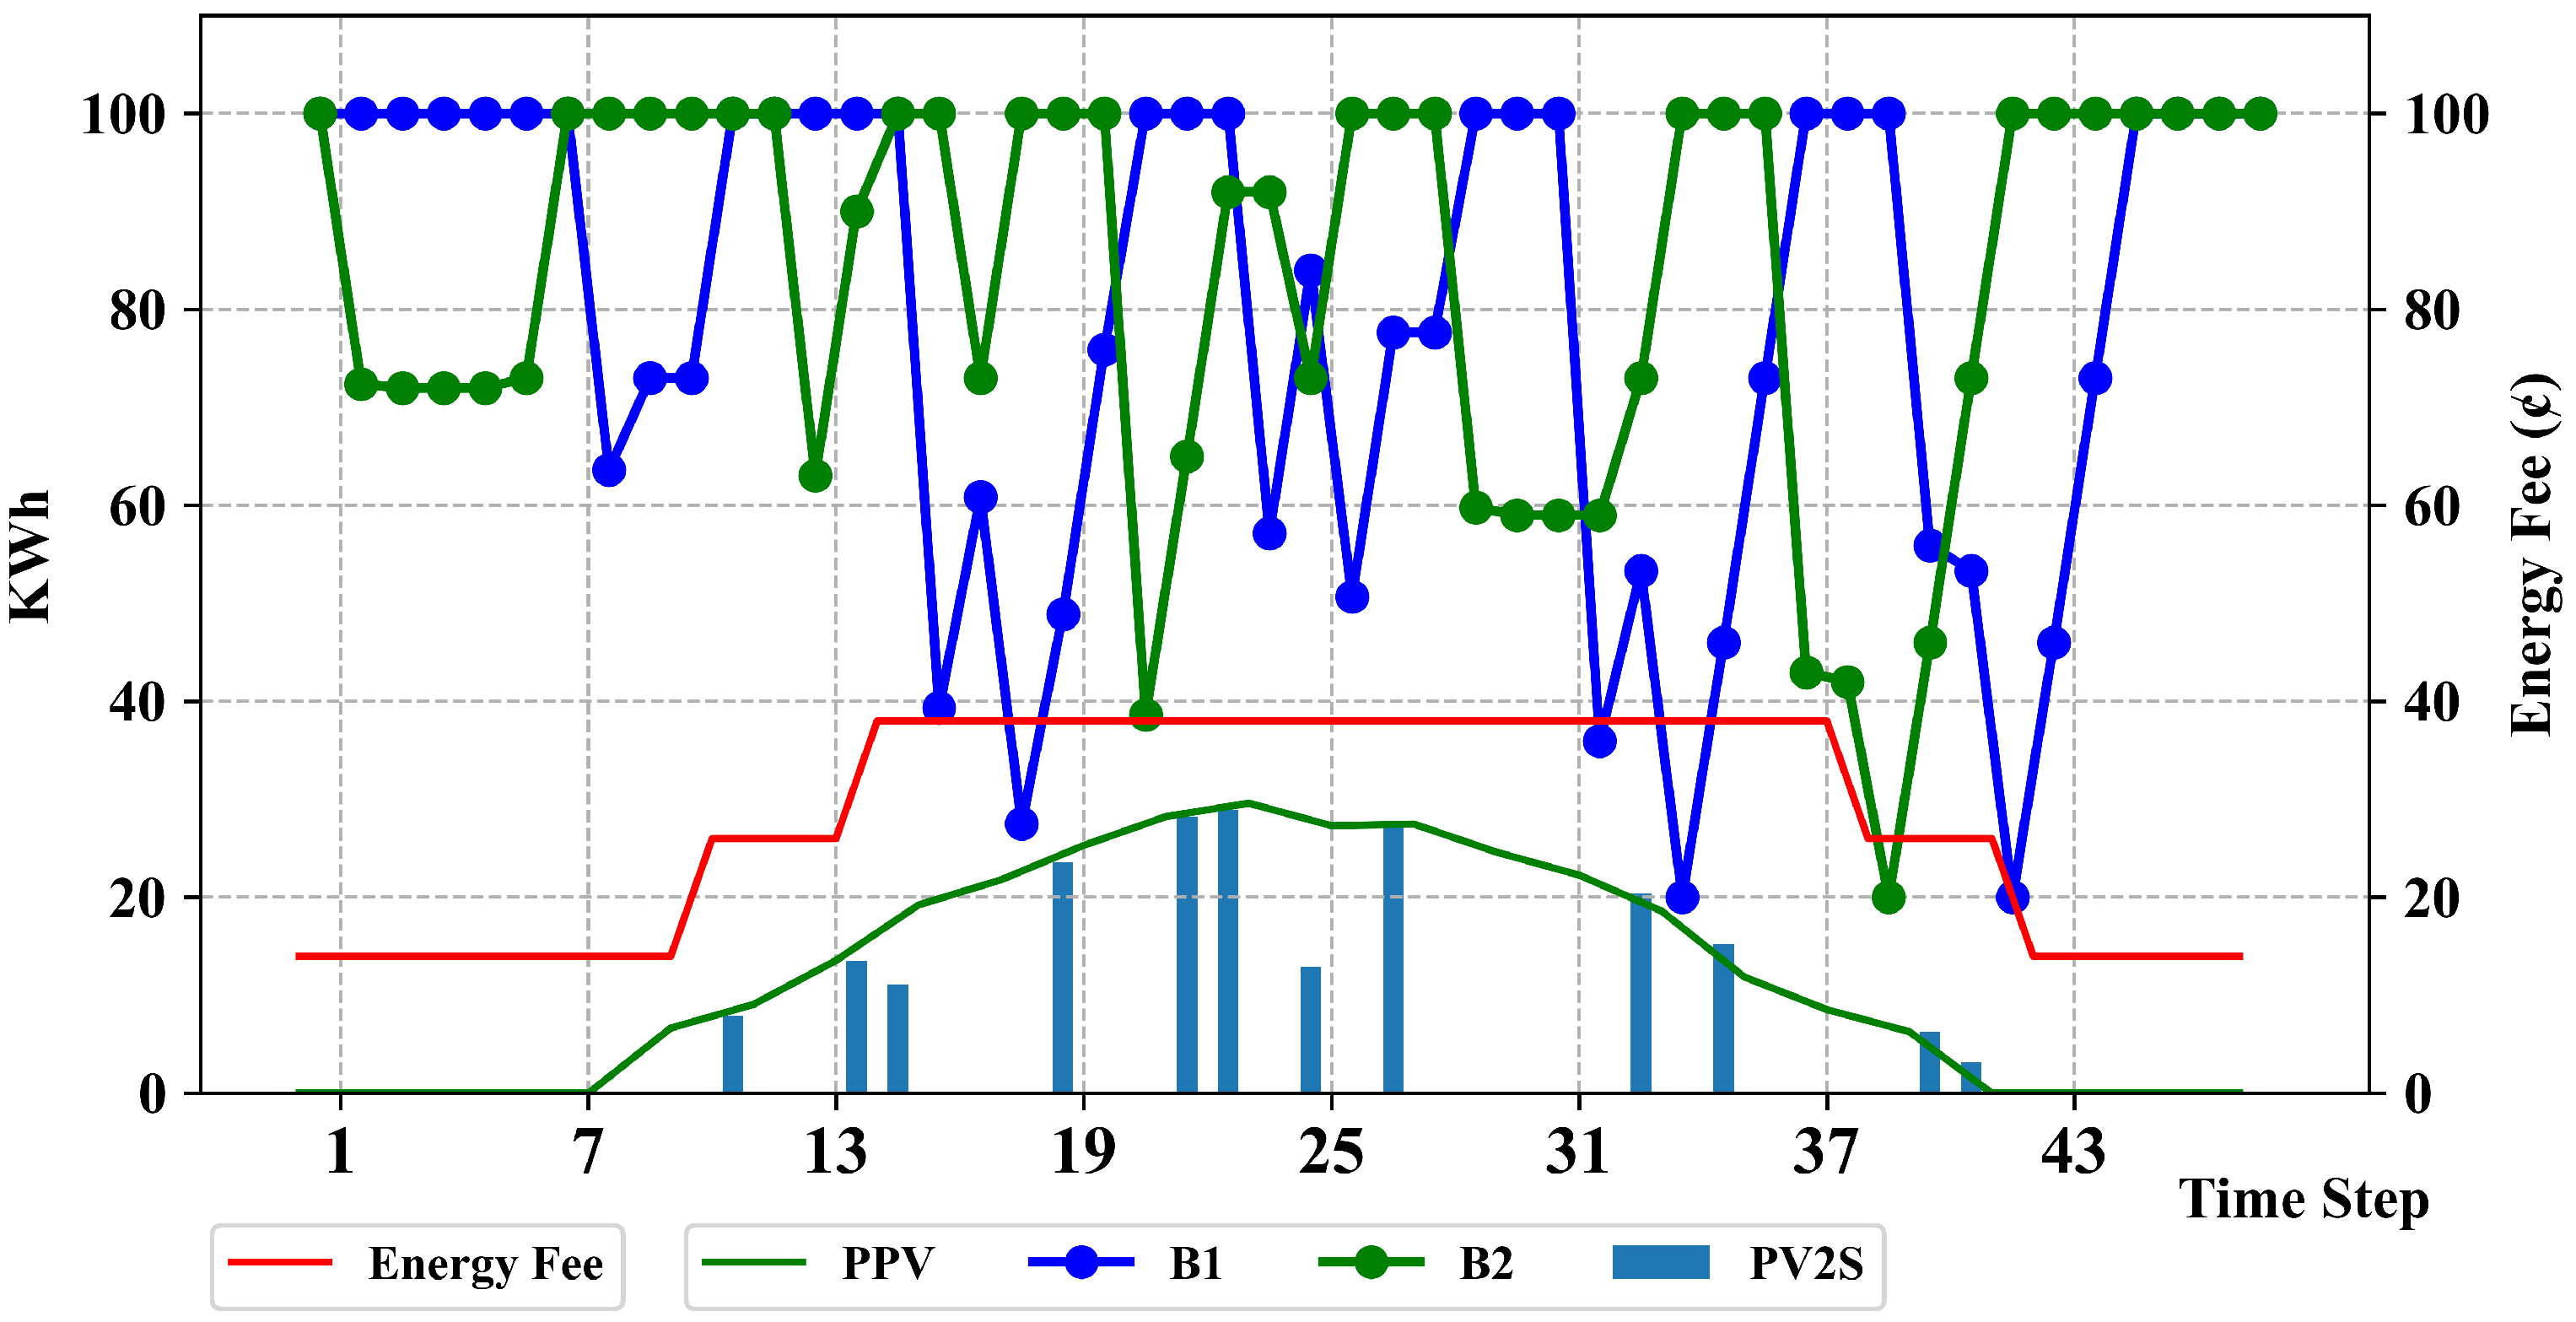
Figure 4 illustrates the amount of energy stored in the MCS at each time step and the sequence of replacements with batteries B 1 and B 2 available at the charging center throughout the scheduling period. At each time step where the MCS swaps its battery for a fully charged one, the MCS battery charge is reset to its maximum level, while the charge of the replaced battery is updated to match the MCS’s charge level from the previous time step. In six time steps, the battery is permitted to reach full charge using the resources within the charging station. This scheduling is supported through power purchases from the upstream grid and PV at each time step. Figure 5 presents the cost of grid power procurement, the available solar energy (a 100 kW PV system is considered for the roof of the parking structure [42]), and the changes in stored energy for batteries B 1 and B 2 at each time step. The energy allocated for battery charging is depicted as bars in Figure 5.
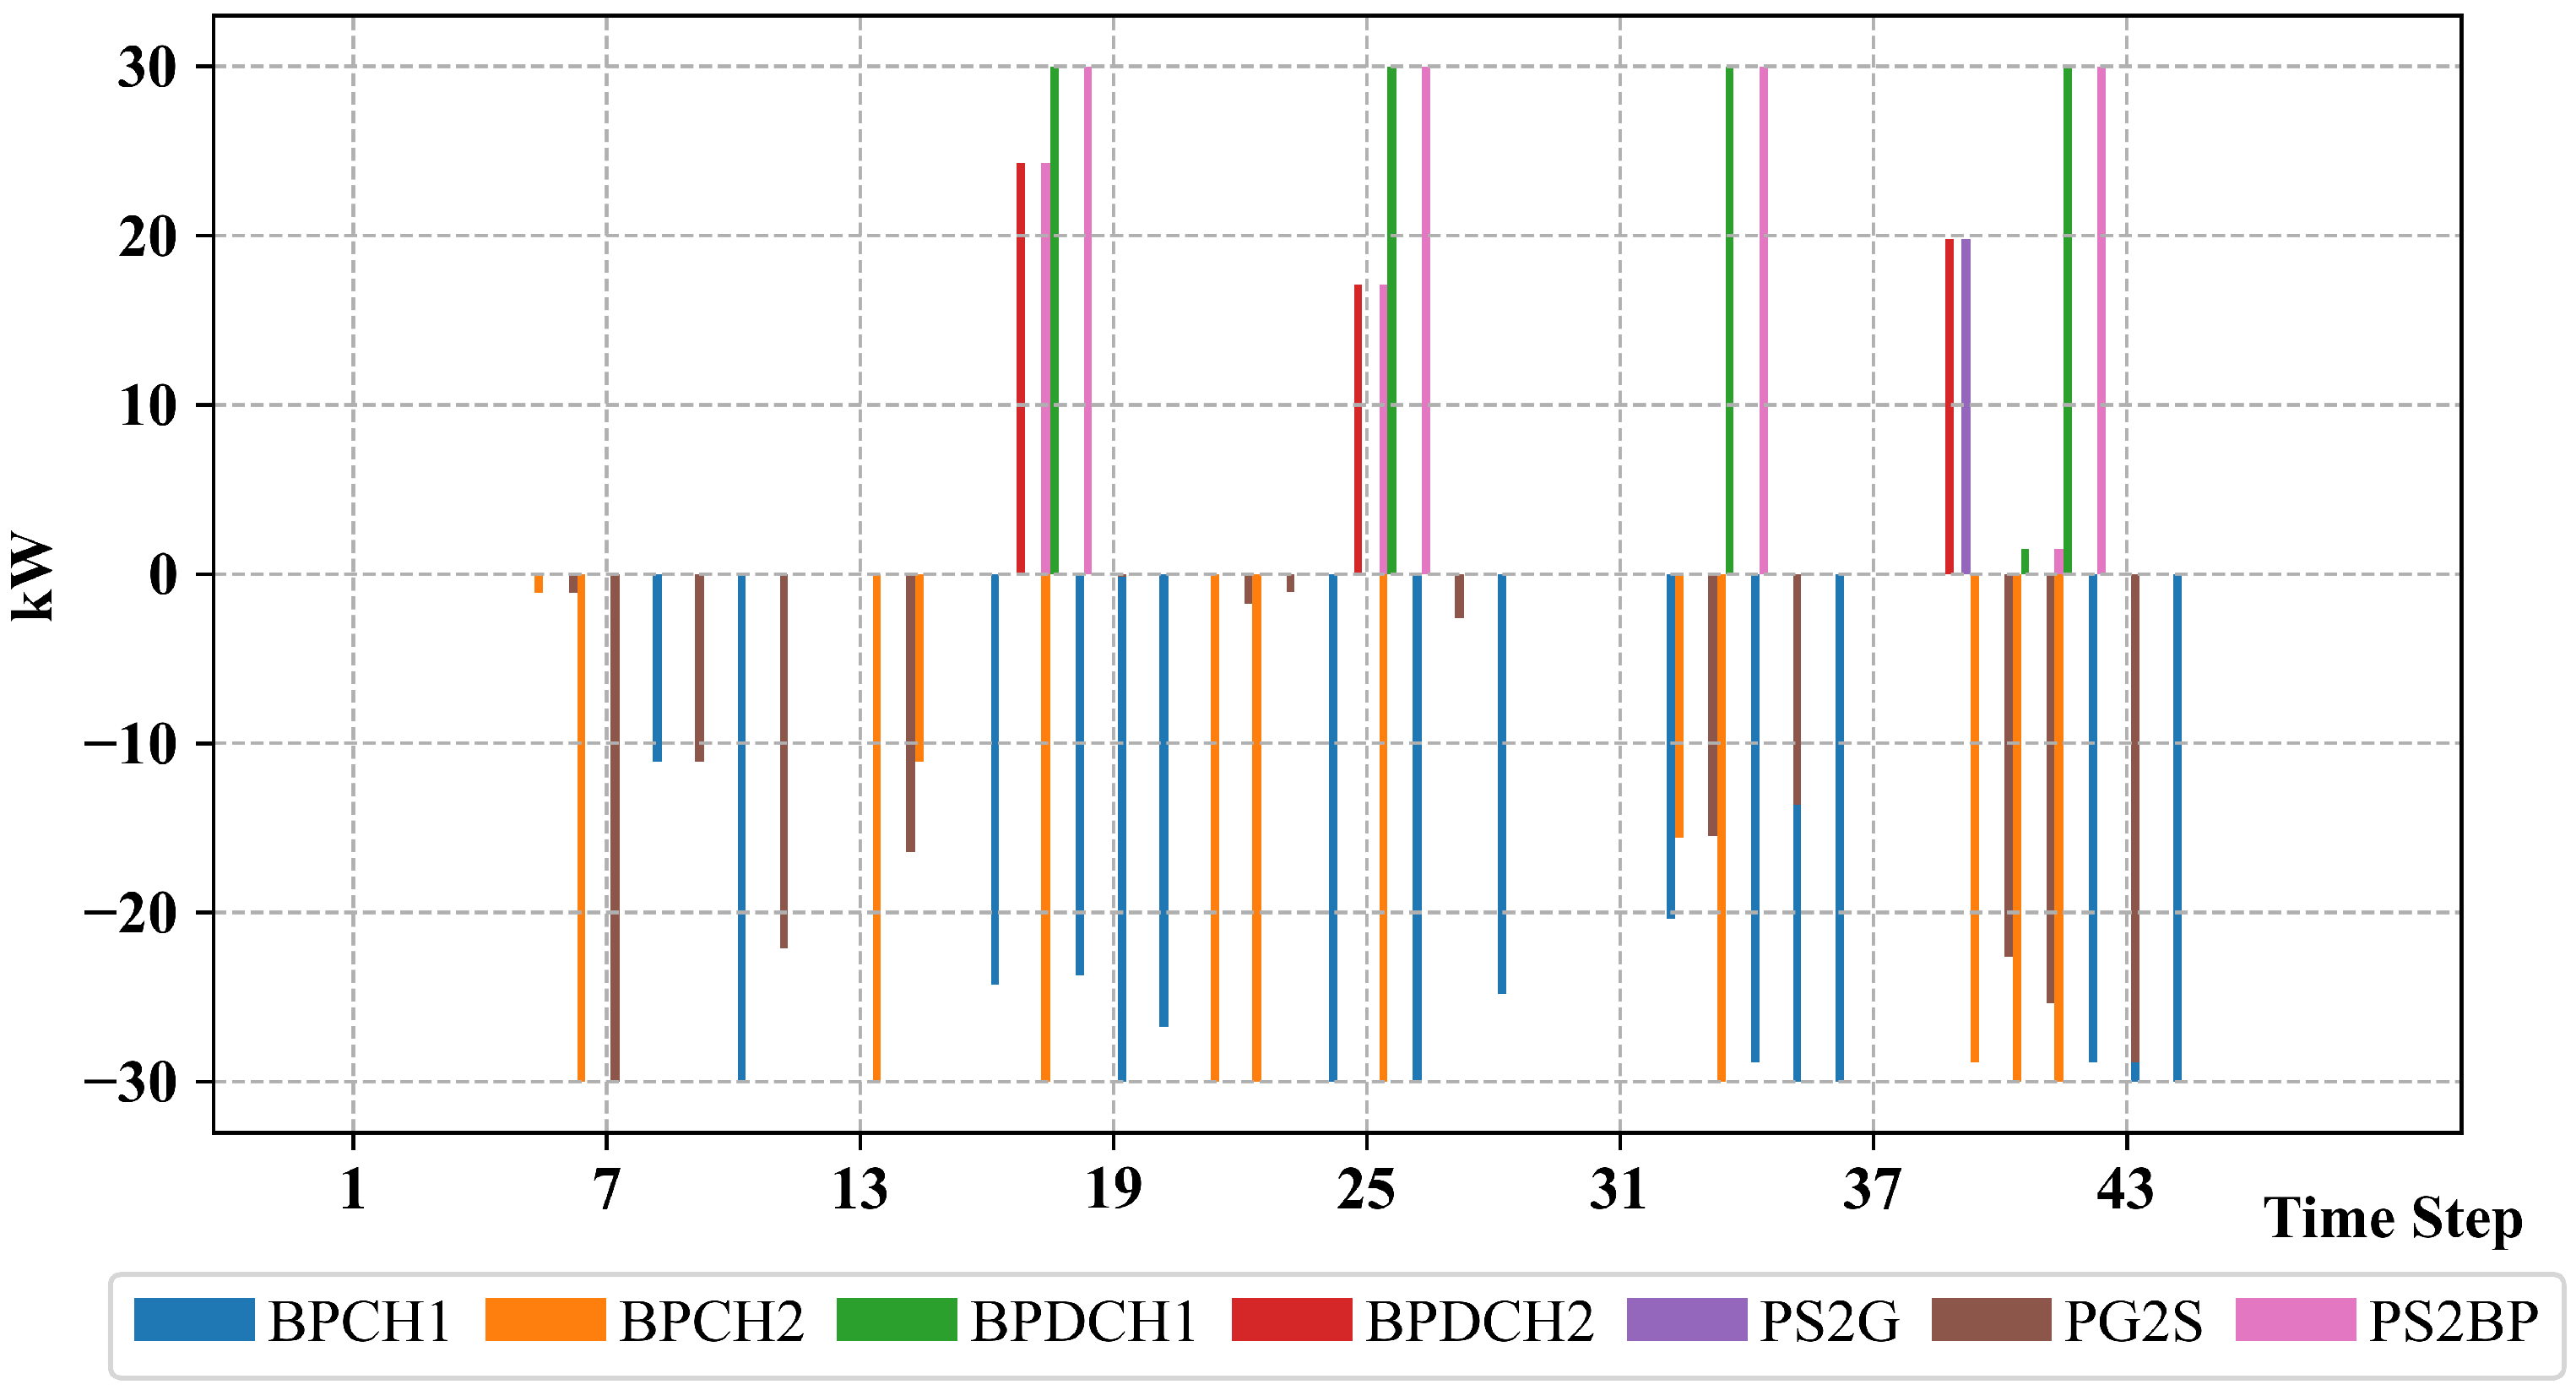
Figure 6 shows the power received by the storage system from the upstream grid, the power dispatched from the storage system to the upstream grid, the charge and discharge levels of each battery separately, and the power exchanged between batteries B 1 and B 2 .
In Table 2, the gap between the proposed DQN solution and the traditional optimal solution using the GLPK solver is demonstrated. It should be noted that the GLPK result represents a benchmark under full-day request information, while the DQN operates with only one-step-ahead requests; therefore, the comparison is intended as a reference rather than a fully equivalent setting. Although the traditional optimal solution generates higher revenue, it requires full knowledge of EV requests for the entire day, which is impractical in real-world scenarios. Throughout the DQN solution model, the MCS successfully serviced 18 EVs, resulting in a total revenue of USD 619. The revenue generated by the charging station is from selling power to the upstream grid, both through the sale of solar energy and by discharging batteries for grid sales, with a total positive revenue of approximately USD 155. The cost of purchasing power from the upstream grid to charge the batteries within the storage amounts to USD 46.5 for the entire scheduling period.
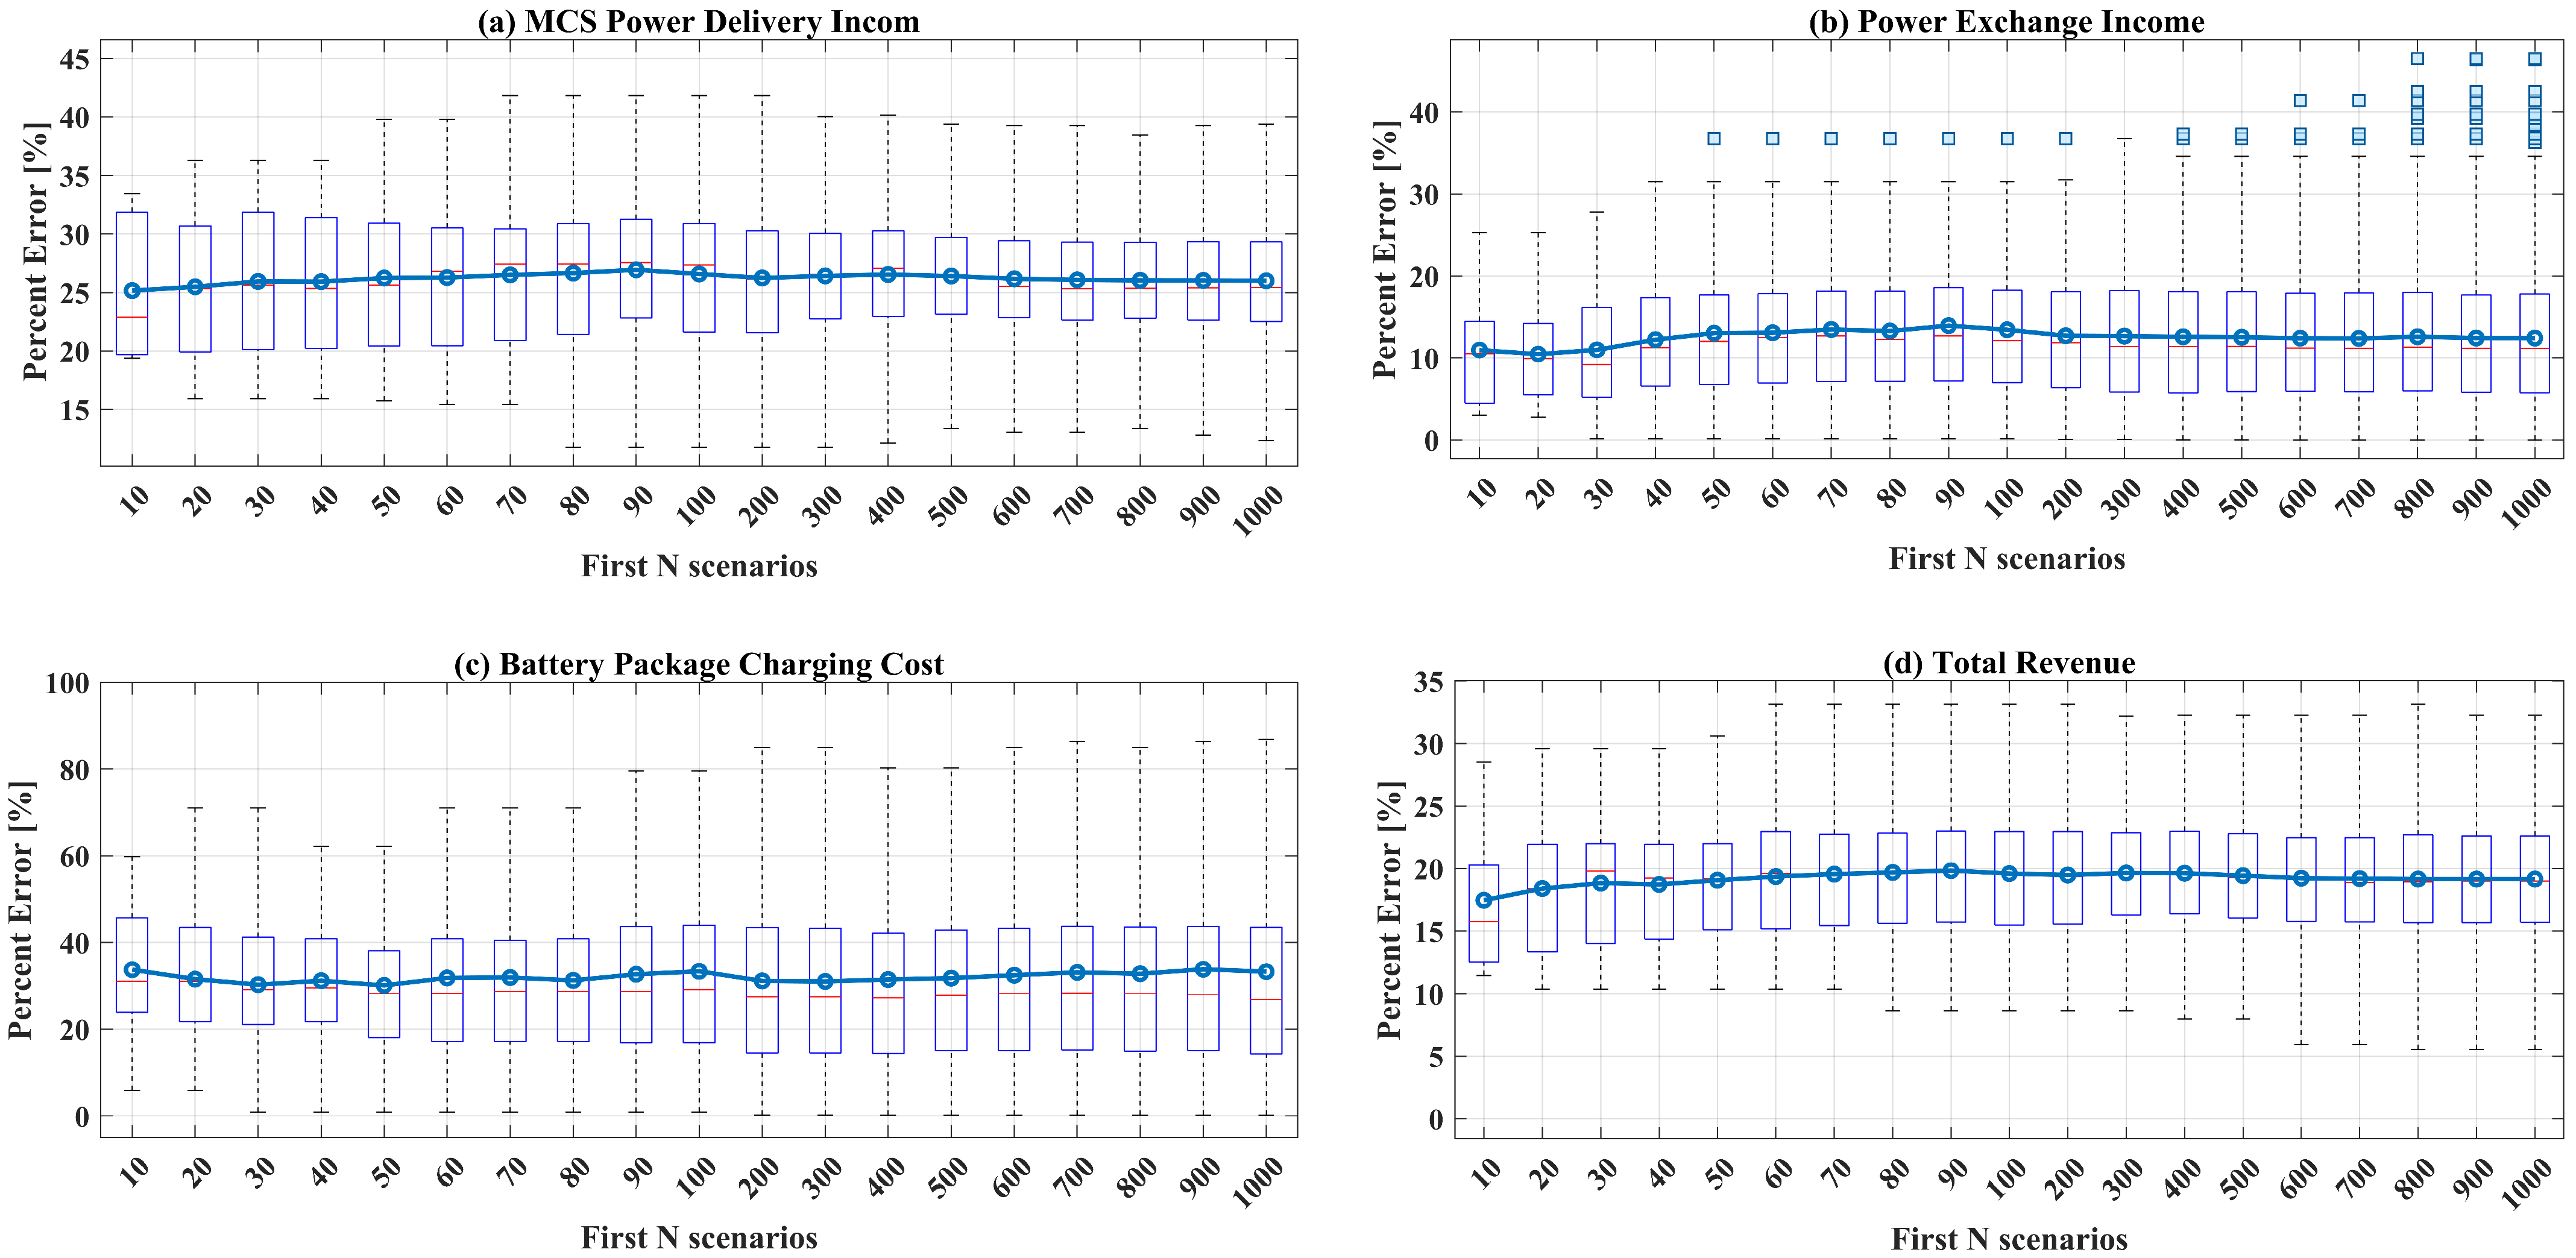
To further assess the reliability of the proposed model, we computed statistical metrics on the simulation outcomes. The percentage error between the DRL-based results and the optimization benchmark was calculated for each scenario and aggregated across different sample sizes. Figure 7 illustrates the variance and interquartile ranges, while the overlaid lines indicate the evolution of the mean error. The results show that the mean error remains relatively stable and the spread decreases as the number of scenarios increases, thereby demonstrating the robustness and consistency of the proposed framework.
To evaluate the impact of MCS service scheduling and the battery charging plans at the MCS battery charging station, three cases are considered, and the analysis is conducted on the IEEE 15-bus distribution system [43], where buses are modeled as load points and the power flow method is described in Section 4:
  • Case 1: Load flow analysis of the network without considering the presence of the MCS.
  • Case 2: Scheduling of MCS services and charging of associated batteries, without considering the technical constraints of the power grid.
  • Case 3: Scheduling of MCS services and battery charging while accounting for the technical constraints of the power grid.
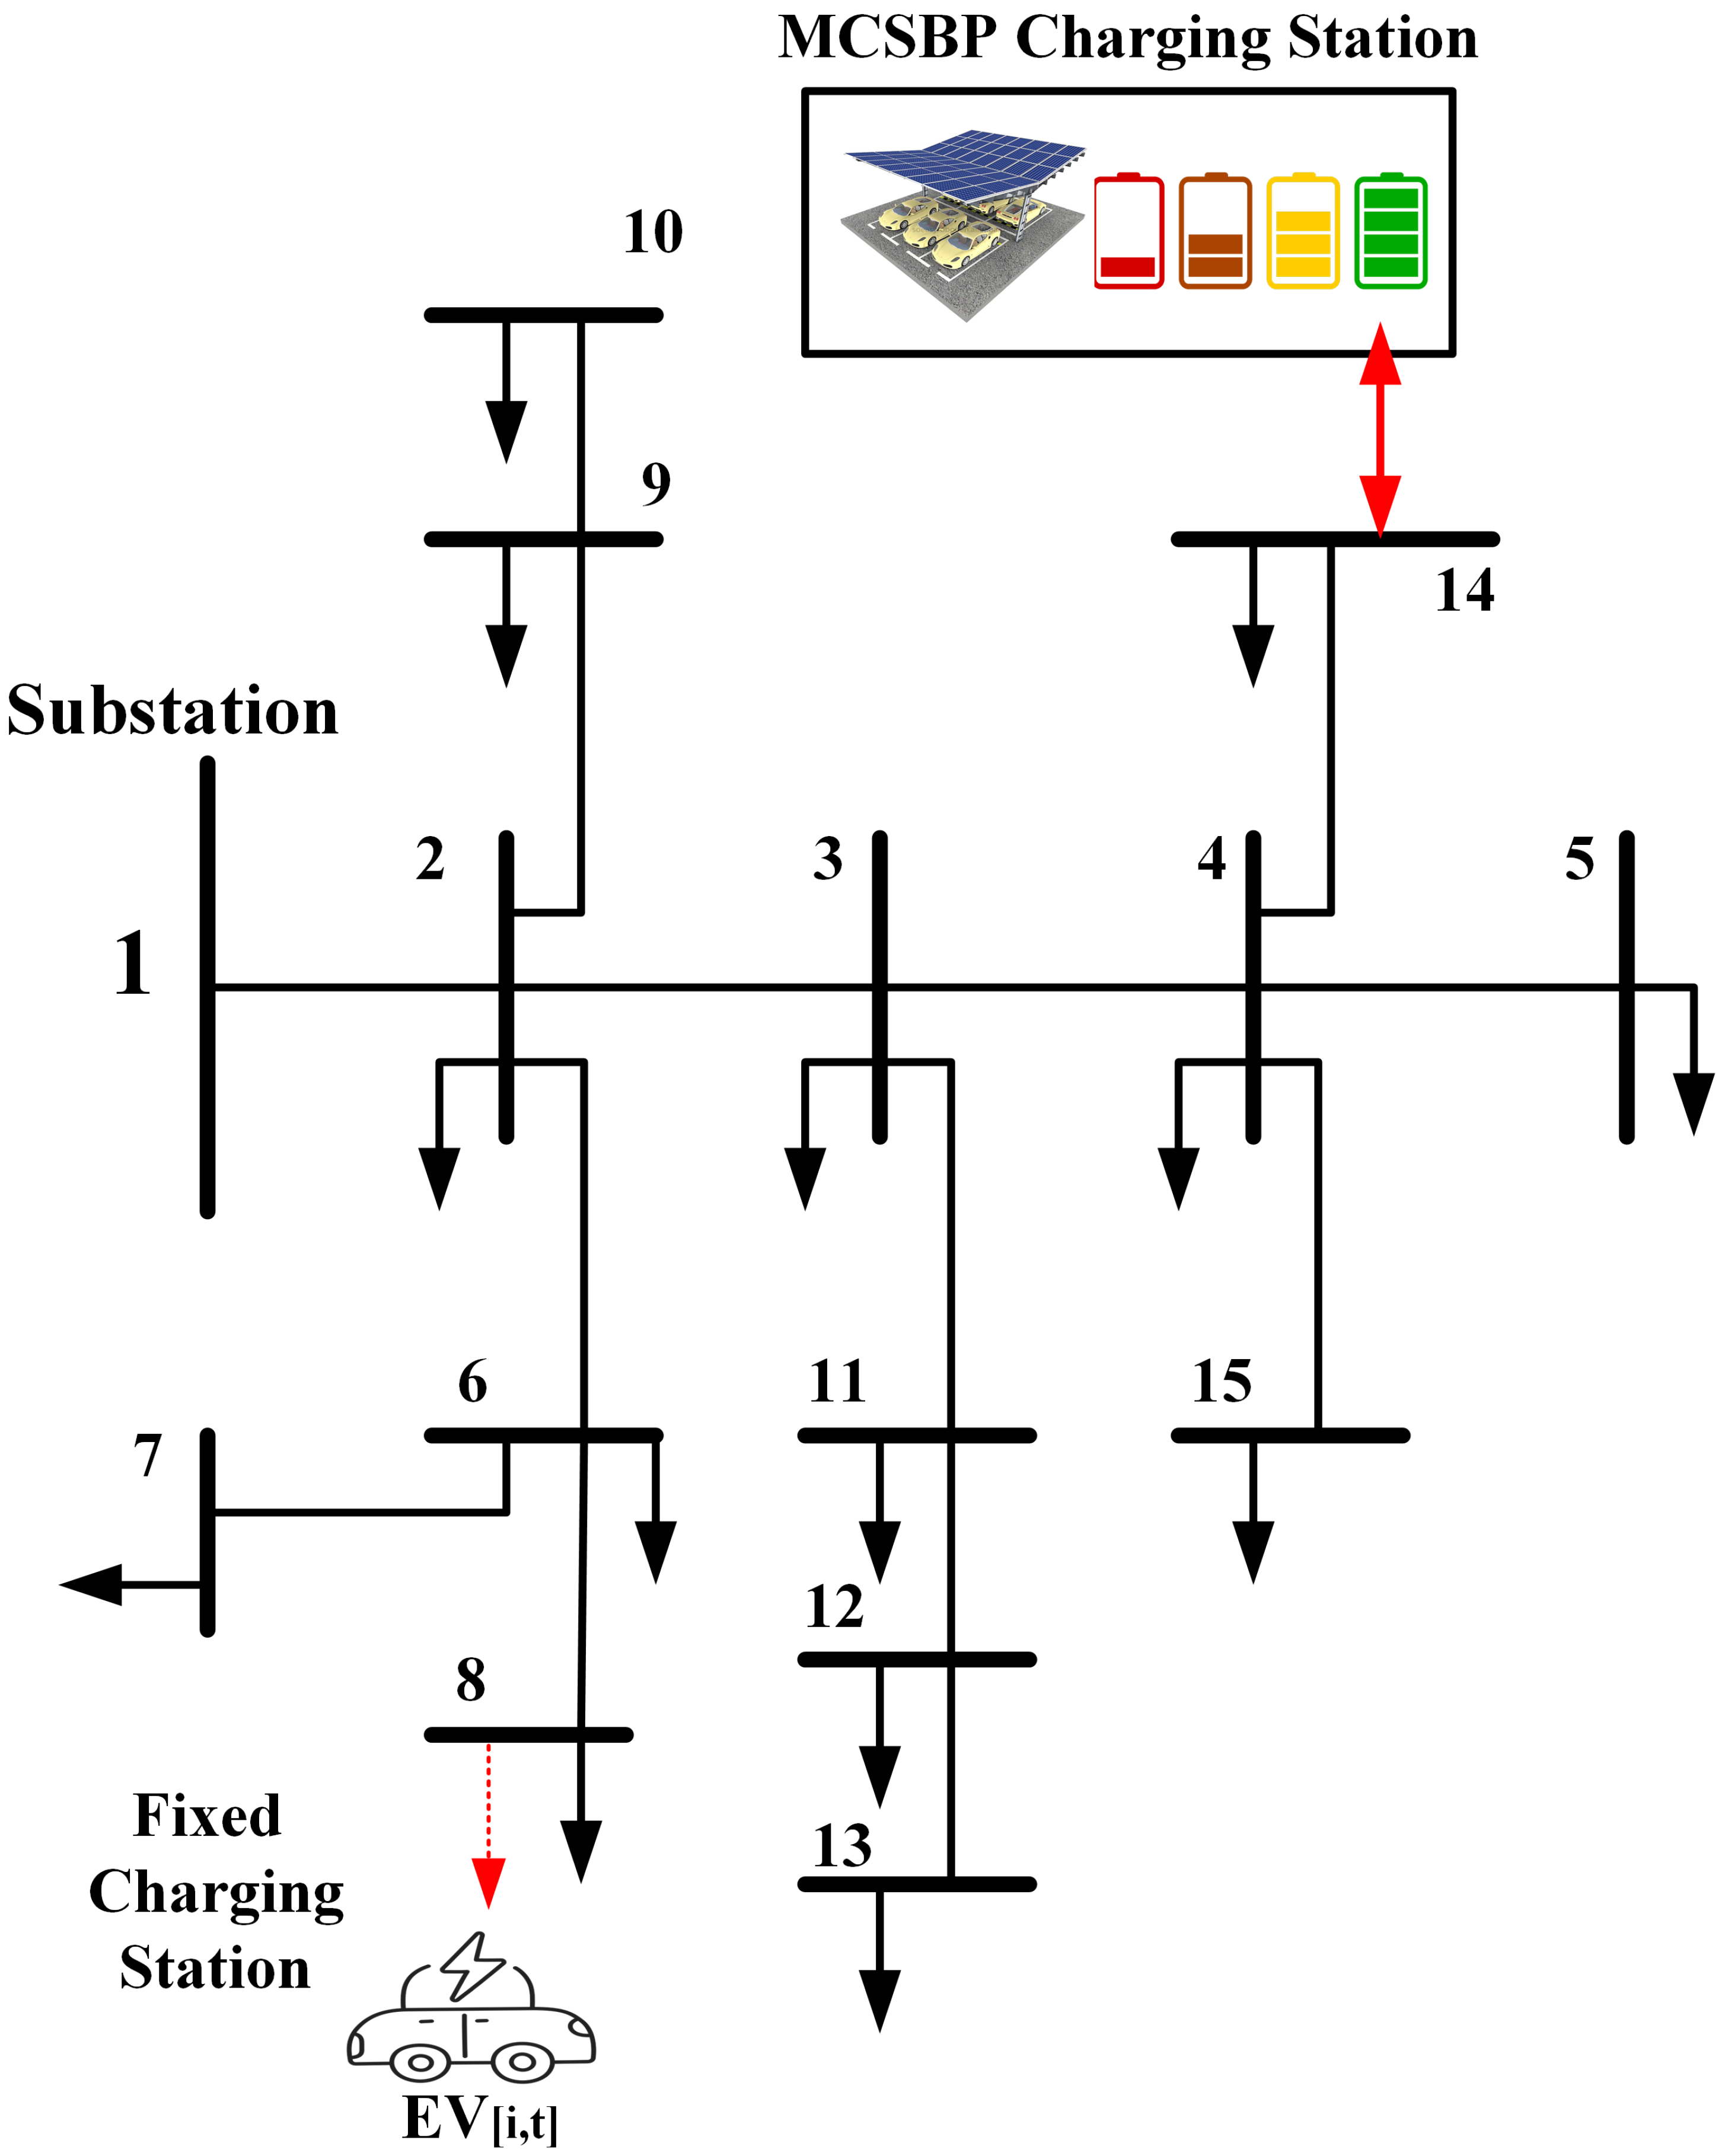
The MCS battery charging station consistently aims to maximize the number of fully charged batteries available for delivery to MCSs. The more access MCSs have to charged batteries, the more EV charging requests they can fulfill, thereby increasing their revenue. However, higher revenues often correlate with increased power demand from the upstream grid, which can impact the technical constraints of the power system, including voltage and current levels. Therefore, when planning battery charging operations at the charging center, it is essential to evaluate the power system parameters at various nodes in the supplying grid. To mitigate negative impacts on the power network, control strategies such as dynamic pricing must be applied. During this planning, MCSs help reduce the grid load by serving EV requests. Since EVs are charged by MCSs instead of fixed charging stations, the load on the node corresponding to the parking area decreases. This load reduction should also be considered in system studies to accurately assess network parameters during the planning process. To examine both load reduction and increase across different network points, Case 2 and Case 3 have been defined. The study uses the standard IEEE 15-bus network, with 40% of the system’s total load considered. As shown in Figure 8, a fixed EV charging station is assumed to be located at bus 8, and the load at this node decreases when EVs are served by MCSs. The MCS battery charging center is located at bus 14, where power consumption increases the load and power generation reduces it.
The 15-bus network load profile is defined using the realistic demand curve of a section of Chattanooga’s distribution system, with each time step representing 30 min [6]. To isolate the effect of battery charging on the network, no PV generation is considered at the charging center in both Case 2 and Case 3. The battery charging schedules for Case 2 and Case 3 are shown in Figure 9 and Figure 10.
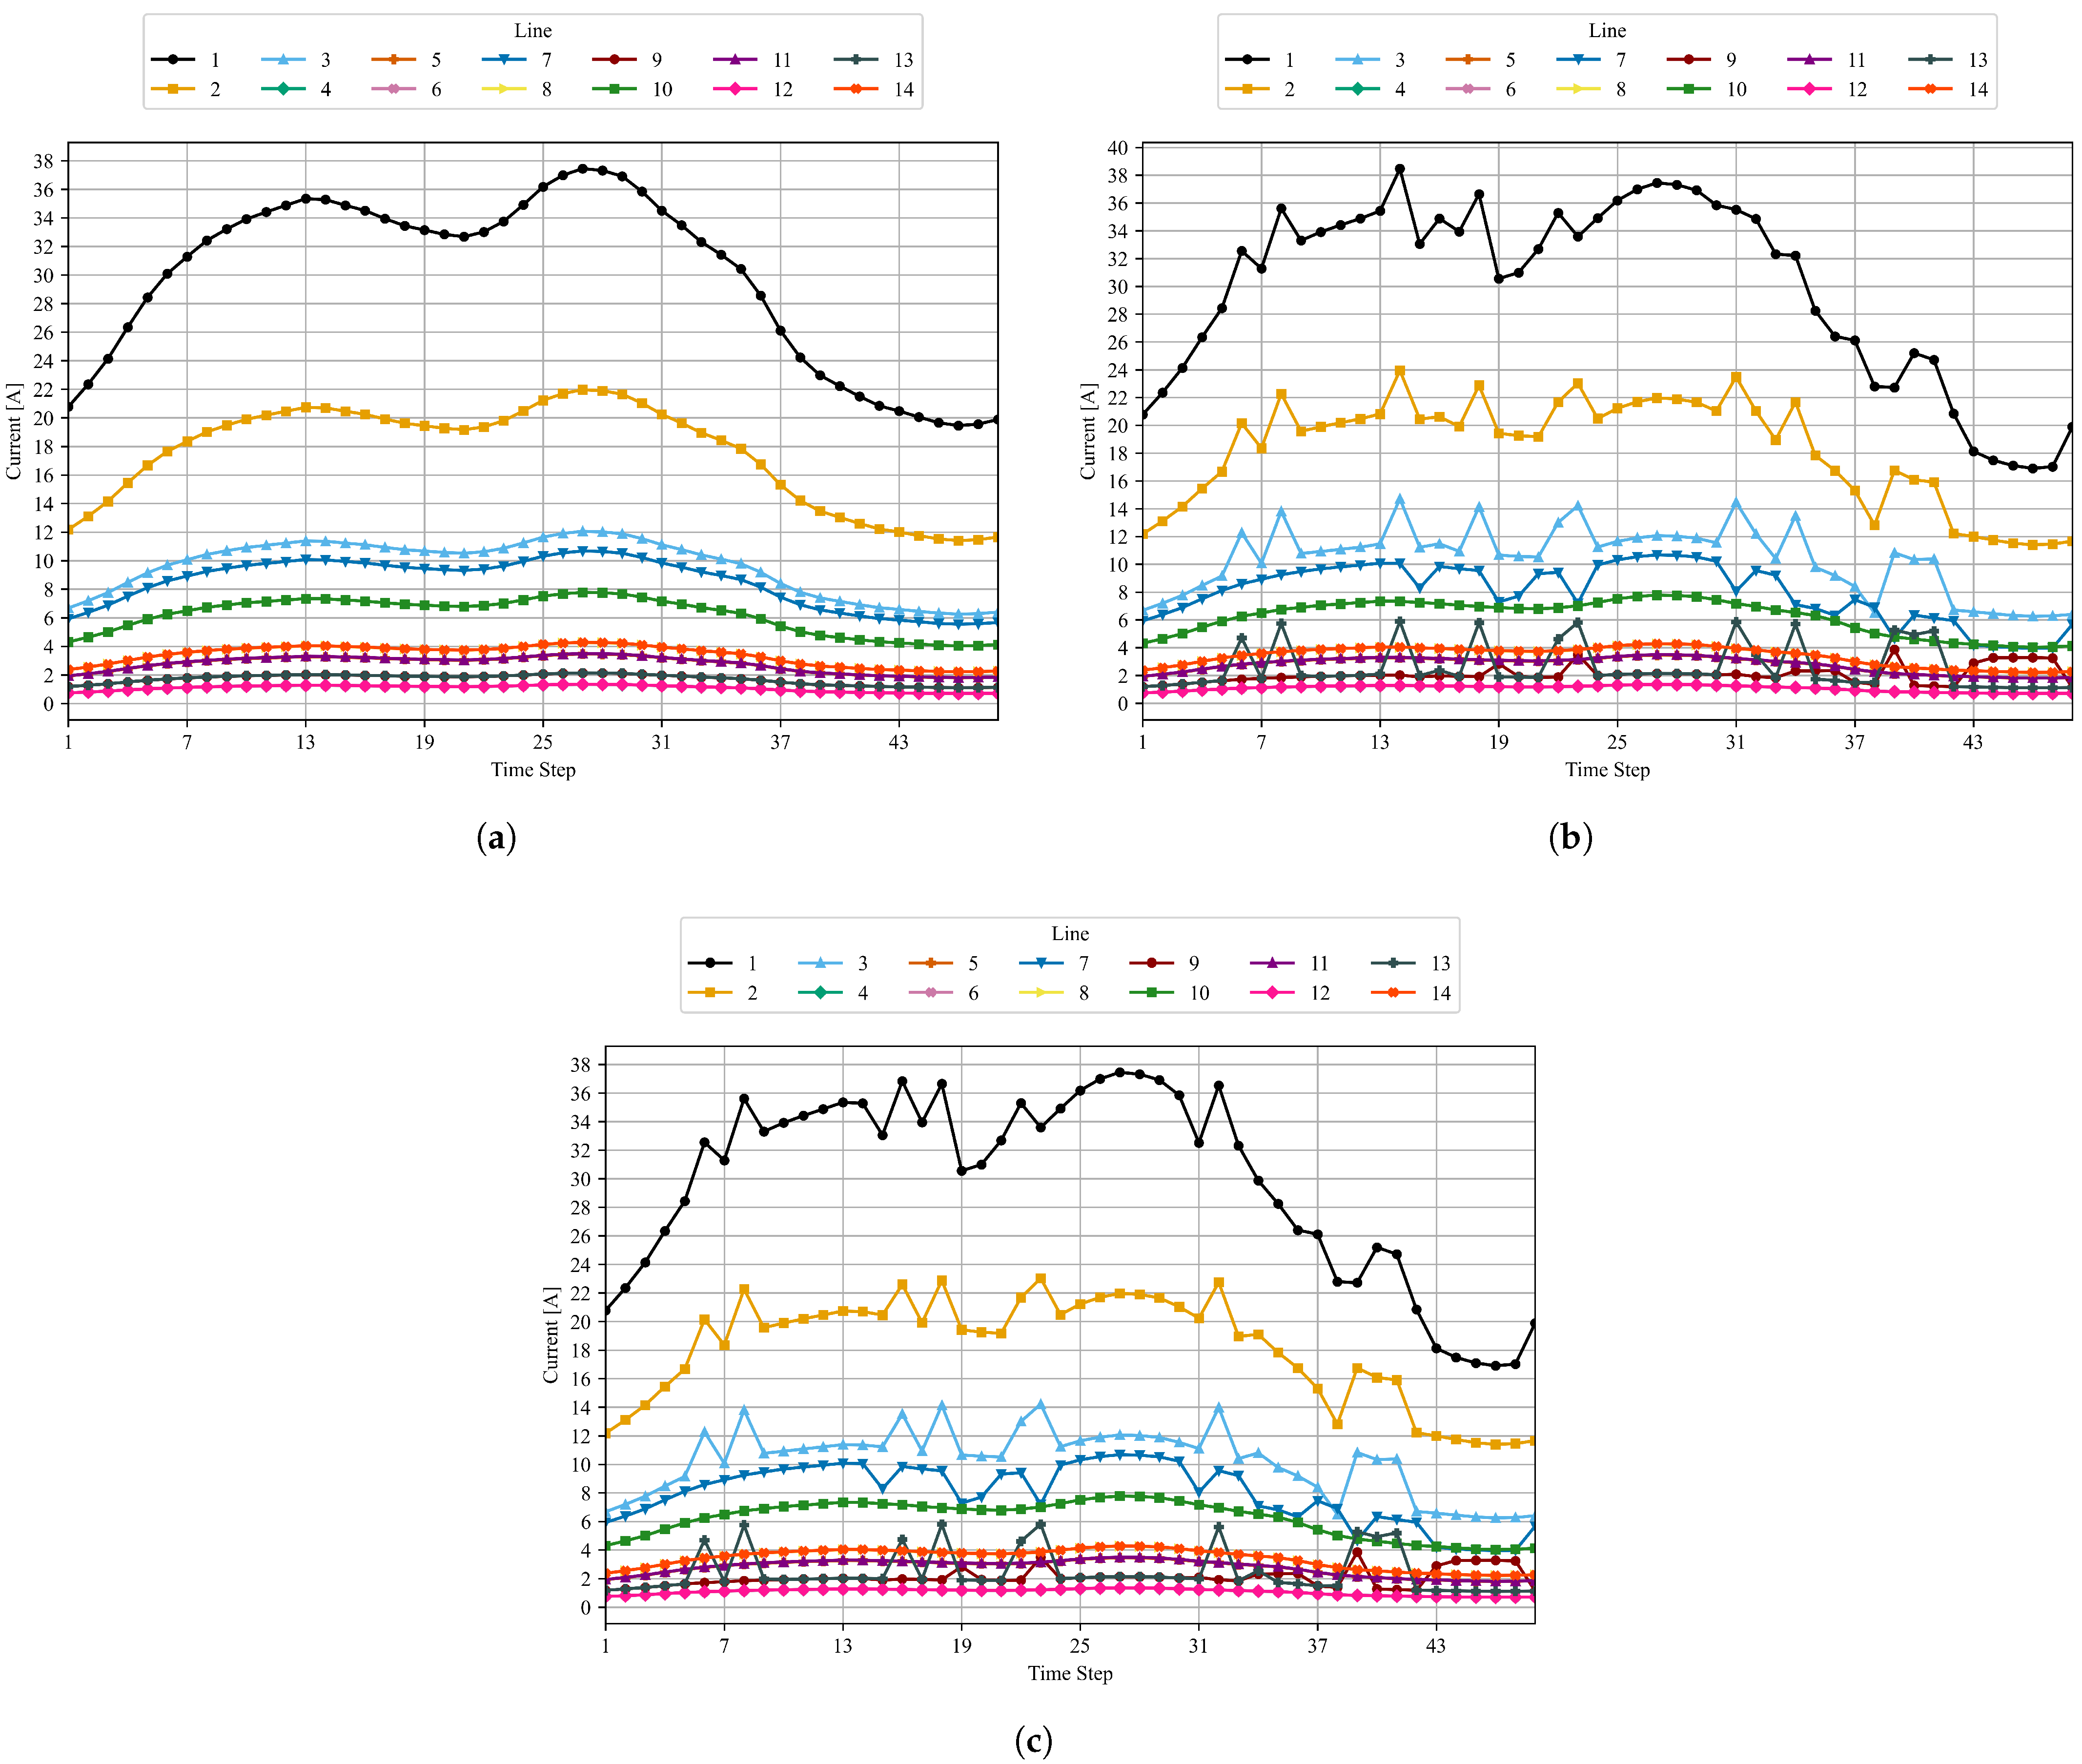
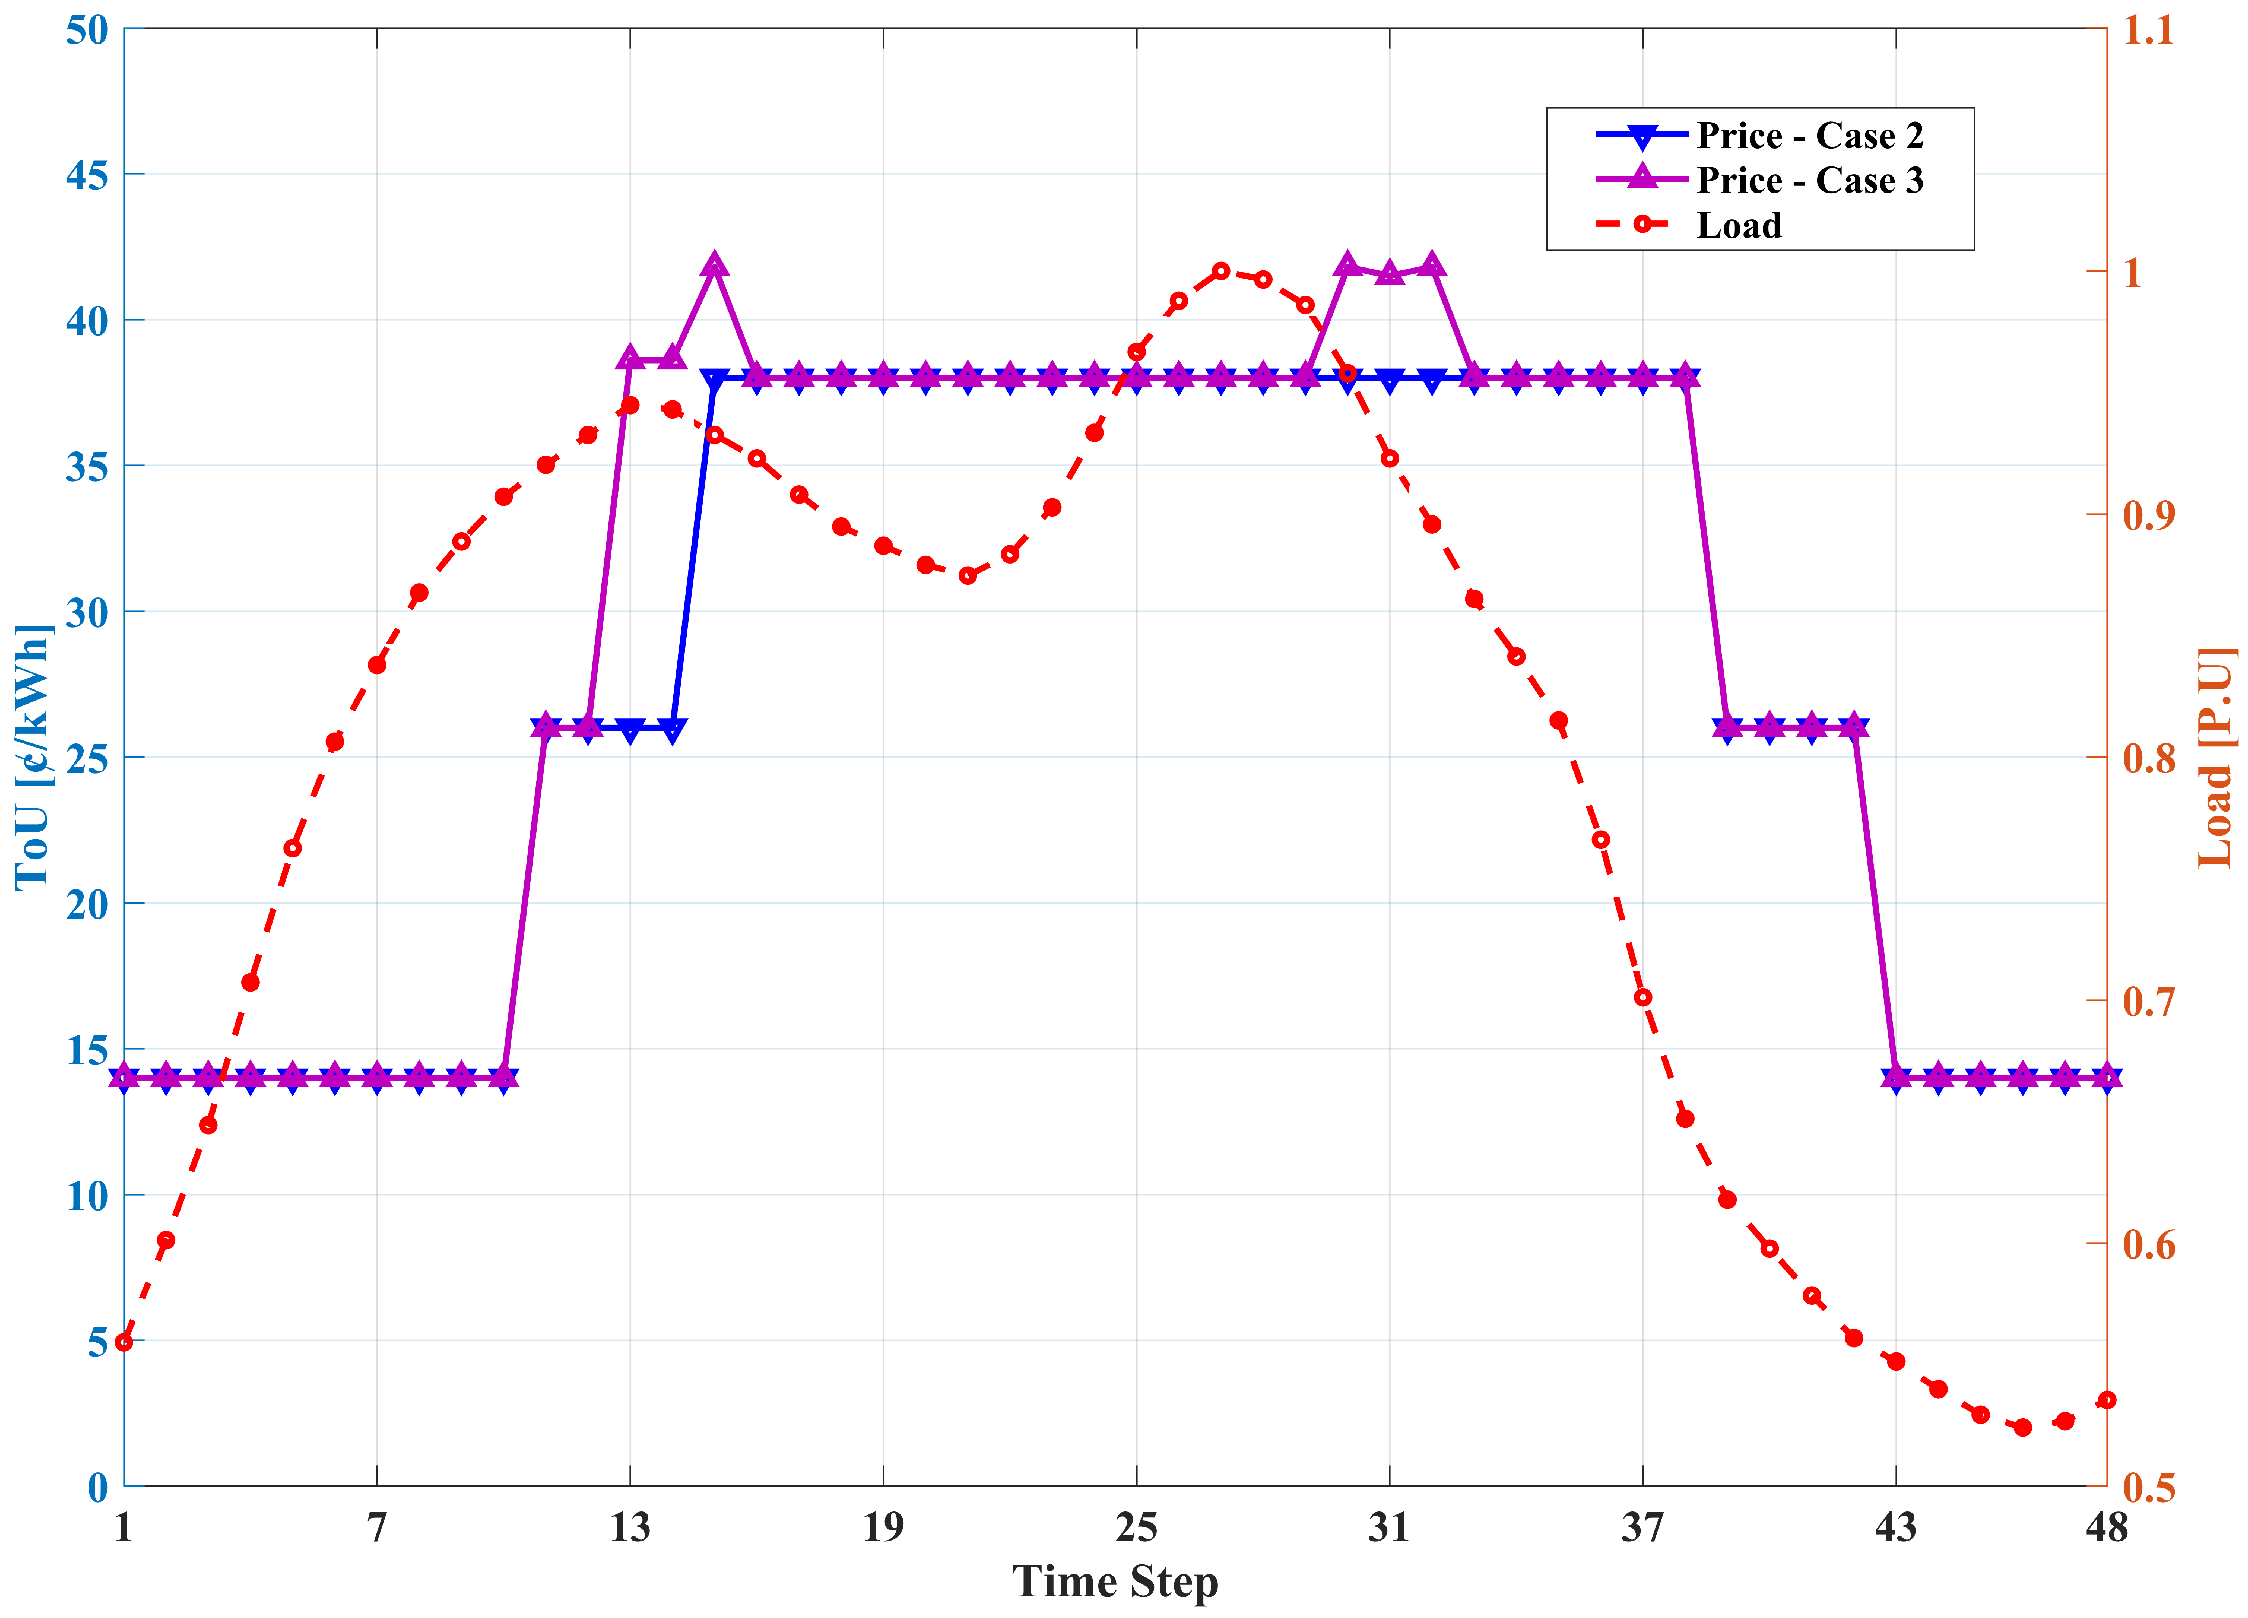
In order to evaluate the impact of MCS scheduling and battery charging (as described in Section 4), voltage and current parameters are calculated at each time step. The acceptable voltage range is assumed to be between 0.95 and 1.05 p.u. In addition to standard line current limits, a specific current constraint of 37.5 A is applied to line 1, the main feeder supplying the entire system. If the battery charging plan violates system constraints, the price of electricity delivered to the MCS battery charging center is increased in 10% steps, encouraging the charging station to shift its demand to other time intervals through self-managed scheduling. Figure 11a shows the current of each network line without MCS scheduling or battery charging center activity. Figure 11b shows the line currents with MCSs and the charging center in operation but without applying voltage or current constraints. As seen in Step 14, the power demand from the charging center causes the current in line 1 to exceed the defined limit. Figure 11c applies the current constraint as part of the charging schedule, using ToU pricing to shift demand.
As a result, line 1 current is reduced by modifying the charging schedule. Figure 12 shows the voltage profiles of buses under different cases. Additionally, upstream electricity price variations for the charging center, with and without system constraints, are presented in Figure 13.

6. Conclusions

In summary, the mathematical model developed in this study provides a comprehensive framework for optimizing the deployment of MCSs and planning their battery recharging in a cost-effective manner. By maximizing profits from EV charging requests and incorporating renewable energy resources into the recharging process, the model addresses key technical and economic challenges. It ensures that MCS operations are both cost-effective and environmentally sustainable. The novelty of this study lies in combining an MILP-based optimization framework with a DQN approach for real-time decision-making while explicitly modeling MCS battery scheduling and its grid impact. This approach not only improves the operational efficiency of MCSs but also contributes to the broader goal of creating a sustainable and scalable EV charging infrastructure for the future. The model effectively manages the limited energy capacity of MCSs by prioritizing high-demand requests and strategically scheduling recharging times. It ensures timely responses to EV users while minimizing idle periods. The proposed solution promotes the intelligent allocation of resources, helping reduce urban congestion and enhance user satisfaction in dynamic traffic environments. Furthermore, this study investigates the impact of MCS battery scheduling on power grid performance using the IEEE 15-bus network and realistic demand data. By modeling the load reduction at fixed EV stations and load increase at MCS charging centers, the study evaluates voltage and current levels across the grid. Dynamic pricing and TOU strategies are applied to ensure that system constraints are satisfied, effectively balancing EV service efficiency with grid reliability.
The limitation of this study is the lack of access to detailed geographical information on traffic conditions along urban routes. Incorporating such data would enable a more precise representation of MCS accessibility and service dynamics. Furthermore, EVs are assumed to be charged only through the plug-in service from MCSs, while the MCS battery packs are managed via swapping at the Parking Battery Station. Future work could build on our framework by integrating spatial and traffic-related information to further enhance the accuracy and applicability of the model.
In future research, we aim to evaluate the impact of our proposed model on grid resilience and cybersecurity, as well as explore multi-agent coordination strategies among MCS fleets and integration with Vehicle-to-Grid (V2G) services. These directions, including the analysis of solar integration with MCS operations and battery swapping for improved load management and grid performance, would further enhance the flexibility and scalability of the proposed framework. In addition, conducting sensitivity analysis on key parameters such as EV demand variability, PV generation, and battery degradation will be considered to assess the robustness of the model under different operational conditions.

Author Contributions

Conceptualization, A.A. and V.D.; methodology, A.A.; software, A.A.; validation, V.D.; visualization, A.A.; writing—original draft preparation, A.A.; writing—review and editing, A.A. and V.D.; supervision, V.D. All authors have read and agreed to the published version of the manuscript.

Funding

This research received no external funding.

Data Availability Statement

The data presented in this study are available within the article. Further inquiries can be directed to the corresponding author.

Conflicts of Interest

The authors declare no conflicts of interest.

References

  1. Afshar, S.; Macedo, P.; Mohamed, F.; Disfani, V. Mobile charging stations for electric vehicles—A review. Renew. Sustain. Energy Rev. 2021, 152, 111654. [Google Scholar] [CrossRef]
  2. Cho, S.; Lim, J.; Won, W.; Kim, J.; Ga, S. Design and optimization of energy supplying system for electric vehicles by mobile charge stations. J. Ind. Eng. Chem. 2024, 138, 481–491. [Google Scholar] [CrossRef]
  3. Tran, T.K.O.; Le, T.H.T.; Shin, M.J.; Nguyen, V.; Han, Z.; Hong, C.S. Distributed auction-based incentive mechanism for energy trading between electric vehicles and mobile charging stations. IEEE Access 2022, 10, 56331–56347. [Google Scholar] [CrossRef]
  4. Neumann, T. Green energy fuelling stations in road transport: Poland in the European and global context. Energies 2025, 18, 4110. [Google Scholar] [CrossRef]
  5. Zhang, Y.; Liu, X.; Wei, W.; Peng, T.; Hong, G.; Meng, C. Mobile charging: A novel charging system for electric vehicles in urban areas. Appl. Energy 2020, 278, 115648. [Google Scholar] [CrossRef]
  6. Afshar, S.; Pecenak, Z.K.; Barati, M.; Disfani, V. Mobile charging stations for EV charging management in urban areas: A case study in Chattanooga. Appl. Energy 2022, 325, 119901. [Google Scholar] [CrossRef]
  7. Qureshi, U.; Ghosh, A.; Panigrahi, B.K. Scheduling and routing of mobile charging stations with stochastic travel times to service heterogeneous spatiotemporal electric vehicle charging requests with time windows. IEEE Trans. Ind. Appl. 2022, 58, 6546–6556. [Google Scholar] [CrossRef]
  8. Wang, C.; Lin, X.; He, F.; Shen, M.Z.-J.; Li, M. Hybrid of fixed and mobile charging systems for electric vehicles: System design and analysis. Transp. Res. Part C Emerg. Technol. 2021, 126, 103068. [Google Scholar] [CrossRef]
  9. Li, H.; Son, D.; Jeong, B. Electric vehicle charging scheduling with mobile charging stations. J. Clean. Prod. 2024, 434, 140162. [Google Scholar] [CrossRef]
  10. Liu, L.; Zhang, H.; Xu, J.; Wang, P. Providing active charging services: An assignment strategy with profit-maximizing heat maps for idle mobile charging stations. IEEE Trans. Mob. Comput. 2024, 23, 2139–2152. [Google Scholar] [CrossRef]
  11. Nazari-Heris, M.; Loni, A.; Asadi, S.; Mohammadi-Ivatloo, B. Toward social equity access and mobile charging stations for electric vehicles: A case study in Los Angeles. Appl. Energy 2022, 311, 118704. [Google Scholar] [CrossRef]
  12. Saboori, H.; Jadid, S. Mobile battery-integrated charging station for reducing electric vehicles charging queue and cost via renewable energy curtailment recovery. Int. J. Energy Res. 2022, 46, 1077–1093. [Google Scholar] [CrossRef]
  13. Zhao, Z.; Luo, F.; Zhu, J.; Ranzi, G. Multi-stage mobile BESS operational framework to residential customers in planned outages. IEEE Trans. Smart Grid 2023, 14, 3640–3653. [Google Scholar] [CrossRef]
  14. Aktar, A.K.; Taşcıkaraoğlu, A.; Catalão, J.P.S. Scheduling of mobile charging stations with local renewable energy sources. Sustain. Energy Grids Netw. 2024, 37, 101257. [Google Scholar] [CrossRef]
  15. Neto, R.C.; Bandeira, C.M.; Azevedo, G.M.S.; Limongi, L.R.; de Carvalho, M.R.S.; Castro, J.F.C.; Rosas, P.A.C.; Venerando, A.C.; Spader, N.; Bueno, E. Mobile charging stations: A comprehensive review of converter topologies and market solutions. Energies 2024, 17, 5931. [Google Scholar] [CrossRef]
  16. Bokopane, L.; Kusakana, K.; Vermaak, H.; Hohne, A. Optimal power dispatching for a grid-connected electric vehicle charging station microgrid with renewable energy, battery storage and peer-to-peer energy sharing. J. Energy Storage 2024, 96, 112435. [Google Scholar] [CrossRef]
  17. Ala, A.; Deveci, M.; Bani, E.A.; Sadeghi, A.H. Dynamic capacitated facility location problem in mobile renewable energy charging stations under sustainability consideration. Sustain. Comput. Inform. Syst. 2024, 41, 100954. [Google Scholar] [CrossRef]
  18. Rani, G.A.; Priya, P.L.; Jayan, J.; Satheesh, R.; Kolhe, M.L. Data-driven energy management of an electric vehicle charging station using deep reinforcement learning. IEEE Access 2024, 12, 65956. [Google Scholar] [CrossRef]
  19. Wang, K.; Wang, H.; Yang, Z.; Feng, J.; Li, Y.; Yang, J.; Chen, Z. A transfer learning method for electric vehicles charging strategy based on deep reinforcement learning. Appl. Energy 2023, 343, 121186. [Google Scholar] [CrossRef]
  20. Tang, M.; Zhuang, W.; Li, B.; Liu, H.; Song, Z.; Yin, G. Energy-optimal routing for electric vehicles using deep reinforcement learning with transformer. Appl. Energy 2023, 350, 121711. [Google Scholar] [CrossRef]
  21. Qiu, D.; Wang, Y.; Hua, W.; Strbac, G. Reinforcement learning for electric vehicle applications in power systems: A critical review. Renew. Sustain. Energy Rev. 2023, 173, 113052. [Google Scholar] [CrossRef]
  22. Suanpang, P.; Jamjuntr, P. Optimizing electric vehicle charging recommendation in smart cities: A multi-agent reinforcement learning approach. World Electr. Veh. J. 2024, 15, 67. [Google Scholar] [CrossRef]
  23. Lin, B.; Ghaddar, B.; Nathwani, J. Deep reinforcement learning for the electric vehicle routing problem with time windows. IEEE Trans. Intell. Transp. Syst. 2022, 23, 11528–11538. [Google Scholar] [CrossRef]
  24. Ahmed, I.; Adnan, M.; Hassan, W. A bidirectional interactive electric vehicles PV grid connected framework for vehicle-to-grid and grid-to-vehicle stability enhancement using hybrid control strategies. Comput. Electr. Eng. 2025, 122, 109983. [Google Scholar] [CrossRef]
  25. Ullah, Z.; Hussain, I.; Mahrouch, A.; Ullah, K.; Asghar, R.; Ejaz, M.T.; Aziz, M.M.; Naqvi, S.F.M. A survey on enhancing grid flexibility through bidirectional interactive electric vehicle operations. Energy Rep. 2024, 11, 5149–5162. [Google Scholar] [CrossRef]
  26. Choudhary, D.; Mahanty, R.N.; Kumar, N. Demand management of plug-in electric vehicle charging station considering bidirectional power flow using deep reinforcement learning. Eng. Appl. Artif. Intell. 2025, 139, 109585. [Google Scholar] [CrossRef]
  27. Choudhary, D.; Mahanty, R.N.; Kumar, N. Plug-in electric vehicle dynamic pricing strategies for bidirectional power flow in decentralized and centralized environment. Sustain. Energy Grids Netw. 2024, 38, 101317. [Google Scholar] [CrossRef]
  28. Sayed, M.A.; Atallah, R.; Assi, C.; Debbabi, M. Electric vehicle attack impact on power grid operation. Int. J. Electr. Power Energy Syst. 2022, 137, 107784. [Google Scholar] [CrossRef]
  29. Hernandez-Matheus, A.; Berg, K.; Gadelha, V.; Aragüés-Peñalba, M.; Bullich-Massagué, E.; Galceran-Arellano, S. Congestion forecast framework based on probabilistic power flow and machine learning for smart distribution grids. Int. J. Electr. Power Energy Syst. 2024, 156, 109695. [Google Scholar] [CrossRef]
  30. Avila-Rojas, A.E.; De Oliveira-De Jesus, P.M.; Alvarez, M. Distribution network electric vehicle hosting capacity enhancement using an optimal power flow formulation. Electr. Eng. 2021, 104, 1337–1348. [Google Scholar] [CrossRef]
  31. Aggarwal, S.; Singh, A.K.; Rathore, R.S.; Bajaj, M.; Gupta, D. Revolutionizing load management: A novel technique to diminish the impact of electric vehicle charging stations on the electricity grid. Sustain. Energy Technol. Assess. 2024, 65, 103784. [Google Scholar] [CrossRef]
  32. Yang, Y.; Xu, J.; AL-Wesabi, A.I.; Aboudrar, I.; Shi, Z.; He, Y. Dynamic LADRC and modified indirect P&O algorithm based-power flow management of PV-BESS-grid integrated fast EV charging stations with G2V, V2G and V2H capability. J. Energy Storage 2025, 112, 115505. [Google Scholar]
  33. Hasanien, H.M.; Alsaleh, I.; Alassaf, A.; Alateeq, A. Enhanced coati optimization algorithm-based optimal power flow including renewable energy uncertainties and electric vehicles. Energy 2023, 283, 129069. [Google Scholar] [CrossRef]
  34. Sithambaram, M.; Rajesh, P.; Shajin, F.H.; Rajeswari, I.R. Grid connected photovoltaic system powered electric vehicle charging station for energy management using hybrid method. J. Energy Storage 2025, 108, 114828. [Google Scholar] [CrossRef]
  35. Upadhaya, D.; Biswas, S.; Dutta, S.; Bhattacharya, A. Optimal power flow and grid frequency control of conventional and renewable energy source using evolutionary algorithm based FOPID controller. Renew. Energy Focus 2025, 53, 100676. [Google Scholar] [CrossRef]
  36. Saini, S.S.; Sharma, K.K. Power enhancement in distributed system to control the bidirectional power flow in electric vehicle. Multimed. Tools Appl. 2023, 83, 54673–54698. [Google Scholar] [CrossRef]
  37. Mazza, A.; Benedetto, G.; Bompard, E.; Nobile, C.; Pons, E.; Tosco, P.; Zampolli, M.; Jaboeuf, R. Interaction among multiple electric vehicle chargers: Measurements on harmonics and power quality issues. Energies 2023, 16, 7051. [Google Scholar] [CrossRef]
  38. Maia, G.L., Jr.; Santos, C.C.L.; Nunes, P.R.M.; Castro, J.F.C.; Marques, D.C.; Medeiros, L.H.A.D.; Limongi, L.R.; Brito, M.E.C.; Dantas, N.K.L.; Filho, A.V.M.L.; et al. EV smart-charging strategy for power management in distribution grid with high penetration of distributed generation. Energies 2024, 17, 5394. [Google Scholar] [CrossRef]
  39. Jia, X.; Xia, Y.; Yan, Z.; Gao, H.; Qiu, D.; Guerrero, J.M.; Li, Z. Coordinated operation of multi-energy microgrids considering green hydrogen and congestion management via a safe policy learning approach. Appl. Energy 2025, 374, 123456. [Google Scholar] [CrossRef]
  40. Ahmed, I.; Shahid, M.K.; Faisal, T. Deep reinforcement learning based beam selection for hybrid beamforming and user grouping in massive MIMO-NOMA system. IEEE Access 2022, 10, 89519. [Google Scholar] [CrossRef]
  41. Ngo, A.P.; Thomas, C.; Oikonomou, K.; Nguyen, H.; Nguyen, D. On the comparison of different convexified power flow models in radial network. In Proceedings of the IEEE Kansas Power and Energy Conference (KPEC), Manhattan, KS, USA, 25–26 April 2022; pp. 1–6. [Google Scholar]
  42. World Bank Group; International Finance Corporation (IFC). Global Solar Atlas. Available online: https://globalsolaratlas.info/ (accessed on 23 September 2025).
  43. Pettikkattil, J. IEEE 15 Bus Radial System. MATLAB Central File Exchange 2025. Available online: https://www.mathworks.com/matlabcentral/fileexchange/48104-ieee-15-bus-radial-system (accessed on 23 September 2025).
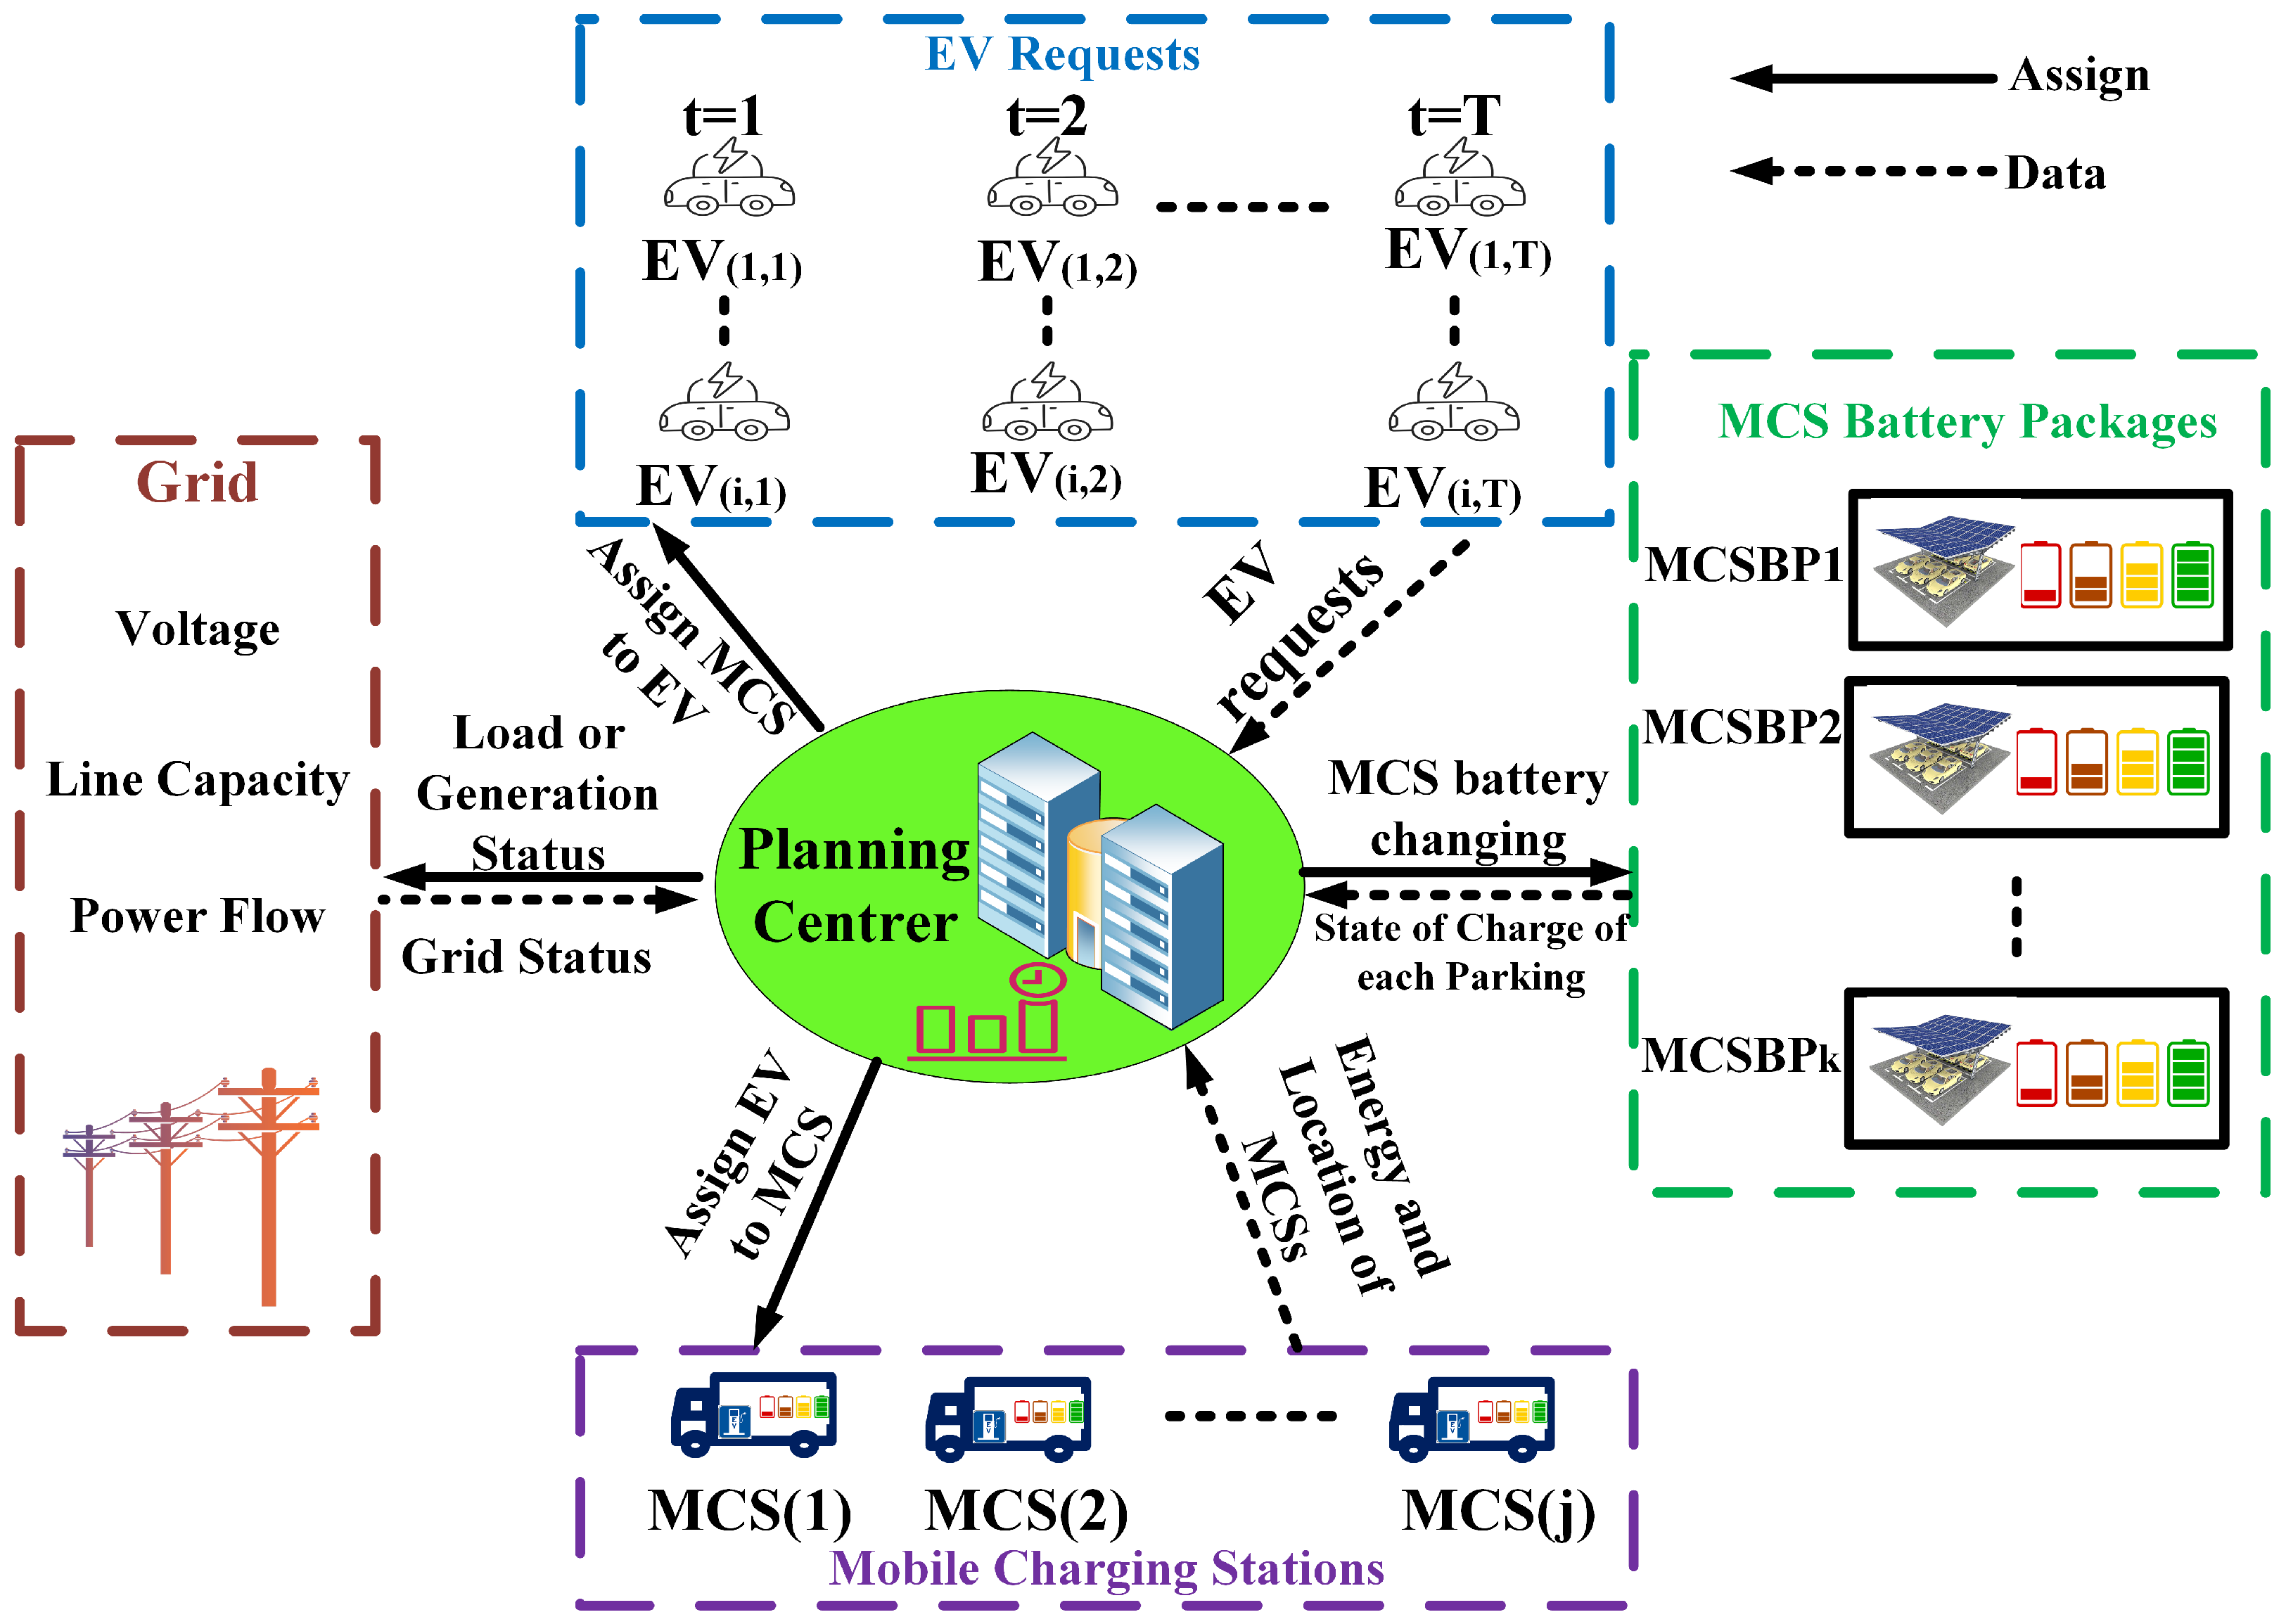
Figure 1. The proposed scheduling model.
Energies 18 05337 g001
Figure 2. The exchange power at the charging station.
Energies 18 05337 g002
Figure 3. EV requests sample and MCS actions.
Energies 18 05337 g003
Figure 4. SOC status of battery packages.
Energies 18 05337 g004
Figure 5. Energy fee and battery package charging scheduling.
Energies 18 05337 g005
Figure 6. Power exchange of storage system.
Energies 18 05337 g006
Figure 7. Statistical validation of simulation results. Boxplots illustrate the distribution, variance, and mean percentage error between DRL-based outcomes and optimization benchmarks as the number of scenarios increases.
Energies 18 05337 g007
Figure 8. 15 bus IEEE system.
Energies 18 05337 g008
Figure 9. SOC status of battery packages case 2—without limitation.
Energies 18 05337 g009
Figure 10. SOC status of battery packages case 2—with limitation.
Energies 18 05337 g010
Figure 11. Current through lines under different cases: (a) Case 1, (b) Case 2, (c) Case 3.
Energies 18 05337 g011
Figure 12. Voltage of buses under different cases: (a) Case 1, (b) Case 2, (c) Case 3.
Energies 18 05337 g012
Figure 13. Time-of-Use change.
Energies 18 05337 g013
Table 1. Simulation parameters [6].
CAP k , b E ̲ j , t mcs E ¯ j , t mcs δ ch / dch η k , b ch / dch
100 KW20 KW100 KW30%90%
λ j , t mcs λ i , j , t del α j ρ t Δ t
$0.12$30$0.0004[6]30-min
Table 2. The result comparison.
OptimalDQN
The MCS Power Delivery IncomUSD 787.5USD 619
The Power Exchange IncomeUSD 144.5USD 155
The Battery Package Charging CostUSD −79.5USD −44.5
Total RevenueUSD 852.59USD 729.5
Disclaimer/Publisher’s Note: The statements, opinions and data contained in all publications are solely those of the individual author(s) and contributor(s) and not of MDPI and/or the editor(s). MDPI and/or the editor(s) disclaim responsibility for any injury to people or property resulting from any ideas, methods, instructions or products referred to in the content.