Article

Technoeconomic Feasibility of Wind and Solar Generation for Off-Grid Hyperscale Data Centres

CREST (Centre for Renewable Energy Systems Technology), Wolfson School of Mechanical, Electrical and Manufacturing Engineering, Loughborough University, Ashby Road, Loughborough LE11 3TU, UK
*
Author to whom correspondence should be addressed.
Energies 2025, 18(2), 382; https://doi.org/10.3390/en18020382
Submission received: 28 November 2024 / Revised: 4 January 2025 / Accepted: 8 January 2025 / Published: 17 January 2025

Abstract

:
As a global community our use of data is increasing exponentially with emerging technologies such as artificial intelligence (AI), leading to a vast increase in the energy demand for data centres worldwide. Delivering this increased energy demand is a global challenge, which the rapid growth of renewable generation deployment could solve. For many data centre giants such as Google, Amazon, and Microsoft this has been the solution to date via power purchase agreements (PPAs). However, insufficient investment in grid infrastructure globally has both renewable generation developers and data centre developers facing challenges to connect to the grid. This paper considers the costs and carbon emissions associated with stand-alone hybrid renewable and gas generation microgrids that could be deployed either before a grid connection is available, or to allow the data centre to operate entirely off-grid. WindPRO 4.0 software is used to find optimal configurations with wind and solar generation, backed up by battery storage and onsite gas generation. The results show that off-grid generation could provide lower cost and carbon emissions for each of Europe’s data centre hotspots in Frankfurt, London, Amsterdam, Paris, and Dublin. This paper compares each generation configuration to grid equivalent systems and an onsite gas-only generation solution. The results showed that each hybrid renewable generation configuration had a reduced levelized cost of energy (LCOE) and reduced CO2eq emissions compared to that of its grid and gas-only equivalent. Previous literature does not consider the economic implications caused by a mismatch between generation and consumption. Therefore, this paper introduces a new metric to evaluate and compare the economic performance of each microgrid, the levelized cost of energy utilised (LCOEu) which gives the levelized cost of energy for a given microgrid considering only the energy which is consumed by the data centre. The LCOEu across all sites was found to be between 70 and 102 GBP/MWh with emissions between 0.021 and 0.074 tCO2eq/MWh.

1. Introduction

The use of data in recent years has increased dramatically and is continuing to do so with rising technologies such as artificial intelligence (AI), machine learning, blockchain, cloud gaming and augmented/virtual reality being deployed at a vast rate and scale. As well as these new emerging technologies existing technologies such as mobile data, video streaming and crypto mining are all still rising in data consumption. These activities are all facilitated by data centres located across the globe and collectively as an industry the energy consumption from data centres is increasing at a rate and scale never seen before. The global data centre capacity demand is estimated to be around 50 GW as of 2023 and is predicted to rise to 200 GW by 2030, with AI accounting for 15% of this demand in 2023 and predicted to account for 40% by 2030 [1]. The energy consumption associated with this global data centre capacity demand is estimated by the International Energy Agency (IEA) to rise to 1000 TWh by 2026 from 460 TWh estimated in 2022 and is expected to rise from 1% to 6% of the UK energy demand by 2030 [2,3]. Some studies even suggest the global energy demand for data centres could increase to 8000 TWh by 2030 [4].
The challenge faced is how to sustainably deliver energy to an industry growing at such a rapid pace. The long-term strategy has been to increase the renewable energy capacity globally, for which the data centre industry leaders such as Google, Microsoft and Amazon all are massively contributing with power purchase agreements (PPAs) covering 100% of their annual energy consumption, respectively [5,6,7]. Power purchase agreements are contractual arrangements between a generator and a consumer in which an agreed amount of energy is procured at an agreed cost for an agreed period of time in advance of the energy generation. However, insufficient investment in grid infrastructure globally is leading to increasingly constrained grids which is starting to slow the progress of the deployment of renewable energy, with over 3000 GW of renewable generation projects awaiting grid connections as of 2023 [8]. These constraints are also inhibiting the construction and operation of new data centres globally [9].
This paper presents a solution to this challenge by deploying hybrid renewable energy systems for providing off-grid energy to data centres. This approach uses wind, solar, gas and batteries to provide reliable and sustainable energy to data centres that cannot obtain a connection to local grids. Each technology is integrated into a microgrid electrical network, which will have an energy management scheme facilitating the automatic operation of the system. The batteries will be used in a grid-forming control mode stabilising the system voltage and frequency. The batteries will also be sized such that the system’s maximum and minimum load steps can be accepted by the system without causing the voltage and frequency of the system to fall outside of the data centre’s operational limits. The wind generation will operate in synchronisation with the battery system at maximum output unless curtailed by the energy management system. Solar generation will be connected to the microgrid via multiple inverters which will be in synchronisation with the battery system inverters but will not control the microgrid voltage and frequency. Gas generation is used as peak lopping and will be issued real and reactive power set points from the energy management system based on the deficit power between the renewable generation and the data centre demand. The gas generation will have sufficient capacity to serve the entire demand of the data centre, eliminating the need for backup diesel generators as required for a data centre to achieve its uptime tier rating.
The economic feasibility of an energy generation scheme is typically quantified by the levelized cost of energy (LCOE), which is the cost per unit of energy generated considering the capital expenditure (CAPEX) and operating expenditure (OPEX) of the system. Previous works presenting hybrid renewable energy systems for off-grid energy do not consider the economic impact of energy generation and consumption mismatch and the effect of curtailment. This paper presents a levelized cost of energy utilised (LCOEu) metric to quantify this impact, which considers the cost per unit of energy consumed.
This paper presents five case studies located in the five key data centre hotspots in Europe, locations which collectively account for over 85% of Europe’s data centre demand, often referred to as FLAPD consisting of Frankfurt, London, Amsterdam, Paris, and Dublin [10].
This paper recognises that time is critical in bringing data centres online and that developing renewable energy generation plants can often take much longer than developing and constructing the data centre. This is often caused by prospective renewable generation plants facing challenges during the planning phase. For this reason, this paper considers the economic and sustainability impacts of operating a gas-only generation solution which can facilitate the operations of the data centre whilst the renewable energy generation schemes are in development and construction. Further to this, implementing a hybrid renewable energy system requires a large CAPEX unlike utilising a PPA for energy procurement, and it is typical that during the initial operating years, the data centre demand would be small in comparison to its capacity. Therefore, there is an economic incentive to shift the installation of renewable energy technologies further into the operation lifetime of the data centre and support the data centre load using gas generators and battery technologies during early operation in order to obtain maximum economic benefit.
The five case study hybrid renewable energy systems presented within this paper are simulated using EMD International WindPRO 4.0 software. WindPRO is a leading software for the planning of wind farm projects and has modules for optimising wind farm layouts, solar farm layouts and hybrid systems. For each system, the levelized cost of energy (LCOE) and emissions are compared against the costs of an equivalent local grid-connected system, onsite gas-only generation, and renewable power purchase agreements.
The design criteria for a hybrid renewable energy scheme are typically based on two definitions: loss of power supply probability (LPSP) and levelized cost of energy (LCOE) both for a given load profile [11]. LPSP is the statistical possibility of the power generation system being unable to support the load due to a lack of generation caused by intermittent generation with insufficient storage and/or undersized dispatchable generation. The LPSP for data centres is zero, in order to maintain the data centre industry standard uptime merit of 99.999% and the LCOE is to be as low as possible. Iverson et al. and Lian et al. both present optimised hybrid renewable energy systems for data centres using these metrics [12,13].
The capacity of each technology within the hybrid renewable energy system is critical to the reliability of the system and the commercial viability of the project. Therefore, each technology must be optimally sized to ensure that the data centre energy demand can be met at the minimum total cost.

2. Design and Methodology

This section details the design and methodology for the various hybrid renewable energy system solutions for providing energy to a hypothetical hyperscale data centre in each of the FLAPD markets. Hyperscale data centres vary in capacity anywhere from 20 MW to over 300 MW. This paper considers a hyperscale data centre with a capacity of 50 MW.
The load profile of a hyperscale data centre can vary significantly depending on the end user application. The demand could be that of internet service providers with daily fluctuations or, if the end-user has a constant workload for applications such as AI training, the demand could be flat. This paper considers a flat load profile. Fluctuations due to cooling are neglected as the total cooling demand in hyperscale data centres typically represents less than 10% of the total energy demand [5,14]. Further to this, changes in external temperature would have only minimal effect on hyperscale data centre cooling demand as they utilise more advanced and efficient cooling then traditional data centres.

2.1. Levelised Cost of Energy

The levelized cost of energy is the average cost per unit (MWh) and is the primary economic metric for analysing the cost of energy. This is calculated by taking the total lifetime costs and dividing by the amount of energy produced over that lifetime.
L C O E = I 0 + t = 1 n A 1 + i t t = 1 n E t , g 1 + i t
  • LCOE is the levelized cost of energy (GBP/MWh)
  • A is the annual total cost (GBP)
  • t is the year of operation
  • n is the lifetime in years
  • E t , g is the annual energy produced (MWh)
  • i is the interest rate (%)
The interest rate is set at 3% within this paper, as advised within Ofgem cost–benefit analysis guidance [15].
The standard formula for LCOE does not allow for a fair comparison of the proposed hybrid renewable energy systems with gas-only generation solutions and grid-connected equivalents. This is because the hybrid renewable energy system can produce more energy than is required by the data centre which if following Equation (1) will lead to a reduced LCOE. This additional energy can be either stored or curtailed by the hybrid renewable energy system. To give a fair comparison the levelized cost of energy utilised (LCOEu) is defined. This is calculated by taking the total lifetime costs and dividing them by the amount of energy consumed by the data centre over that lifetime. The value of LCOEu will be higher than LCOE.
L C O E u = I 0 + t = 1 n A 1 + i t t = 1 n E t , c 1 + i t
  • LCOEu is the levelized cost of energy utilised (GBP/MWh)
  • E t , c is the annual energy consumed (MWh)
To allow comparison of the costs of hybrid renewable energy system and equivalent power purchase agreements (PPAs) the LCOEs,w is defined, which considers the LCOE of only the solar and wind component of the hybrid renewable energy system. This is because the PPAs that data centres utilise comprise only solar and/or wind generation and do not consider the battery and gas generation as deployed within each proposed hybrid renewable energy system. This is a limitation of PPAs as they do not consider the cost of energy when the renewable resource is not available. LCOEs,w is calculated by taking the total lifetime costs of the solar and wind components and dividing them by the amount of energy generated by the solar and wind generation over that lifetime.
L C O E s , w = I 0 + t = 1 n A 1 + i t t = 1 n E t , s , w 1 + i t
  • LCOEs,w is the levelized cost of solar and wind energy (GBP/MWh)
  • E t , s , w is the annual energy produced by solar and wind (MWh)

2.2. Technology Choice

Renewable energy alone cannot provide reliable power for data centres as the sources are intermittent. However, a hybrid scheme with a combination of multiple renewable energy sources accompanied by an energy storage scheme can improve the reliability of the renewable energy scheme and reduce the reliance on onsite generation from oil and gas or utility. In the instance where the hybrid renewable energy system operates without connection to the local electrical grid, this system can be described as a microgrid. The choice of renewable energy technologies is an important consideration for a hybrid renewable energy system, with solar, wind, hydropower and biomass power being the most common. Within this paper, only solar and wind are selected as viable technologies. Hydropower is disregarded as it cannot be adopted near any of the data centre hotspot locations due to a lack of resources. Biomass is also disregarded due to challenges in the reliable availability of resources [16]. Wind and solar are chosen as they are well-developed technologies with low LCOE across Europe [8]. Having a combination of technologies allows for each technology to potentially compensate for the other in times of low generation reducing the reliance on dispatchable generation and lowering energy storage requirements.
The choice of energy storage technologies is also an important consideration for a hybrid renewable energy system, with batteries and hydrogen being the most suitable. Iverson et al., Haddad et al., and Clúa et al. all present hydrogen storage in their hybrid renewable energy systems with Haddad et al. having batteries accompanying the hydrogen [12,17,18]. The hybrid renewable energy system presented by Clúa et al. is supported by the grid so that the electrolyser operates at constant power to maintain high purity hydrogen. If the grid is not as ‘green’ as the hybrid renewable energy system then the environmental benefit of using hydrogen for energy storage will be reduced. Hydrogen is more suitable for long-term storage compared to batteries with Microsoft promoting a ‘first of its kind’ 3 MW polymer electrolyte membrane (PEM) fuel cell backup power generator for data centre applications [19]. Within this paper, batteries are chosen as the energy storage technology as they are suitable for utility scale-up, unlike hydrogen. Battery energy storage is also a more mature technology than hydrogen and has lower costs and maintenance requirements.

2.2.1. Wind

The selection of a suitable wind turbine to provide reliable, resilient, economically viable, and environmentally sustainable power is site-specific and is dependent upon the wind resource at a given site. For the selected 50 MW demand, no single turbine is sufficient and so a wind farm is required.
There are a variety of considerations when developing a wind farm, including site resources, site infrastructure, legal obligations, and turbine layout. The site resource is dependent on location, with factors such as surface roughness, height above sea level and interference with other structures affecting the wind speed and the available power. In this paper locations are fixed near the data centre hotspots and the resource is assessed using meteorological data available from nearby measurement sites. Site infrastructure such as access for vehicles for turbine transport is not considered within this paper. Legal obligations such as shadow flicker, noise and effect on bird migration are also not considered, although it is appreciated that these concerns could be a barrier to allowing wind farm development for the data centre.
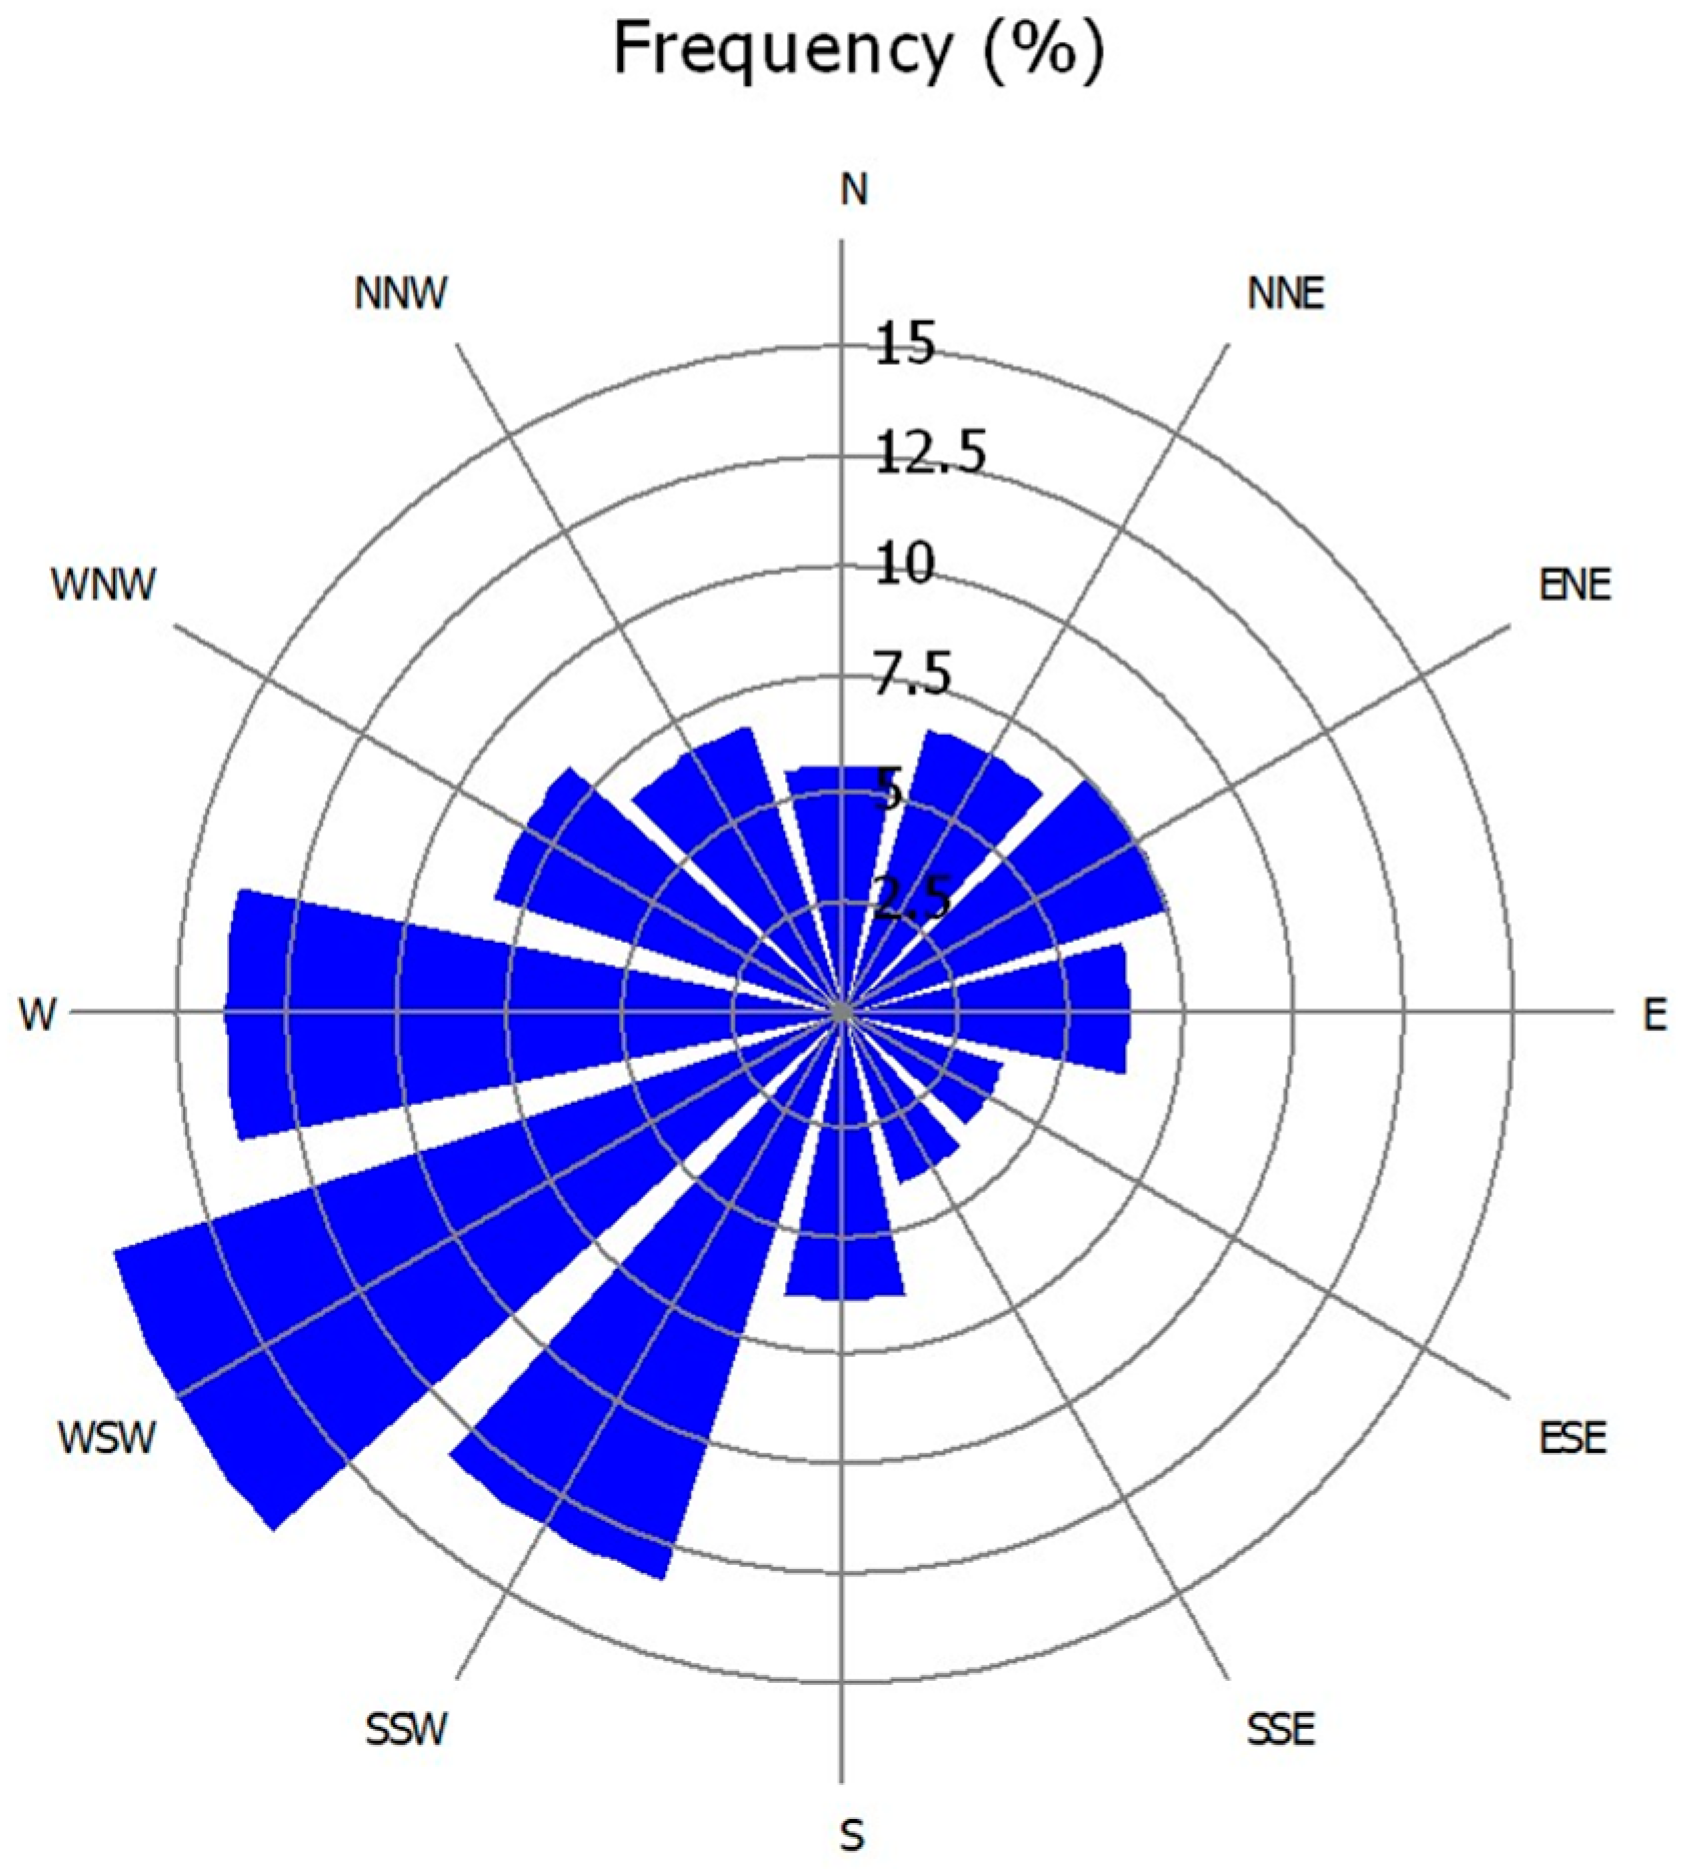
Wind farm layout is an important consideration as the wake of a wind turbine can affect the available power for nearby turbines. Traditional layouts are such that they are uniform with distance ellipses between each turbine, typically with a radius of seven times the rotor diameter on the major axis and four times the rotor diameter on the minor axis, with the major axis of the ellipse pointing in the direction of the mean wind direction as shown on a wind rose [20]. Meyers and Meneveau challenge this approach by presenting a mathematical method of determining the optimum non-elliptical wind turbine spacing considering the annual energy yield and cost of both the land and turbine [21]. Their conclusions state that the average optimal spacing between wind turbines is 15 times the rotor diameter, more than double the factor of seven that traditional layouts suggest.
WindPRO software has been used for optimising the wind farm layout and results are compared with the methods presented by Meyers and Meneveau. WindPRO has been selected as it includes a vast database of meteorological data globally and available wind turbine models. WindPRO calculates the annual energy production (AEP) for a single turbine using wind speed statistics from meteorological data and the chosen wind turbine power curve. The AEP for the wind farm is then calculated using an improved N.O. Jensen wake model. WindPRO then optimises the wind farm layout using a proprietary ‘smart’ iterative method.

2.2.2. Solar

Solar power is an intermittent sustainable energy source using photovoltaics, which generates direct current from semiconductors being illuminated by photons from the sun’s light. The energy that can be produced by a solar farm depends on the solar irradiation as well as the solar farm layout considering tilt angle, azimuth angle, row spacing, shading and albedo of the ground.
Optimising the solar farm layout depends on the site location with respect to the position of the sun. WindPRO has been selected for the solar farm optimisation as it allows for all technologies within the hybrid renewable energy system to be modelled using only one software package eliminating the need to integrate the results from multiple simulations. It is recognised that other software packages such as PVSyst version 8 could be more appropriate for obtaining more detailed and comprehensive results.
The WindPRO analysis assumes that the tilt angle of the panels can be optimised continuously. Tilt control is often not implemented due to maintenance requirements but, as this paper is considering a hybrid renewable energy systems solution for a mission-critical application, there will be operators onsite 24/7. Therefore, regular maintenance checks are less of an inconvenience in comparison to remote solar farms which are often left unattended. Including tilt control has a relatively minor impact on the AEP of each solar farm with the a difference in the WindPRO of circa 5%. The solar azimuth angle and row spacing were optimised using the WindPRO solar optimiser. This can provide optimisation for either maximum annual energy production (AEP), minimum levelized cost of energy (LCOE) or maximum net present value (NPV).

2.3. Locations

Data centres are often geographically located in clusters. This is for many reasons such as available power, connectivity, workforce, politics and policy among others. However, the main drivers are power and connectivity.
The cost of land for each if the FLAPD locations is detailed in Table 1. It has been assumed that the land required is purchased rather than leased, thereby inflating the LCOE at each site.

2.4. Technology Costs

In order to calculate the LCOE for each technology and to allow WindPRO to optimise the hybrid renewable energy system configuration, the cost per unit of each technology is required and is shown in Table 2. The cost per unit is given as capital expenditure (CAPEX) and operating expenditure (OPEX). The LCOE includes both the CAPEX and OPEX.

2.5. Wind Turbines

Within WindPRO there are modelling parameters available for a vast number of wind turbine designs. The same turbine design has been selected for all site locations for ease of comparability, although it is appreciated that the optimum wind turbine choice may differ across sites.
Within WindPRO five wind turbines of different power ratings and hub heights were selected for comparison to find the optimum wind turbine that gave the lowest LCOE over 20 years. The five turbines selected are detailed in Table 3 and the optimum wind turbine was found to be the Vestas V172-7.2.
The results shown in Table 3 are for the Southwest England site. It is appreciated that the AEP and LCOE will be different at each site; however, it is assumed that the optimum turbine will prevail across all sites and as such this process is not repeated for each site.
It is recognised that the LCOE results for both the Vestas V172-7.2 and GE WIND ENERGY GE 2.5-120 are much lower than the 3.3 MW utility-scale example shown by the NREL [25] and the UK government prediction for 2025 for onshore wind [31] which show 39 USD/MWh and 38 GBP/MWh, respectively. This difference is due to these wind turbines having higher hub heights than most typical onshore wind turbines. This could potentially lead to planning permission issues and result in requiring a wind turbine of lower hub height. It is expected that a lower hub height would result in the wind farm having a lower capacity factor thereby increasing the LCOE.

2.6. Wind Farm Configuration

The wind farm layout for each location is optimised using the WindPRO wind farm layout optimisation function. Using this function the LCOE is improved compared to the traditional spacing method of 7D × 4D and the 15D spacing method suggested by Meyers and Meneveau [21]. The results for a site in Slough, England are shown in Table 4.
For each of the proposed locations, a square area of circa 100 ha is drawn in WindPRO which is angled so that the mean wind direction at the turbine hub height shown from the site wind rose is perpendicular to the area. Figure 1 shows how this is seen visually in WindPRO. It is appreciated that the availability of land is a primary consideration for each hybrid renewable energy system and that this ideal land geometry will most likely not be available. However, using the optimum geometry at each site allows for a fair comparison between sites.
Once the area is defined, using the wind farm optimiser in WindPRO a variety of configurations with varying numbers of wind turbines is simulated giving the optimum layout for annual energy production (AEP). From the AEP of each layout, the optimum LCOE can be found. Figure 2 shows the WindPRO wind farm optimiser output layout.
The WindPRO wind farm optimiser uses a ‘Global Atlas of Siting Parameter’ as the input for the wind speed data. Actual site conditions will deviate from this data, and WindPRO states that for “flat” terrain the mean error is 5.5% and the median error is 4.0%, recorded against 241 masts. This error is appreciated but not considered any further within this paper.

2.7. Solar Panels and Solar Farm Configuration

WindPRO has a variety of solar panel models within the software; however, unlike the wind turbine models which represent manufacturers and models available on the market, the solar panel models are generic. As with the wind turbine selection, the same solar panels will be used across all sites. The solar panel selected across all sites is the EMD-Generic 700 W due to having the highest power rating.
For this paper the tilt angle is tracked, therefore for optimisation purposes, the tilt angle is optimised within WindPRO and then fixed for the simulation for optimising the row distribution and azimuth angle. Row distribution is the spacing between adjacent rows of solar panels, sometimes referred to as row spacing. Row distribution affects how much one solar panel shades another at different tilt and solar angles, and therefore determines how much energy the shaded solar panel can produce.
Within WindPRO the solar panel azimuth can be altered such that it allows for a more consistent energy production profile with a lower maximum generation but increased at the extremes of sunrise and sunset. This arrangement is acknowledged with respect to its benefits for the flat data centre demand considered within this paper. However, for ease of comparability across each site a fixed optimum azimuth is determined for each site.
The solar irradiance data used for all calculations within WindPRO uses a SARAH-3 data set, this is a satellite-driven metrological measuring system that covers a spatial resolution of 5.5 km with a temporal resolution of 30 min. The mean error in data is 2.1% [32]. This data set was selected as it provides high-resolution solar irradiation data across each site used within this paper, therefore the reliability of the solar irradiation data is uniform across all sites.

2.8. WindPRO Limitations and Uncertainties

This paper utilises the WindPRO micro-grid optimiser for HRES optimisation. The micro-grid optimiser in WindPRO can also include battery storage, curtailment, load shedding, grid connections and dispatchable generators (oil and gas) for a user-defined demand profile, covering the technology and topology of the systems proposed in this project. The WindPRO micro-grid optimiser, searches for the minimum lifetime cost of the system using an iterative method, adjusting the scaling of each technology capacity. The output gives predicted hourly generation data for the lifespan of the HRES. By including carbon pricing within the optimiser, emissions can be indirectly optimised.
The optimiser is limited in that it does not consider the non-linearity of technology costs therefore limits are implemented within the optimiser so that the system does not increase or decrease the magnitude of a given technology outside of the cost range for which the associated costs are reflective. The optimiser is also limited in that land requirements are not considered; for example, the lifetime cost of the system may be reduced by GBP 1 but require an additional hectare of land. Another limitation of the WindPRO hybrid optimiser is that it does not consider the degradation of the battery storage system which would be expected at a rate of more than 1.5% per year based on a single charge and discharge period per day [33]. The battery storage system costs are also excluded from the LCOE calculation within the optimiser therefore the LCOE of each site is calculated using Excel.

3. Results and Discussion

This section details the WindPRO results of the optimum hybrid renewable energy system at each proposed location for a 50 MW constant load hyperscale data centre with an expected operational life of 35 years. The results are compared with an equivalent grid-connected system and an equivalent gas-generation-only system.

3.1. Energy Results

The WindPRO optimised hybrid renewable energy system at each location comprises wind, solar, battery and gas generation. Table 5 shows the percentage of the demand fulfilled by each technology at each optimised hybrid renewable energy system. For each system, wind is the largest source of energy followed by solar, battery storage discharge and gas, respectively. Paris has the least reliance on gas followed by Dublin, Amsterdam, Southwest England and then Frankfurt, respectively.
Table 6 shows the installed capacity of each technology at each site. For each system the installed capacity of battery energy storage is greater than 80% of the total demand. It is therefore recommended that during the feasibility stage of a specific project, a harmonic study is performed using the proposed inverters to assess the potential impact.
Table 7 shows the generation and capacity factor for both solar and wind at each site. It is recognised that the capacity factors shown in Table 7 for wind generation at the Amsterdam, Paris and Dublin sites are high in comparison to current onshore values for Europe, which for new wind farms are expected to be between 30 and 35% [34]. This variation could be explained by the hub height, selected in WindPRO, exceeding 150 m, which is achievable though not yet common. A sensitivity analysis is included below in Section 3.5 which demonstrates that this potential over-estimation in wind generation does not affect the overall suitability of the proposed systems.

3.2. Land

The availability of land is to be considered for each location; this is a critical non-technical consideration. The consequences of using land for renewable generation must be considered at each location. Conflicts of interest in land use between different stakeholders are a potential barrier to entry at a given location, as it could be argued that the same land should be used for farming or urban development. Environmental barriers such as wildlife habitat destruction and damage to local landscapes would also need to be considered. If there is sufficient land available at the given location, consideration must be given to the distance between the area utilised for renewable generation and the data centre, as installing a private wire connection could take a considerable amount of time as well as incur high costs. Table 8 details the land requirements and cost of each hybrid renewable energy system solution. It is seen that although Amsterdam requires less land than other sites the associated costs are higher than the other hybrid renewable energy system locations. Another consideration is that the area of land occupied by the wind farm can also have a secondary function as a source of income, such as farming. This is because the wind turbines only occupy a small area of the total land required. This is unlike solar which will occupy the majority of the required area.

3.3. Economics

3.3.1. Hybrid Renewable Energy Systems

For each hybrid renewable energy system, it can be seen in Table 9 that the LCOEu is greater than the LCOE showing that each hybrid renewable energy system produces more energy than is required for the data centre. It can also be seen that the LCOEs,w at each site is lower than the LCOE and LCOEu as it comprises only the solar and wind generation, these technologies alone are not capable of fulfilling the data centre energy demand. This highlights how economic metrics can be misleading when not considering that wind and solar are not always available, this applies directly to PPAs and the misconception that PPAs alone are the solution to carbon-free data centres. In the case where the data centre is not grid-connected this additional energy must be either stored in the batteries or curtailed.
Significant consideration should be given to the initial capital required for constructing the hybrid renewable energy system. Table 10 shows the CAPEX and OPEX of each hybrid renewable energy system. The CAPEX of each proposed system is significant, potentially doubling the expected CAPEX for the data centre developer [35].

3.3.2. Grid Equivalents

Figure 3 shows the retail electricity prices for large industrial users from 2009 to 2023 [36]. It can be seen that each hybrid renewable energy system has a much lower unit cost of energy compared to purchasing from its associated grid since 2021. This gives evidence to suggest that even data centres which can obtain a grid connection should consider implementing a hybrid renewable energy system. The significant increase in the price of electricity since 2021 is attributed to both the COVID-19 pandemic and Russia’s invasion of Ukraine. Therefore, should electricity prices fall back to pre-2021 levels then the economic benefit of each hybrid renewable energy system will be reduced. However, there is a lot of uncertainty in the future price of electricity and the volatility of the retail market has been exposed. Implementing a hybrid renewable energy system reduces the data centre’s exposure to this risk by having a fixed and secure energy supply. Table 11 shows the total 35-year costs of energy, should the data centre be grid-connected, which far exceed the costs of the corresponding hybrid renewable energy systems, using energy prices as of 2023.

3.3.3. Gas Generation Only Solutions

The economics associated with the gas generation-only solutions rely almost exclusively on the price of gas. The price of gas similarly to the price of electricity has increased significantly in recent years, partly due to the COVID-19 pandemic and the war in Ukraine. Figure 4 shows the LCOE of a gas generation-only solution at each location using industry gas prices from the respective country from 2009 to 2023 [36]. The LCOE has been calculated assuming a gas generator efficiency of 40%. Note that for the gas generation-only solution, the LCOE is the same as the LCOEu. It can be seen that each hybrid renewable energy system has improved LCOE compared to the gas generation-only solution using gas prices post-2021. Similarly to the electricity market, recent years have exposed the volatility of the gas market thereby implementing a hybrid renewable energy system reduces the data centre’s exposure to economic risk.
The gas generation-only solution in the Southwest England, Amsterdam and Dublin locations shows improved LCOE compared to their local grid equivalent. This gives economic credibility to operating the data centre using gas generation until such times that the wind, solar and battery farms become available for integration into the system.

3.3.4. Power Purchase Agreements

The current method of reducing the carbon emissions associated with data centres is the procurement of green energy through power purchase agreements (PPAs). A power purchase agreement (PPA) is a contractual agreement between the generator and consumer whereby they agree to purchase the energy produced by the generator at an agreed price. There are a variety of different PPA mechanisms, these include direct wire PPA, a sleeved PPA or a virtual PPA. Renewable PPAs are limited in that when the renewable resource is not available the consumer is required to top up the additional energy required from either the grid or onsite generation. During these periods it is likely that the grid will have a high carbon intensity. This highlights that PPAs are only a partial solution for achieving carbon-free data centres.
A direct wire PPA requires the generator to be located close to the consumer so that a physical private wire connection can be made. This type of PPA does not necessarily require the consumer to have a grid connection, therefore this is a valid comparison to the hybrid renewable energy systems proposed within this paper. Direct wire PPAs are typically the most cost-effective PPA as they do not incur any regulatory charges imposed by the grid, unlike sleeved and virtual PPAs which require the energy to be delivered via the grid. Also, a private wire PPA eliminates the exposure of the wholesale price volatility as would be seen with sleeved and virtual PPAs.
Table 12 shows the average price in Europe for a solar and wind power purchase agreement either as private wire or sleeved/virtual. The cost of a PPA can vary significantly depending on a variety of factors. It can be seen that the hybrid renewable energy system LCOEs,w for each site remains within +/− 25% of that of the average private wire PPA LCOE. A private wire PPA between the data centre developer and generator would be mutually beneficial if the data centre is facing difficulty in that given area to obtain a grid connection so will the renewable generator, this gives both stakeholders a solution. A further benefit to the data centre developer is that they will not have the initial capital investment to make thereby reducing their financial risk. In the case of a private wire PPA, the data centre developer must also consider its load ramp rate (this is the time it takes for the data centre’s capacity to be met by customers) as the generator will expect to dispatch all of its contracted energy to the data centre for which the data centre will have to pay for regardless of if it can be consumed or not. Furthermore, when the wind and solar contracted by the private wire PPA are not generating the data centre must top up this additional demand, therefore putting the data centre developer in the same situation technically as if they undertook the generation activities themselves requiring dispatchable generation from either gas generation or battery storage.
The PPAs procured by Google are either sleeved or virtual meaning they are via the electricity grid. In this case, there is a financial benefit to implementing the hybrid renewable energy system, as the cost of procuring solar and wind energy is reduced across all sites and the exposure to wholesale market prices is eliminated. Similarly to the private wire PPA, when the contracted PPA is not producing energy, the data centre will have to top up the energy by other means, which in the case of grid-connected data centres with sleeved/virtual PPAs is purchased via the electricity grid. This will increase the overall LCOE to the data centre depending on the volume of energy that needs to be purchased from the electricity grid. The predictability of this volume and the time when it needs to be consumed will affect the cost imposed by the energy supplier if the demand is unpredictable day by day or hour by hour the energy supplier will be exposed to balancing risk. This means that the energy supplier will need to procure the energy required by the data centre from the balancing markets such as the day ahead market or intraday market both of which are susceptible to large swings in price depending on a variety of factors. The energy supplier will pass these costs down to the data centre.

3.4. Environmental

3.4.1. Hybrid Renewable Energy System Emissions

Table 13 shows the carbon intensity of each hybrid renewable energy system. The embodied carbon from manufacturing, transportation and installation accounts for the hybrid renewable energy system construction emissions and is assumed to be as follows:
  • Wind: 333 kg/CO2eq/kW [39]
  • Solar: 400 kg/CO2eq/kW [40]
  • Battery Storage: 200 kg/CO2eq/kWh [41]
The operational emissions of each hybrid renewable energy system are associated with the burning of gas, these emissions are assumed to be 0.18 kg/CO2eq/kWh [42] with a reciprocating gas engine efficiency of 40%.

3.4.2. Grid Emissions

Energy produced by a generator connected to a local grid cannot be delivered to a specific user. Therefore, for grid-connected data centres, irrespective of the PPAs and/or renewable energy guarantees of origin certificates (REGOs) a consumer has in place the emissions associated with the energy consumption of the data centre will be that of the carbon intensity of the grid at that given point in time. Table 14 shows the equivalent energy-related carbon emissions for each data centre if the energy was delivered by its associated utility grid over a 35-year period based on yearly average grid emissions as of 2023 [43]. This shows clearly that each hybrid renewable energy system has significant emissions reductions compared to operating on local grids in 2023, which gives evidence to suggest all data centres that can facilitate a hybrid renewable energy system should, with or without a grid connection. However, it is expected that over the 35-year operating life of each hybrid renewable energy system, its associated grids carbon intensity will be reduced as renewable penetration across each region increases.

3.4.3. Gas Emissions

Table 15 shows the carbon emissions from energy consumption for each data centre location if the energy were to be delivered by a gas only solution over a 35-year period. The results show each hybrid renewable energy system to have significant emissions reductions compared to the gas only solution. The emissions from the gas generation only solutions are higher than that of the local grid equivalents across all sites. However, this increase is not significant at the Dublin and Frankfurt locations with the emissions only being reduced by 13% and 21%, respectively.
Further to this the gas generation only solution is proposed only to provide the data centres energy demand in the initial operating years whilst the renewable energy is phased in over time. It is also likely that in many cases the data centre load will be much lower during the initial operational years as tenant occupancy typically builds up over some years.

3.4.4. Carbon-Free Energy

Many companies claim that their annual energy consumption is sourced from 100% renewables, this is no different to the data centre market leaders. This gives rise to the question, of how is this achieved when renewable energy sources are intermittent by nature. This can be achieved through either procuring an amount of MWh per year regardless of whether the energy generated will be consumed at a given point in time, or with the deficit energy required to top up the demand when the PPA is not generating procured with Renewable Energy Guarantees of Origin certificates (REGOs). Both mechanisms promote and help fund renewable energy schemes, however, it does not give a true reflection of the amount of energy consumed by the data centre that is actually derived from renewable sources at any given moment in time.
Carbon Free Energy (CFE) is a metric which details the yearly percentage of energy that is derived directly from renewables at the time of consumption.
Table 16 compares the CFE of each hybrid renewable energy system with its associated grid and Google’s reported CFE of its data centres in those locations [5]. It can be seen that the CFE of each hybrid renewable energy system is higher than that of its associated grid. Googles CFE is varied across locations with some matching and outperforming the CFE of the proposed hybrid renewable energy system.

3.5. Sensitivity Analysis

The sensitivity analysis shown in Figure 5 and Figure 6 shows how a reduction in wind AEP would affect the LCOEu and emissions of each site if the energy not produced by wind was fulfilled by gas generation. The results show that for each site excluding Paris, the LCOEu and emissions remain lower than grid-connected alternatives should wind energy production fall by 30%. The sensitivity analysis also showed that for each site excluding Paris and Southwest England, the LCOEu remains lower than gas-only generation alternatives should wind energy production fall by 30%.

4. Conclusions

This paper demonstrates that the challenges faced by data centre developers and renewable energy generators to connect to increasingly constrained grids can be solved by implementing off-grid hybrid renewable energy systems. The example systems presented within this paper show that hybrid renewable energy systems can significantly reduce data centres’ cost of energy and emissions compared to purchasing energy from their associated grids or equivalent gas generation-only schemes.
This paper also demonstrates the economic and environmental feasibility of deploying a gas-only solution to facilitate the initial operation of the data centre until renewable generation becomes available for integration into the system, or a grid connection becomes available. It was found in some instances that the gas-only solution is economically favourable in comparison to purchasing energy from local grids; however, the associated emissions would be higher.
The results of the hypothetical case studies presented within this paper give evidence to suggest that data centre developers should consider undertaking full feasibility studies for implementing off-grid hybrid renewable energy systems specific to their data centre requirements.
The paper also provides a new economic metric for evaluating off-grid hybrid renewable energy systems, the levelized cost of energy utilised (LCOEu). This metric gives a true representation of a data centre’s cost of energy when supplied from an off-grid hybrid renewable energy system.

Author Contributions

Conceptualization, W.R. and M.T.; methodology, W.R. and M.T.; validation, A.U.; formal analysis, W.R.; investigation, W.R.; writing—original draft preparation, W.R.; writing—review and editing, M.T. and A.U.; supervision, M.T. and A.U. All authors have read and agreed to the published version of the manuscript.

Funding

This research received no external funding.

Data Availability Statement

The raw data supporting the conclusions of this article will be made available by the authors on request.

Conflicts of Interest

The authors declare no conflicts of interest.

References

  1. McKinsey Company. AI Power: Expanding Data Center Capacity to Meet Growing Demand. Available online: https://www.mckinsey.com/industries/technology-media-and-telecommunications/our-insights/ai-power-expanding-data-center-capacity-to-meet-growing-demand#/ (accessed on 9 December 2024).
  2. International Energy Agency. Electricity 2024 Analysis and Forecast to 2026. 2024. Available online: https://www.iea.org/-reports/electricity-2024 (accessed on 25 November 2024).
  3. National Grid. Data Centres What Are Data Centres and How Will They Influence the Future Energy System? 2022. Available online: https://www.neso.energy/document/246446/download (accessed on 25 November 2024).
  4. Andrae, A.S.G.; Edler, T. On Global Electricity Usage of Communication Technology: Trends to 2030. Challenges 2015, 6, 117–157. [Google Scholar] [CrossRef]
  5. Google. Environmental Report 2023. 2023. Available online: https://sustainability.google/reports/google-2023-environmental-report/ (accessed on 25 November 2024).
  6. Microsoft. Environmental Data Fact Sheet 2024. 2024. Available online: https://www.microsoft.com/en-us/corporate-responsibility/sustainability/report (accessed on 25 November 2024).
  7. Amazon. 2023 Amazon Sustainability Report. 2023. Available online: https://sustainability.aboutamazon.com/2023-report (accessed on 25 November 2024).
  8. International Energy Agency. Renewables 2023 Analysis and Forecast to 2028. 2024. Available online: https://www.iea.org/reports/renewables-2023 (accessed on 25 November 2024).
  9. CBRE. Global Data Center Trends 2023. 2023. Available online: https://www.cbre.com/insights/reports/global-data-center-trends-2023 (accessed on 25 November 2024).
  10. CBRE. Europe Data Centres. 2023. Available online: https://www.cbre.com/insights/reports/european-data-centres-overview (accessed on 25 November 2024).
  11. Zhou, W.; Lou, C.; Li, Z.; Lu, L.; Yang, H. Current Status of Research on Optimum Sizing of Stand-Alone Hy-brid Solar–Wind Power Generation Systems. Appl. Energy 2010, 87, 380–389. [Google Scholar] [CrossRef]
  12. Iverson, Z.; Achuthan, A.; Marzocca, P.; Aidun, D. Optimal Design of Hybrid Renewable Energy Systems (HRES) Using Hydrogen Storage Technology for Data Center Applications. Renew. Energy 2013, 52, 79–87. [Google Scholar] [CrossRef]
  13. Lian, J.; Zhang, Y.; Ma, C.; Yang, Y.; Chaima, E. A Review on Recent Sizing Methodologies of Hybrid Renew-able Energy Systems. Energy Convers. Manag. 2019, 199, 112027. [Google Scholar] [CrossRef]
  14. Shehabi, A.; Smith, S.; Sartor, D.; Brown, R.; Herrlin, M.; Koomey, J.; Masanet, E.; Horner, N.; Azevedo, I.; Lintner, W. United States Data Center Energy Usage Report; Lawrence Berkeley Laboratory: Berkeley, CA, USA, 2016. [Google Scholar]
  15. Ofgem. RIIO-ED2 Cost Benefit Analysis (CBA) Guidance. 2021. Available online: https://www.ofgem.gov.uk/sites/default/files/2021-10/RIIO-ED2%20Cost%20Benefit%20Analysis%20Guidance.pdf (accessed on 25 November 2024).
  16. Rostirolla, G.; Grange, L.; Minh-Thuyen, T.; Stolf, P.; Pierson, J.-M.; Da Costa, G.; Baudic, G.; Haddad, M.; Kassab, A.; Nicod, J.-M. A Survey of Challenges and Solutions for the Integration of Renewable Energy in Datacenters. Renew. Sustain. Energy Rev. 2022, 155, 111787. [Google Scholar] [CrossRef]
  17. Haddad, M.; Da Costa, G.; Nicod, J.-M.; Péra, M.-C.; Pierson, J.-M.; Rehn-Sonigo, V.; Stolf, P.; Varnier, C. Combined It and Power Supply Infrastructure Sizing for Standalone Green Data Centers. Sustain. Comput. Inform. Syst. 2021, 30, 100505. [Google Scholar] [CrossRef]
  18. Clúa, J.G.G.; Mantz, R.J.; De Battista, H. Optimal Sizing of a Grid-Assisted Wind-Hydrogen System. Energy Convers. Manag. 2018, 166, 402–408. [Google Scholar] [CrossRef]
  19. Microsoft. 2022 Environmental Sustainability Report. 2022. Available online: https://news.microsoft.com/wp-content/uploads/prod/sites/42/2023/05/2022-Environmental-Sustainability-Report.pdf (accessed on 25 November 2024).
  20. Schellong, W.; Weimbs, M. Site Planning and Optimizing of Wind Farms. In Proceedings of the IASTED International Conference on Environmental Management and Engineering, Banff, AB, Canada, 6–8 July 2009; pp. 144–149. [Google Scholar]
  21. Meyers, J.; Meneveau, C. Optimal Turbine Spacing in Fully Developed Wind Farm Boundary Layers. Wind. Energy 2012, 15, 305–317. [Google Scholar] [CrossRef]
  22. Savills. Global Farmland Index. 2022. Available online: https://en.savills.de/research_articles/259694/304987-0 (accessed on 25 November 2024).
  23. Knight Frank. The Rural Report-2023-24. 2024. Available online: https://www.knightfrank.com/research/report-library/the-rural-report-2023-24-10303.aspx (accessed on 25 November 2024).
  24. European Union. Agricultural Land Prices by Region. Available online: https://ec.europa.eu/eurostat/databrowser/view/a-pri_lprc/default/table?lang=en&category=agr.apri.apri_lpr (accessed on 6 April 2024).
  25. NREL. 2022 Cost of Wind Energy Review. 2023. Available online: https://research-hub.nrel.gov/en/publications/2022-cost-of-wind-energy-review (accessed on 25 November 2024).
  26. UK Gov WSP. Onshore Wind and Solar PV Costs Review. 2020. Available online: https://www.gov.uk/government/publications/review-of-power-generation-costs-for-technologies-eligible-for-contracts-for-difference (accessed on 25 November 2024).
  27. Ramasamy, V.; Zuboy, J.; Woodhouse, M.; O’Shaughnessy, E.; Feldman, D.; Desai, J.; Walker, A.; Margolis, R.; Basore, P.U.S. Solar Photovoltaic System and Energy Storage Cost Benchmarks, with Minimum Sustainable Price Analysis: Q1 2023. 2023. Available online: https://www.nrel.gov/docs/fy23osti/87303.pdf (accessed on 25 November 2024).
  28. NREL. Utility-Scale Battery Storage. Available online: https://atb.nrel.gov/electricity/2022/utility-scale_battery_storage (accessed on 6 April 2024).
  29. Augustine, C.; Blair, N. Storage Futures Study Storage Technology Modeling Input Data Report. Available online: https://www.nrel.gov/docs/fy21osti/78694.pdf (accessed on 25 November 2024).
  30. Department for Energy Security and Net Zero. Combined Heat and Power–Finance. 2021. Available online: https://www.gov.uk/government/collections/combined-heat-and-power-chp-developers-guides (accessed on 25 November 2024).
  31. Department for Energy Security and Net Zero. Electricity Generation Costs 2023. 2023. Available online: https://www.gov.uk/government/publications/electricity-generation-costs-2023 (accessed on 25 November 2024).
  32. Morten, L.T.; Marta, I.M.; Lasse, S.; Thorkild, G.S. Memo: SARAH-3-Surface Solar Irradiation Data–Performance and Ac-curacy for Your Solar-PV Calculation. 2024. Available online: https://help.emd.dk/mediawiki/images/c/cf/20240222_SARAH3_Evaluation.pdf (accessed on 25 November 2024).
  33. Gräf, D.; Marschewski, J.; Ibing, L.; Huckebrink, D.; Fiebrandt, M.; Hanau, G.; Bertsch, V. What Drives Ca-pacity Degradation in Utility-Scale Battery Energy Storage Systems? The Impact of Operating Strategy and Temperature in Different Grid Applications. J. Energy Storage 2022, 47, 103533. [Google Scholar] [CrossRef]
  34. Wind Europe. Wind Energy in Europe 2023 Statistics and the Outlook for 2024–2030. 2023. Available online: https://windeurope.org/intelligence-platform/product/wind-energy-in-europe-2023-statistics-and-the-outlook-for-2024-2030/ (accessed on 25 November 2024).
  35. Savills. European Data Centres Navigating the New Data-Centric Frontiers. Available online: https://pdf.euro.savills.co.uk/european/european-commercial-markets/spotlight-eu-data-centre---may-2024---final.pdf (accessed on 12 December 2024).
  36. UK Department for Energy Security and Net Zero. Statistical Data Set International Industrial Energy Prices. Available online: https://www.gov.uk/government/statistical-data-sets/international-industrial-energy-prices (accessed on 1 June 2024).
  37. Pexapark. PPA Times Monthly PPA News Digest. 2024. Available online: https://pexapark.com/pexaquote-freemium/ (accessed on 25 November 2024).
  38. LevelTen Energy. EUROPE Q1 2024 PPA Price Index Executive Summary. 2024. Available online: https://www.leveltenenergy.com/post/q1-2024-ppa-price-index-europe (accessed on 25 November 2024).
  39. Smoucha, E.A.; Fitzpatrick, K.; Buckingham, S.; Knox, O.G.G. Life Cycle Analysis of the Embodied Carbon Emissions from 14 Wind Turbines with Rated Powers Between 50 Kw and 3.4 Mw. J. Fundam. Renew. Energy Appl. 2016, 6, 1000211. [Google Scholar] [CrossRef]
  40. International Energy Agency. Solar PV Manufacturing Emissions Intensity and Payback Period. Available online: https://www.iea.org/data-and-statistics/charts/solar-pv-manufacturing-emissions-intensity-and-payback-period (accessed on 7 May 2024).
  41. Iris, C.; Yang, S.-H.; David, K. How Much CO2 Is Emitted by Manufacturing Batteries? 2022. Available online: https://climate.mit.edu/ask-mit/how-much-co2-emitted-manufacturing-batteries (accessed on 7 May 2024).
  42. UK: Department for Energy Security and Net Zero. Greenhouse Gas Reporting: Conversion Factors 2023. Available online: https://www.gov.uk/government/publications/greenhouse-gas-reporting-conversion-factors-2023 (accessed on 7 May 2024).
  43. Electricity Maps. Available online: https://app.electricitymaps.com/map (accessed on 29 May 2024).
Figure 1. Wind farm configuration area.
Energies 18 00382 g001
Figure 2. WindPRO wind farm optimiser output layout.
Energies 18 00382 g002
Figure 3. Industrial electricity prices [36].
Energies 18 00382 g003
Figure 4. Gas Generation Only Scheme LCOE (Historic and Present).
Energies 18 00382 g004
Figure 5. Wind energy production sensitivity analysis for LCOE.
Energies 18 00382 g005
Figure 6. Wind energy production sensitivity analysis for emissions.
Energies 18 00382 g006
Table 1. European land price data.
LocationLand Price (GBP/Hectare)ReferenceYear
Frankfurt 129,000[22]2020
Southwest England22,000[23]2022
Amsterdam73,000[24]2022
Paris6600[24]2022
Dublin32,600[24]2022
1 Scaled to reflect 2022 prices.
Table 2. Technology costs.
TechnologyCAPEXOPEXReferencesYear 5
Wind 11400 GBP/kW35 GBP/kW/year[25]2022
Solar 2615 GBP/kW15 GBP/kW/year[26,27]2020 and 2023
Battery 3950 GBP/kW
170 GBP/kWh
10 GBP/kW/year
1 GBP/kWh/year
[28,29]2021 and 2020
Reciprocating Gas (Dual Fuel) 4800 GBP/kW0.7 GBP/kW/year[30]2021
1 Wind turbine cost is based on a land-based utility-scale 3.3 MW turbine. 2 Solar (PV) cost is based on an NREL 100 MWdc utility-scale system and guidance from the UK Department for Business, Energy and Industrial Strategy. 3 Battery cost is split between GBP/kW and GBP/kWh to account for the power rating and energy rating of the battery storage system (i.e., inverter costs and battery costs), this is required for the WindPRO model. Battery system CAPEX cost is based on a 60 MW 10 h system. Battery System OPEX cost is based on a 4 h Lithium-ion battery system. 4 Reciprocating gas cost is based on a 10 MW system. 5 Year of reference publication.
Table 3. Wind Turbine Models.
TurbineRated Power (kW)Hub Height (m)LCOE (GBP/MWh)
VESTAS V172-7.21720015023
GAMESA G132500013240
ENERCON E-147 EP5 E2500014728
GE WIND ENERGY GE 2.5-120250012025
Repower 57/100010005736
Table 4. Comparison of wind farm spacing layouts.
Turbine DetailsDescriptionAEP (MWh/yr)Wake Losses (%)LCOE (20 Years) GBP/MWh
Siemens Gamesa SG 5.0-132 MkII (5000 kW)
Rotor Diameter = 132 m
Hub Height = 84 m
20 × (7D × 4D)—PARK GASP281,6408.640.8
20 × (14D × 8D)—PARK GASP293,8283.048.5
30 × (smart fit)—GASP418,95011.240.0
GE Wind Energy GE 2.5-100 (2500 kW)
Rotor Diameter = 100 m
Hub Height = 100 m
20 × (7D × 4D)—PARK GASP173,5678.733.5
20 × (14D × 8D)—PARK GASP188,2692.939.4
30 × (smart fit)—GASP455,82310.932.7
Repower 57/1000 (1000 kW)
Rotor Diameter = 57 m
Hub Height = 100 m
20 × (7D × 4D)—PARK GASP54,7148.541.9
20 × (14D × 8D)—PARK GASP59,6762.848.3
60 × (smart fit)—GSAP173,1827.736.1
Note that as Meyers and Meneveau do give a recommendation for the minor axis spacing of the turbine it is assumed proportional to that of the traditional 7D × 4D giving 15D × 8.57D. For ease of scaling in WindPRO 14D × 8D is used.
Table 5. Energy mix of each optimised hybrid renewable energy system.
LocationWind (%)Solar (%)Battery (%)Gas (%)
Frankfurt32.130.018.319.6
Southwest England37.329.918.814.0
Amsterdam50.024.412.912.7
Paris53.226.012.88.0
Dublin49.624.915.69.9
Table 6. Installed capacity of each technology.
LocationWind (MW)Solar (MW)Battery (MW 1)Gas (MW)
Frankfurt10215740.550
Southwest England10419452.550
Amsterdam12213259.750
Paris17210951.350
Dublin7314660.750
1 Each battery system is rated for 10 h day 1.
Table 7. Solar and wind generation and capacity factors for each hybrid renewable energy system.
LocationSolar (MWh/year) Solar Capacity Factor (%) Wind (MWh/year) Wind Capacity Factor (%)
Frankfurt221,02116%213,81024
Southwest England228,26913%286,39831
Amsterdam135,45512%411,42439
Paris149,42316%571,75738
Dublin323,21912%323,21950
Table 8. Land requirements and cost for each hybrid renewable energy system.
LocationSolar Area Required (ha)Wind Area Required (ha)Total Area Required (ha)Land Cost (GBP M)
Frankfurt21720342112.2
Southwest England35518153611.8
Amsterdam6413019514.2
Paris1504786284.1
Dublin711021735.6
The amount of land required at each site for solar is different per unit of power due to each site having different row spaces which have been optimised for LCOE. If land area is limited at a given site this row spacing could be reduced to increase the power per unit of land, this would increase the solar LCOE but could give the site the potential to be a hybrid renewable energy system location. It is also assumed that solar and wind cannot occupy the same land.
Table 9. LCOE, LCOEu & LCOEs,w of each hybrid renewable energy system.
LocationLCOE (GBP/MWh)LCOEu (GBP/MWh)LCOEs,w (GBP/MWh)
Frankfurt738742
Southwest England7810238
Amsterdam628637
Paris467728
Dublin597029
Table 10. CAPEX and OPEX of each hybrid renewable energy system.
LocationCAPEX (GBPM)1 OPEX (GBPM/35-yr)TOTAL (GBPM/35-yr)
Frankfurt469.5350.9820.3
Southwest England499.2460.1959.3
Amsterdam529.5277.6807.1
Paris515.7224.7740.4
Dublin422.5235.6658.1
1 Interest rate set to 3%.
Table 11. The 35-year cost of energy from the grid assuming energy prices as of 2023.
Location1 Grid Energy Costs (GBPM/35-yr)
Frankfurt1398.5
Southwest England2168.8
Amsterdam2119.8
Paris1028.4
Dublin1649.9
1 Interest rate set to 3%.
Table 12. PPA LCOE.
Table 12. PPA LCOE.
PPA MethodLCOE (GBP/MWh)Reference
Private Wire40[37]
Sleeved/Virtual70[38]
Table 13. Emissions associated with each hybrid renewable energy system.
LocationConstruction Emissions (tCO2eq)Operational Emissions (MtCO2eq/year)35 Year Emissions (MtCO2eq)Energy Production (MWh/year)Carbon Intensity (tCO2eq/MWh)
Frankfurt1160.0391.357520,9610.074
Southwest England1460.4360.968576,1270.048
Amsterdam2030.3960.880602,7450.042
Paris1440.2500.555756,3850.021
Dublin2310.3070.682517,2130.038
Table 14. Emissions associated with each data centre if the energy was delivered by its associated grid.
LocationLocal Grid Emissions (t/CO2eq/MWh)35 Year Local Grid Emissions Equivalent (MtCO2eq)35 Year Emissions Reduction with Hybrid Renewable Energy System (MtCO2eq)Emissions Reduction with Hybrid Renewable Energy System (%)
Frankfurt0.4006.1324.77578
Southwest England0.2003.0662.09868
Amsterdam0.2834.3383.45880
Paris0.0530.8120.25832
Dublin0.3715.6875.00688
Table 15. Emissions associated with each data centre if the energy was delivered by its gas-only solution.
LocationGas Ony Emissions (MtCO2eq/year) 35-Year Gas Ony Emissions (MtCO2eq) 35-Year Emissions Reduction with Hybrid Renewable Energy System (MtCO2eq)Emissions Reduction from Hybrid Renewable Energy System (%)
Frankfurt0.1976.8995.54280
Southwest England0.1976.8995.93086
Amsterdam0.1976.8996.01887
Paris0.1976.8996.34492
Dublin0.1976.8996.21790
Table 16. Carbon-free energy comparison.
LocationHybrid Renewable Energy System CFE (%)Grid CFE 2022 (%)Google CFE (%)
Frankfurt805696
Southwest England865885
Amsterdam874257
Paris928787
Dublin903939
Disclaimer/Publisher’s Note: The statements, opinions and data contained in all publications are solely those of the individual author(s) and contributor(s) and not of MDPI and/or the editor(s). MDPI and/or the editor(s) disclaim responsibility for any injury to people or property resulting from any ideas, methods, instructions or products referred to in the content.

