Article

Investigation of the Structural Characteristics of the Gas Diffusion Layer Using Micro-X-Ray Computed Tomography

1
School of Electrical Engineering, Tongling University, Tongling 244061, China
2
College of Materials Science and Engineering, Tongji University, Shanghai 201804, China
3
School of Automotive Studies, Tongji University, Shanghai 201804, China
*
Author to whom correspondence should be addressed.
Energies 2025, 18(2), 381; https://doi.org/10.3390/en18020381
Submission received: 24 December 2024 / Revised: 13 January 2025 / Accepted: 15 January 2025 / Published: 17 January 2025
(This article belongs to the Section A5: Hydrogen Energy)

Abstract

:
Due to its low stiffness, the gas diffusion layer (GDL) exhibits significant deformation under a compression service condition, thereby exerting a nonlinear and strong coupling influence on fuel cells’ performance. Therefore, it is of great practical significance to study the structural characteristics evolution of GDLs. The microstructure of the GDLs was obtained using micro-X-ray computed tomography in this study, and their structural properties were analyzed comprehensively and quantitatively. The morphology of GDLs exhibited significant variations across manufacturers due to disparities in the materials and manufacturing processes. The distribution of the pore equivalent diameter and sphericity in GDLs conformed to a normal distribution, with irregular shapes. The fiber length distribution in the unit followed a Gamma distribution, showing a random and uneven distribution in the XY plane. When compressed, the average fiber length was reduced, and a substantial increase in isolated pores was observed. However, the quantity of long fibers and connected and isolated pores decreased after acidification treatment.

1. Introduction

Hydrogen energy plays an indispensable role in the establishment of a novel energy system [1]. The proton exchange membrane fuel cell (PEMFC), serving as a hydrogen energy utilization device, finds extensive applications in distributed power generation and transportation [2]. The gas diffusion layer (GDL) employed in a PEMFC plays a pivotal role in facilitating the transport of mass, heat, and electricity [3]. The impact of a compressed GDL on fuel cell performance and durability exhibits characteristics that are nonlinear, multi-parameter, with little variation, and strongly coupled [4]. Therefore, analyzing the microstructure of the GDL is instrumental in enhancing the performance and reliability of fuel cells.
Due to its excellent mechanical properties, electrochemical stability, and cost-effectiveness in manufacturing, carbon fiber paper has emerged as a prominent form of GDL [5]. Currently, the investigation of GDL microstructure characteristics’ impact on fuel cell performance primarily relies on stochastic reconfiguration methods [6]. Despite its advantages of flexibility, controllability, and low cost, the microstructure of a GDL is highly complex due to the disordered distribution of carbon fibers and random aggregation of resins near the fibers. This complexity poses a challenge in achieving a fully realistic representation of the GDL microstructure. The integration of pore-scale modeling and tomography offers a solution to bridge this gap, enabling the visualization of internal structures in porous materials at micrometer resolution through three-dimensional micro X-ray computed tomography (3D-μXCT) [7,8,9]. Khajeh et al. [10] studied the effects of PTFE treatment and compression on the microstructure of TGP-H-120, and obtained the function of the PTFE load and pressure on the porosity of GDL. Becker et al. [11] analyzed the diffusion coefficient, permeability, resistivity, and other physical property parameters of GDLs with different porosity. Wargo et al. [12] studied the effects of microporous layers on the porosity, curvature, and permeability of the GDL. Odaya et al. [13] reconstructed the 3D microstructure of GDLs and analyzed the aperture distribution of several typical commercial GDLs, and found that GDL porosity and average pore size are closely related to its manufacturing and processing technology. Totzke et al. [14] studied the morphology of paper-type GDLs under compression and calculated parameters such as porosity, aperture distribution, and curvature. These parameters change obviously during compression, which directly affects the transport of gas and generated water in PEMFC. The intrusion of the GDL into the flow channel was also observed. Holzer et al. [15] and Atkinson et al. [16] reconstructed the microstructure of the GDL under different compression ratios and established the relationship between the microstructure characteristics and the macroscopic physical properties. Kulkarni et al. [17] studied the nonuniform deformation of the membrane electrode under two different flow fields and found that nonuniform compression may lead to partial blockage in the flow field and proton film deflection. Meyer et al. [18] studied the effect of the hot pressing temperature on the microstructure and interface of MEA, and investigated the effect of the crack size. Pfrang et al. [19] studied the changes of the membrane electrode morphology before and after cycling using micro-CT, and found that micro-cracks existed in the catalytic layer during sample preparation, and the crack density did not increase after cycling, indicating that micro-cracks in the catalytic layer were not the main cause of PEMFC attenuation.
Despite extensive micro-CT investigations on the GDL by previous researchers, a comprehensive characterization of its structural features, especially its post-decline changes, is still lacking. The 3D-μXCT technique (NanoVoxel-3000, Sanying Precision Instruments, Tianjin, China) was employed in this manuscript to reconstruct the three-dimensional microstructures of the GDL. This facilitated a comprehensive and quantitative analysis of the bulk and pore structural characteristics, enabling a comparison of the microstructural disparities between the pre- and post-degradation periods. The relevant resolved parameters are depicted in Figure 1. These investigations establish a robust foundation for the analysis of the support, mass transfer, and electro-thermal characteristics of the GDL, as well as the exploration of its degradation mechanism.

2. Experiment

2.1. Materials

The commercial GDLs, namely, TGP-H-060 (Toray, Tokyo, Japan), H14CX483 (Freudenberg, Weinheim, Germany) and SGL28BC (SGL, Wiesbaden, Germany), were subjected to mechanical compression, acidification, and durability testing, respectively. The degraded GDL samples from the commercial products are denoted as TGP-H-060-M, H14CX483-J, and SGL 28BC-A, correspondingly. The thickness of TGP-H-060 was 162 μm and the volume fraction of TGP-H-060 was 25.83% after compression at 6.0 MPa. H14CX483 was derived from the samples of real vehicle durability test. The SGL28BC sample was subjected to 1800 h of acidification using a solution containing 0.05 M sulfuric acid and 2.9 × 10⁻² mol·L−1 hydrogen peroxide.

2.2. Image Processing

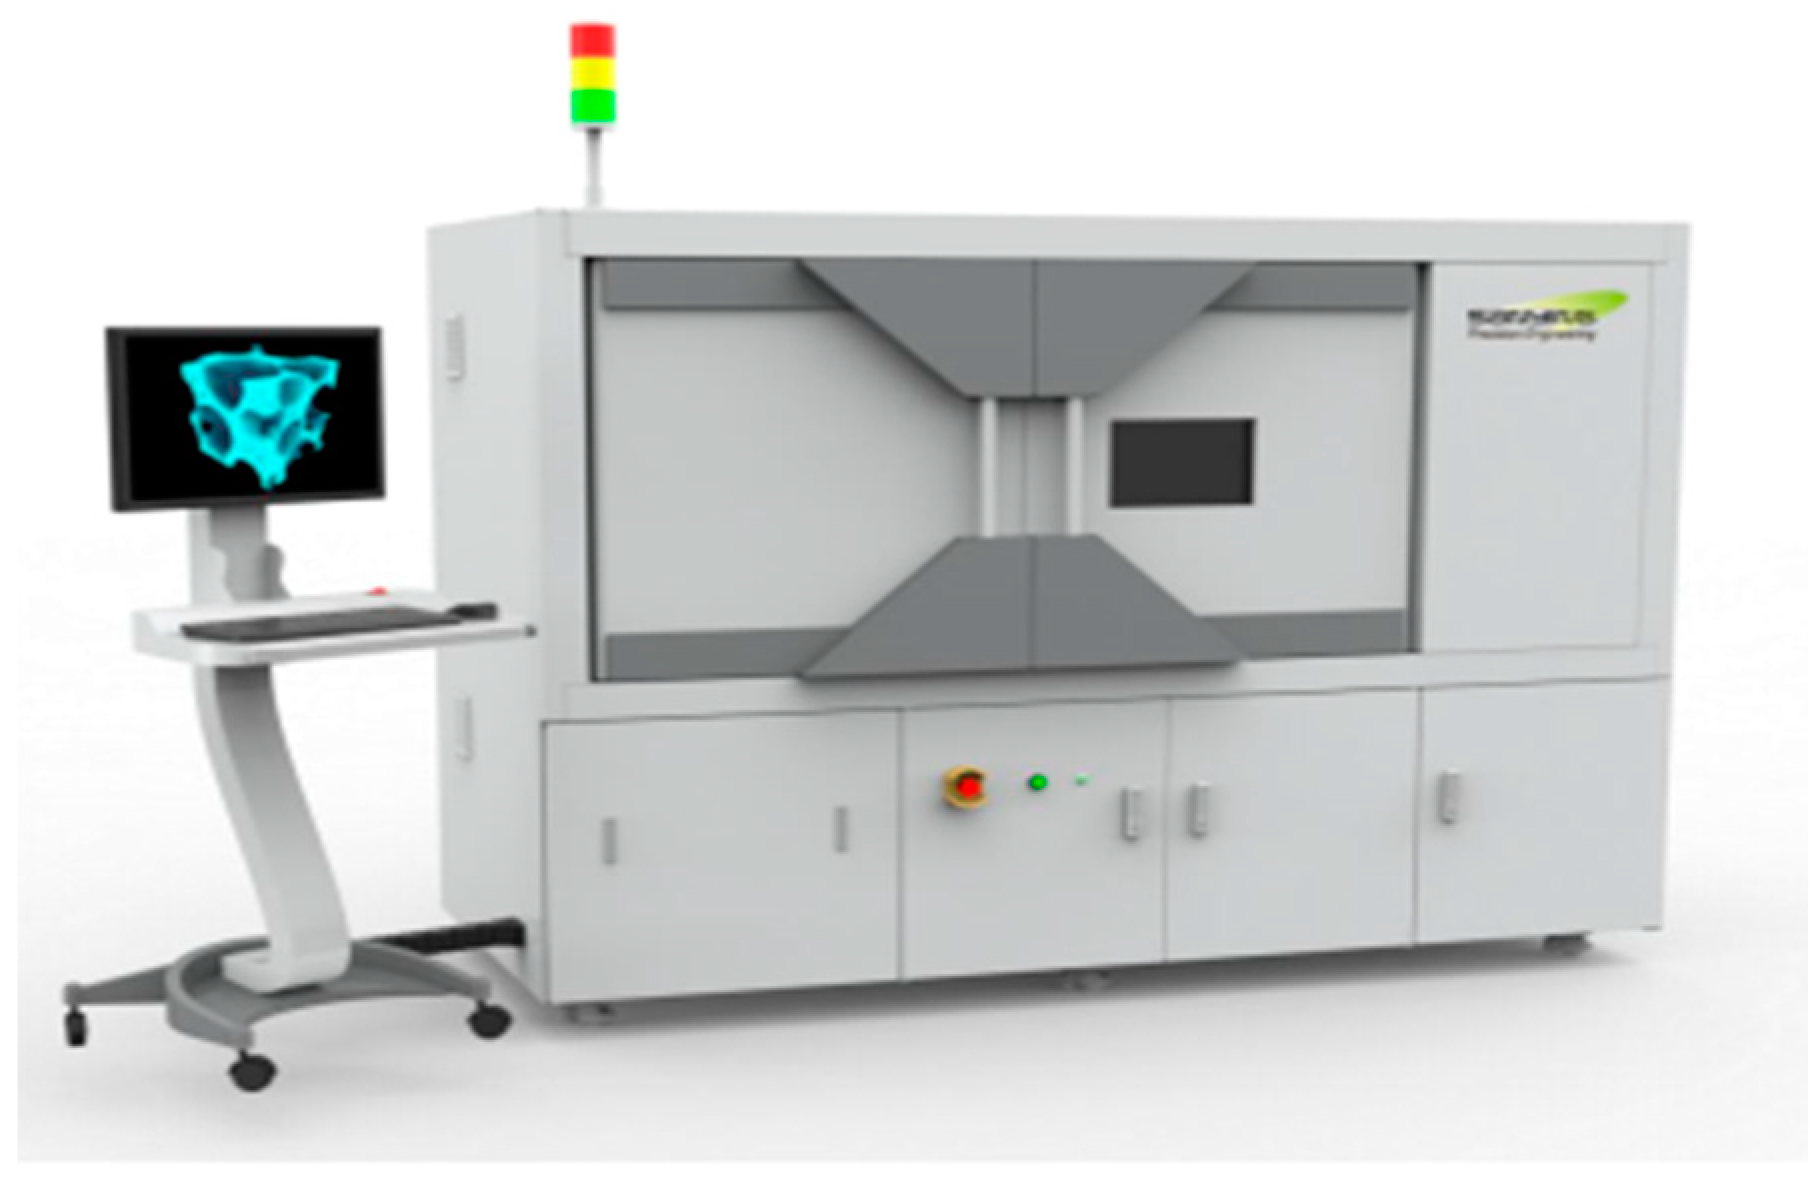
3D-μXCT is a high-resolution imaging technique that utilizes the penetration of X-rays to obtain the morphology of a sample without damaging it. The device and principle of 3D-μXCT are shown in Figure 2, which consists of X-ray source, sample table, and detector [10]. The sample table is rotated to obtain a series of CT cross-section images. Substances are distinguished based on the varying attenuation of the rays’ intensity as they penetrate different materials, attributed to the low density of carbon fibers. The smaller pixel values correspond to the pores, which manifest as regions of lower intensity, whereas the bulk phase exhibits higher density and appears as a brighter region in the image. The image reconstruction algorithm is utilized to determine an optimal threshold value, which in turn enables the segmentation of the sample microstructure. Detailed principles and image processing methods of 3D-μXCT are described in Refs. [10,12,20].
The Thermo Scientific Avizo software 9 system is characterized by its modular and object-oriented design, with modules and data objects serving as the fundamental components [21]. Modules are utilized for visualizing data objects or conducting computational operations on them, while components are represented by little icons and connected by lines indicating processing dependencies between the components. The creation of modules from data objects of specific types occurs automatically when reading file input data or as the output of module computations. Instances of particular module types are generated through a context-sensitive pop-up menu, based on the matching existing data object.
The representation of material structures can be achieved through image pixels, geometry, or grids that are suitable for numerical simulation. Avizo software facilitates comprehensive exploration of the structural characteristics of porous materials, encompassing intuitive visualization and measurement, as well as advanced image processing and analysis techniques. As depicted in Figure 3, the process of GDL image analysis encompasses image processing and quantitative analysis. After undergoing filtration and other preprocessing techniques, the initial dataset is partitioned into two distinct components: the bulk phase and pore space of the GDL, achieved through threshold segmentation. The pore space is partitioned into discrete pores by separate modules, and the morphological characteristics are analyzed using the Label Analysis module. The bulk phase is analyzed using the Cylinder Correlation and Trace Correlation Line modules.
X-ray computed tomography (NanoVoxel-3000, Sanying, Tianjin, China) was used to obtain the microstructure of the GDL. Figure 4 shows the reconstruction processing step of the TGP-H-060. The sample was imaged using an applied energy of 50 keV and a current of 40 μA. The resolution of the detector optics and the field of view are crucial factors for achieving high-resolution imaging. In order to obtain high-quality images, the original sample size was set to 1.0 × 1.0 mm, with a spatial resolution of 0.55 μm. For reconstruction purposes, a central view measuring 550 × 550 × 190 μm was selected. Images obtained from X-ray computed tomography are in 16-bit grayscale and range from 0 to 65,536. Figure 4b depicts a cross-sectional view of the GDL, with the elongated red region representing the carbon fibers and the colored area adhered to their surface signifying the carbonized resin. The fibers are randomly dispersed within the XY plane, while the binders exhibit a distribution pattern in fiber-aggregated regions characterized by random shapes and compositions. The AVIZO software employs a filter and noise reduction algorithm to enhance the quality of the image. Finally, a threshold value was determined by quantifying the volume fraction of the GDL in various regions and comparing it with theoretical values. A visualization of the GDL microstructure is shown in Figure 4c.

3. Result and Discussion

3.1. Morphology

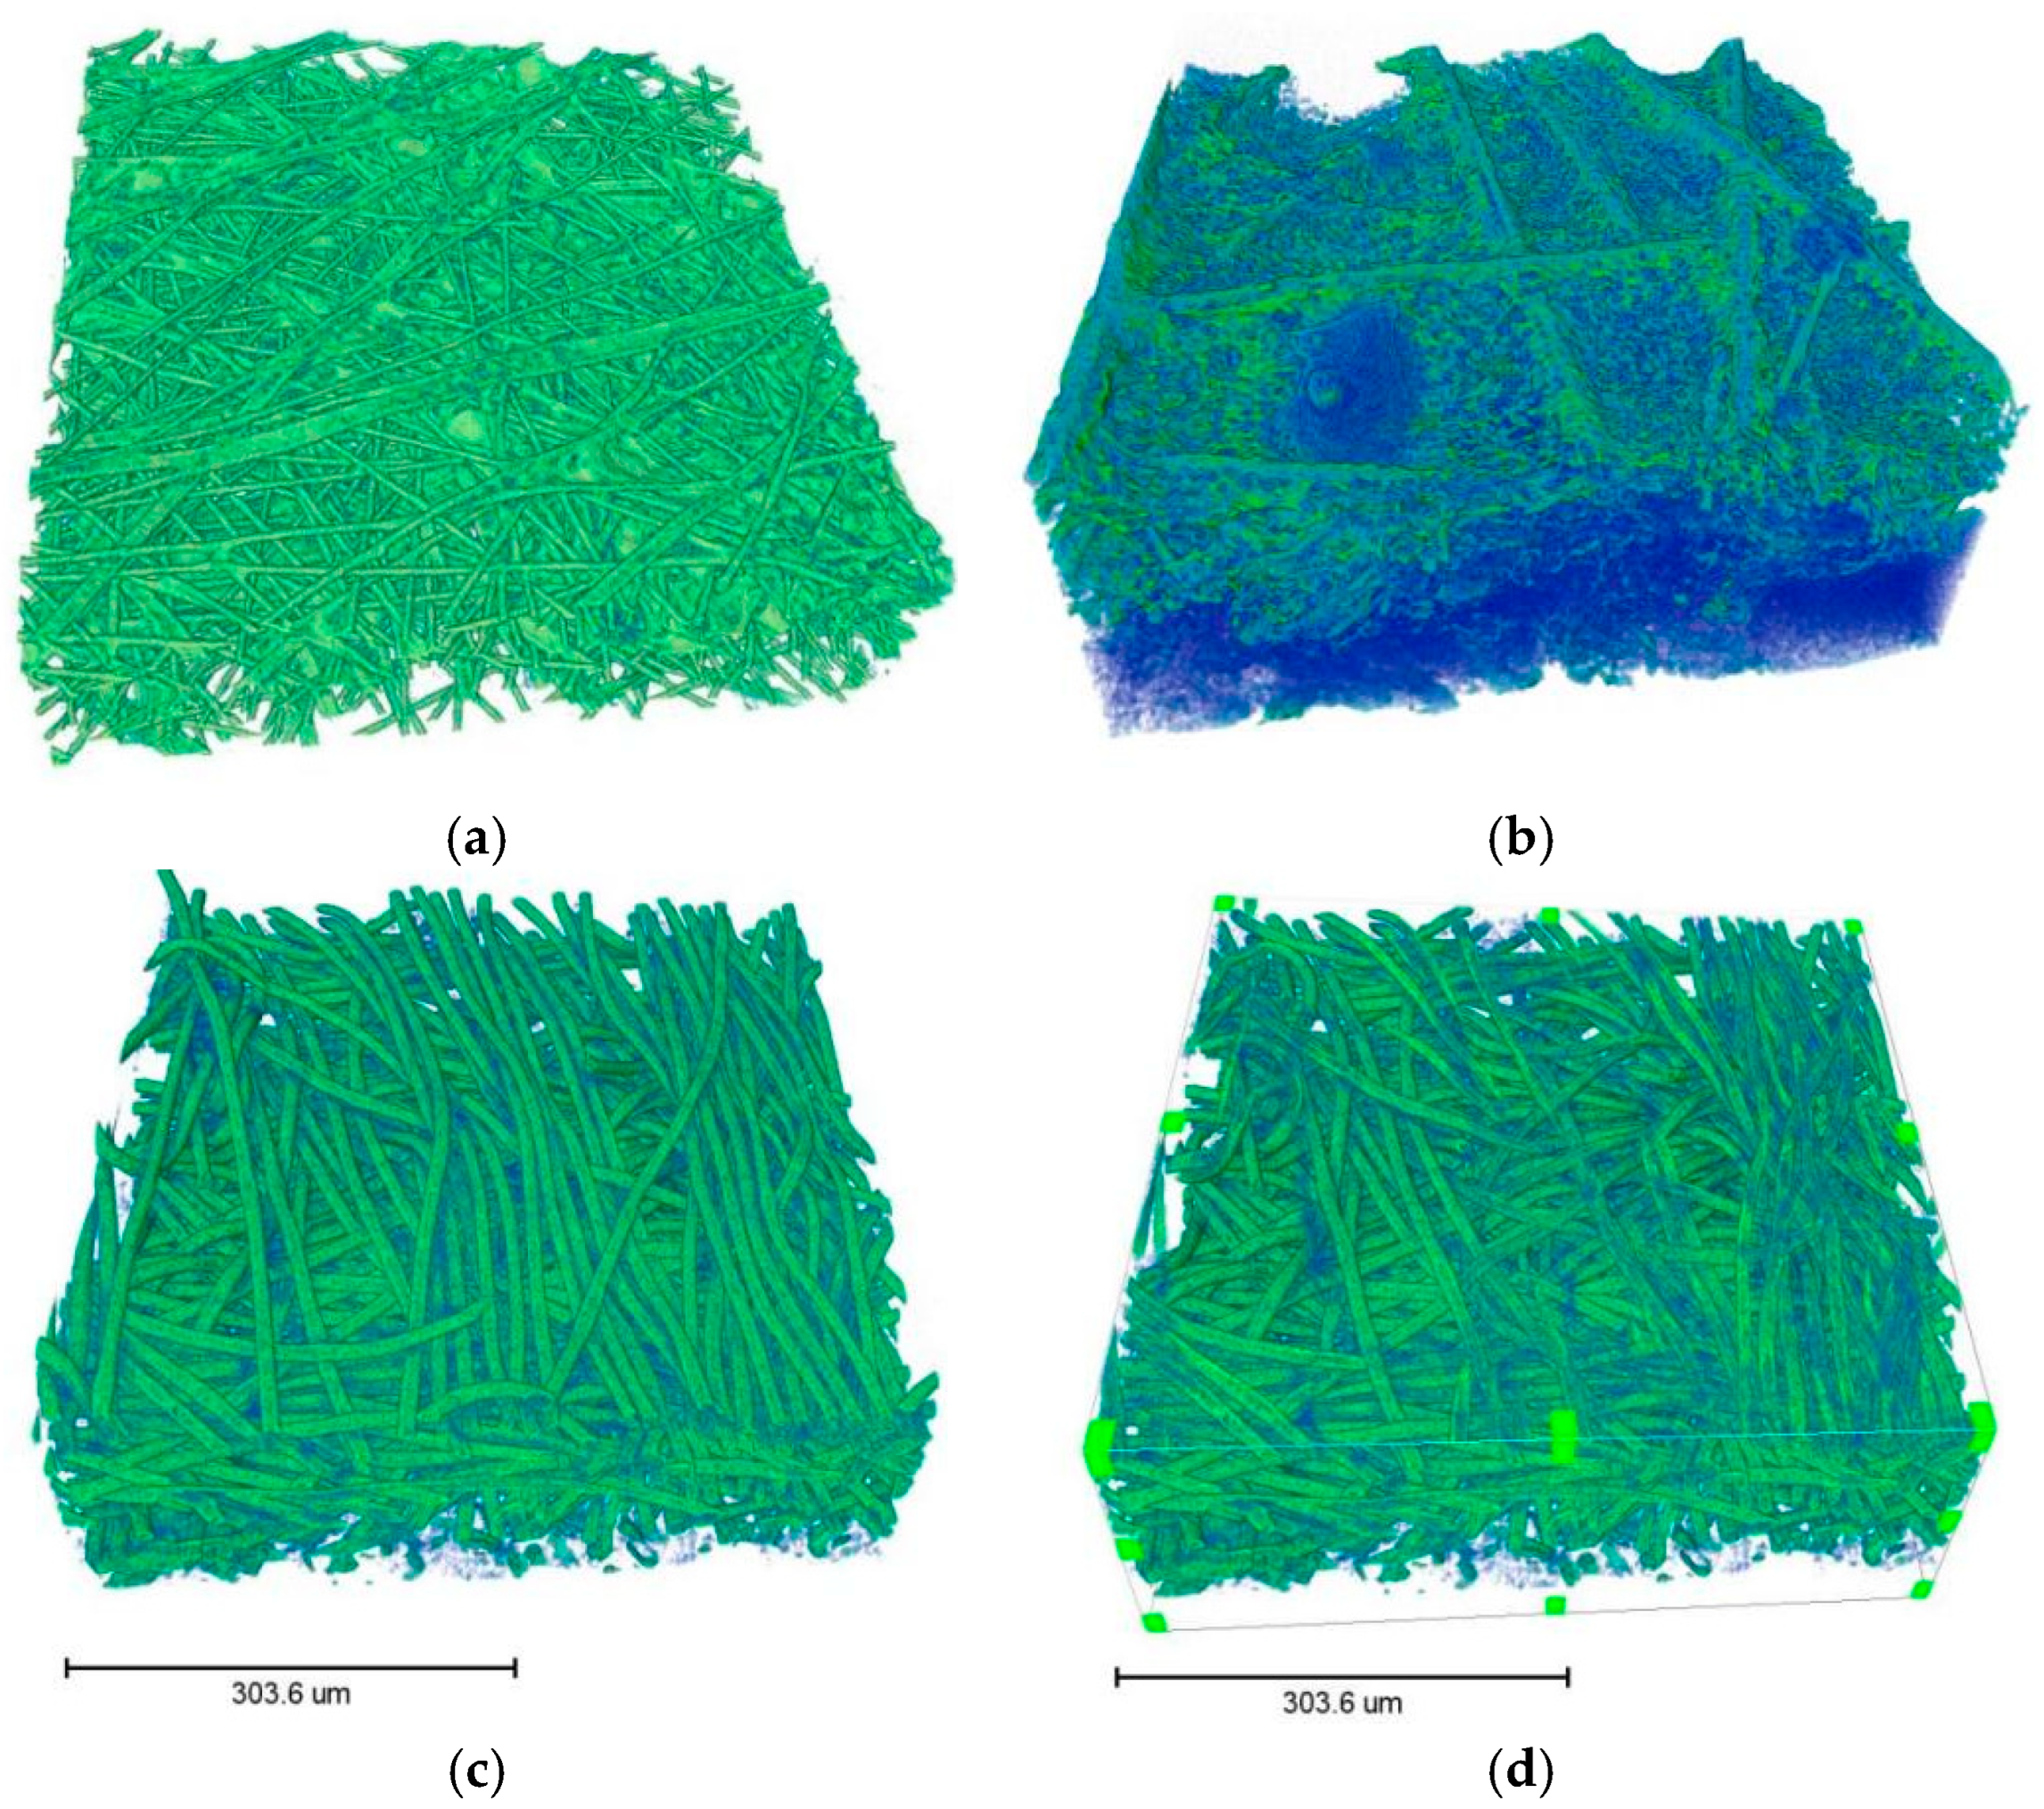
The 3D-μXCT technique enabled the clear differentiation of the pores, fibers, and carbonized resins present in commercial GDLs. As depicted in Figure 5, the morphology of the GDL exhibits significant variations across manufacturers due to disparities in materials and manufacturing processes. The carbon fibers in TGP-H-060 exhibit a straight and uniform distribution within the layers. In contrast, SGL28BC displays a lower fiber density within the layer and contains a higher proportion of carbon particle fillers. On the other hand, H14CX483 demonstrates an oriented fiber distribution with approximately 50 μm thickness on the bipolar plate side, while exhibiting a disordered curved distribution of fibers in the middle layer.

3.2. Volume Fraction

The gray map of TGP-H-060 was segmented using a threshold, with the bulk phase ranging from 10,000 to 65,535. Units of various sizes were selected from different locations within the sample, and, subsequently, the volume fractions were computed. As depicted in Figure 6a, the volume fraction in Region-A is observed to be relatively small, while Region-D exhibits a significant increase, indicating the presence of a localized aggregation within the volumetric phase. As shown in Figure 6b, the relative error between the volume fraction and its theoretical value exceeds 10% when the unit size is less than 330 μm, which fails to meet the criteria for representative unit selection [22]. The aforementioned conclusion aligns with the findings of Ref. [18], which suggest that the in-plane area of the GDL should not be less than 0.1 mm2. When the unit side length was 550 μm, the GDL volume fractions at different locations were 0.201, 0.219, 0.214, and 0.224 respectively. The average volume fraction was calculated to be approximately 0.214, which closely aligns with the theoretical value [23], resulting in a minimal relative error of only 3.4%.
As displayed in Figure 6c, the in-plane distribution of the GDL volume fraction is non-uniform, suggesting a localized aggregation of carbon fibers. The volume fraction of TGP-H-060 in the plane direction ranges from 16.847% to 32.28%. The ratio of the maximum and minimum values along the in-plane direction for TGP-H-060, H14CX483, and SGL28BC are 1.9, 1.77, and 1.7 respectively. As shown in Figure 6d, the through-plane volume fraction of the GDL exhibits a linear change during the initial stages. Subsequently, it fluctuates randomly within a small range, approaching the average value. The MPL layer in H14CX483 and SGL28BC exhibits a linear increase on the MPL side, indicating that the carbon particles are embedded within the GDL.

3.3. Pore Characteristics

As illustrated in Figure 7a, the image segmentation algorithm divides the connected pore space into smaller pores, and each color represents a distinct volume. In order to accurately analyze pore morphology and pore distribution characteristics, the removal of edge pores was performed using the Border kill command. Then, the equivalent diameter of pores were obtained with Equation (1).
E q . D = 6 × V π 3
The pore morphology significantly influences the two-phase flow within the pore. The description of pore morphology was challenging when compared to the equivalent diameter of the pore. According to the description of particle morphology parameters, we employed dimensionless shape factors to characterize the pore morphology and subsequently determined the pore sphericity, aspect ratio, and specific surface area. Sphericity, defined as the ratio of the spherical surface area to the pore surface area for a given volume, decreases as the deviation of pore shape from a perfect sphere increases. The pore characteristics of the GDL are depicted in Figure 7b,c. The distribution of the equivalent diameter and sphericity for the GDL follows a normal distribution. The equivalent diameters were concentrated in the range of 12.5 μm to 87.5 μm, with SGL28BC exhibiting the smallest average pore size of 27.4 μm and H14CX483 displaying the largest average pore size of 37.6 μm. The TGP-H-060 exhibited an average pore diameter of 29.70 μm with a standard deviation of 12.37, which is consistent with the findings reported in the literature [22,24]. The average sphericity values were 0.5588, 0.5447, and 0.5108, respectively, indicating a deviation of the pores from a spherical shape. The average value of the other pore structure parameters are shown in Table 1. The average flatness and specific surface area of the pores were approximate 0.5 and 0.5 μm−1, respectively, while the average aspect ratio approached 1.5. These findings indicate that the pore morphology within the GDL is predominantly characterized by a distribution of flat and irregular shapes.

3.4. Bulk Characteristics

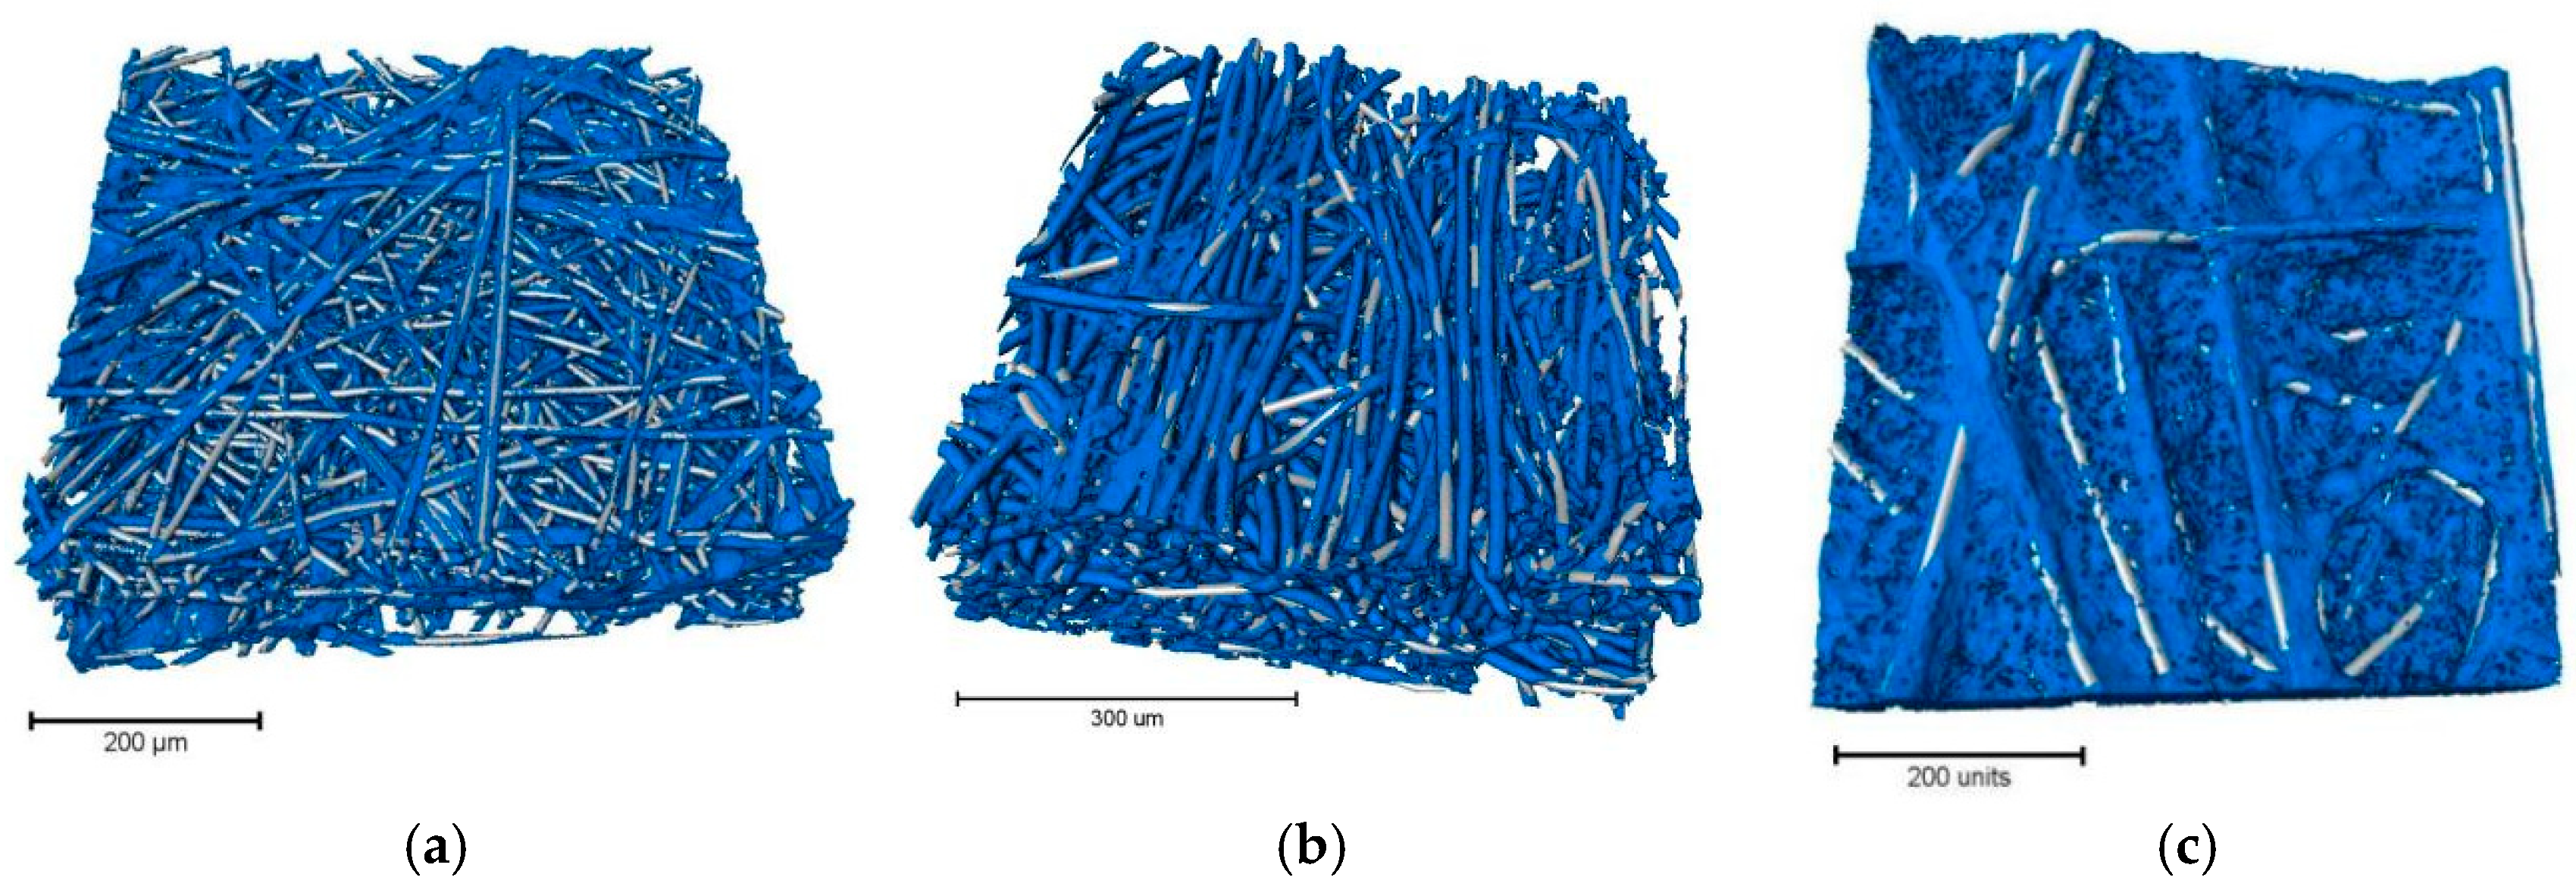
The Avizo XFiber Extension module provides enhanced support for the analysis of fiber status. By fitting an equal-diameter cylinder to the bulk phase of the GDL, various parameters, such as fiber distribution, length, tortuosity, and orientation theta and Phi, can be determined by analyzing the fitted data. Figure 8a–c illustrate the bulk phase data of the GDL fitted with equal-diameter fibers. Upon comparing the data before and after fitting, it was observed that there was a higher degree of coincidence among carbon fibers, with a random attachment of carbonized resin to their surfaces.
Tortuosity, defined as the ratio between the fiber length and fiber chord length, serves as an indicator of bending degree. As depicted in Figure 8d–f, the distribution of fiber tortuosity was primarily concentrated within the range of 1.0 to 1.1, with average values recorded at 1.032, 1.056, and 1.012, respectively. Among them, the tortuosity of SGL28BC was less than 1.1, exhibiting exceptional linearity. H14CX483 demonstrated the highest tortuosity, with a maximum value of 3.81, primarily attributed to its specific manufacturing process, as depicted in Figure 5d.
Based on the fitted data, the distribution of carbon fiber length is depicted in Figure 8g, which conforms to a three-parameter Gamma distribution. The average lengths of TGP-H-060, H14CX483, and SGL28BC fibers were measured as 167.7 μm, 299.5 μm, and 227.6 μm, respectively. Correspondingly, the number of carbon fibers for each type was reported as follows: 1155 for TGP-H-060, 410 for H14CX483, and 106 for SGL28BC. It is noteworthy that more than 58% of these fibers had a length less than or equal to 300 μm, while those exceeding the threshold of 600 μm accounted for less than an estimated value of approximately only 8.3%. This discrepancy can be attributed to the presence of a significant amount of carbon particle fillers in the bulk phase composition of SGL28BC compared to TGP-H-060 and H14CX483, which contain predominantly longer fibers. Furthermore, both the volume fraction and total fiber length analysis revealed that carbon fibers constituted merely around 10% of the overall bulk phase content in the SGL28BC material.
The orientation theta represents the angle between the chord length and the XY plane, while the fiber orientation Phi refers to the angle between the projection of chord length and the X axis. As displayed in Figure 8h, the empirical cumulative distribution function of the orientation theta adheres to a three-parameter Gamma distribution, with a concentration primarily around 12.5°. The percentage of orientation theta that was less than 12.5° fell within the range of 56.8% to 87.1%, whereas the percentage that was greater than 45° accounted for less than 12.9%. As shown in Figure 8i, the carbon fibers exhibited a uniform distribution of orientation Phi ranging from 0 to 90°. The results show that the carbon fibers are randomly dispersed within the XY plane. However, there is still a minor proportion vertically embedded in the GDL. According to the curve of the cumulative distribution function, H14CX483 exhibits a more pronounced fiber crossing phenomena compared to TGP-H-060, which displays weaker occurrences thereof.

3.5. Degradation

Compared with the pore characteristics observed before and after compression, a significant increase in isolated pores was observed in the compressed GDL due to the extrusion of bulk phase fibers and resins. The average equivalent diameter of isolated pores and the number were 5.1 μm and 480, respectively. As illustrated in Figure 7b,c and Figure 9a,b, the average equivalent diameter and standard deviation of connected pores increased from 29.7 μm and 12.26 to 36.8 μm and 17.43, respectively, while the number of connected pores was reduced from 1024 to 820. The sphericity mean value increased significantly from 0.5588 to 0.6269, indicating a notable improvement in pore regularity. The average fiber length after compression was reduced from 167.7 μm to 149.1 μm. As depicted in Figure 8g and Figure 9c, there was an increase in the percentage of fibers with lengths below 300 μm from 84.4% to 88.5%, while the proportion of fibers exceeding 600 μm decreased from 3.0% to 1.6%. The average tortuosity of the compressed fiber decreased from 1.032 to 1.022, while the maximum value was reduced from 2.16 to 1.71. The fibers exhibited a uniform distribution within the plane range both before and after compression, with a notable decrease in the average orientation theta from 12.7° to 10.7°.
The aperture distribution and sphericity of the GDL after service under working conditions are shown in Figure 9a,b. The quantity of connected pores exhibited a significant increase. The average equivalent diameter and pore count underwent a transformation from 37.6 μm and 415 to 30.96 μm and 626, respectively. The average pore size and number of isolated pores were 4.08 μm and 174, respectively, with no statistically significant variation observed. The surface-oriented fibers of H14CX483 exhibited a higher proportion of longer fibers, and there was minimal alteration in the fiber length and distribution after durability. The average fiber length was 294.1 μm and the orientation theta within 15° distribution was large. The orientation Phi was concentrated within 12.5°, accounting for 71%. The average tortuosity and maximum value after durability were 1.075 and 3.64, respectively.
Due to the manufacturing process of SGL 28BC, the pore space comprises a substantial number of connected and isolated pores. As presented in Figure 7b,c and Figure 9a,b, following immersion in an acid solution for a duration of 1800 h, the number distribution of connected and isolated pores decreased from 1675 and 2973 to 1364 and 361, respectively. The average pore size and porosity increased from 27.95 μm and 75.33% to 30.2 μm and 80.98%, respectively. The equivalent pore size of isolated pores was concentrated in the range of 1.5~3.0 μm, and a significant reduction in the number of isolated pores with an equivalent pore size of less than 2.0 μm was observed after acidification treatment. This phenomenon can be attributed to the formation of connections between small isolated pores and larger ones due to acid-induced corrosion. Given the limited quantity of fibers of SGL 28BC within the unit, there was an absence of substantial alterations in both the fiber length and distribution. As demonstrated in Figure 8g,h and Figure 9c,d, the average length decreased from 317 μm to 281 μm, and the number of fibers with a length of 500 μm significantly decreased. The number of fibers with a tortuosity greater than 1.01 increased significantly after acidification. This can be attributed to the softening of the bulk phase following acidification, leading to an augmented number of fiber contact points and increased tortuosity.

4. Conclusions

In this study, we utilized 3D-μXCT to reconstruct the microstructure of GDLs and accurately depict their morphology and structural parameters. The morphology of GDLs exhibit significant variations across manufacturers due to disparities in materials and manufacturing processes. The distribution of the pore equivalent diameter and sphericity in GDLs conformed to a normal distribution. The pore morphology within the GDL was predominantly characterized by a distribution of flat and irregular shapes. The carbonized resin adhered to the fiber surface in a stochastic manner. The carbon fibers exhibited a linear and random arrangement in the XY plane, with a lower density embedded in the GDL.
When compressed, the average diameter of connected pores in the GDL increased, the number of pores decreased, and a significant amount of isolated pores emerged. The pore parameters exhibited significant changes after chemical attenuation, while the shape parameters remained less changed. The distribution of bulk phase fibers remained stable, with a slight increase in fiber curvature observed. After working service, the number of connected pores in the GDL increased, accompanied by a decrease in the average equivalent diameter and an overall increase in the pore count.
Although the research of this paper has achieved initial success, there is still much further research work to be carried out, and the key points are briefly discussed as follows:
  • We have shown that 3D-μXCT can analyze the microstructure characteristics of GDLs well. Therefore, it can be used as an important method for GDL process design and failure study. The relevant experimental methods and mechanism analysis need further study.
  • Mechanical compression and chemical corrosion have different effects on the microstructure of GDLs. More experiments and samples are needed to explain the degradation of GDLs under different actual conditions.

Author Contributions

Validation, B.L.; Writing—original draft, Q.S.; Writing—review & editing, C.F.; Funding acquisition, P.M. All authors have read and agreed to the published version of the manuscript.

Funding

This work was supported by the National Natural Science Foundation of China General Program (52276210), the Tongling University research fund project (2024tlxyrc033).

Data Availability Statement

The original contributions presented in the study are included in the article, further inquiries can be directed to the first author.

Acknowledgments

This work was supported by the National Natural Science Foundation of China General Program (52276210), the Tongling University research fund project (2024tlxyrc033), and Zhongjun Hou.

Conflicts of Interest

The authors declare that they have no known competing financial interests or personal relationships that could have appeared to influence the work reported in this paper.

References

  1. Catumba, B.D.; Sales, M.B.; Borges, P.T.; Filho, M.N.R.; Lopes, A.A.S.; Rios, M.A.d.S.; Desai, A.S.; Bilal, M.; dos Santos, J.C.S. Sustainability and challenges in hydrogen production: An advanced bibliometric analysis. Int. J. Hydrogen Energ. 2023, 48, 7975–7992. [Google Scholar] [CrossRef]
  2. Olabi, A.G.; Wilberforce, T.; Abdelkareem, M.A. Fuel cell application in the automotive industry and future perspective. Energy 2021, 214, 118955. [Google Scholar] [CrossRef]
  3. Athanasaki, G.; Jayakumar, A.; Kannan, A.M. Gas diffusion layers for PEM fuel cells: Materials, properties and manufacturing—A review. Int. J. Hydrogen Energ. 2023, 48, 2294–2313. [Google Scholar] [CrossRef]
  4. Shi, Q.T.; Feng, C.; Ming, P.W.; Tang, F.; Zhang, C. Compressive stress and its impact on the gas diffusion layer: A review. Int. J. Hydrogen Energ. 2022, 47, 3994–4009. [Google Scholar] [CrossRef]
  5. Jiao, K.; Xuan, J.; Du, Q.; Bao, Z.; Xie, B.; Wang, B.; Zhao, Y.; Fan, L.; Wang, H.; Hou, Z.; et al. Designing the next generation of proton-exchange membrane fuel cells. Nature 2021, 595, 361–369. [Google Scholar] [CrossRef]
  6. Chen, Q.; Niu, Z.; Li, H.; Jiao, K.; Wang, Y. Recent progress of gas diffusion layer in proton exchange membrane fuel cell: Two-phase flow and material properties. Int. J. Hydrogen Energ. 2021, 46, 8640–8671. [Google Scholar] [CrossRef]
  7. Mukherjee, P.P.; Kang, Q.J.; Wang, C.Y. Pore-scale modeling of two-phase transport in polymer electrolyte fuel cellsprogress and perspective. Energy Environ. Sci. 2011, 4, 346–369. [Google Scholar] [CrossRef]
  8. Cecen, A.; Wargo, E.A.; Hanna, A.C.; Turner, D.M.; Kalidindi, S.R.; Kumbur, E.C. 3-D microstructure analysis of fuel cell materials: Spatial distributions of tortuosity, void size and diffusivity. J. Electrochem. Soc. 2012, 159, B299–B307. [Google Scholar] [CrossRef]
  9. Sizikov, V.S.; Sidorov, D.N. Generalized quadrature for solving singular integral equations of Abel type in application to infrared tomography. Appl. Numer. Math. 2016, 106, 69–79. [Google Scholar] [CrossRef]
  10. Khajeh-Hosseini-Dalasm, N.; Sasabe, T.; Tokumasu, T.; Pasaogullari, U. Effects of polytetrafluoroethylene treatment and compression on gas diffusion layer microstructure using high-resolution X-ray computed tomography. J. Power Sources 2014, 266, 213–221. [Google Scholar] [CrossRef]
  11. Becker, J.; Fluckiger, R.; Reum, M.; Büchi, F.N.; Marone, F.; Stampanoni, M. Determination of material properties of gas diffusion layers: Experiments and simulations using phase contrast tomographic microscopy. J. Electrochem. Soc. 2009, 156, B1175–B1181. [Google Scholar] [CrossRef]
  12. Wargo, E.A.; Schulz, V.P.; Çeçen, A.; Kalidindi, S.; Kumbur, E. Resolving macro- and micro-porous layer interaction in polymer electrolyte fuel cells using focused ion beam and X-ray computed tomography. Electrochim. Acta 2013, 87, 201–212. [Google Scholar] [CrossRef]
  13. Odaya, S.; Phillips, R.K.; Sharma, Y.; Bellerive, J.; Phillion, A.; Hoorfar, M. X-ray tomographic analysis of porosity distributions in gas diffusion layers of proton exchange membrane fuel cells. Electrochim. Acta 2015, 152, 464–472. [Google Scholar] [CrossRef]
  14. Tötzke, C.; Gaiselmann, G.; Osenberg, M.; Bohner, J.; Arlt, T.; Markötter, H.; Hilger, A.; Wieder, F.; Kupsch, A.; Müller, B.; et al. Three-dimensional study of compressed gas diffusion layers using synchrotron X-ray imaging. J. Power Sources 2014, 253, 123–131. [Google Scholar] [CrossRef]
  15. Holzer, L.; Pecho, O.; Schumacher, J.; Marmet, P.; Stenzel, O.; Büchi, F.; Lamibrac, A.; Münch, B. Microstructure-property relationships in a gas diffusion layer (GDL) for Polymer Electrolyte Fuel Cells, Part I: Effect of compression and anisotropy of dry GDL. Electrochim. Acta 2017, 227, 419–434. [Google Scholar] [CrossRef]
  16. Atkinson, R.W.; Garsany, Y.; Gould, B.D.; Swider-Lyons, K.E.; Zenyuk, I.V. The role of compressive stress on gas diffusion media morphology and fuel cell performance. ACS Appl. Energy Mater. 2018, 1, 191–201. [Google Scholar] [CrossRef]
  17. Kulkarni, N.; Kok, M.D.R.; Jervis, R.; Iacoviello, F.; Meyer, Q.; Shearing, P.R.; Brett, D.J. The effect of non-uniform compression and flow-field arrangements on membrane electrode assemblies-X-ray computed tomography characterisation and effective parameter determination. J. Power Sources 2019, 426, 97–110. [Google Scholar] [CrossRef]
  18. Meyer, Q.; Mansor, N.; Iacoviello, F.; Cullen, P.; Jervis, R.; Finegan, D.; Tan, C.; Bailey, J.; Shearing, P.; Brett, D. Investigation of hot pressed polymer electrolyte fuel cell assemblies via x-ray computed tomography. Electrochim. Acta 2017, 242, 125–136. [Google Scholar] [CrossRef]
  19. Pfrang, A.; Veyret, D.; Janssen, G.J.M.; Tsotridis, G. Imaging of membrane electrode assemblies of proton exchange membrane fuel cells by X-ray computed tomography. J. Power Sources 2011, 196, 5272–5276. [Google Scholar] [CrossRef]
  20. Wargo, E.A.; Kotaka, T.; Tabuchi, Y.; Kumbur, E. Comparison of focused ion beam versus nano-scale X-ray computed tomography for resolving 3-D microstructures of porous fuel cell materials. J. Power Sources 2013, 241, 608–618. [Google Scholar] [CrossRef]
  21. Available online: https://www.thermofisher.cn/cn/zh/home/industrial/electron-microscopy/electron-microscopy-instruments-workflow-solutions/3d-visualization-analysis-software (accessed on 15 September 2023).
  22. Roth, J.; Eller, J.; Marone, F.; Büchi, F.N. Investigation of the representative area of the water saturation in gas diffusion layers of polymer electrolyte fuel cells. J. Phys. Chem. C 2013, 117, 25991–25999. [Google Scholar] [CrossRef]
  23. Toray Industries, Inc. Data Sheet. Available online: https://www.toray.com (accessed on 15 September 2023).
  24. Zhang, H.; Zhu, L.; Harandi, H.B.; Duan, K.; Zeis, R.; Sui, P.-C.; Chuang, P.A. Microstructure reconstruction of the gas diffusion layer and analyses of the anisotropic transport properties. Energy Convers. Manag. 2021, 241, 114293. [Google Scholar] [CrossRef]
Figure 1. GDL structure parameters.
Energies 18 00381 g001
Figure 2. The 3D-μXCT device.
Energies 18 00381 g002
Figure 3. The process of GDL image analysis.
Energies 18 00381 g003
Figure 4. Reconstruction processing steps: (a) GDL; (b) grayscale image. (c) Microstructural visualization of TGP-H-060.
Energies 18 00381 g004
Figure 5. The morphology of GDL: (a) TGP-H-060; (b) SGL28BC; (c) H14CX483; and (d) H14CX483 after removal of the surface oriented fibers.
Energies 18 00381 g005
Figure 6. The volume fraction of GDL: (a) different sized units in different areas; (b) mean volume fraction and relative error; (c) in-plane; and (d) through-plane.
Energies 18 00381 g006
Figure 7. (a) Pore morphology changes before and after Border kill (Different colors indicate different pores); (b) pore size distribution and (c) sphericity.
Energies 18 00381 g007
Figure 8. 3D reconstruction of (a) TGP-H-060, (b) H14CX483, and (c) SGL28BC. The tortuosity of (d) TGP-H-060, (e) H14CX483, and (f) SGL28BC. Empirical CDF of (g) the length of carbon fiber and (h) orientation theta. (i) Histogram of orientation Phi.
Energies 18 00381 g008aEnergies 18 00381 g008b
Figure 9. GDL structure parameters: (a) pore sizes distribution; (b) sphericity; (c) length of carbon fiber; (d) orientation theta. Tortuosity: (e) TGP-H-060-M, (f) H14CX483-J, and (g) SGL28BC-A.
Energies 18 00381 g009
Table 1. The average value of GDL structure parameters.
Connected PoresIsolated PoresBulk Phase
FlatnessSpecific Surface AreaAspect RatioAverage DiameterNumberTortuosityFiber Length/μmOrientation Theta/°
TGP-H-0600.52960.491.491//1.03216712.7
H14CX4830.70010.79221.41354.081741.135299.518.06
SGL 28BC0.54850.5171.4242.54929731.012227.64.06
TGP-H-060-M0.45090.58261.7055.14801.027149.110.7
H14CX483-J0.66950.78691.45834.111991.075294.114.85
SGL 28BC-A0.5260.46891.43032.4673611.009281.87.306
Disclaimer/Publisher’s Note: The statements, opinions and data contained in all publications are solely those of the individual author(s) and contributor(s) and not of MDPI and/or the editor(s). MDPI and/or the editor(s) disclaim responsibility for any injury to people or property resulting from any ideas, methods, instructions or products referred to in the content.