

Analysis of Techno–Economic and Social Impacts of Electric Vehicle Charging Ecosystem in the Distribution Network Integrated with Solar DG and DSTATCOM


 ,
,  ,
,
Abstract
1. Introduction
- A robust planning model of radial DN is designed incorporating EVCE, solar DG, and DSTATCOM;
- The study aims to identify the location and size of the EVCE, solar DG and DSTATCOM optimally employing IPSO-SR, with the goal of optimizing both economic performance and social advantages. The optimization process ensures compliance with system security constraints, including power balance, power flow, voltage, and power factor limits;
- A comprehensive financial assessment is conducted, covering the installation expenses, operational and maintenance costs, energy loss charges, and emission-related costs over an extended period. The analysis also incorporates the interest rate and inflation rate to efficiently model the future cost of the planning;
- Various case studies of different configurations of EVCE, solar DG, and DSTATCOM are conducted to compare key techno–economic factors to help the planning engineers of the power system select the optimal strategy.
2. EV Charging Ecosystem (EVCE), Solar Distributed Generation (DG) and Distribution Static Compensator (DSTATCOM)
3. Objective Function and Constraints
3.1. Objective Function
- (a)
- Total cost of installation ()
- (b)
- Total cost of operation and maintenance ()
- (c)
- Total cost of energy loss ()
- (d)
- Total cost of environmental emissions ()
3.2. Constraints
- (a)
- Power balance constraints
- (b)
- Power flow constraints
- (c)
- Voltage constraints
- (d)
- Power factor constraints
4. Problem Formulation
- i.
- Allocation of EVCE, solar DG, and DSTATCOM in the DN;
- ii.
- Minimization of investment costs including installation and operation–maintenance expenses to ensure a cost-effective approach;
- iii.
- Minimization of energy loss to benefit the power system planning engineer;
- iv.
- Minimization of environmental emissions to address societal benefits.
5. Methodology
5.1. Conventional Particle Swarm Optimization (PSO)
5.2. Improved Particle Swarm Optimization Based on Success Rate (IPSO-SR)
- Step 1: Input network information related to line data and bus data. Set the number of EVCE, DG, and DSTATCOM;
- Step 2: Set the parameters for population size and maximum iteration counts, parameters of IPSO-SR, i.e., , , the upper and lower boundaries of the decision variable (size and locations of the EVCE, DG, and DSTATCOM), and velocity;
- Step 3: Conduct the load flow analysis using BFS in order to identify the base case power losses and voltage profile;
- Step 4: Initialize the decision variables by creating random initial particles of locations and sizes of the EVCE, DG, and DSTATCOM;
- Step 5: Calculate the objective function using (1)–(18) and check for security constraint violations such as power balance, voltage, power flow, and power factor constraints using (19)–(23). If any particle does not satisfy the operational constraints, reinitialize the particles;
- Step 6: Set the personal best and global best solution as and , respectively;
- Step 7: Calculate the adaptive inertia weight using (26)–(28) and update the velocity as well as the position of the particle using (24) and (25);
- Step 8: Update the and according to the error fitness value of the objective function;
- Step 9: Check the convergence criteria, i.e., the maximum number of iterations;
- Step 10: If the solution reaches convergence, display the results. If not, proceed to Step 5.
6. Results and Discussion
6.1. Case Description
- a.
- Base Case: In this case, no EVCE, solar DG, or DSTATCOM systems are integrated into the network;
- b.
- Case I: An EVCE is placed within the network;
- c.
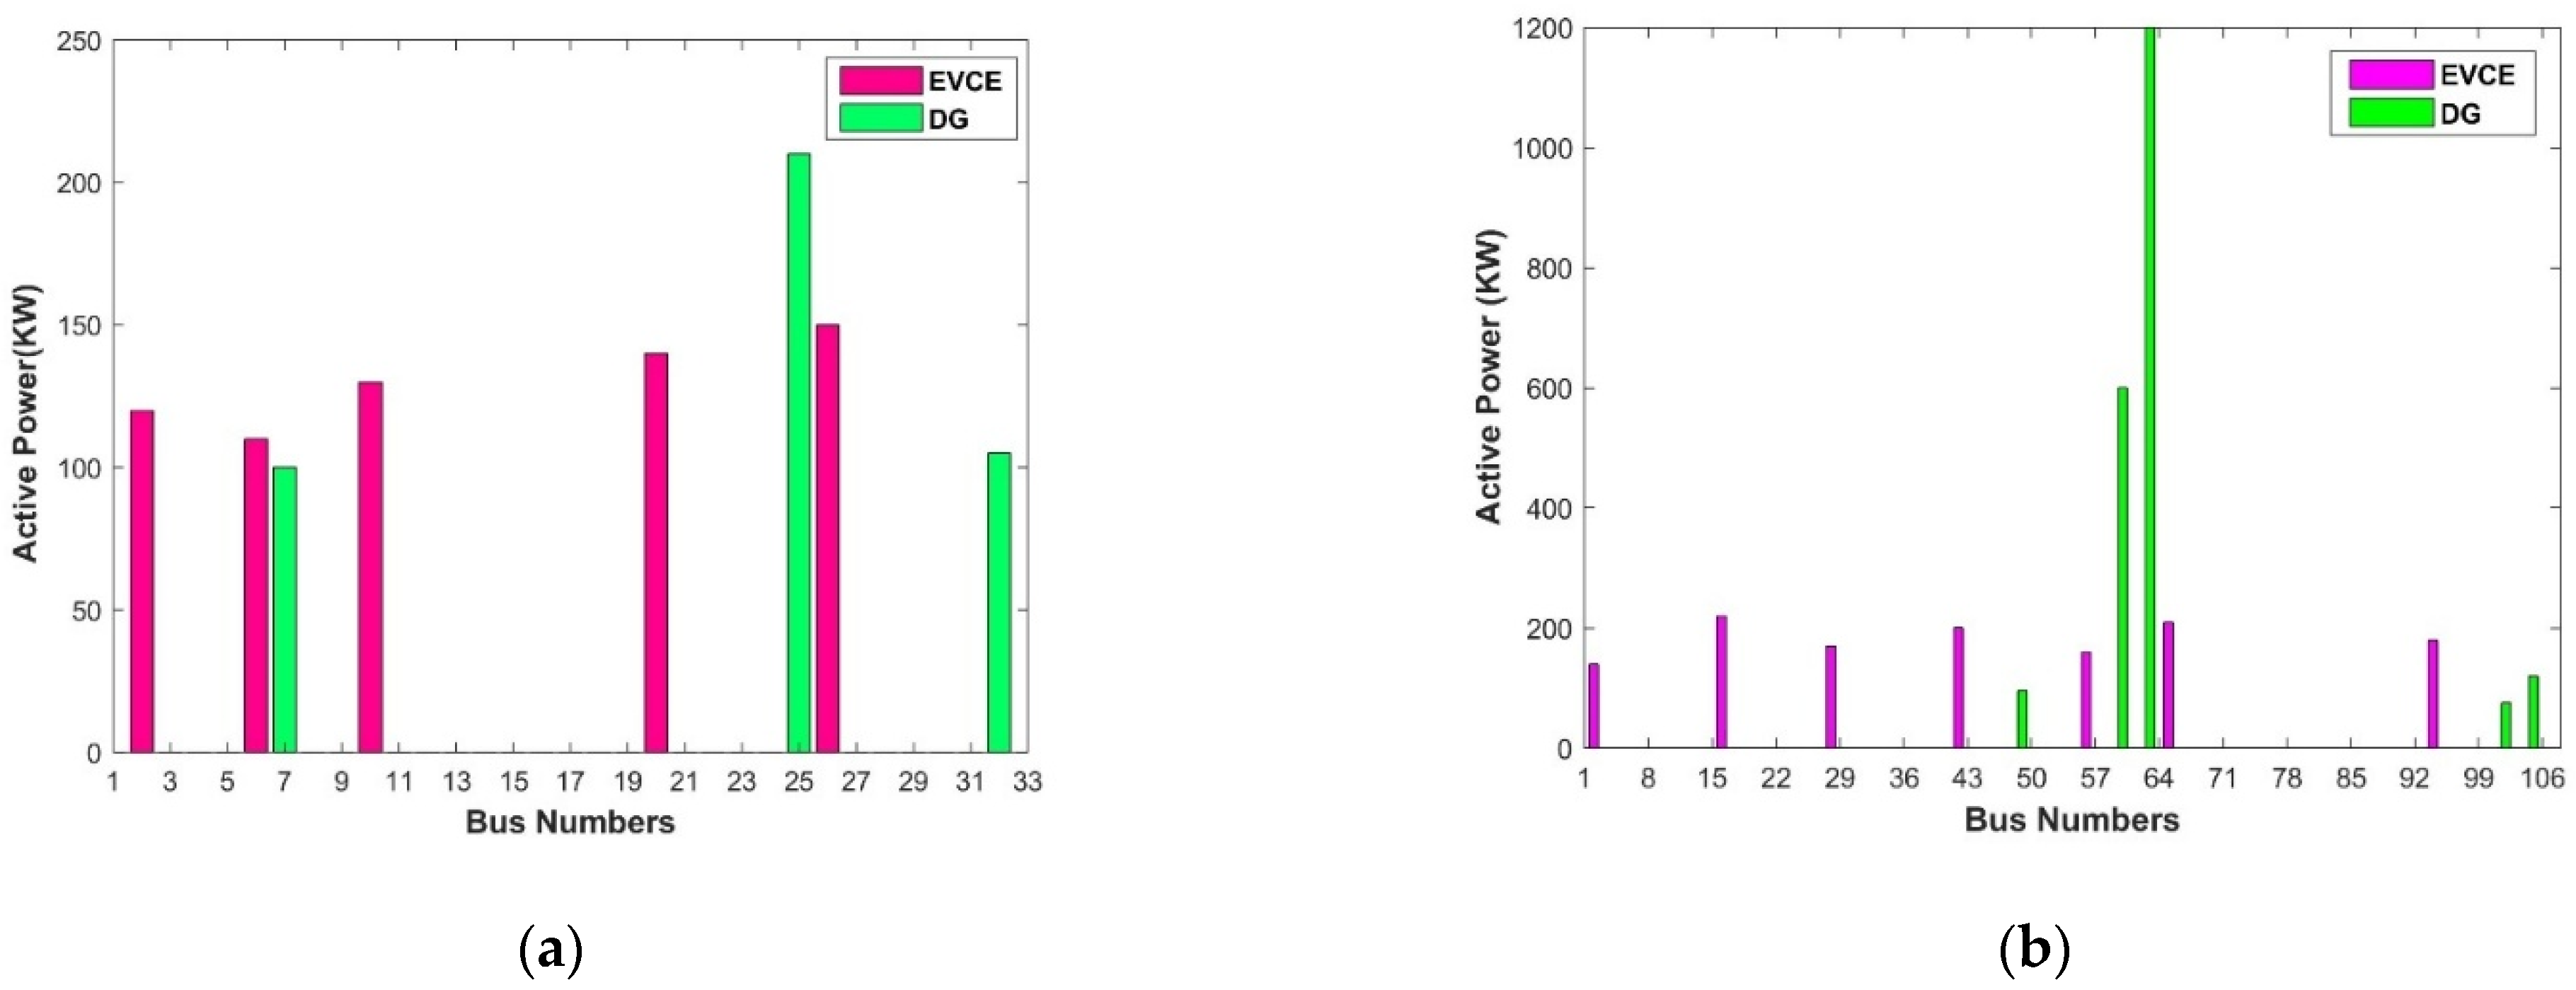
- Case II: an EVCE is integrated with a solar-based DG in the test system;
- d.
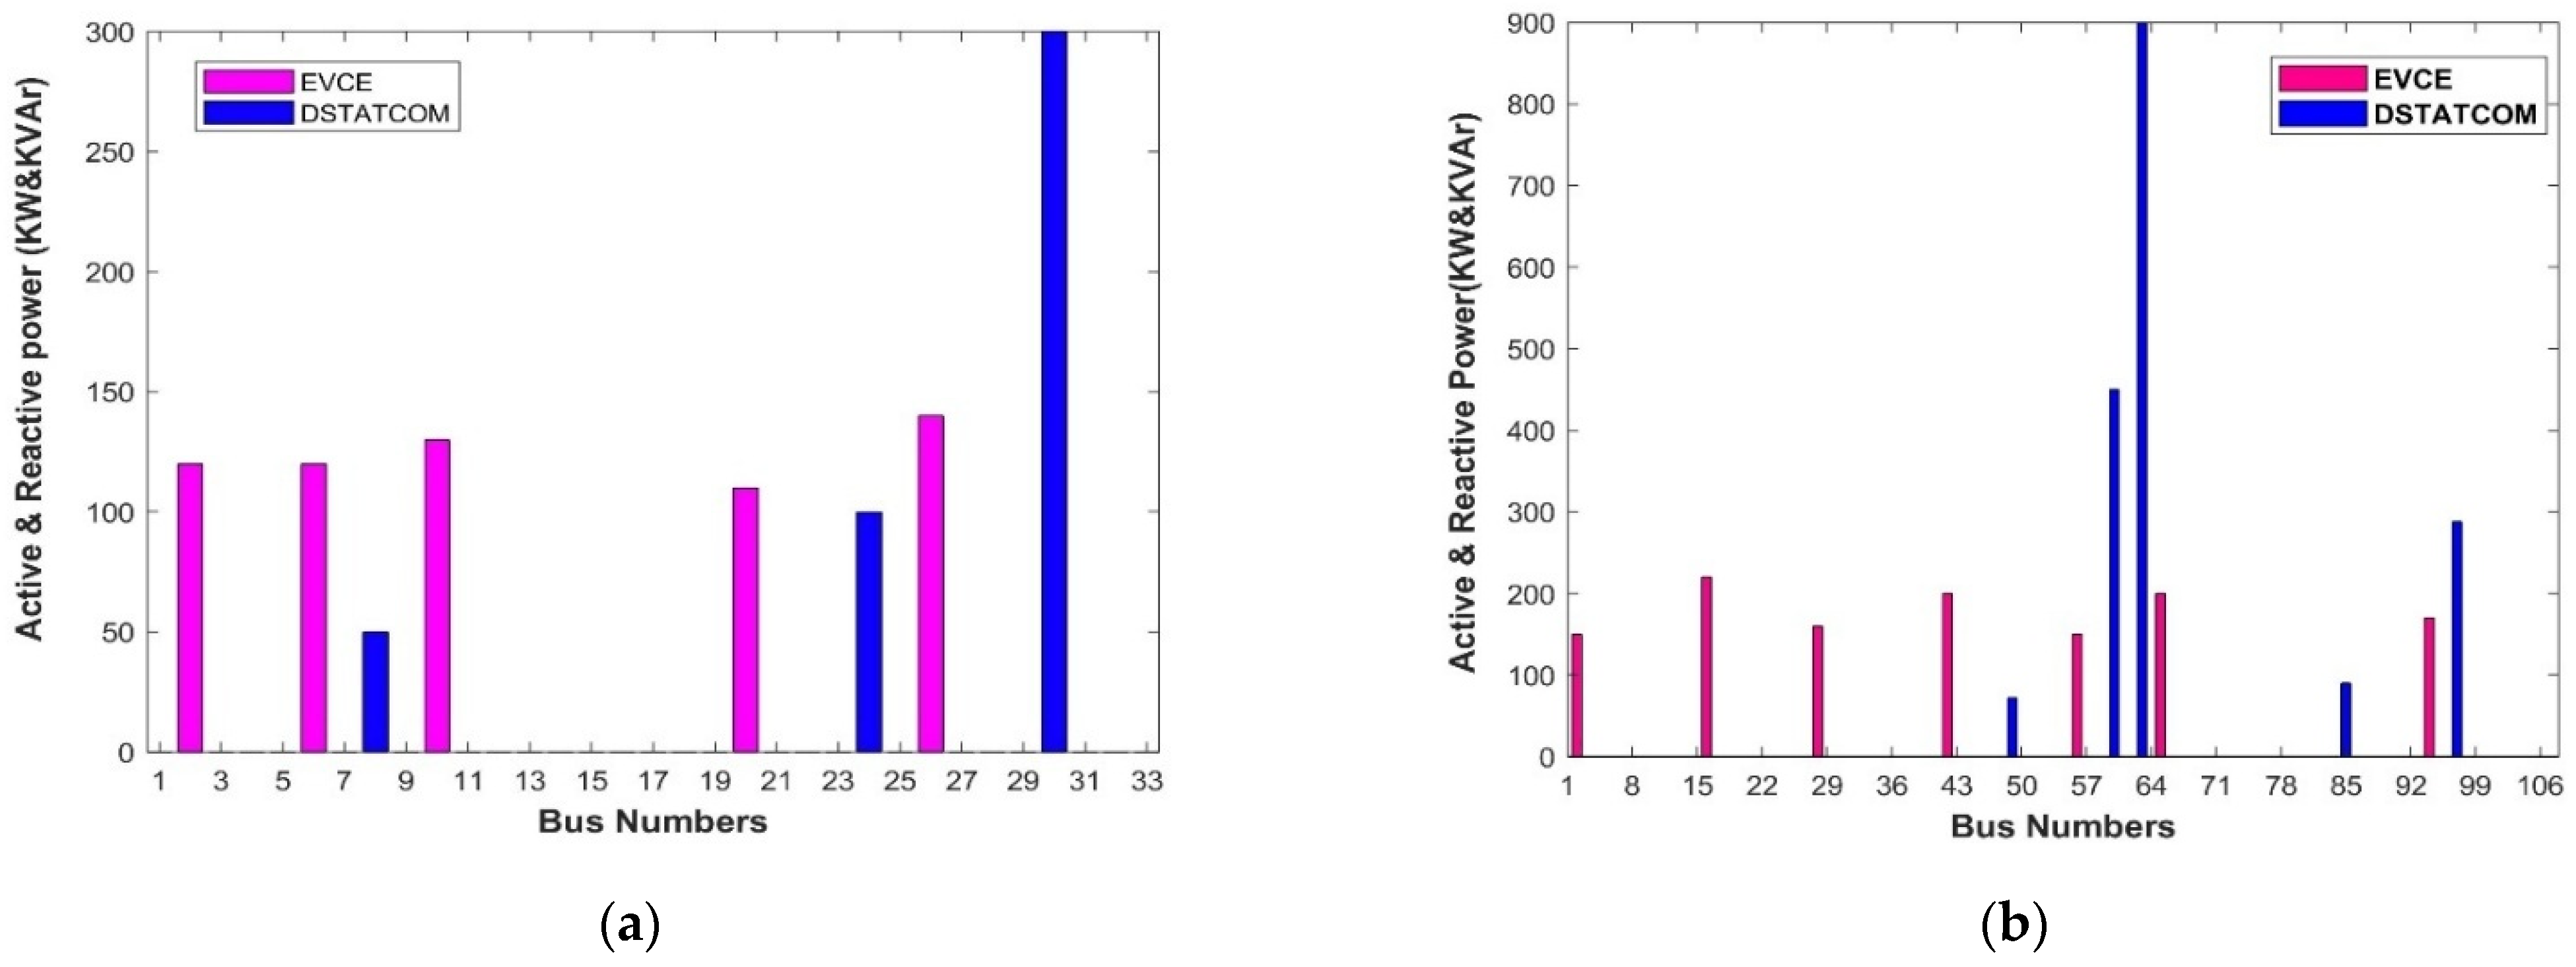
- Case III: an EVCE is integrated with a DSTATCOM;
- e.
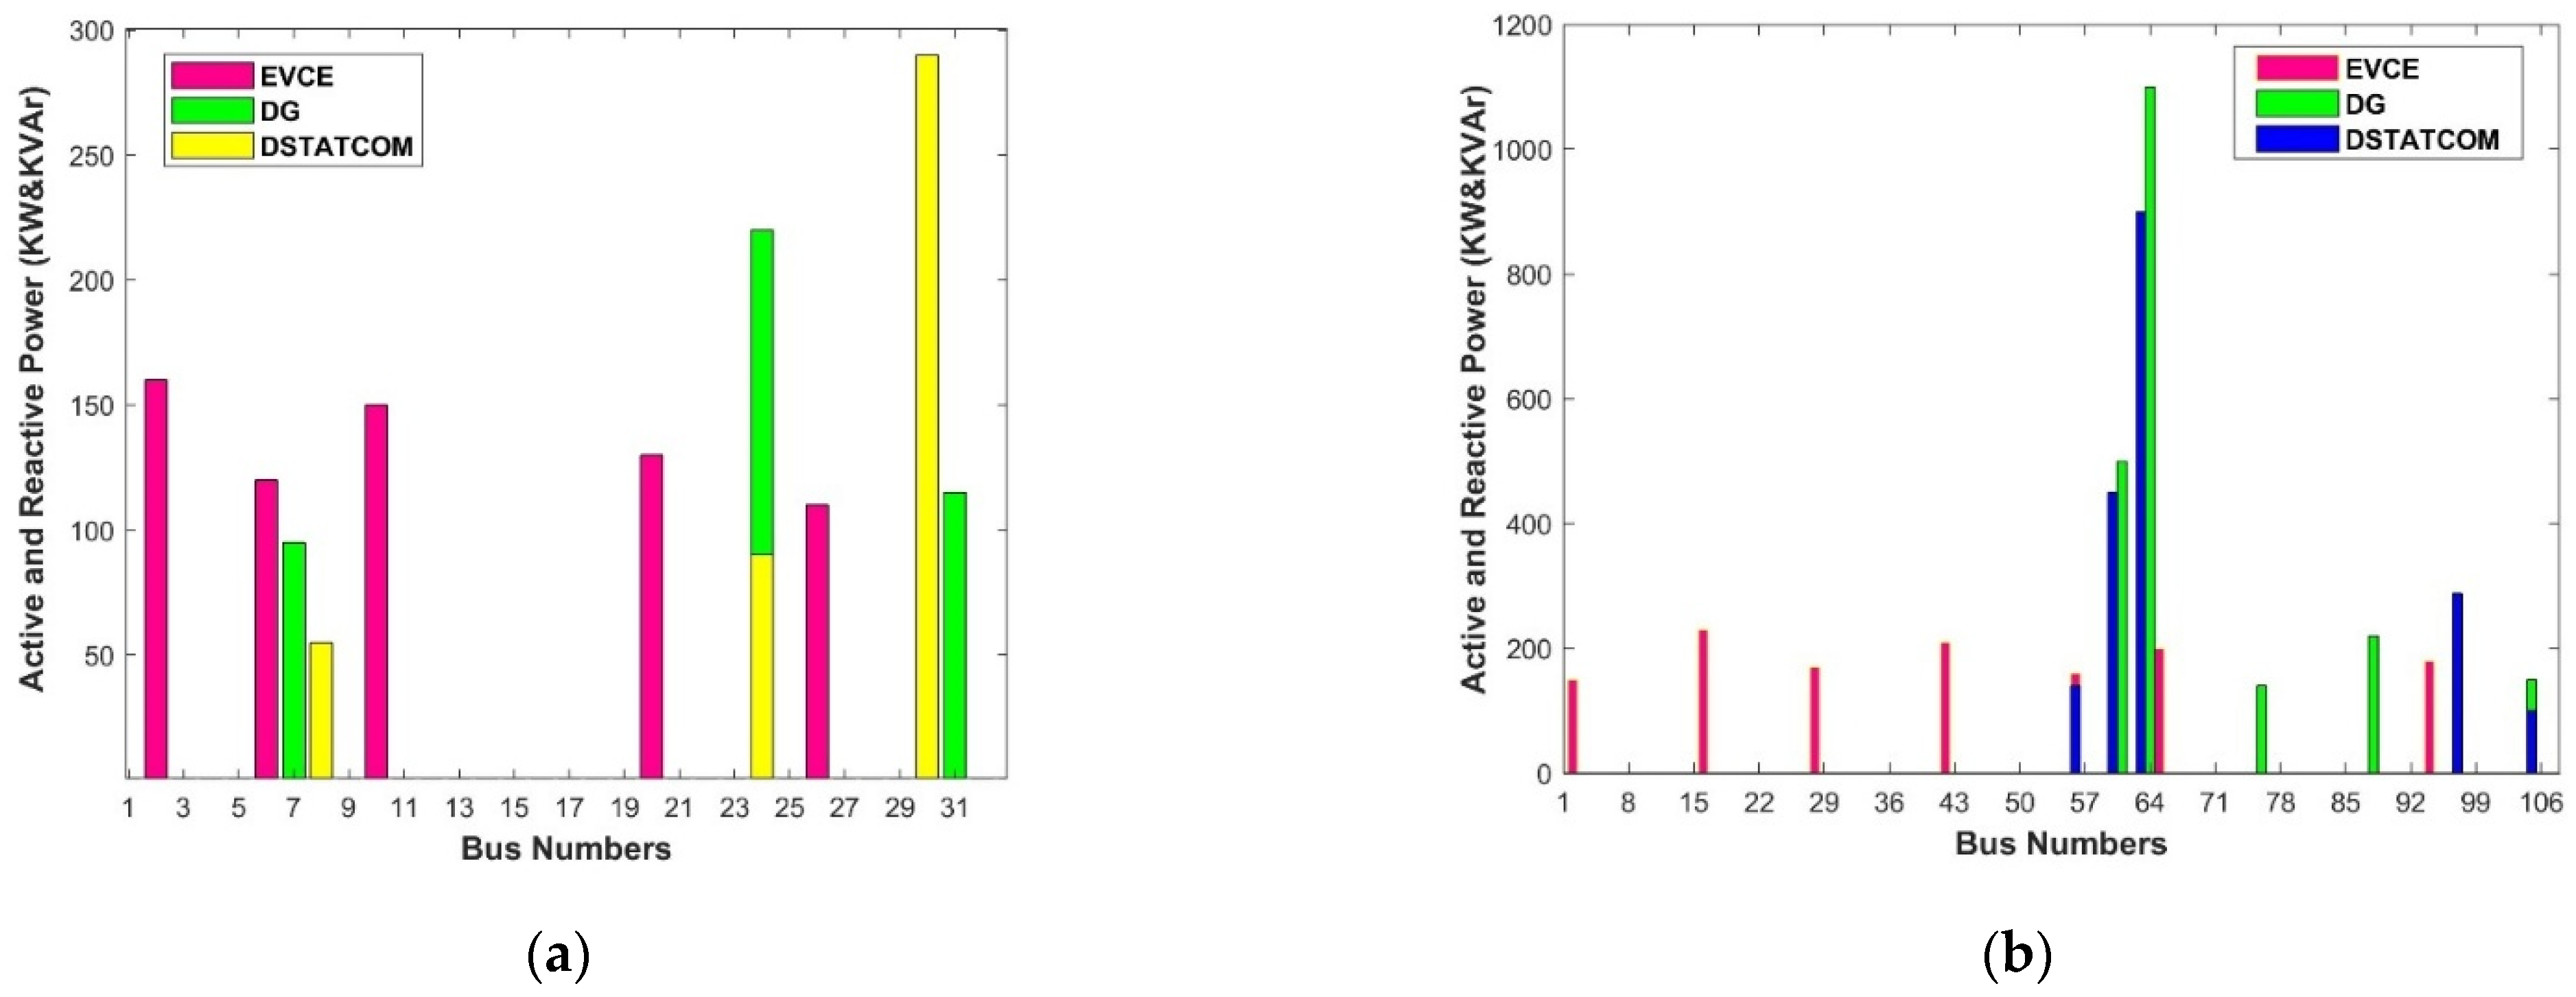
- Case IV: an EVCE is placed in conjunction with a solar-based DG and DSTATCOM-based reactive power compensators.
6.2. Analysis of Results
- (a)
- Results of sitting and sizing of the EVCE, solar DG, and DSTATCOM
- (b)
- Results of objective functions obtained using IPSO-SR technique
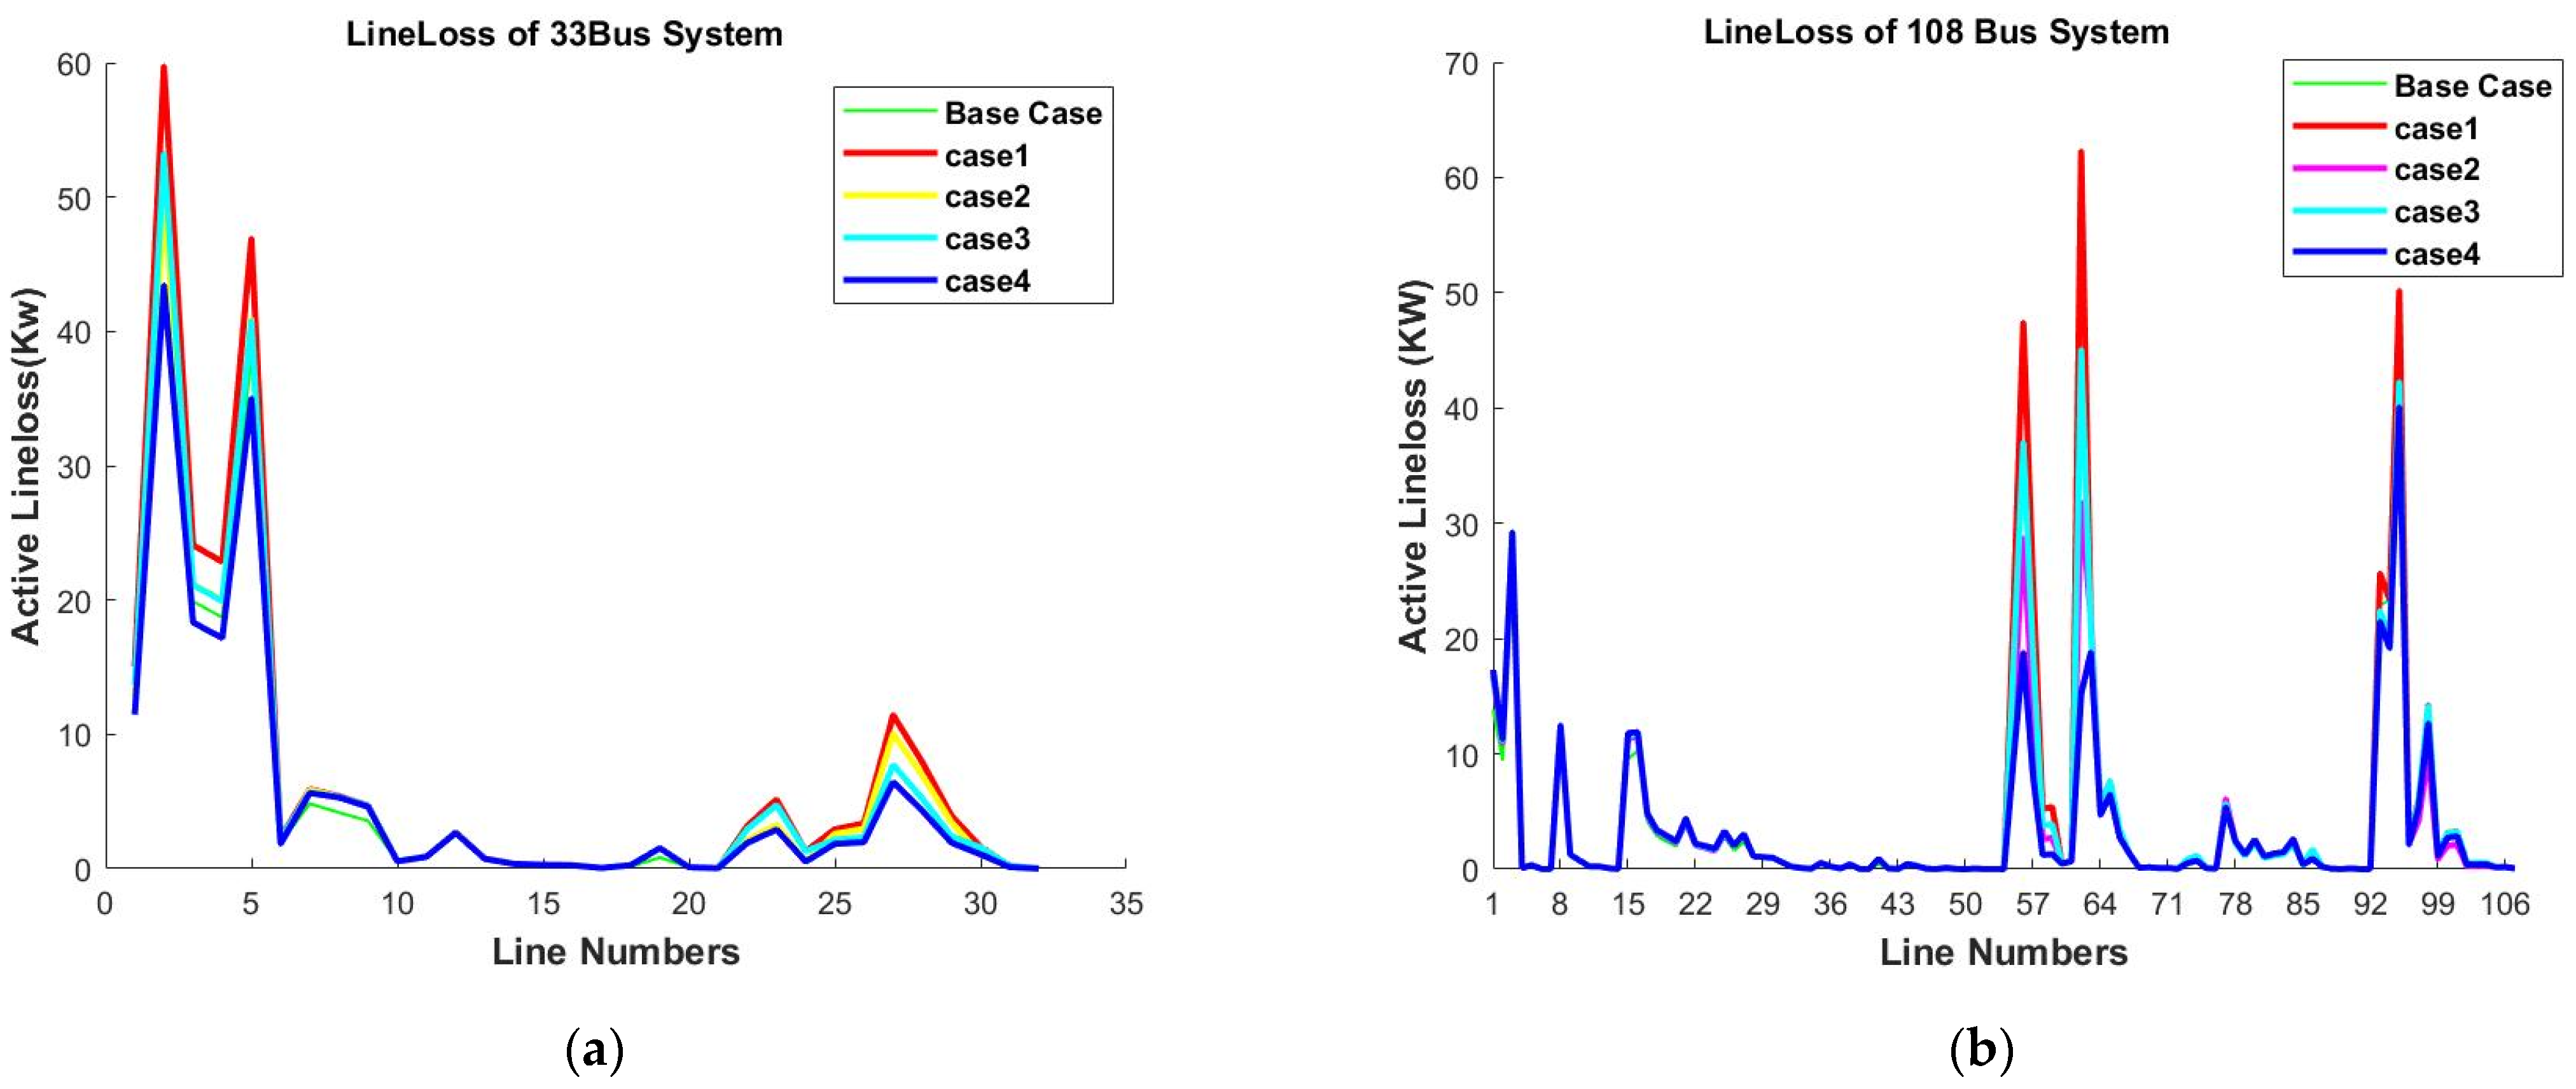
6.3. Impact Assessment
- (a)
- Voltage Profile Improvement
- (b)
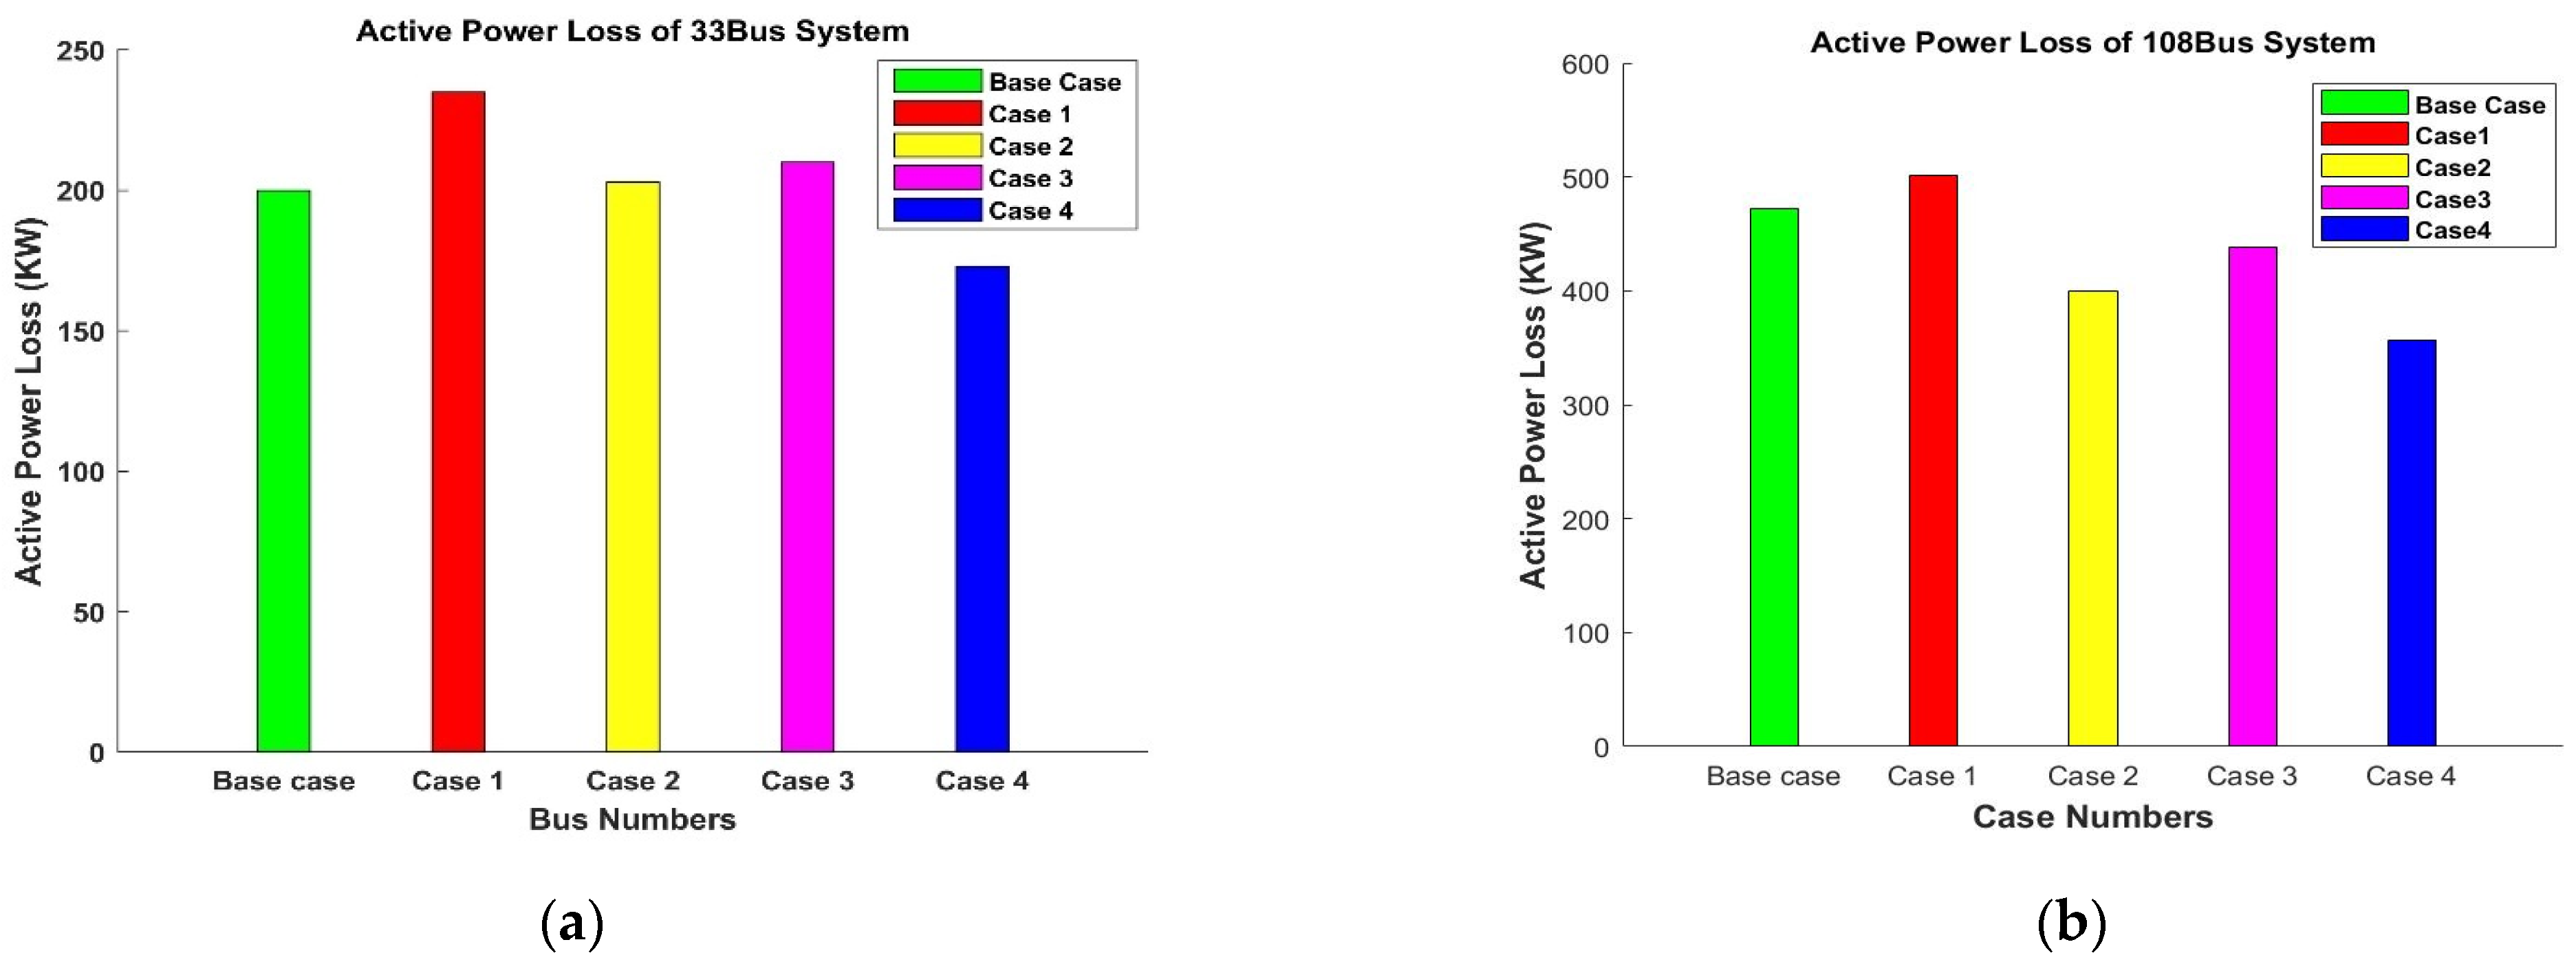
- Power loss
- (c)
- Environmental emissions
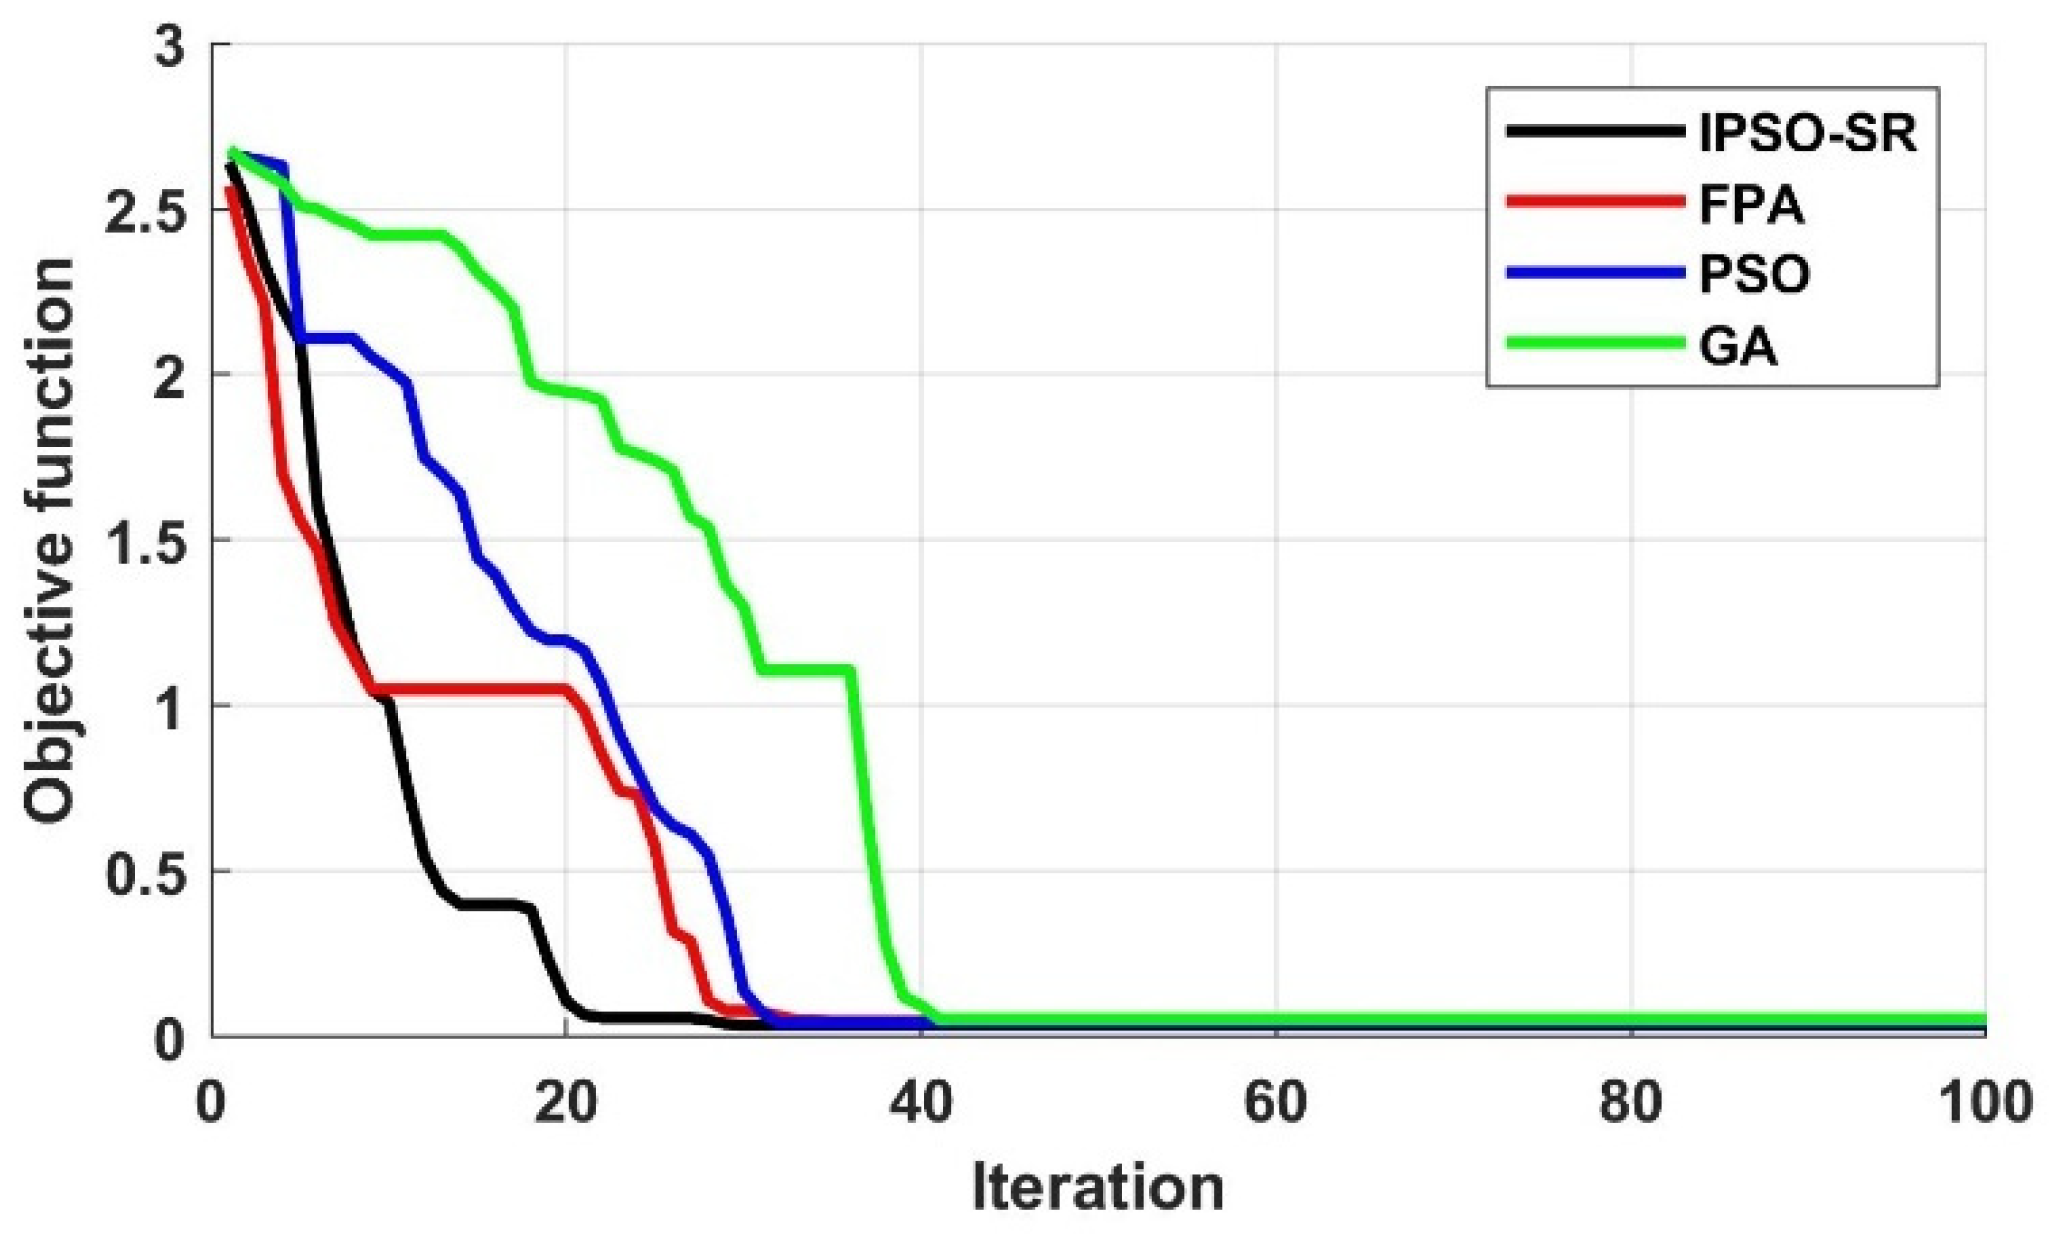
6.4. Algorithm Comparison
7. Conclusions
Author Contributions
Funding
Data Availability Statement
Acknowledgments
Conflicts of Interest
Appendix A. Bus Data and Line Data of 33-Bus DN and 108-Bus Real Indian Real DN

| Branch Number | Sending End Bus | Receiving End Bus | Active Power (MW) | Reactive Power (MVAr) | Resistance (Ω) | Reactance (Ω) |
|---|---|---|---|---|---|---|
| 1 | 1 | 2 | 0.0922 | 0.047 | 0 | 0 |
| 2 | 2 | 3 | 0.493 | 0.2511 | 0.1 | 0.06 |
| 3 | 3 | 4 | 0.366 | 0.1864 | 0.09 | 0.04 |
| 4 | 4 | 5 | 0.3811 | 0.1941 | 0.12 | 0.08 |
| 5 | 5 | 6 | 0.819 | 0.707 | 0.06 | 0.03 |
| 6 | 6 | 7 | 0.1872 | 0.6188 | 0.06 | 0.02 |
| 7 | 7 | 8 | 0.7114 | 0.2351 | 0.2 | 0.01 |
| 8 | 8 | 9 | 1.03 | 0.74 | 0.2 | 0.01 |
| 9 | 9 | 10 | 1.044 | 0.74 | 0.06 | 0.02 |
| 10 | 10 | 11 | 0.1966 | 0.065 | 0.06 | 0.02 |
| 11 | 11 | 12 | 0.3744 | 0.1238 | 0.045 | 0.03 |
| 12 | 12 | 13 | 1.468 | 1.155 | 0.06 | 0.035 |
| 13 | 13 | 14 | 0.5416 | 0.7129 | 0.06 | 0.035 |
| 14 | 14 | 15 | 0.591 | 0.526 | 0.12 | 0.08 |
| 15 | 15 | 16 | 0.7463 | 0.545 | 0.06 | 0.01 |
| 16 | 16 | 17 | 1.289 | 1.721 | 0.06 | 0.02 |
| 17 | 17 | 18 | 0.732 | 0.574 | 0.06 | 0.02 |
| 18 | 2 | 19 | 0.164 | 0.1565 | 0.09 | 0.04 |
| 19 | 19 | 20 | 1.5042 | 1.3554 | 0.09 | 0.04 |
| 20 | 20 | 21 | 0.4095 | 0.4784 | 0.09 | 0.04 |
| 21 | 21 | 22 | 0.7089 | 0.9373 | 0.09 | 0.04 |
| 22 | 3 | 23 | 0.4512 | 0.3083 | 0.09 | 0.04 |
| 23 | 23 | 24 | 0.898 | 0.7091 | 0.09 | 0.05 |
| 24 | 24 | 25 | 0.896 | 0.7011 | 0.42 | 0.2 |
| 25 | 6 | 26 | 0.203 | 0.1034 | 0.42 | 0.2 |
| 26 | 26 | 27 | 0.2842 | 0.1447 | 0.06 | 0.025 |
| 27 | 27 | 28 | 1.059 | 0.9337 | 0.06 | 0.025 |
| 28 | 28 | 29 | 0.8042 | 0.7006 | 0.06 | 0.02 |
| 29 | 29 | 30 | 0.5075 | 0.2585 | 0.12 | 0.07 |
| 30 | 30 | 31 | 0.9744 | 0.963 | 0.2 | 0.06 |
| 31 | 31 | 32 | 0.3105 | 0.3619 | 0.15 | 0.07 |
| 32 | 32 | 33 | 0.341 | 0.5302 | 0.21 | 0.1 |
| 33 | 21 | 8 | 2 | 2 | 0.06 | 0.04 |
| Branch Number | Sending End Bus | Receiving End Bus | Active Power (MW) | Reactive Power (MVAr) | Resistance (Ω) | Reactance (Ω) |
|---|---|---|---|---|---|---|
| 1 | 1 | 2 | 0.0814 | 0.0921 | 0 | 0 |
| 2 | 2 | 3 | 0.0555 | 0.0628 | 0 | 0 |
| 3 | 3 | 4 | 0.1443 | 0.1632 | 0 | 0 |
| 4 | 4 | 5 | 0.2970 | 0.0470 | 0 | 0 |
| 5 | 5 | 6 | 1.1550 | 0.1827 | 96 | 72 |
| 6 | 6 | 7 | 0.2970 | 0.0470 | 38.4 | 28.8 |
| 7 | 7 | 8 | 0.5940 | 0.0940 | 38.4 | 28.8 |
| 8 | 4 | 9 | 0.0666 | 0.0753 | 60 | 45 |
| 9 | 9 | 10 | 0.5940 | 0.0940 | 0 | 0 |
| 10 | 10 | 11 | 0.6270 | 0.0992 | 60 | 45 |
| 11 | 11 | 12 | 0.2970 | 0.0470 | 60 | 45 |
| 12 | 12 | 13 | 0.4950 | 0.0783 | 60 | 45 |
| 13 | 13 | 14 | 0.2970 | 0.0470 | 98.4 | 73.8 |
| 14 | 14 | 15 | 0.2970 | 0.0470 | 60 | 45 |
| 15 | 9 | 16 | 0.0814 | 0.0921 | 96 | 72 |
| 16 | 16 | 17 | 0.0925 | 0.1046 | 96 | 72 |
| 17 | 17 | 18 | 0.0396 | 0.0385 | 96 | 72 |
| 18 | 18 | 19 | 0.0352 | 0.0342 | 96 | 72 |
| 19 | 19 | 20 | 0.0396 | 0.0385 | 96 | 72 |
| 20 | 20 | 21 | 0.0352 | 0.0342 | 96 | 72 |
| 21 | 21 | 22 | 0.0999 | 0.0424 | 96 | 72 |
| 22 | 22 | 23 | 0.0555 | 0.0236 | 96 | 72 |
| 23 | 23 | 24 | 0.0888 | 0.0377 | 96 | 72 |
| 24 | 24 | 25 | 0.0888 | 0.0377 | 0 | 0 |
| 25 | 25 | 26 | 0.1665 | 0.0707 | 96 | 72 |
| 26 | 26 | 27 | 0.1650 | 0.0261 | 96 | 72 |
| 27 | 27 | 28 | 0.2970 | 0.0470 | 96 | 72 |
| 28 | 28 | 29 | 0.2310 | 0.0365 | 96 | 72 |
| 29 | 29 | 30 | 0.2970 | 0.0470 | 0 | 0 |
| 30 | 30 | 31 | 0.3960 | 0.0626 | 96 | 72 |
| 31 | 31 | 32 | 0.3630 | 0.0574 | 96 | 72 |
| 32 | 32 | 33 | 0.2310 | 0.0365 | 96 | 72 |
| 33 | 33 | 34 | 0.2640 | 0.0418 | 96 | 72 |
| 34 | 34 | 35 | 0.3630 | 0.0574 | 96 | 72 |
| 35 | 18 | 36 | 0.6270 | 0.0992 | 96 | 72 |
| 36 | 36 | 37 | 0.6270 | 0.0992 | 96 | 72 |
| 37 | 37 | 38 | 0.6270 | 0.0992 | 96 | 72 |
| 38 | 19 | 39 | 0.4950 | 0.0783 | 96 | 72 |
| 39 | 39 | 40 | 0.1980 | 0.0313 | 96 | 72 |
| 40 | 39 | 41 | 0.2310 | 0.0365 | 96 | 72 |
| 41 | 21 | 42 | 0.4950 | 0.0783 | 96 | 72 |
| 42 | 42 | 43 | 0.1650 | 0.0261 | 96 | 72 |
| 43 | 43 | 44 | 0.1650 | 0.0261 | 96 | 72 |
| 44 | 23 | 45 | 0.2970 | 0.0470 | 96 | 72 |
| 45 | 45 | 46 | 0.2970 | 0.0470 | 96 | 72 |
| 46 | 46 | 47 | 0.2970 | 0.0470 | 96 | 72 |
| 47 | 46 | 48 | 0.2310 | 0.0365 | 96 | 72 |
| 48 | 26 | 49 | 0.2970 | 0.0470 | 192 | 144 |
| 49 | 28 | 50 | 0.1980 | 0.0313 | 96 | 72 |
| 50 | 50 | 51 | 0.3630 | 0.0574 | 0 | 0 |
| 51 | 30 | 52 | 0.4950 | 0.0783 | 96 | 72 |
| 52 | 10 | 53 | 0.2970 | 0.0470 | 60 | 45 |
| 53 | 10 | 54 | 0.5940 | 0.0940 | 60 | 45 |
| 54 | 54 | 55 | 0.2970 | 0.0470 | 0 | 0 |
| 55 | 1 | 56 | 0.6660 | 0.2826 | 0 | 0 |
| 56 | 56 | 57 | 1.5540 | 0.6594 | 0 | 0 |
| 57 | 57 | 58 | 1.1100 | 0.4710 | 0 | 0 |
| 58 | 58 | 59 | 0.3330 | 0.1413 | 0 | 0 |
| 59 | 59 | 60 | 0.3441 | 0.1460 | 1200 | 900 |
| 60 | 57 | 61 | 0.8250 | 0.1305 | 240 | 180 |
| 61 | 58 | 62 | 1.1550 | 0.1827 | 240 | 180 |
| 62 | 1 | 63 | 1.0560 | 0.7128 | 2400 | 1800 |
| 63 | 1 | 64 | 0.3960 | 0.2673 | 0 | 0 |
| 64 | 64 | 65 | 0.0990 | 0.0668 | 0 | 0 |
| 65 | 65 | 66 | 0.8580 | 0.1357 | 240 | 180 |
| 66 | 66 | 67 | 0.6930 | 0.1096 | 0 | 0 |
| 67 | 67 | 68 | 1.0230 | 0.1618 | 240 | 180 |
| 68 | 68 | 69 | 0.8910 | 0.1409 | 0 | 0 |
| 69 | 69 | 70 | 1.1550 | 0.1827 | 0 | 0 |
| 70 | 70 | 71 | 0.6930 | 0.1096 | 0 | 0 |
| 71 | 71 | 72 | 0.7590 | 0.1201 | 60 | 45 |
| 72 | 72 | 73 | 0.6600 | 0.1044 | 60 | 45 |
| 73 | 67 | 74 | 0.7260 | 0.1148 | 0 | 0 |
| 74 | 74 | 75 | 1.0230 | 0.1618 | 240 | 180 |
| 75 | 75 | 76 | 0.8910 | 0.1409 | 0 | 0 |
| 76 | 76 | 77 | 0.4950 | 0.0783 | 96 | 72 |
| 77 | 65 | 78 | 0.3663 | 0.1554 | 0 | 0 |
| 78 | 78 | 79 | 0.2220 | 0.0942 | 0 | 0 |
| 79 | 79 | 80 | 0.1980 | 0.0313 | 0 | 0 |
| 80 | 80 | 81 | 0.4620 | 0.0731 | 0 | 0 |
| 81 | 81 | 82 | 0.2640 | 0.0418 | 0 | 0 |
| 82 | 82 | 83 | 0.3630 | 0.0574 | 0 | 0 |
| 83 | 83 | 84 | 0.4950 | 0.0783 | 60 | 45 |
| 84 | 84 | 85 | 1.0890 | 0.1723 | 240 | 180 |
| 85 | 85 | 86 | 0.6600 | 0.1044 | 240 | 180 |
| 86 | 78 | 87 | 2.9700 | 0.4698 | 240 | 180 |
| 87 | 79 | 88 | 0.3630 | 0.0574 | 240 | 180 |
| 88 | 80 | 89 | 0.9240 | 0.1462 | 0 | 0 |
| 89 | 89 | 90 | 0.4620 | 0.0731 | 60 | 45 |
| 90 | 81 | 91 | 0.6270 | 0.0992 | 96 | 72 |
| 91 | 82 | 92 | 0.1650 | 0.0261 | 38.4 | 28.8 |
| 92 | 83 | 93 | 0.2310 | 0.0365 | 60 | 45 |
| 93 | 1 | 94 | 0.6549 | 0.2779 | 0 | 0 |
| 94 | 94 | 95 | 0.6660 | 0.2826 | 0 | 0 |
| 95 | 95 | 96 | 1.8870 | 0.8007 | 0 | 0 |
| 96 | 96 | 97 | 0.0999 | 0.0424 | 768 | 576 |
| 97 | 97 | 98 | 0.8580 | 0.1357 | 0 | 0 |
| 98 | 98 | 99 | 2.0460 | 0.3236 | 0 | 0 |
| 99 | 99 | 100 | 0.2970 | 0.0470 | 0 | 0 |
| 100 | 100 | 101 | 0.6930 | 0.1096 | 0 | 0 |
| 101 | 101 | 102 | 0.7260 | 0.1148 | 151.2 | 113.4 |
| 102 | 102 | 103 | 0.8250 | 0.1305 | 0 | 0 |
| 103 | 103 | 104 | 0.8250 | 0.1305 | 0 | 0 |
| 104 | 104 | 105 | 0.8580 | 0.1357 | 240 | 180 |
| 105 | 95 | 106 | 0.2970 | 0.0470 | 240 | 180 |
| 106 | 99 | 107 | 0.7260 | 0.1148 | 151.2 | 113.4 |
| 107 | 102 | 108 | 0.0990 | 0.0157 | 240 | 180 |
References
- Chen, T.; Zhang, X.-P.; Wang, J.; Li, J.; Wu, C.; Hu, M.; Bian, H. A Review on Electric Vehicle Charging Infrastructure Development in the UK. J. Mod. Power Syst. Clean Energy 2020, 8, 193–205. [Google Scholar] [CrossRef]
- Deb, S.; Tammi, K.; Kalita, K.; Mahanta, P. Impact of Electric Vehicle Charging Station Load on Distribution Network. Energies 2018, 11, 178. [Google Scholar] [CrossRef]
- Nandi, S.; Ghatak, S.R.; Acharjee, P. Multi-Scenario Based Optimal Planning of Distribution Network Considering Fast Electric Vehicle Charging Station. In Proceedings of the 2024 IEEE 4th International Conference on Sustainable Energy and Future Electric Transportation (SEFET), Hyderabad, India, 31 July–3 August 2024; pp. 1–6. [Google Scholar]
- Agrawal, S.; Soni, R. Renewable Energy: Sources, Importance and Prospects for Sustainable Future. In Energy; Singh, P., Singh, S., Kumar, G., Baweja, P., Eds.; Wiley: Hoboken, NJ, USA, 2021; pp. 131–150. ISBN 978-1-119-74144-2. [Google Scholar]
- Nandi, S.; Ghatak, S.R.; Sannigrahi, S.; Acharjee, P. Coordinated Planning and Operation of PV- Hydrogen Integrated Distribution Network Incorporating Daily-Seasonal Green Hydrogen Storage and EV Charging Station. Int. J. Hydrogen Energy 2024, 90, 134–158. [Google Scholar] [CrossRef]
- He, H.; Lu, Z.; Guo, X.; Shi, C.; Jia, D.; Chen, C.; Guerrero, J. Optimized Control Strategy for Photovoltaic Hydrogen Generation System with Particle Swarm Algorithm. Energies 2022, 15, 1472. [Google Scholar] [CrossRef]
- Ferminus Raj, A.; Gnana Saravanan, A. An Optimization Approach for Optimal Location & Size of DSTATCOM and DG. Appl. Energy 2023, 336, 120797. [Google Scholar] [CrossRef]
- Sayed, M.A.; Atallah, R.; Assi, C.; Debbabi, M. Electric Vehicle Attack Impact on Power Grid Operation. Int. J. Electr. Power Energy Syst. 2022, 137, 107784. [Google Scholar] [CrossRef]
- Kanojia, S.; Suthar, B.N. Voltage Stability Analysis in Modern Power System Considering Wind Energy Conversion System. In Proceedings of the 2023 IEEE IAS Global Conference on Emerging Technologies (GlobConET), London, UK, 19–21 May 2023; pp. 1–7. [Google Scholar]
- Liang, X.; Chai, H.; Ravishankar, J. Analytical Methods of Voltage Stability in Renewable Dominated Power Systems: A Review. Electricity 2022, 3, 75–107. [Google Scholar] [CrossRef]
- Ghatak, S.R.; Basu, D.; Acharjee, P. Voltage Profile Improvement and Loss Reduction Using Optimal Allocation of SVC. In Proceedings of the 2015 Annual IEEE India Conference (INDICON), New Delhi, India, 17–20 December 2015; pp. 1–6. [Google Scholar]
- Paredes, L.A.; Molina, M.G.; Serrano, B.R. Enhancing Dynamic Voltage Stability in Resilient Microgrids Using FACTS Devices. IEEE Access 2023, 11, 66150–66176. [Google Scholar] [CrossRef]
- Pagidipala, S.; Sandeep, V. Optimal Planning of Electric Vehicle Charging Stations and Distributed Generators with Network Reconfiguration in Smart Distribution Networks Considering Uncertainties. Meas. Sens. 2024, 36, 101400. [Google Scholar] [CrossRef]
- Yuvaraj, T.; Suresh, T.D.; Meyyappan, U.; Aljafari, B.; Thanikanti, S.B. Optimizing the Allocation of Renewable DGs, DSTATCOM, and BESS to Mitigate the Impact of Electric Vehicle Charging Stations on Radial Distribution Systems. Heliyon 2023, 9, e23017. [Google Scholar] [CrossRef]
- Tiwari, D.; Ghatak, S.R. Performance Enhancement of Distribution System Using Optimal Allocation of Distributed Generation & DSTATCOM. In Proceedings of the 2017 International Conference on Innovative Mechanisms for Industry Applications (ICIMIA), Bengaluru, India, 21–23 February 2017; pp. 533–538. [Google Scholar]
- Roy Ghatak, S.; Sannigrahi, S.; Acharjee, P. Comparative Performance Analysis of DG and DSTATCOM Using Improved PSO Based on Success Rate for Deregulated Environment. IEEE Syst. J. 2018, 12, 2791–2802. [Google Scholar] [CrossRef]
- Mohanty, A.K.; Babu, P.S.; Salkuti, S.R. Fuzzy-Based Simultaneous Optimal Placement of Electric Vehicle Charging Stations, Distributed Generators, and DSTATCOM in a Distribution System. Energies 2022, 15, 8702. [Google Scholar] [CrossRef]
- B. C., S.; A., U.; R. S., G. Optimal Planning of PV Sources and D-STATCOM Devices with Network Reconfiguration Employing Modified Ant Lion Optimizer. Energies 2024, 17, 2238. [Google Scholar] [CrossRef]
- Sannigrahi, S.; Ghatak, S.R.; Basu, D.; Acharjee, P. Optimal Placement of DSTATCOM, DG and Their Performance Analysis in Deregulated Power System. Int. J. Power Energy Convers. 2019, 10, 105. [Google Scholar] [CrossRef]
- Jin, Y.; Acquah, M.A.; Seo, M.; Han, S. Optimal Siting and Sizing of EV Charging Station Using Stochastic Power Flow Analysis for Voltage Stability. IEEE Trans. Transp. Electrif. 2023, 10, 777–794. [Google Scholar] [CrossRef]
- Krishnamurthy, N.K.; Sabhahit, J.N.; Jadoun, V.K.; Gaonkar, D.N.; Shrivastava, A.; Rao, V.S.; Kudva, G. Optimal Placement and Sizing of Electric Vehicle Charging Infrastructure in a Grid-Tied DC Microgrid Using Modified TLBO Method. Energies 2023, 16, 1781. [Google Scholar] [CrossRef]
- Sengor, I.; Erenoglu, A.K.; Guldorum, H.C.; Erdinc, O.; Taşcıkaraoğlu, A.; Taştan, İ.C.; Büyük, A.F.; Catalão, J.P.S. Optimal Sizing and Siting of Different Types of EV Charging Stations in a Real Distribution System Environment. IET Renew. Power Gener. 2022, 16, 3171–3183. [Google Scholar] [CrossRef]
- Chen, L.; Xu, C.; Song, H.; Jermsittiparsert, K. Optimal Sizing and Sitting of EVCS in the Distribution System Using Metaheuristics: A Case Study. Energy Rep. 2021, 7, 208–217. [Google Scholar] [CrossRef]
- Pal, A.; Bhattacharya, A.; Chakraborty, A.K. Allocation of EV Fast Charging Station with V2G Facility in Distribution Network. In Proceedings of the 2019 8th International Conference on Power Systems (ICPS), Jaipur, India, 20–22 December 2019; pp. 1–6. [Google Scholar]
- Jamatia, P.; Bhattacharjee, S.; Sharma, S. Optimal Allocation of EV Charging Station in Distribution Network. In Proceedings of the 2022 4th International Conference on Energy, Power and Environment (ICEPE), Shillong, India, 29 April–1 May 2022; pp. 1–6. [Google Scholar]
- Karmaker, A.K.; Hossain, M.A.; Pota, H.R.; Onen, A.; Jung, J. Energy Management System for Hybrid Renewable Energy-Based Electric Vehicle Charging Station. IEEE Access 2023, 11, 27793–27805. [Google Scholar] [CrossRef]
- Kumar, N.; Kumar, T.; Nema, S.; Thakur, T. A Comprehensive Planning Framework for Electric Vehicles Fast Charging Station Assisted by Solar and Battery Based on Queueing Theory and Non-Dominated Sorting Genetic Algorithm-II in a Co-Ordinated Transportation and Power Network. J. Energy Storage 2022, 49, 104180. [Google Scholar] [CrossRef]
- Ahmad, F.; Iqbal, A.; Asharf, I.; Marzband, M.; Khan, I. Placement and Capacity of EV Charging Stations by Considering Uncertainties With Energy Management Strategies. IEEE Trans. Ind. Appl. 2023, 59, 3865–3874. [Google Scholar] [CrossRef]
- El-Ela, A.A.A.; Mouwafi, M.T.; Elbaset, A.A. Optimal Combination of DGs and Capacitor Banks for Performance Enhancement of Distribution Systems. In Modern Optimization Techniques for Smart Grids; Springer International Publishing: Cham, Switzerland, 2023; pp. 141–176. ISBN 978-3-030-96024-7. [Google Scholar]
- Ćetković, D.; Komen, V. Optimal Distributed Generation and Capacitor Bank Allocation and Sizing at Two Voltage Levels. IEEE Syst. J. 2023, 17, 5831–5841. [Google Scholar] [CrossRef]
- Pal, A.; Bhattacharya, A.; Chakraborty, A.K. Planning of EV Charging Station With Distribution Network Expansion Considering Traffic Congestion and Uncertainties. IEEE Trans. Ind. Appl. 2023, 59, 3810–3825. [Google Scholar] [CrossRef]
- Yuvaraj, T.; Devabalaji, K.R.; Thanikanti, S.B.; Aljafari, B.; Nwulu, N. Minimizing the Electric Vehicle Charging Stations Impact in the Distribution Networks by Simultaneous Allocation of DG and DSTATCOM with Considering Uncertainty in Load. Energy Rep. 2023, 10, 1796–1817. [Google Scholar] [CrossRef]
- Saw, B.K.; Bohre, A.K.; Jobanputra, J.H.; Kolhe, M.L. Solar-DG and DSTATCOM Concurrent Planning in Reconfigured Distribution System Using APSO and GWO-PSO Based on Novel Objective Function. Energies 2022, 16, 263. [Google Scholar] [CrossRef]
- Mahdad, B. Towards Sustainable Integration of STATCOM and DGs Based Radial Distribution Systems Using Dynamic Adaptive Aquila Optimizer. Process Integr. Optim. Sustain. 2023, 7, 381–405. [Google Scholar] [CrossRef]
- Montoya, O.D.; Molina-Cabrera, A.; Giral-Ramírez, D.A.; Rivas-Trujillo, E.; Alarcón-Villamil, J.A. Optimal Integration of D-STATCOM in Distribution Grids for Annual Operating Costs Reduction via the Discrete Version Sine-Cosine Algorithm. Results Eng. 2022, 16, 100768. [Google Scholar] [CrossRef]
- Sen, D.; Ghatak, S.R.; Acharjee, P. Optimal Allocation of Static VAR Compensator by a Hybrid Algorithm. Energy Syst. 2019, 10, 677–719. [Google Scholar] [CrossRef]
- Nandi, S.; Ghatak, S.R.; Acharjee, P.; Lopes, F. Multi-Scenario-Based Strategic Deployment of Electric Vehicle Ultra-Fast Charging Stations in a Radial Distribution Network. Energies 2024, 17, 4204. [Google Scholar] [CrossRef]
- Dolatabadi, S.H.; Ghorbanian, M.; Siano, P.; Hatziargyriou, N.D. An Enhanced IEEE 33 Bus Benchmark Test System for Distribution System Studies. IEEE Trans. Power Syst. 2021, 36, 2565–2572. [Google Scholar] [CrossRef]
- Meena, N.K.; Swarnkar, A.; Gupta, N.; Niazi, K.R. Optimal Integration of DERs in Coordination with Existing VRs in Distribution Networks. IET Gener. Transm. Distrib. 2018, 12, 2520–2529. [Google Scholar] [CrossRef]
- Gupta, R.S.; Anand, Y.; Tyagi, A.; Anand, S. Sustainable Charging Station Allocation in the Distribution System for Electric Vehicles Considering Technical, Economic, and Societal Factors. J. Energy Storage 2023, 73, 109052. [Google Scholar] [CrossRef]
- Roy Ghatak, S.; Sannigrahi, S.; Acharjee, P. Optimised Planning of Distribution Network with Photovoltaic System, Battery Storage, and DSTATCOM. IET Renew. Power Gener. 2018, 12, 1823–1832. [Google Scholar] [CrossRef]


| Parameters | Values | Parameters | Values |
|---|---|---|---|
| 45 | $1058/kW | ||
| $824.35/ | $68.35/kVAr | ||
| $941 | 3% of | ||
| $129/ | 3% of | ||
| $29/ | 5% of | ||
| 10 kW | Inf, Int | 5%, 10% | |
| $0.0705/kWh | h, y | 8760 h, 10 years | |
| 0.9 p.u., 1.05 p.u. | r | 10% | |
| 910 kg /MWh | 0.20 | ||
| $9.76/ton | m, n | 0.0002478, 0.2261 |
| Total EVCE Capacity (kW) | ||
|---|---|---|
| Cases | 33-Bus System | 108-Bus System |
| Case I | 590 | 1210 |
| Case II | 650 | 1270 |
| Case III | 620 | 1250 |
| Case IV | 670 | 1300 |
| 33-Bus Radial DN | ||||
|---|---|---|---|---|
| Cases | () | ) | ) | ) |
| 1 | 3.668 | 1.419 | 0.137 | 5.223 |
| 2 | 4.136 | 1.234 | 0.125 | 5.495 |
| 3 | 3.679 | 1.296 | 0.136 | 5.111 |
| 4 | 4.335 | 1.049 | 0.123 | 5.509 |
| 108-Bus Radial DN | ||||
|---|---|---|---|---|
| Case | () | ) | ) | ) |
| 1 | 7.685 | 2.949 | 0.457 | 11.091 |
| 2 | 8.108 | 2.586 | 0.409 | 11.108 |
| 3 | 7.928 | 2.684 | 0.415 | 11.027 |
| 4 | 8.537 | 2.321 | 0.378 | 11.235 |
| Cases | Total Carbon Emissions ) | Cases | Total Carbon Emissions () |
|---|---|---|---|
| 1 | 36.81 | 1 | 121.33 |
| 2 | 33.24 | 2 | 108.73 |
| 3 | 36.02 | 3 | 112.14 |
| 4 | 32.17 | 4 | 100.44 |
Disclaimer/Publisher’s Note: The statements, opinions and data contained in all publications are solely those of the individual author(s) and contributor(s) and not of MDPI and/or the editor(s). MDPI and/or the editor(s) disclaim responsibility for any injury to people or property resulting from any ideas, methods, instructions or products referred to in the content. |
© 2025 by the authors. Licensee MDPI, Basel, Switzerland. This article is an open access article distributed under the terms and conditions of the Creative Commons Attribution (CC BY) license (https://creativecommons.org/licenses/by/4.0/).
Share and Cite
Bonela, R.; Roy Ghatak, S.; Swain, S.C.; Lopes, F.; Nandi, S.; Sannigrahi, S.; Acharjee, P. Analysis of Techno–Economic and Social Impacts of Electric Vehicle Charging Ecosystem in the Distribution Network Integrated with Solar DG and DSTATCOM. Energies 2025, 18, 363. https://doi.org/10.3390/en18020363
Bonela R, Roy Ghatak S, Swain SC, Lopes F, Nandi S, Sannigrahi S, Acharjee P. Analysis of Techno–Economic and Social Impacts of Electric Vehicle Charging Ecosystem in the Distribution Network Integrated with Solar DG and DSTATCOM. Energies. 2025; 18(2):363. https://doi.org/10.3390/en18020363
Chicago/Turabian StyleBonela, Ramesh, Sriparna Roy Ghatak, Sarat Chandra Swain, Fernando Lopes, Sharmistha Nandi, Surajit Sannigrahi, and Parimal Acharjee. 2025. "Analysis of Techno–Economic and Social Impacts of Electric Vehicle Charging Ecosystem in the Distribution Network Integrated with Solar DG and DSTATCOM" Energies 18, no. 2: 363. https://doi.org/10.3390/en18020363
APA StyleBonela, R., Roy Ghatak, S., Swain, S. C., Lopes, F., Nandi, S., Sannigrahi, S., & Acharjee, P. (2025). Analysis of Techno–Economic and Social Impacts of Electric Vehicle Charging Ecosystem in the Distribution Network Integrated with Solar DG and DSTATCOM. Energies, 18(2), 363. https://doi.org/10.3390/en18020363