Article

The Effects of Pilot Structure on the Lean Ignition Characteristics of the Internally Staged Combustor

1
School of Power and Energy, Northwestern Polytechnical University, Xi’an 710129, China
2
Department of Combustion Research, AECC Hunan Aviation Power Plant Research Institute, Zhuzhou 412002, China
*
Author to whom correspondence should be addressed.
Energies 2025, 18(2), 349; https://doi.org/10.3390/en18020349
Submission received: 28 August 2024 / Revised: 13 September 2024 / Accepted: 16 September 2024 / Published: 15 January 2025
(This article belongs to the Section I2: Energy and Combustion Science)

Abstract

:
In order to explore the influence of pilot structure on the lean ignition characteristics in a certain type of internally staged combustor, the current study was conducted on the effects of the auxiliary fuel nozzle diameter, the rotating direction of the pilot swirler, and the swirl number on the lean ignition fuel–gas ratio limit, combining numerical simulation and experimental validation. The optimization potential of the mixing structure of this type of internally staged combustor was further explored. It indicated that the lean ignition fuel–gas ratio limit was significantly influenced by the diameter of the auxiliary fuel nozzles the swirl number of the pilot swirler and the combination of the same rotating direction for both pilot swirlers, while the mass flow rate of air was constant. Increasing the diameter of the auxiliary fuel path nozzles (0.4~0.6 mm) and having excessively higher or lower swirl numbers of the pilot module primary swirlers are not conducive to broadening the lean ignition boundary. Compared with the two-stage pilot swirler with the same rotation combination, the fuel–gas ignition performance of the two-stage pilot swirler with the opposite rotation combination is better. Under the typical working conditions (the air mass flow rate is 46.7 g/s and the ignition energy is 4 J), for a pilot swirler with a rotating direction opposite to the main swirler, the diameter of the auxiliary fuel nozzles is 0.2 mm, the swirl number of first-stage of pilot swirler is 1.4, and the lean ignition fuel–air ratio was reduced to 0.0121, which is 32.78% lower than the baseline scheme, which further broadens the lean ignition boundary of the centrally staged combustion chamber.

1. Introduction

With the global increase in environmental awareness, the emission standards for aircraft engines are becoming more stringent. Traditional combustor designs face challenges in balancing efficient combustion with low-pollution emissions [1,2,3]. To address this issue, the internally staged combustor has garnered significant attention. This combustor utilizes multiple, swirling internally staged technologies that, via staged fuel supply and combustion zoning, meet the broadening operational scope and stricter emission regulations of modern engines. The internally staged combustor is one of the advanced low-pollution combustors designed to meet the aircraft engine demands for high thrust-to-weight ratios and low emissions. Currently, significant progress has been made in the study of emission characteristics of centrally staged combustors. Companies like GE, PW, R-R, and other researchers worldwide have extensively studied NOx control as a key topic [4,5,6,7,8,9]. However, due to the stratified swirl in the main and premixing stages, ignition in internally staged combustors is more challenging than in conventional ones. Researchers [10,11,12,13,14,15,16,17,18,19] have conducted extensive studies on the ignition process of internally staged combustors. Although the lean combustion technology used by these combustors achieves low emissions, ignition under lean conditions is difficult. For aircraft engines, lean ignition performance is crucial for reliable operation, and improving lean ignition performance and broadening the stable operation range under lean conditions is a primary focus for researchers. The fuel–air ratio for lean ignition is a critical parameter for evaluating the ignition performance of the combustor.
Kobayashi M et al. [20] studied the impact of fuel distribution at the premixing stage outlet on ignition performance under normal temperature and pressure conditions. The presence of a recirculation or low-velocity zone formed by the swirl effect at the combustor head outlet center improves ignition performance as more fuel mist is distributed in this area. Fu Zhenbai et al. [21] experimentally investigated the impact of the step height between the main and premixing stages on the ignition performance of a lean internally staged combustor, finding that a larger step height broadened the lean ignition boundary under the same total pressure drop at the flame tube inlet and outlet. Wu Haowei et al. [22] discovered that the ignition performance with a swirl scheme in the premixing stage is superior to a non-swirling scheme; the latter disrupts the recirculation zone structure and fuel core area distribution, hindering core flame group formation and stable recirculation zone flames, and worsening ignition performance. Liu Yan et al. [23] experimentally studied the impact of swirl number in the premixing stage on the ignition performance of the internally staged combustor and obtained the lean ignition boundary. It was found that under the scheme with weak inner and strong outer swirl, sufficient fuel mist distribution near the combustor center axis and the wall ignition nozzle ensures optimal ignition performance, and increasing the inner swirl strength of the premixing stage is not conducive to ignition. Yang Jinhu et al. [24] experimentally studied the impact of different premixing stage head structures on staged combustor ignition performance, finding that increasing the swirl number of standby stage blades gradually worsens ignition performance. Liu Aiguo et al. [25] experimentally studied the ignition characteristics of a combustor with different swirl numbers at the standby stage, discovering that changes in swirl number significantly affect ignition; increasing the swirl number and the difference between the first and second stage swirl numbers improves the ignition characteristics. Liu Wei et al. [26] conducted experimental studies on the combustion performance of internally staged combustors during a standalone operation of the standby stage and a joint operation with the main stage, obtaining combustion patterns under specific experimental conditions. The research shows that during the standalone operation of the standby stage, increasing intake temperature and velocity improves ignition characteristics. Gui Tao et al. [27] experimentally studied the ignition characteristics of different combustor head structures and flame tube diameters at an inlet pressure of 45 kPa, obtaining ignition boundary curves for various operating states. The results indicate that with other structures unchanged, appropriately increasing the flame tube diameter can broaden the lean ignition boundary. Xu Li et al. [28] experimentally studied the ignition–extinction performance of a tri-swirl combustor with eight different swirl angle combinations in the head structure, finding that the inner and middle swirl angles of the swirler play a decisive role in ignition performance, while the outer swirl angle determines the ignition–extinction limit; the lowest lean ignition fuel–air ratio in this combustor is 0.05236.
The aforementioned studies indicate that the head structure of the internally staged combustor significantly affects ignition performance. Research on the impact of the head structures of the pilot stage on lean ignition characteristics is relatively limited, and there is a lack of qualitative studies on the impact of specific structural parameter changes on lean ignition characteristics. In summary, this paper combines numerical simulation with experimental research to focus on the influence of the diameter of the auxiliary fuel path nozzles, the swirl number of the pilot module primary swirlers, and swirl direction combinations of pilot swirlers on the lean ignition boundary. It comprehensively considers the influence patterns of key structural parameters on the ignition performance of internally staged combustors and proposes schemes for optimizing ignition performance, providing strong support for further optimization of internally staged combustor ignition performance.

2. Research Methods

2.1. Numerical Calculation Methods

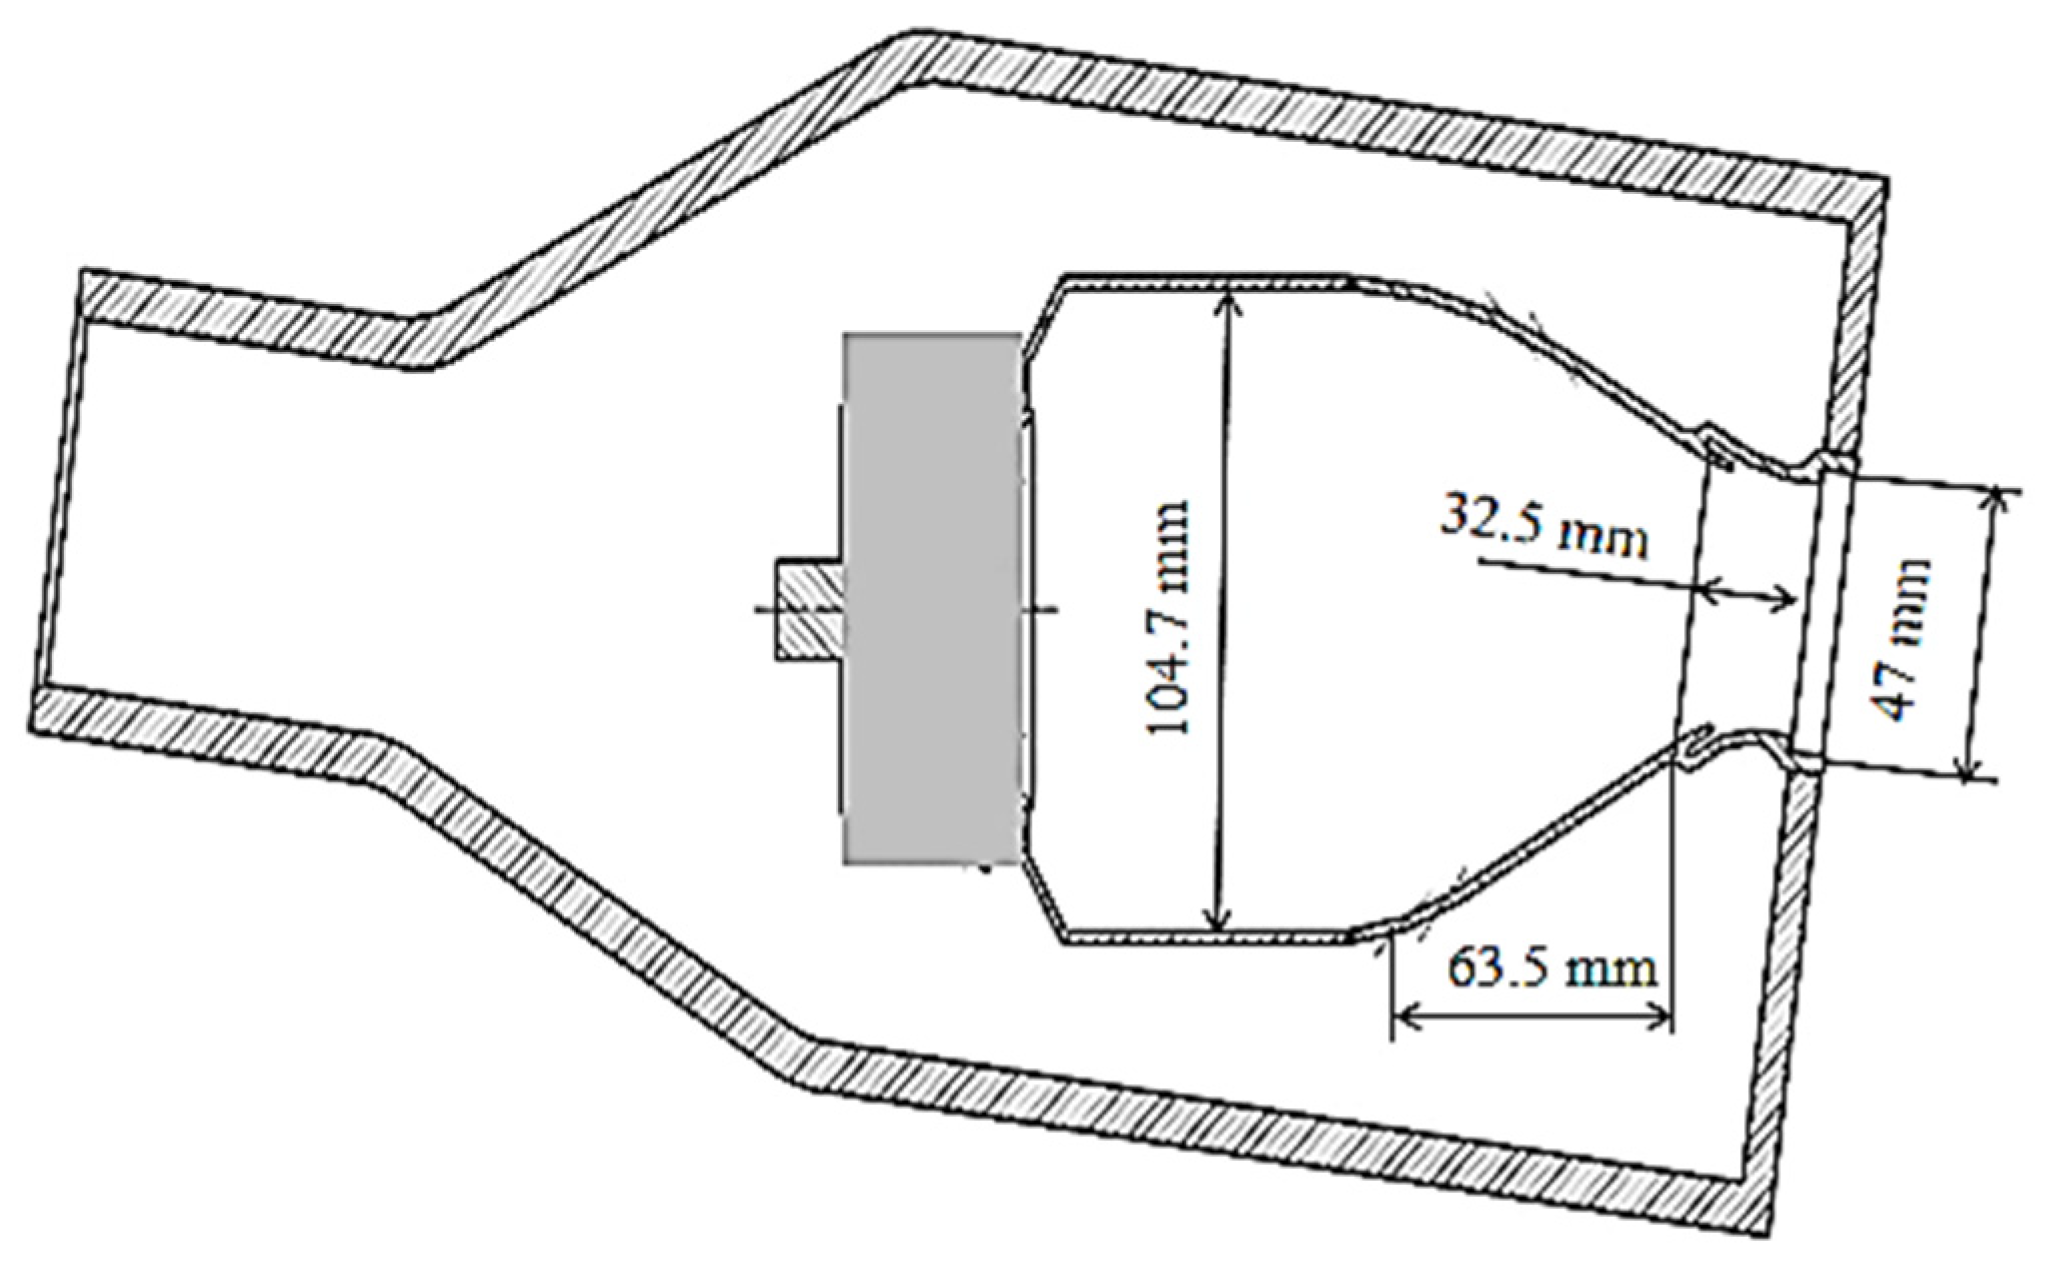
2.1.1. Geometric Model

The typical structure of the internally staged combustor is shown in Figure 1, mainly comprising the main swirler, pilot swirlers, central nozzle, cowling, and film holes. For easy observation of flame propagation and development in the flame tube, the combustor adopts a rectangular structure. The film hole directions form a 25° angle with the flame tube wall, and the auxiliary swirlers are divided into two stages. The fluid calculation domain of this internally staged combustor is shown in Figure 2, where the flame tube is 158.1 mm long and 104.7 mm high, with a contraction section of 63.5 mm in length, and an outlet guide section of 32.5 mm in length. The flame tube outlet is a 47 mm × 96.5 mm rectangle. The key parameters of different head configurations of this internally staged combustor are shown in Table 1; C and U refer to the unoptimized and optimized condition numbers, respectively. C specifically includes C1 to C6, while U includes U1 to U4. C1 to C6 represent operating conditions under different structural parameters. U1 to U4 represent operating conditions under different optimization schemes with C1 as the baseline model.

2.1.2. Model and Boundary Conditions

In this numerical calculation, the flow field in the combustion chamber is computed using a pressure-based implicit segregated solver. The turbulence model selected is the Realizable k-ε model, with the standard wall functions used for near-wall treatment. The pressure–velocity coupling method is the SIMPLE algorithm, and all equations are solved using second-order upwind schemes. The combustion model employed is the Eddy Dissipation Concept (EDC) model. Due to the similar physical and chemical properties of C12H23 to kerosene, it can, to a certain extent, represent the combustion characteristics of kerosene. By using this simplified compound, it is still possible to obtain combustion behavior similar to that of kerosene. Moreover, it simplifies the chemical reaction model and calculations, reducing the number of variables in the simulation and improving computational efficiency. Thus, in numerical simulations, C12H23 is used as a substitute for kerosene, and the chemical reaction mechanism adopts a 10-step, 12-species mechanism for C12H23. The motion trajectory and fuel distribution of kerosene particles in the combustion chamber are simulated using the DPM discrete phase model. The air inlet is set as a mass inlet condition, the combustion chamber outlet is set as a pressure outlet condition with the outlet pressure set to atmospheric pressure, and the combustion chamber walls are set to no-slip adiabatic wall conditions. In this study, the ignition process relies on the spark ignition model. By controlling the ignition timing process, we add an energy source term to the energy equation. Specifically, the ignition radius is 0.002 m, the ignition start time is 1.5 s, the ignition energy is 2 J, and the discharge duration is 0.005 s.

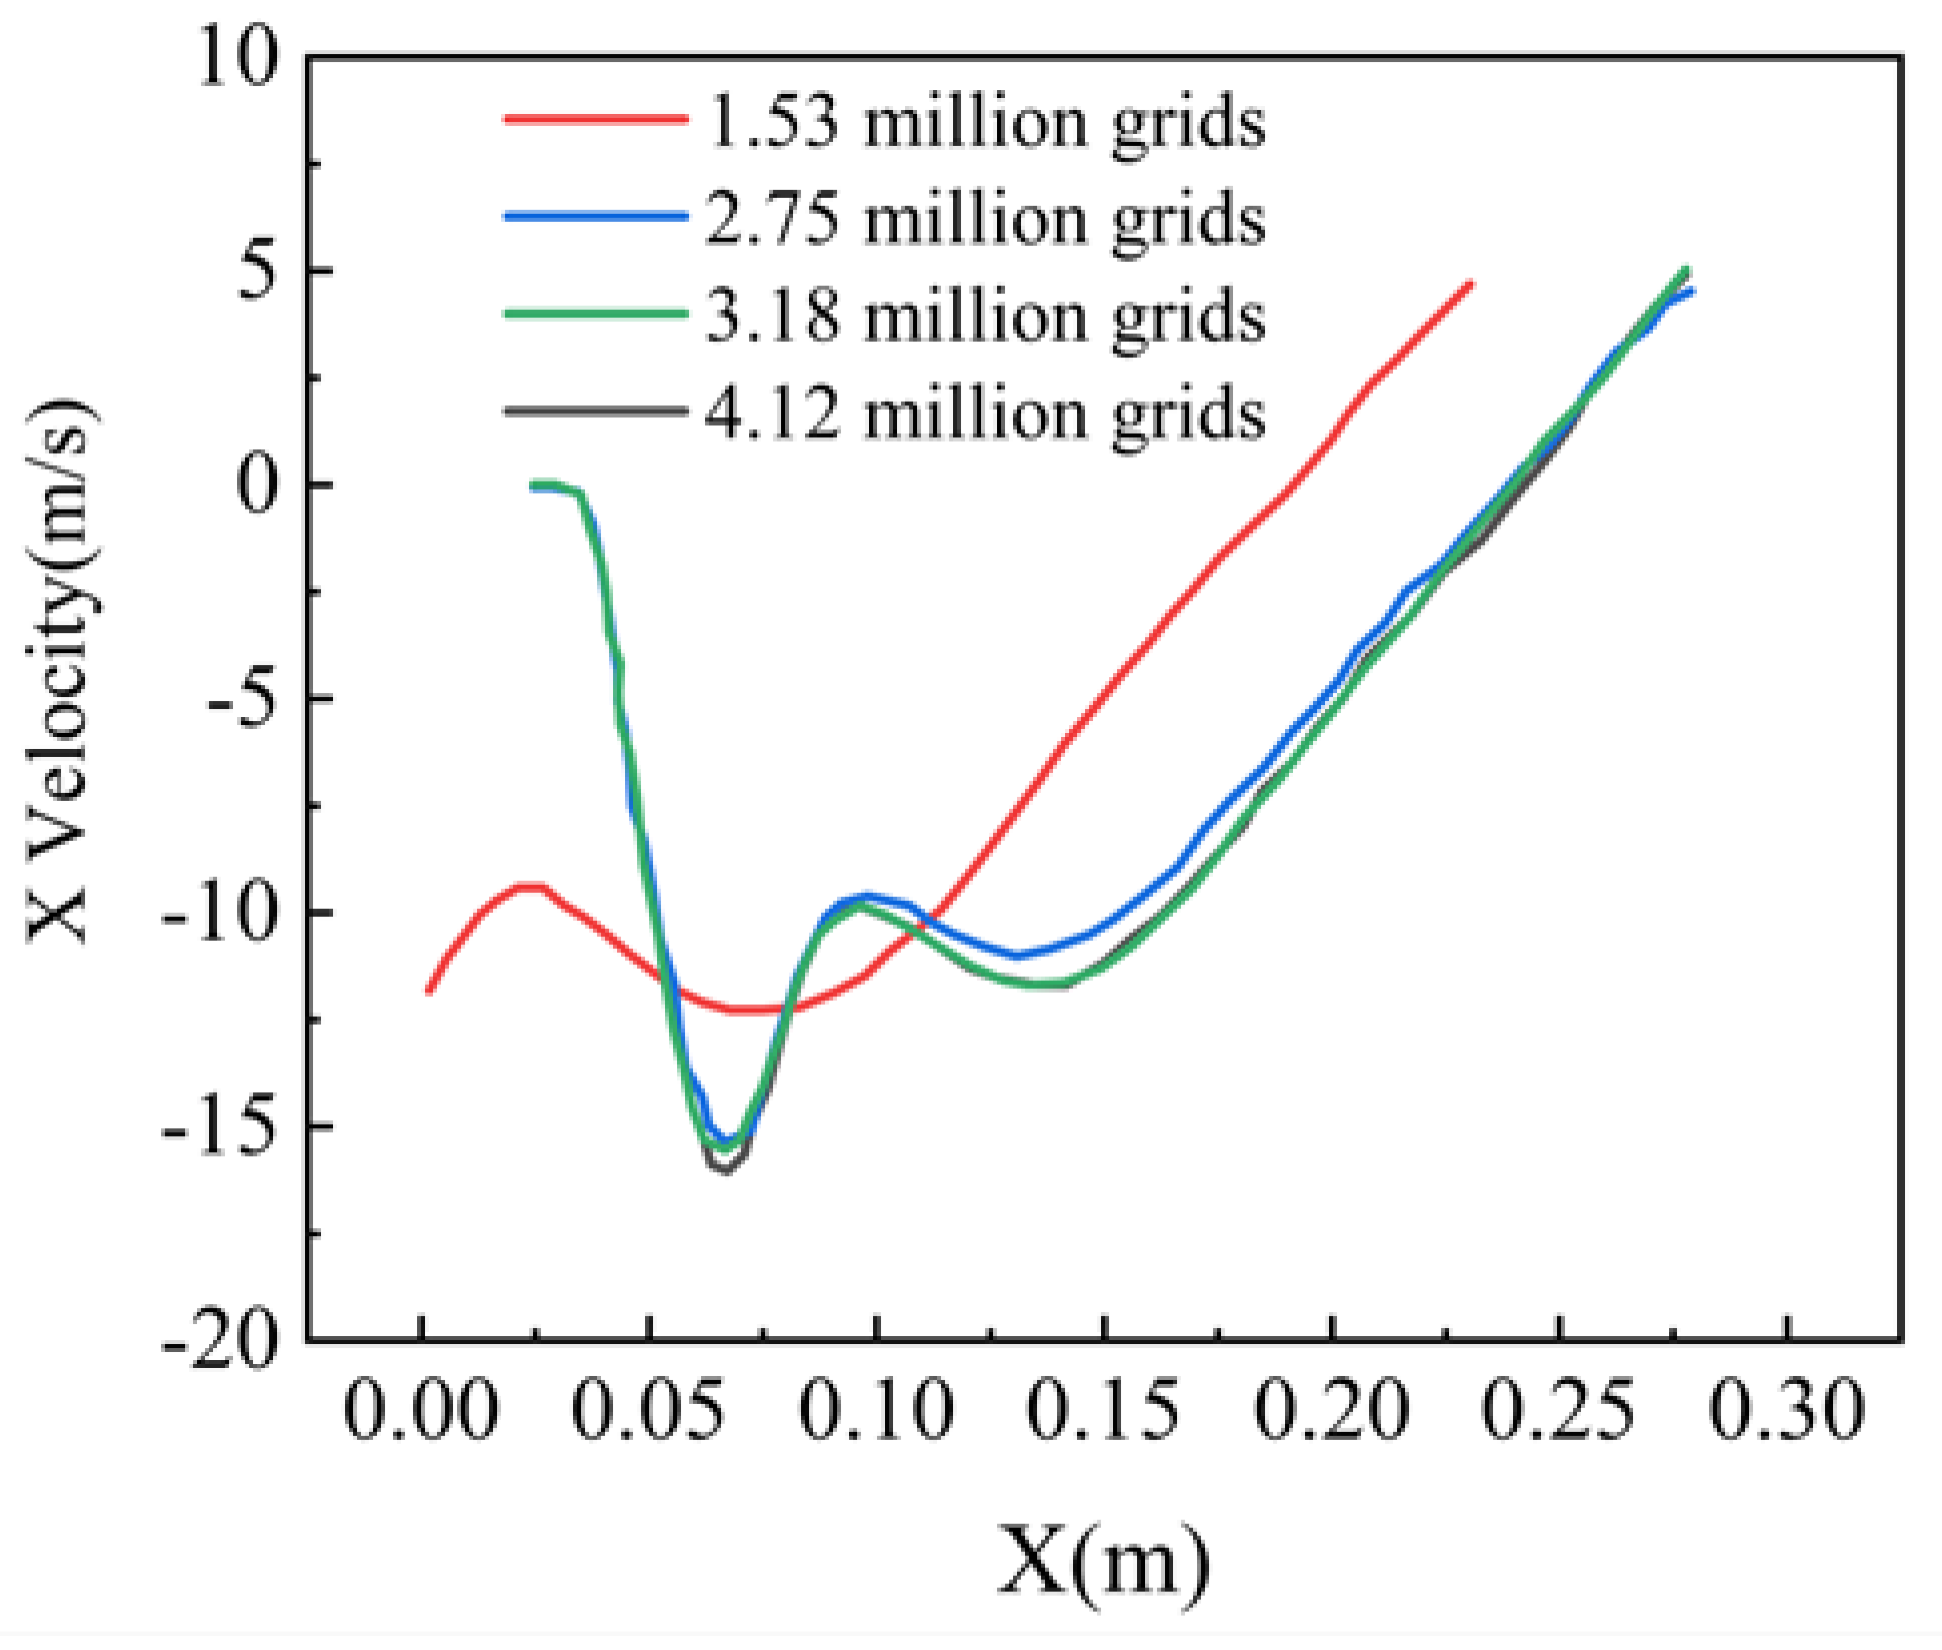
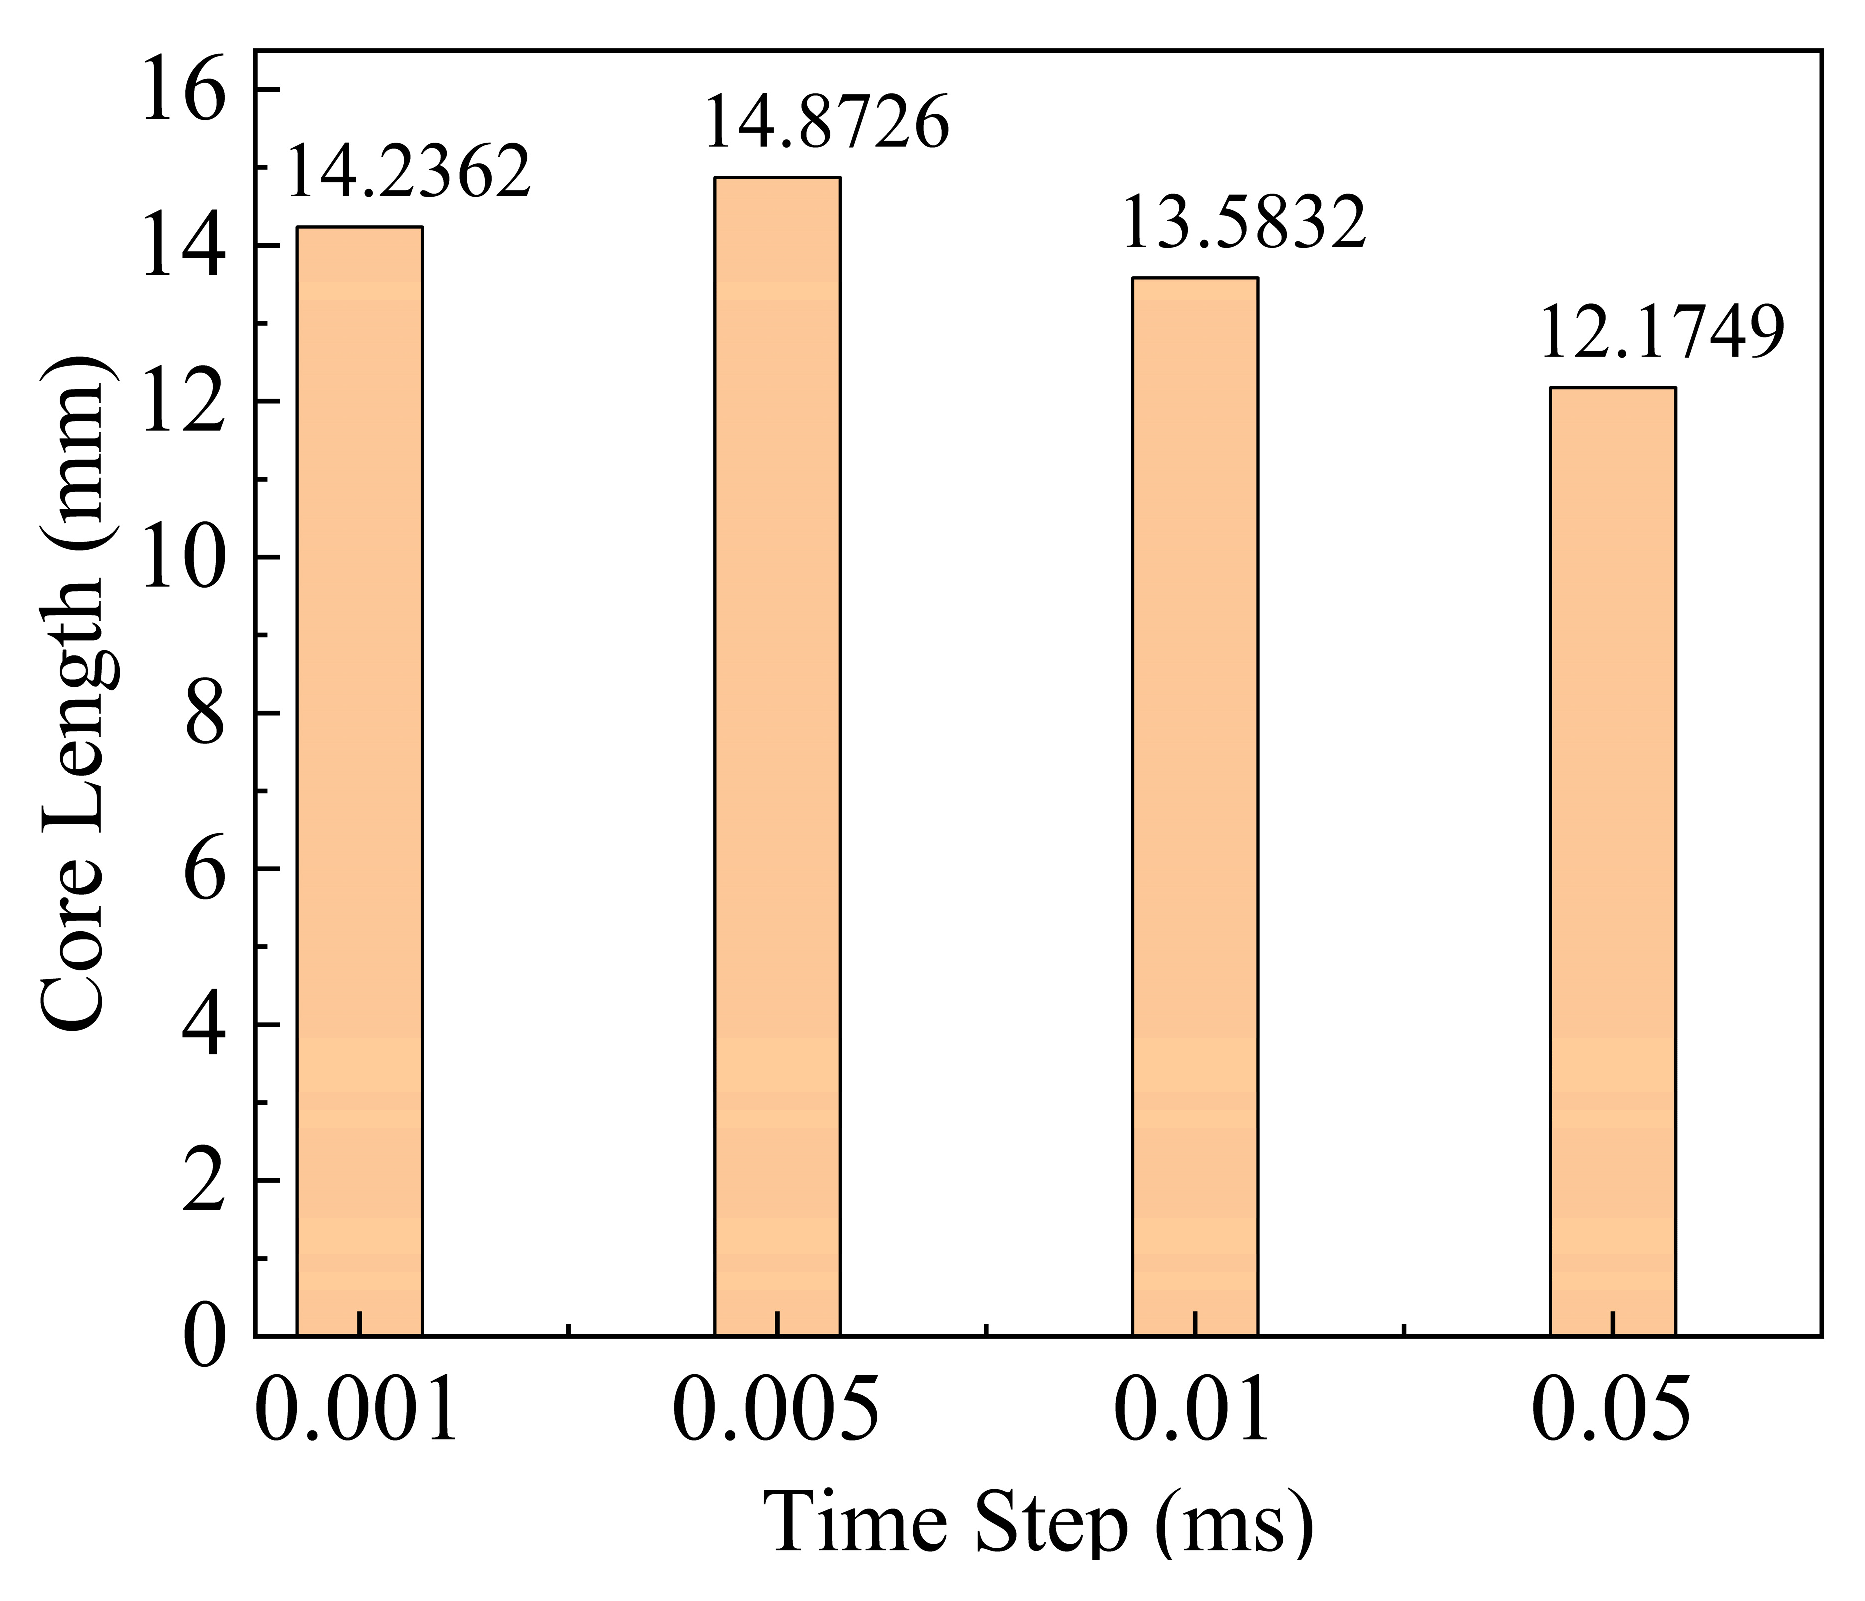
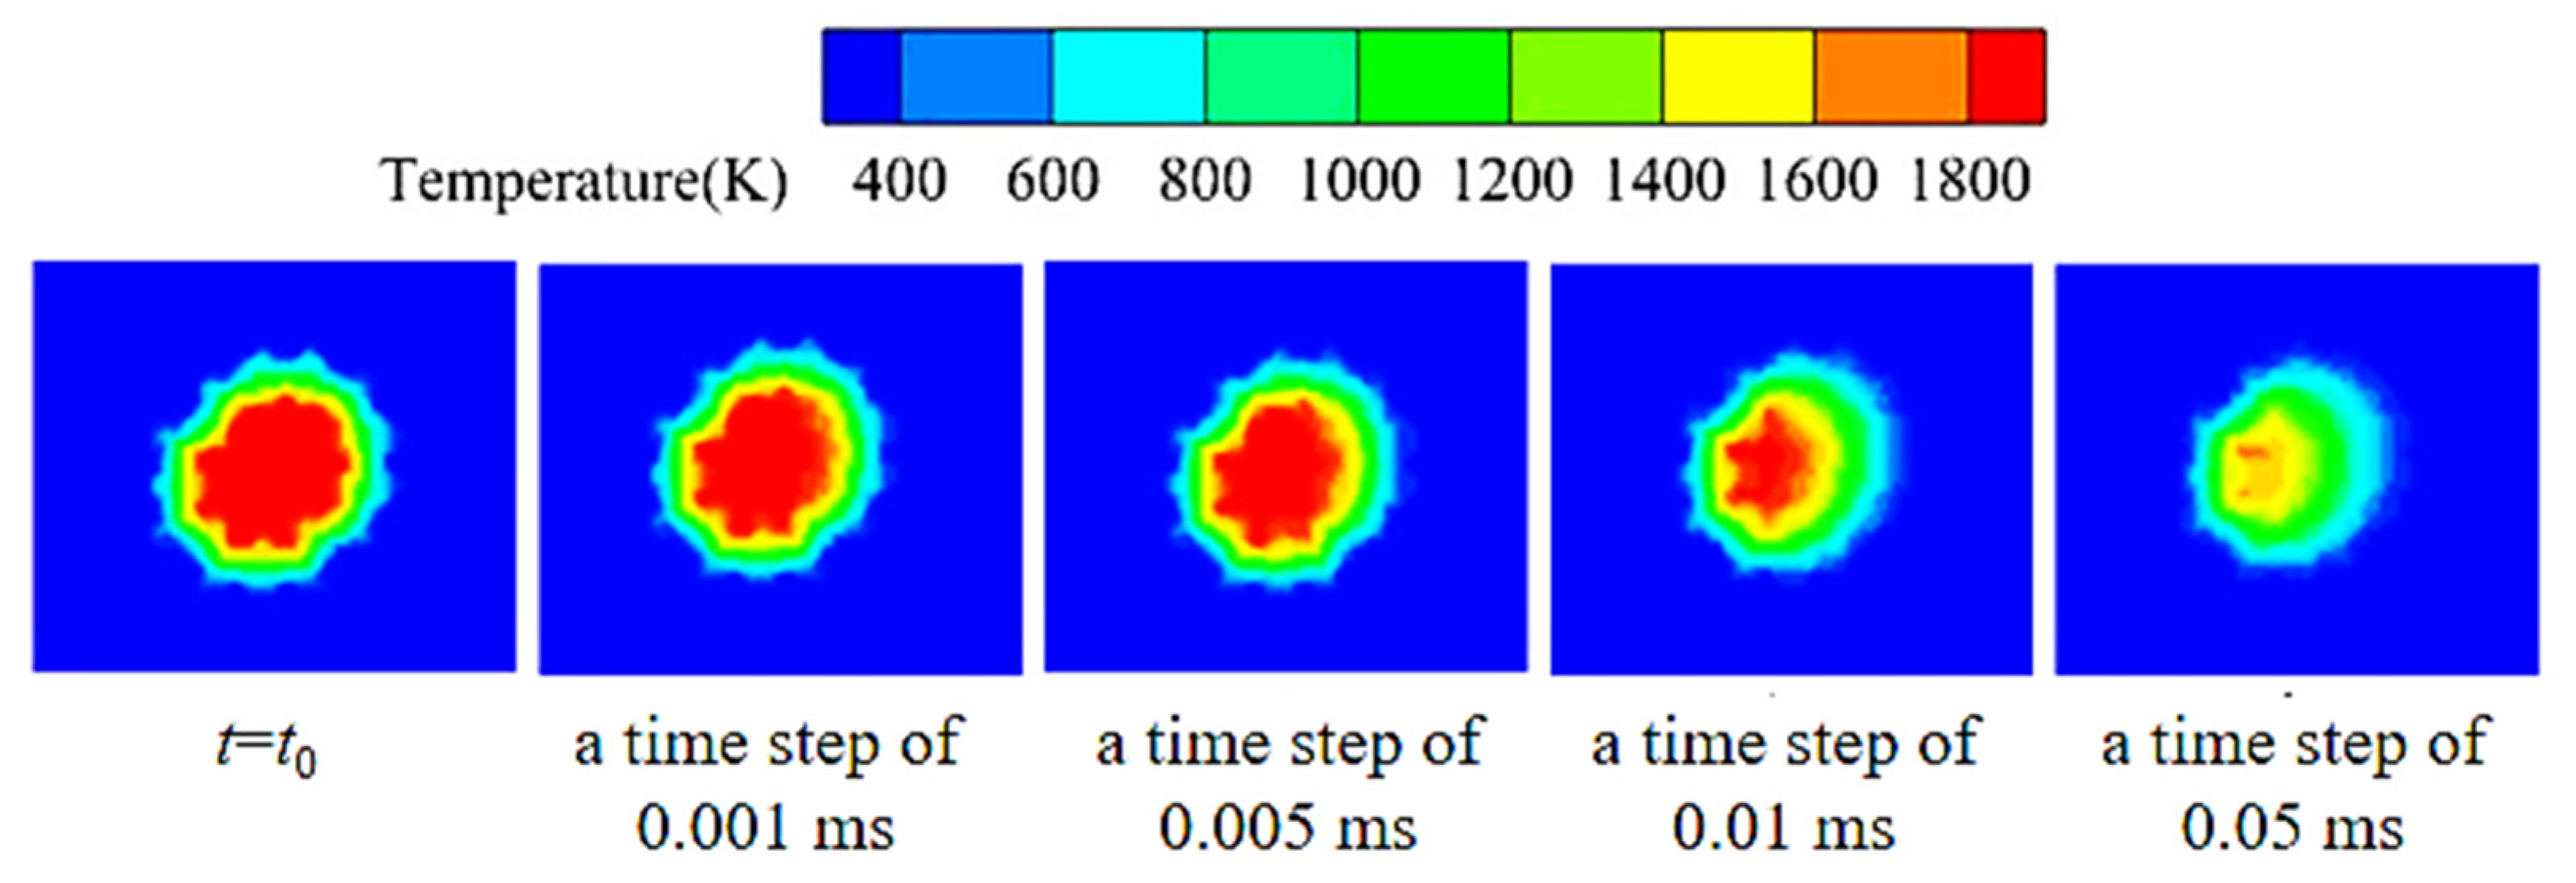
2.1.3. Grid Division and Independence Verification

As shown in Figure 3, the fluid computational domain is divided using polyhedral grids, with local grid refinement applied to the combustion chamber head and flame tube flow field areas using Body of Influence (BOI) technology. The red line represents the densified areas of the flame tube and the vortex generator. We have added annotation marks in the Figure 3. To ensure the accuracy of the calculation results while saving computational resources, grid independence verification is conducted for this computational model. Four different grid quantities, approximately 1.53 million, 2.75 million, 3.18 million, and 4.12 million, are used to numerically simulate the cold-state flow field in the core area of the combustion chamber.
As shown in Figure 4, the axis velocity difference between different grid quantities gradually decreases with the increase in grid number. When 2.75 million grids are used, the grid number meets the computational requirements, and the gap between different grid numbers is within an acceptable range. It can be considered that the calculation results are no longer affected by the grid number, meeting the independence condition. Therefore, 2.75 million grids are ultimately selected for the relevant numerical simulation study.
In unsteady numerical calculations, theoretically, the smaller the time step, the more accurate the turbulent flow field and ignition process. However, a smaller time step greatly increases the computational cost, while a larger time step fails to yield accurate results. In this unsteady turbulent simulation, second-order implicit time-stepping is used, and the time step size can be set based on the CFL criterion to ensure stable numerical convergence. As shown in Equations (1) and (2), the time step is roughly determined to be 0.001 ms. Further time step verification is then conducted, with time steps of 0.001 ms, 0.005 ms, 0.01 ms, and 0.05 ms being taken in turn, and the average temperature of the initial fire core, the radial length of the initial fire core, and the development trend in the initial fire core are shown in Figure 5, Figure 6 and Figure 7.
Δ t = Δ x ( | u | max + c ) C F L
C F L = Δ t ( | u | max + c ) Δ x < 1
In this equation, c is the local speed of sound; umax is the maximum velocity in the flow field; and ∆x is the smallest scale of the grid. In this study, CFL = 0.6 is used to ensure the convergence and stability of numerical calculations.
Figure 5, Figure 6 and Figure 7 show that, compared to the time step of 0.001 ms, the average temperature change is within 10 °C, and the radial length change in the initial fire core is small when the time step is 0.005 ms, which can represent the development process of the initial fire core well while meeting the calculation accuracy. The final time step is set to 0.005 ms.

2.2. Experimental System

The experimental system used in this study is shown in Figure 8. The combustor test section is a staged combustor with a single head, with several measurement points arranged along the flow direction to meet experimental testing needs. Aviation kerosene is supplied to the front end of the combustor nozzle through a constant flow pump to maintain a constant flow rate. The air in the high-pressure tank is introduced through a high-pressure pipeline to provide oxidant for the combustor. The ignition module is a high-energy electric spark ignition system that provides a forced ignition source for the combustor. The control and acquisition instrument controls the opening and closing of the gas and fuel path, outputs the ignition signal, and collects experimental data. The ignition process of the combustion chamber is studied by recording the CH* spontaneous luminescence group within the flame front using a high-speed camera.

3. Verification of Numerical Calculation Method Accuracy

Relevant research results [29,30,31,32,33,34] show that, compared with other turbulence models, the Standard k-ε and Realizable k-ε turbulence models provide simulation results of swirling flow fields that are closer to experimental results. Using different RANS turbulence models to simulate the internally staged swirl flow field, the Realizable k-ε turbulence model is most similar to PIV experimental results, so it is reasonable to adopt this turbulence model.
To further verify the accuracy of this numerical simulation method in calculating the lean ignition fuel–air ratio, a comparative study of experiments and numerical simulations was conducted based on three physical models, C1, C5, and C6. The flow velocities at X = 0.026 m for the C1, C5, and C6 schemes under different air flow rates (46.7 g/s, 83.3 g/s, and 116.6 g/s) are the most stable, making this location suitable for ignition. Numerical simulations verify that this location can achieve successful ignition, and the temperature field distribution is shown in Figure 9. In a word, the specific ignition location is X = 0.026 m; Y = 0; and Z = 0.026.
The injection scheme at this time uses only the central nozzle for fuel injection. The calculation formula for the fuel–air ratio is as follows:
φ l b l = m f , l b l m g , l b l
Among them, fuel refers to C12H23 (kerosene), and gas refers to air (78%N2 + 21%O2). Here, mf,lbl and mg,lbl are the minimum fuel and air mass flow rates that can successfully ignite in the experiment. The lean ignition fuel–air ratio will be the direct indicator for evaluating the lean ignition characteristics of different schemes in this paper.
In the numerical simulation, the lean ignition fuel–air ratio of the combustion chamber is determined by the method of steady-state successive approximation of fuel, fixing the air flow rate, and using the bisection method to continuously narrow the range of lean ignition fuel–air ratio to find the fuel–air ratio that can just achieve successful ignition under each condition. Based on the numerically simulated lean ignition fuel–air ratio, repeated experiments are conducted to adjust the air flow rate and kerosene flow rate to the set flow rate for lean ignition, thereby narrowing the range of lean ignition fuel–air ratio until successful ignition can no longer be achieved. The lean ignition fuel–air ratio with stable flame combustion in the recirculation zone is the lean ignition boundary obtained from the experiment and serves as the criterion. The flame development processes of successful and failed ignitions recorded by a high-speed camera are shown in Figure 10 and Figure 11. To avoid the contingency of successful ignition, repeated experiments are conducted near the ignition boundary to find the minimum ignition fuel–air ratio for each successful ignition, which is the experimentally obtained lean boundary, as shown in Figure 12.
In this study, we will describe the characteristics of lean combustion ignition using the lean ignition fuel-to-air ratio limit. Therefore, it is adequate to conduct a comparison between numerical simulations and experimental results based solely on the lean ignition fuel-to-air ratio limit. The lean ignition fuel–air ratios obtained from experiments and numerical calculations under different air flow rates are shown in Table 2. The maximum gap between the experimental values and the numerical simulation results is within 10%, verifying that the numerical simulation method has a certain degree of accuracy and reasonableness.

4. Results and Discussion

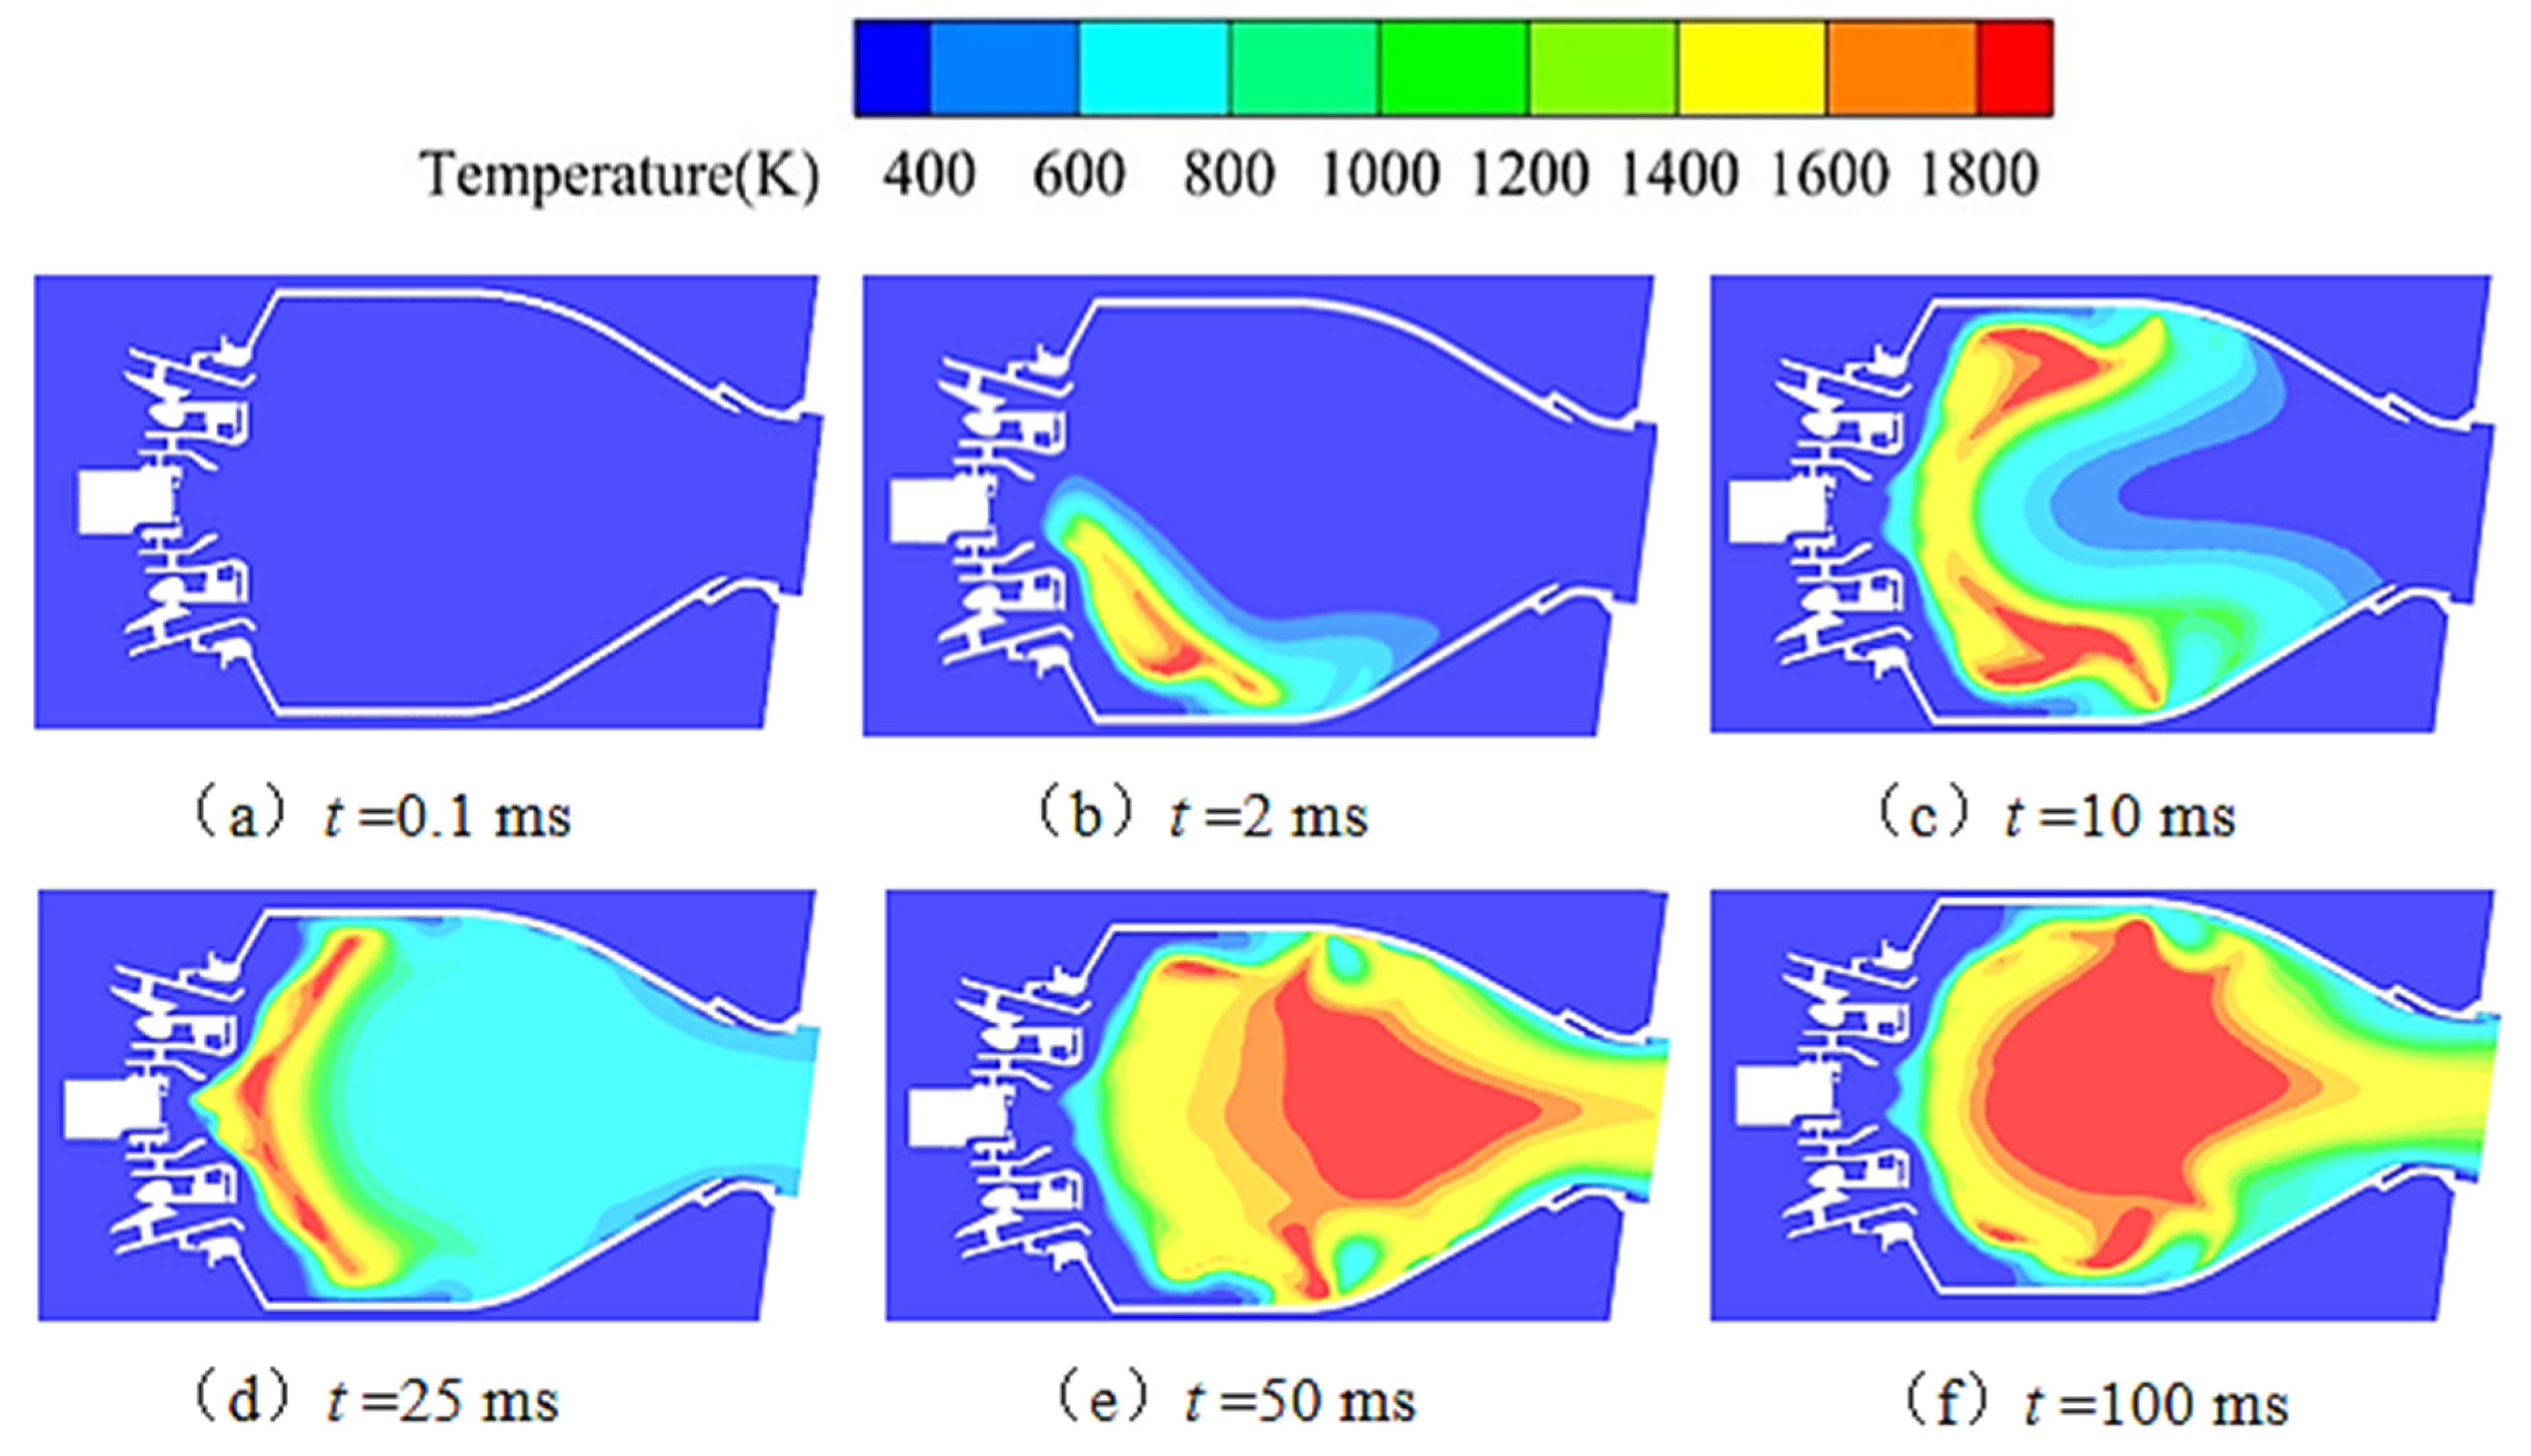
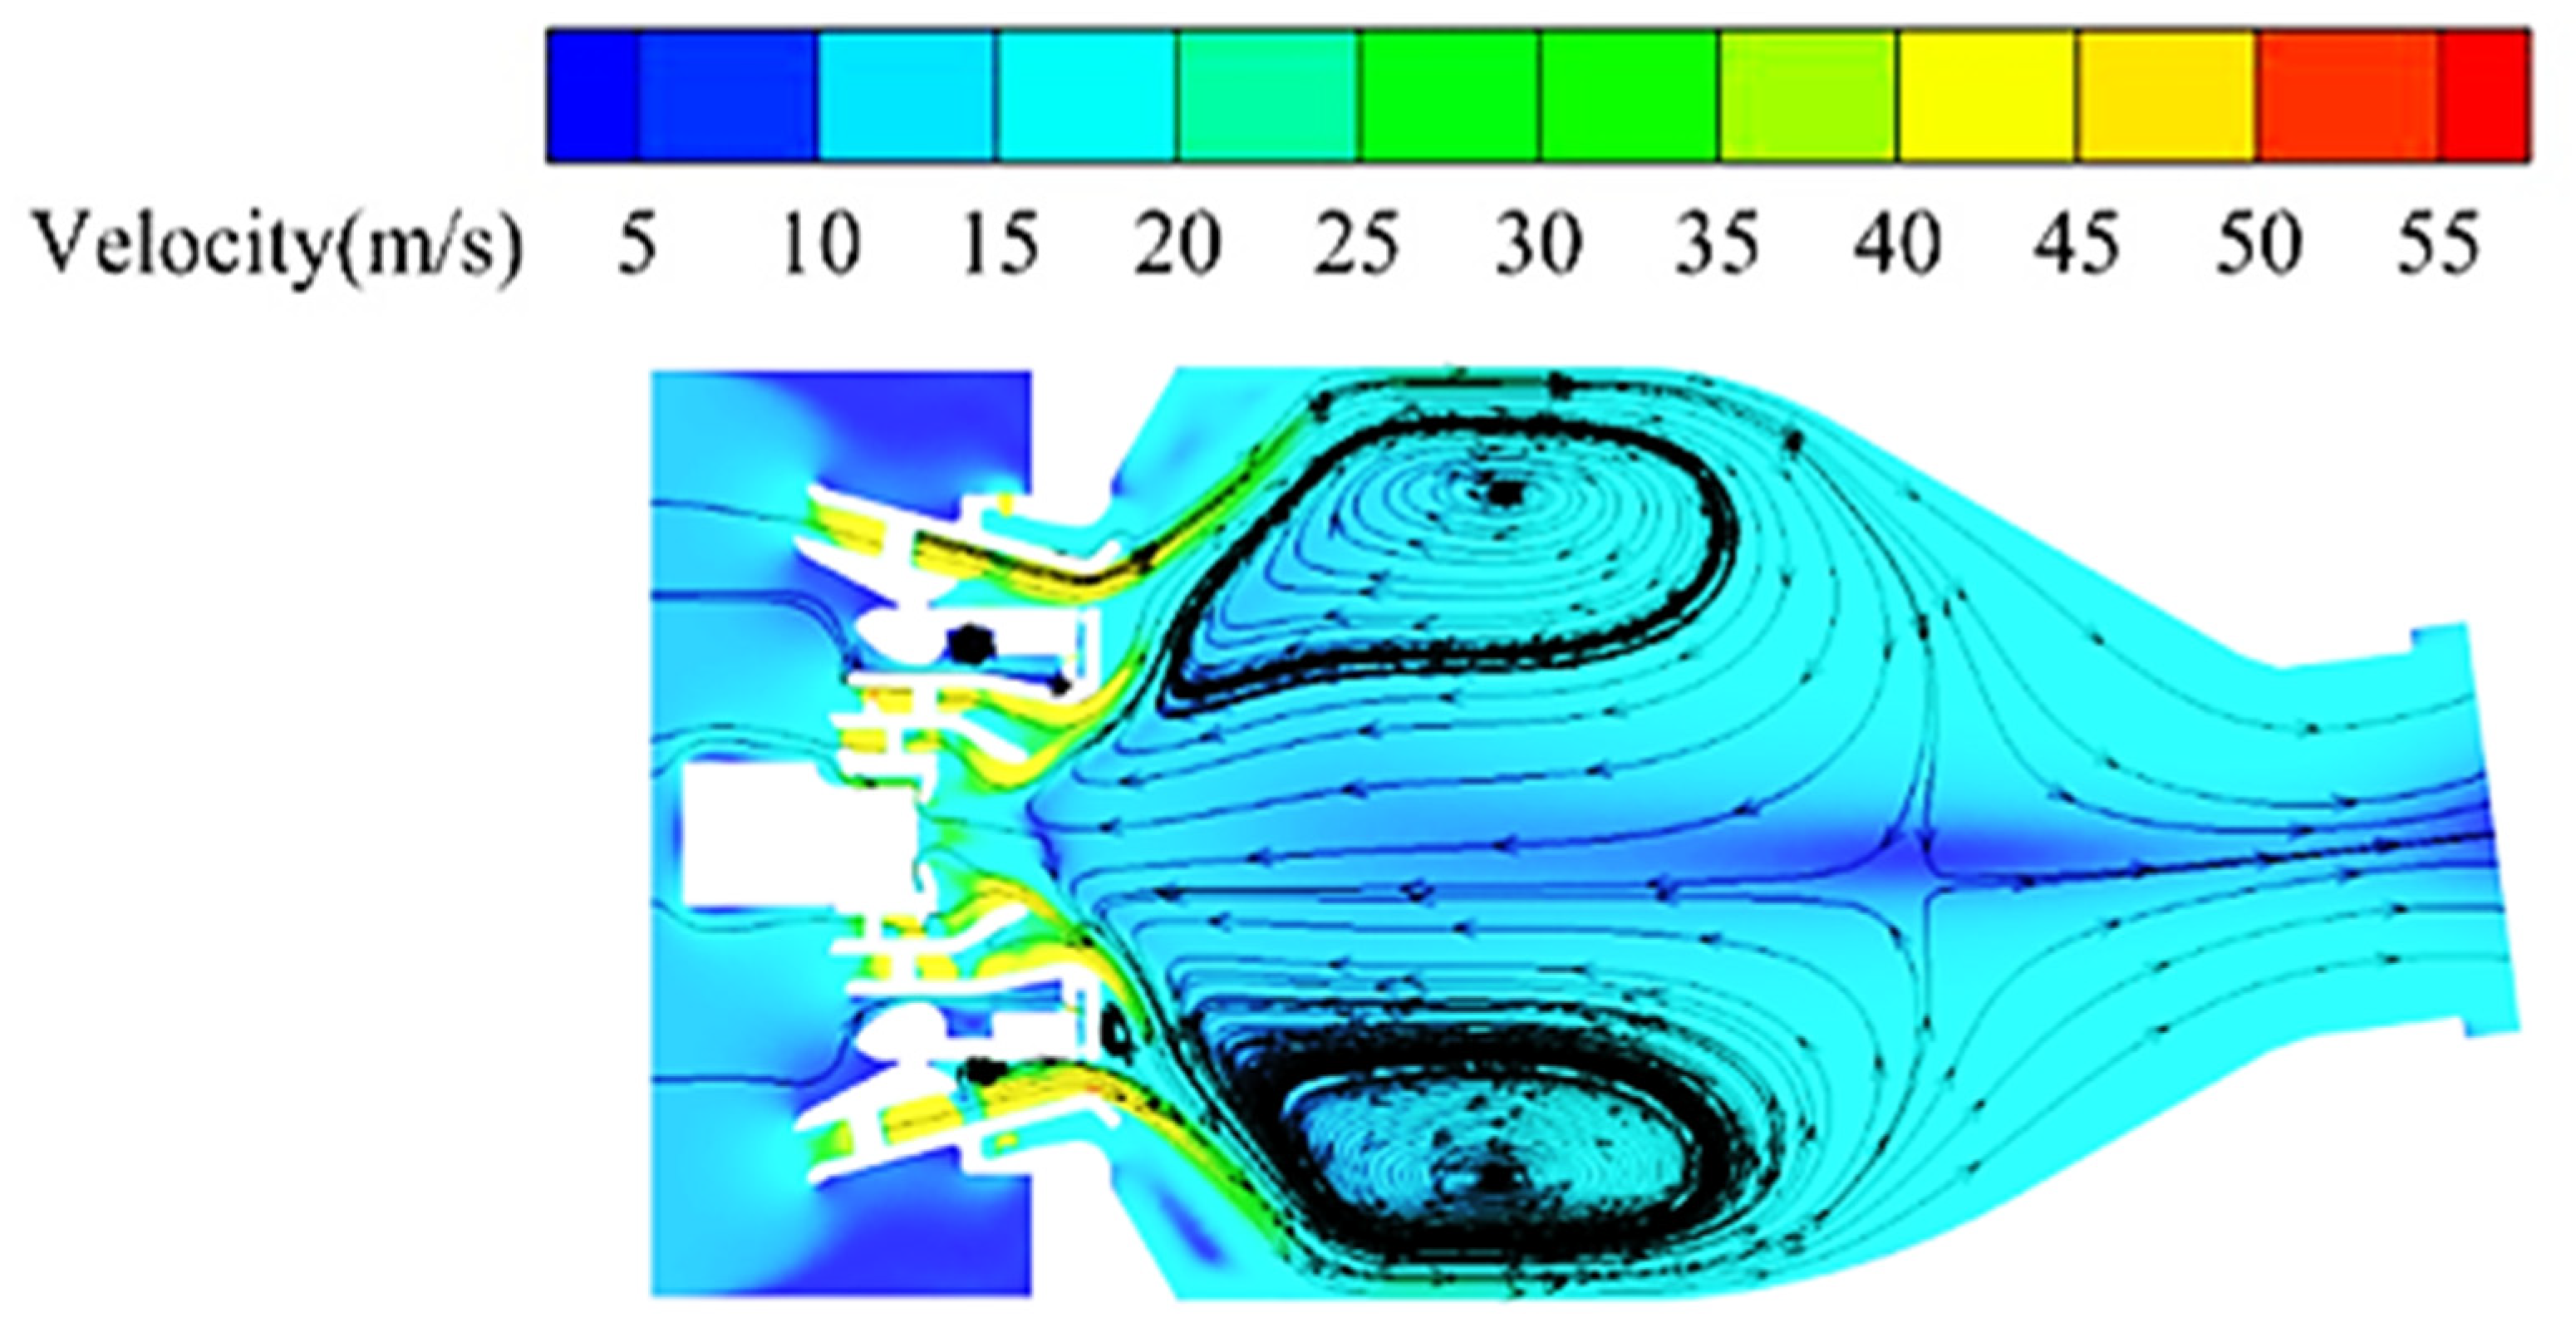
4.1. Ignition Process Analysis

The lean ignition process using the internally staged nozzle injection scheme of the C1 model was recorded by a high-speed camera, taking an inlet air mass flow rate of 46.7 g/s as an example. It mainly includes four periods, initial fire core formation, fire core development, local flame formation, and the merging of local flame, as shown in Figure 10 and Figure 11. Specifically, after the initial fire core is formed at the spark discharge position, it moves to the right along the edge of the recirculation zone, gradually igniting the surrounding combustible mixture, and forming a local flame downstream in the combustor. Subsequently, the local flame brightens and diffuses upstream against the flow, propagating upward in the combustor under the combined action of swirl and recirculation, eventually achieving stable combustion throughout the combustor.
The axis velocity flow field at Y = 0 cross-section when stable combustion is achieved after successful ignition, with an inlet air mass flow rate of 46.7 g/s, is shown in Figure 13. Due to the influence of the swirl effect, there are symmetrical vortex structures radially around Z = 0 m in both the central recirculation zone and the corner recirculation zone. Part of the air flow enters the central recirculation zone from the head of the flame tube and is entrained into the recirculation zone by the vortex structure. Since the air flow speed in the recirculation zone is relatively low, the vortex structure can effectively mix the air and fuel with each other, creating a stable region for keeping a stable flame.
If the flame fails to develop in any of the four stages of initial fire core formation, fire core development, local flame formation, and the merging of local flame, it will lead to ignition failure. Figure 11 is a CH* spontaneous luminescence image of ignition failure due to unstable flame self-sustaining, recording the moment of successful fire core development as time 0. In the subsequent time period, the flame begins to move downstream, the area shrinks, and the color fades. At 101 ms, the flame becomes a local small flame at the lower part of the combustor. At 108 ms, the flame in the combustion chamber disappears, leaving only a fire core-like bright spot. By 116 ms, the flame in the combustor has been completely extinguished, indicating ignition failure.

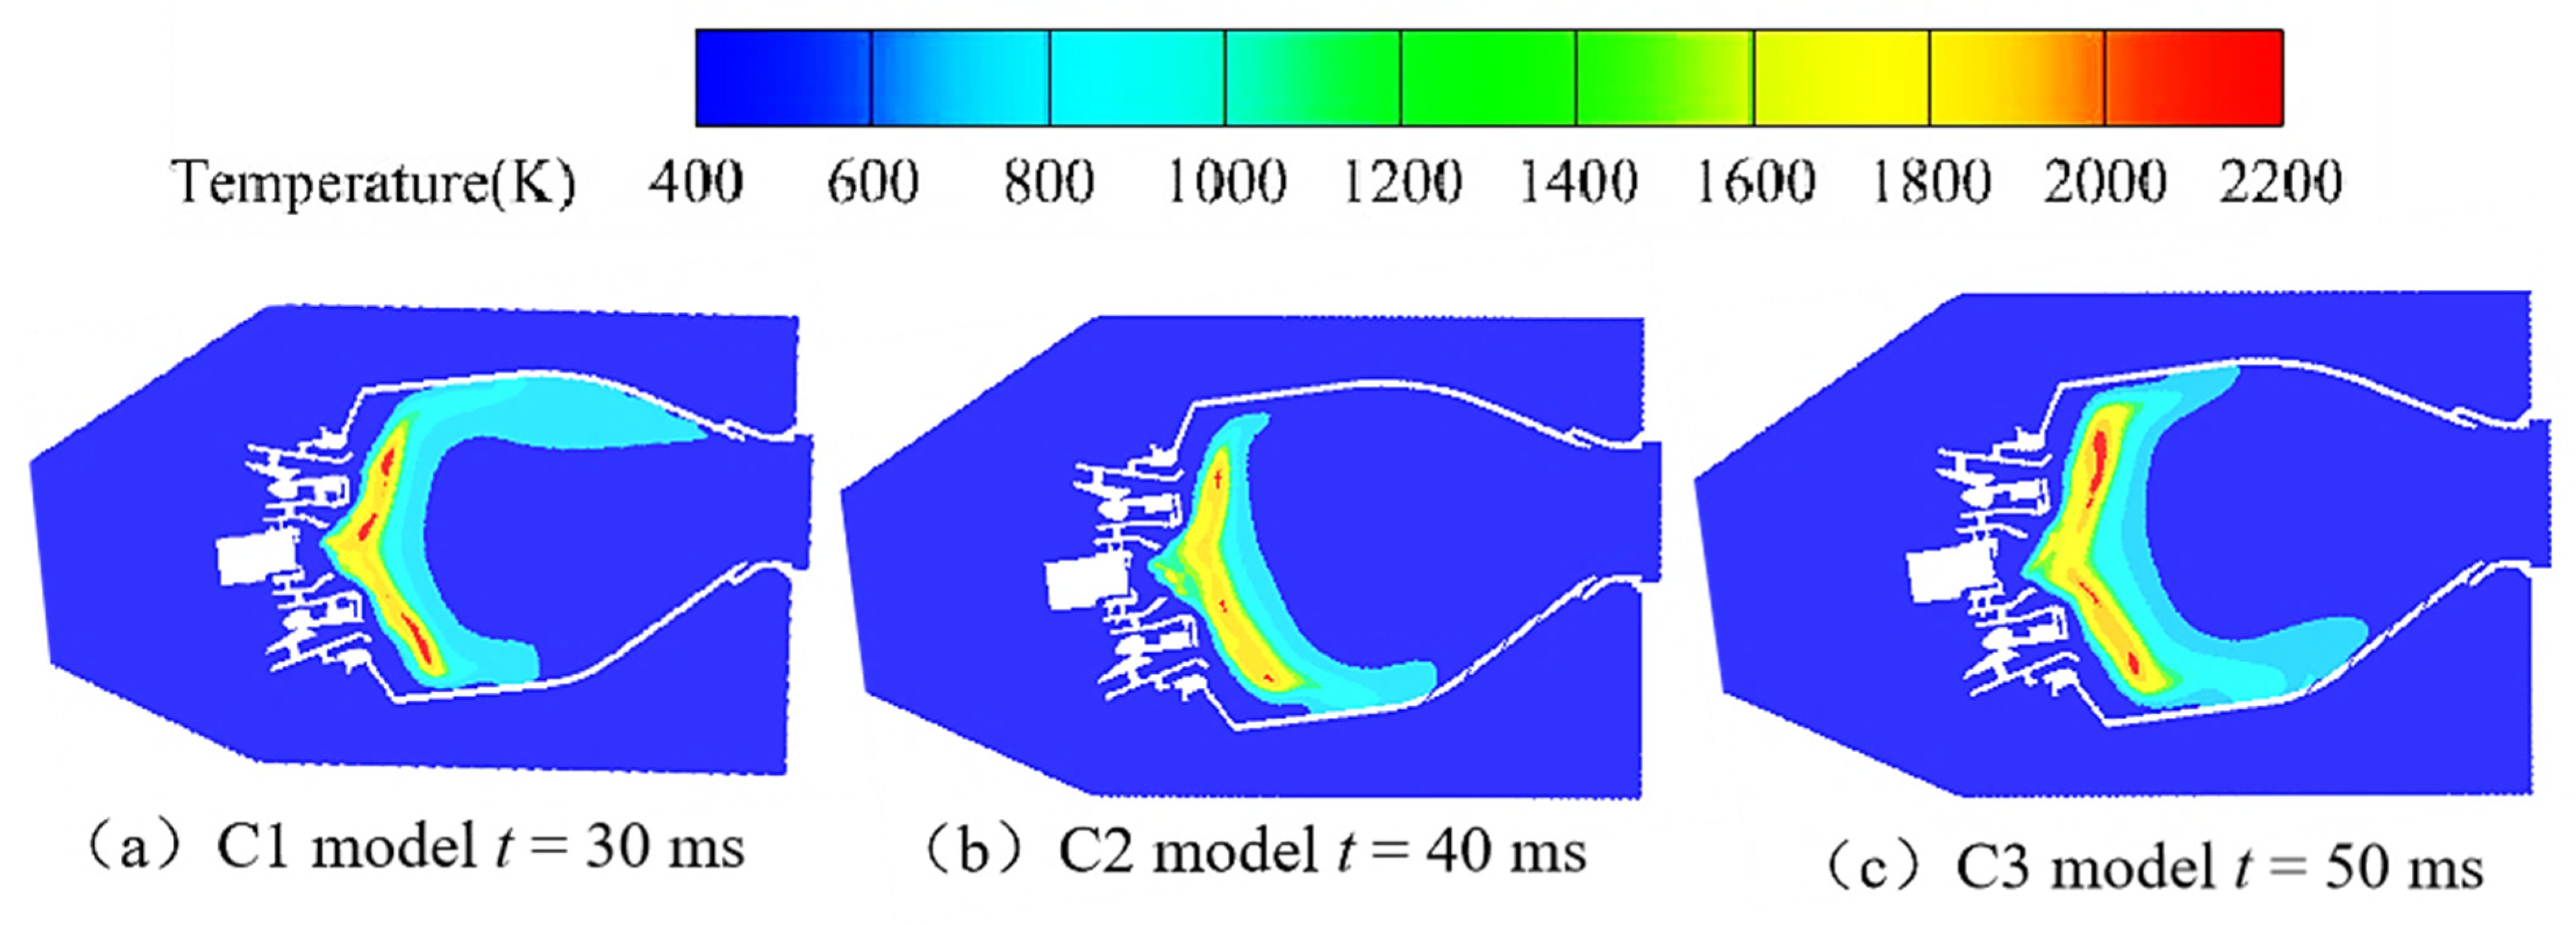
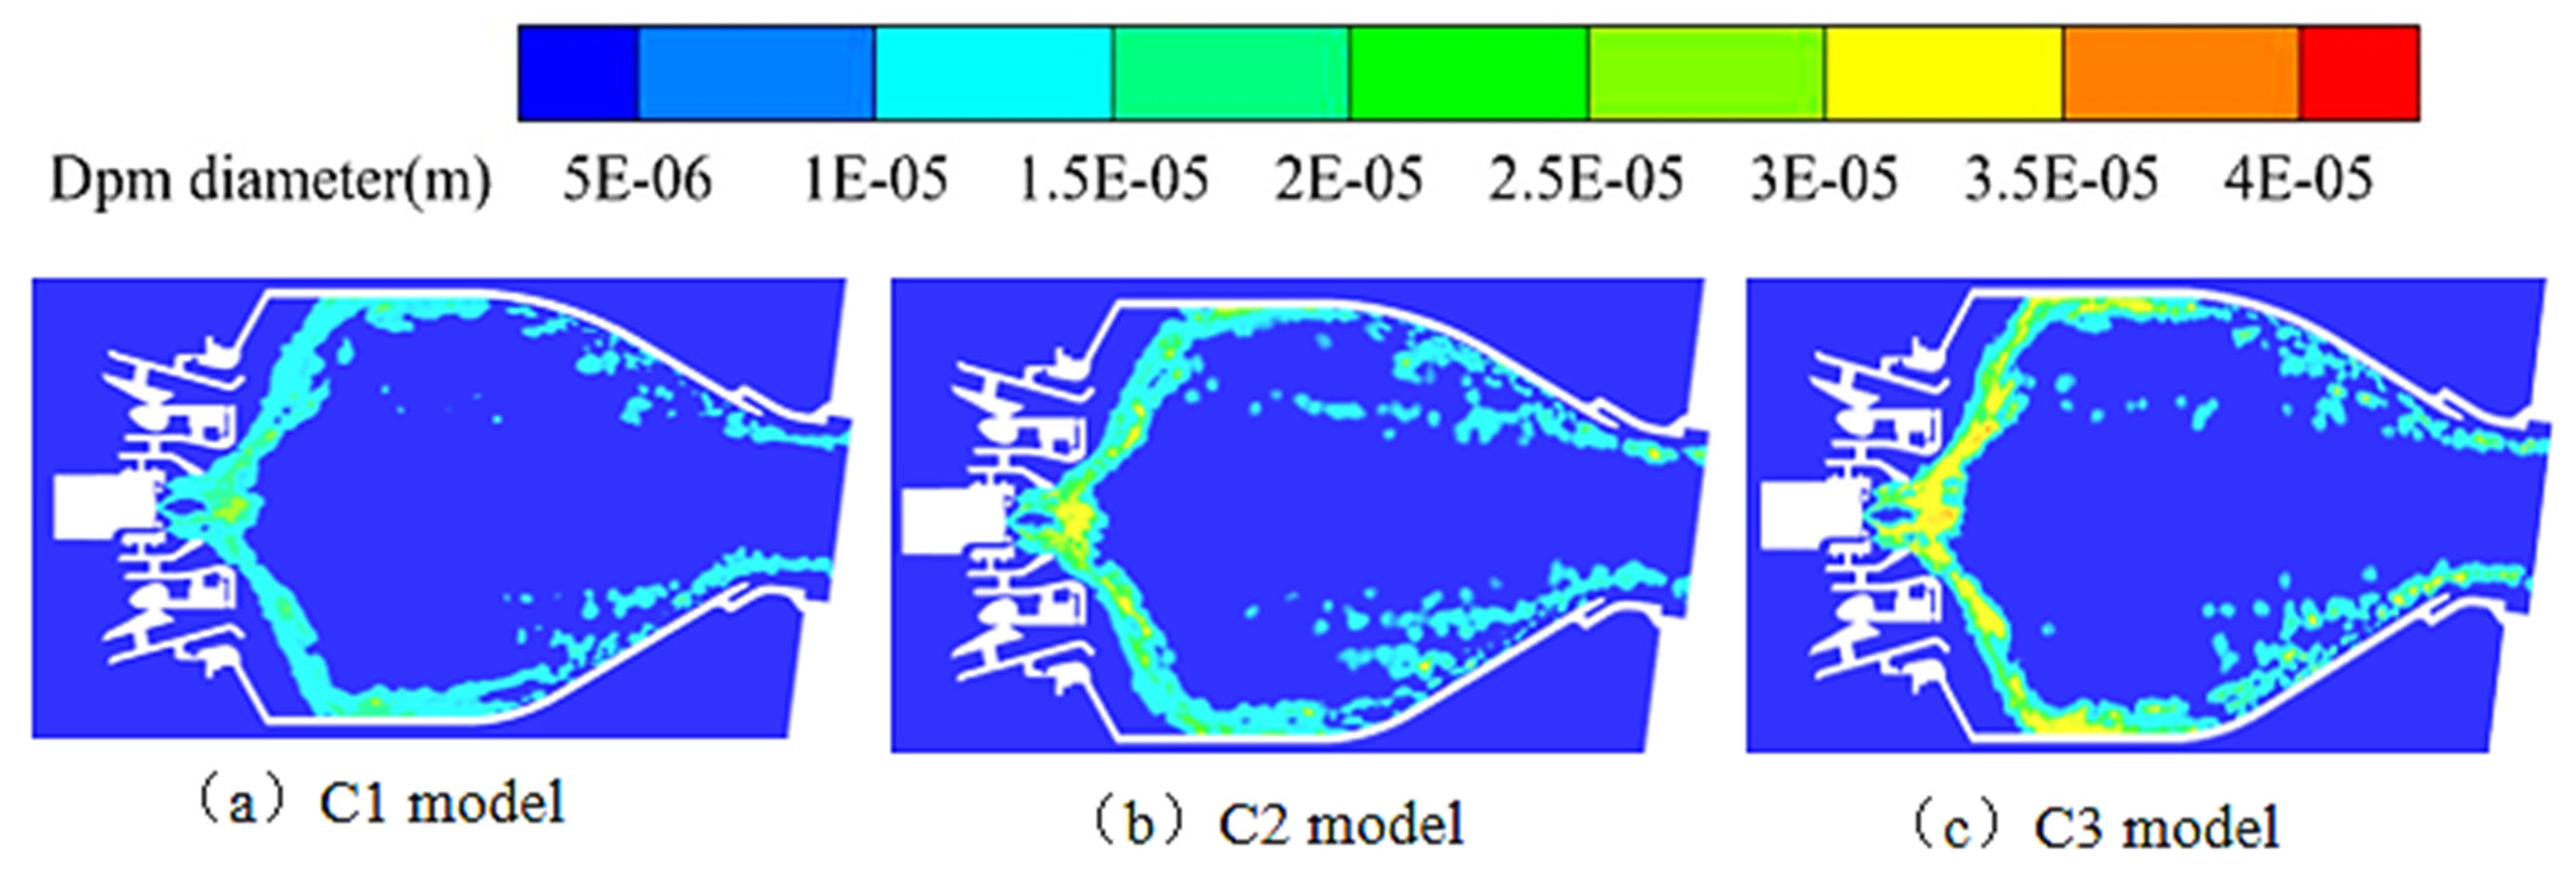
4.2. Influence of the Diameter of the Auxiliary Fuel Nozzles on Ignition Performance

The effect of changing the nozzle diameter of the auxiliary fuel nozzles as shown in Table 3 was studied using the C1, C2, and C3 schemes. Taking an inlet air mass flow rate of 46.7 g/s as an example, the influence of the nozzle diameter of the auxiliary fuel path on the spray field and the ignition performance of the combustor was studied.
When the inlet air flow rate is constant, with an increase in the diameter of the auxiliary fuel nozzles, the lean ignition fuel–air ratio slightly increases, and the lean ignition boundary slightly narrows, indicating that the ignition performance of the smaller diameter of the auxiliary fuel nozzles is better. The lean ignition fuel–air ratios limit for nozzle diameters of 0.4 mm, 0.5 mm, and 0.6 mm are 0.018, 0.0185, and 0.019, respectively. Compared to the baseline scheme, the speed of fire core propagation and development during ignition decreases slightly with the C2 and C3 schemes, extending the flame development time, as shown in Figure 14a–c.
Combined with Figure 15, it can be seen that with an increase in the diameter of the auxiliary fuel nozzles, the maximum diameter of kerosene droplets also gradually increases. The maximum droplet diameters of C1, C2, and C3 schemes are approximately 40 μm, 42 μm, and 45 μm, respectively. The increase in diameter of the auxiliary fuel nozzles increases the average and maximum droplet diameters of kerosene, weakening the spray effect of kerosene, leading to poorer mixing effects, and ultimately slightly increasing the lean ignition fuel–air ratio limit.

4.3. Influence of Pilot Swirler with Different Rotating Direction Combination on Combustor Ignition Performance

The influence of different rotating direction combinations of the pilot swirler on the ignition performance of the internally staged combustor was studied using the C1 and C4 schemes, with an inlet air mass flow rate of 46.7 g/s as an example. The lean ignition fuel–air ratios limit for the C1 and C4 schemes are 0.018 and 0.014, respectively, as shown in Table 4. At the lean ignition fuel–air ratio limit, successful ignition is achieved, with the temperature field distributions of the C1 and C4 models shown in Figure 14a and Figure 16, respectively.
Compared to the baseline scheme, the C4 scheme, due to the opposite rotating direction of the first and second stage of pilot swirlers, has a lower air velocity near the ignition position, significantly reducing the lean ignition fuel–air ratio limit by 22.2%. As shown in Figure 17, at the X = 0.026 m cross-section near the tube wall in the combustor, the velocity range at the interface between the swirl region and recirculation zone of the C1 scheme is 24–36 m/s, while the C4 scheme has a velocity range of 16–28 m/s. Lower velocity means that the difficulty of fire core development and flame stabilization without being blown out is reduced, which also means a lower lean ignition fuel–air ratio limit.

4.4. Influence of the Swirl Number of the Pilot Module Primary Swirlers on Combustor Ignition Performance

The effect of different swirl numbers of the pilot module primary swirlers on the ignition performance of the combustion chamber was studied using the C1, C5, and C6 schemes, with an inlet air mass flow rate of 46.7 g/s as an example. Table 5 shows the lean ignition fuel–air ratios for the three schemes with different swirl numbers of the pilot module primary swirlers. It can be seen that too small or too large swirl numbers are not conducive to widening the lean ignition boundary. The baseline scheme C1, with a swirl number of 1.2, has the best ignition performance among the three, with the temperature field distribution at the lean ignition fuel–air ratio limit shown in Figure 18.
Taking the C5 model as an example, the velocity flow field distribution at the Y = 0 section is shown in Figure 19. Combined with Figure 13, it is evident that the velocity range of the recirculation zone for the C5 model is 10–20 m/s, higher than the 5–15 m/s velocity range of the recirculation zone for the C1 scheme. The C5 scheme, due to its lower swirl number compared to the baseline scheme, has a weakened swirl effect, a thinner jet layer along the wall towards the downstream, a weakened vortex structure flow intensity, a smaller central negative pressure area, an increased air velocity in the recirculation zone, and adverse effects on lean ignition.

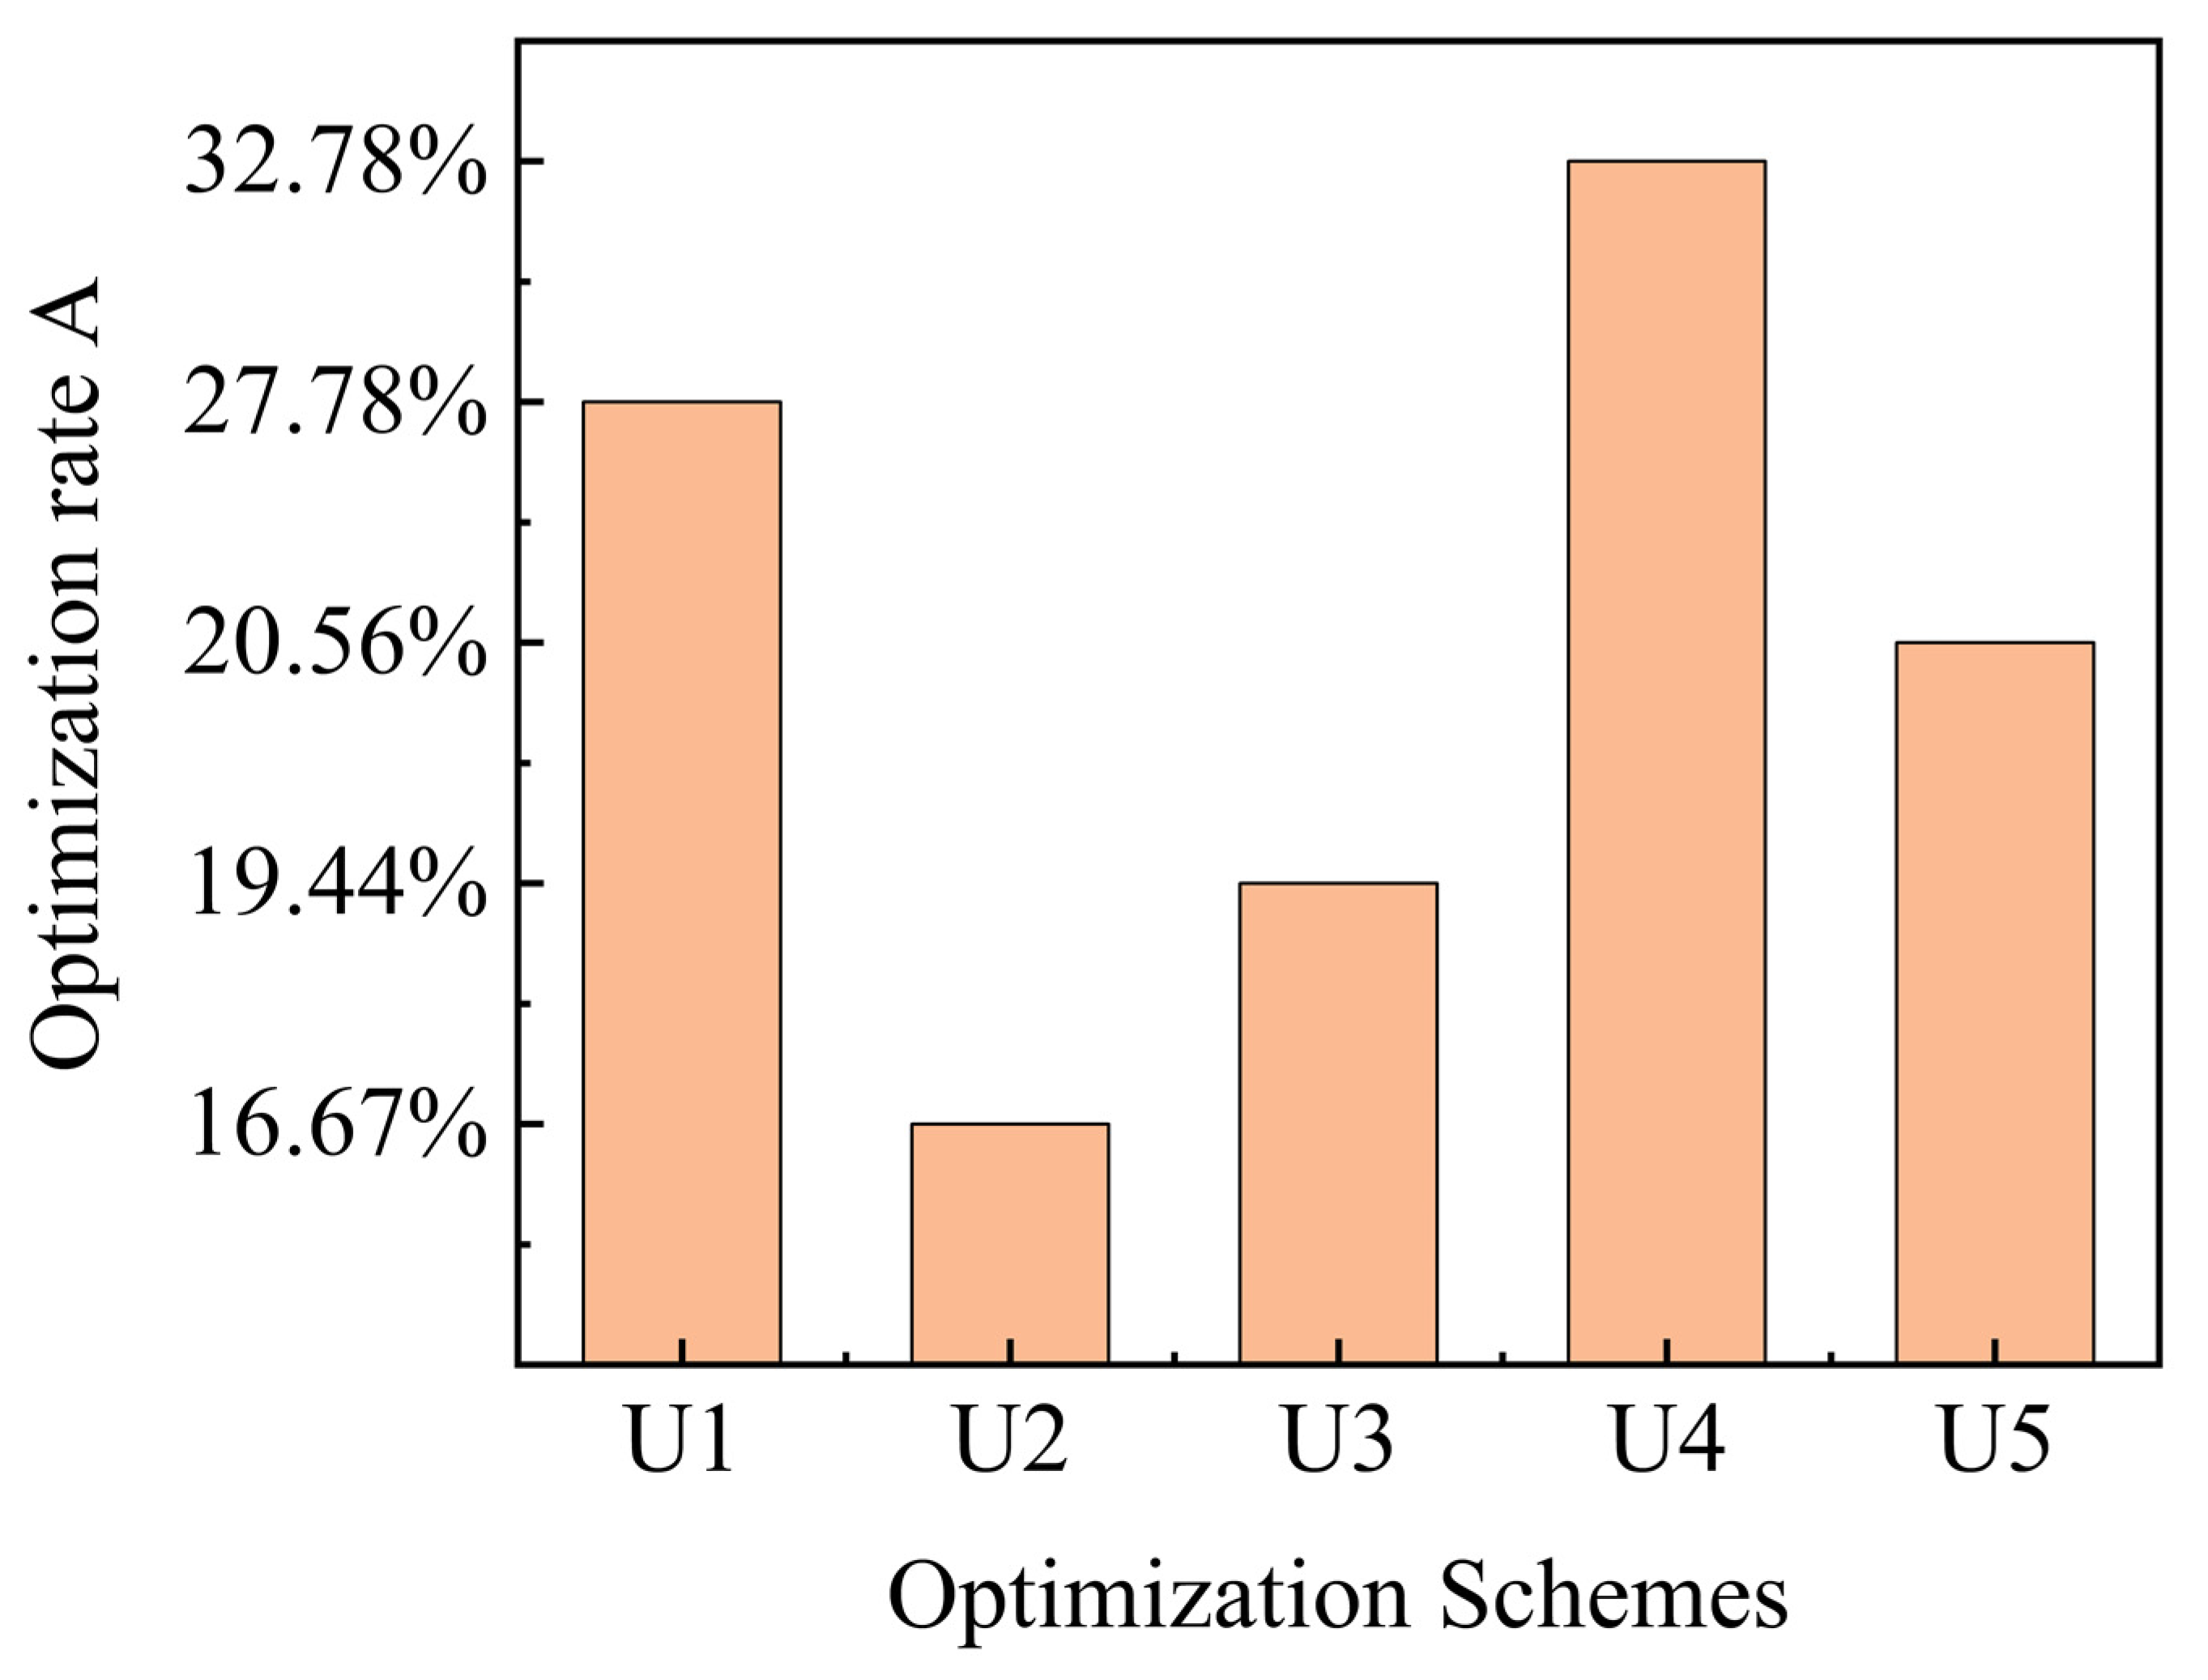
4.5. Optimization Scheme for Ignition Performance of the Internally Staged Combustor

Based on the C1 model, the lean ignition characteristics of this typical structure are optimized by changing the nozzle diameter of the auxiliary fuel path and the swirl number of the pilot module primary swirlers. With the swirl number unchanged and the ignition energy at 4 J, the nozzle diameter is optimized to 0.2 mm, corresponding to the serial number U1. After optimization, the lean ignition boundary is reduced by 27.8%, expanding the lean operating range and improving the lean ignition characteristics.
Further optimization of the lean ignition characteristics is achieved by optimizing the swirl number of the pilot module primary swirlers. When the nozzle diameter is 0.2 mm and the ignition energy is 4 J, the swirl number of the pilot module primary swirlers changes. The swirl numbers chosen are 1.0, 1.1, 1.2, 1.4, and 1.6, corresponding to serial numbers U2, U3, U4, and U5, with the working conditions set as shown in Table 1. Figure 20 further verifies the conclusion that too large or too small swirl numbers are not conducive to widening the lean ignition boundary, and there exists an optimal swirl number that results in the lowest lean ignition fuel–air ratio limit.
To better describe the optimization effect of adjusting structural parameters on ignition performance, the optimization rate A is defined, and the specific calculation formula is as follows:
A   = φ C 1 φ u i φ C 1 × 100 %   ( i = 1 , 2 , 3 , 4 , 5 )
where φC1 is the lean ignition fuel–air ratio limit of the baseline model, and φui is the lean ignition fuel–air ratio limit of the optimized model U1~U5.
The optimization rates of lean ignition characteristics compared to the baseline scheme are shown in Figure 21. It can be seen that when the swirl number of the pilot module primary swirlers is optimized to 1.4, the lean ignition fuel–air ratio limit can be further reduced to 0.0121, a decrease of 32.78% compared to the baseline scheme, demonstrating the best lean ignition performance.

5. Conclusions

In this paper, a typical internally staged combustor was studied by combining numerical simulation and experimental methods. The effects of different pilot structural parameters on lean ignition characteristics were analyzed, and the flame development and propagation characteristics during ignition and the optimization methods for lean ignition performance were proposed. The main conclusions are as follows:
(1)
Changing the diameter of the auxiliary fuel nozzles affects the average droplet size distribution of fuel, thereby affecting the lean ignition limit of the combustor under a constant inlet air flow rate.
(2)
Both too-large and too-small swirl numbers of the pilot module primary swirlers are not conducive to broadening the lean ignition limit. Compared to the combination of the same rotating direction for both pilot swirlers, the opposite rotating direction combination shows better lean ignition performance.
(3)
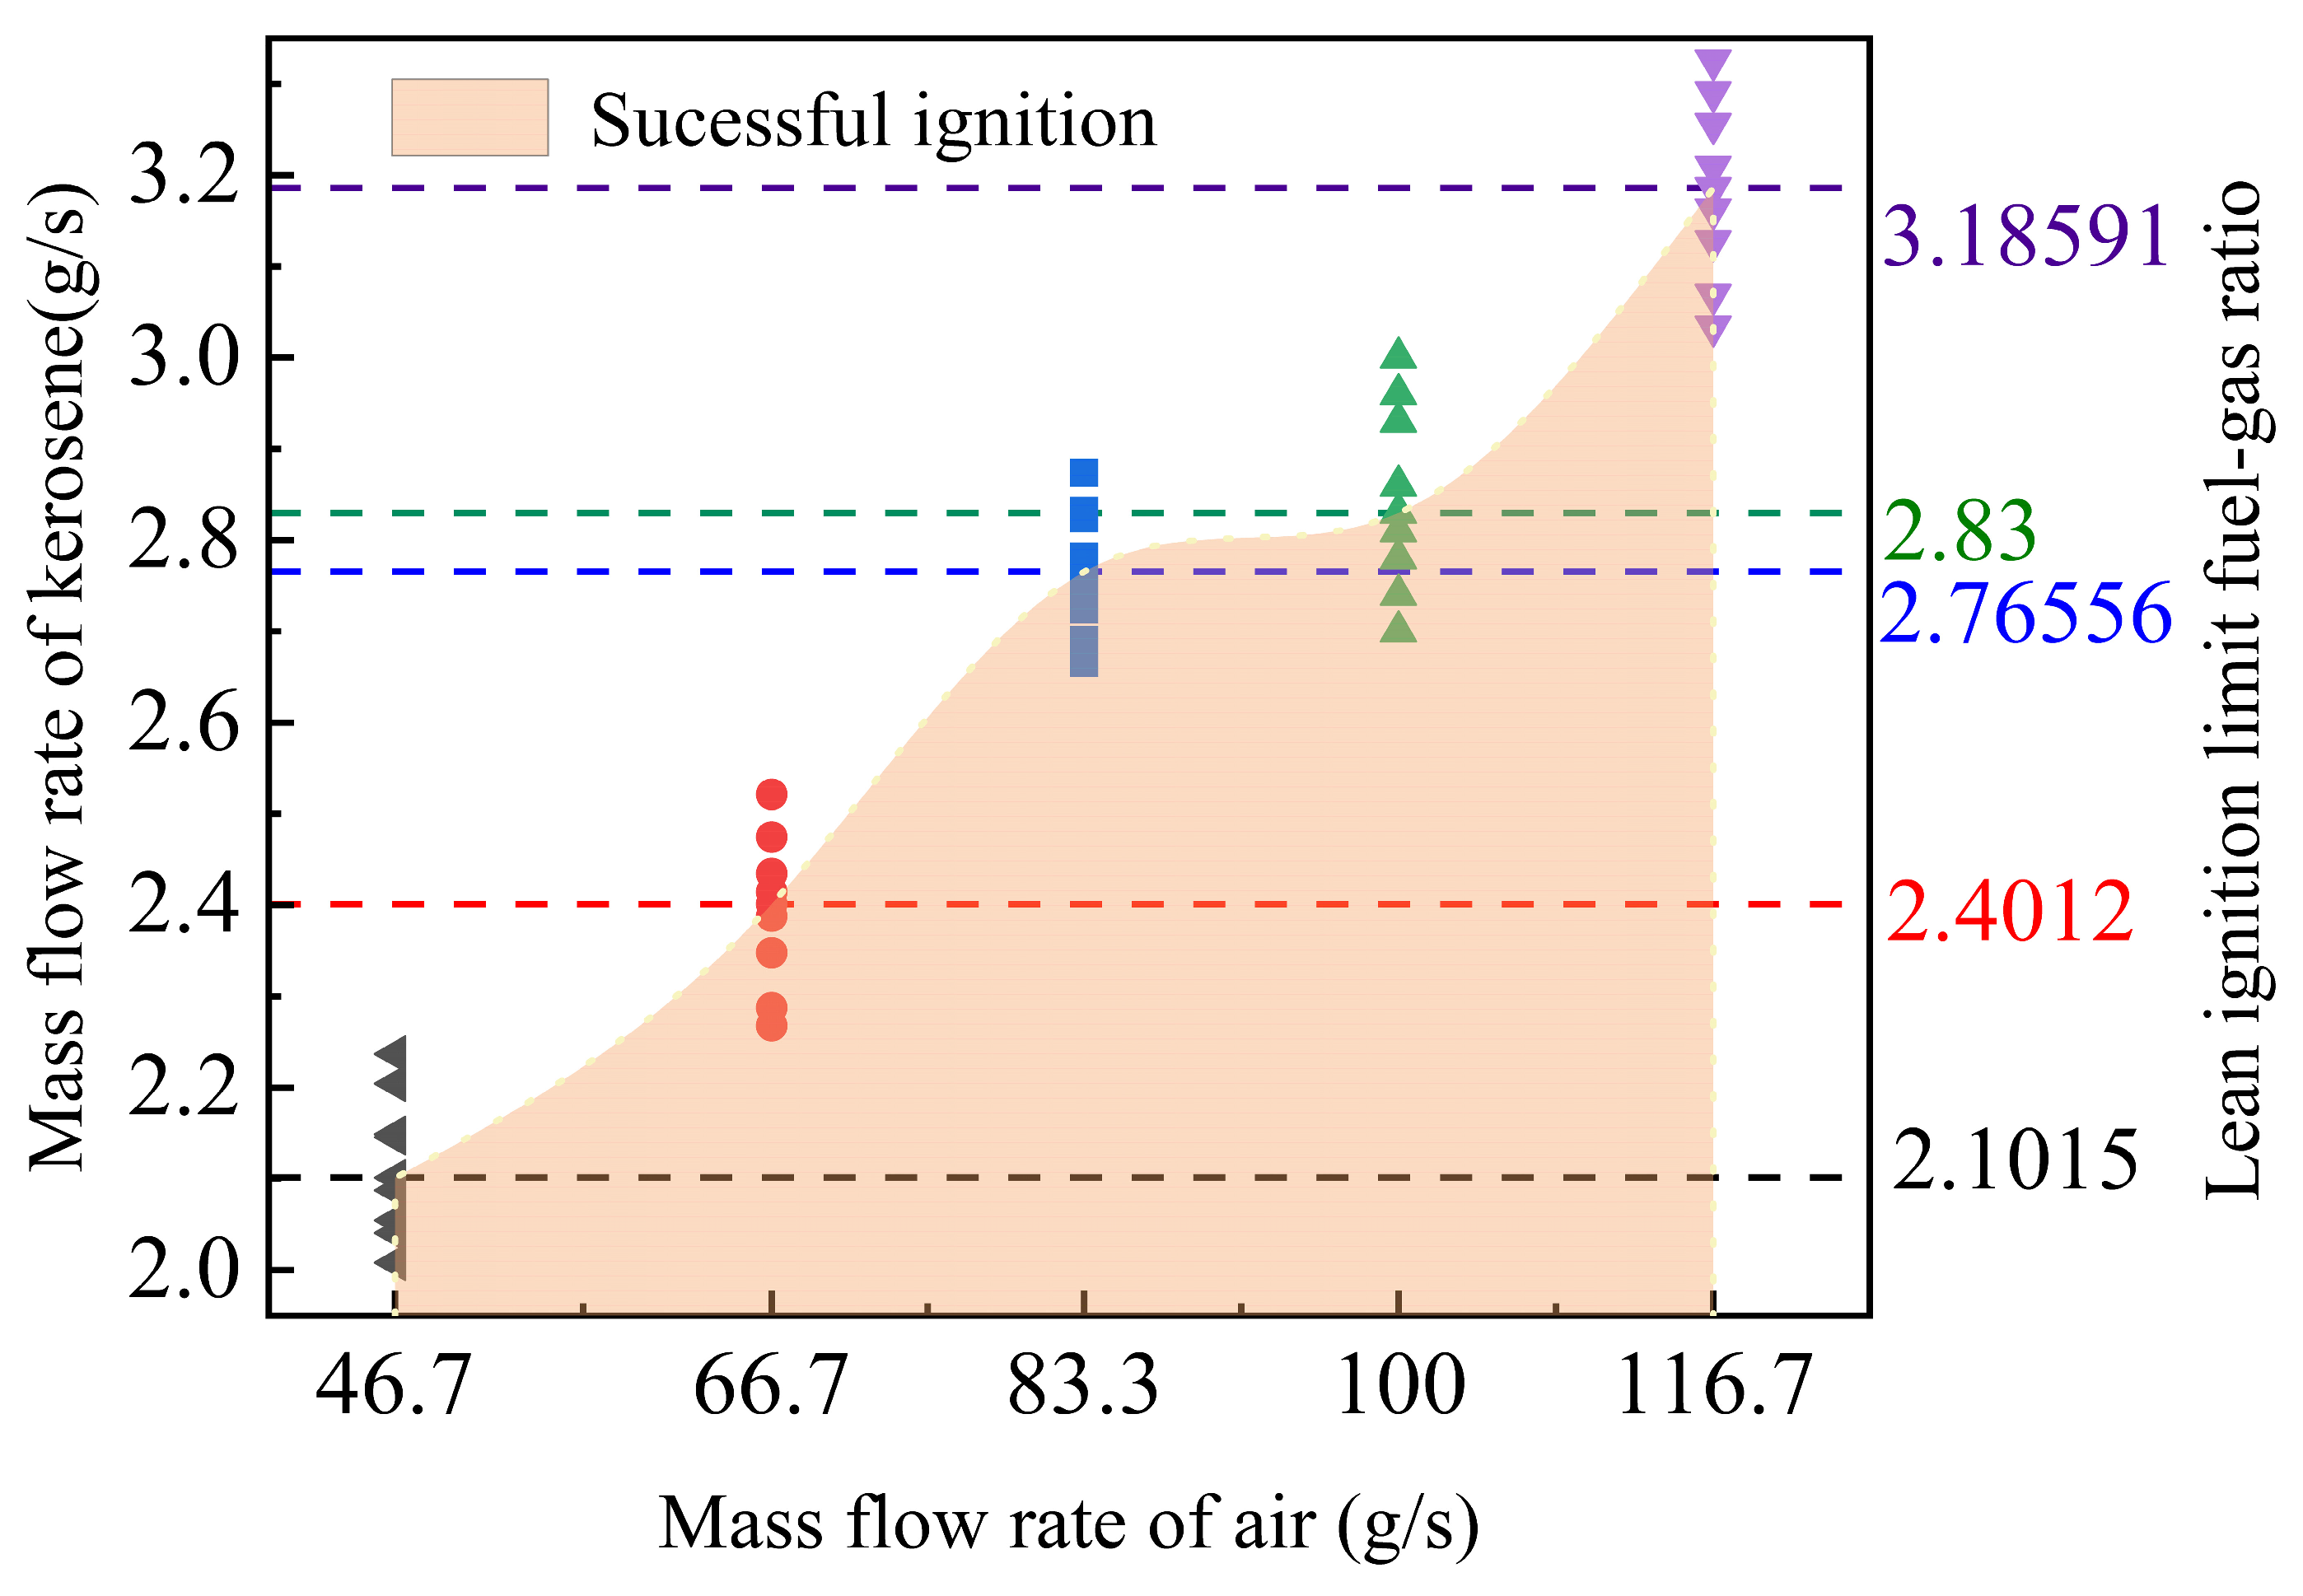
Under typical working conditions (inlet air flow rate of 46.7 g/s and ignition energy of 4 J), the lean ignition fuel–air ratio limit is reduced to 0.0121 with the opposite rotating direction combination of pilot swirlers, the diameter of the nozzle diameter is 0.2 mm, and the swirl number of the pilot module primary swirlers is 1.4, showing the best lean ignition performance with a reduction of 32.78% compared to the baseline scheme C1.

Author Contributions

Conceptualization, Z.G. and P.C.; methodology, Z.G.; software, Y.L. and J.Y.; validation, Z.G.; formal analysis, Z.G., Y.L. and J.Y.; investigation, P.C.; resources, Q.Z. and W.F.; data curation, Z.G. and P.C.; writing—original draft preparation, Z.G. and Y.L.; writing—review and editing, J.Y.; visualization, J.Y.; supervision, Q.Z.; project administration, Q.Z. and W.F.; funding acquisition, The National Natural Science Foundation of China (Grant No.52336006). and Science Center for Gas Turbine Project (P2023-B-II-002-001). All authors have read and agreed to the published version of the manuscript.

Funding

1. The National Natural Science Foundation of China (Grant No.52336006) 2. Science Center for Gas Turbine Project (P2023-B-II-002-001).

Data Availability Statement

The data presented in this study are available on request from the corresponding author due to privacy.

Conflicts of Interest

The authors declare no conflicts of interest.

References

  1. Huang, Y. Combustion and Combustion Chamber; Beihang University Press: Beijing, China, 2009; ISBN 9787811248951. [Google Scholar]
  2. Lin, Y.Z.; Xu, Q.H.; Liu, G.E. Gas Turbine Combustor; National Defence Industry Press: Beijing, China, 2008. [Google Scholar]
  3. International Standards and Recommended Practices Environmental Protection Annex 16 to the Convention on International Civil Aviation on Volume Aviation Engine Emissions; ICAO: Montréal, QC, USA, 1993.
  4. Lin, Y.Z.; Peng, Y.H.; Liu, G.E. A Preliminary Study of NOx Emission of staging/Premixed and Prevaporized Lean Combustion Low Emission Combustor Scheme. J. Aerosp. Power 2003, 18, 492–497. [Google Scholar]
  5. Fu, Z.B.; Lin, Y.Z.; Zhang, C.; Xu, Q.H. Experimental Investigation on Fuel-Staging Mode of Internally-Staged Combustor under Approach Condition. J. Propuls. Technol. 2014, 35, 77–86. (In Chinese) [Google Scholar]
  6. Liu, D.C.; Dong, Y.X.; Shang, S.T.; Cheng, M.; Shang, M.Z. Numerical simulation of the flow field in a single annular concentric staged combustor. J. Aerosp. Power 2010, 25, 1251–1257. (In Chinese) [Google Scholar]
  7. Mongia, H. Perspective of Combustion Modeling for Gas Turbine Combustors. In Proceedings of the 42nd AIAA Aerospace Sciences Meeting and Exhibit, Reno, NV, USA, 5–8 January 2004; American Institute of Aeronautics and Astronautics: Reston, VA, USA, 2004. [Google Scholar]
  8. Stouffer, S.; Ballal, D.; Zelina, J.; Shouse, D.; Hancock, R.; Mongia, H. Development and Combustion Performance of High Pressure WSR and TAPS Combustor. In Proceedings of the 43rd AIAA Aerospace Sciences Meeting and Exhibit, Reno, NV, USA, 10–13 January 2005; American Institute of Aeronautics and Astronautics: Reston, VA, USA, 2005. [Google Scholar]
  9. Fu, Z.B.; Lin, Y.Z.; Zhang, C.; Xu, Q.H. Experiment of combustion performance of internally-staged combustor pilot stage. J. Aerosp. Power 2015, 30, 46–52. (In Chinese) [Google Scholar]
  10. William, P.; Tyliszczak, A. Large Eddy Simulation of Spark Ignition in a Gas Turbine Combustor. Flow Turbul. Combust. 2010, 85, 711–734. [Google Scholar]
  11. Wang, X.W.; Huang, Y.; Liu, Y.F.; Sun, L. Effect of the ignition location on lean light-off limits for a gas turbine combustor. Combust. Flame 2022, 245, 17–35. (In Chinese) [Google Scholar] [CrossRef]
  12. Hervo, L.; Senoner, J.M.; Biancherin, A.; Cuenot, B. Large-Eddy Simulation of Kerosene Spray Ignition in a simplified Aeronautic Combustor. Flow Turbul. Combust. 2018, 101, 603–625. [Google Scholar] [CrossRef]
  13. Wang, K.X.; Liu, F.Q.; Fan, X.J.; Liu, C.X.; Yang, J.H.; Mu, Y.; Xu, G. Effects of Ignition Position on Ignition Process of Internally-Staged Combustor. J. Propuls. Technol. 2022, 43, 233–242. (In Chinese) [Google Scholar]
  14. ASME GT2011-45786; Experimental Investigation on Ignition Performance of LESS Combustor. ASME: Vancouver, BC, Canada, 2012.
  15. ASME GT 2014-25644; Numerical Investigation of Ignition Performance of a Lean Burn Combustor at Sub-Atmospheric Conditions. ASME: Düsseldorf, Germany, 2014.
  16. Read, R.W. Experimental Investigations into High-Altitude Relight of a Gas Turbine; University of Cambridge: Cambridge, UK, 2008. [Google Scholar]
  17. ASME GT2010-22625; Experimental Analysis of Altitude Relight under Realistic Conditions Using Laser and High-Speed Video Techniques. ASME: Glasgow, UK, 2010.
  18. Huang, B.; Qiu, W.; Fang, R.L. Experiment on variable-frequency-energy ignition performance of internally-staged combustor. J. Aerosp. Power 2019, 34, 529–538. (In Chinese) [Google Scholar]
  19. ASME GT2013-94681; Experimental and Numerical Analysis of an Ignition Sequence in a Multiple-Injectors Burner. ASME: San Antonio, TX, USA, 2013.
  20. ASME GT-2011-46187; Improvement on Ignition Performance for a Lean Staged Low NOx Combustor. ASME: Vancouver, BC, Canada, 2011.
  21. Fu, Z.B.; Lin, Y.Z.; Fu, Q.H.; Zhang, C. Effect of different step heights on ignition and blowout performance of internally-staged combustor. J. Aerosp. Power 2014, 5, 1062–1070. (In Chinese) [Google Scholar]
  22. Wu, H.W.; Chen, H.; Liu, C.X.; Yang, J.H.; Mu, Y.; Cheng, M.; Xu, G. Effect of Pilot-Inner-Staged Swirl on Ignition and Blowout Performance of Combustor. J. Combust. Sci. Technol. 2017, 23, 560–566. (In Chinese) [Google Scholar]
  23. Liu, Y.; Hui, X.; Wang, J.; Wang, X.; Han, M. Effect of swirl number of pilot stage on ignition performance of centrally-staged combustor. J. Aerosp. Power 2022, 37, 2335–2343. (In Chinese) [Google Scholar]
  24. Yang, J.H.; Liu, C.X.; Liu, F.Q.; Mu, Y.; Xu, G. Experimental Investigation of Effects of Pilot Swirl Flow Organization on Ignition and LBO Performance for a Staged Combustor. J. Propuls. Technol. 2019, 40, 2050–2059. (In Chinese) [Google Scholar]
  25. Liu, A.G.; Li, H.Z.; Zhu, T. Effect of Central Staged Combustor Swirl Angle on Combustion Performance. J. Eng. Therm. Energy Power 2019, 34, 16–23. (In Chinese) [Google Scholar]
  26. Liu, W.; Wang, C.J.; Yu, L.; Zheng, S.; Zeng, W. Experimental investigation on combustion performance of centrally-staged combustor. China Meas. Test 2019, 45, 149–155. [Google Scholar]
  27. Gui, T.; Fang, R.L.; Qiu, W.; Deng, Y.; Fan, W. Experimental Investigation on Ignition Performance of Coaxial and Divisional High Temperature Rise Combustor. J. Propuls. Technol. 2022, 43, 224–232. (In Chinese) [Google Scholar]
  28. Xu, L.; Sun, Y.L. Experimental study on ignition and flameout performance of low-pollution combustor. J. Shenyang Aerosp. Ace Univ. 2018, 35, 6. [Google Scholar]
  29. Li, Y.; Zheng, H.T.; Mu, Y.; Cheng, B. Application of Turbulent Models on Simulation of intense Swirling flow Combustor. In Proceedings of the Asia-Pacific Power and Energy Engineering Conference, Wuhan, China, 25–28 March 2011. [Google Scholar]
  30. Mongia, H. Recent Progress in Comprehensive Modeling of Gas Turbine Combustion. In Proceedings of the 46th AIAA Aerospace Sciences Meeting and Exhibit, Reno, NV, USA, 7–10 January 2008; American Institute of Aeronautics and Astronautics: Reston, VA, USA, 2008. [Google Scholar]
  31. Li, L.; Suo, J.Q.; Zheng, L.X. Effect of Rotating Direction on Flow and Temperature Field of Concentric Staged Combustor. J. Northwestern Polytech. Univ. 2020, 38, 1198–1209. [Google Scholar] [CrossRef]
  32. Guo, X.; Yang, M.; Li, F.; Zhu, Z.; Cui, B. Investigation on Cryogenic Cavitation Characteristics of an Inducer Considering Thermodynamic Effects. Energies 2024, 17, 3627. [Google Scholar] [CrossRef]
  33. Wu, J.; Xu, P.; Li, L.; Li, Z.; Qi, H.; Wang, C.; Zhang, Y.; Xie, Y.; Tan, D. Multiphase dynamic interfaces and abrasive transport dynamics for abrasive flow machining in shear thickening transition states. Powder Technol. 2024, 446, 120150. [Google Scholar] [CrossRef]
  34. Li, L.; Lu, B.; Xu, W.; Wang, C.; Wu, J.; Tan, D. Dynamic behaviors of multiphase vortex-induced vibration for hydropower energy conversion. Energy 2024, 308, 132897. [Google Scholar] [CrossRef]
Figure 1. A schematic diagram of the internally staged combustor.
Energies 18 00349 g001
Figure 2. The computational fluid domain of the internally staged combustor.
Energies 18 00349 g002
Figure 3. A schematic diagram of the combustor grid.
Energies 18 00349 g003
Figure 4. Grid-independent verification.
Energies 18 00349 g004
Figure 5. The average temperature of the initial fire core at the end of discharge.
Energies 18 00349 g005
Figure 6. The radial length of the initial fire core at the end of discharge.
Energies 18 00349 g006
Figure 7. Trends in the development of fire cores at different time steps.
Energies 18 00349 g007
Figure 8. A schematic diagram of the experimental system.
Energies 18 00349 g008
Figure 9. Temperature contour of Y = 0 cross-section during ignition.
Energies 18 00349 g009
Figure 10. Flame propagation process with air flow rate when ignition is successful.
Energies 18 00349 g010
Figure 11. Flame propagation process during ignition failure.
Energies 18 00349 g011
Figure 12. Repeatability experiment of lean ignition limit fuel–gas ratio.
Energies 18 00349 g012
Figure 13. Streamline diagram of Y = 0 section axis velocity of C1 model.
Energies 18 00349 g013
Figure 14. Temperature distribution of different models at the time of full flame development in Y = 0 section.
Energies 18 00349 g014
Figure 15. The distribution of kerosene droplet size under different models in the Y = 0 section.
Energies 18 00349 g015
Figure 16. Temperature distribution of the C4 model at lean ignition fuel–gas ratio limit.
Energies 18 00349 g016
Figure 17. Velocity contour of X = 0.026 m cross-section.
Energies 18 00349 g017
Figure 18. Temperature distribution of the C5 model at lean ignition fuel–gas ratio limit.
Energies 18 00349 g018
Figure 19. Distribution of velocity flow field in Y = 0 section of C5 scheme.
Energies 18 00349 g019
Figure 20. Lean ignition fuel–gas ratios limit under different swirl numbers of the pilot module primary swirlers.
Energies 18 00349 g020
Figure 21. Optimization rate of lean ignition performance under different schemes.
Energies 18 00349 g021
Table 1. Structural parameters for different models.
SchemeThe Diameter of the Auxiliary Fuel Path Nozzles/mmSwirl Direction Combinations of Pilot SwirlersSwirl Number of Auxiliary Swirlers
C10.4 Same1.2
C20.5Same1.2
C30.6Same1.2
C40.4 Opposite1.2
C50.4 Same0.8
C60.4 Same1.6
U10.2 Opposite1.2
U20.2 Opposite1.0
U30.2 Opposite1.1
U40.2 Opposite1.4
U50.2Opposite1.6
Table 2. Comparison of experimental and numerical simulation results.
Air Inlet Mass Flow Rate (g/s)Lean Ignition
Fuel–Gas Ratio
(Numerical Simulation)
Lean Ignition Fuel and Gas Ratio
(Experimental Results)
Gap
46.70.0410.0458.9%
66.70.0390.0368.3%
83.30.0360.03329.9%
1000.0310.02839.5%
116.70.0300.02739.9%
Table 3. Lean ignition fuel–gas ratios of the different diameters of the auxiliary fuel nozzles.
SchemeLean Ignition Fuel–Gas Ratio Limit
C10.018
C20.0185
C30.019
Table 4. The limit ratio of lean ignition fuel–gas obtained by changing the pilot swirler with a rotating direction.
SchemeLean Ignition Fuel–Gas Ratio Limit
C10.018
C40.014
Table 5. The lean ignition fuel–gas ratio limit by changing the swirl number of the first pilot swirler.
SchemeLean Ignition Fuel–Gas Ratio Limit
C10.018
C50.03
C60.02
Disclaimer/Publisher’s Note: The statements, opinions and data contained in all publications are solely those of the individual author(s) and contributor(s) and not of MDPI and/or the editor(s). MDPI and/or the editor(s) disclaim responsibility for any injury to people or property resulting from any ideas, methods, instructions or products referred to in the content.

