Article

A Study on the Performance of Soiled Solar Photovoltaic Panels at Different Tilt Angles in Al Seeb, Oman

by
Girma T. Chala
1,*,
Shaharin A. Sulaiman
2 and
Xuecheng Chen
3,*
1
Department of Mechanical Engineering (Well Engineering), International College of Engineering and Management, P.O. Box 2511, C.P.O Seeb, Muscat 111, Oman
2
Department of Mechanical Engineering, Universiti Teknologi PETRONAS, Seri Iskandar 32610, Perak, Malaysia
3
Faculty of Chemical Technology and Engineering, West Pomeranian University of Technology, Piastów Ave. 42, 71-065 Szczecin, Poland
*
Authors to whom correspondence should be addressed.
Energies 2025, 18(2), 301; https://doi.org/10.3390/en18020301
Submission received: 12 December 2024 / Revised: 8 January 2025 / Accepted: 8 January 2025 / Published: 11 January 2025
(This article belongs to the Section A2: Solar Energy and Photovoltaic Systems)

Abstract

:
Climate and weather conditions greatly affect photovoltaic (PV) module performance and efficiency, particularly in desert environments. Dust accumulation, which significantly reduces power generation efficiency, is currently the main issue facing photovoltaic modules since it affects the return on investment of PV systems. It is believed that the tilt angle of solar PV panels can be helpful in reducing the effect of soiling using the gravitational force experienced by the dust particles, mainly in dry environments. In this work, experimental studies were conducted to investigate the effects of the tilt angle and dust deposition on the electrical power generation performance of photovoltaic modules under weather conditions in Al Seeb, Oman. The study was conducted by exposing solar PV panels to outdoor sunlight for two weeks. Two of the PV panels with fixed and different tilt angles were cleaned on a daily basis, while another panel was left uncleaned. A comparison was made with the panel that was not cleaned for an extended time. Measurements included solar irradiance, solar panel temperature, voltage, and current. The output power and efficiency reached 93.5 W and 24.5%, respectively, for the panel cleaned daily. Furthermore, soiling resulted in an 18.8% power loss. The results showed that the highest output power of 79.75 W was observed at an angle of 25°, with an efficiency of up to 20.5%. Moreover, the power generated was up to 9.8% higher than that at different tilt angles.

1. Introduction

The need for energy is growing daily due to technological advancement and the rapid growth of the global population [1,2,3]. Numerous countries are adopting renewable energy sources, particularly solar energy, for different sectors [4,5,6]. The use of photovoltaics to generate electricity from solar energy is considerable and could solve the current global warming problems [7,8,9]. The photovoltaic industry is expanding quickly, reaching 23.5 GW globally in 2010 and expanding at an average growth rate of 35–40% yearly, making it one of the industries with the quickest growth [10]. The global solar installed capacity increased by 203 GW in 2022 [11].
Due to the impacts of air pollution and the deposition of dust particles that are different in composition, size, and type, PV systems’ productivity and performance are adversely affected [12]. One of the biggest challenges solar photovoltaic generators face is dust accumulation, resulting in damage to the panel surfaces and a reduction in photovoltaic system performance [13,14,15]. The performance of photovoltaic energy units has been discovered to be greatly affected by dust accumulation on the units’ surfaces [16,17,18]. An accumulation of 4 g/m2 of dust on a solar module’s surface, for example, may reduce the output power by approximately 40% [19].
It is essential to ascertain the features of dust deposition of photovoltaic modules to create precise recommendations for developing dust removal efforts to increase solar efficiency. Dust collection appears to affect the thermal performance, the temperature, and the electrical characteristics of solar power production systems, such as the output power, open-circuit voltage, and short-circuit current [20,21]. It was reported that there is an upward correlation between humidity and particle size and an inverse relationship between wind speed and the angle of inclination, with the loss of the kinetic energy of particles from impacts equal to 10–13 J. The number of deposited particles decreases and subsequently increases with wind speed and particle size. Conversely, it rises with an increase in humidity and falls with an increasing inclination angle [22]. Al Siyabi et al. [23] noted that an increase in daylight humidity raises the humidity of the photovoltaic surface, leading to mud accumulation and lowering the efficiency of the solar panels.
A photovoltaic cell’s efficiency varies depending on the environment; some places recieve a lot of rain, while others experience significant dust accumulation [24,25]. Over five months in Nepal, where the dust concentration on photovoltaic panels was 9.67 g/m2, Paudyal et al. [26] investigated the correlation between the dust concentration and meteorological variables as well as the loss of the conversion efficiency of solar panels. The study observed that the efficiency of a dirty solar cell exposed to dust deposition was reduced by 30% compared to a regularly cleaned panel. The solar cell was also permanently damaged due to the concentration of dust that was collected at its lowest point. Conversely, the deposition had a 30–40% impact on the short-circuit current but was not the sole factor impacting the open-circuit voltage and the current [26].
In a different study, Mohandes et al. [27] examined the effects of temperature, humidity, and dust on the functionality of 500 W photovoltaic modules installed in the United Arab Emirates. The study showed that dew could collect on the surfaces of the solar PV systems. They also observed a significant amount of tiny dust particles in the air, which was supported by the fact that dry places have low temperatures at night. However, the dew evaporated during the day as the temperature increased, leaving a coating of dust in its place. The results indicate that the maximum power was reduced with humidity and that dust buildup caused a 10% maximum power drop in just five weeks [27]. The angle of inclination is one of the factors that influence dust deposition. Dust deposition occurs very quickly on flat surfaces where the inclination angle is zero due to the force of gravity. Since it was discovered that the deposition of dust decreases with the inclination of the angle of the horizontal axis, the ability of the PV panel surface to hold dust is the poorest when the tilt angle is at 90°, simplifying the continuous removal of dust [28]. In addition, Jiang et al. [29] investigated the efficiency of different PV panels under various conditions, including airborne dust, a solar simulator, and a test area. It appeared that when the dust density increased to 22 g/m2, the efficiency reduction increased to 26%. Moreover, precipitation affects the process of dust deposition, as it causes an increase in dust deposition. It was reported that precipitation of at least 20 mm is needed to remove dust from a solar cell’s surface in very dry areas. When there has not been any rain, the dust transforms into mud, and therefore cleaning must be carried out mechanically [28].
Solar panel efficiency can be improved via cleaning, even though conducting this comes at a high maintenance cost [30]. Typically, cleaning cycles for photovoltaic facilities are pre-planned based on the predicted contamination losses at their locations [31]. An automatic or manual cleaning system can be used for solar panels. Cleaning can be either dry or wet, depending on several variables, including the type and quantity of dust present [32]. Though there are studies on the performance of photovoltaic panels exposed to dust, there have been limited studies on the cleaning of photovoltaic panels and limited comparisons of cases with different tilt angles. Therefore, the objective of this study is to investigate the impact of dust on photovoltaic (PV) performance in Al Seeb, Oman, by tracking the degradation of PV performance under external climatic conditions, as well as the inclination angle. Thus, this study provides an extensive analysis of the impact of dust and the optimal inclination angle for enhancing the power generated from solar photovoltaic panels.

2. Experimental Setup and Techniques

The experiment was carried out in Al Seeb, Muscat, Oman. The Arabian Peninsula’s extreme southeast is home to the Sultanate of Oman. The Rub’ al-Khali, an area of the Arabian Peninsula that is sandy, treeless, and largely dry, contains a large portion of the country’s interior. Oman usually experiences hot, dry weather in the interior and hot, humid weather around the shore. The capital city of Muscat has summer temperatures as high as 43 °C. The average low temperature during the mild winters is around 17 °C. Rainfall is low over the entire country, averaging approximately 100 mm annually; however, it is higher in the mountains [33]. The experiment was conducted for two weeks during the winter season.
Oman experiences an annual occurrence of sandstorms, typically during the summer months, when the region is subjected to high temperatures and dry conditions. These natural phenomena are characterized by strong winds carrying vast amounts of fine sand and dust particles across the landscape, leading to reduced visibility and deterioration of air quality. The effects of sandstorms on solar PV systems in Oman can be considerable. Figure 1 shows a schematic diagram of the experimental setup. Three monocrystalline half-cut photovoltaic modules were used to investigate how sand dust deposition affects photovoltaic panel performance. In addition, three glass panels were also installed parallel to the solar panels, which were situated at coordinates 23°34′34″ N 58°18′07″ E and set at a height of 1.2 m from the ground. The rated power of the photovoltaic panels was 100 W, with an open-circuit voltage (Voc) of 22.6 V. Solar irradiance was measured under each glass panel using a solarimeter. Each solar PV panel had 1–3 thermal sensors (PT100 temperature probe) at different points below the panels to measure the panel temperature. Voltage and current transmitters of 4–20 mA were used to measure the voltage and current in real time. A data logger was connected to the solar PV panels to record the standard characteristics, including the ambient temperature, solar radiation, open-circuit voltage, short-circuit current, and solar panel temperature. It had 26 channels connected to the solar PV and glass panels for data acquisition. The power and efficiency were then calculated from the data.
Panel 1 was kept at a tilt angle of 20° and cleaned every morning manually using towels, referred to hereafter as the cleaned panel. Panel 2 was used to tilt the angle and was cleaned similarly to Panel 1, but the angles were changed daily to 10°, 25°, 30°, 40°, 45°, and 55°, referred to hereafter as the inclined panel. Panel 3, exposed to sand dust and not cleaned for a long time, was used as a reference for the experiment to represent a prolonged uncleaned panel. Dust accumulated on the photovoltaic panel was measured by wiping the dust off the solar panel with a towel, and it was measured before data collection. A digital analytical balance with an accuracy of ±0.001 g and with a precise and stable dual-screen display was used to measure the mass of dust. The mass of the towel was measured after it had been dampened with water. The mass of the collected dust made up the difference between the two masses of the towel. Table 1 shows specifications of the PV panels.

3. Results and Discussion

3.1. Effect of Daily Cleaning on the Solar Panel

A comparison was made between the cleaned and uncleaned photovoltaic panels. Figure 2 shows the variation in the maximum temperature of the panels’ bottom surface over time (during days and hours). The results show that the bottom surface temperature of the PV modules increased with time. In addition, the temperature of the cleaned panel was higher than the uncleaned panel, which was likely due to the dust acting as a natural insulation for solar radiation. The maximum surface temperature of the solar panels that were cleaned was 52 °C, while it was 45.4 °C for the solar panels that were not cleaned (See Figure 2a). Figure 2b shows the results during the day. It is noted that the temperature increased between 10:30 and 11:00, reaching the highest during this duration. It then began to decrease, so the cleaned panel recorded the highest value, which was 40.9 °C.
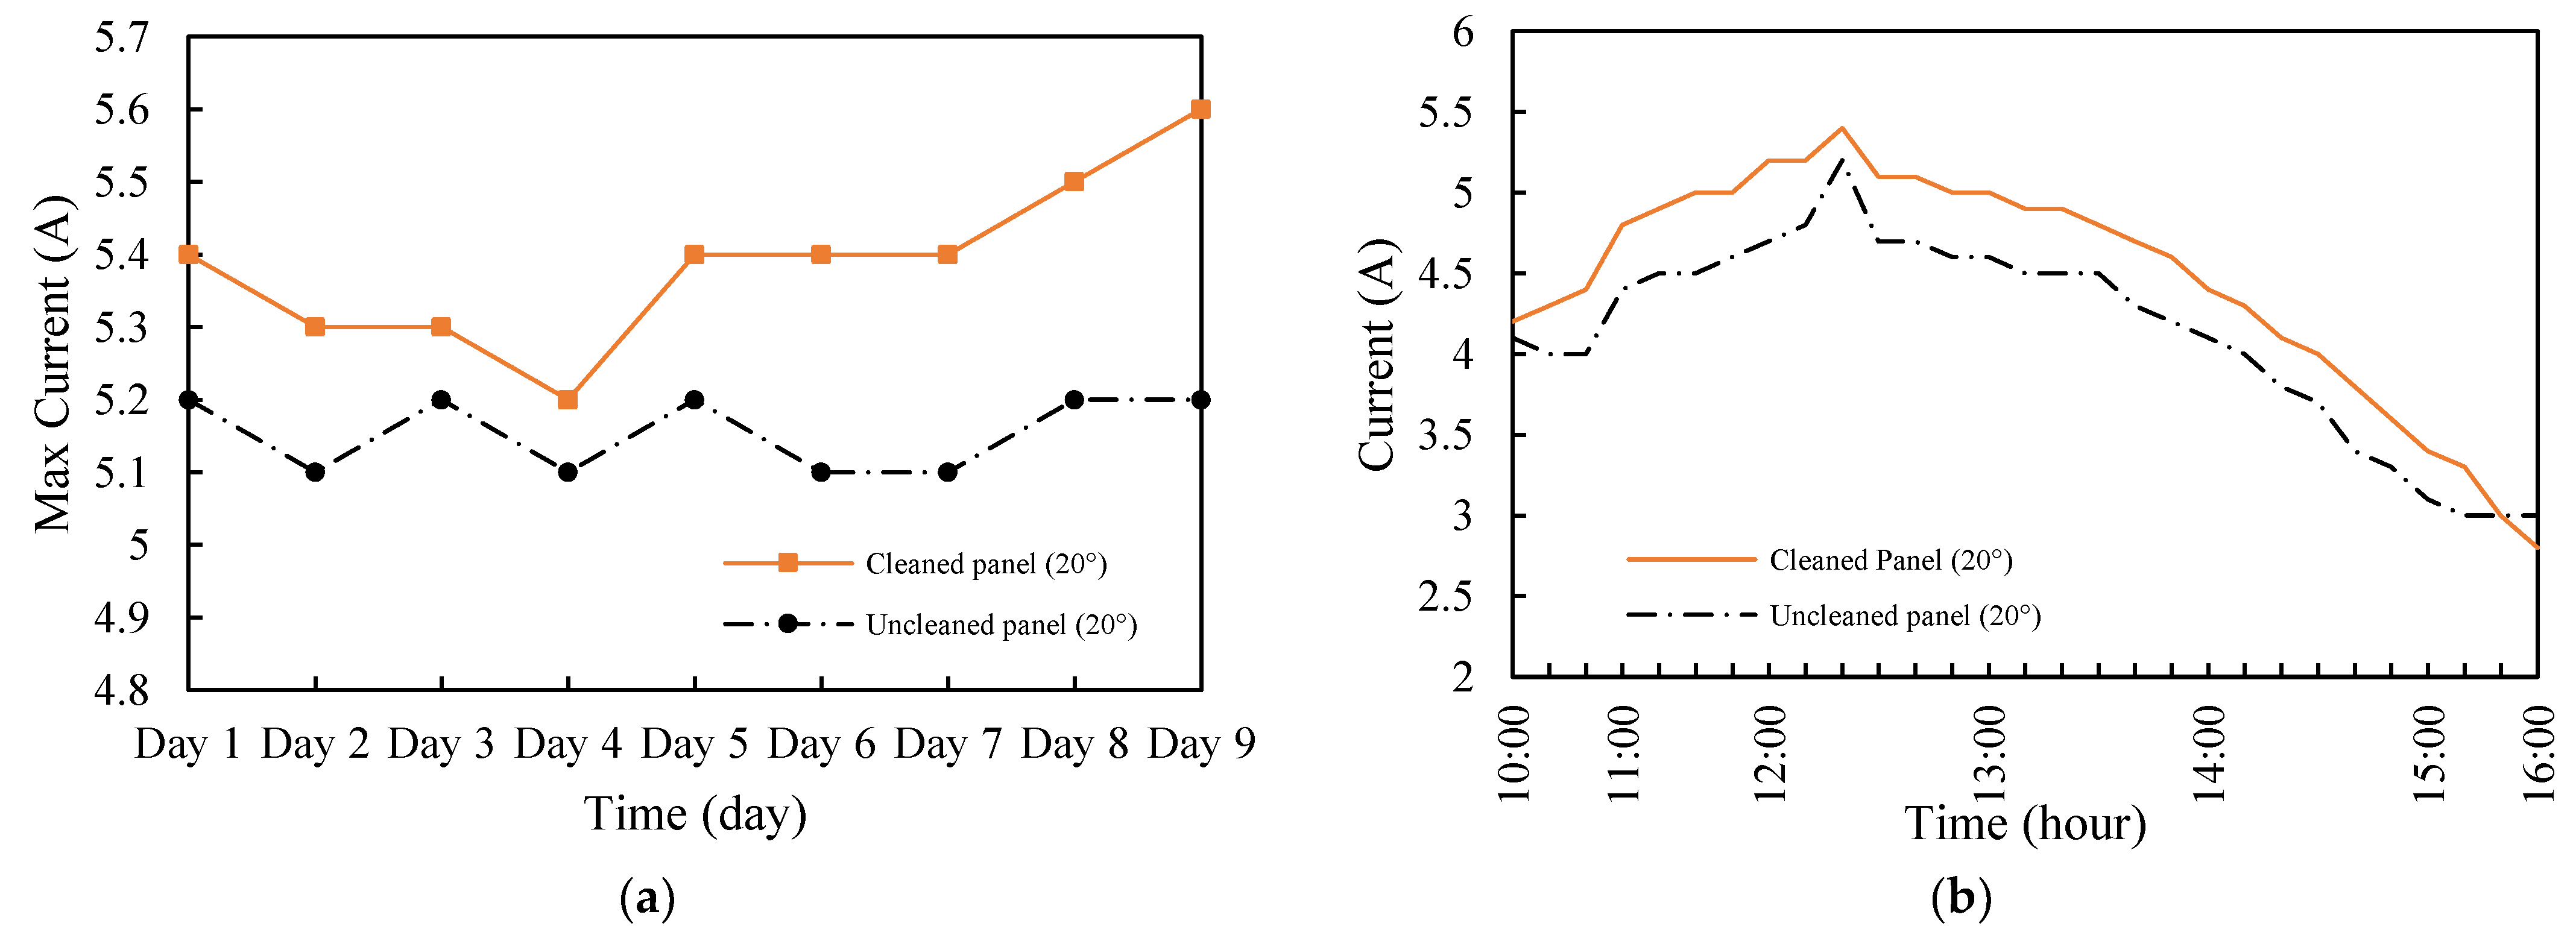
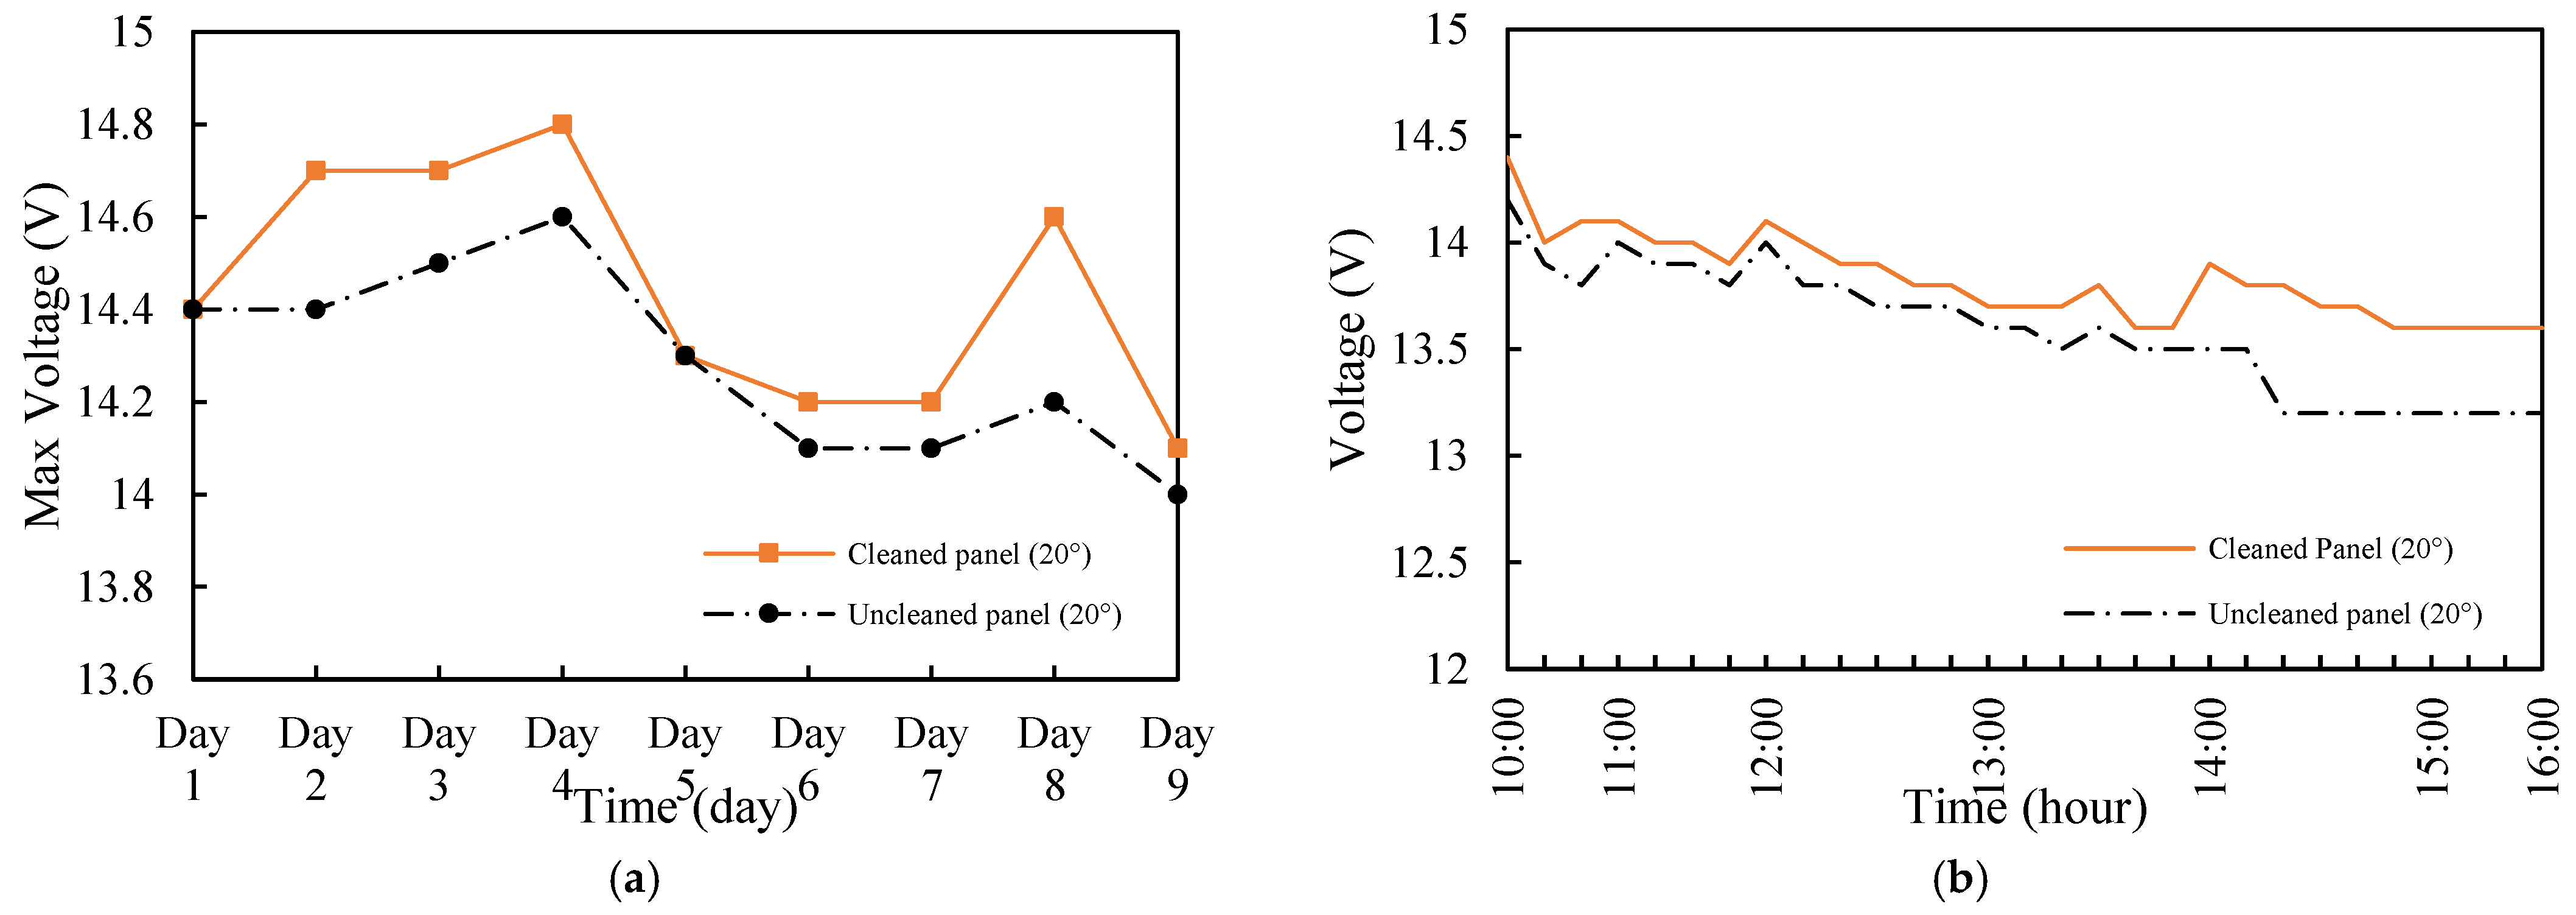
Figure 3 and Figure 4 show the output current and voltage with time. The results show that the output voltage and current of the cleaned panel were in ideal conditions. Therefore, this ideality changed when dust and dirt were deposited, as was the case with the uncleaned panel. Voltage and current are related to temperature. When the temperature rises, the voltage decreases, increasing the current. As shown in Figure 3a and Figure 4a, during the day for the cleaned photovoltaic panel, the highest current and voltage values were 5.6 A and 14.1 V, and the minimum values were 5.2 A and 14.8 V. The maximum voltage and current were 14.4 V and 5.2 A for the panel that was not cleaned, while the lowest values were 14.6 V and 5.1 A. Figure 3b and Figure 4b show the relationship during the day. It is observed that the current increased with increasing time and then began to decrease. In contrast, the voltage was observed to decrease over time. Mainly, the temperature impacted the voltage output of the solar panels.
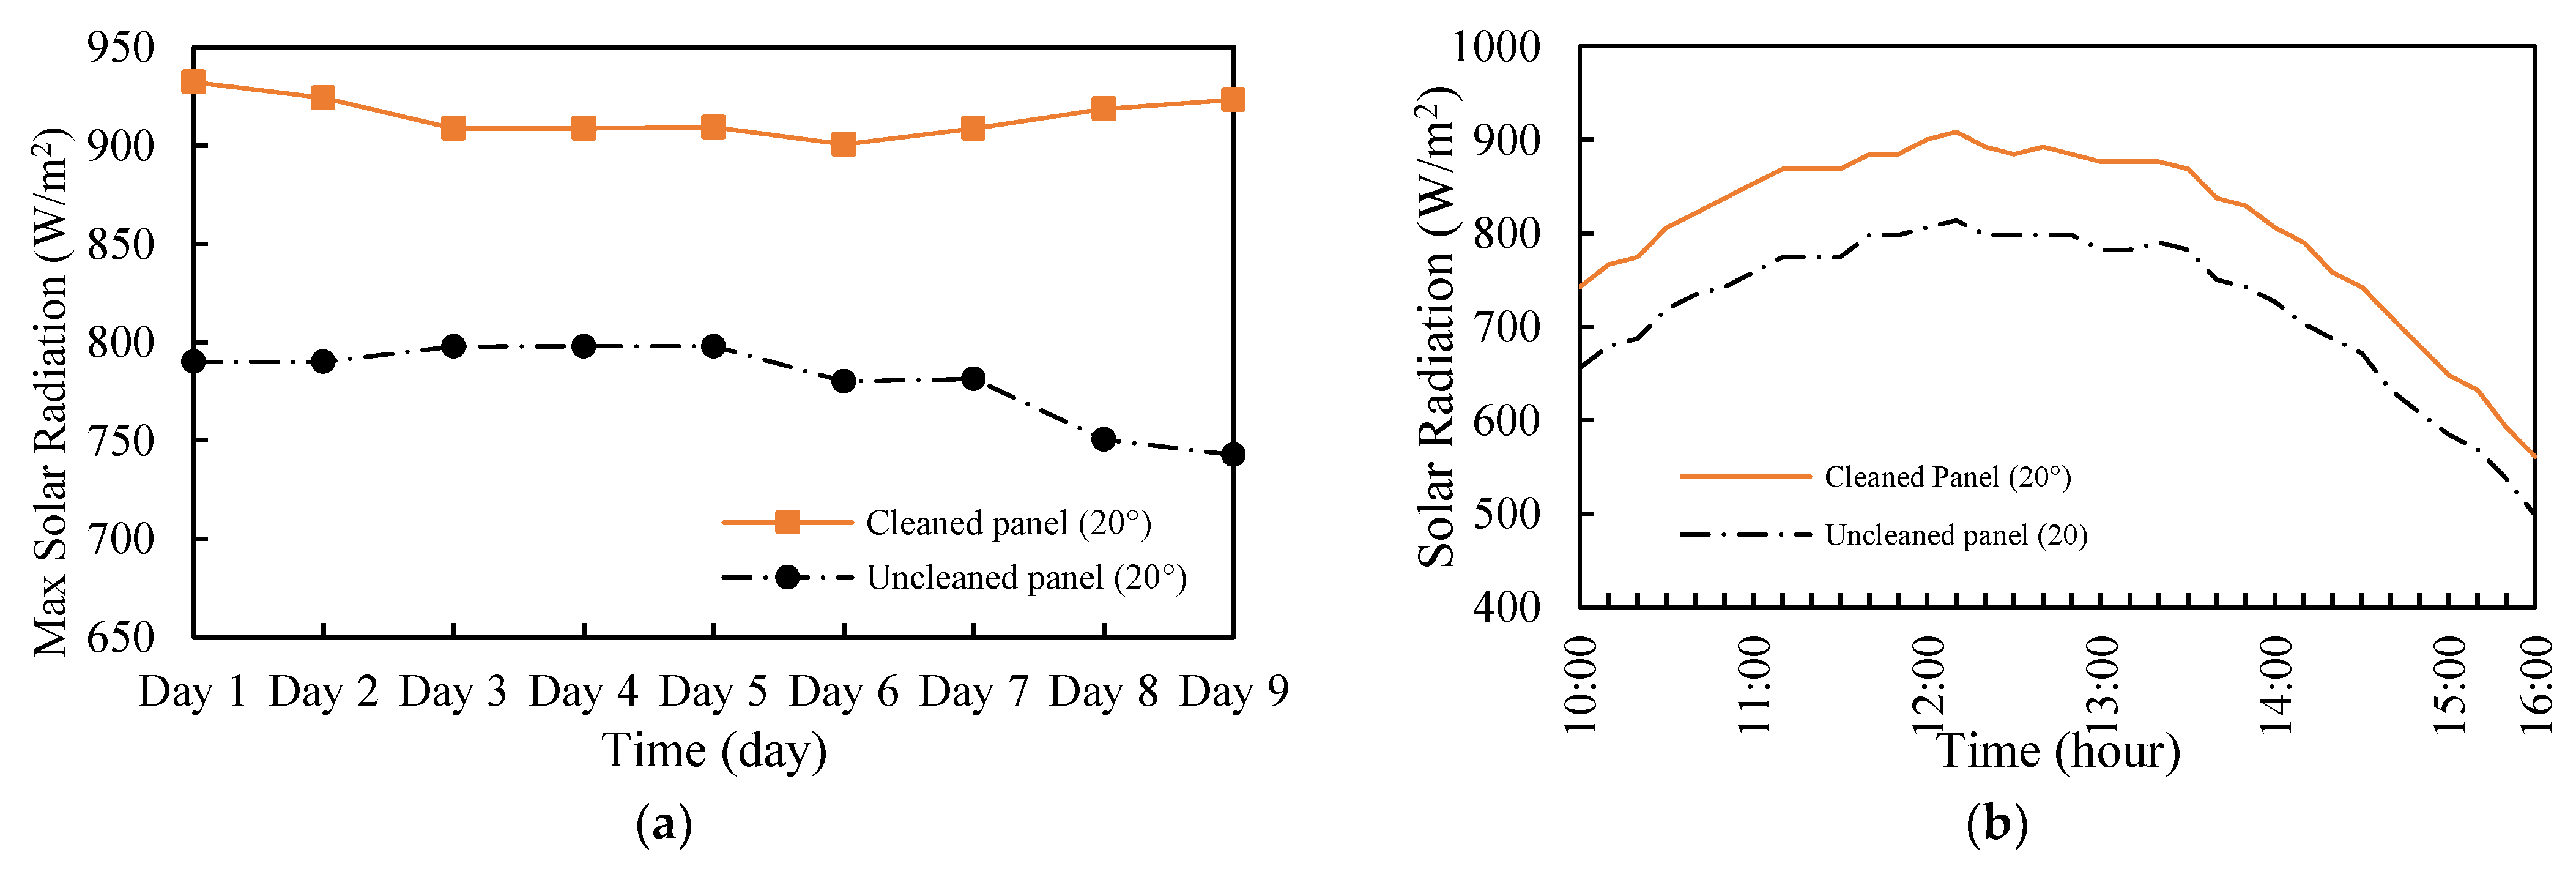
Figure 5 shows the solar radiation variation with time. The results show that the cleaned photovoltaic panel received more solar radiation than the uncleaned photovoltaic panel, and this was due to the dust deposited on the panel preventing solar radiation from entering the panel. During the day, the highest value for the cleaned photovoltaic panel reached 932 W/m2, whereas the uncleaned photovoltaic panel had a value that was lower by 134 W/m2 (a reduction of over 14%). It can be seen in the figure that the output power reduction was significantly more severe for comparatively lower sun radiation. This result was most likely caused by the deposited dust comparatively increasing the effect of reflecting light [29].
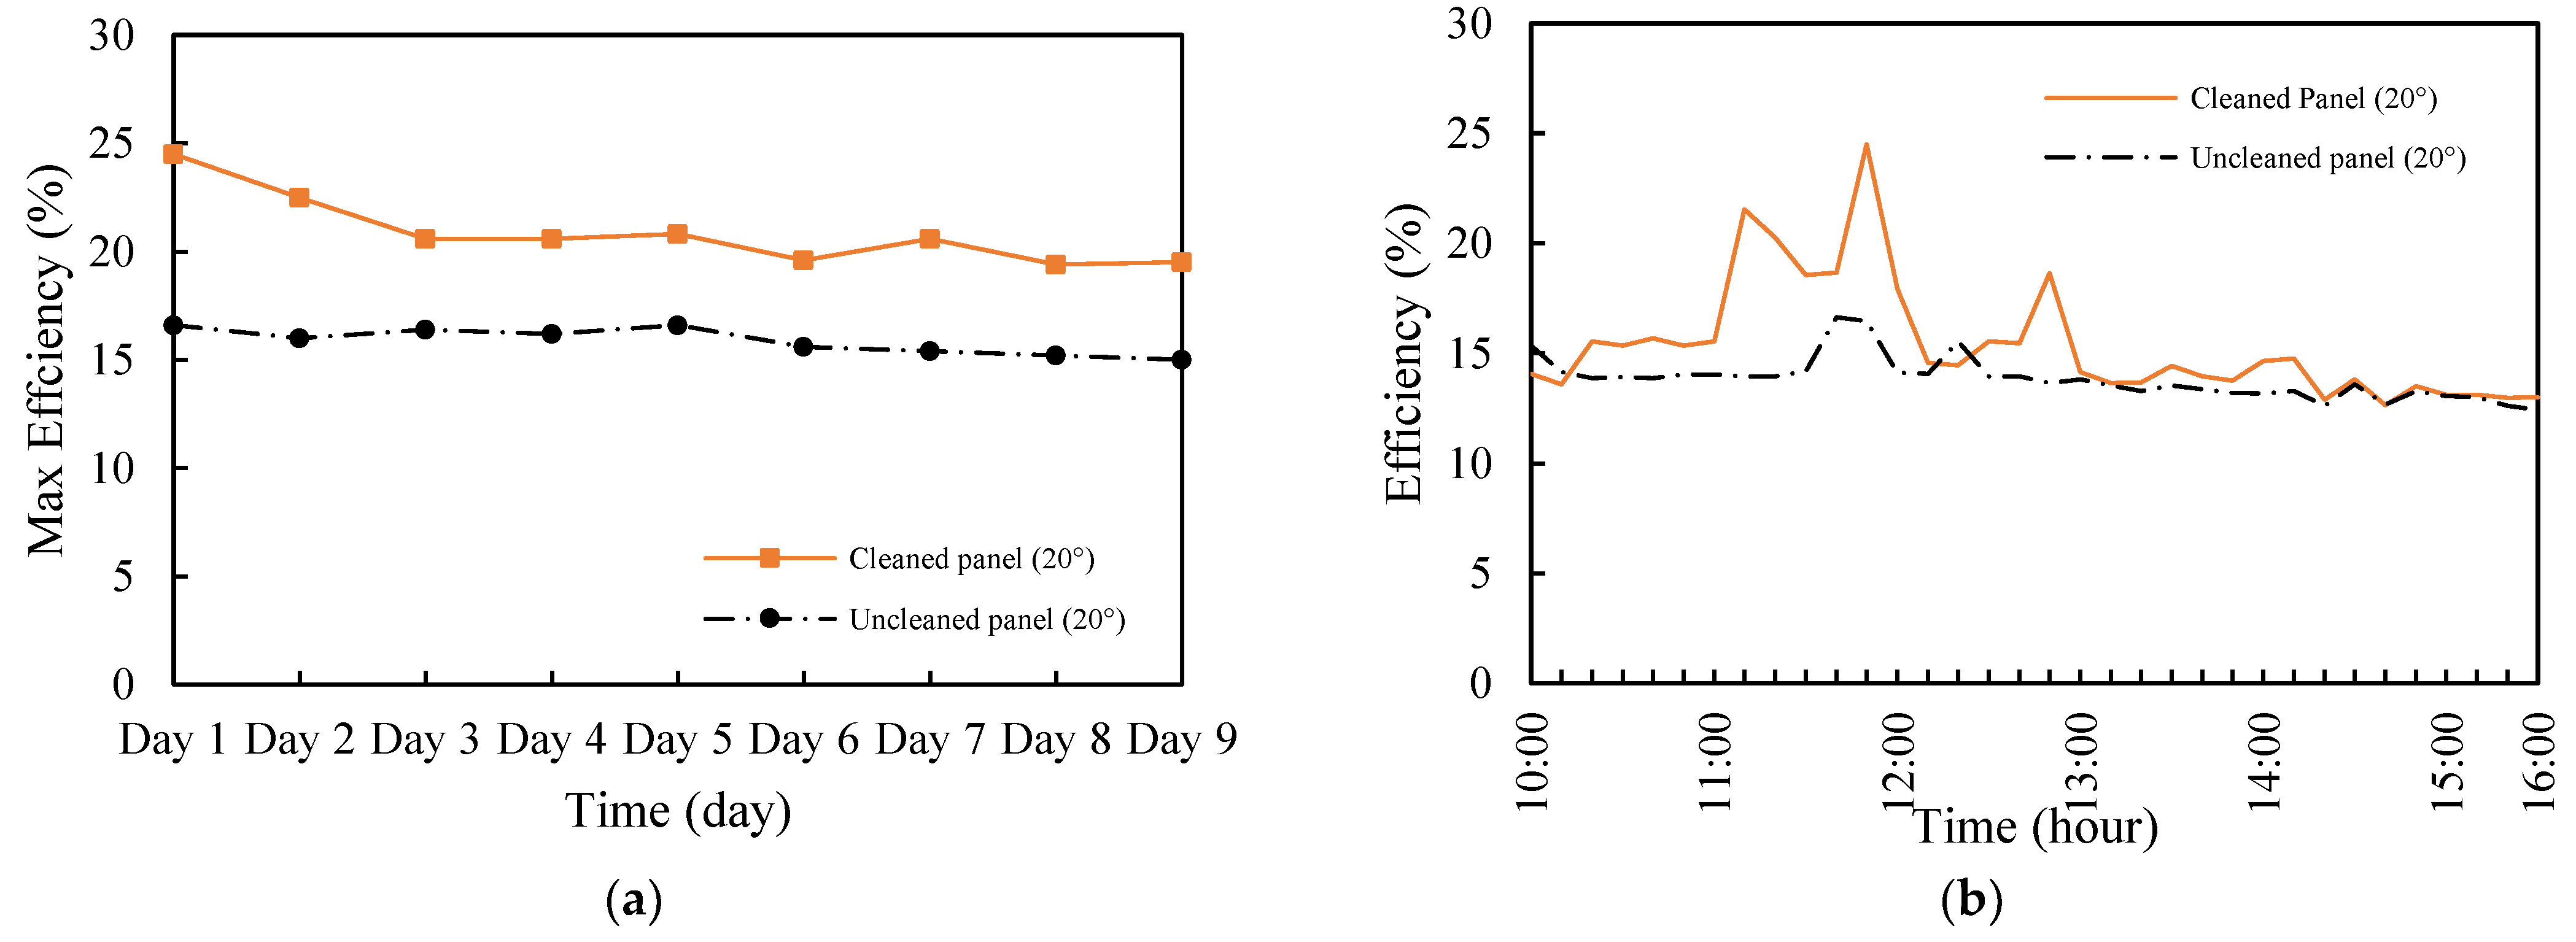
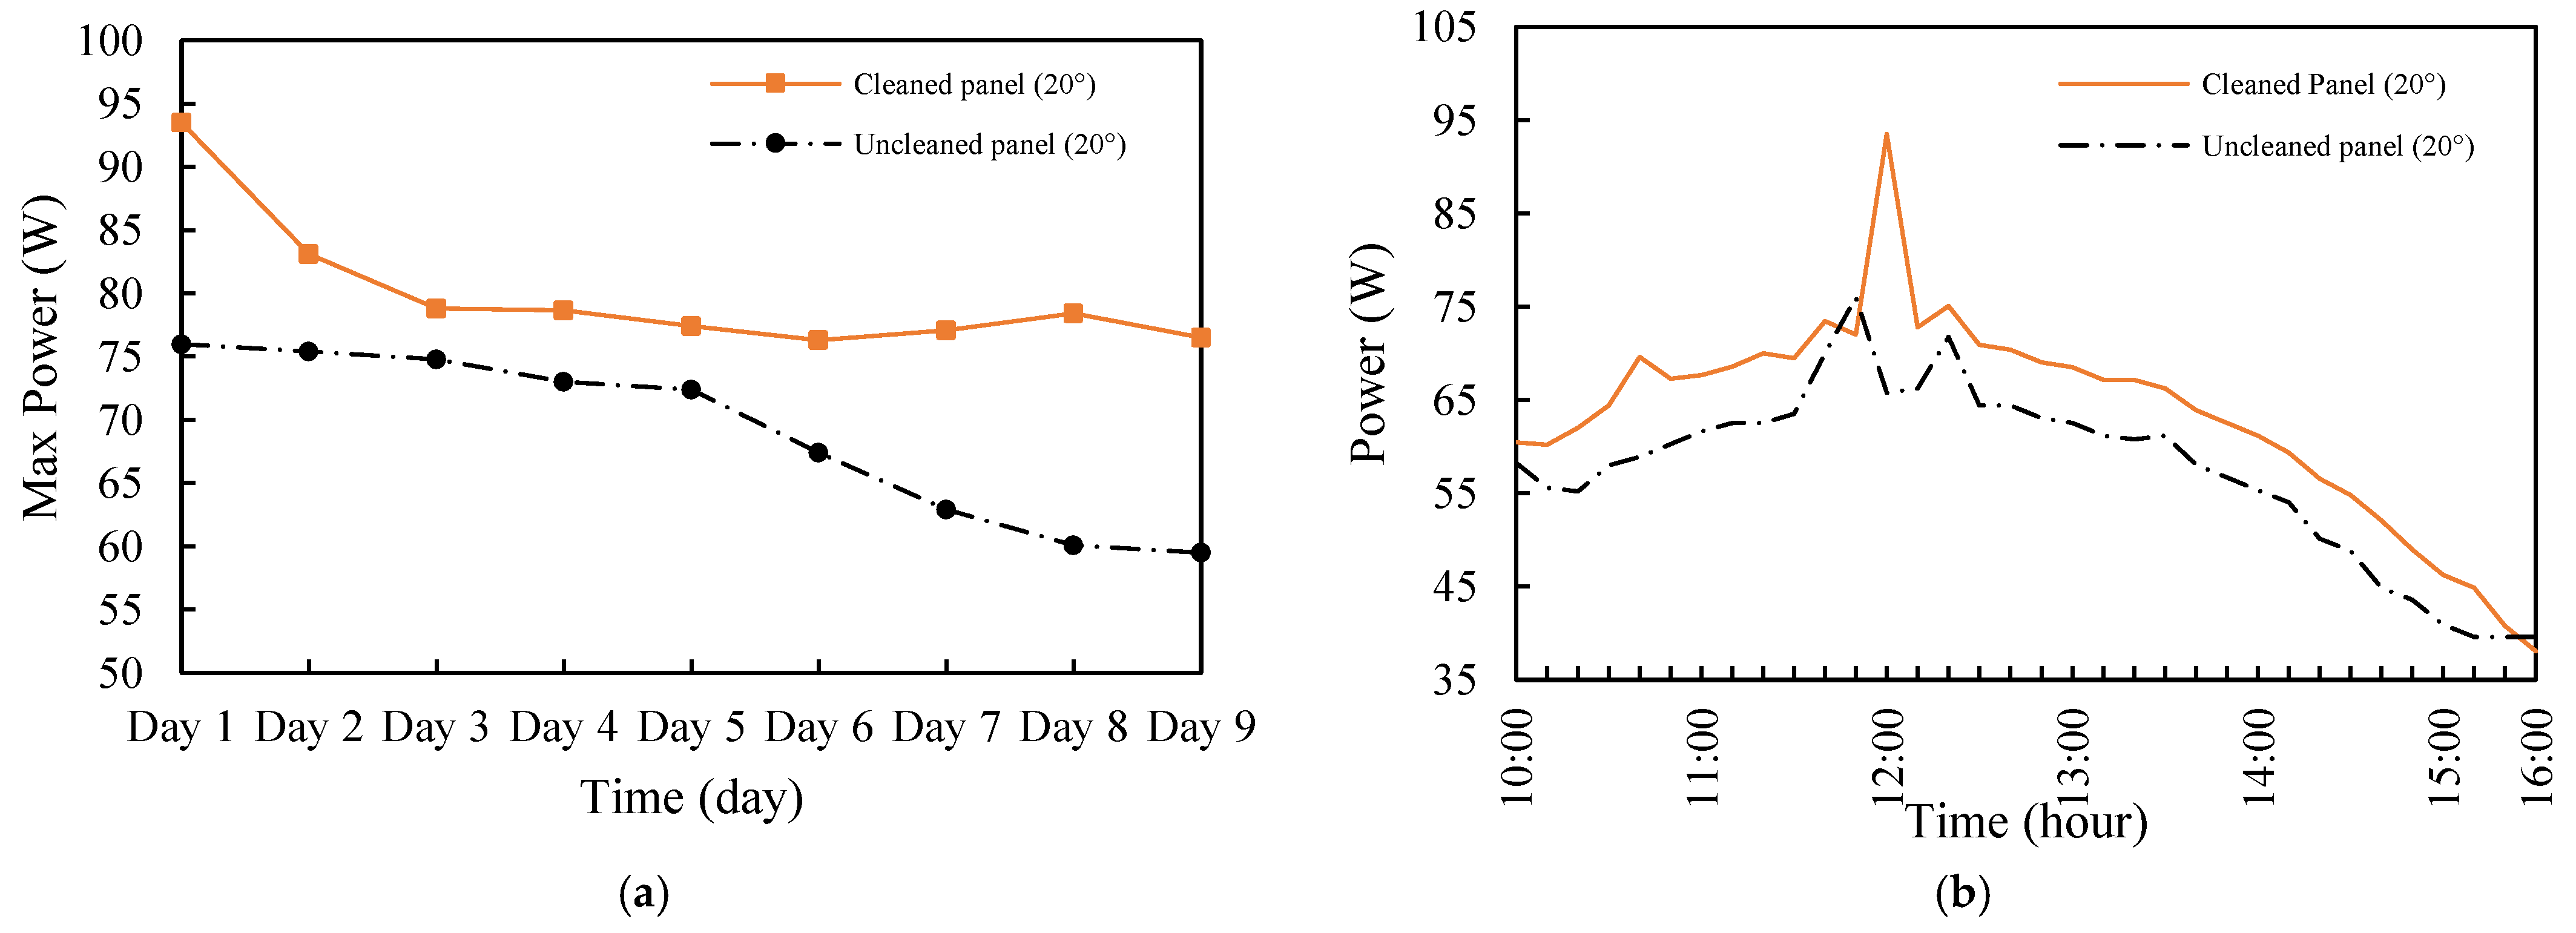
Figure 6 and Figure 7 show the output power and efficiency over time. All the previous parameters were related to each other. Since the photocurrent is directly influenced by the irradiance, the output power of the solar module reflects this relationship. The results show that the highest power generated was 93.5 W with an efficiency of 24.5% for the cleaned photovoltaic panel. The slightly higher efficiency on day 1 could be attributed to reduced reflection during the measurements. The highest power value reached 75.9 W with an efficiency of 16.6% for the uncleaned panel. This indicates that constantly cleaning the panel is very important, as dust deposition on the panel reduces the energy output and the efficiency of photovoltaic panels. According to Bashir et al. [34], a PV module’s output power varies linearly with solar irradiation. Thus, irradiance is the main factor influencing solar module power production. Furthermore, daily manual cleaning is an excellent way to increase the efficiency of solar panels. However, if the weather is humid and rainy, this method becomes relatively complicated because dust accumulates in the form of mud, making it difficult to clean manually [23]. El-Nashar et al. [35] examined the effects of dust deposition on PV performance in the United Arab Emirates (UAE) on a seasonal basis. The results show that the glass transmittance reduction was more prominent in the summer, at about 10%, and lower in the winter, at 6%. The findings also indicate that over a year, a 70% efficiency loss was observed when the PV module was not cleaned. Additionally, studies have shown that a single dust storm could reduce the performance of PV modules by almost 20%.
On the other hand, as shown in Figure 8, the amount of deposition on the photovoltaic panel indicates that the highest amount of deposition reached 0.2 g. The deposition amount also depended on several factors, such as wind speed, humidity, temperature, and other characteristics. These factors reduce or increase dust fall. In line with this, Lu et al. [32] investigated how wind speed affects the deposition of particles of different sizes. They discovered that similar results can be observed at different wind speeds, increasing the dust diameter with the deposition rate. The maximum dust deposition diameter was 100 mm at a 1.3 m/s wind speed and 150 mm at 2.6 m/s. This was due to the interaction between various particle masses and wind speeds [36].

3.2. Effects of Title Angles on the Performance of Photovoltaic Panels

The tilt angle significantly impacted the solar panels’ ability to collect energy. Moreover, it significantly influenced the particle deposition density, which, in turn, influenced the efficiency of solar energy collection. Figure 9a,b show the temperature profiles of the PV panels at inclination angles of 25° and 45° and for the PV panels at an angle of 20°. The temperature of the cleaned panel at an angle of 25° increased compared to the cleaned panel at angles of 20° and 45°, indicating that increasing the tilt angle results in a decrease in temperature, and vice versa. Figure 9c shows the temperature profile of the photovoltaic panels at different inclination angles. It was observed that the highest temperature reached was 44.7 °C at 25°, while the lowest temperature reached was 33.9 °C at an angle of 55°.
Figure 10a,b compare the current between the cleaned panels at a 20° tilt angle and those at angles of 25° and 45°, respectively. The results show that the current of the cleaned panels at an angle of 25° increased compared to the cleaned panels at angles of 20° and 45°. The maximum value of the photovoltaic panel current was 5.6 A for the 25° angle, 5.4 A for the 45° angle, and 4.7 A for the 20° angle, and the lowest value of 0.6 A was observed for all angles. An increase in the tilt angle reduced the current. This can be seen in Figure 10c, where the highest current value reached 5.7 A at an angle of 25°, while the lowest current value reached 4.5 A at an angle of 45°.
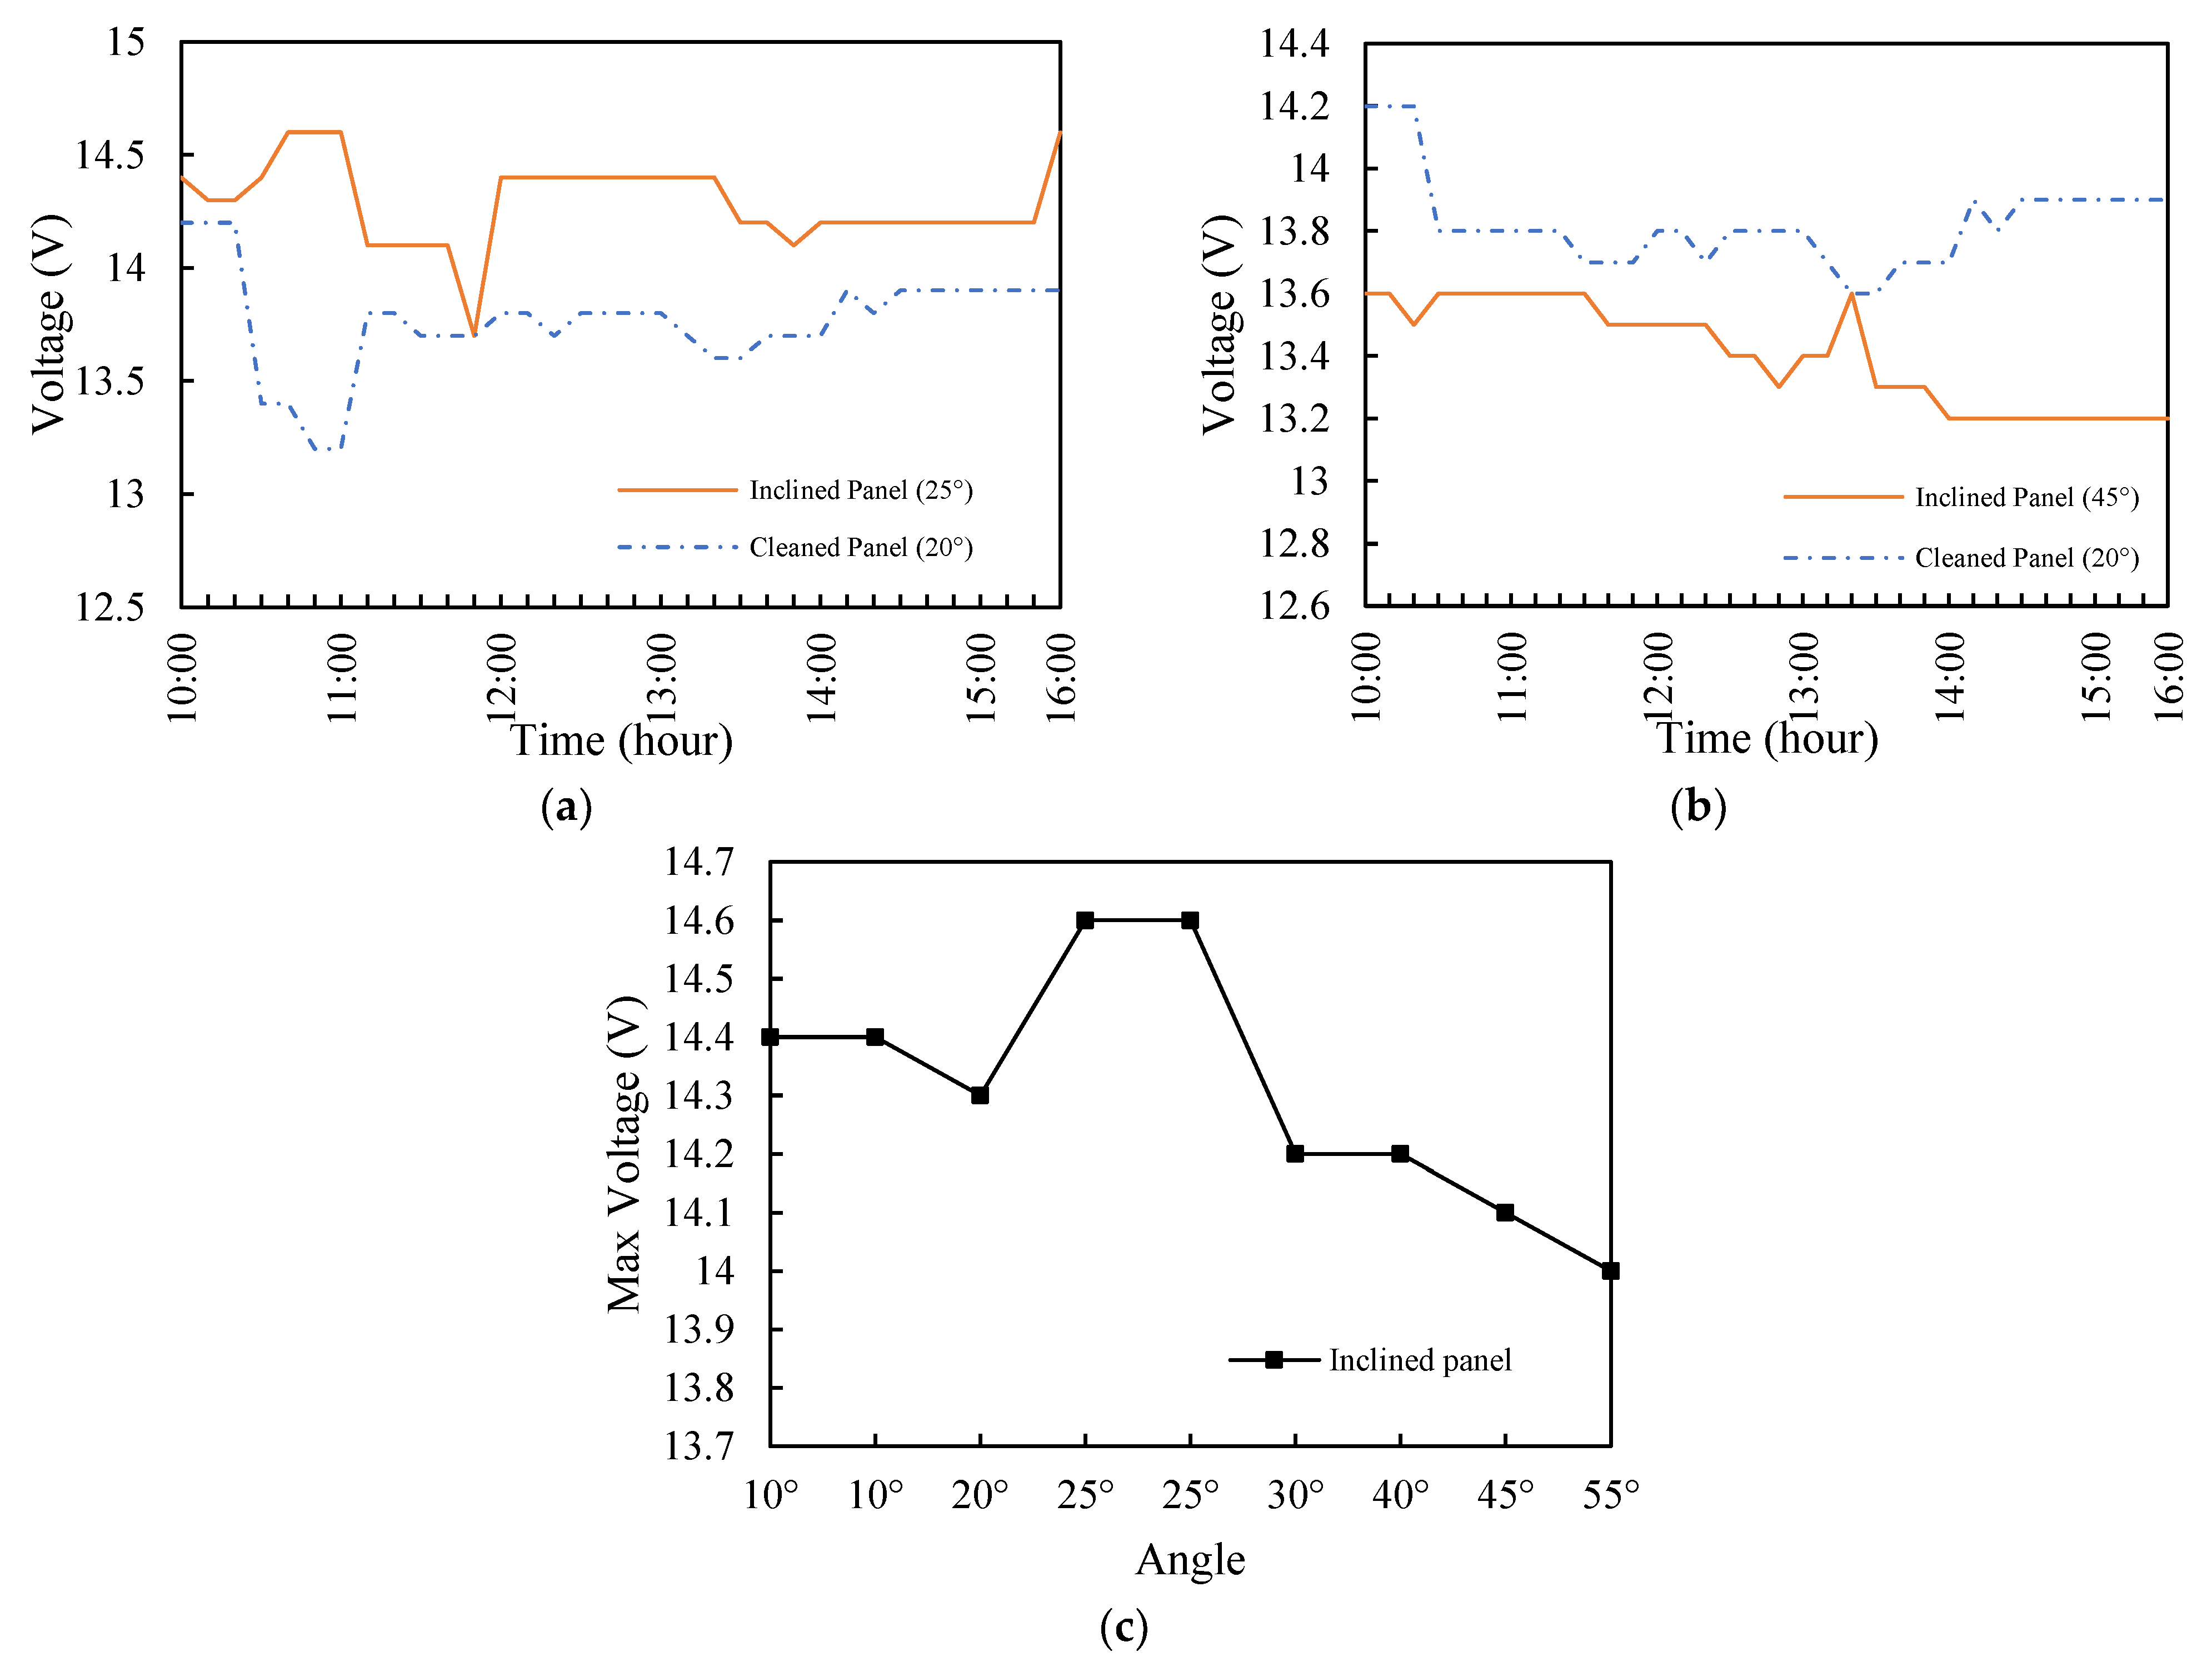
Figure 11a,b show the voltage profile of the cleaned PV panel with 45° and 25° angles and the cleaned PV panel with a 20° angle. The results show that the voltage on the cleaned panel at an angle of 25° increased compared to the cleaned panel at an angle of 20° and 45°. The maximum voltage of the photovoltaic panel was 14.3 V at an angle of 25°, 13.5 V at an angle of 45°, and 14.2 V at an angle of 20°. The minimum value was 12.8 V. Figure 11c shows the voltage development of the photovoltaic panels for the different inclination angles. The highest voltage value reached 14.6 V at an angle of 25°, and the lowest value reached 14 V at an angle of 55°. It can be summarized that an increase in the inclination angle reduces the voltage value.
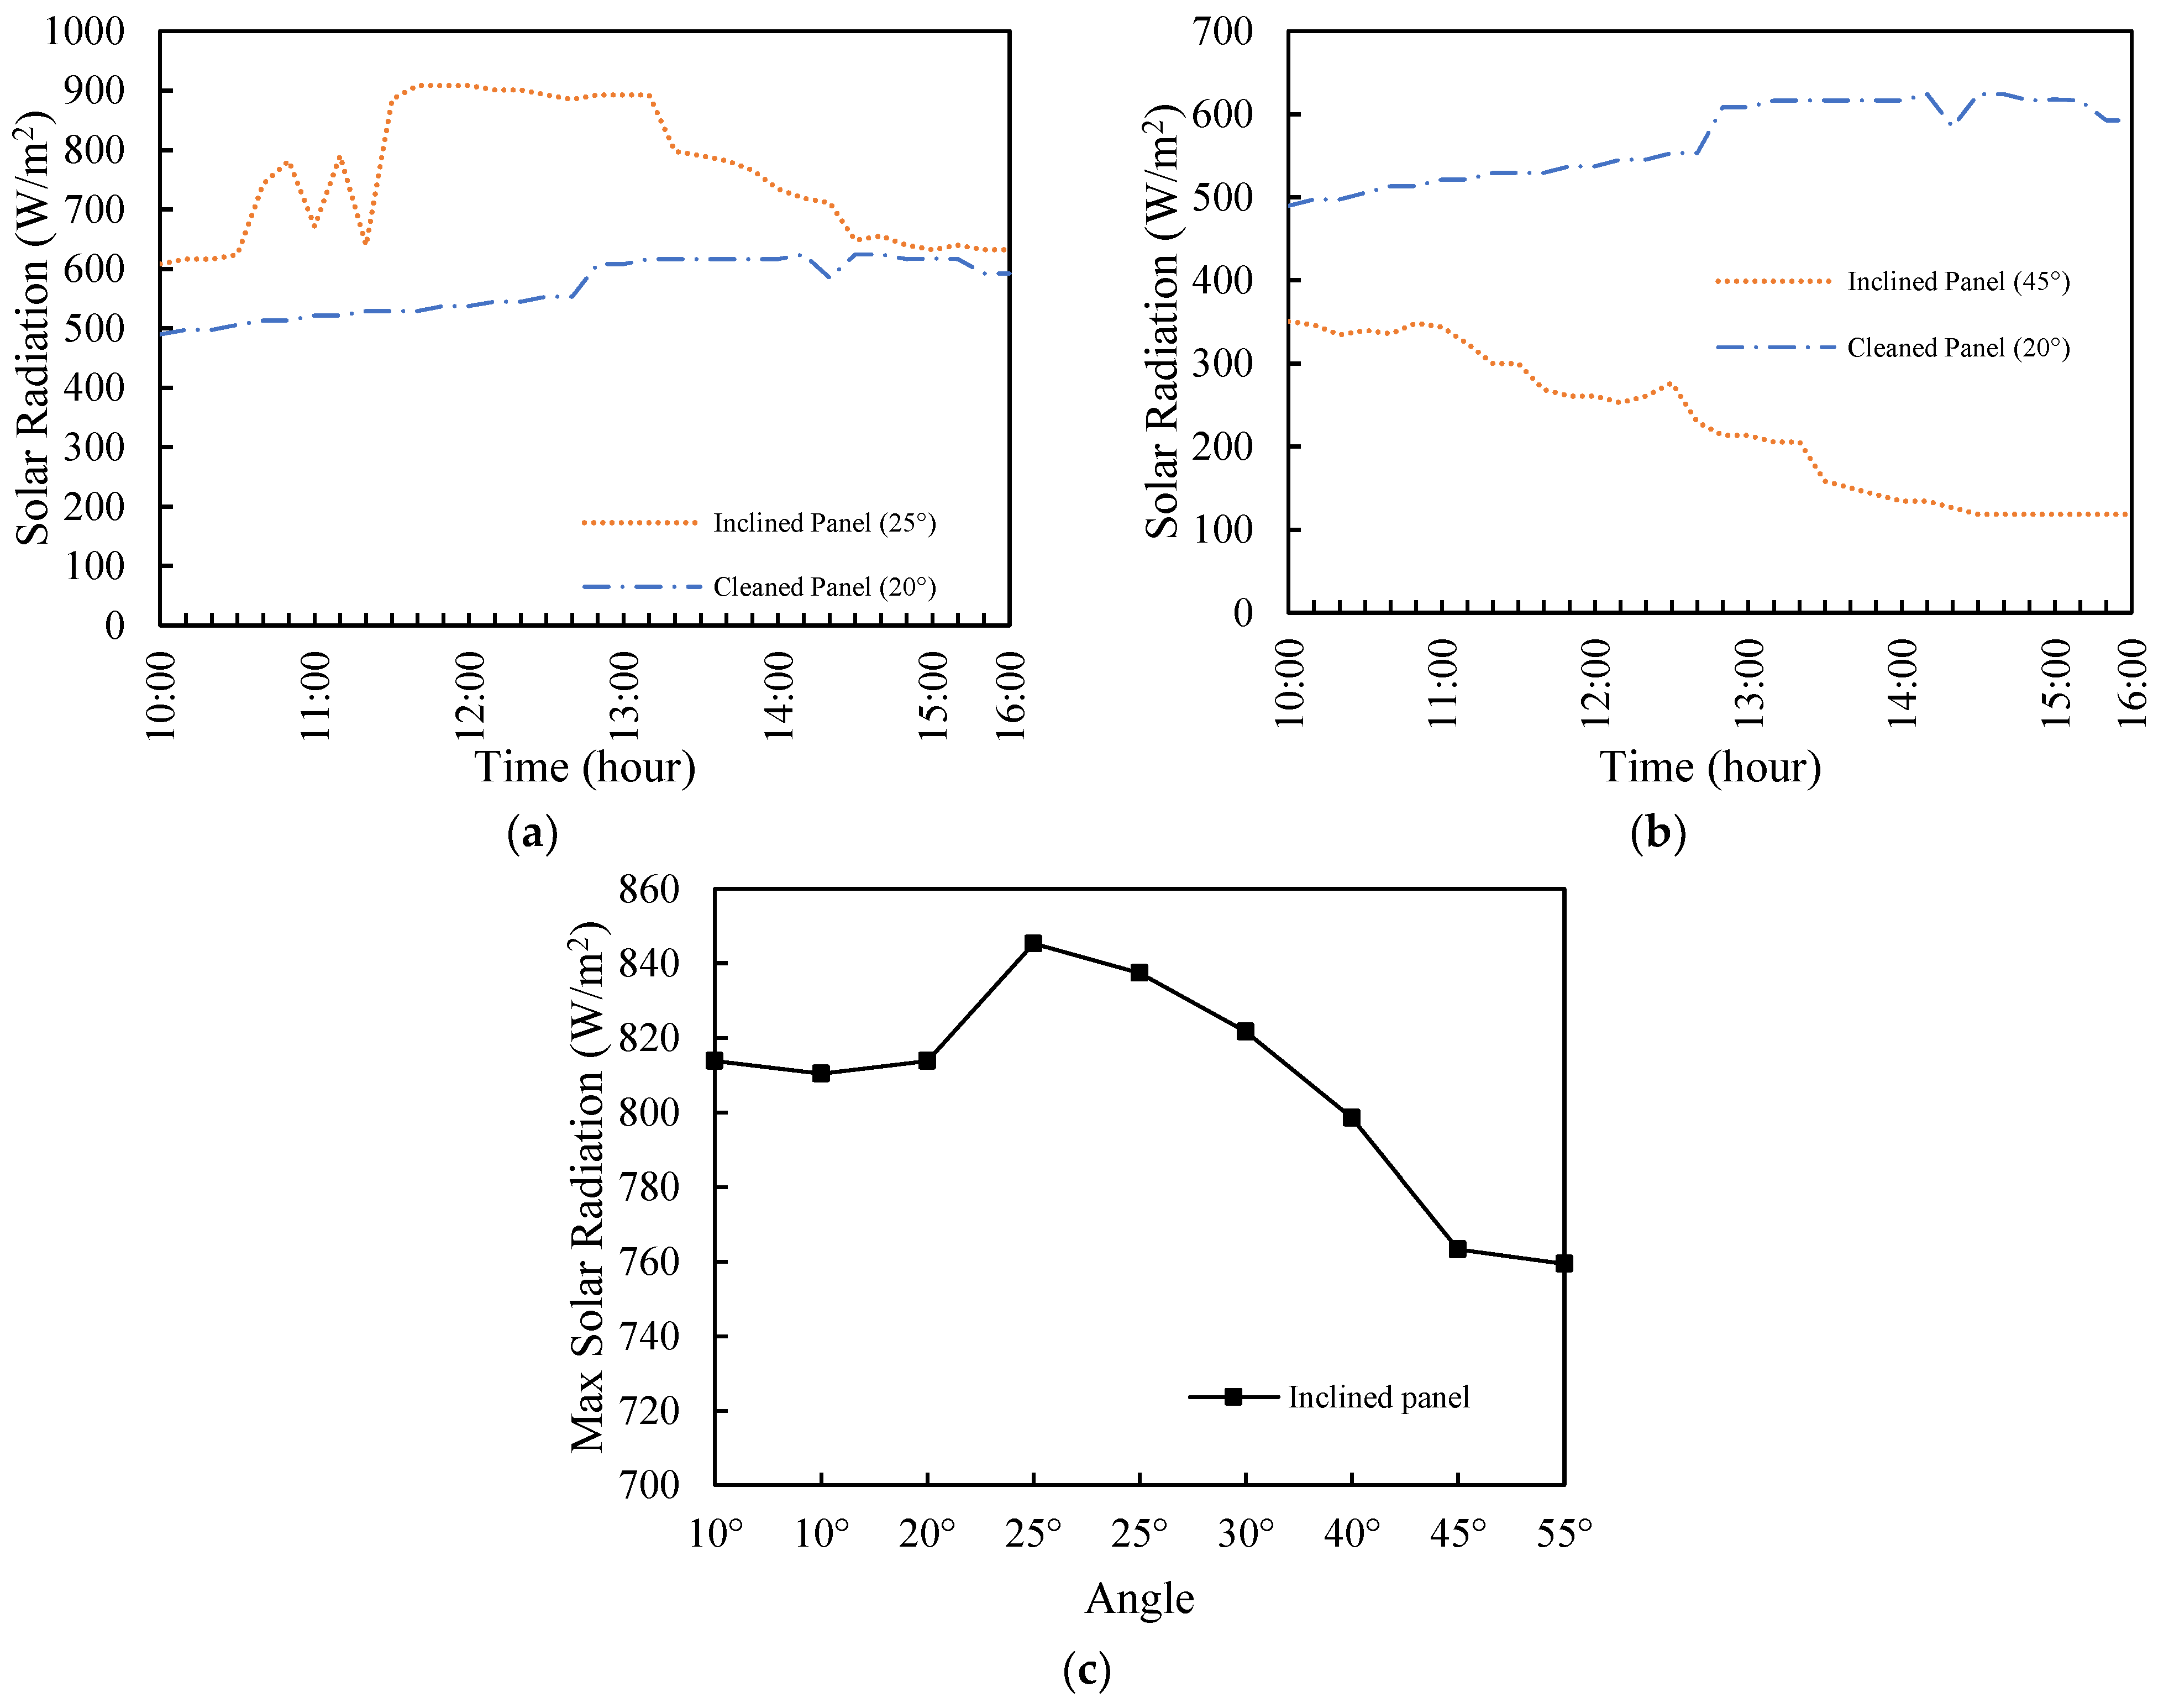
Figure 12b,c show the difference in solar radiation between the cleaned PV panel at 25° and 45° angles and the cleaned PV panel at an angle of 20°, respectively. The results show that the solar radiation on the cleaned panel at an angle of 25° increased compared to the cleaned panel at angles of 20° and 45°, as the maximum solar radiation of the photovoltaic panel reached 840 W/m2 for an angle of 25°, 759 W/m2 for an angle of 45°, and 813 W/m2 for an angle of 20°. The input energy (solar radiation) decreased when the tilt angle increased. Figure 12c depicts the solar radiation at different inclination angles. The highest value reached 845 W/m2 at an angle of 25°, while the lowest value reached 759.4 W/m2 at an angle of 55°. The PV performance was also directly influenced by the radiation intensity; the higher the intensity of the radiation, the better the PV performance. Therefore, PV modules need to be tilted to ensure the greatest incident irradiation so that the sun’s rays fall vertically on the panel [37].
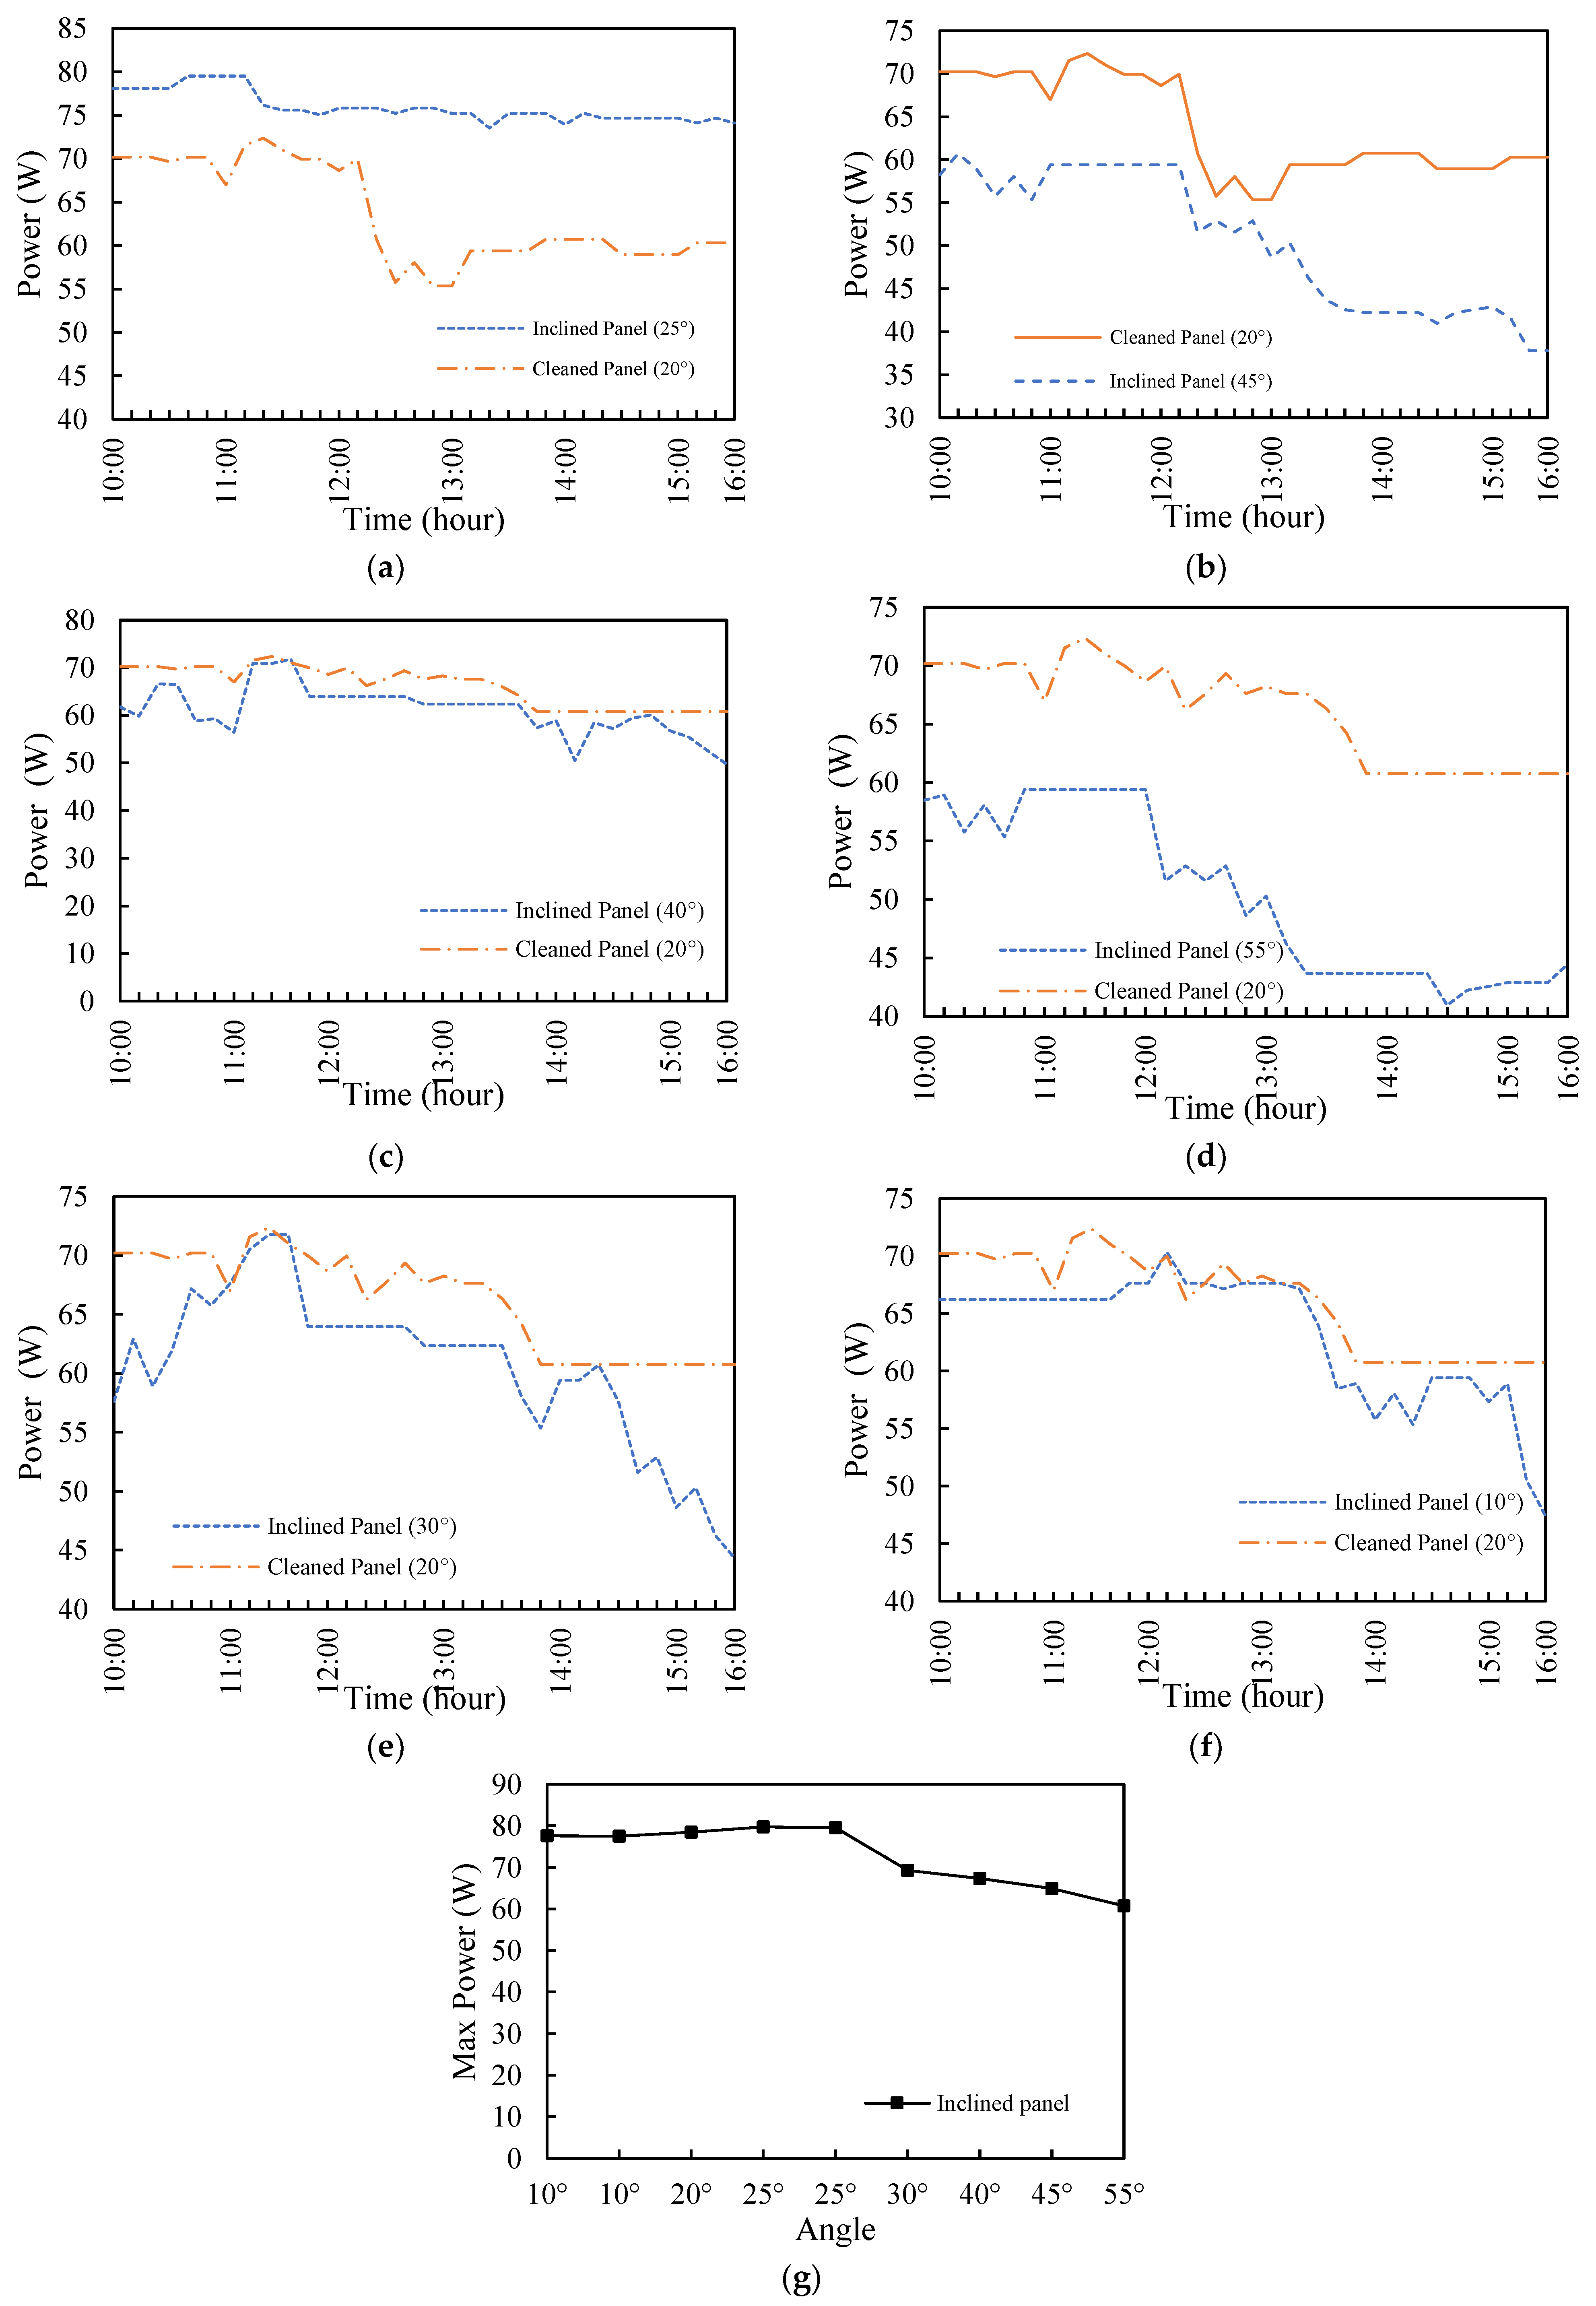
Figure 13a–f and Figure 14a–f show a comparison between the cleaned photovoltaic panel at different angles of 10°, 25°, 30°, 40°, 45°, and 55° and the cleaned photovoltaic panel at an angle of 20°. The results show that the power and efficiency of the cleaned panel at an angle of 25° were the maximum compared to the cleaned panel at the other angles. The highest power and efficiency were 79.52 W and 20.5% at an angle of 25°, 60.7 W and 13.6% at an angle of 45°, 67.32 W and 17.8% at an angle of 40°, 60.75 W and 17.6% at an angle of 55°, 69.3 W and 18.4% at an angle of 30°, 77.5 W and 18.2% at an angle of 10°, and 75.9 W and 19.7% at an angle of 20°, which indicates that an increase in the tilt angle led to a decrease in the power production and a reduction in the efficiency of the panels. The higher performance at 25° was due to the fact that the inclination of the panel was close to the angle of latitude.
As for the output power and efficiency of the photovoltaic panels, as shown in Figure 13g and Figure 14g, the highest output power reached 79 W at an angle of 25°. The highest efficiency of the photovoltaic panels reached 20.5% at an angle of 25°. In comparison, the lowest output power value reached 60.75 W at an angle of 55°, and the lowest efficiency value reached 17.6% at an angle of 55°. However, the output power and efficiency were affected by variations in temperature, voltage, current, and the amount of solar radiation. Therefore, it is clear from the results that when the inclination angle increases, the temperature decreases, the voltage and current decrease, and thus, the resulting power and efficiency decrease. Furthermore, Benganem, in 2011 [38], investigated the optimal choice of inclination angle for solar panels in Medina, Saudi Arabia. Their results show that the loss in the amount of energy collected at a fixed angle annually amounted to about 8% compared to the optimal inclination angle per month. Ekpenyong et al., in 2017, conducted a study in Uyo, Akwa State, Nigeria, to determine the optimum inclination angle for the winter season for fixed-pitch PV installations and found that the optimum inclination angle for the winter season was 24.73° [39].

3.3. Effect of Daily Cleaning and Tilt Angle Changes on the Performance of the Solar Panel

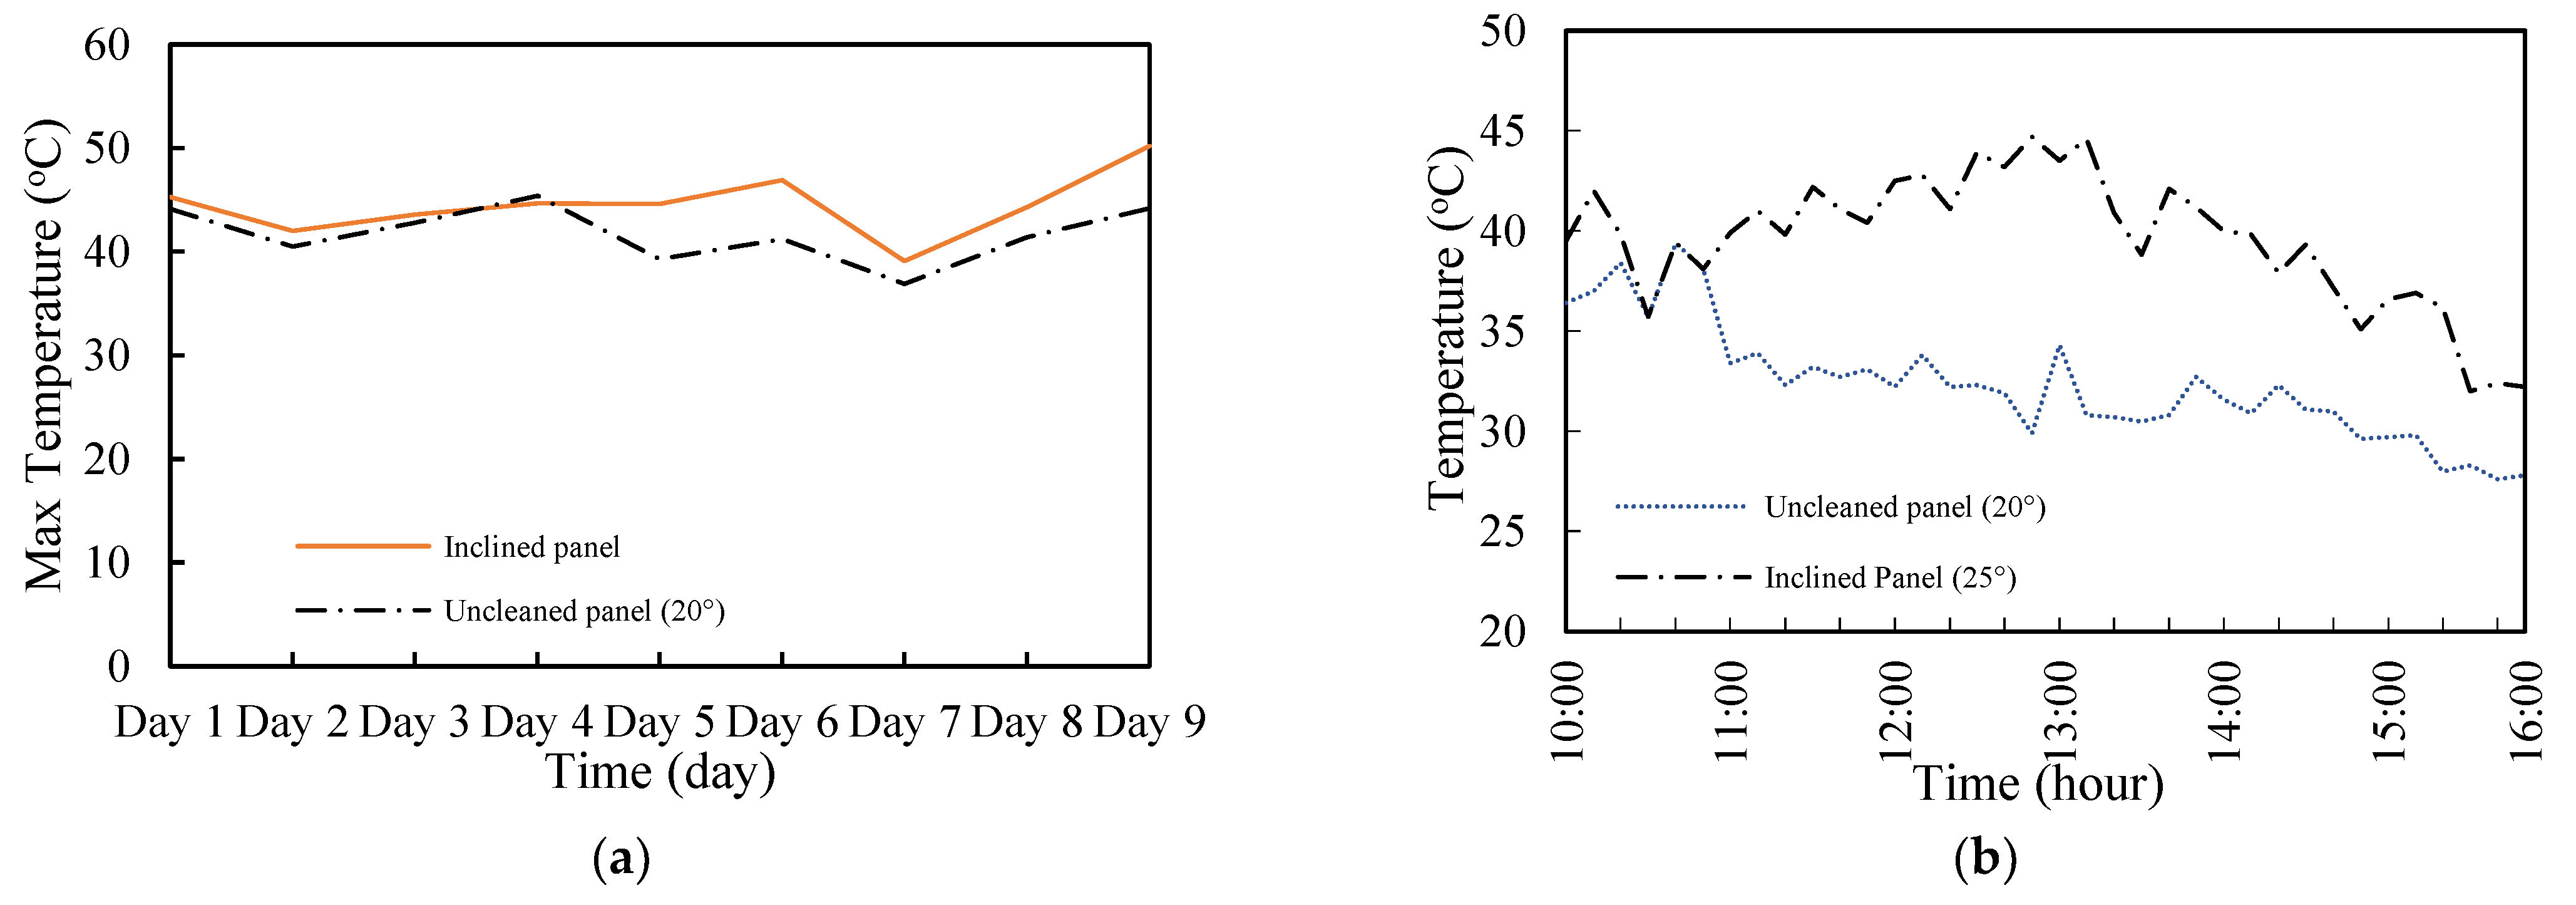
The inclination angle of the photovoltaic panel was changed daily and cleaned early in the morning using manual cleaning before starting the experiment. Consequently, the dust accumulated on the photovoltaic panel was measured. A comparison was made between the cleaned photovoltaic panel with different angles and the uncleaned photovoltaic panel with a fixed angle of 20°. It was shown that the performance efficiency of the photovoltaic module changed depending on the variation in the angle. Figure 15 shows the temperature evolution of both the inclined panel with different inclination angles and the uncleaned panel at 20° over days and hours. The results show that the inclination angle alone was not sufficient to change the energy production amount, while dust deposition did have significant effects. It can be noted that the uncleaned panel at an angle of inclination of 20° had lower temperatures than the inclined panel, as the highest value of the surface temperature of the inclined panel was 50.2 °C, and the highest value of the temperature of the uncleaned panel was 45.4 °C.
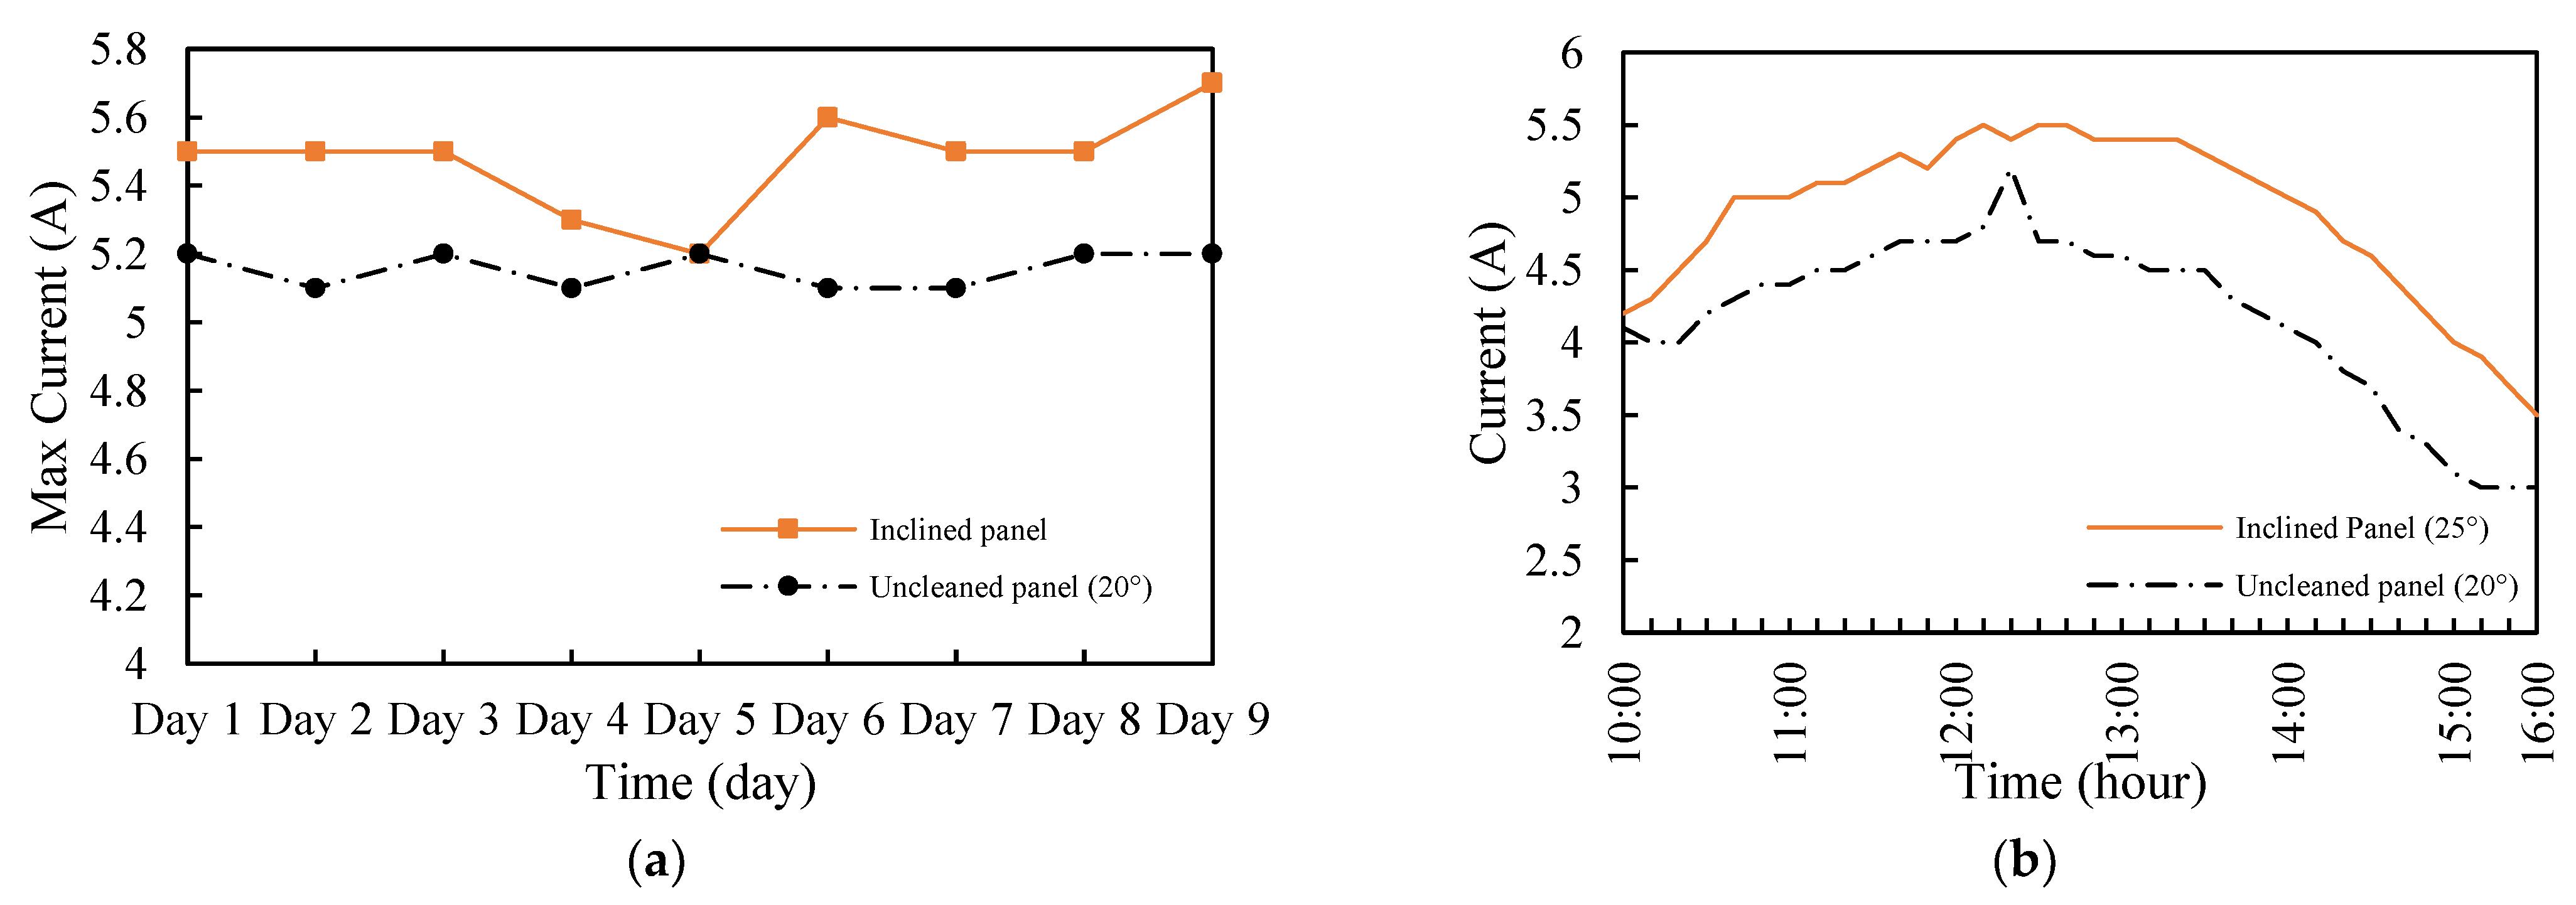
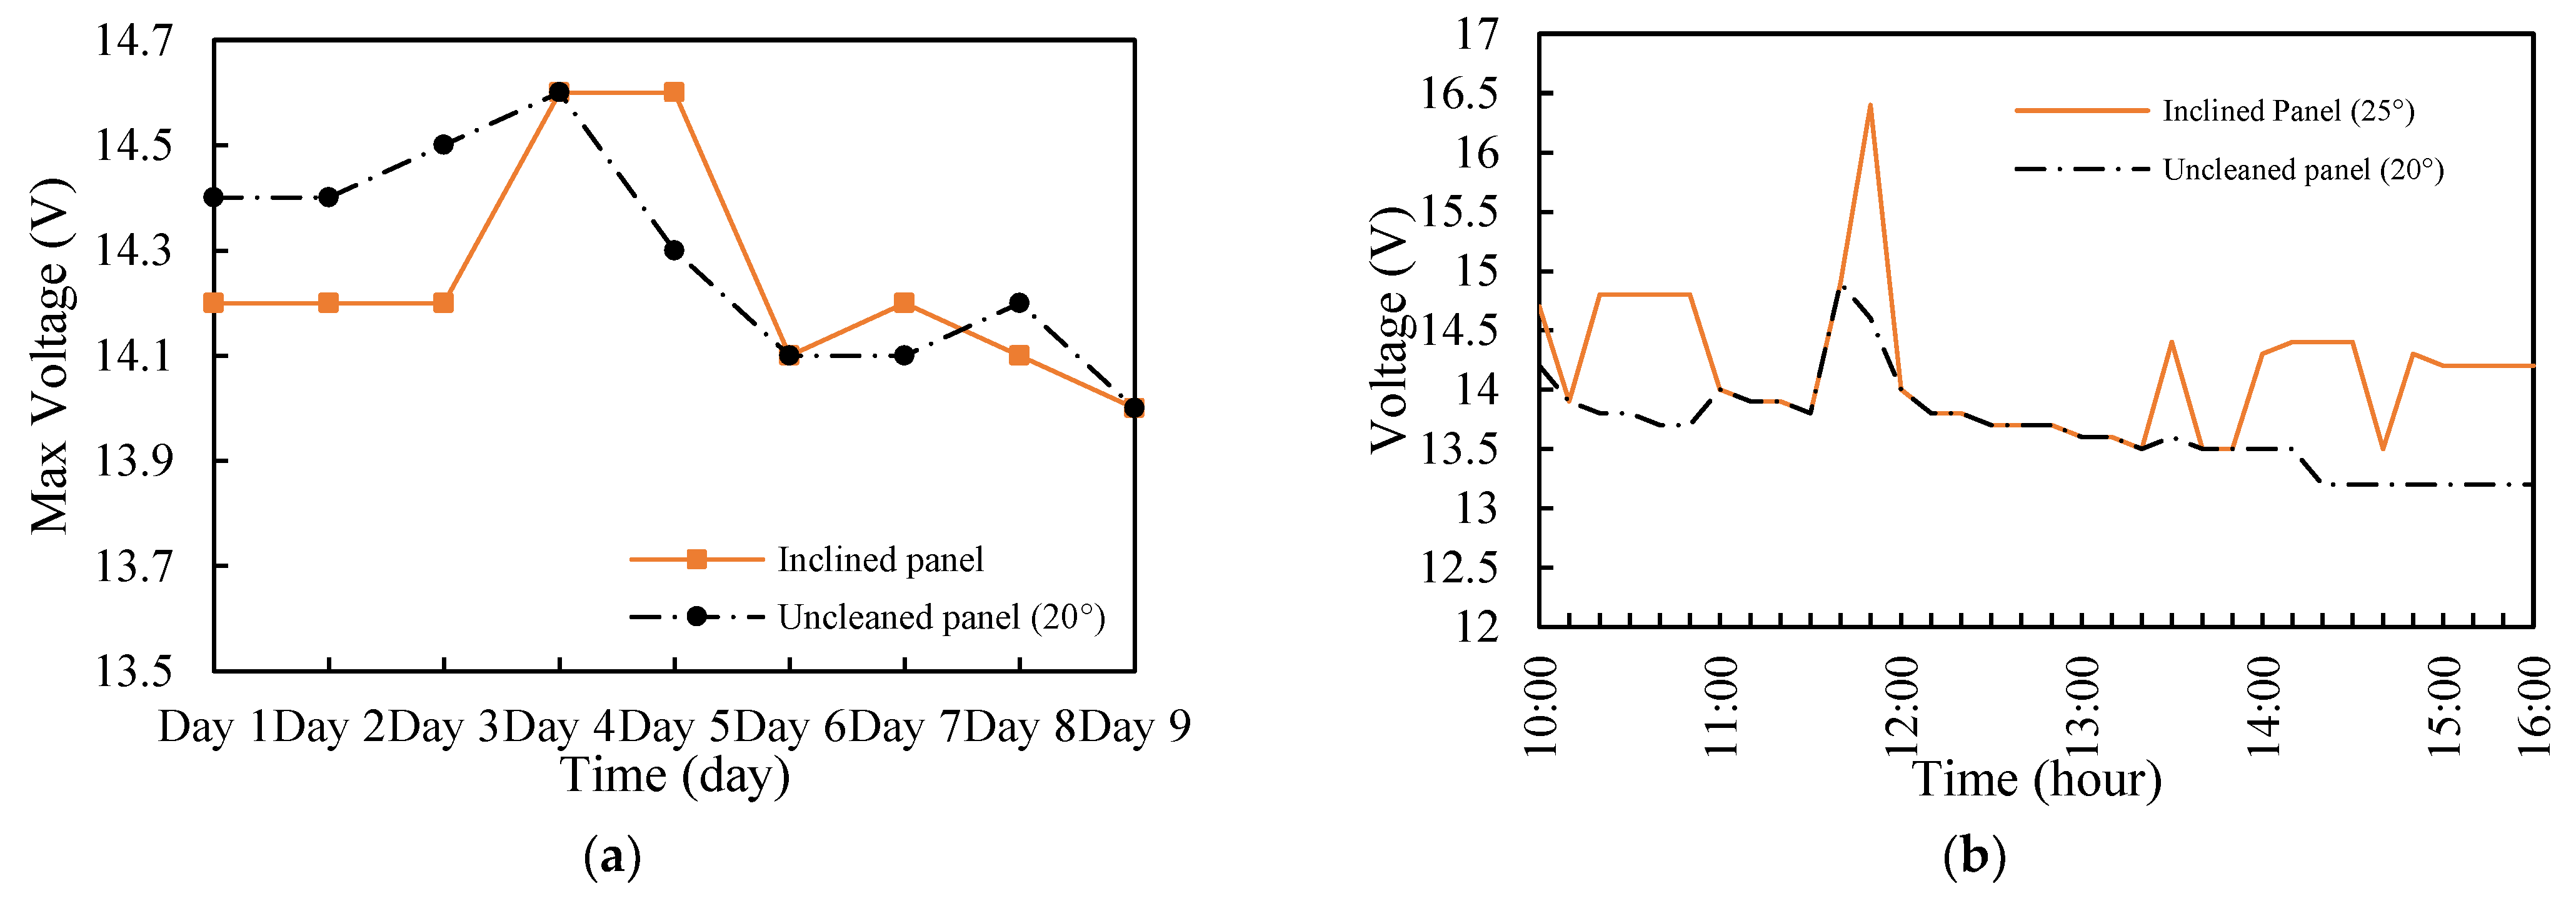
Figure 16 and Figure 17 depict the relationship between the voltage and current. The current increased, and therefore the voltage decreased. The results show that when the current was 5.6 A, the voltage was 14.2 V for the inclined panel. Compared to the uncleaned photovoltaic panels, when the current was 5.2 A, the voltage was 14.3 V for the cleaned panels.
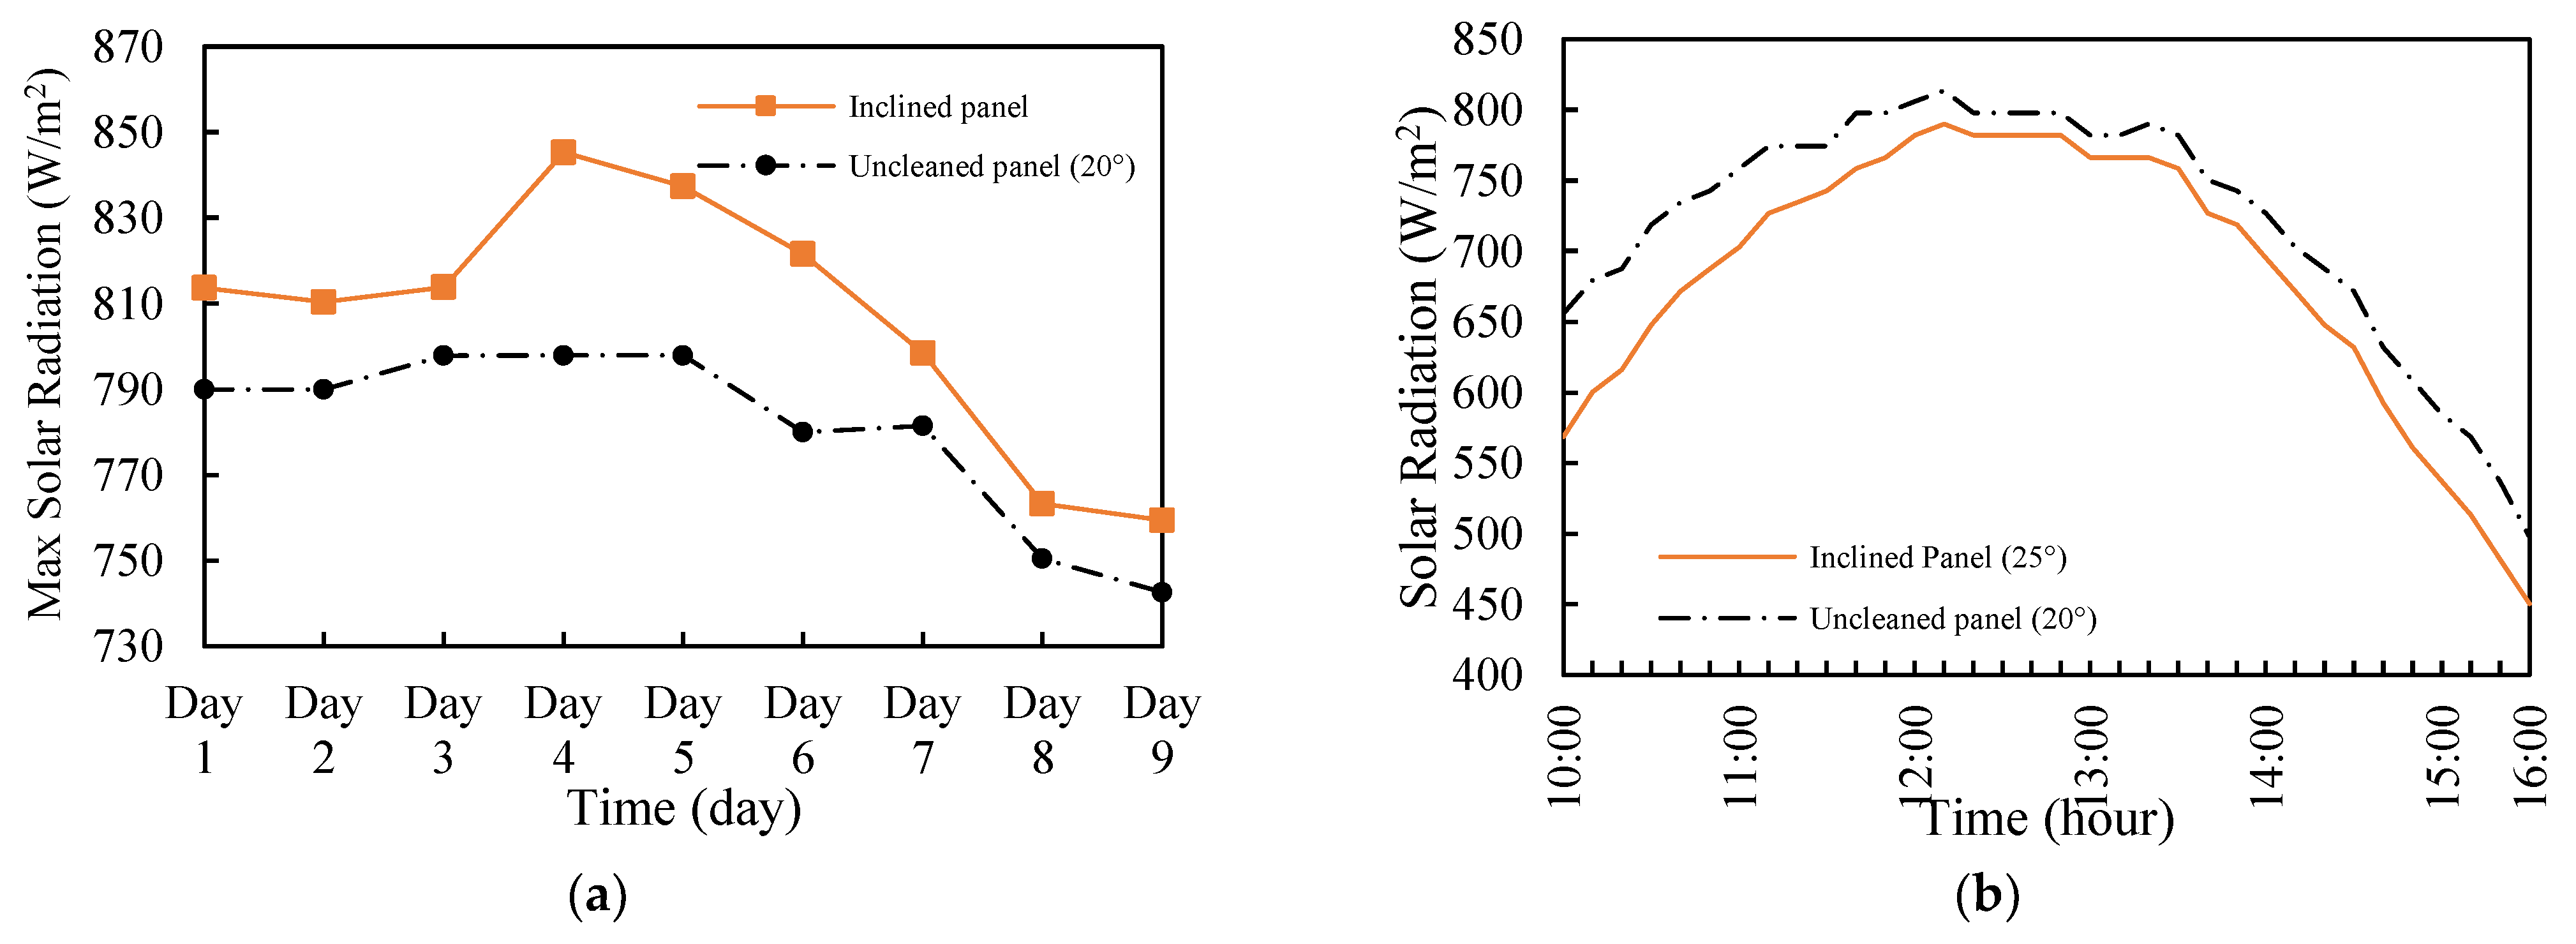
Figure 18 shows the evolution of solar radiation versus time. The results show that the highest value was 845.3 W/m2 for the inclined panel, and compared to the photovoltaic panels that were not cleaned, the highest value was 797.8 W/m2. The decrease in solar radiation for the uncleaned photovoltaic panel was due to dust deposition, which prevented sunlight from reaching the panel.
Figure 19 and Figure 20 compare the power and efficiency profiles between the inclined and uncleaned panels, respectively. As evidenced in Figure 19a and Figure 20a, the highest power and efficiency were 79 W and 20.5% for the inclined panel. For the uncleaned panel, the highest power was 75.9 W, with an efficiency of 16.6%. Figure 19b and Figure 20b show the hourly variation in power and efficiency for both the inclined and uncleaned panels. It can be concluded that dust plays a major role in reducing the energy production of photovoltaic panels. In confirmation of this, Lu et al. [40] studied the effects of different inclination angles and dust particle sizes on dust deposition. It was observed that various tilt angles have a fundamental impact on dust accumulation rates on PV panels.
Furthermore, the dust deposition rates increased when the solar PV panel was more horizontal to the ground [40]. On the other hand, it can be seen that as the angle increased, the dust percentage decreased, reaching 0.5 g at an angle of 40°, and this was due to rainy weather on that day. The dust percentage began to decline; however, as the angle increased, the percentage increased to 0.3 g at an angle of 25°. Hachicha et al. [41] investigated how dust sample morphologies affected photovoltaic performance. According to their results, dust density and normalized PV power had a linear connection that decreased by 1.7% for every g/m2. Additionally, their results demonstrate that for 0°, 25°, and 45° tilt angles, there was a decrease in dust accumulation by 37.63%, 14.11%, and 10.95%, respectively.

4. Conclusions

Solar photovoltaic energy is considered one of the most promising future clean energy sources globally. The power production and performance of PV systems significantly decrease when dust accumulates on the surfaces of PV panels. This study aimed to investigate the effect of the tilt angle and dust on the performance of photovoltaic modules under weather conditions in Al Seeb, Oman. The study was conducted by cleaning the first panel daily for two weeks at an angle of 20° and cleaning the second panel daily whilst changing the inclination angle. Both results were compared with another panel that was not cleaned for a long time. Measurements were made using a data logger, and the measured parameters included solar temperature, open-circuit voltage, solar radiation, and short-circuit current. The power and efficiency were calculated from the data. It was observed that the output power reached 93.5 W with a 24.5% efficiency for the panel that was cleaned daily. Furthermore, soiling resulted in an 18.8% power loss. When comparing the power outputs at different tilt angles, the highest power of 79.75 W was achieved at an angle of 25°, with an efficiency of up to 20.5%. Moreover, the power generated was up to 9.8% higher than those at different tilt angles.

Author Contributions

Conceptualization, G.T.C.; Methodology, G.T.C.; Investigation, G.T.C.; Resources, G.T.C., S.A.S. and X.C.; Writing—original draft, G.T.C.; Writing—review & editing, S.A.S. and X.C. All authors have read and agreed to the published version of the manuscript.

Funding

Ministry of Higher Education, Research and Innovation (MoHERI) Oman (MoHERI/BFP/ICEM/01/21).

Data Availability Statement

Data are contained within the article.

Acknowledgments

The authors would like to thank the Ministry of Higher Education, Research and Innovation (MoHERI) Oman and the International College of Engineering and Management (ICEM) for the support and facilities provided.

Conflicts of Interest

The authors declare no conflict of interest.

References

  1. Ebhota, W.S.; Jen, T.-C. Fossil Fuels Environmental Challenges and the Role of Solar Photovoltaic Technology Advances in Fast Tracking Hybrid Renewable Energy System. Int. J. Precis. Eng. Manuf. Green Technol. 2020, 7, 97–117. [Google Scholar] [CrossRef]
  2. Darwish, Z.A.; Sopian, K.; Fudholi, A. Reduced output of photovoltaic modules due to different types of dust particles. J. Clean. Prod. 2021, 280, 124317. [Google Scholar] [CrossRef]
  3. Chala, G.T.; Al Alshaikh, S.M.; Sulaiman, S.A. Comparative Study Between Clean, Dusty, and Muddy Photovoltaic Panels in Al Seeb, Oman; Zeng, Y., Wang, S., Eds.; Environmental Science and Technology: Sustainable Development II; Springer Nature: Cham, Switzerland, 2024; pp. 277–287. [Google Scholar]
  4. Sarver, T.; Al-Qaraghuli, A.; Kazmerski, L.L. A comprehensive review of the impact of dust on the use of solar energy: History, investigations, results, literature, and mitigation approaches. Renew. Sustain. Energy Rev. 2013, 22, 698–733. [Google Scholar] [CrossRef]
  5. Dincer, I. Renewable energy and sustainable development: A crucial review. Renew. Sustain. Energy Rev. 2000, 4, 157–175. [Google Scholar] [CrossRef]
  6. Gómez-Calvet, R.; Martínez-Duart, J.M.; Gómez-Calvet, A.R. The 2030 power sector transition in Spain: Too little storage for so many planned solar photovoltaics? Renew. Sustain. Energy Rev. 2023, 174, 113094. [Google Scholar] [CrossRef]
  7. Dewangan, D.; Ekka, J.P.; Arjunan, T.V. Solar photovoltaic thermal system: A comprehensive review on recent design and development, applications and future prospects in research. Int. J. Ambient Energy 2022, 43, 7247–7271. [Google Scholar] [CrossRef]
  8. Ebhota, W.; Tabakov, P. Influence of photovoltaic cell technologies and elevated temperature on photovoltaic system performance. Ain Shams Eng. J. 2023, 14, 101984. [Google Scholar] [CrossRef]
  9. Vodapally, S.N.; Ali, M.H. A Comprehensive Review of Solar Photovoltaic (PV) Technologies, Architecture, and Its Applications to Improved Efficiency. Energies 2023, 16, 319. [Google Scholar] [CrossRef]
  10. Tyagi, V.V.; Rahim, N.A.A.; Rahim, N.A.; Selvaraj, J.A.L. Progress in solar PV technology: Research and achievement. Renew. Sustain. Energy Rev. 2013, 20, 443–461. [Google Scholar] [CrossRef]
  11. Spasić, V. Global Solar Power to Cross 200 GW Annual Installation Threshold in 2022. Balkan Green Energy News. Available online: https://balkangreenenergynews.com/global-solar-power-to-cross-200-gw-annual-installation-threshold-in-2022/ (accessed on 17 April 2023).
  12. Alnasser, T.M.A.; Mahdy, A.M.J.; Abass, K.I.; Chaichan, M.T.; Kazem, H.A. Impact of dust ingredient on photovoltaic performance: An experimental study. Sol. Energy 2020, 195, 651–659. [Google Scholar] [CrossRef]
  13. Alshebani, M. A critical review of solar energy and dust in Gulf Countries. Int. J. Eng. Res. Appl. 2021, 11, 43–73. [Google Scholar]
  14. Chanchangi, Y.N.; Ghosh, A.; Sundaram, S.; Mallick, T.K. Dust and PV Performance in Nigeria: A review. Renew. Sustain. Energy Rev. 2020, 121, 109704. [Google Scholar] [CrossRef]
  15. Yadav, A.; Pillai, S.R.; Singh, N.; Philip, S.A.; Mohanan, V. Preliminary investigation of dust deposition on solar cells. Mater. Today Proc. 2021, 46, 6812–6815. [Google Scholar] [CrossRef]
  16. Aslam, A.; Ahmed, N.; Qureshi, S.A.; Assadi, M.; Ahmed, N. Advances in solar PV systems; A comprehensive review of PV performance, influencing factors, and mitigation techniques. Energies 2022, 15, 7595. [Google Scholar] [CrossRef]
  17. Chen, E.Y.-T.; Chen, Y.; Guo, B.; Liang, H. Effects of surface morphological parameters on cleaning efficiency of PV panels. Sol. Energy 2019, 194, 840–847. [Google Scholar] [CrossRef]
  18. Ndeto, M.P.; Wekesa, D.W.; Njoka, F.; Kinyua, R. Correlating dust deposits with wind speeds and relative humidity to overall performance of crystalline silicon solar cells: An experimental study of Machakos County, Kenya. Sol. Energy 2022, 246, 203–215. [Google Scholar] [CrossRef]
  19. Moharram, K.A.; Abd-Elhady, M.S.; Kandil, H.A.; El-Sherif, H. Influence of cleaning using water and surfactants on the performance of photovoltaic panels. Energy Convers. Manag. 2013, 68, 266–272. [Google Scholar] [CrossRef]
  20. Chen, J.; Pan, G.; Ouyang, J.; Ma, J.; Fu, L.; Zhang, L. Study on impacts of dust accumulation and rainfall on PV power reduction in East China. Energy Convers. 2020, 194, 116915. [Google Scholar] [CrossRef]
  21. Chala, G.T.; Sulaiman, S.A.; Al Alshaikh, S.M. Effects of cooling and interval cleaning on the performance of soiled photovoltaic panels in Muscat, Oman. Results Eng. 2024, 21, 101933. [Google Scholar] [CrossRef]
  22. Zhao, W.; Lv, Y.; Zhou, Q.; Yan, W. Investigation on particle deposition criterion and dust accumulation impact on solar PV module performance. Energy 2021, 233, 121240. [Google Scholar] [CrossRef]
  23. Al Siyabi, I.; Al Mayasi, A.; Al Shukaili, A.; Khanna, S. Effect of soiling on solar photovoltaic performance under desert climatic conditions. Energies 2021, 14, 659. [Google Scholar] [CrossRef]
  24. Chala, G.T.; Al Alshaikh, S.M. Solar Photovoltaic Energy as a Promising Enhanced Share of Clean Energy Sources in the Future—A Comprehensive Review. Energies 2023, 16, 7919. [Google Scholar] [CrossRef]
  25. Chala, G.T.; Sulaiman, S.A.; Chen, X.; Al Shamsi, S.S. Effects of Nanocoating on the Performance of Photovoltaic Solar Panels in Al Seeb, Oman. Energies 2024, 17, 2871. [Google Scholar] [CrossRef]
  26. Paudyal, B.R.; Shakya, S.R. Dust accumulation effects on efficiency of solar PV modules for off grid purpose: A case study of Kathmandu. Sol. Energy 2016, 135, 103–110. [Google Scholar] [CrossRef]
  27. Mohandes, B.M.A.; El-Chaar, L.; Lamont, L.A. Application study of 500 W photovoltaic (PV) system in the UAE. Appl. Sol. Energy 2009, 45, 242–247. [Google Scholar] [CrossRef]
  28. Gupta, V.; Sharma, M.; Pachauri, R.K.; Babu, K.D. Comprehensive review on effect of dust on solar photovoltaic system and mitigation techniques. Sol. Energy 2019, 191, 596–622. [Google Scholar] [CrossRef]
  29. Jiang, H.; Lu, L.; Sun, K. Experimental investigation of the impact of airborne dust deposition on the performance of solar photovoltaic (PV) modules. Atmos. Environ. 2011, 45, 4299–4304. [Google Scholar] [CrossRef]
  30. Li, D.; King, M.; Dooner, M.; Guo, S.; Wang, J. Study on the cleaning and cooling of solar photovoltaic panels using compressed airflow. Sol. Energy 2021, 221, 433–444. [Google Scholar] [CrossRef]
  31. Aljaghoub, H.; Abumadi, F.; AlMallahi, M.N.; Obaideen, K.; Alami, A.H. Solar PV cleaning techniques contribute to Sustainable Development Goals (SDGs) using Multi-criteria decision-making (MCDM): Assessment and review. Int. J. Thermofluids 2022, 16, 100233. [Google Scholar] [CrossRef]
  32. Abuzaid, H.; Awad, M.; Shamayleh, A. Impact of dust accumulation on photovoltaic panels: A review paper. Int. J. Sustain. Eng. 2022, 15, 264–285. [Google Scholar] [CrossRef]
  33. Peterson, J.; Crystal, J.A. Oman. Encyclopedia Britannica. Available online: https://www.britannica.com/place/Oman (accessed on 18 August 2023).
  34. Bashir, M.A.; Ali, H.M.; Ali, M.; Siddiqui, A.M. An experimental investigation of performance of photovoltaic modules in Pakistan. Therm. Sci. 2015, 19, 525–534. [Google Scholar] [CrossRef]
  35. El-Nashar, A.M. The effect of dust accumulation on the performance of evacuated tube collectors. Sol. Energy 1994, 53, 105–115. [Google Scholar] [CrossRef]
  36. Lu, H.; Zhao, W. CFD prediction of dust pollution and impact on an isolated ground-mounted solar photovoltaic system. Renew. Energy 2019, 131, 829–840. [Google Scholar] [CrossRef]
  37. Babatunde, A.A.; Abbasoglu, S.; Senol, M. Analysis of the impact of dust, tilt angle and orientation on performance of PV Plants. Renew. Sustain. Energy Rev. 2018, 90, 1017–1026. [Google Scholar] [CrossRef]
  38. Benghanem, M. Optimization of tilt angle for solar panel: Case study for Madinah, Saudi Arabia. Appl. Energy 2011, 88, 1427–1433. [Google Scholar] [CrossRef]
  39. Ekpenyong, A.I.; Umoren, A.M.; Markson, I. Development of Winter Season Optimal Tilt Angle Model for Fixed Tilted Plane PV Installation in Akwa Ibom State, Nigeria. Math. Softw. Eng. 2017, 3, 67–77. [Google Scholar]
  40. Lu, H.; Zhao, W. Effects of particle sizes and tilt angles on dust deposition characteristics of a ground-mounted solar photovoltaic system. Appl. Energy 2018, 220, 514–526. [Google Scholar] [CrossRef]
  41. Hachicha, A.A.; Al-Sawafta, I.; Said, Z. Impact of dust on the performance of solar photovoltaic (PV) systems under United Arab Emirates weather conditions. Renew. Energy 2019, 141, 287–297. [Google Scholar] [CrossRef]
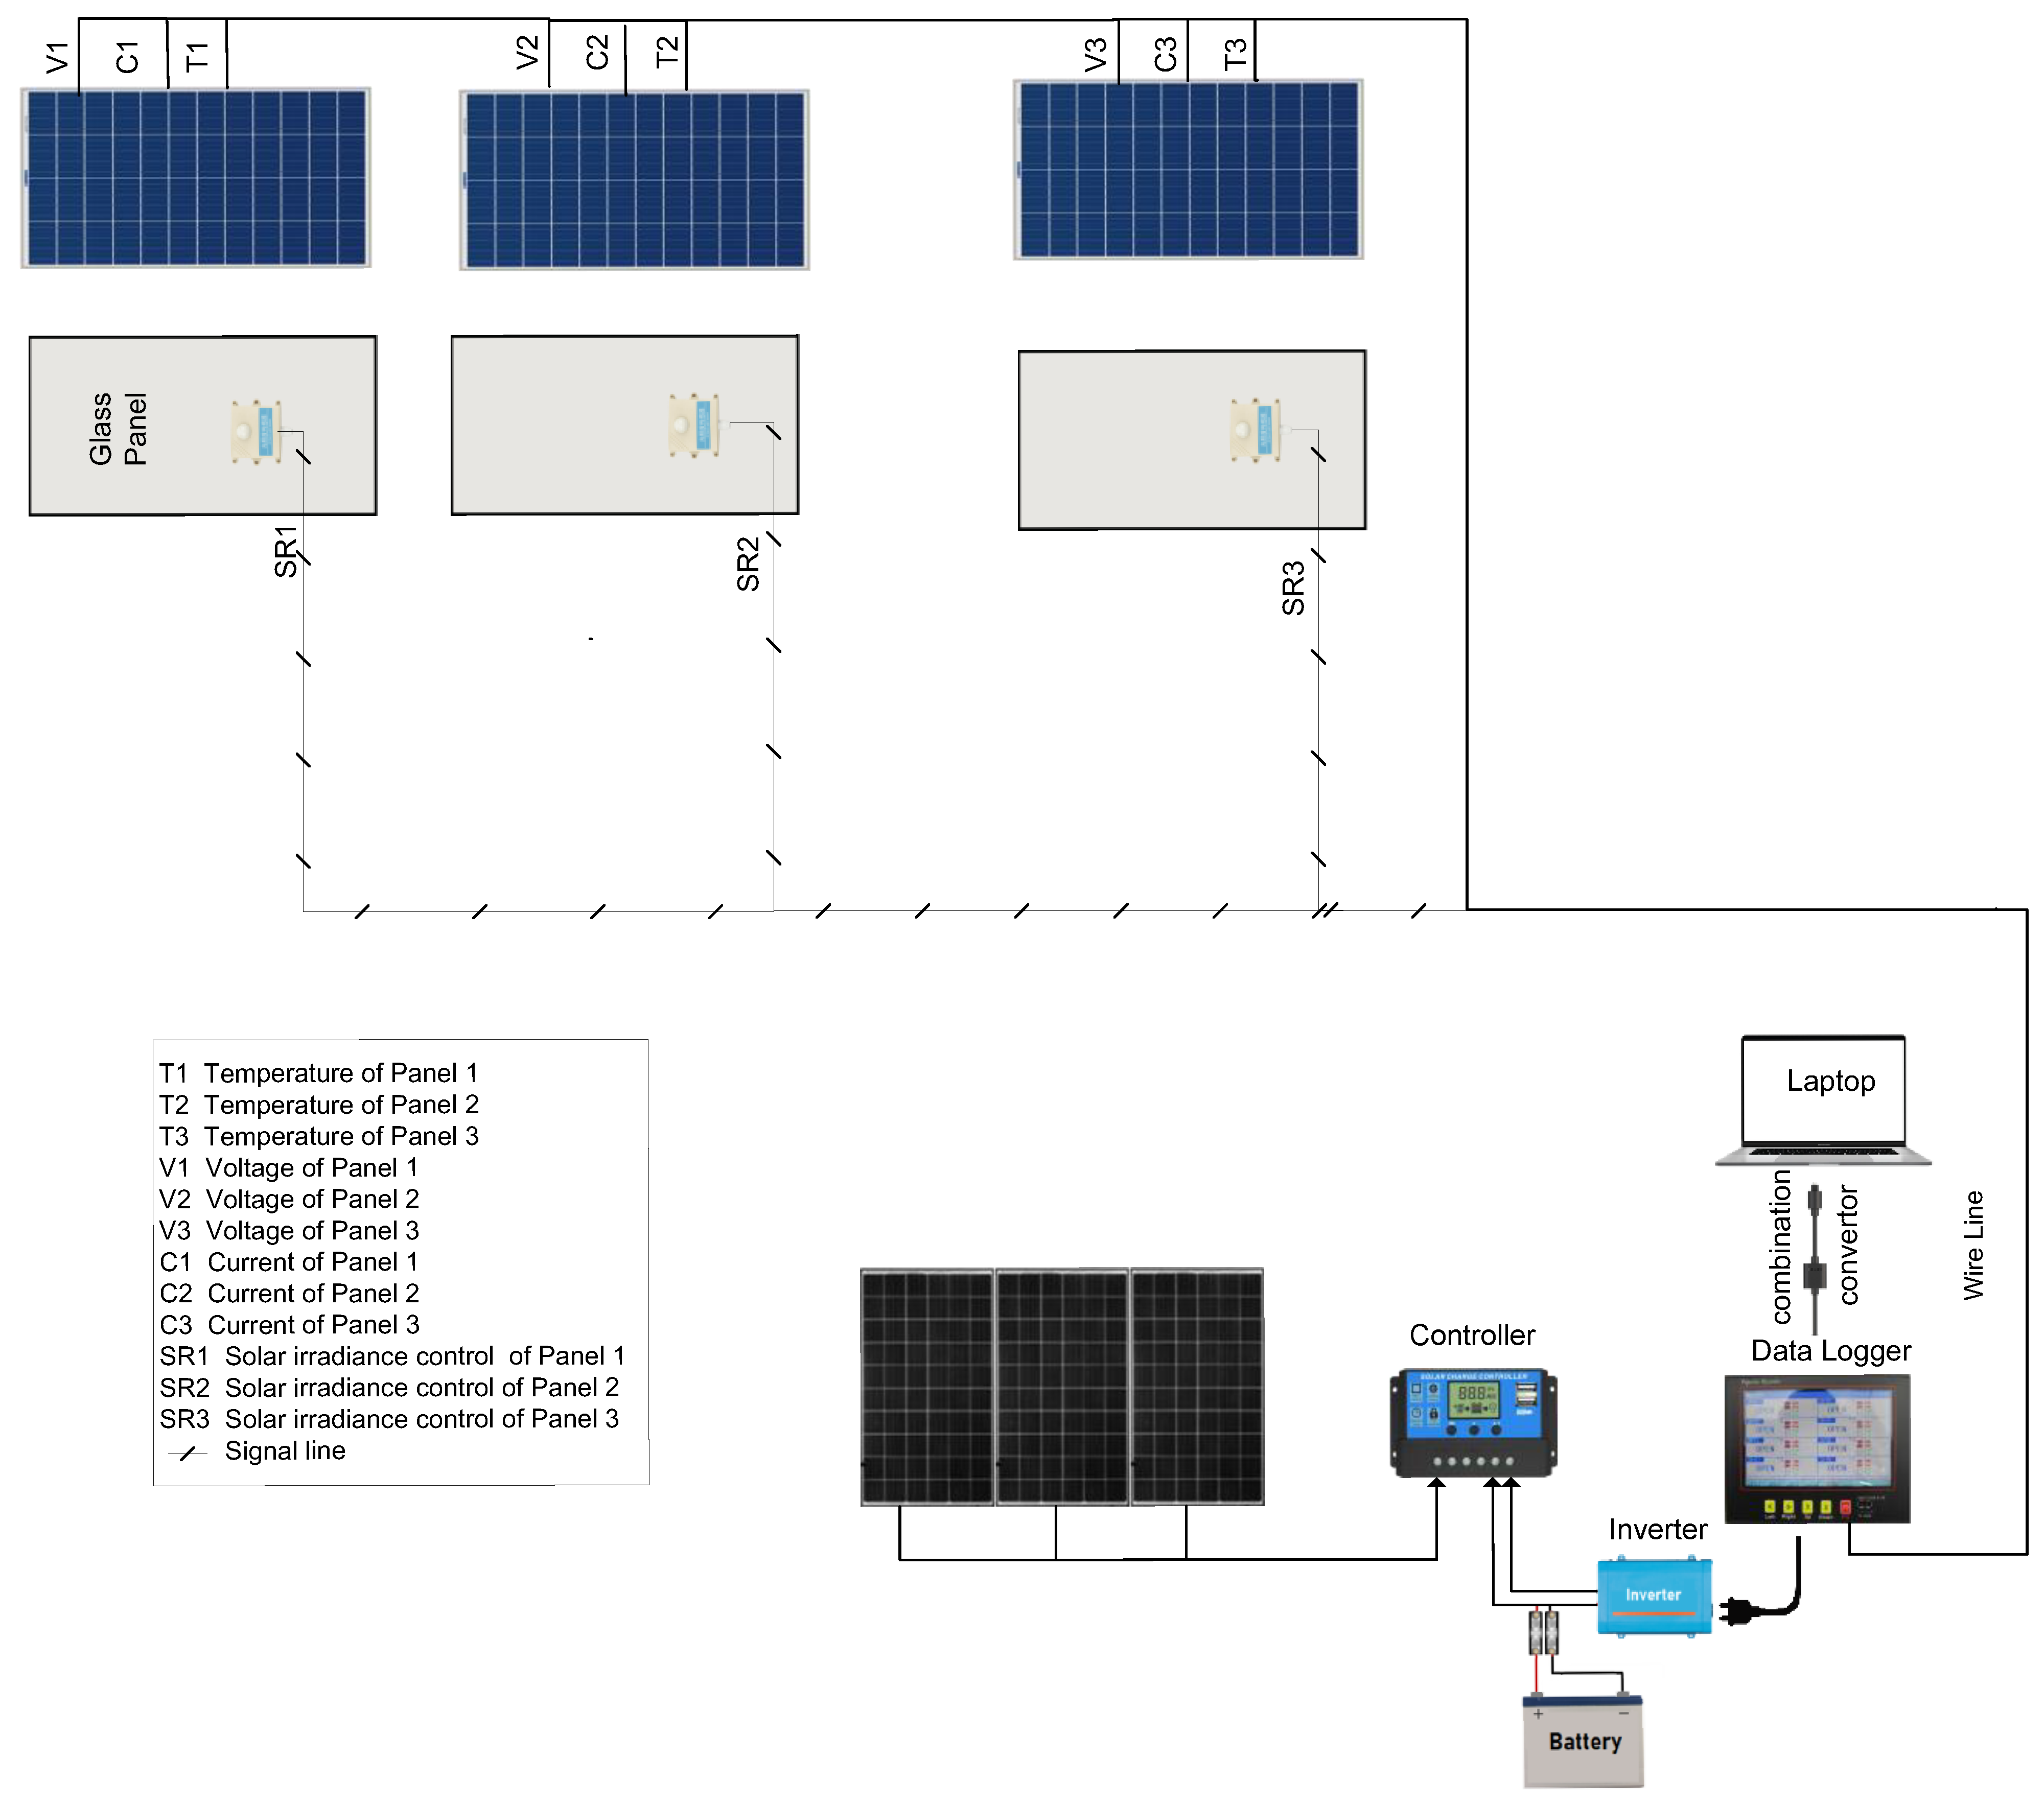
Figure 1. Experimental setup.
Energies 18 00301 g001
Figure 2. Variation in solar PV bottom surface temperature with time: (a) daily and (b) hourly.
Energies 18 00301 g002
Figure 3. Variation in solar PV current with time: (a) daily and (b) hourly.
Energies 18 00301 g003
Figure 4. Solar PV voltage vs. time: (a) daily and (b) hourly.
Energies 18 00301 g004
Figure 5. Solar radiation versus time: (a) daily and (b) hourly.
Energies 18 00301 g005
Figure 6. Efficiency vs. time: (a) daily and (b) hourly (day 1).
Energies 18 00301 g006
Figure 7. Solar PV power over time: (a) daily and (b) hourly (day 1).
Energies 18 00301 g007
Figure 8. Dust amount collected on the panel at a 20° tilt angle.
Energies 18 00301 g008
Figure 9. Solar PV bottom surface temperature vs. time: (a) hourly (25°), (b) hourly (45°), and (c) angle.
Energies 18 00301 g009
Figure 10. Solar PV current vs. time: (a) hourly (25°), (b) hourly (45°), and (c) angle.
Energies 18 00301 g010
Figure 11. Voltage versus time: (a) hourly (25°), (b) hourly (45°), and (c) angle.
Energies 18 00301 g011
Figure 12. Solar PV solar radiation over time: (a) hourly (25°), (b) hourly (45°), and (c) angle.
Energies 18 00301 g012
Figure 13. Solar PV power vs. time: (a) hourly (25°), (b) hourly (45°), (c) hourly (40°), (d) hourly (55°), (e) hourly (30°), (f) hourly (10°), and (g) angle.
Energies 18 00301 g013
Figure 14. Solar PV efficiency variation with time: (a) hourly (25°), (b) hourly (45°), (c) hourly (55°), (d) hourly (40°), (e) hourly (10°), (f) hourly (30°), and (g) angle.
Energies 18 00301 g014
Figure 15. Solar PV bottom surface temperature vs. time: (a) daily and (b) hourly.
Energies 18 00301 g015
Figure 16. Variation in current versus time: (a) daily and (b) hourly.
Energies 18 00301 g016
Figure 17. Solar PV voltage over time: (a) daily and (b) hourly.
Energies 18 00301 g017
Figure 18. Solar radiation vs. time: (a) daily and (b) hourly.
Energies 18 00301 g018
Figure 19. Power variation with time: (a) daily and (b) hourly.
Energies 18 00301 g019
Figure 20. Efficiency versus time: (a) daily and (b) hourly.
Energies 18 00301 g020
Table 1. Specifications of the PV panels.
Rated power (Pmax) at STC100 W
Maximum power voltage (Vmpp)18.4 V
Maximum power current (Impp)5.43 A
Open-circuit voltage (Voc)22.6 V
Short-circuit current (ISC)5.87 A
Disclaimer/Publisher’s Note: The statements, opinions and data contained in all publications are solely those of the individual author(s) and contributor(s) and not of MDPI and/or the editor(s). MDPI and/or the editor(s) disclaim responsibility for any injury to people or property resulting from any ideas, methods, instructions or products referred to in the content.