Article

Lithium-Ion Battery Degradation Based on the CNN-Transformer Model

1
School of Electrical and Control Engineering, Shaanxi University of Science & Technology, Xi’an 710021, China
2
School of Engineering, Xi’an International University, Xi’an 710071, China
3
School of Computer Science, South China Normal University, Guangzhou 510631, China
*
Author to whom correspondence should be addressed.
Energies 2025, 18(2), 248; https://doi.org/10.3390/en18020248
Submission received: 30 August 2024 / Revised: 11 December 2024 / Accepted: 27 December 2024 / Published: 8 January 2025
(This article belongs to the Special Issue Advances in Battery Degradation and Recycling)

Abstract

:
Due to its innovative structure and superior handling of long time series data with parallel input, the Transformer model has demonstrated a remarkable effectiveness. However, its application in lithium-ion battery degradation research requires a massive amount of data, which is disadvantageous for the online monitoring of batteries. This paper proposes a lithium-ion battery degradation research method based on the CNN-Transformer model. By leveraging the efficiency of the CNN model in feature extraction, it reduces the dependency of the Transformer model on data volume, thereby ensuring faster overall model training without a significant loss in model accuracy. This facilitates the online monitoring of battery degradation. The dataset used for training and validation consists of charge–discharge data from 124 lithium iron phosphate batteries. The experimental results include an analysis of the model training results for both single-battery and multiple-battery data, compared with commonly used models such as LSTM and Transformer. Regarding the instability of single-battery data in the CNN-Transformer model, statistical analysis is conducted to analyze the experimental results. The final model results indicate that the root mean square error (RMSE) of capacity predictions for the majority of batteries among the 124 batteries is within 3% of the actual values.

1. Introduction

As the application of lithium-ion batteries becomes increasingly widespread, the accurate estimation of their health status and real-time prediction of their remaining life have significant implications for the safety monitoring of lithium battery systems and their practical use [1,2,3,4,5]. The internal processes of lithium batteries involve complex physical and chemical reactions that are challenging to model precisely using electrochemical models. This difficulty makes it challenging to achieve accurate health status assessments and remaining life predictions for batteries using electrochemical models [5,6]. In recent years, data-driven methods for predicting the health status of lithium batteries have gained prominence [7,8,9,10]. These methods, by bypassing the internal mechanisms of batteries, eliminate the need for intricate electrochemical models and the associated parameter solving. Consequently, data-driven approaches provide a more direct, simple, and efficient means of estimating the health status and predicting the remaining life of lithium batteries [11,12]. Moreover, the use of data-driven methods broadens their applicability, as these avoid the traditional challenges associated with parameter solving in mathematical and physical models. In this regard, this study leverages the advantages of the Transformer model in addressing time series problems, providing an effective means to track and predict the degradation process of lithium battery capacity [13,14,15,16].
The estimation of battery state parameters primarily involves the estimation of the state of charge (SOC) and state of health (SOH) of the battery. This estimation utilizes the respective SOC calculation formula (Formula (1)) to determine the current available energy of the battery. Additionally, the SOH calculation formula (Formula (2)) quantitatively assesses the current degradation level of the battery, indicating its remaining lifespan until it declines to 80% of its initial capacity. The accurate estimation of these parameters ensures the safe utilization of the battery and provides guidance for maximizing its effectiveness.
The SOC calculation formula is represented as Formula (1), as follows:
S O C % = Q m I · d t Q m × 100 %
The SOH calculation formula is represented as Formula (2), as follows:
S O H % = Q m Q n o m × 100 %
Note: In the formulas provided, Q m represents the maximum capacity of the battery in the most recent charge and discharge cycle. I represents the current at a specific moment during the charge and discharge processes of the battery. Q n o m represents the rated capacity of the battery.
Figure 1a illustrates typical discharge curves during five cycles of charge and discharge processes in the usage of lithium-ion batteries. From a single discharge curve in the graph, the following characteristics can be observed in each discharge process: a rapid voltage drop in the early stage of discharging, a moderate decline in the middle stage, and a very rapid voltage drop in the late stage. The figure indicates that, as the cycle count increases from the 5th to the 700th charge and discharge cycle, the discharge curves shift to the left, implying a reduction in the middle-stage discharge process. Additionally, the early and late stages of discharge become steeper, suggesting battery capacity degradation, which can be indicative of the State of Health (SOH) of the battery. Figure 1a presents multiple discharge cycles obtained from the battery data in the 5th, 100th, 300th, 500th, and 700th cycles.
In Figure 1b, the relationship between the charged capacity and voltage during the battery charging process is depicted, as shown in Figure 1b. It is evident that, throughout the entire lifecycle of the battery, the charging process is approximately constant-voltage charging. The charging process reaches its final state in two stages. Similar to the discharge process, the right side of Figure 1b illustrates that, with an increasing number of cycles, there is a decrease in the voltage and a reduction in the usable capacity of the battery.
To accurately assess the battery’s usage and promptly identify when the battery reaches the end of its life, common methods include traditional electrochemical modeling and the construction of equivalent circuit models. However, both of these conventional approaches have limitations. Electrochemical modeling requires tracking from the battery’s manufacturing process, involving various parameters related to battery materials and manufacturing processes. This makes the model applicable only to a specific battery model, and, in practical battery usage where multiple batteries constitute a battery pack, the model may not adequately reflect the collective performance of the battery pack. As a result, it becomes challenging to accurately assess the health status of the entire battery pack.
In the establishment of an equivalent circuit model for batteries, although the battery model is abstracted into a simplified representation involving common circuit elements such as resistors (Rs), inductors (Ls), capacitors (Cs), and parameters that are relatively simple and easy to calculate, similar to the electrochemical model, it suffers from the limitation of being effective only for individual batteries. This leads to inaccurate assessments when applied to battery packs, and the model may not be suitable for capturing the nuances of the practical usage of lithium-ion batteries.
In recent years, due to an increase in the computing power of computer chips, the application of machine learning has become increasingly widespread across various disciplines. Regarding its application in lithium-ion battery studies, it mainly focuses on researching the lifespan and health status of lithium-ion batteries based on data-driven approaches. In these new data-driven research methodologies, neural network models serve as the foundation, enabling the deep learning of data from lithium-ion batteries. This facilitates the training of degradation models for the capacity of lithium-ion batteries, thereby enabling the prediction of the lifespan and health status of lithium-ion batteries.
The Recurrent Neural Network (RNN) and its variants are neural network models capable of handling sequential data [17,18,19]. Figure 2 illustrates its architecture. Sequential data refer to a series of data arranged in a specific order, such as commonly encountered time series data and textual data. RNNs, owing to their recurrent connections, can use the output from the previous time step as the input for the current time step. This architecture enables RNNs to store and propagate information through sequential data, allowing them to learn long-term dependencies within the sequence. The basic structure of an RNN processes input sequences one time step at a time. At each time step, the input and the output from the previous time step are fed into the hidden layer for processing. The hidden layer calculates the output for the current time step and sends it to the next time step, while also preserving the hidden layer’s state from the previous time step.
Although traditional RNN models are very effective in time series prediction, they also suffer from an issue known as the vanishing or exploding gradient problem, leading to the disappearance of long-term dependencies [20]. When the sequence data are extremely long, the gradients of RNNs during backpropagation can vanish or explode, causing the RNN model to fail to learn long-term dependencies. To address this issue, many improved RNN models have been proposed, such as the Gated Recurrent Unit (GRU), whose structure is shown in Figure 3a, and the Long Short-Term Memory (LSTM), depicted in Figure 3b. These models can handle long-sequence data better and have achieved significant success in fields such as time series prediction [21,22]. Among them, the Long Short-Term Memory (LSTM) model is widely used. It is a special type of recurrent neural network that can mitigate the vanishing and exploding gradient problems present in ordinary RNNs while also handling long-term dependencies in long-sequence data. In addition to the GRU and LSTM mentioned above, there are other types of recurrent neural networks, including Simple RNN, Echo State Network, etc. [23,24].
However, these models share a common structure, which involves sequential data input. Consequently, during the processing of battery data, insufficient research may occur on multiple batteries’ input data [25,26,27]. This could be due to non-standardization in the battery manufacturing process, leading to significant biases in the degraded battery models obtained after training. The method proposed in this paper, based on the Transformer model, effectively addresses these issues because it allows for concurrent data input, thereby resolving these problems.
The Transformer model is a type of deep learning model primarily based on self-attention mechanisms and operates in a parallel manner. Functionally, it is similar to RNN (Recurrent Neural Network) models. The Transformer model is designed to process ordered input data (such as textual or image information) for tasks like language translation and image processing. However, there are differences between the Transformer model and traditional neural network models like RNNs. The Transformer model incorporates self-attention mechanisms within its structure, appearing in both the encoding and decoding processes of the model. This allows the model to better capture the features of the research data within a complete cycle when dealing with time series problems. Additionally, the Transformer model tends to be more effective in terms of training speed compared to RNN models. In addition to these advantages, the Transformer model excels in parallel data processing. Unlike RNN models, it does not require the strict serialization of data processing, meaning that the processing of one step does not depend on the results of the previous step. The structure of the Transformer is illustrated in Figure 4.

2. Materials and Methods

2.1. Battery Instruction

The dataset is from the article [28,29,30,31,32]. The researchers performed the experiment and recorded the data. The batteries used were commercial LFP/graphite cells (A123 Systems, model APR18650M1A, 1.1 Ah nominal capacity). The details of the batteries are shown in the Table 1. The experiments were conducted at a constant temperature, which was 30 °C. The batteries used fast-charging ways, but identical discharging ways (4 C to 2.0 V, where 1 C is 1.1 A). Since the graphite negative electrode dominated degradation in these cells, these results could be useful for other lithium-ion batteries based on graphite.

2.2. Hardware and Software

Overall, the experiment was conducted on the Windows 10 Enterprise LTSC operating system. The experiment was performed under the running state of a CPU (75 W) and GPU (115 W). The usage of hardware and software during the experiment is summarized in Table 2. In summary, the experiment heavily relied on both CPU and GPU resources. Enhancing CPU computational capacity can expedite data processing and model validation, while leveraging GPU resources significantly accelerates model training, reducing the overall process time. Additionally, the choice of CUDA and PyTorch versions can also impact the training time of the model, thereby influencing the overall duration of the experiment.

2.3. Methods

The overall steps of the experiment were as follows:
Step 1:
The preliminary data processing was conducted using Matlab software, including the deletion of erroneous battery data. Voltage and current data from individual batteries were extracted, and the battery capacity for each charge–discharge cycle was calculated in advance. Data used for model training and validation were packaged and stored in .mat files.
Step 2:
The battery data were imported from the .mat files into the PyCharm software for training and validation. The model parameters were set and the model training was proceeded with to obtain the final results.
Step 3:
The final results were then imported back into the Matlab software for further analysis and processing alongside other battery data.
In the entire experiment, the most crucial aspect lay in setting the model parameters in Step 2. During the parameter setting process, it was essential to adjust the parameters according to the calculation Formula (3) for attention magnitude, thereby achieving the optimal attention match. This ensured that the model minimized errors as much as possible during the evaluation of batteries, thereby enhancing the accuracy of the model. The Attention (Q, K, V) mechanism required the following three specified inputs: Q (query), K (key), and V (value). These inputs were then utilized in the formula to calculate the attention, representing the representation of the query under the influence of key and value.
A t t e n t i o n Q , K , V = s o f t m a x Q K T d k V
Note: In Formula (3), K represents the Key values in the model input, V represents the Value values in the model input, and Softmax refers to the softmax function.
The softmax function was used to transform a real-valued vector of length K into a real-valued vector whose elements summed up to 1. The input values could be positive, negative, zero, or greater than one, but the softmax function transformed them into values between zero and one, allowing them to be interpreted as probabilities. This enabled the selection of the most probable battery capacity value from the computed results, thereby facilitating the assessment of the battery’s health status.
To facilitate the understanding of the processing of the input query in key and value in Formula (3), a graphical illustration is provided here, as shown in Figure 5. Essentially, it involved various transformations of the input before serving as the input to the softmax function.

3. Results

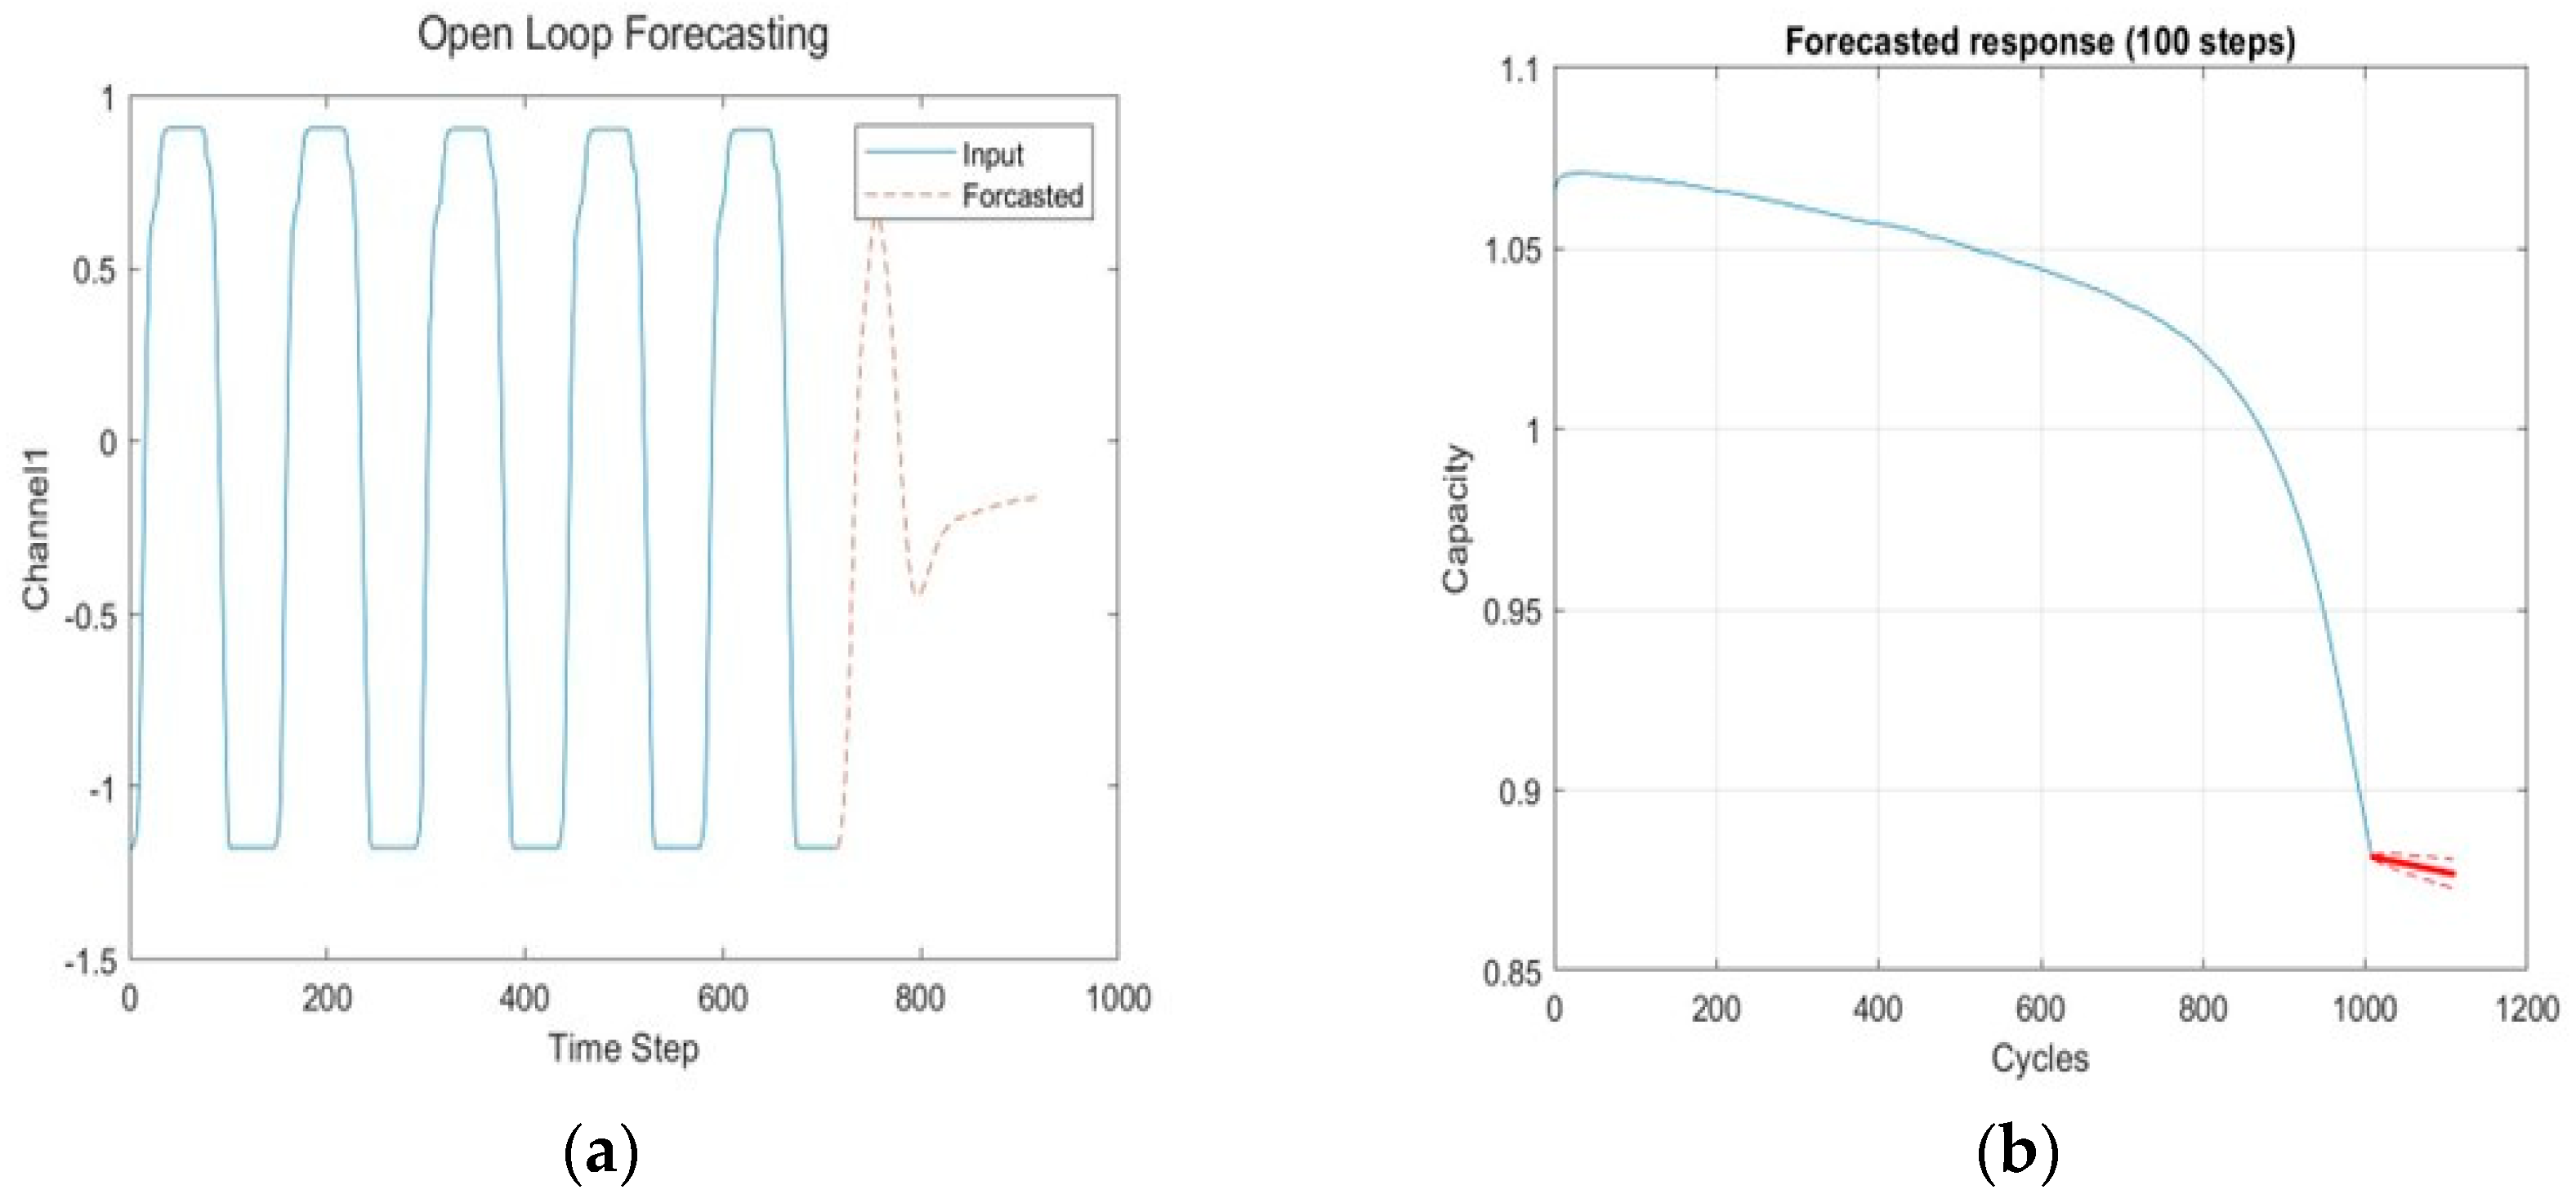
3.1. Training a Single-Battery Model and Using the Model for Prediction

As shown in Figure 6a, using Matlab software, the training of the constructed model for a single battery reveals that the RMSE (Root Mean Square Error) can be below 0.2 with a learning rate of 0.001. Additionally, the calculated loss value is close to zero in Figure 6b. Although the RMSE and Loss meet the requirements early on, it should be noted that this is for a single battery and does not demonstrate the advantages of the method mentioned in this paper. Specifically, the model’s accuracy improves significantly when applied to a large dataset. However, since these are only data from a single battery used for training, the Transformer model trained with limited data may not fully leverage the advantages of the Transformer architecture. The true potential of the Transformer model, which benefits from a large amount of data and parallelized data processing, to enhance prediction accuracy may not be realized due to the limited dataset.
In the training process of the Transformer model using data from only one battery, if the model is trained and predicts the battery capacity in the closed-loop mode, as shown in Figure 7, it can be observed that the single-battery model achieves a good tracking and prediction. However, due to the unavailability of the actual battery capacity for validation during the practical prediction process, the closed-loop mode can only serve as a rough reference for battery degradation and cannot be used for accurate battery capacity prediction.
In the process of training the Transformer model using data from only one battery, even in the open-loop mode, it cannot be considered as accurate for predictions. As shown in Figure 8a, in the open-loop mode, the model fails to approximate the charge and discharge process of a single battery (approximately 150 time points). Moreover, if this trained model is used to predict the capacity of the battery for an extended period after each cycle, it may result in significant deviations, as depicted in Figure 8b. The actual capacity of the single battery is represented by the solid red line between the two red dashed lines. As mentioned earlier, the limitations arise from using data from only one battery negate the advantages of the Transformer model and lead to a linearized prediction over a longer duration.

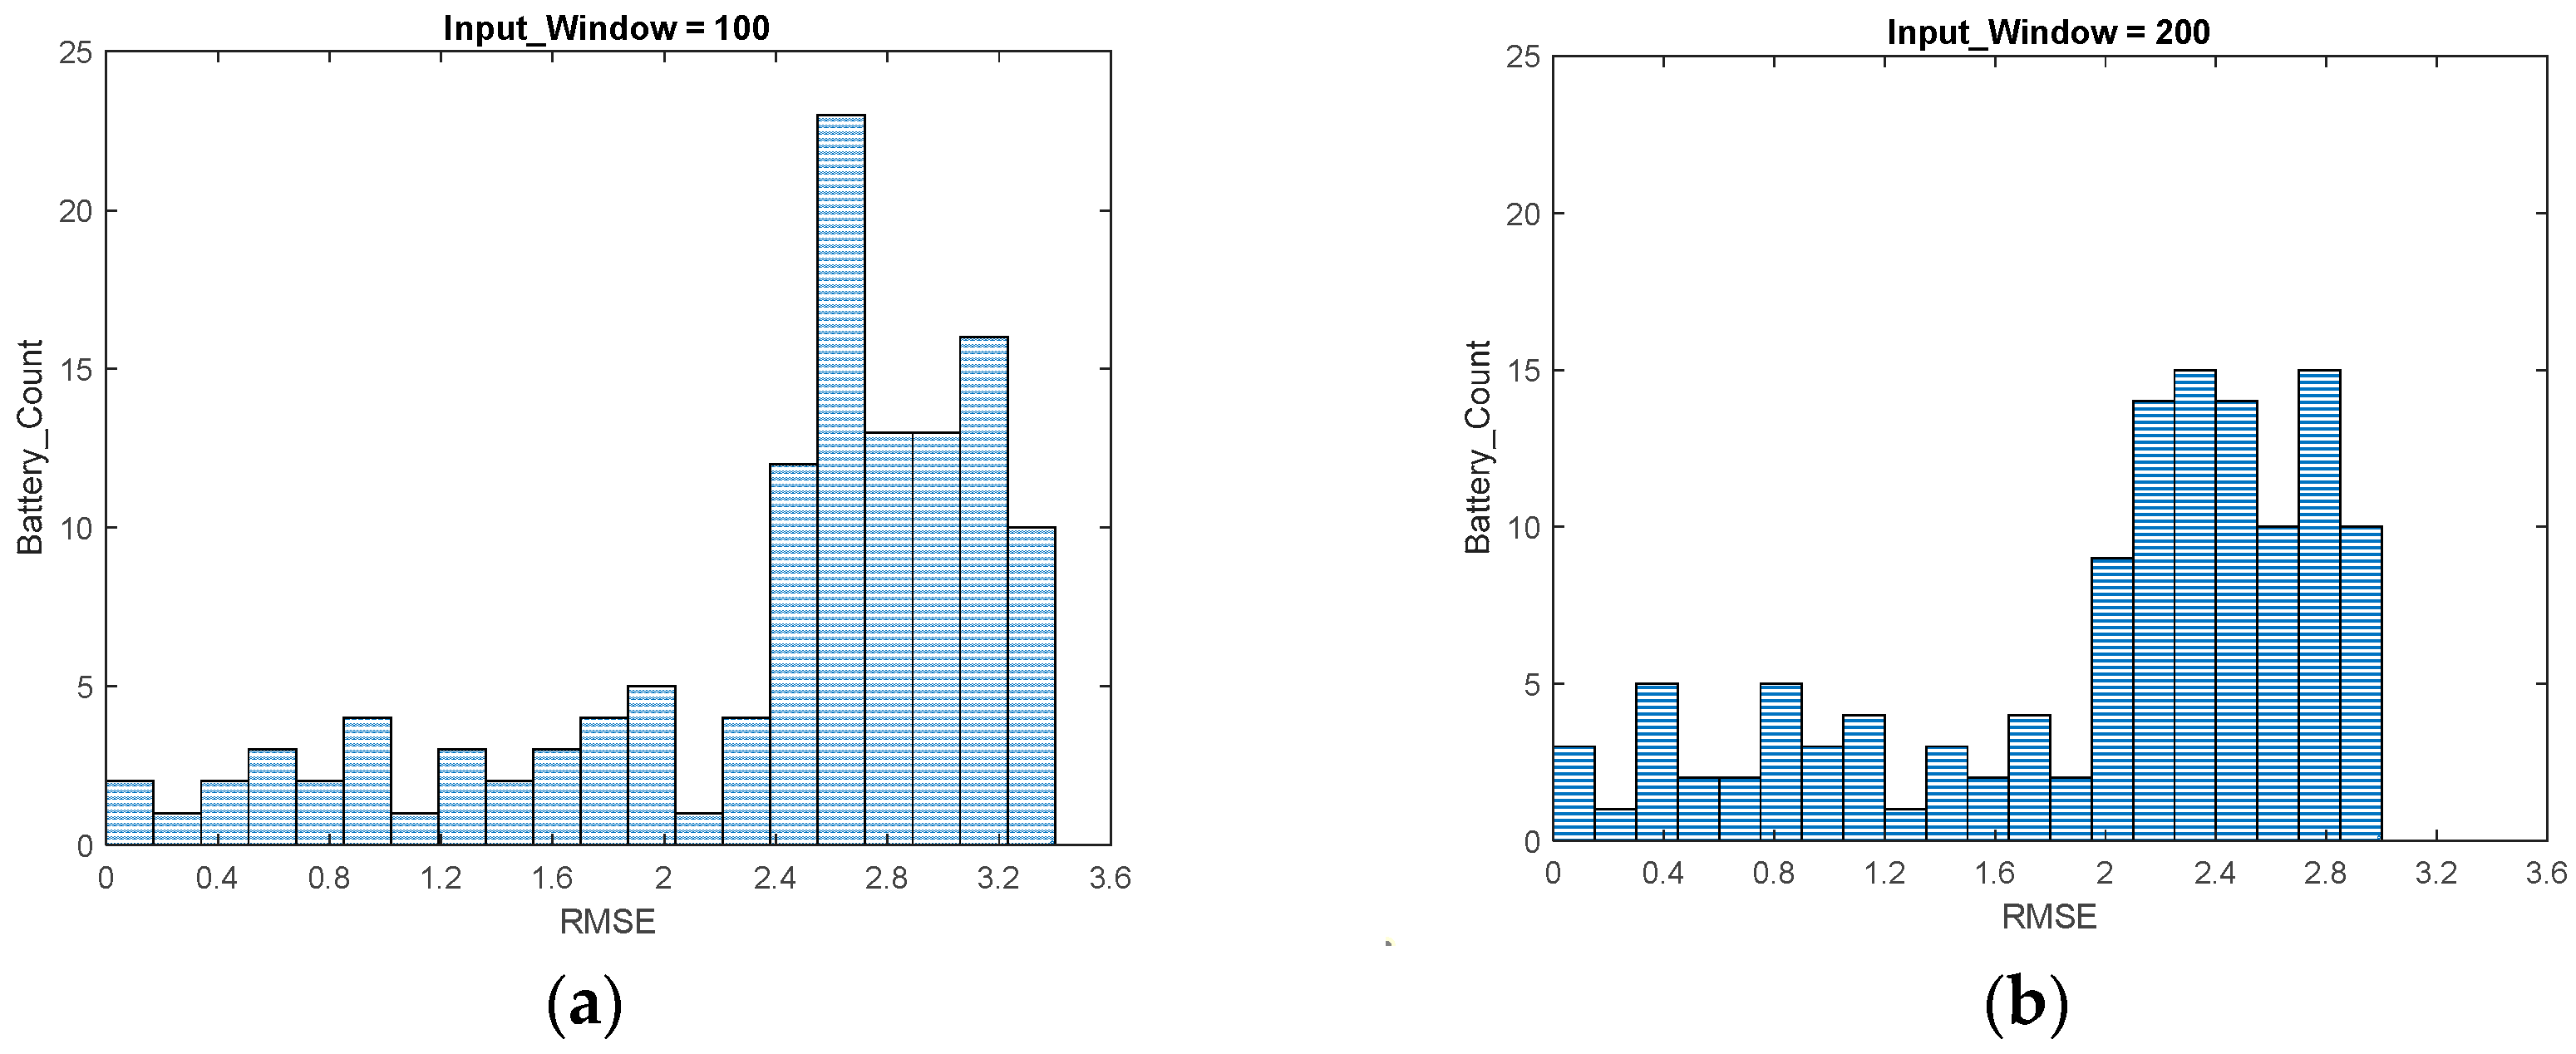
3.2. Statistical Results of Joint Model Training and Model Prediction for 124 Batteries

To evaluate the performance of the Transformer model in assessing the health status of multiple batteries of this model, all data from 124 batteries were used as input for the experiment. The trained model was then used to predict each battery’s capacity, and the predictions for each battery were aggregated for statistical analysis. In this experiment, the Root-Mean-Squared-Error (RMSE) (100%) was employed to assess the model’s performance. In general, a smaller RMSE indicates that the model has better predictions for the data. The formula for calculating RMSE (100%) is as follows:
RMSE 100 % = 1 n t = 1 n C t C t ˜ 2 × 100
Note: In Formula (4), C represents the battery capacity, C t represents the actual value of the t-th data point, C t ˜ represents the predicted value of the t-th data point, and n represents the total number of cycles for a particular battery.
In the training process of the Transformer model, the Input_Window typically refers to the fixed-size input tokens or data sequences that the model receives at each step during training or inference. For Transformer models, the choice of input window size is crucial, as a larger window allows the model to capture longer-range dependencies, but may increase computational requirements. On the other hand, a smaller window may capture more local information, but can ignore long-term dependencies. The optimal window size often depends on the nature of the task and the characteristics of the data.
For battery capacity prediction, the impact of the model’s input window size on the resulting RMSE is illustrated in Figure 9. It is evident that, when the input window size is equal to 200, the range of RMSE for 124 batteries is smaller compared to when the input window size is equal to 100. In other words, a larger data input window results in a smaller RMSE, indicating that the model becomes more accurate when processing more data simultaneously. Specifically, with an input window size of 100, 84 batteries out of 124 have RMSE values falling within the range of 2.4–3.4, as shown in Figure 9a. In contrast, with an input window size of 200, as depicted in Figure 9b, 88 batteries out of 124 have RMSE values falling within the range of 2.0–3.0. The experimental results align with the characteristics of the model, emphasizing that increasing the amount of input data during model processing enhances the model’s advantages and improves its accuracy in predicting data.
The batch size refers to the number of training samples used in a single model iteration. During the training process, the dataset is divided into batches, and each batch is used to update the model’s parameters. The choice of batch size can affect the training dynamics and computational efficiency of the training process. The selection of batch size may impact the convergence speed, memory requirements, and computational efficiency of the training process. Larger batch sizes may lead to faster training on hardware with parallel processing capabilities, but may require more memory. Smaller batch sizes may introduce more update variability, but can converge faster in certain situations. The optimal batch size typically depends on the specific problem, dataset size, and available computational resources.
In the process of setting the internal parameters of the model during this experiment, adjusting the batch size within the model can, to some extent, influence the model’s accuracy in predicting battery capacity. According to Figure 10, setting a smaller internal data segmentation size can improve the predictive accuracy of the model. Specifically, as shown in Figure 10a, when the internal batch size of the model is set to 256, the majority of RMSE values for 96 out of 124 batteries fall within the range of 2.6–3.4. On the other hand, when setting the internal batch size to 128, as depicted in Figure 10b, the distribution of RMSE values for all 124 batteries is more uniform, and even for batteries with RMSE values exceeding 10, they are distributed in the range of 2.2–3.0. This suggests that, in the battery dataset used in this experiment, for the internal parameter settings of the Transformer model, a smaller batch size can enhance the accuracy of the battery capacity prediction.

4. Experiments and Discussions

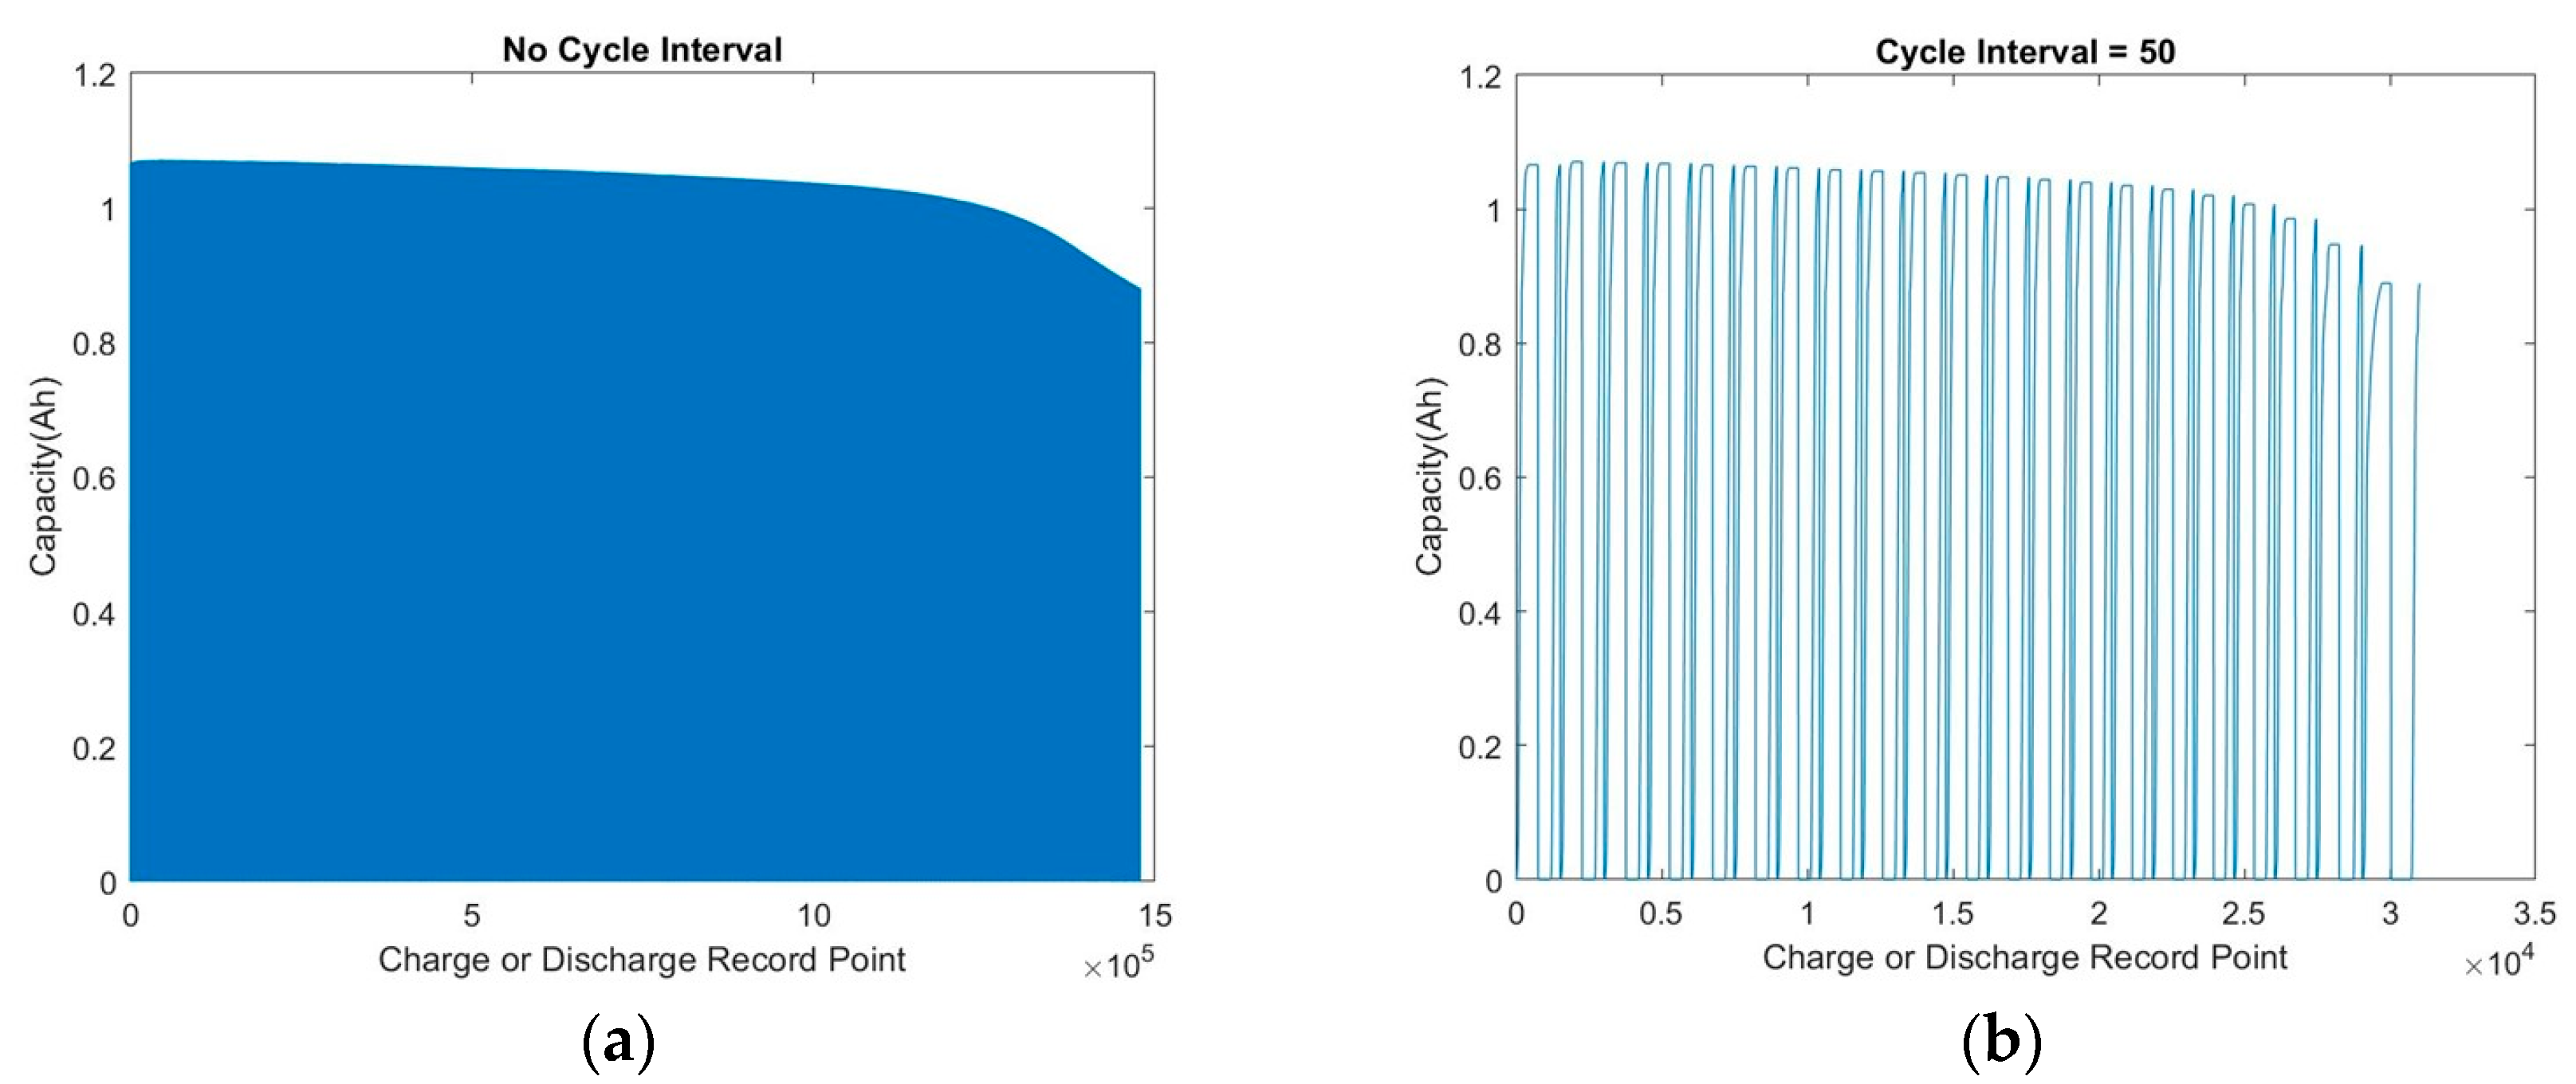
4.1. Get Enough Data

From the above experimental process, we can conclude that the data from a single battery under the Transformer model cannot effectively predict changes in the battery capacity. In contrast, when a large amount of data are used as a training set, the Transformer model can better predict changes in the battery capacity.
Figure 11 depicts the complete charge–discharge process of a specific battery, showing a gradual decrease in capacity with an increase in charge–discharge cycles. It is observed that the decay curve is approximately similar when considering only the final capacity value of each cycle (as shown in Figure 11a). However, when intervals are taken at 50 cycles (as shown in Figure 11b), the curve appears less smooth, indicating that there are many data points not utilized during the battery’s charge–discharge process. Unlike the RNN-type models with sequential data input mentioned earlier, the Transformer model requires a vast amount of data to support model training, thus enhancing the accuracy of the final model.

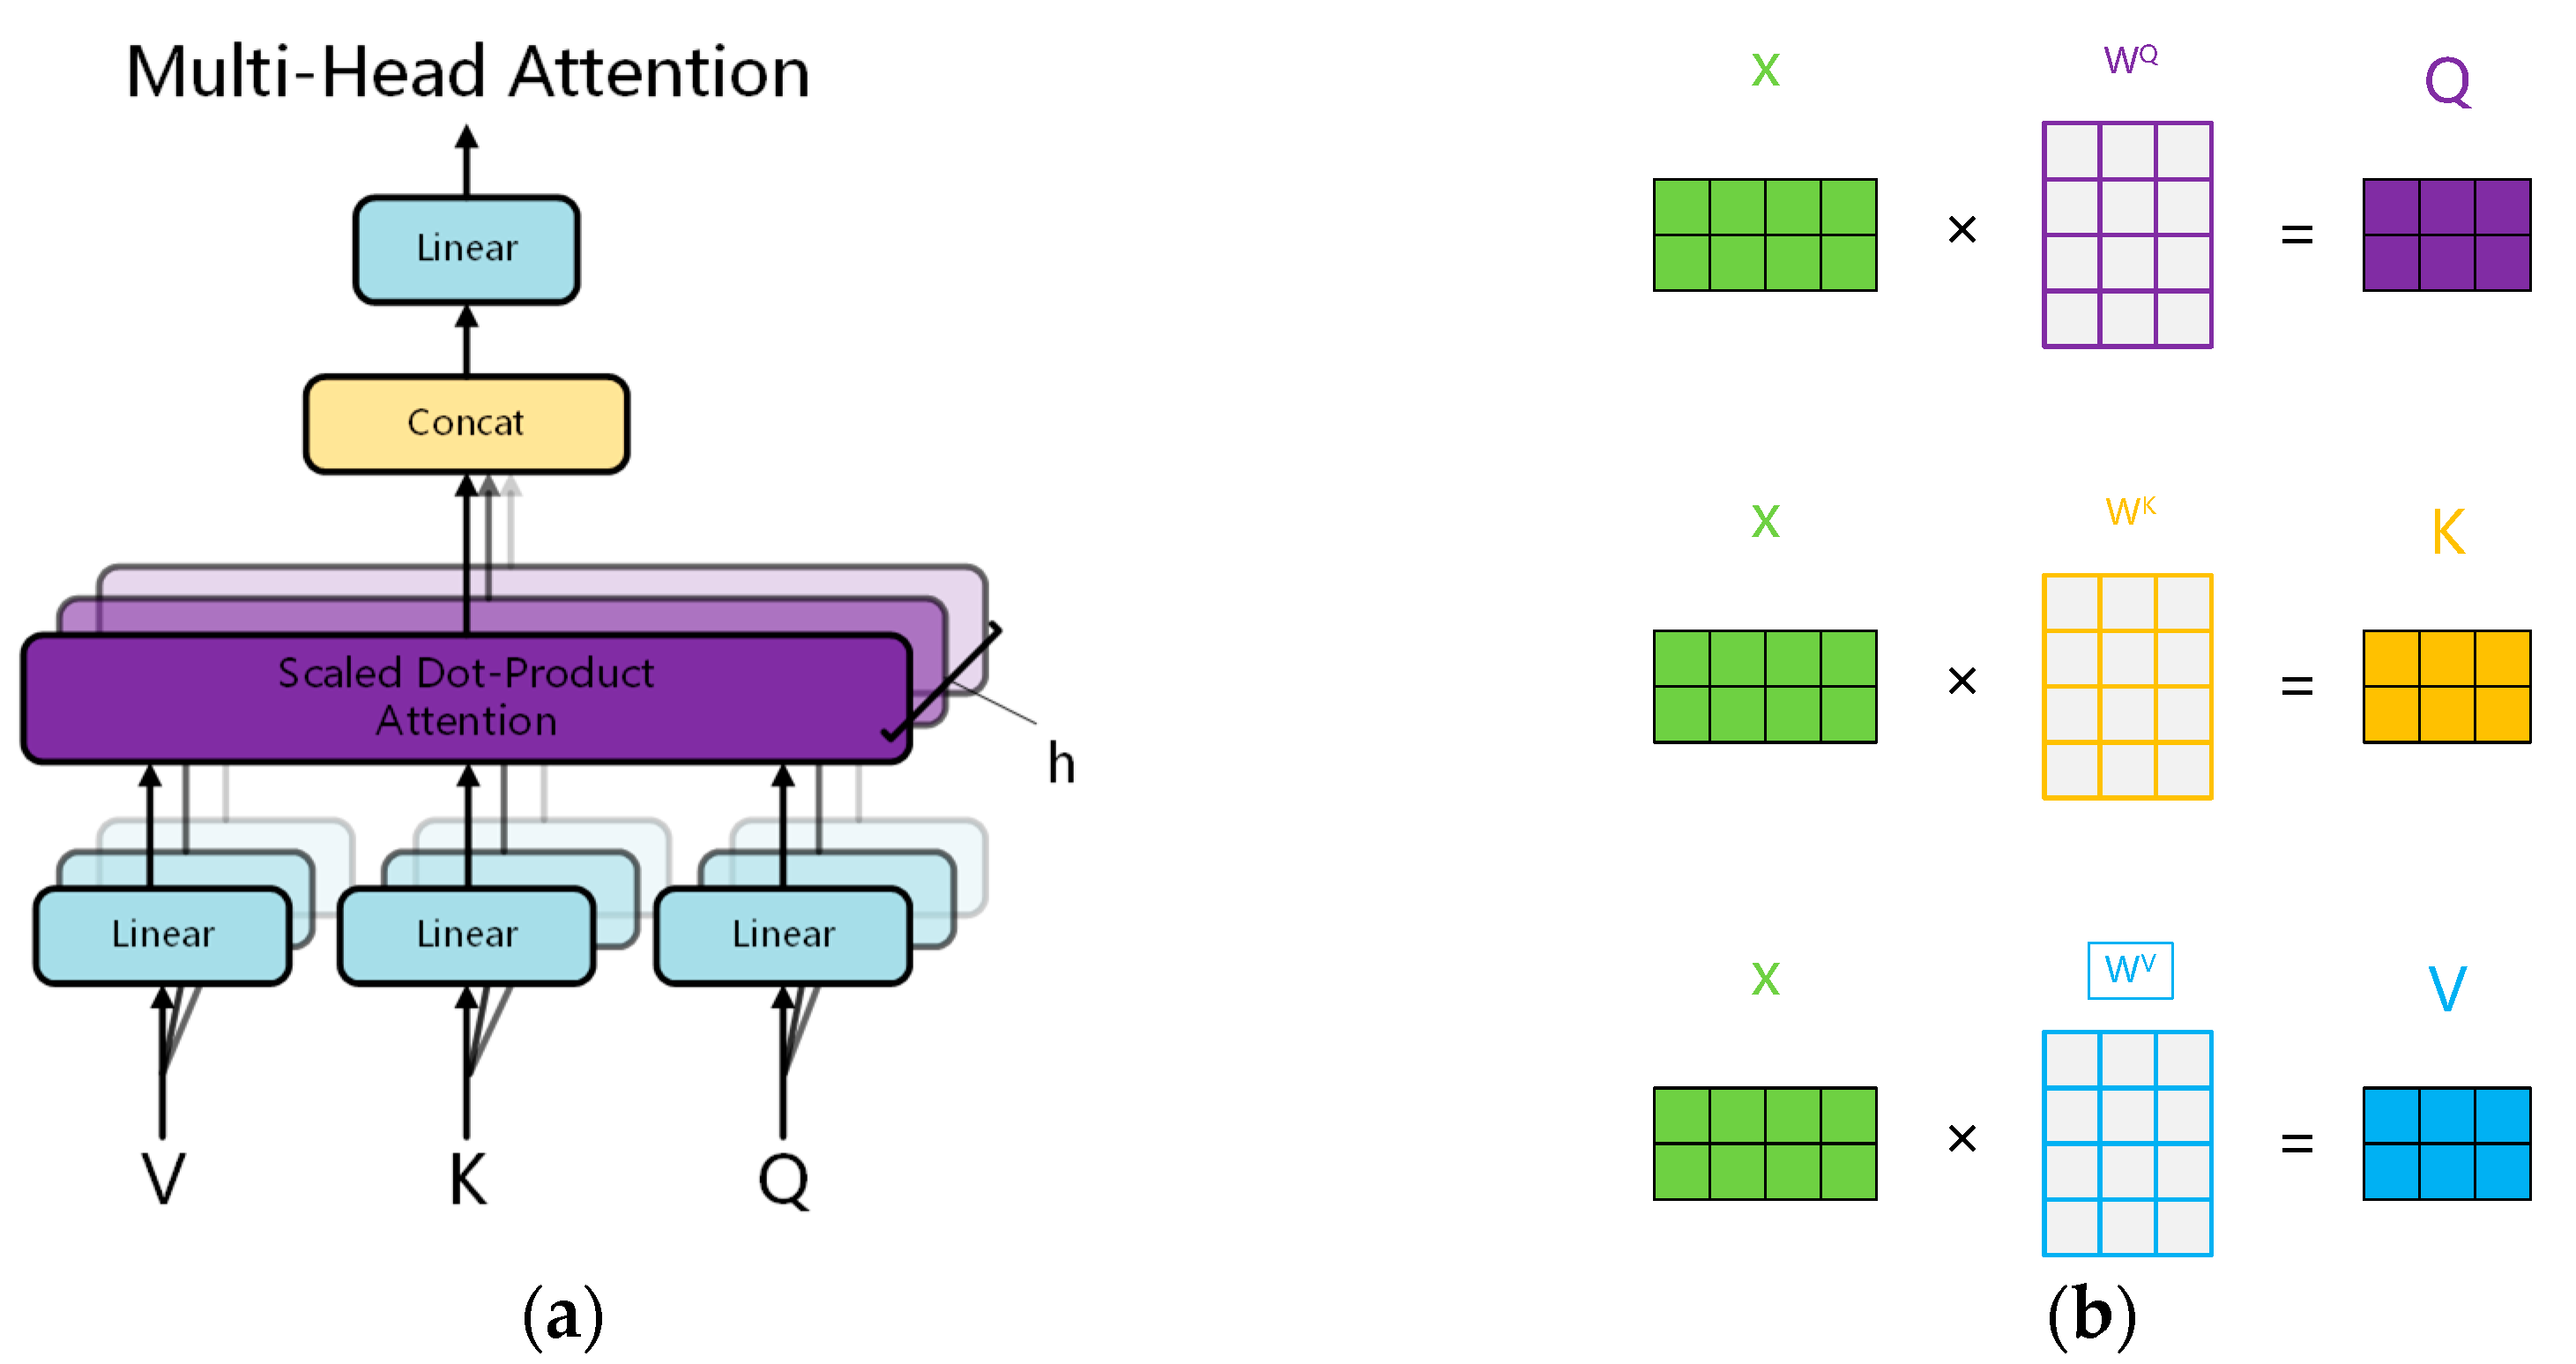
4.2. Transformer Model Discussion

In the entire experimental process, a detailed investigation reveals several innovative aspects of the Transformer model, with the most crucial part being the Multi-Head Attention component, as illustrated in Figure 12a. This component appears not only in the encoding part of the overall model, but is also utilized in the decoding part, making it the most critical section of the entire model. The core component, the Self-Attention mechanism, is employed to handle information correlations at different positions in the sequence data.
Similar to traditional attention mechanisms, the Self-Attention mechanism can assign different attention or weights to different parts of a sequence. When applied to time series data, different positions of the data in the time series undergo transformations in the Query, Key, and Value directions, as shown in Figure 12b, before being input into the Self-Attention module for data processing. The different colors represent the weights of the same data at different positions in the time series.

5. Conclusions

In comparison to traditional RNN, GRU, and LSTM models, this paper proposes a new approach that involves dedicating more time and hardware resources to enhance the accuracy of predicting the health status of a specific type of battery. When applying the Transformer model to predict the SOC of lithium-ion batteries, the amount of data required is relatively larger compared to that of previous models constructed using single time series like RNN, GRU, LSTM, etc. From the experimental results, it can be observed that more data improves the overall accuracy of the model, and the new method proposed in this paper is better at utilizing this large volume of battery data. However, since the input training data are processed in parallel, the increased time and hardware costs are acceptable considering the improvement in accuracy. To ensure the accuracy of the model, it is necessary to have relatively complete charge and discharge data from the early stages of battery operation for model training. The results also indicate that, while this model may not achieve predictions with fewer data points, when a sufficient amount of battery data is available, the accuracy of capacity prediction (expressed by RMSE) can be achieved within 3%.

Author Contributions

Conceptualization, Y.S. and L.W.; methodology, Y.S. and L.W.; software, L.W. and Z.X.; validation, L.W. and N.L.; formal analysis, L.W. and N.L.; investigation, L.W. and N.L.; resources, L.W. and N.L.; data curation, L.W.; writing—original draft preparation, L.W.; writing—review and editing, L.W.; visualization, L.W. and Z.X.; supervision, L.W.; project administration, L.W.; funding acquisition, L.W. All authors have read and agreed to the published version of the manuscript.

Funding

This work was supported by National Natural Science Foundation of China (22279101 and 22279076), the Local Special Service Program Funded by Education Department of Shaanxi Provincial Government (19JC031), and the Natural Science Foundation of Shaanxi (2020JC-41 and 2021TD-15).

Data Availability Statement

The datasets used in this study are available at https://data.matr.io/1/projects/5c48dd2bc625d700019f3204 (accessed on 12 May 2017).

Acknowledgments

The authors would like to appreciate the battery datasets giving by the Toyota Research Institute and the codes to handle the raw data writing by Peter M. Attia. We can do the work so efficient because your Selfless dedication.

Conflicts of Interest

The authors declare no conflicts of interest.

References

  1. Li, W.; Xu, H.; Zhang, H.; Wei, F.; Zhang, T.; Wu, Y.; Huang, L.; Fu, J.; Jing, C.; Cheng, J.; et al. Designing ternary hydrated eutectic electrolyte capable of four-electron conversion for advanced Zn–I 2 full batteries. Energy Environ. Sci. 2023, 16, 4502–4510. [Google Scholar] [CrossRef]
  2. Malozyomov, B.V.; Martyushev, N.V.; Kukartsev, V.V.; Konyukhov, V.Y.; Oparina, T.A.; Sevryugina, N.S.; Gozbenko, V.E.; Kondratiev, V.V. Determination of the Performance Characteristics of a Traction Battery in an Electric Vehicle. World Electr. Veh. J. 2024, 15, 64. [Google Scholar] [CrossRef]
  3. Xiao, W.; Yoo, K.; Kim, J.H.; Xu, H. Breaking Barriers to High-Practical Li-S Batteries with Isotropic Binary Sulfiphilic Electrocatalyst: Creating a Virtuous Cycle for Favorable Polysulfides Redox Environments. Adv. Sci. 2023, 10, 2303916. [Google Scholar] [CrossRef] [PubMed]
  4. Berecibar, M.; Gandiaga, I.; Villarreal, I.; Omar, N.; Van Mierlo, J.; Van den Bossche, P. Critical review of state of health estimation methods of Li-ion batteries for real applications. Renew. Sustain. Energy Rev. 2016, 56, 572–587. [Google Scholar] [CrossRef]
  5. Li, Z.; Khajepour, A.; Song, J. A comprehensive review of the key technologies for pure electric vehicles. Energy 2019, 182, 824–839. [Google Scholar] [CrossRef]
  6. Noura, N.; Boulon, L.; Jemeï, S. A review of battery state of health estimation methods: Hybrid electric vehicle challenges. World Electr. Veh. J. 2020, 11, 66. [Google Scholar] [CrossRef]
  7. Hu, X.; Feng, F.; Liu, K.; Zhang, L.; Xie, J.; Liu, B. State estimation for advanced battery management: Key challenges and future trends. Renew. Sustain. Energy Rev. 2019, 114, 109334. [Google Scholar] [CrossRef]
  8. Cui, Y.; Zuo, P.; Du, C.; Gao, Y.; Yang, J.; Cheng, X.; Yin, G. State of health diagnosis model for lithium ion batteries based on real-time impedance and open circuit voltage parameters identification method. Energy 2018, 144, 647–656. [Google Scholar] [CrossRef]
  9. Zheng, L.; Zhu, J.; Lu, D.D.C.; Wang, G.; He, T. Incremental capacity analysis and differential voltage analysis based state of charge and capacity estimation for lithium-ion batteries. Energy 2018, 150, 759–769. [Google Scholar] [CrossRef]
  10. Zhang, C.; Wang, Y.; Gao, Y.; Wang, F.; Mu, B.; Zhang, W. Accelerated fading recognition for lithium-ion batteries with Nickel-Cobalt-Manganese cathode using quantile regression method. Appl. Energy 2019, 256, 113841. [Google Scholar] [CrossRef]
  11. Hsu, C.W.; Xiong, R.; Chen, N.Y.; Li, J.; Tsou, N.T. Deep neural network battery life and voltage prediction by using data of one cycle only. Appl. Energy 2022, 306, 118134. [Google Scholar] [CrossRef]
  12. Richardson, R.R.; Osborne, M.A.; Howey, D.A. Battery health prediction under generalized conditions using a Gaussian process transition model. J. Energy Storage 2019, 1, 320–328. [Google Scholar] [CrossRef]
  13. Hosseininasab, S.; Lin, C.; Pischinger, S.; Stapelbroek, M.; Vagnoni, G. State-of-health estimation of lithium-ion batteries for electrified vehicles using a reduced-order electrochemical model. J. Energy Storage 2022, 52, 104684. [Google Scholar] [CrossRef]
  14. Berecibar, M.; Devriendt, F.; Dubarry, M.; Villarreal, I.; Omar, N.; Verbeke, W.; Van, M.J. Online state of health estimation on NMC cells based on predictive analytics. J. Power Sources 2016, 320, 239–250. [Google Scholar] [CrossRef]
  15. Liu, K.; Shang, Y.; Ouyang, Q.; Widanage, W.D. A data-driven approach with uncertainty quantification for predicting future capacities and remaining useful life of lithium-ion battery. IEEE Trans. Ind. Electron. 2020, 68, 3170–3180. [Google Scholar] [CrossRef]
  16. Vaswani, A.; Shazeer, N.; Parmar, N.; Uszkoreit, J.; Jones, L.; Gomez, A.N.; Kaiser, L.; Polosukhin, I. Attention is all you need. Adv. Neural Inf. Process. Syst. 2017, 30. [Google Scholar]
  17. Zeng, A.; Chen, M.; Zhang, L.; Xu, Q. Are transformers effective for time series forecasting? In Proceedings of the AAAI Conference on Artificial Intelligence, Washington, DC, USA, 26 June 2023. [Google Scholar]
  18. Zhou, H.; Zhang, S.; Peng, J.; Zhang, S.; Li, J.; Xiong, H.; Zhang, W. Informer: Beyond efficient transformer for long sequence time-series forecasting. In Proceedings of the AAAI Conference on Artificial Intelligence, Virtual, 18 May 2021. [Google Scholar]
  19. Ding, Y.; Jia, M.; Miao, Q.; Cao, Y. A novel time–frequency Transformer based on self–attention mechanism and its application in fault diagnosis of rolling bearings. Mech. Syst. Signal Process. 2022, 168, 108616. [Google Scholar] [CrossRef]
  20. Han, Z.; Zhao, J.; Leung, H.; Ma, K.F.; Wang, W. A review of deep learning models for time series prediction. IEEE Sensors J. 2019, 21, 7833–7848. [Google Scholar] [CrossRef]
  21. Lucu, M.; Mrtinez-Laserna, E.; Gandiaga, I.; Camblong, H. A critical review on self-adaptive Li-ion battery ageing models. J. Power Sources 2018, 401, 85–101. [Google Scholar] [CrossRef]
  22. Hosen, M.S.; Jaguemont, J.; Van Mierlo, J.; Berecibar, M. Battery lifetime prediction and performance assessment of different modeling approaches. iScience 2021, 24. [Google Scholar] [CrossRef] [PubMed]
  23. Yang, F.; Zhang, S.; Li, W.; Miao, Q. State-of-charge estimation of lithium-ion batteries using LSTM and UKF. Energy 2020, 201, 117664. [Google Scholar] [CrossRef]
  24. Ren, X.; Liu, S.; Yu, X.; Dong, X. A method for state-of-charge estimation of lithium-ion batteries based on PSO-LSTM. Energy 2021, 234, 121236. [Google Scholar] [CrossRef]
  25. Yang, X.G.; Leng, Y.; Zhang, G.; Ge, S.; Wang, C.Y. Modeling of lithium plating induced aging of lithium-ion batteries: Transition from linear to nonlinear aging. J. Power Sources 2017, 360, 28–40. [Google Scholar] [CrossRef]
  26. Hewamalage, H.; Bergmeir, C.; Bandara, K. Recurrent neural networks for time series forecasting: Current status and future directions. Int. J. Forecast 2021, 37, 388–427. [Google Scholar] [CrossRef]
  27. Li, X.; Bi, F.; Yang, X.; Bi, X. An echo state network with improved topology for time series prediction. IEEE Sens. J. 2022, 22, 5869–5878. [Google Scholar] [CrossRef]
  28. Tang, X.; Zou, C.; Yao, K.; Chen, G.; Liu, B.; He, Z.; Gao, F. A fast estimation algorithm for lithium-ion battery state of health. J. Power Sources 2018, 396, 453–458. [Google Scholar] [CrossRef]
  29. Ullah, I.; Liu, K.; Yamamoto, T.; Al Mamlook, R.E.; Jamal, A. A comparative performance of machine learning algorithm to predict electric vehicles energy consumption: A path towards sustainability. Energy Environ. 2022, 33, 1583–1612. [Google Scholar] [CrossRef]
  30. Hong, J.; Lee, D.; Jeong, E.R.; Yi, Y. Towards the swift prediction of the remaining useful life of lithium-ion batteries with end-to-end deep learning. Appl. Energy 2020, 278, 115646. [Google Scholar] [CrossRef]
  31. Severson, K.A.; Attia, P.M.; Jin, N.; Perkins, N.; Jiang, B.; Yang, Z.; Braatz, R.D. Data-driven prediction of battery cycle life before capacity degradation. Nat. Energy 2019, 4, 383–391. [Google Scholar] [CrossRef]
  32. Attia, P.; Deetjen, M.; Witmer, J. Accelerating battery development via early prediction of cell lifetime. Elastic 2018, 2, 2. [Google Scholar]
Figure 1. This is a figure showing 5 batteries discharging and charging: (a) this is a figure about the battery voltage vs. battery capacity in discharge and (b) this is a figure about the battery voltage vs. battery capacity in charge.
Energies 18 00248 g001
Figure 2. Traditional RNN model architecture.
Energies 18 00248 g002
Figure 3. This is a figure about two variants of RNN: (a) the GRU variant and (b) the LSTM variant.
Energies 18 00248 g003
Figure 4. Architecture of the Transformer model.
Energies 18 00248 g004
Figure 5. The graphical illustration of softmax input.
Energies 18 00248 g005
Figure 6. The process of training a model for a single battery. (a) the RMSE (Root Mean Square Error) and (b) the calculated loss value.
Energies 18 00248 g006aEnergies 18 00248 g006b
Figure 7. Prediction of a single battery in closed-loop mode.
Energies 18 00248 g007
Figure 8. Prediction of a single battery in open-loop mode. (a) Charge and discharge prediction of a single battery in open-loop mode and (b) battery capacity prediction with a step length of 150.
Energies 18 00248 g008
Figure 9. Statistical results of RMSE. (a) Statistical results of RMSE where Input_Window equals 100 and (b) statistical results of RMSE where Input_Windows equal 200.
Energies 18 00248 g009
Figure 10. Statistical results of RMSE. (a) Batch_Size equals 256 and (b) Batch_Size equals 128.
Energies 18 00248 g010
Figure 11. Changes in capacity during battery charge and discharge cycles. (a) Record with no cycle interval and (b) record with cycle interval equal 50.
Energies 18 00248 g011
Figure 12. Details of the Multi-Head Attention. (a) The structure of the Multi-Head Attention and (b) graphical illustration of the input.
Energies 18 00248 g012
Table 1. The details of the battery.
AttributeDescription
Cell chemistry (cathode)LiFePO4
Cell chemistry (anode)Graphite
Nominal capacity1.1 Ah
Nominal voltage3.3 V
Voltage window2.0V–3.6 V
Environmental temperature30 °C
Recommended fast-charge current3.6 C (4 A)
Cell manufacturer and typeA123 APR18650M1A
Table 2. Hardware and software used.
Hardware/SoftwareModel/Version
CPUAMD 3900X (75 W)
GPUNVIDIA rtx2060 (115 w)
Memory32G (2666 Hz)
DiskSN750 (1 Tb)
OSWindows 10 Enterprise LTSC
GPU Driver Version531.14
CUDA Version12.1
Python3.10
Pytorch2.0.0 + cu118
Matlab9.8.0.1323502 (R2020a)
Pycharm2021.1.2
Disclaimer/Publisher’s Note: The statements, opinions and data contained in all publications are solely those of the individual author(s) and contributor(s) and not of MDPI and/or the editor(s). MDPI and/or the editor(s) disclaim responsibility for any injury to people or property resulting from any ideas, methods, instructions or products referred to in the content.

