1. Introduction
In recent years, with the gradual increase in China’s electricity demand and the continuous expansion of the power system [
1], issues related to the security and stability of the power grid have become increasingly significant. Due to the uneven distribution of energy centers and load centers, long-distance power transmission is often required [
2]. Transmission lines are becoming more densely packed, and the available land for power corridors is increasingly limited. To avoid densely populated industrial and residential areas, overhead transmission lines need to pass through densely vegetated mountainous areas. Intense vegetation in these areas is prone to wildfires during extreme weather conditions [
3]. Additionally, human activities, such as sacrificial rituals and slash-and-burn practices, contribute to frequent wildfires. Wildfires in the vicinity of power transmission line corridors significantly reduce the insulation strength of gaps between the transmission lines [
4,
5,
6]. The breakdown of air gaps occurs more easily, leading to line tripping incidents and jeopardizing the safety of the power grid.
Wildfires impact line tripping occurs in two main forms, primarily involving the breakdown of the air gap between conductors and damage to insulators [
7,
8]. Air gap breakdown typically takes two forms: discharge between conductors and discharge from conductors to ground, including trees, buildings, and towers. According to relevant statistics, approximately 90% of line-tripping incidents are caused by air gap breakdown between conductors, with fewer cases of insulator damage. Wildfires have characteristics of mobility and continuity [
9,
10,
11], thus increasing the probability of causing multiphase faults in power lines. This could lead to consecutive tripping of multiple circuits within the same corridor, as well as repetitive tripping of the same circuit within a short timeframe, thereby posing significant safety hazards to primary equipment, such as circuit breakers. Wildfires have gradually become a crucial factor causing disaster incidents in power grids [
12,
13]. The 2019–2020 Black Summer Bushfires in Australia caused widespread power outages, particularly in New South Wales and Victoria, due to wildfire-induced electrical faults and transmission line failures. As a result, stronger transmission line management measures and improved inspections during fire seasons were implemented [
14]. On 5 February 2021, a wildfire on the Southern Power Grid’s 500 kV Laiwu I line caused a phase C tripping. After a successful reclosure, phase A experienced tripping again shortly thereafter. In recent years, the number of tripping and power outage incidents caused by wildfires on transmission lines has increased, significantly affecting the secure and stable operation of the power grid [
15,
16].
A substantial amount of experimental research has been conducted internationally on the characteristics of AC transmission line tripping caused by wildfires [
17,
18], primarily under AC-voltage conditions. However, there is relatively limited research domestically on the discharge aspects of air gaps during wildfires, and the understanding of the wildfire discharge mechanism on transmission lines is not yet sufficiently deep. According to gas discharge theory, atmospheric conditions, space charge, and conductive particles all influence the development of electron avalanche and streamer discharge. The high temperature of the flame, oxidation reactions, and charges generated by thermal ionization, as well as smoke and ash, can significantly impact the insulation strength of air gaps in transmission lines [
19,
20,
21,
22]. Therefore, based on factors such as wildfire temperature, space charge, smoke, and ash, different discharge mechanisms have been proposed.
- (1)
Air density reduction model
The most prominent feature of a flame is its high temperature. Under atmospheric conditions, the air pressure is approximately constant. Therefore, the increase in temperature leads to a decrease in the breakdown voltage of the gap. Initially studied by West and Mcmullam in 1978 [
23], the relationship between breakdown voltage and temperature for long gaps is expressed as follows:
In the equation, Vs represents the breakdown voltage under standard atmospheric conditions. Vt is the breakdown voltage under actual conditions, P is the air pressure in units of mercury column height, measured in millimeters (mm), and T is the temperature in degrees Celsius (°C).
Equation (1) indicates that the breakdown voltage is directly proportional to air pressure and inversely proportional to temperature. As the temperature increases, the relative air density around the transmission lines decreases, favoring the formation of corona discharges. The decrease in gap insulation strength under wildfire conditions is due to the influence of temperature, space ions, and smoke on the development of streamers [
24,
25].
- (2)
Particle-triggered breakdown model
During the combustion process of wildfires, in addition to generating a large amount of smoke, large-sized ash particles enter the wire–wire and wire–ground gaps under the influence of thermal convection. These particles, mostly carbonized branches, exhibit good conductivity. Under the buoyancy of the flame, they enter the strong field region near the conductors and approach the conductors under the polarization effect of the strong electric field. Naidoo in South Africa conducted research on the impact of conductive particles on discharges, suggesting that as the length of conductive particles increases, the insulation strength sharply decreases [
26].
Under the influence of high temperature and charges generated by the flame, the degree of electric field distortion around the particles increases, expanding the range of triggered discharge. The discharge interactions between these particles and the high-voltage conductors, as well as between the particles themselves, form discharge channels that short-circuit most line–ground gaps, resulting in breakdown.
- (3)
Conductivity model
The conductivity model indicates that the insulation strength of the gap is influenced by the presence of electrons and ions in the flame. There are two sources of electrons and ions in the flame: first, the H3O+ ions and CH3+ generated during the oxidation process of vegetation; second, alkali metal and alkaline earth metal ions present in the vegetation, which undergo thermal ionization at high temperatures in the flame due to their low ionization potential. As the flame temperature increases, the number of ions in the flame significantly increases, leading to a noticeable increase in flame conductivity.
- (4)
Thermal ionization model
The thermal ionization model posits that the flame causes significant thermal ionization in the air, rendering it conductive, while a portion of the smoke region above the flame is considered an insulator. Near the conductor, there exists a charged region due to phenomena such as corona discharges. In practice, the thermal ionization model also takes into account the impact of ions in the flame on discharges. However, the primary source of ions in the flame is from the oxidation reactions of vegetation and the thermal ionization of alkali metal salts. Therefore, understanding the source of ions in the flame is crucial for wildfire prevention and control.
Wildfires can lead to a significant decrease in the insulation strength of gaps, and some experiments have been conducted in this regard. Fonseca, a researcher in South Africa, conducted experiments and found that the AC insulation strength of the conductor-plate gap in sugarcane straw flame was 35 kV/m (rms), while the insulation strength of the air gap above the flame was 150 kV/m (rms) [
27]. West and Mcmullam used a two-phase test line and studied the breakdown strength of gaps under the condition of flames burning wood below the line [
23]. The results were a conductor–conductor gap: 65 kV/m, and conductor–tower gap: 49.3 kV/m. Lanoie R. obtained a breakdown voltage of 32 kV/m for DC voltage under eucalyptus tree flames [
28]. However, the author did not consider the impact of flame temperature, conductivity, or particles on discharges, making the experimental results challenging to apply to the assessment of insulation characteristics of DC lines under wildfire conditions. Liu H and Zhang M proposed a transmission line gap breakdown voltage prediction model based on flame temperature, conductivity, and particulate matter effects, and validated it experimentally [
29]. However, the model has not been tested in real-world line scenarios, which may limit its generalizability. Huang D et al. systematically studied the breakdown characteristics of wire–plane gaps under different vegetation fire conditions and found that flame conductivity is the primary factor affecting gap insulation strength. Under the flame of pine branches, the average breakdown voltage gradient decreased to 10% of that in a pure air gap [
30].
The aforementioned studies indicate a significant decrease in the insulation strength of transmission line gaps under wildfire conditions. Moreover, the impact on gap insulation strength varies considerably depending on the burning materials. However, existing research, both domestically and internationally, has not systematically considered the influence of vegetation-burning flames on the insulation strength of transmission line gaps, and the discharge mechanisms under wildfire conditions are not yet well-defined. This paper investigates the breakdown characteristics under wildfire conditions for both rod–rod gaps and conductor–ground gaps. The findings hold significant importance for wildfire prevention and control in power grid transmission lines.
It is worthwhile to highlight several aspects of the contributions here:
Three different types of voltage platforms for air gap breakdown under wildfire conditions were established, including direct current, power frequency, and standard operating waves;
Gap breakdown tests were performed under varying flame heights and smoke concentrations, and the corresponding voltage curves were obtained;
Flame height directly influences the gap insulation distance. Under flame bridging conditions, the maximum decrease in breakdown voltage reaches 70–80%;
As the concentration of smoke increases, the degradation of insulation performance becomes more pronounced, with a reduction ranging from 20% to over 50%.
This paper is organized as follows.
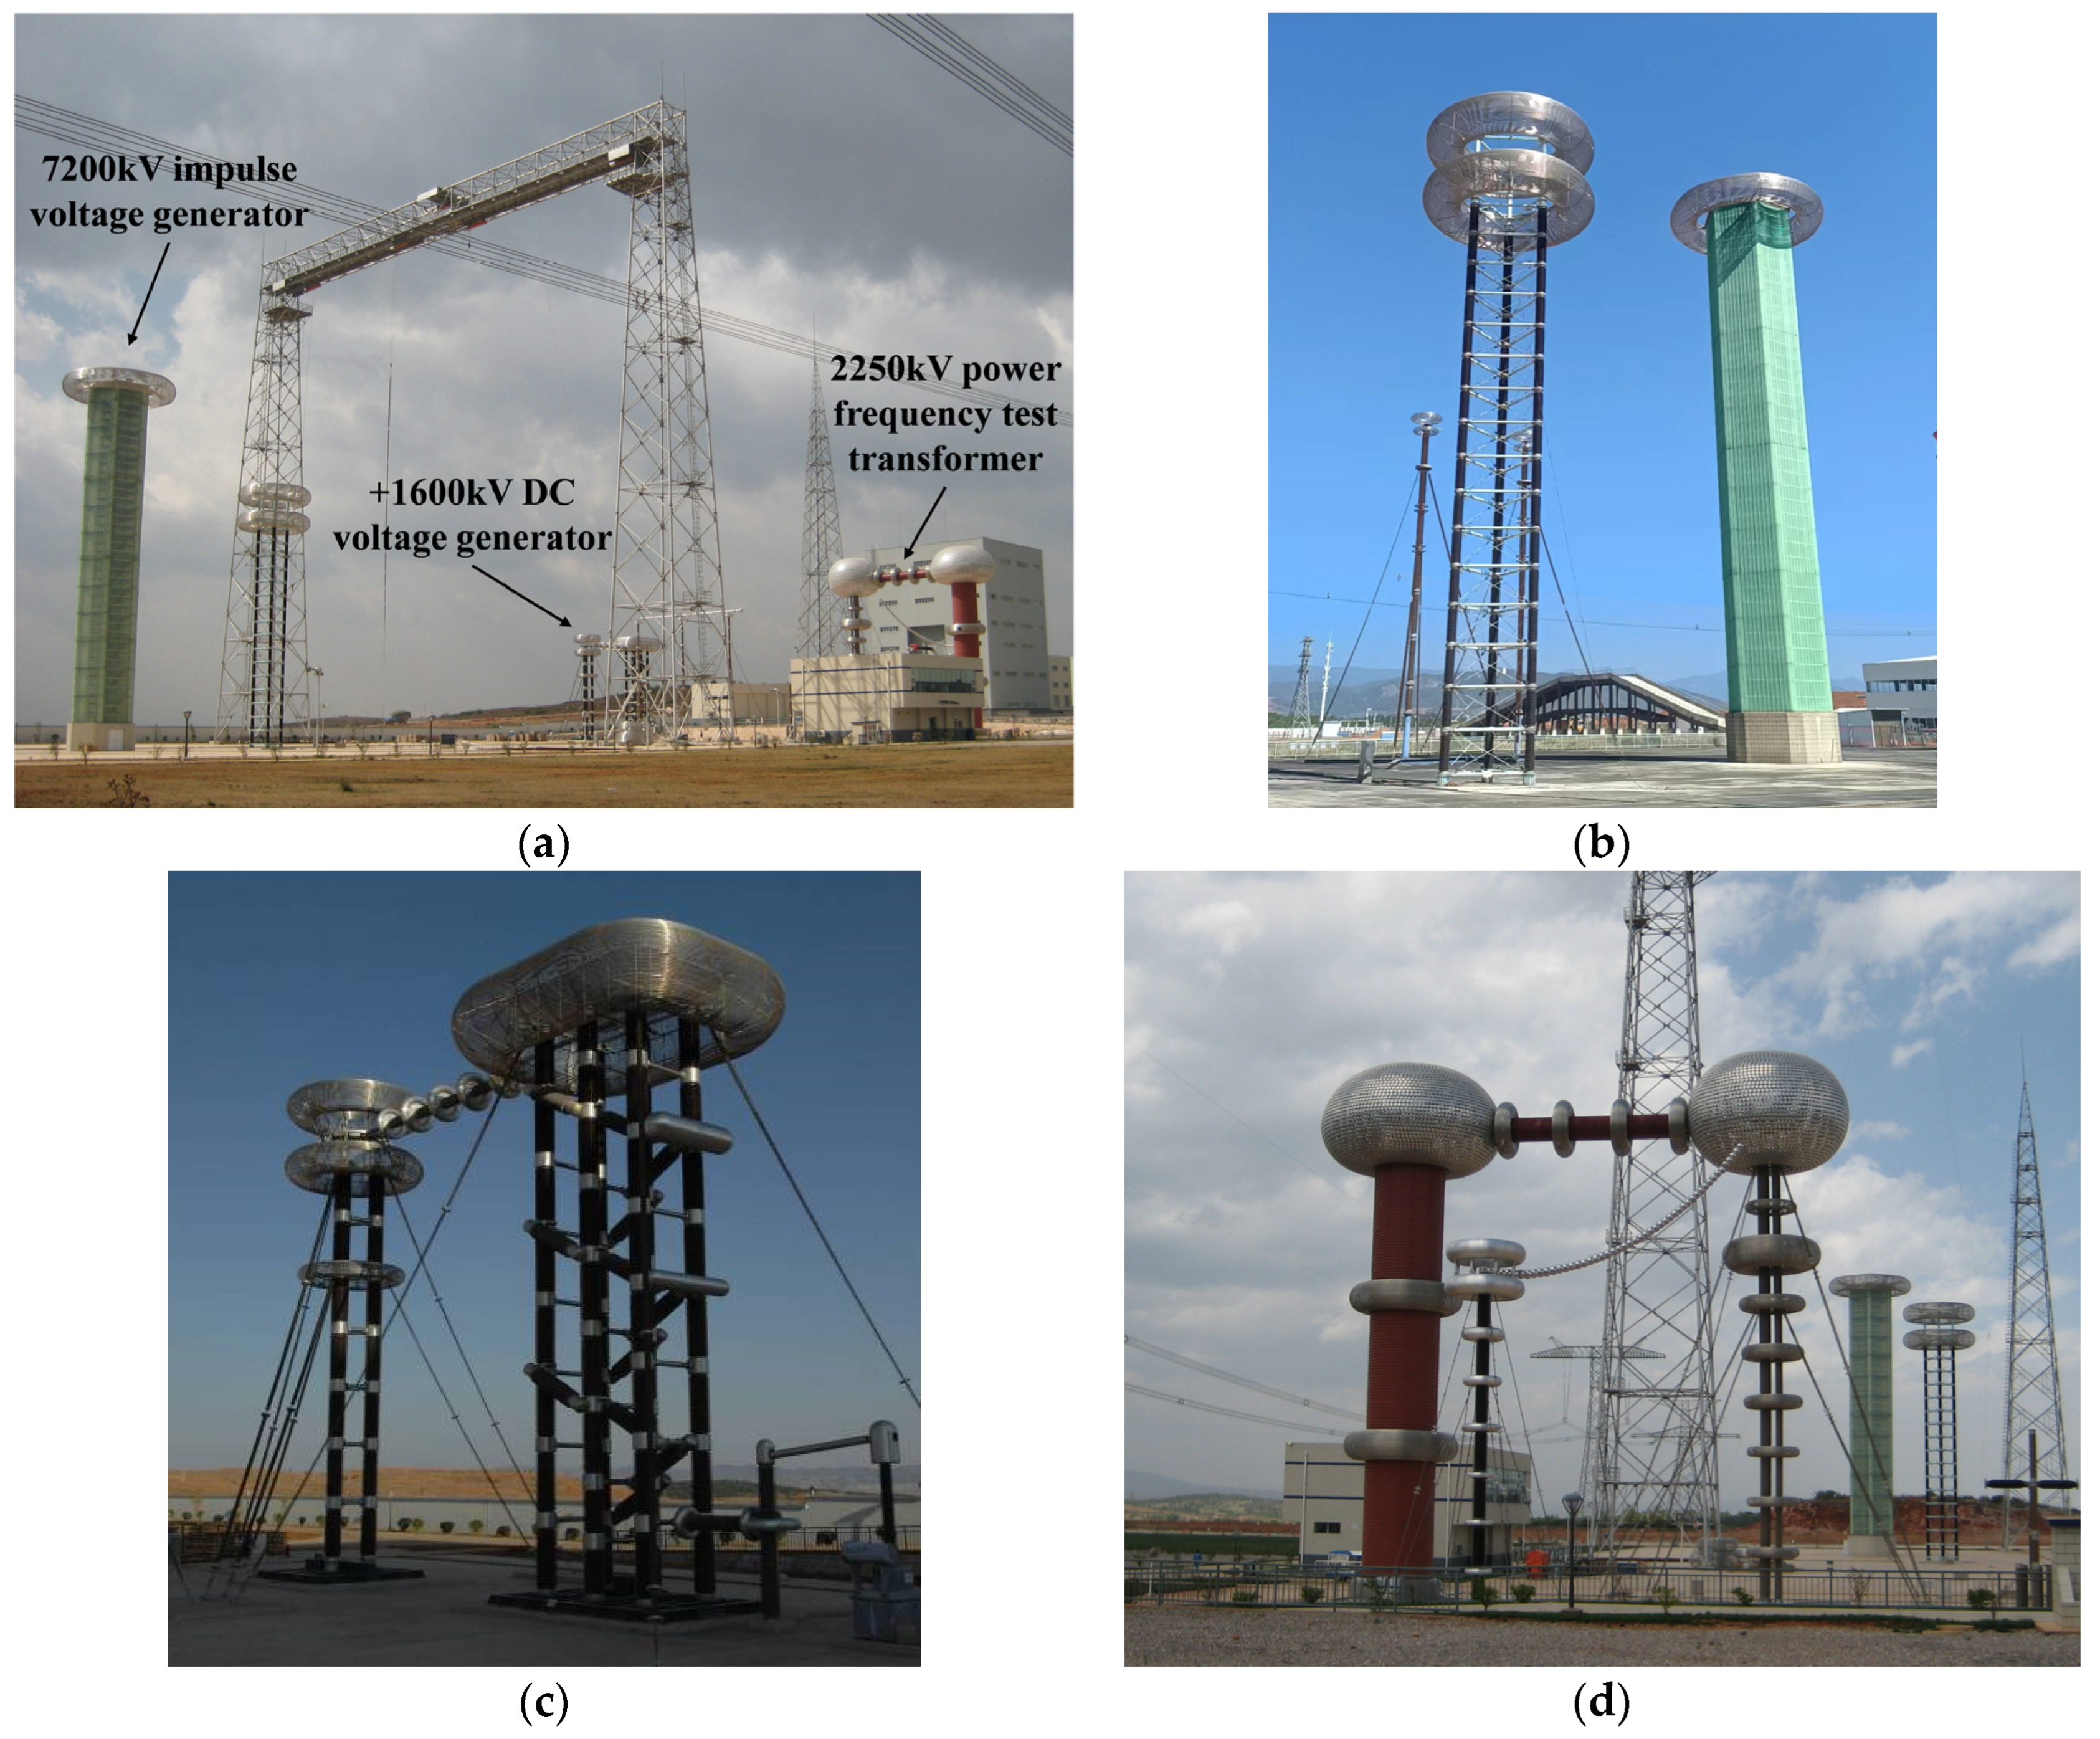
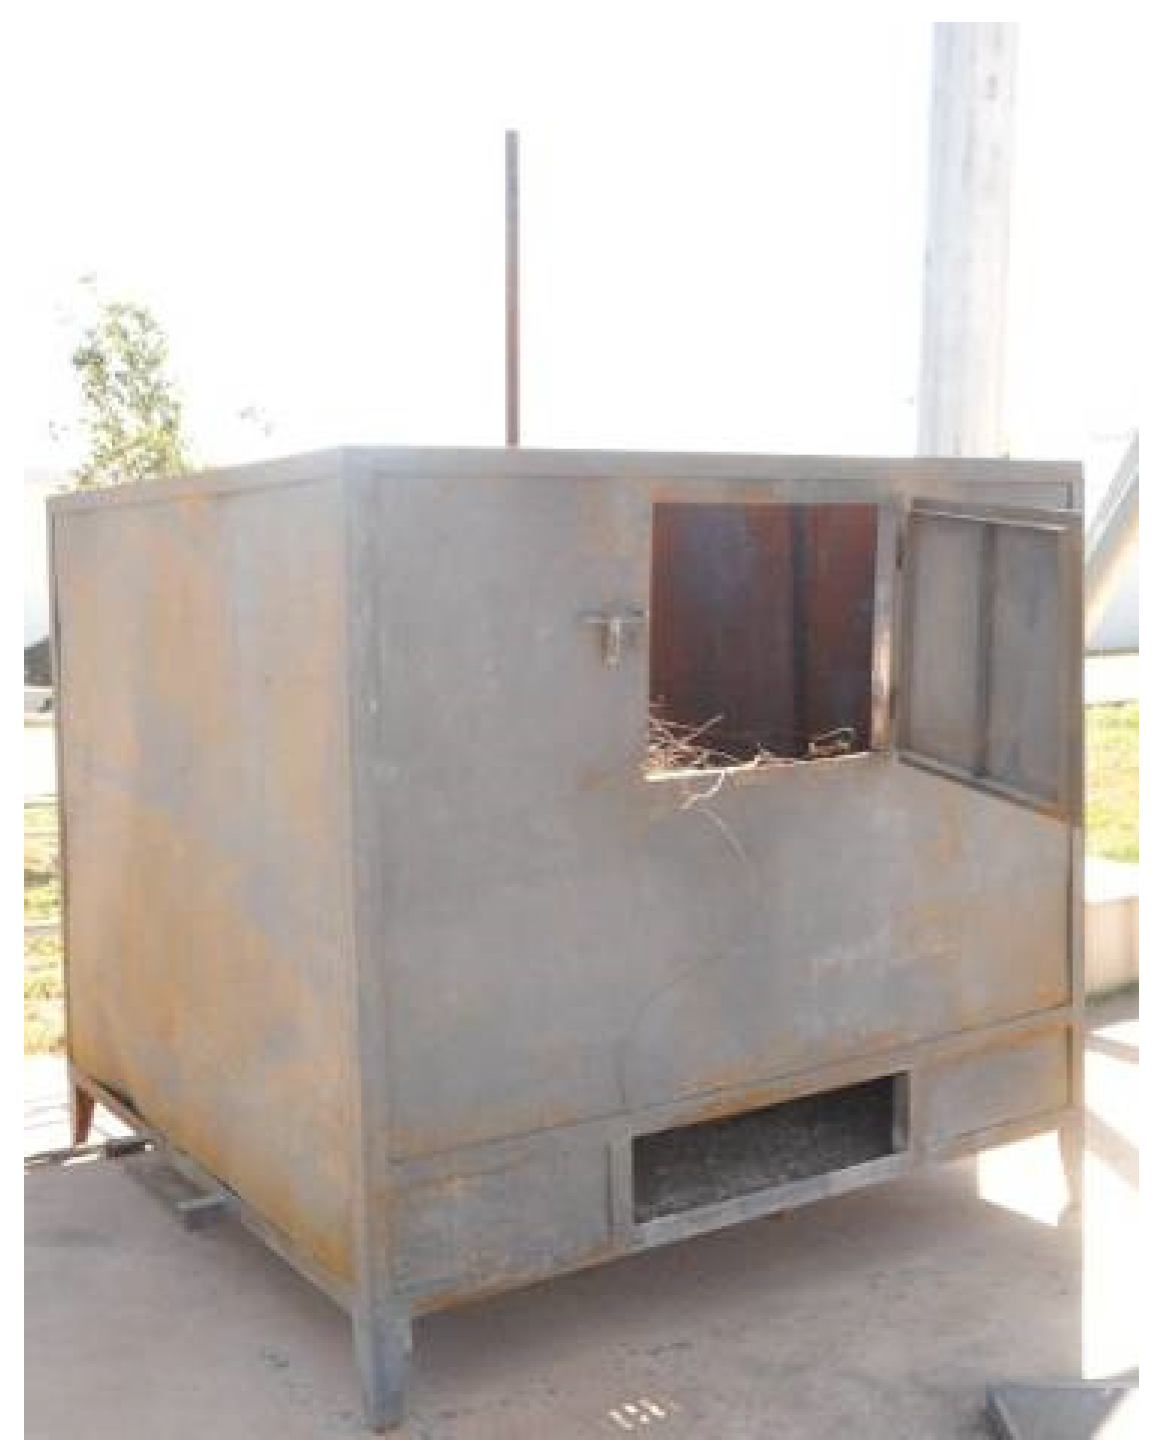
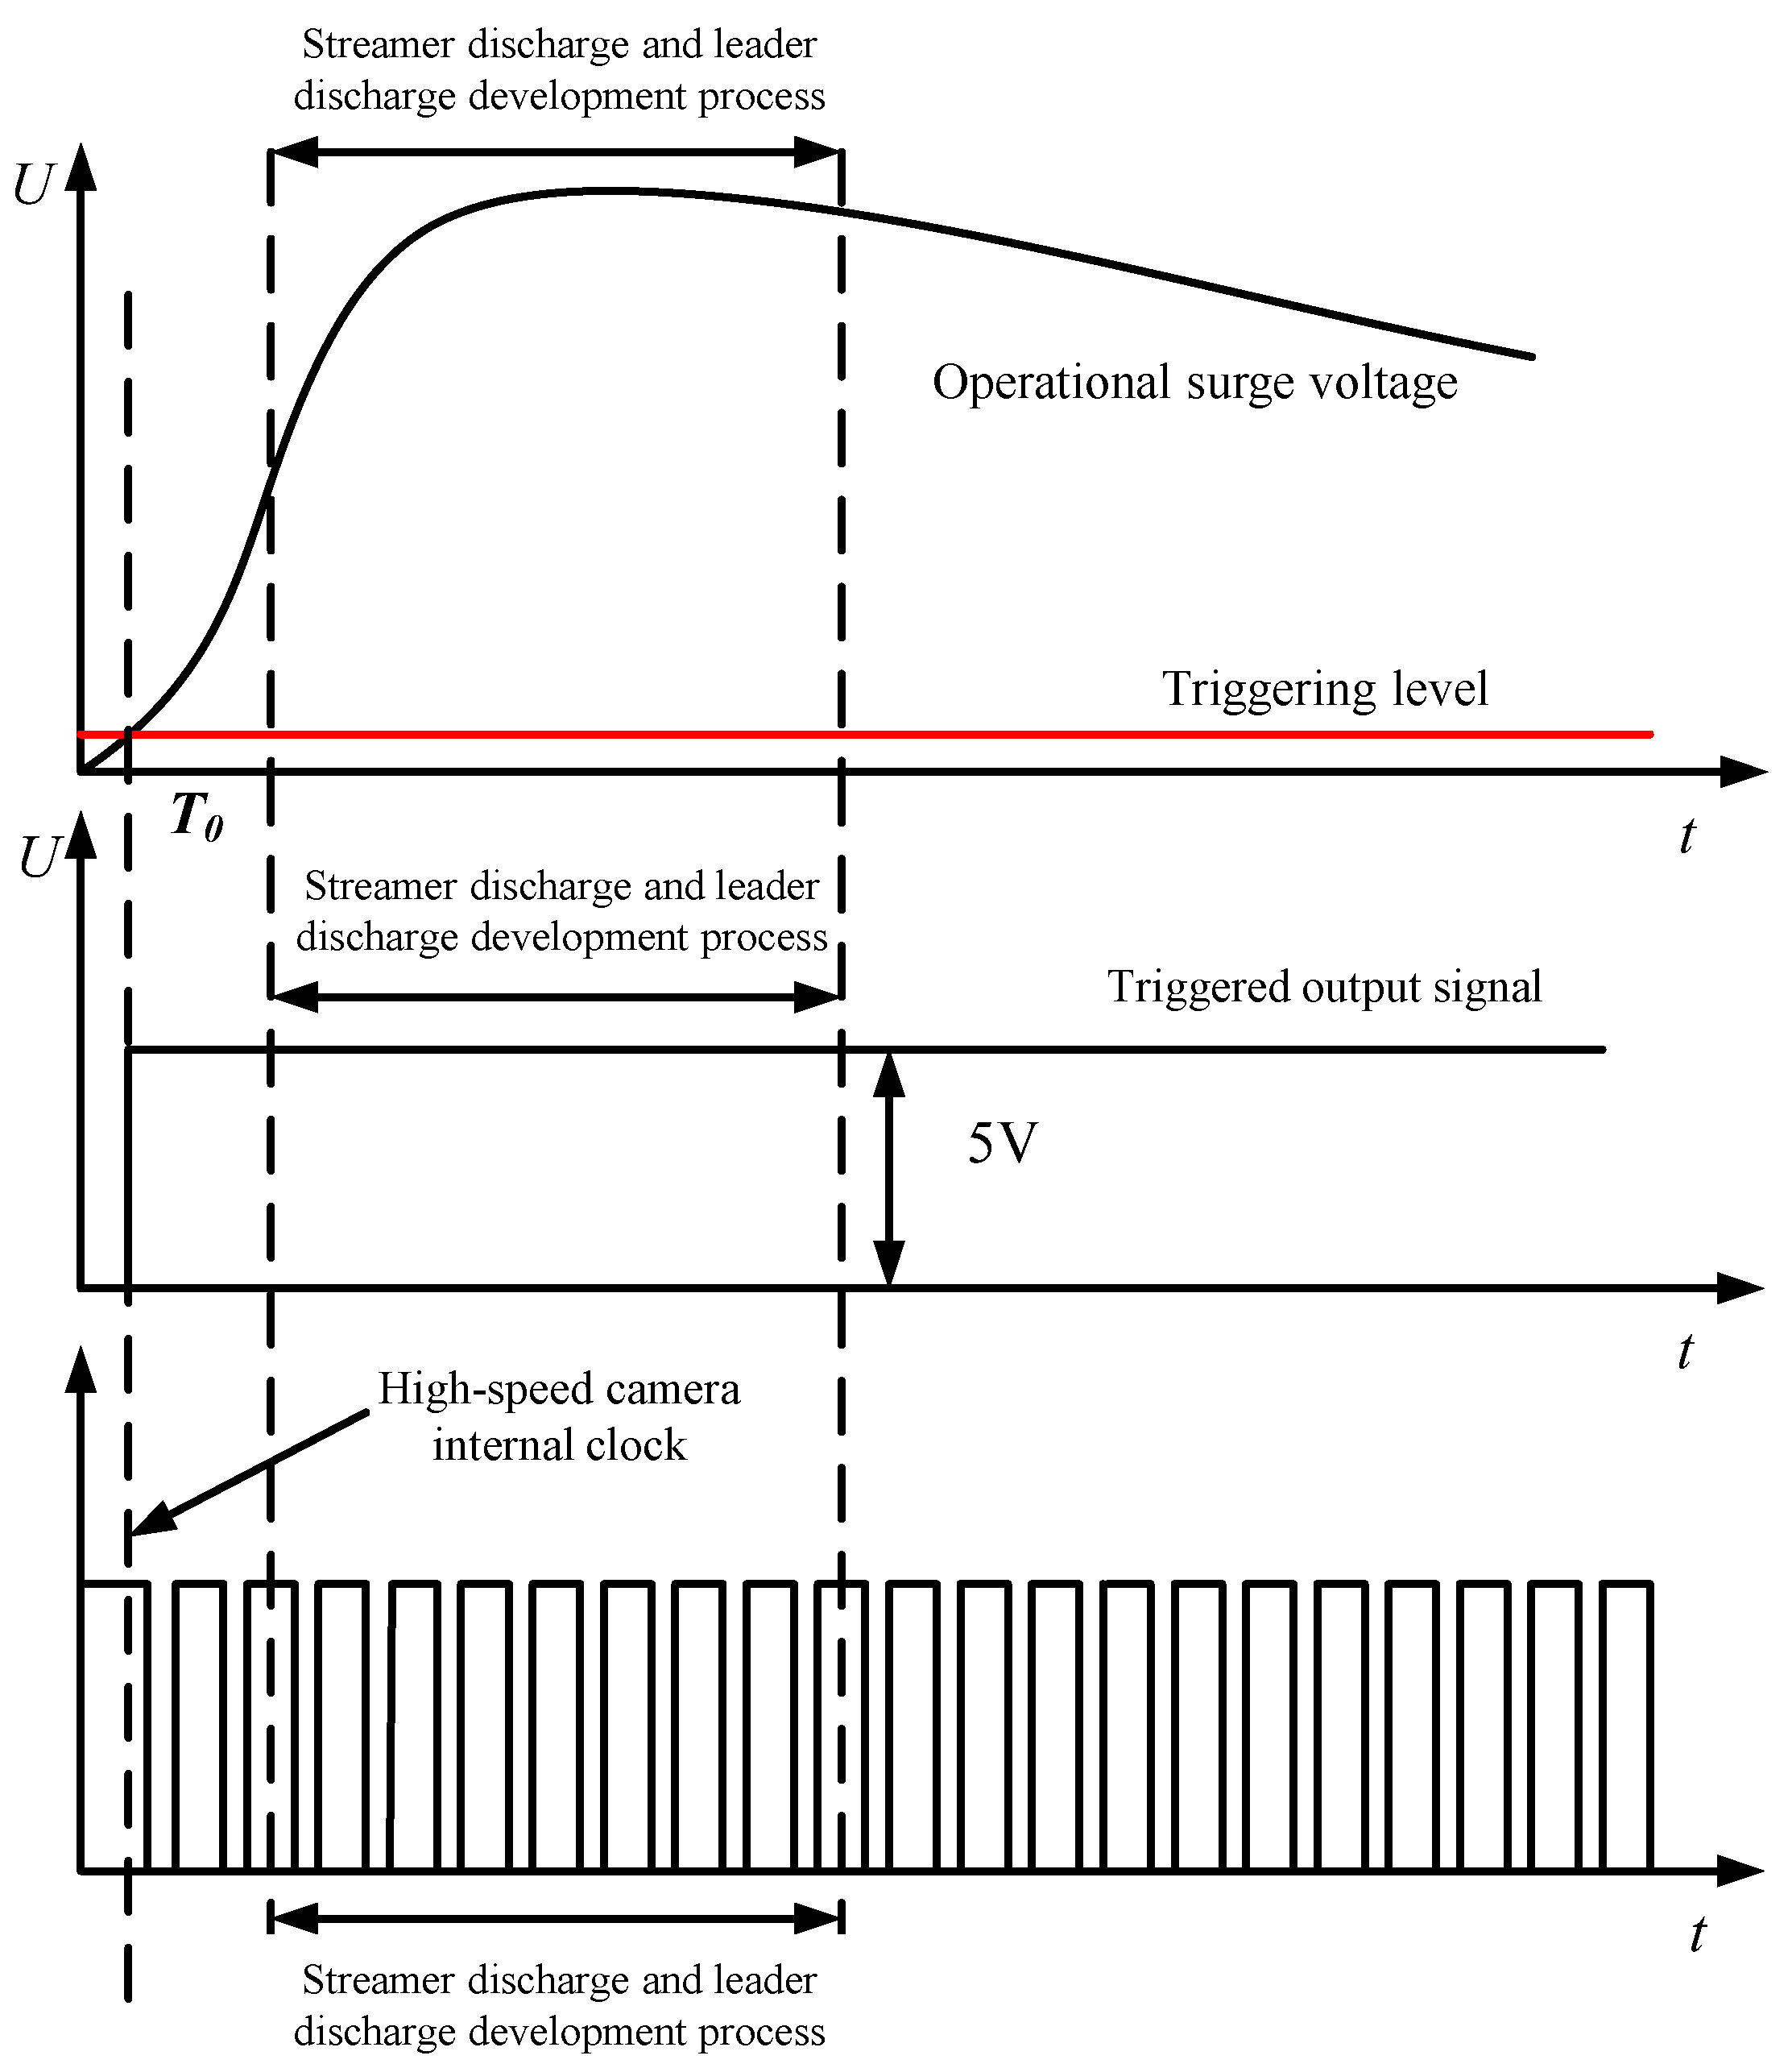
Section 2 describes the experimental equipment used in this study, including voltage generators of three different types, a wildfire simulation chamber, and a high-speed camera synchronized data acquisition system. The breakdown data under wildfire and smoke conditions for various voltage types are presented, followed by a data analysis in
Section 3.
Section 4 describes the effects of flame height and smoke concentration on the air gap breakdown voltage and provides a theoretical analysis. The conclusions and experimental results are presented in
Section 5.
3. Experimental Results
3.1. Discharge Characteristics of Rod–Rod Gaps Under Wildfire Conditions
A rod–rod gap was set up, and the fire was ignited in the furnace. In this setup, the upper rod was 5 m long with a diameter of 38 mm, and the lower rod was 5 m long with a diameter of 38 mm. Direct current, power frequency, and standard operating voltage were applied to the upper rod separately, while the lower rod was grounded.
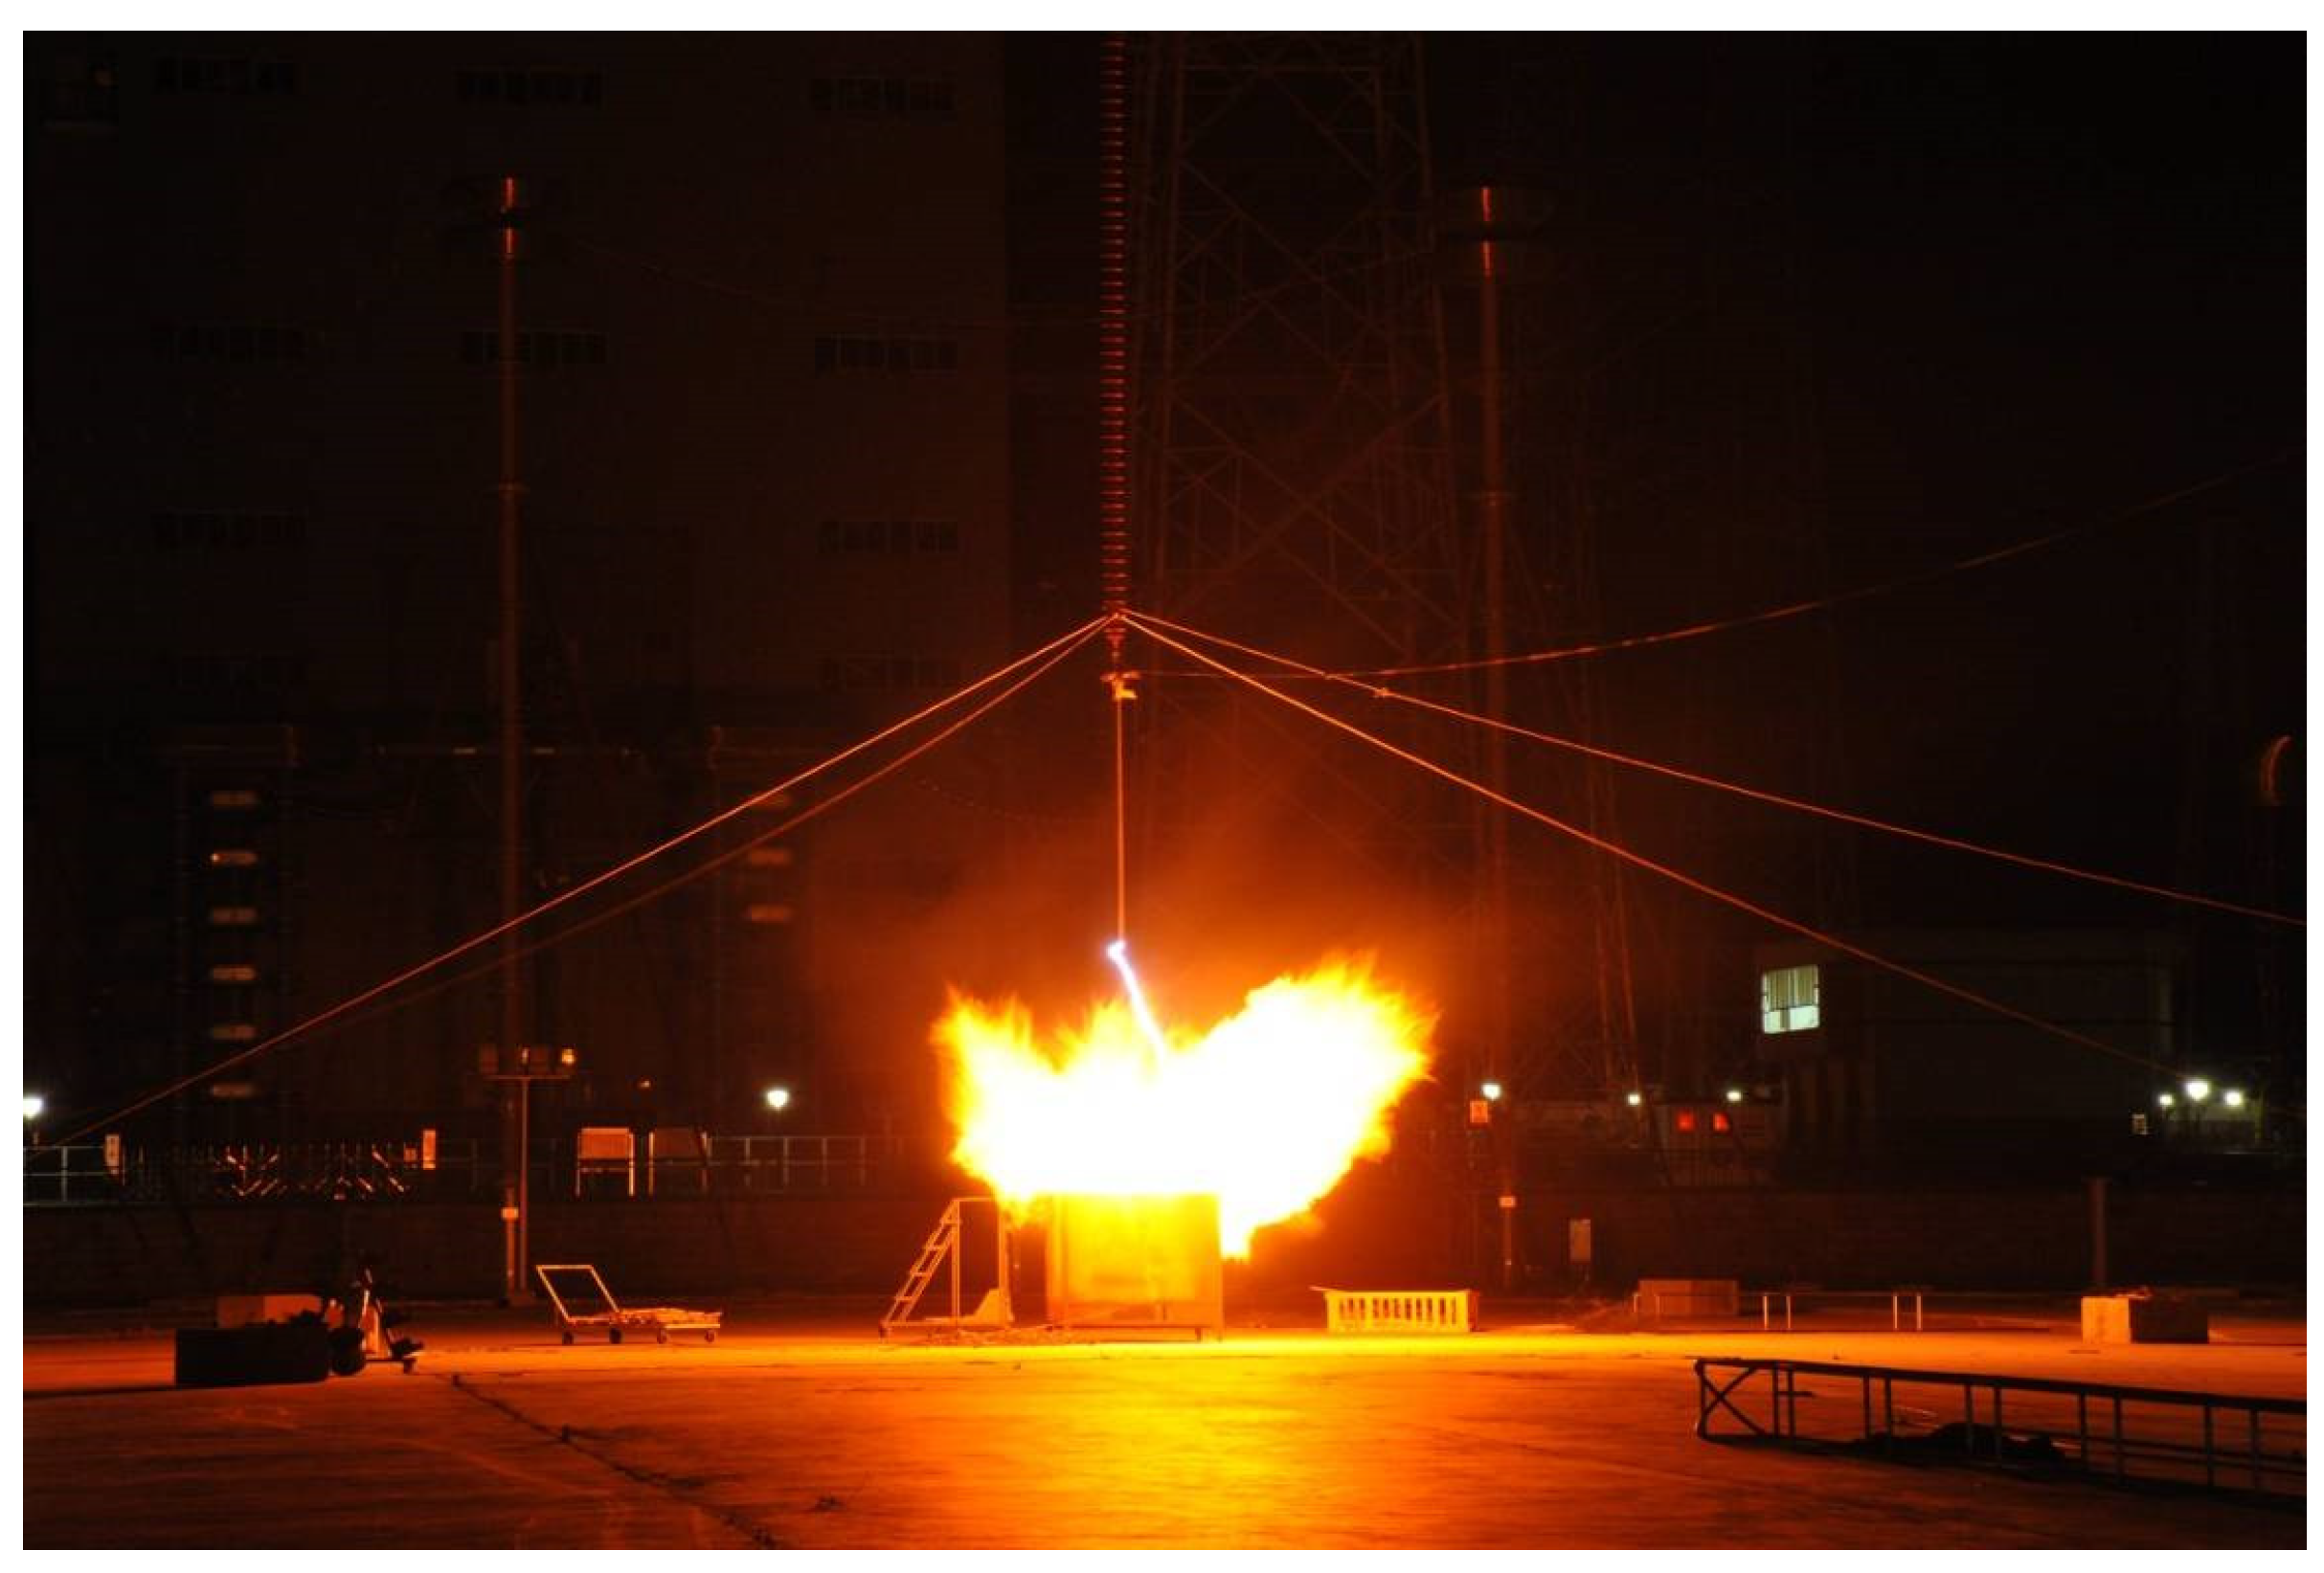
Figure 4 is a photograph of the wildfire test site.
From
Table 1, it can be observed that in the case of flame bridging, the standard operation waveform experienced a significant voltage drop of up to 57.7%, indicating a substantial reduction. When there was an open flame without flame bridging, the voltage drop was around 20%. According to observations, the voltage drop was directly proportional to the flame height. In situations with no visible flame and no smoke, the voltage drop was not significant, not exceeding 5%. As the gap distance increased, the breakdown voltage gradually rose under flame-free conditions, while it decreased to varying degrees in the presence of a flame. When the gap distance became large enough to approximate negligible flame influence, the reduction in breakdown voltage could also be considered negligible. This indicates that flame height has a significant impact on breakdown voltage.
Under both DC and power frequency voltages, the rod–rod gap distance ranged from 1 to 3 m. Specifically, gap distances of 1 m, 1.5 m, 2 m, 2.5 m, and 3 m were selected. Multiple experiments were conducted during a single flame process, and due to the dynamics of flame combustion, the flame height may have varied during each experiment. The defined states of flame height in a concentrated set of experiments are illustrated in
Figure 5.
Table 2 presents the DC and power-frequency breakdown test results for the rod–rod gap under wildfire conditions. In the case of flame bridging, the voltage drop ranged from approximately 73% to 80%. With basic flame bridging, the voltage drop reached around 62% to 70%. When the flame height exceeded half, the voltage drop was around 28%. Under the same gap and flame conditions, the reduction in DC breakdown voltage was greater than that of AC breakdown voltage, which was closely related to the breakdown characteristics of AC voltage in air gaps. AC voltage exhibits a periodic waveform, allowing the insulation strength of the air gap to partially recover near the zero-crossing points of the voltage. This recovery effect can mitigate the ionization caused by flames and the resulting degradation of insulation performance, leading to a relatively smaller reduction in AC breakdown voltage. In contrast, DC voltage maintains a constant polarity, resulting in the continuous accumulation of ions and charged particles within the gap. Flames significantly enhance the ionization process through high temperatures and conductive particles, further deteriorating the insulation performance. Moreover, the absence of zero-crossing points in DC voltage prevents the recovery of insulation strength within the waveform cycle, as occurs with AC voltage. This exacerbates the impact of flames on DC breakdown voltage, leading to a more pronounced decrease.
In the same experiment, as ignition occurred, the flame intensified, reaching its maxi-mum state, and then gradually being extinguished. During this process, the breakdown voltage changed with the variation in flame height states. In a single electrical test, the breakdown voltage changes are as shown in
Table 3. As the flame height state changed, the break-down voltage varied accordingly. The higher the flame height, the greater the voltage drop.
The data in
Table 3 provide insight into the relationship between flame conditions and breakdown voltage under different polarities. For visible flame conditions, the breakdown voltage shows a moderate drop compared to no-flame conditions. This can be attributed to the increased ionization caused by the flame, which lowers the gap’s insulation strength. The voltage drop is slightly higher for positive polarity (6.48%) than for negative polarity (5.04%), which may be due to differences in the ion transport and recombination processes influenced by the polarity of the applied voltage.
Under basic bridging conditions, where the flame reaches and partially bridges the gap, the breakdown voltage experiences a significant reduction. For instance, with negative polarity, the breakdown voltage drops as low as −391 kV and −292 kV, corresponding to voltage drops of 59.73% and 69.92%, respectively. Similarly, with positive polarity, the breakdown voltage decreases to 319 kV and 271 kV, with drops of 64.94% and 70.21%. This dramatic reduction is due to the direct involvement of the flame in the gap, creating a highly conductive path through ionized particles and reducing the insulation capacity significantly.
In the “more than half” flame condition, where the flame partially bridges more than half of the gap, the breakdown voltage drops were intermediate between the visible flame and basic bridging conditions. For positive polarity, the breakdown voltage reduced by 25.05%, while for negative polarity, the reduction reached 34.70%. This indicates that the extent of flame penetration into the gap directly correlates with the degree of insulation degradation.
3.2. Discharge Characteristics of Conductor–Ground Gap Under Wildfire Conditions
The conductor–ground wildfire test is illustrated in
Figure 6, with a conductor–ground distance of 10 m, a wood height of 6 m, and the flame reaching its highest height with bridging.
The power-frequency breakdown voltage data, as flame height varies from low to high and then from high to low, are presented in
Table 4.
Different flame heights resulted in varying breakdown voltage values. The height of the burning flame, in relation to the distance from the conductor, predominantly influenced the breakdown voltage values. From the conductor–ground test, it can be observed that flame height was the most significant factor affecting breakdown voltage. The high flame conductivity directly determined the remaining insulation distance of the gap, with a higher flame height leading to a smaller remaining insulation distance. Under bridging flame conditions, the maximum decrease in breakdown voltage reached 75.3%.
3.3. Effect of Smoke Particles on Air Gap Discharge
Experiments were conducted at five points with rod–rod gap distances of 1 m, 1.5 m, 2 m, 2.5 m, and 3 m. Both positive and negative polarity DC, as well as power frequency voltages, were applied. The voltage drop under different distances and voltage forms was compared, as shown in
Figure 7.
It can be observed that smoke particles have a promoting effect on air gap breakdown, and the effect is significant. Smoke particles at high temperatures release a significant number of charge carriers, such as electrons and ions, which increase the electrical conductivity of the gas, thereby reducing the insulation strength of the air gap. Furthermore, smoke particles become polarized in the presence of an electric field, leading to local distortion of the electric field. This distortion reduces the uniformity of the field, resulting in an enhanced electric field strength in certain regions, which makes breakdown more likely to occur. Moreover, as the smoke concentration increases, the voltage drop becomes more pronounced. With the increase in gap distance, smoke particles diffuse into a larger space, resulting in a decrease in concentration and a smaller impact. The influence range of high-temperature smoke particles on air gap breakdown voltage was roughly a decrease of 20% to over 50%. For a 1 m gap, the maximum decrease in break-down voltage for positive polarity DC was up to 53.93%. As the gap distance increased, the concentration of smoke particles in the gap space decreased, and at 3 m, the minimum decrease in breakdown voltage was 20.24%.
Similarly, smoke experiments were conducted under the conductor–ground gap condition with a gap distance of 3 m and power frequency voltage applied. The experimental data are presented in
Table 5.
Under smoke conditions, the breakdown voltage of the conductor–ground gap showed a significant decrease compared to standard meteorological conditions, indicating the substantial impact of smoke on the insulation performance. The data highlight that when smoke fully bridged the gap, the breakdown voltage decreased by 59.0%, while partial smoke bridging resulted in a slightly lower decrease, with a reduction of 47.4% to 52.8%. This variation is attributable to the degree of gap coverage and the corresponding level of conductive pathways established by the smoke particles. Fully bridged smoke creates a continuous conductive medium between the conductor and ground, drastically reducing the gap’s effective insulation strength. The high ion density and charge carriers in the smoke under full bridging conditions lead to enhanced ionization and increased electrical conductivity, which facilitates breakdown at lower voltages. In contrast, when the smoke does not fully bridge the gap, the insulating air regions provide some resistance to the formation of conductive pathways, resulting in a less pronounced reduction in breakdown voltage. However, the polarization and local electric field distortion caused by smoke particles still significantly degrade the insulation performance, as evidenced by the considerable voltage drop in partially bridged scenarios. The trend underscores the critical influence of smoke density and distribution on the electrical strength of conductor–ground gaps. As the concentration and coverage of smoke increase, the insulating properties of the gap deteriorate progressively, emphasizing the need for targeted mitigation strategies during wildfire events to ensure the safe operation of transmission lines.
4. Discussion
The flame height was the primary factor affecting breakdown voltage. The flame has a high electrical conductivity, and the flame height directly determines the remaining insulation distance of the gap. The higher the flame height, the smaller the remaining insulation distance of the gap. In the rod–rod gap experiments, under flame bridging conditions, the voltage drop was approximately 73% to 80%, under basic flame bridging conditions, the voltage drop was about 62% to 69%, and when the flame height was more than half, the voltage drop was around 28%. From the conductor-to-ground experiments, it can be observed that under flame bridging conditions, the maximum decrease in breakdown voltage reached 75.3%.
Smoke promotes breakdown in air gaps, and under certain gap lengths, higher smoke concentrations lead to a more pronounced decrease in breakdown voltage. From the rod–rod gap breakdown experiments, it can be concluded that the influence of high-temperature smoke on breakdown voltage in air gaps ranges roughly from a decrease of 20% to over 50%. For a 1 m gap with positive polarity DC voltage, the maximum decrease in breakdown voltage can reach 53.93%. As the gap distance increases, the smoke concentration in the gap space decreases, resulting in a minimum decrease in breakdown voltage of 20.24% at 3 m. From the conductor–ground experiments, it is evident that smoke is also a primary factor influencing breakdown voltage, with the maximum decrease in breakdown voltage reaching 59.0%.
Previous studies on air-gap breakdown characteristics under wildfire conditions primarily focused on the influence of environmental factors such as humidity, temperature, and natural wind on insulation performance. For instance, traditional experimental methods often use artificially generated arcs or simplified flame simulations to evaluate breakdown voltages. However, these approaches tend to overlook the complex and dynamic effects of actual wildfire conditions, including varying flame heights and high-temperature smoke.
Compared to these existing methods, this study integrated realistic wildfire simulation conditions, including controlled variations in flame height, smoke concentration, and their combined effects on air gaps. Under flame bridging conditions, our results indicate a maximum breakdown voltage decrease of 70–80%, aligning with earlier findings that flames significantly enhance ionization. However, by explicitly quantifying the effects of varying flame heights and smoke bridging states, this study extends the understanding of how these factors individually and collectively influence air gap insulation performance.
Moreover, this research highlights the unique differences in breakdown voltage behavior under DC and AC voltages. Unlike prior studies that focus predominantly on AC voltages, our findings reveal that DC voltage, due to its continuous polarity and lack of zero-crossing recovery effects, exhibits a more pronounced degradation in insulation strength under wildfire conditions. For example, under DC flame bridging scenarios, the voltage drop reached up to 80%, compared to approximately 73% under power frequency voltage.
Additionally, this work introduces the impact of smoke particle polarization and local electric field distortion, which have rarely been discussed in previous research. The observed breakdown voltage decrease of 20% to over 50% due to smoke concentrations provides a new perspective on the degradation mechanisms under wildfire-induced smoke conditions.
In summary, this article not only validates some of the key observations from earlier research but also addresses gaps in existing methods by incorporating more comprehensive and realistic wildfire conditions. The findings significantly enhance the understanding of air gap breakdown characteristics, providing a foundation for improved risk assessment and mitigation strategies in wildfire-prone areas.
By quantifying the degradation in insulation performance of air gaps under wildfire conditions, this study provides a new safety margin reference for transmission line design. For instance, the significant reduction in breakdown voltage during flame penetration highlights the need to reassess insulator configurations and gap designs in wildfire-prone areas to mitigate the risk of large-scale power outages caused by air gap failures. Based on the findings, the following operational improvements for power grids are proposed: in wildfire-prone regions, alternative transmission routes should be pre-planned to reduce the impact of line failures on the overall grid; and regional power shutoff strategies should be implemented based on wildfire progression and the risk of air gap breakdown to prevent cascading failures. Additionally, the experimental data can be utilized to update risk assessment models for power grids in wildfire-prone areas, enhancing the ability to predict system safety under extreme environmental conditions.
Although this study provides valuable insights, there are several limitations. While the study simulates real wildfire conditions, the experiments are still confined to a laboratory environment, using flames and smoke generated from specific fuel sources. In actual wildfires, a wider variety of vegetation and more complex airflow patterns may be involved, which could further influence the breakdown characteristics. Additionally, flames in wildfires typically exhibit strong dynamic variations, such as rapid fluctuations in height and shape. While this study controlled flame height and smoke concentration, it could not fully replicate the complex dynamic characteristics of a real wildfire, which may lead to differences between the experimental results and actual conditions.


