Article

A New Method to Design Resilient Wide-Area Damping Controllers for Power Systems

by
Murilo E. C. Bento
Department of Electrical Engineering, Federal University of Rio de Janeiro, Rio de Janeiro 21941-909, Brazil
Energies 2025, 18(19), 5323; https://doi.org/10.3390/en18195323 (registering DOI)
Submission received: 30 August 2025 / Revised: 1 October 2025 / Accepted: 3 October 2025 / Published: 9 October 2025
(This article belongs to the Section F1: Electrical Power System)

Abstract

Operating power systems has become challenging due to the complexity of these systems. Stability studies are essential to ensure that a system operates under suitable conditions. Low-frequency oscillation modes (LFOMs) are one of the main branches of system angular stability studies and are often studied in small-signal stability. Many LFOMs in the system may have low and insufficient damping rates, negatively affecting the operation of power systems. Different control strategies have been proposed, such as the Wide-Area Damping Controller (WADC), to adequately and easily dampen these LFOMs. The operating principle of a WADC requires the reception of remote and synchronized signals from system PMUs through communication channels. However, WADCs are subject to communication failures and cyberattacks that compromise their proper operation. This paper proposes a multi-objective optimization model whose variables are the WADC parameters and the objective function guarantees the previously desired and high damping rates for the system under normal conditions and when there are permanent communication failures caused by a Denial-of-Service attack. The design method uses Linear Quadratic Regulator theory, where the parameters of this method are tuned by a bio-inspired algorithm. The studies were performed in the IEEE 68-bus system, considering a set of different operating points. The results achieved in the modal and time domain analysis confirm the successful and robust design of the WADC.

1. Introduction

The evolution of power systems has accompanied the evolution of society. Advances in society have led to an increased dependence on and demand for electrical energy that require advances in power systems, such as new sources of energy generation, the expansion of transmission systems, and increasingly effective and reliable monitoring, control, and protection systems [1]. Thus, the complexity of energy systems has evolved and new tools are needed to allow the desired system operation to be met, with the goals of low total economic cost and complete service to the load center [1].
During the operation of a power system, different contingencies may occur and negatively affect power system performance. Some of these contingencies cause the emergence of low-frequency oscillation modes (LFOMs) with low damping ratios [2]. The persistence of these modes with low damping ratios may even cause a system blackout; therefore, they need to be studied and mitigated [3]. LFOMs are one of the branches of interest, and small-signal stability and damping control techniques are researched and developed to improve these damping ratios to desirable values [3].
Power System Stabilizers (PSSs) are the main traditional damping controllers in power systems and are installed in the vicinity of the Automatic Voltage Regulators (AVRs) of synchronous generators [3]. PSSs are local controllers and are effective in improving the damping rates of oscillation modes classified as local. Usually, the frequency of these modes is between 0.8 and 2 Hz. However, the expansion and complexity of modern power systems have worsened the damping rates of inter-area modes, where PSSs have limited effect due to the lack of system observability [3]. Usually, the frequency of these modes is between 0.1 and 0.8 Hz. This scenario requires researching and developing new damping control strategies.
Over the years, new technologies have been applied to power systems to aid in their operation [4]. Phasor Measurement Units (PMUs) are advanced meters that measure high rates of three-phase voltage and current signals and make these data available in time synchronization in a data concentrator [5]. An optimal allocation of PMUs in the system allows a high degree of observability, which can be useful in several applications. In recent decades, the power system scientific community has proposed different tools for monitoring, control, and protection using PMU data [6,7,8,9,10]. Several reports have been presented on the benefits of PMUs in systems, such as those from Brazil [11], China [12] and India [13].
PMU data have shown promise for application in damping controller designs, especially due to the benefits of achieving greater system observability and high damping rates for inter-area modes. Usually, a damping controller that uses PMU data is called a Wide-Area Damping Controller (WADC) [14,15,16]. There are some design and operation challenges related to a WADC compared to traditional PSSs, such as communication delays in the communication channels and cyberattacks or physical failures that can cause temporary or permanent communication failures.
A number of relevant WADC design methods deal with time delays, and the results presented are promising [17,18,19,20]. The authors of [17] use a Pade approximation of a certain order to represent a transfer function through to the maximum data transmission delay. The authors of [18] proposed an adaptive controller to deal with variable delays, while the authors of [19] propose applying adequately designed compensators. A delay scheduling strategy was developed, tested, and discussed by the authors of [20]. In [21], the researchers propose a delay-handling strategy to deal with different data transmission delay rates. In [22], the researchers present a delay-robust WADC design. In [23], the authors apply theories of a correctly formulated Linear Matrix Inequality to evaluate the stability of a system subjected to time delays.
A recent concern in data-dependent PMU tools is their vulnerability to cyberattacks, which may impair the proper and guaranteed operation of the system and may even cause a widespread blackout. Recently, the Ukrainian power system was attacked by a False Data Injection attack that caused a blackout and significant social and economic losses [24]. Since WADCs depend on data from PMUs, they are also vulnerable to various types of cyberattack [25,26,27].
Some recent works have aimed at designing a WADC that is resilient to cyberattacks or communication failures. In [28], the authors proposed to interrupt the operation of a WADC when a failure is detected, but this approach eliminates the desired and adequate damping benefits of having a WADC in the system. In [29], the authors proposed to use redundant data in the lost communication channel, but this strategy has limitations and difficulties in complex scenarios. In [30], the authors proposed a strategy capable of dealing with permanent communication failures; however, only one channel is considered and failures could occur in multiple communication channels. In [31], the author proposes a WADC design method using coherency analysis to tolerate the communication losses. In [32], the authors proposed a WADC design capable of dealing with Deception Attacks, but this controller has operating limitations. In [33,34,35], the authors proposed a WADC design capable of dealing with False Data Injection Attacks. In [36], the authors propose a WADC resilient to strong cyberattacks through a switching approach. Thus, there is a concern in the scientific community about designing WADC-type damping controllers that are robust to cyberattacks or communication failures.
The use of LQR theory for WADC design has gained prominence in recent years. An iterative method based on LQR is proposed in [37], but good performance is only guaranteed for a single operating condition. Subsequently, the authors of [38] discussed these limitations and the fact that this strategy cannot incorporate resilience into communication failures. The authors of [39] developed the design of a STATCOM that operates with wide-area measurements using LQR but does not deal with uncertainties or communication failures. An approach to incorporate uncertainties into methods using LQR is discussed in [40], but still does not consider communication failures. A two-stage algorithm is developed in [41] to attempt resilience to communication failures, but the method has has difficulty converging in within a small number of iterations in large systems. A promising attempt to incorporate uncertainty into LQR-based techniques is presented in [42], but it is difficult to achieve good damping ratios for LFOMs because the method aims only to reduce the inherent control effort. Furthermore, the approach requires an extremely precise definition of the Q and R matrices that comprise the technique. The authors of [43] developed a modification of the LQR method, and the results demonstrate that uncertainties can be successfully addressed. Unfortunately, the method does not incorporate resilience to cyberattacks or communication failures. Recently, an optimization model using LQR theory was presented in [44], but this technique presents convergence problems and produces a WADC with high gain values that can saturate the output signals and affect control performance. Furthermore, this technique does not benefit from model reduction methods, which are very useful in large systems. This method uses only genetic algorithms for its resolution and does not evaluate other metaheuristics for the convergence and performance tests of the designed WADC. A technique based on Linear Matrix Inequality (LMI) was developed in [45] for the resilient design of a WADC, but this technique also presents design difficulties, as reported by the authors. The method presents many design variables that can hinder the convergence of the method. Furthermore, the designed WADC is of the same order as the plant, thus order-reduction techniques must be applied to reduce the WADC to enable the implementation of the WADC in the system. However, this order reduction of the WADC can cause the loss of the performance benefits achieved in the design, such as high damping ratio values, because the reduced WADC is not equal to the designed WADC.
This paper proposes a multi-objective optimization model whose variables are the WADC parameters and whose multi-objective function is to ensure that the two modes with the lowest damping ratios at each WADC operating point are close to the desired values. Resilience to permanent communication failures due to a well-formulated Denial-of-Service (DoS) attack sequence is incorporated into the linearized models of the closed-loop control system. Furthermore, order-reduction techniques were applied to improve the convergence of the proposed method based on LQR theory. The weight matrices associated with LQR theory are tuned by a bio-inspired algorithm. A comparative analysis was performed with three different bio-inspired algorithms: Particle Swarm Optimization (PSO) [46], Tunicate Swarm Algorithm (TSA) [47], and Whale Optimization Algorithm (WOA) [48]. The IEEE 68-bus system was chosen to conduct evaluation studies of the proposed method through modal analysis and time-domain analysis.
Section 2 describes the power system model equipped with PMUs, the signal transmission delay model, the WADC model, the closed-loop control system, and the strategy to deal with cyberattacks that cause permanent communication failures. Section 3 presents the proposed method with a step-by-step algorithm. Section 4 shows the case studies of application of the proposed method describing and discussing the results. Section 5 presents the conclusion of the article with possible future research.

2. Modeling

The WADC design is entirely based on linearized models dependent on a predefined set of operating points. The successful performance of the proposed method depends on ensuring that the system operating with the WADC meets predefined performance requirements. Therefore, a definition of the system model is required, incorporating the signal transmission delay model presented in Section 2.1, a definition of the WADC presented in Section 2.2, a definition of the closed-loop system in Section 2.3, and a definition of the strategy to incorporate resilience to permanent communication failures in Section 2.4.

2.1. Power System Modeling

The power systems present transformers, loads, PSSs, AVRs, synchronous generators, transmission lines, and other equipment. The entire system can be linearized for each of the operating points within a predefined set of operating conditions. This linearized model is [3]
x ˙ = A x + B u
y = C x
where x is the vector of state variables, y is the vector of output variables (speed signals from selected generators), and u is the vector of input variables (control signals from the WADC that will go to the AVRs of selected generators). The output, input, and state matrices are given by C , B , and A respectively.
Signal transmission delays are very common in a WADC, both for its speed signal input and its control signal output. This research adopted a Padé approximation [17], given in (3), to represent the maximum time delay. The WADC has a buffer at its inputs and outputs that holds the signals for a maximum time limit before they are effectively used. Thus, data can be transmitted with different delay values, and the buffer holds these data until it is effectively used. This strategy allows for delay tolerance. If delays exceed this pre-specified value, the communication channel is considered lost and this may affect the system dynamics.
E ( s ) = 6 2 T s 6 + 4 T s + T 2 s 2
where T assumes a user-defined value to represent the signal transmission delay.
The model (3) can be reformulated into a state-space system of equations if the following matrices are constructed
A d = 0 6 T 2 1 4 T
B d = 6 T 2 2 T
C d = 0 1
The formulations of these matrices, A d , B d , and C d , allow us to construct the following equations in state space for the output (7) and (8) and the input (9) and (10) of the WADC
x ˙ do = A do x do + B do u do
y do = C do x do
x ˙ di = A di x di + B di u di
y di = C di x di
where x do and x di are vectors of state variables, y do and y di are vectors of output variables, and u do and u di are vectors of input variables.
In this research and control design, the operating points are known and thus the equations are known. Furthermore, the time delays T will be fixed by the designers and thus the equations are also known. Therefore, the Equations (11) and (12) can be formulated with the power system and time delay models.
x ¯ ˙ = A ¯ x ¯ + B ¯ u ¯
y ¯ = C ¯ x ¯
where x ¯ represents a vector of state variables and the matrices C ¯ , B ¯ , and A ¯ are given by
C ¯ = 0 0 C do
B ¯ = 0 B di 0
A ¯ = A B C di 0 0 A di 0 B do C 0 A do
Therefore, it is essential to mention that the matrices C ¯ , B ¯ , and A ¯ will be known and fixed in this control design.

2.2. WADC Model

This section describes the WADC model that is to be designed. The WADC operates with multiple input (selected speed signals from some synchronous generators of the system) and multiple output signals (WADC control signals that will go to the AVRs of some selected generators) and can thus be described by the following transfer function matrix
W ( s ) = [ w k , m ( s ) ] = w 1 , 1 ( s ) w 1 , p ( s ) w p , 1 ( s ) w p , p ( s )
where each w k , m ( s ) , m = 1 , , p , k = 1 , , p is given by
w k , m ( s ) = n u m ( s ) d e n ( s ) = b 1 k , m s + b 0 k , m s 2 + a 1 k , m s + a 0 k , m + d k , m
This transfer function matrix W ( s ) can be reformulated as
x ˙ c = A c x c + B c u c
y c = C c x c + D c u c
where W ( s ) = C c ( s I A c ) 1 B c + D c and each matrix is represented as
A c = 0 a 0 1 , 1 0 0 1 a 1 1 , 1 0 0 0 0 0 a 0 k , m 0 0 1 a 1 k , m
B c = b 0 1 , 1 b 0 1 , m b 1 1 , 1 b 1 1 , m b 0 k , 1 b 0 k , m b 1 k , 1 b 1 k , m
C c = 0 1 0 0 0 0 0 1
D c = d 1 , 1 d 1 , m d k , 1 d k , m

2.3. Closed-Loop Control System

In this study, the WADC will operate for each operating point of the system. Therefore, it must be evaluated whether the closed-loop control system for all operating points meets the desired requirements for safe operation and satisfactory performance criteria. The model can be formulated as
x ^ ˙ = A ^ x ^
where x ^ is the vector of state variables and the matrix A ^ is formulated as
A ^ = A ¯ + B ¯ D c C ¯ B ¯ C c B c C ¯ A c
Another way of formulating the system operating with a WADC is to adopt the following system
x ˙ a = A a x a + B a u a
y a = C a x a
where u a is the vector of input variables, y a is the vector of output variables, x a is the vector of state variables, and the matrices A a , B a , and C a are given by
A a = A ¯ B ¯ C c 0 A c
B a = B ¯ 0 0 I
C a = C ¯ 0
If we formulate the following G a matrix as
G a = D c B c
and the following output feedback law
u a = G a C a x a = G a y a
then
x ˙ a = A a x a + B a u a = A a x a B a G a C a x a = ( A a B a G a C a ) x a
Thus, the closed-loop matrix A ^ described (25) can also be obtained as
A ^ = A a B a G a C a = A ¯ + B ¯ D c C ¯ B ¯ C c B c C ¯ A c
This second formulation of the closed-loop control system presents interesting aspects. The WADC presents a matrix of transfer functions (see (16) and (17)). If the poles of these transfer functions are fixed, then the matrices A a , B a , and C a will also be fixed since the system matrices will also be known in advance. Therefore, the only variable to be determined is the matrix G a . This formulation will be used in the LQR-based WADC control design.

2.4. Resilience to Permanent Communication Failures

Permanent communication failures in a WADC channel can occur after a Denial-of-Service cyberattack that congests the channel and interrupts data transmission [49]. The matrices C ¯ and B ¯ are the output (speed signals) and input (WADC control signals) matrices of the power system formulated in (11) and (12). The permanent loss of a single channel related to the generator speed signal can be formulated as zeroing the row of matrix C ¯ associated with the permanently lost channel. Since the matrix C ¯ can have p output signals, there are p possible lost channels. The permanent loss of a single channel related to the WADC control signal that is sent to the generator AVR can be formulated as zeroing the column of matrix B ¯ associated with the permanently lost channel. Since the matrix B ¯ can have p input signals, there are p possible lost channels. These changes in matrices B ¯ and C ¯ cause changes in the closed-loop control system matrix A ^ in (25) that can be formulated by Equations (35) and (36).
A ˘ q = A ¯ + B ¯ q D c C ¯ B ¯ q C c B c C ¯ A c
A ˜ r = A ¯ + B ¯ D c C ¯ r B ¯ C c B c C ¯ r A c
q = 1 , , p and r = 1 , , p .
Thus, the successful design of a WADC that is robust to the loss of a communication channel can be assessed by evaluating the two closed-loop matrices A ˘ and A ˜ .

3. Proposed Method

Determining the parameters of a WADC that is resilient to communication failures is the goal of this work. As presented in Section 2.3, the closed-loop control system formulated as (25) is equivalent to the system encompassing (26) and (27) if we apply an output feedback law given by (32). Furthermore, if the poles of the WADC are fixed, then the matrices A a , B a , and C a are fixed and the problem consists of finding G a . In this research, the WADC design will be carried out by adopting an optimal control theory whose purpose is to minimize a quadratic index defined as a Linear Quadratic Regulator [50]. This quadratic index is formulated as [50]
J ( x a , u a ) = 1 2 0 x a T Q x a + u a T R u a d t
where Q is a positive semi-definite matrix and R is a positive definite matrix. The choices Q and R affect the minimization of the index J ( x a , u a ) .
The determination of the parameters of the WADC damping controller requires the resolution of the algebraic Riccati equation formulated in (41). If we consider the state feedback control law formulated as (38), the solution of this algebraic Riccati equation provides a unique optimal solution [37].
u a = K x a
where the vectors u a and x a have already been presented and K is the state feedback gain that satisfies
K = R 1 B a T P
In this equation the matrix P is positive definite and symmetric, that is,
P = P T 0
and this matrix is obtained by the algebraic Riccati equation
A a T P + P A a P B a R 1 B a T P + Q = 0
The G a matrix that defines the WADC parameters is subsequently calculated as
G a = D c B c = K C a T C a C a T 1
In the WADC design, A a , B a , and C a are fixed and known and the goal consists of finding G a . Thus, the optimal control theory given by the Linear Quadratic Regulator can be applied to determine G a as long as the matrices Q and R are appropriately chosen. Furthermore, the power system’s size affects the dimensions of matrices A , B , and C , and consequently of matrices A a , B a , and C a . The larger the size of these matrices, the greater the number of variables. Another interesting point is the fact that A a , B a , and C a have many zero elements, which induces matrix P to also have zero elements and encounter difficulties in satisfying the algebraic Riccati equation. The solution found in this research was to apply the reduction model in [51], which reduces the dimensions of matrices A , B , and C , and consequently of matrices A a , B a , and C a . In addition, it assigns many non-zero elements to these matrices. Reduced models also reduce the processing time because there are fewer eigenvalue calculations and a smaller number of variables. Section 3.1 discusses the multi-objective optimization model for choosing Q and R and control performance requirements that must be met. Section 3.2 describes the objective function in detail. Finally, Section 3.3 briefly describes the bio-inspired algorithms.

3.1. Optimization Model

The proposed LQR-based algorithm aims to identify the WADC parameters by solving a multi-objective optimization model formulated as (43)
Find Q , R Minimize F o b j ( Q , R ) = ω 1 ( ζ * ζ m i n * ) 2 + ω 2 ( ζ * * ζ m i n * * ) 2 Subject to Q min d i a g ( Q ) Q max R min d i a g ( R ) R max K min g a i n ( A c , B c , C c , D c ) K max
where Q and R are variable matrices in which only the elements of the main diagonal have nonzero values. Furthermore, the diagonal elements of Q must respect the minimum ( Q min ) and maximum ( Q max ) limits, and the diagonal elements of R must respect the minimum ( R min ) and maximum ( R max ) limits. Another constraint imposed on this model is to ensure that the gains of each transfer function ( g a i n ( A c , B c , C c , D c ) ) respect minimum ( K min ) and maximum ( K max ) limits to avoid saturation of the control signals. The multi-objective function ( F o b j ( Q , R ) ) is shown in Section 3.2 and is related to meeting the damping ratio values for the modes with the lowest damping ratios. It is important to emphasize that LQR-based methods aim to minimize control effort and not necessarily to meet or improve the damping ratios of the LFOMs.

3.2. Objective Function

The multi-objective function of this optimization model is given by
F o b j ( Q , R ) = ω 1 ( ζ * ζ m i n * ) 2 + ω 2 ( ζ * * ζ m i n * * ) 2
where ω 1 and ω 2 are user-defined weights and ζ m i n * and ζ m i n * * are predefined damping ratios for the first pair and the second pair of eigenvalues with smaller damping ratios.
Before applying the objective function, it is also necessary to define the set of N o p operating points and the nominal case ( A a , B a C a ) that will be evaluated by the algebraic Riccati equation. The algorithm presented below is an extension of the algorithm presented in [37], with the addition of the formulation of resilience to communication failures.
The multi-objective function is determined by solving the following step-by-step algorithm from inputs Q and R , which are the variables.
Step 1: The matrices Q 0 and R are initialized.
Step 2: Set k = 0 and L 0 = 0 . Find P k = P k T 0 from the following algebraic Riccati equation
A a T P + P A a P B a R 1 B a T P + Q 0 + L T R L = 0
Step 3: Calculate L k + 1 from
L k + 1 = R 1 B a T P k I C a T ( C a C a T ) 1 C a
Step 4: Calculate Q k + 1 as
Q k + 1 = Q 0 + L k + 1 T R L k + 1
Step 5: Solve the following algebraic Riccati equation
A a T P + P A a P B a R 1 B a T P + Q k + 1 = 0
Step 6: If | | L k + 1 L k | | < ϵ for ϵ sufficiently small, then go to Step 7; however, if | | L k + 1 L k | | ϵ , then go to Step 3 and k = k + 1 .
Step 7: Calculate K as
K = R 1 B a T P k L k + 1
Step 8: Calculate B c , D c and G a as
D c B c = G a = K C a T C a C a T 1
Step 9: Calculate the three closed-loop sets A ^ n , A ˘ n q , A ˜ n r for each of the N o p operating points.
A ^ n = A ¯ n + B ¯ n D c C ¯ n B ¯ n C c B c C ¯ n A c
A ˘ n q = A ¯ n + B ¯ n q D c C ¯ n B ¯ n q C c B c C ¯ n A c
A ˜ n r = A ¯ n + B ¯ n D c C ¯ n r B ¯ n C c B c C ¯ n r A c
for n = 1 , , N o p , q = 1 , , p , and r = 1 , , p .
Step 10: Calculate all damping ratios after determining all eigenvalues of A ^ n , A ˘ n q , A ˜ n r for all N o p operating points.
Step 11: Calculate the lowest damping ratio ζ k * and the second-lowest damping ratio ζ k * * for each one of the N o p operating points and provide the smallest values ζ * and ζ * * .
Step 12: Return the following objective function value
F o b j ( Q , R ) = ω 1 ( ζ * ζ m i n * ) 2 + ω 2 ( ζ * * ζ m i n * * ) 2
This step-by-step algorithm must be recalculated for each different value of Q and R taken as variables of the optimization model.

3.3. Bio-Inspired Algorithms

Different techniques based on bio-inspired algorithms (BIAs) can be applied to solve the optimization model in (43). In this research, three BIAs were applied and compared to evaluate the solving capacity of the optimization model. The three algorithms chosen were Particle Swarm Optimization (PSO) [46], Tunicate Swarm Algorithm (TSA) [47], and Whale Optimization Algorithm (WOA) [48]. Bio-inspired algorithms such as PSO, TSA, and WOA have been successfully applied to various optimization problems, such as in [52,53,54,55,56], and the results are promising, especially when the studies are performed offline. Bio-inspired algorithms present some difficulties when applied in real time. In this research, the WADCs will be designed offline and will not be designed in real time. The benefits of applying offline techniques include increased design time; thus, the convergence of the method can provide a WADC with better performance requirements. Furthermore, large systems may require large-scale linearized models. As a consequence, the method may require a longer processing time for adequate convergence, making its application in real time unfeasible.

4. Cases Studies

The proposed LQR-based method will be applied, analyzed, and discussed in the IEEE 68-bus system. In [57], the authors present the nominal operation case (NOC); the two LFOMs with the lowest damping ratios in this nominal case are represented by M1 ad M2 in Table 1. Furthermore, Table 1 also presents a second operating case (OC2) relating to a 2% increase in the entire system load. Both operating cases present LFOMs with damping ratios well below 5% and, in addition, all four modes—M1, M2, M3, and M4—are inter-area modes. A suitable WADC design could decrease the control effort and increase the damping ratios of all oscillation modes in these operating cases.
Before applying the proposed method, we must choose the signals of the WADC. This system has 16 generators, but AVRs are only installed on generators 1 to 12 and can receive the control signals from the WADC. Applying the geometric controllability measures [3] on the four oscillation modes of Table 1, generators 12, 9, 11, 5, and 10 have high controllability rate values and will therefore be responsible for receiving output signals from the WADC. Applying the geometric observability measures [3] onto the four oscillation modes of Table 1, generators 12 to 16 will be responsible for sending the signals as inputs to the WADC. Thus, the WADC to be designed has 25 transfer functions that must be determined relative to the five input and output signals. It should be emphasized that the appropriate selection of WADC input and output signals is important because it affects the convergence of the method and the performance objectives of the closed-loop system. Large systems may have multiple LFOMs with low damping ratios, in addition to many synchronous generators equipped with AVRs. Therefore, the selection of signals and the number of signals is an essential task in the successful design of a WADC.
Now, the parameters of the proposed algorithm based on LQR theory must be defined. In this research, ω 1 = 0.6 , ω 2 = 0.4 , ζ m i n * = 0.06 , ζ m i n * * = 0.08 , ϵ = 10 5 , Q min = 0.01 , Q max = 10,000, R min = 0.01 , R max = 5 , K min = 30 , and K max = 30 . Two operating points were considered in the analysis: NOC and OC2. The case was considered as a nominal case and the poles of all WADC transfer functions were equal to 25 and 25 . Thus, the matrices A a , B a , and C a were fixed. Bio-inspired algorithms have parameters that must also be defined. The three bio-inspired algorithms will have a population of 20 individuals, and the stopping criterion is a maximum of 1000 iterations. According to [46], the PSO algorithm will have the following parameters: ω = 0.7 , c 1 = 1.1 , and c 2 = 1.2 and r 1 and r 2 are random values in [0, 1]. According to [47], the TSA algorithm will have the following parameters: P m i n = 1 , P m a x = 4 , and c 1 , and c 2 and c 3 are random values in [0, 1]. According to [48], the WOA algorithm will have the following parameters: a [ 2 , , 0 ] , and l [ 1 , 1 ] , r is a vector with appropriate dimensions and values in [0, 1].
A comparative analysis was conducted with a method [44] already published in the literature. This method presents differences in relation to the method proposed in this research. The method in [44] does not consider gain limits for the WADC transfer functions, which can cause saturation of the WADC output control signals. Furthermore, this method [44] aims to maximize the damping ratio of the smallest eigenvalue, which can lead to a reduction in the damping ratios of the other modes of the system, and these modes can compromise the angular response. The method in [44] does not use order-reduction techniques; thus, it works with a larger number of variables and requires more processing time.
BIAs may present different convergence results for each simulation of the same algorithm. Thus, 100 different simulations for each BIA were performed. Table 2 presents the standard deviation, maximum, average, and minimum results of the objective function.
For modal analysis studies and dynamic simulations, a WADC resulting from each of the bio-inspired algorithms was chosen. Table 3, Table 4 and Table 5 present the numerator parameters of each of these WADCs. It should be noted that the poles were fixed in the simulation and equal to 25 and 25 . Therefore, the denominator of each transfer function is d e n ( s ) = s 2 + 50 s + 625 . Table 6 presents WADC parameters after applying the method in [44]. Table 7 presents the WADC parameters after applying the method in [45].
Each WADC can provide different eigenvalues for the whole system and consequently different damping ratios. Thus, a modal analysis was conducted. Table 8, Table 9 and Table 10 provide the LFOMs for each operation case, with or without the loss of communication signals, and for each WADC. Table 11 also provides these LFOMs for WADC designed using the method in [44]. Table 12 provides these LFOMs for WADC designed using the method in [45].
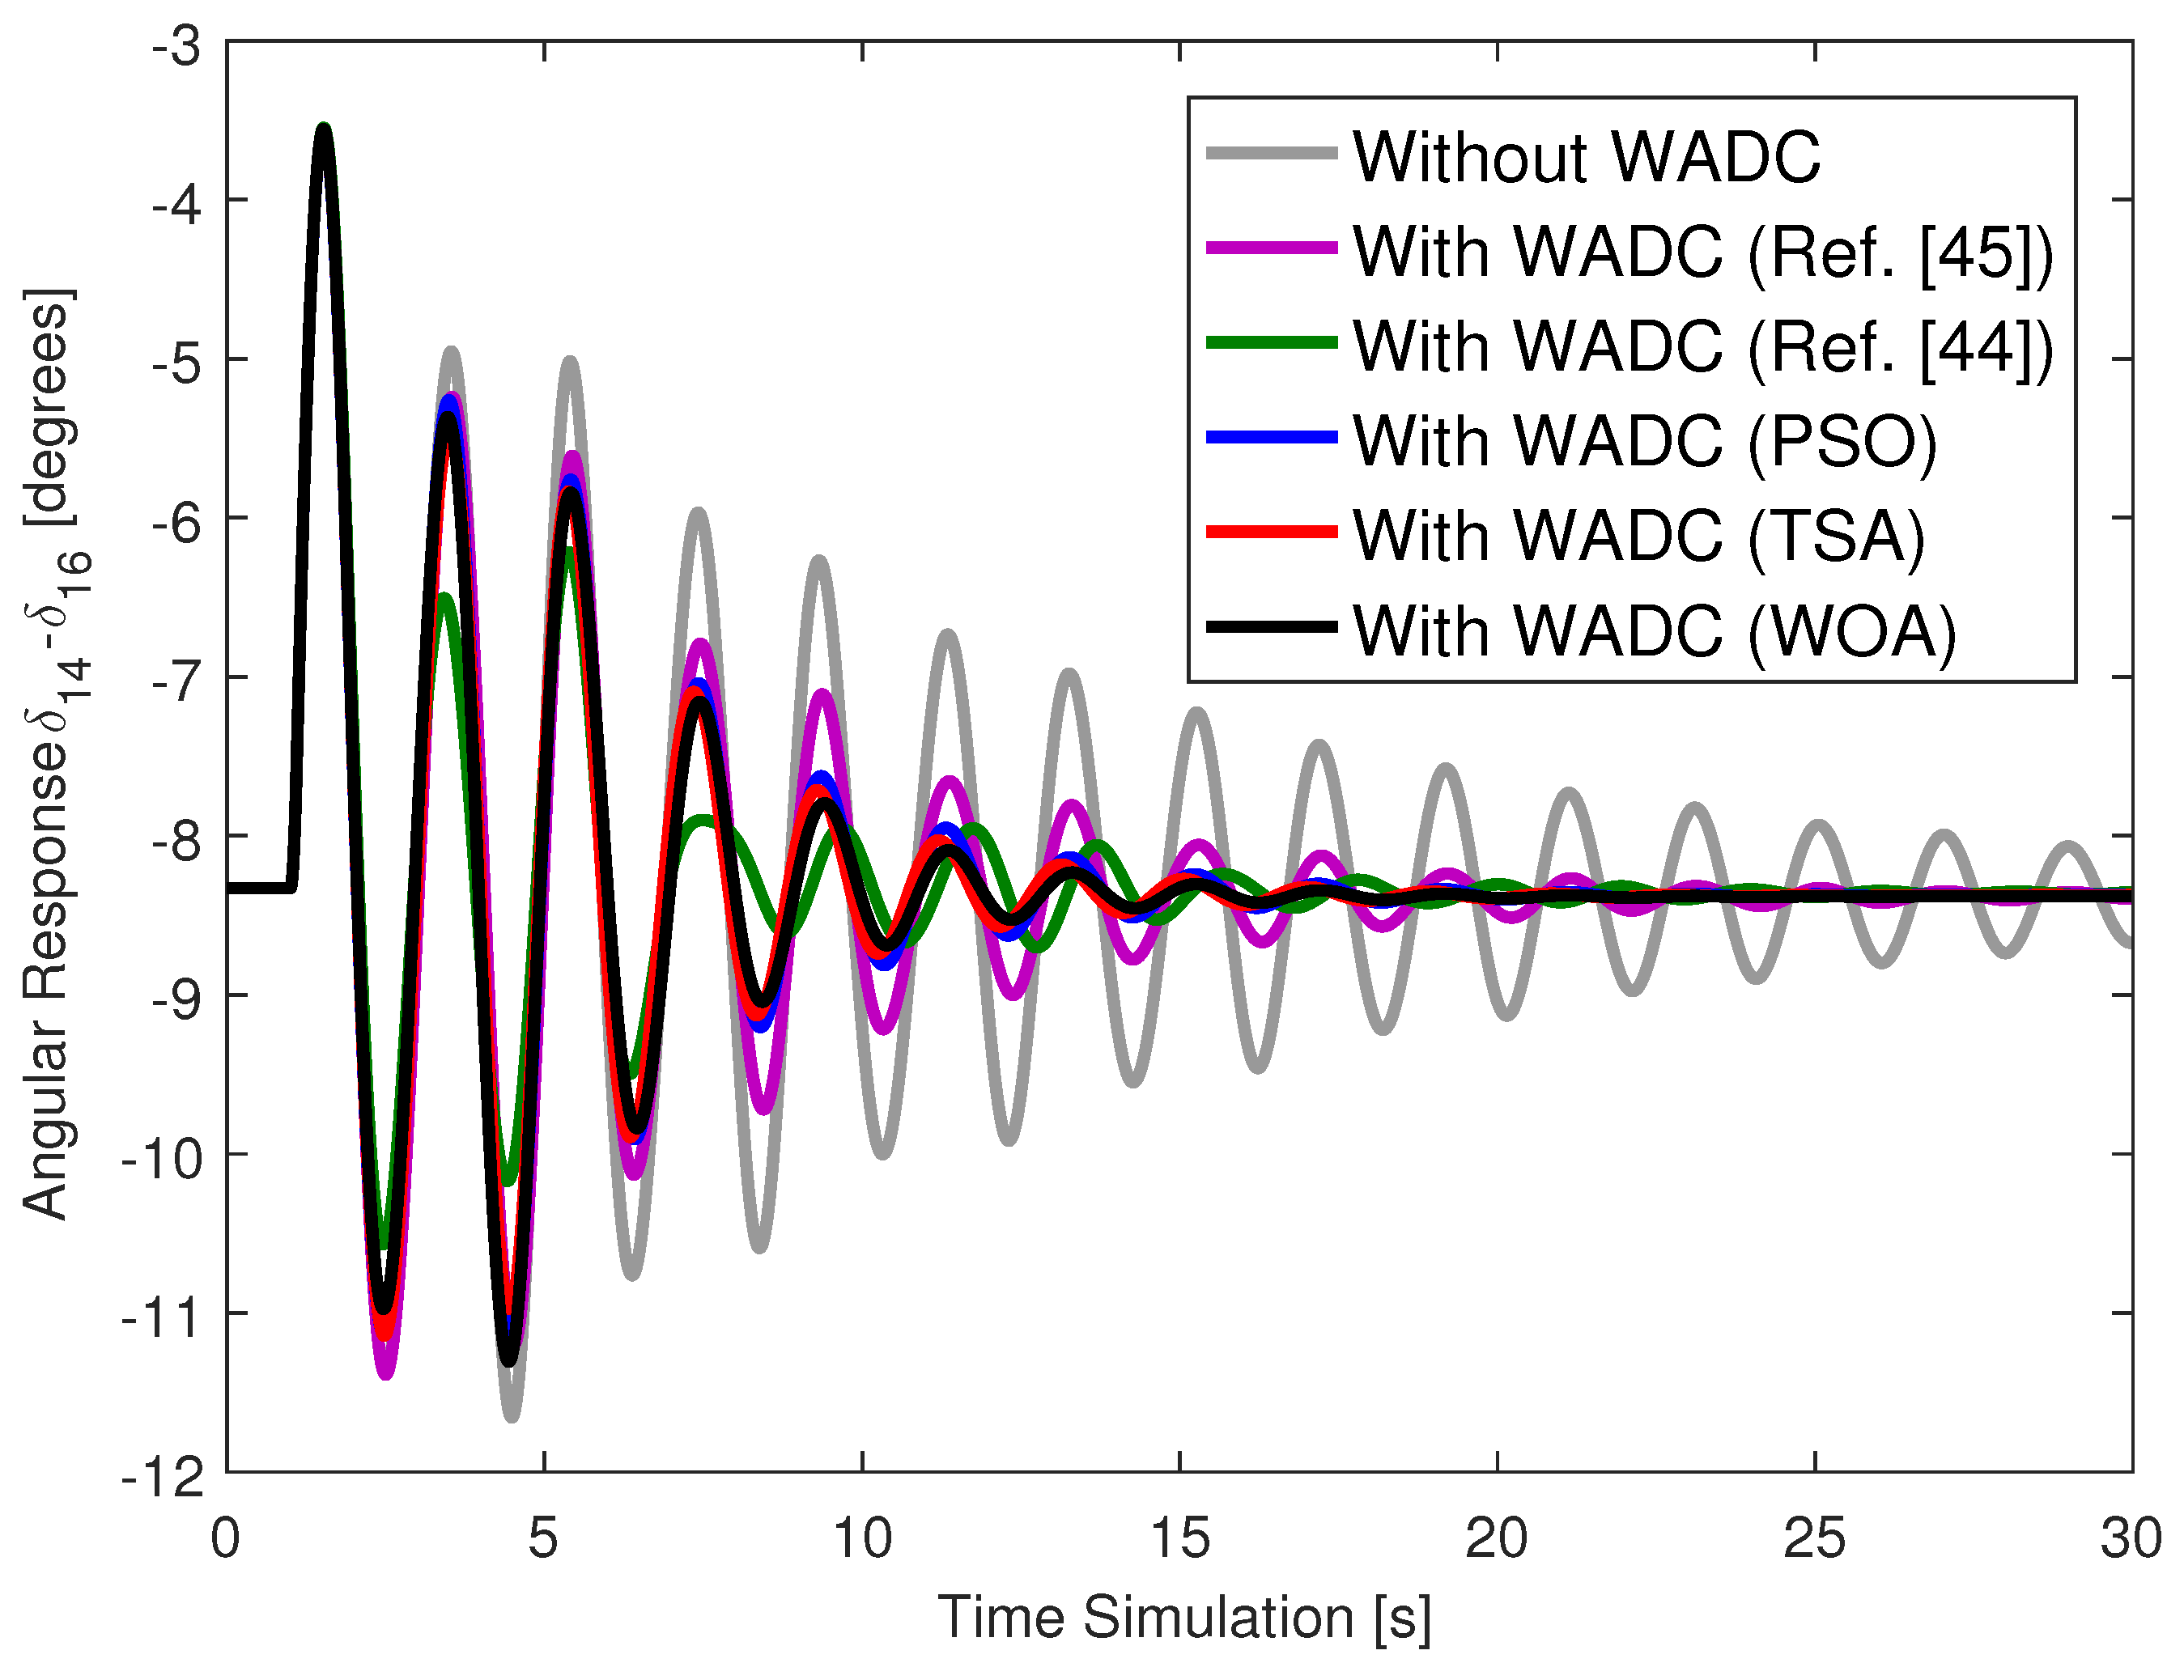
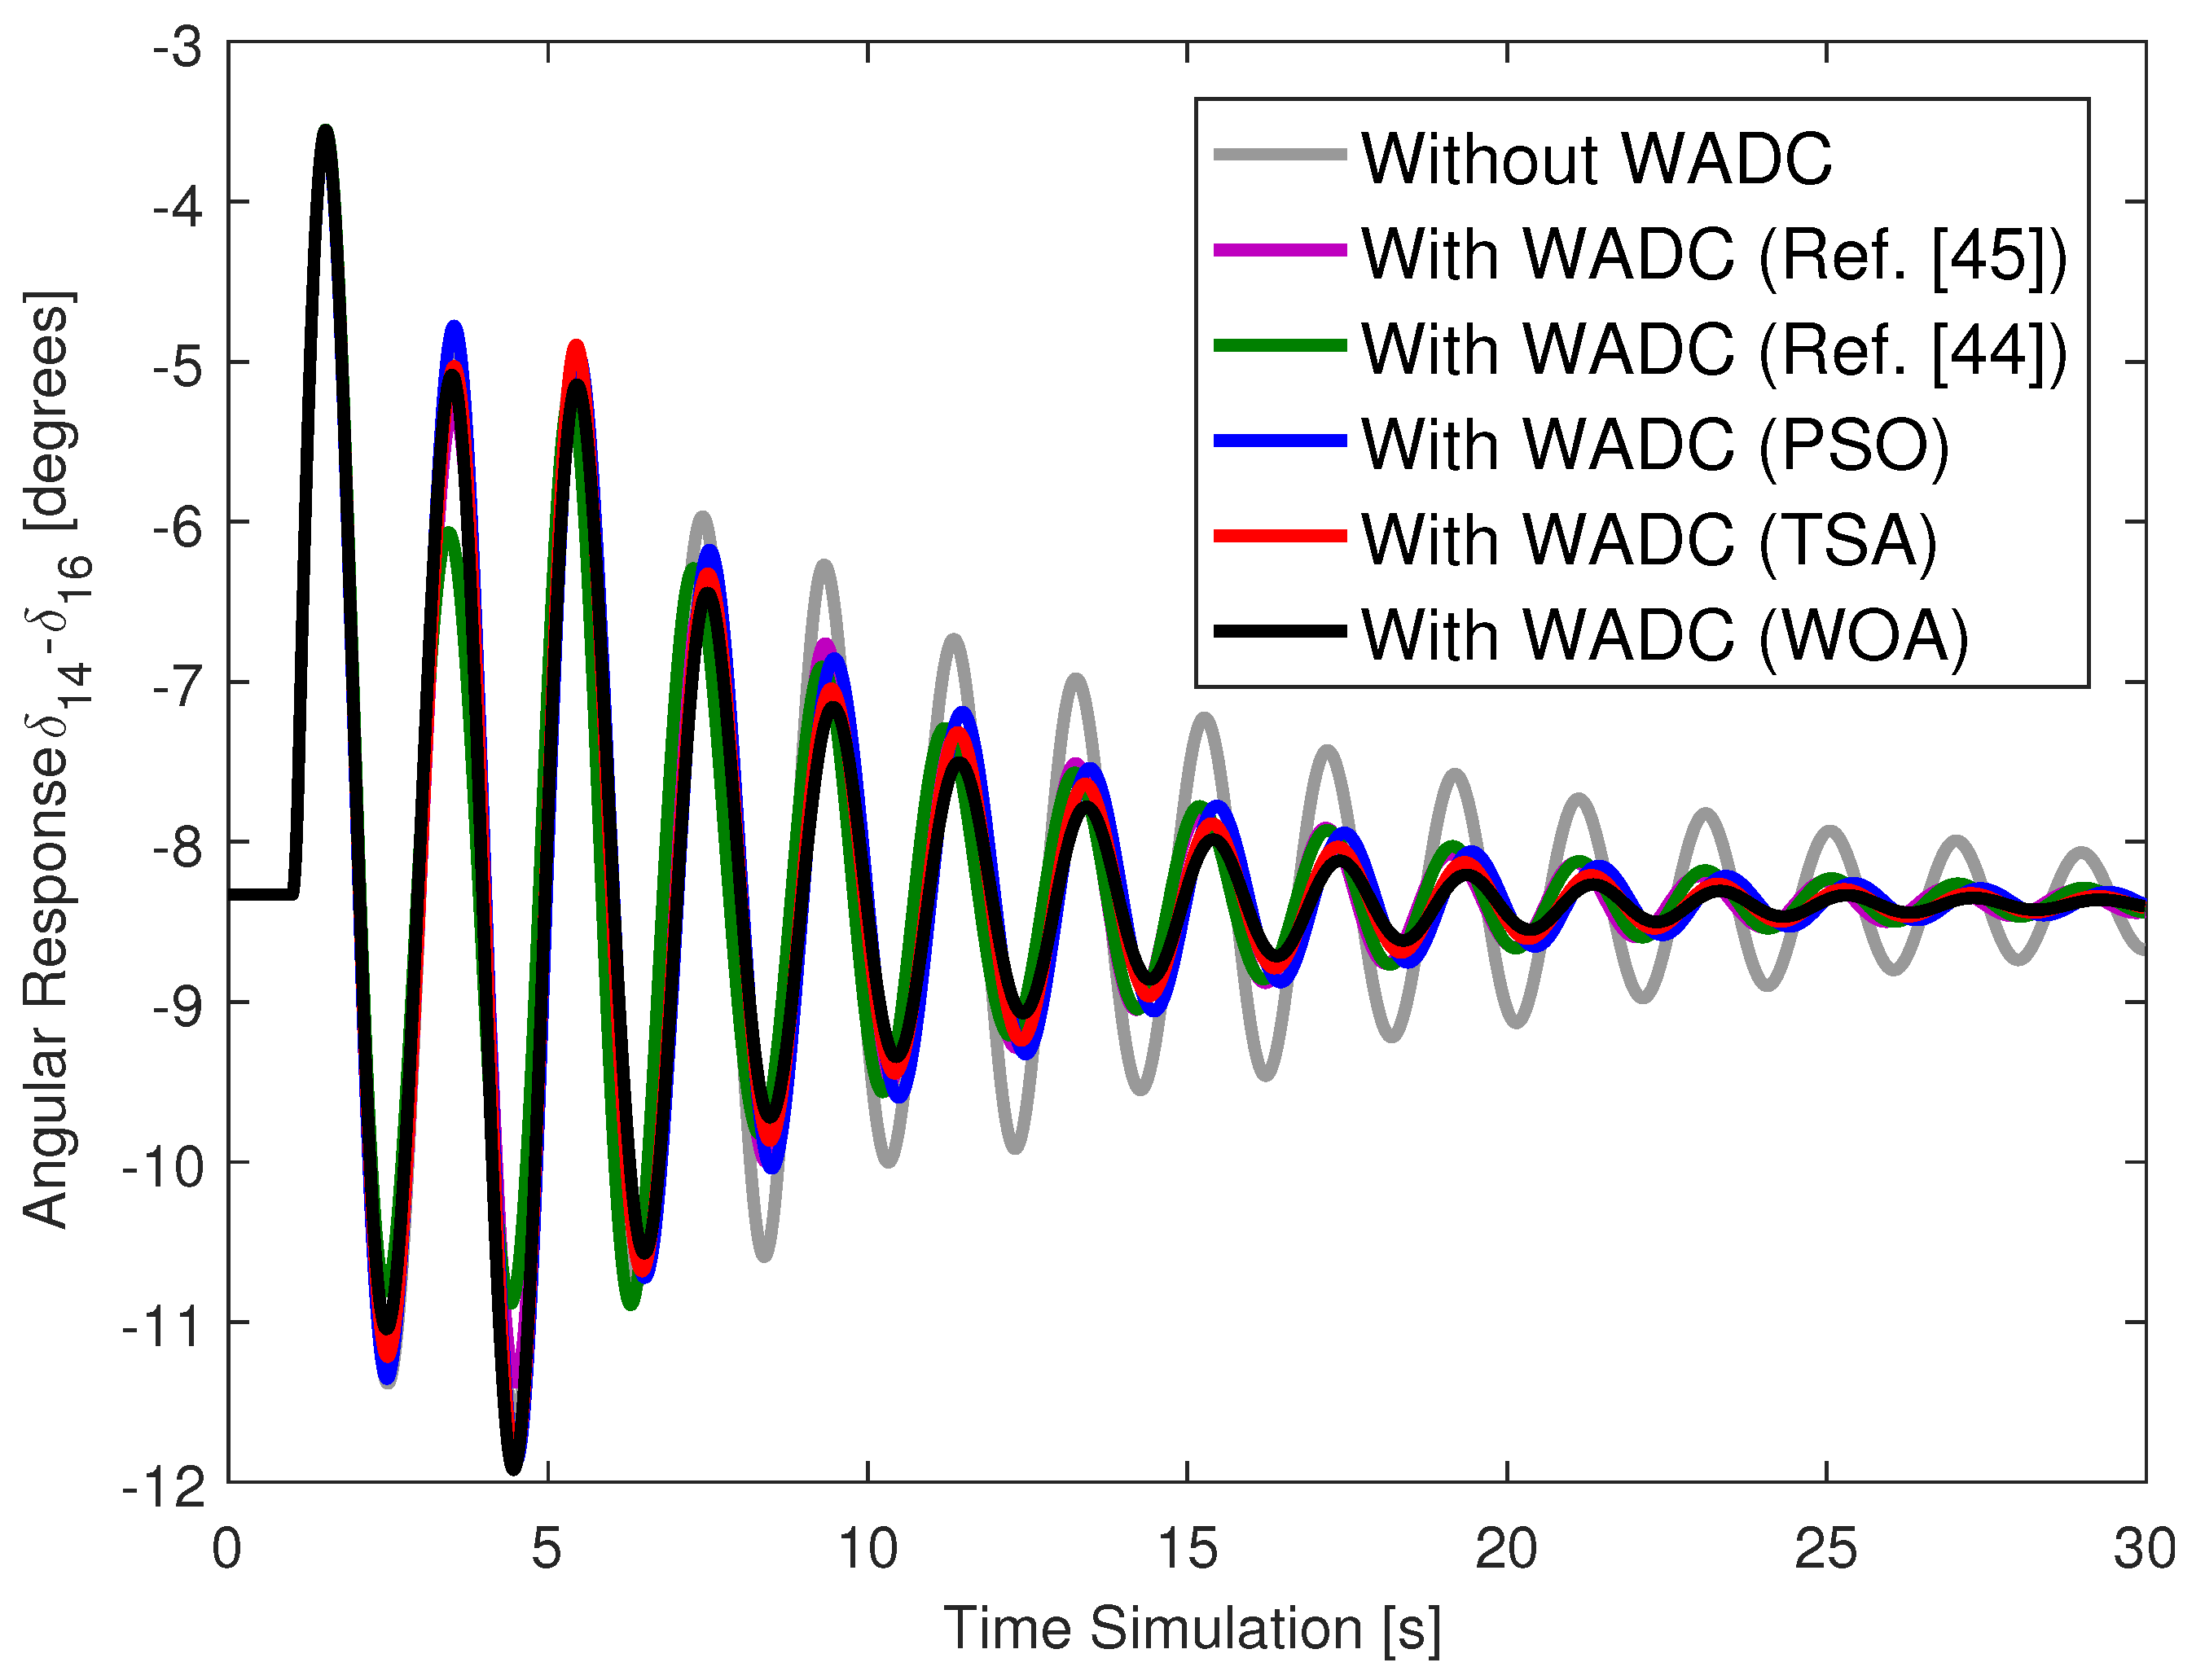
The WADC design was performed using linearized models. Thus, dynamic analyses must be conducted. These dynamic analyses were conducted in ANATEM software [58] with the application of a contingency. The AVRs, PSSs, and WADC present output signal limiters. A short circuit was applied to the IEEE 68-bus system at bus 40 with a duration of 100 ms. The angular response of generator 14 is described in Figure 1 for the system with different WADCs and without the WADC. The failure of the WADC was also evaluated in these simulations. The same short circuit was applied and, in addition, the communication channel related to the speed signal of generator 16 was permanently lost. The angular response of generator 14 is described in Figure 2 for the system with different WADCs and without the WADC. A second failure case was evaluated: the failure of the channel responsible for sending the control signal to generator 5. The angular responses are described in Figure 3 for the system with different WADCs and without the WADC.
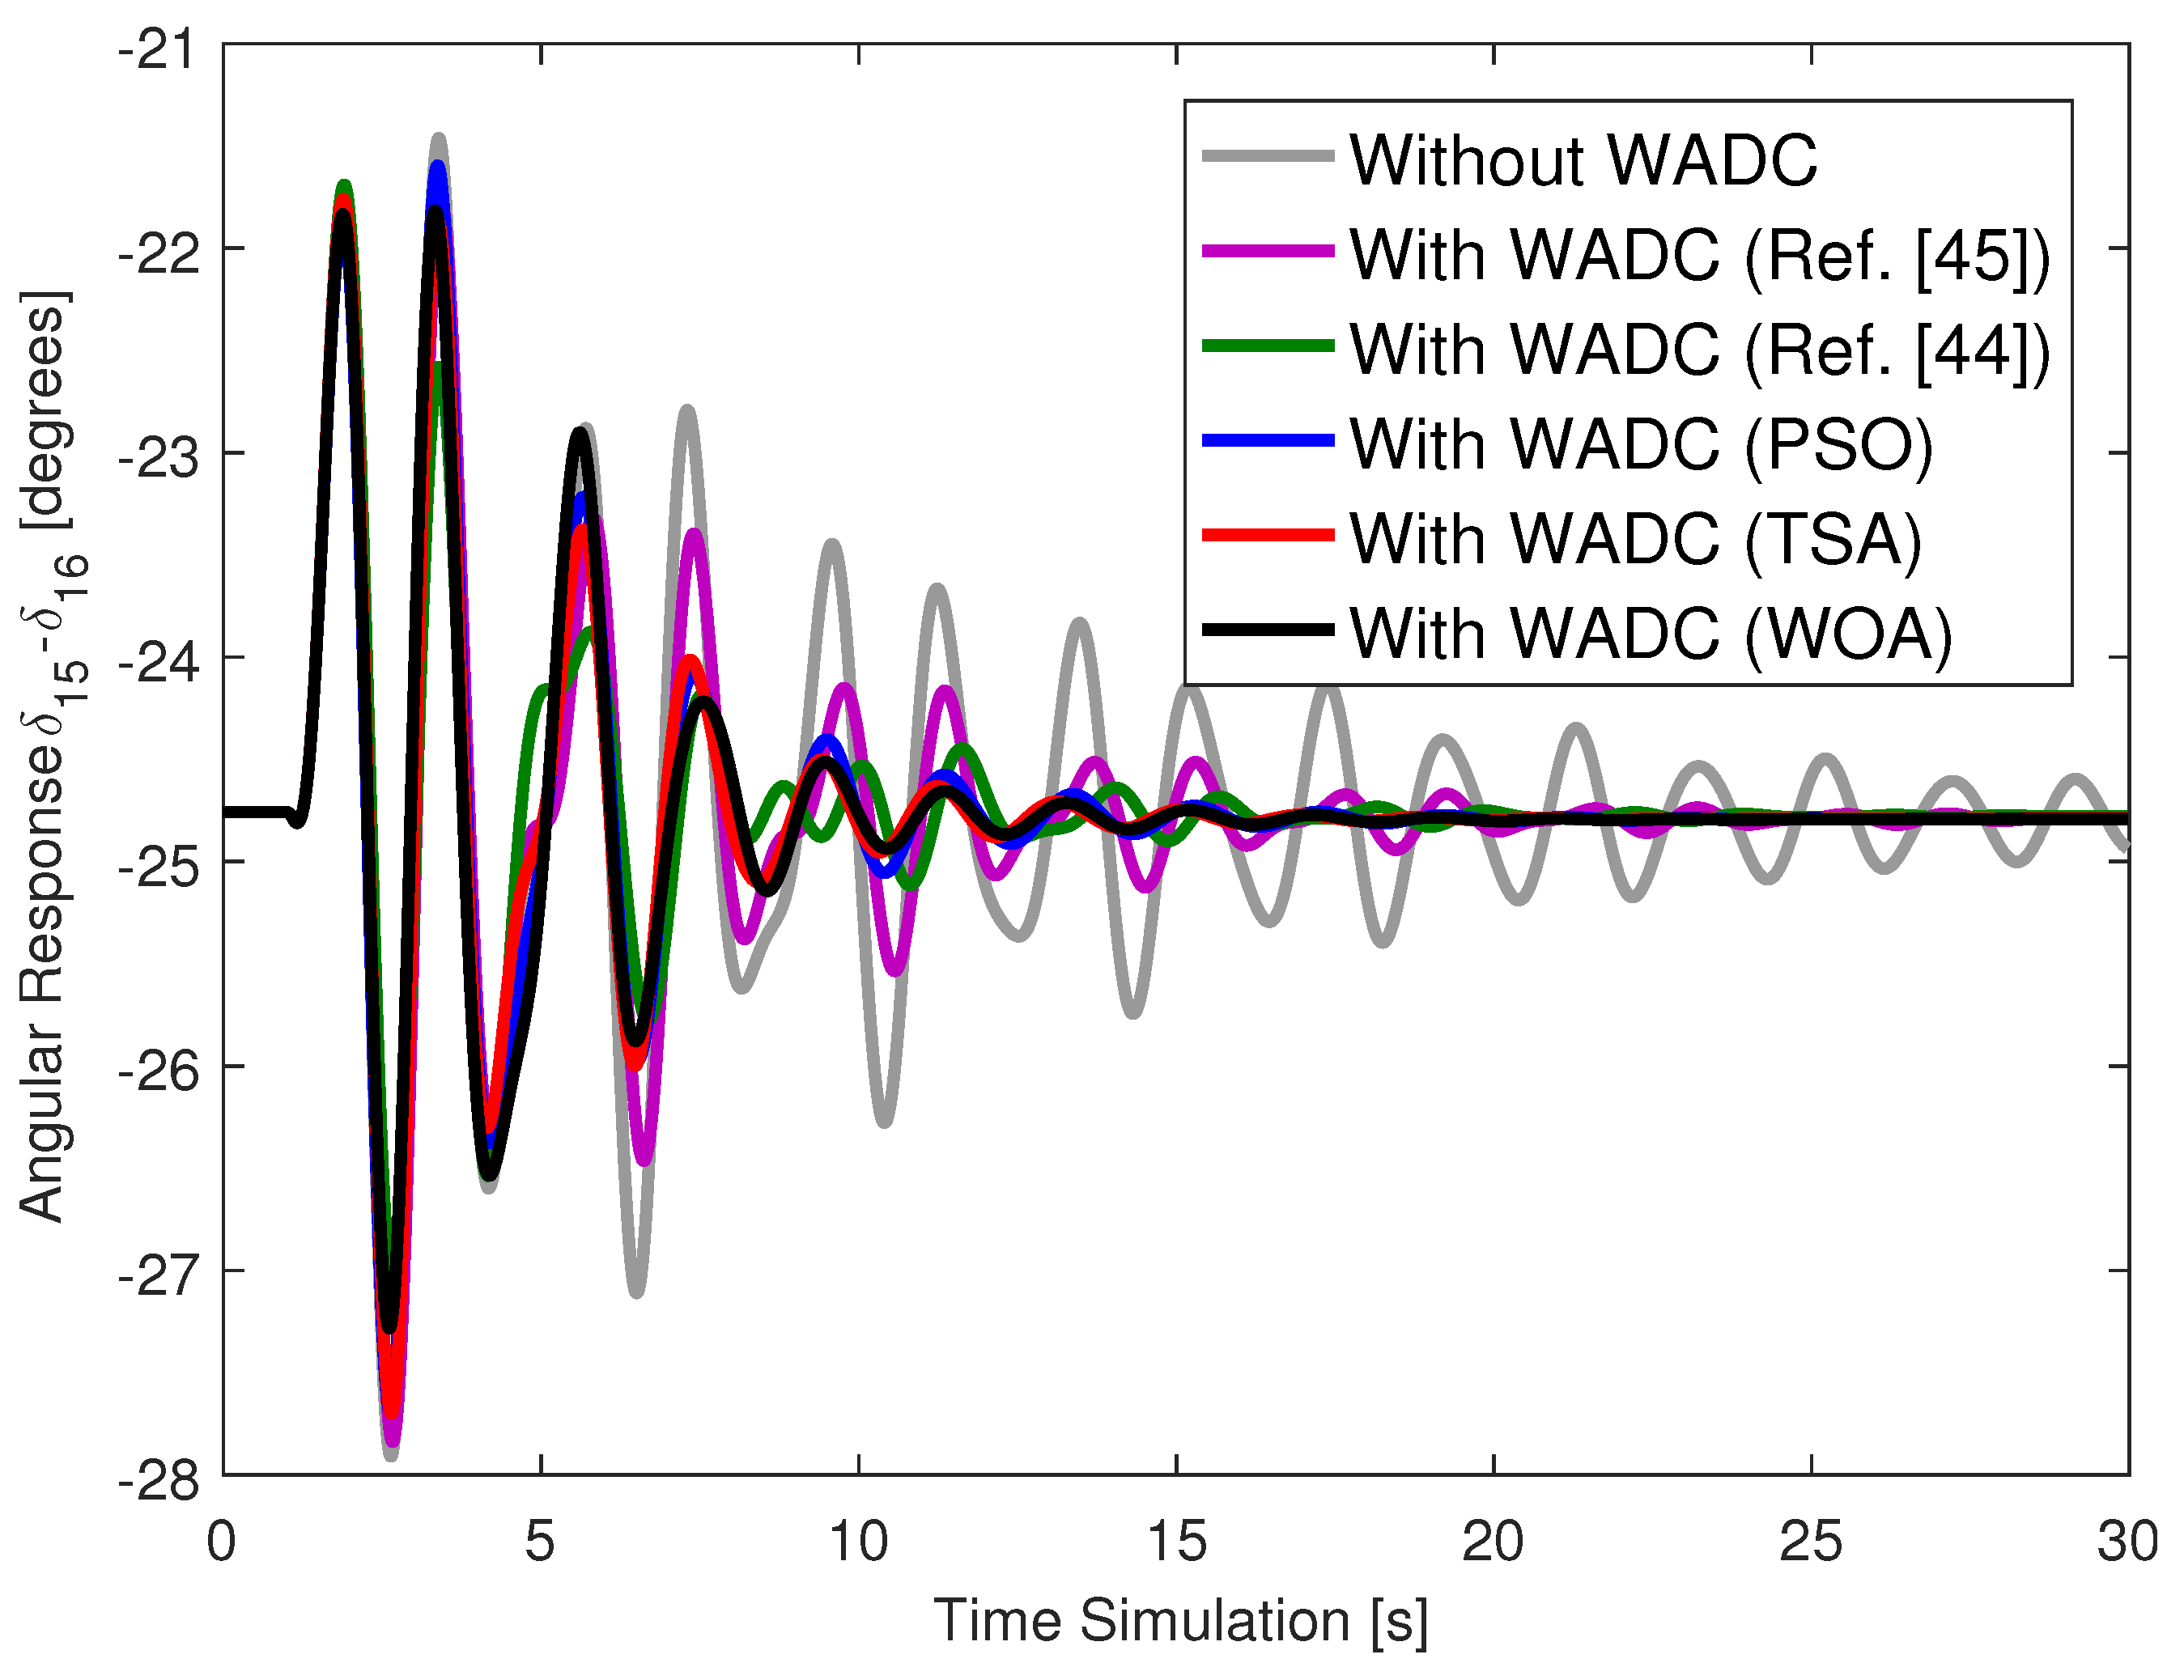
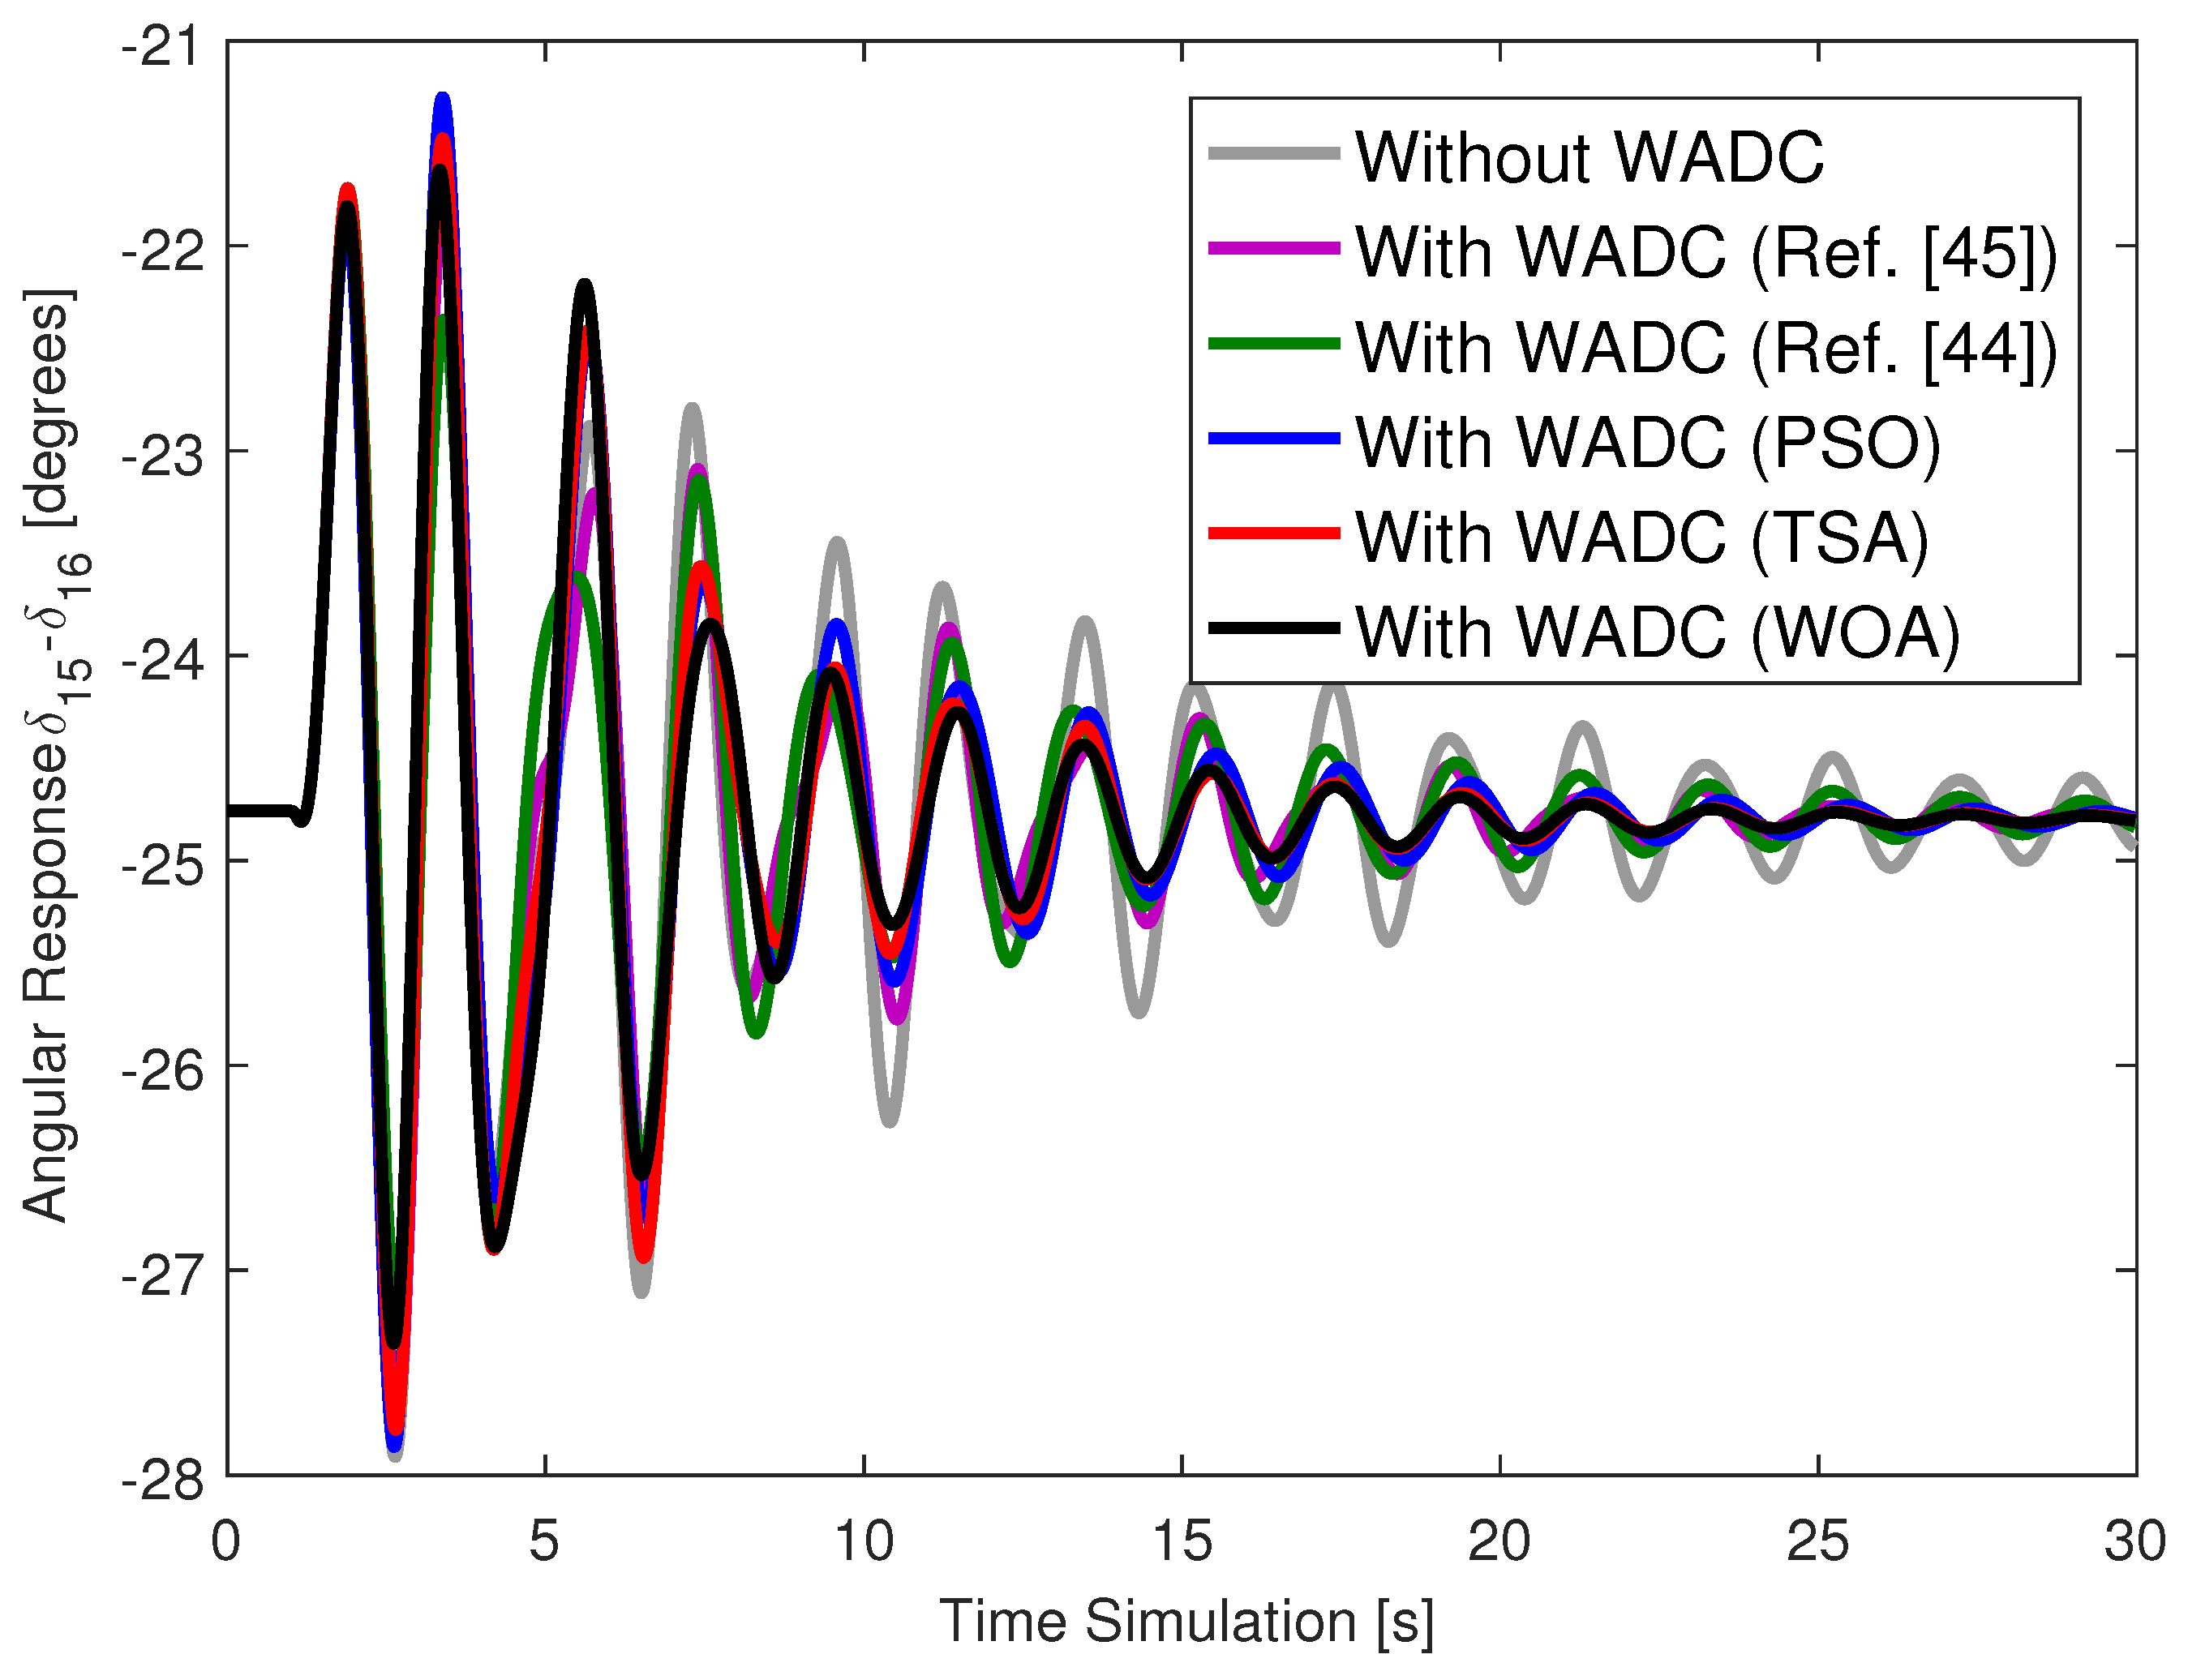
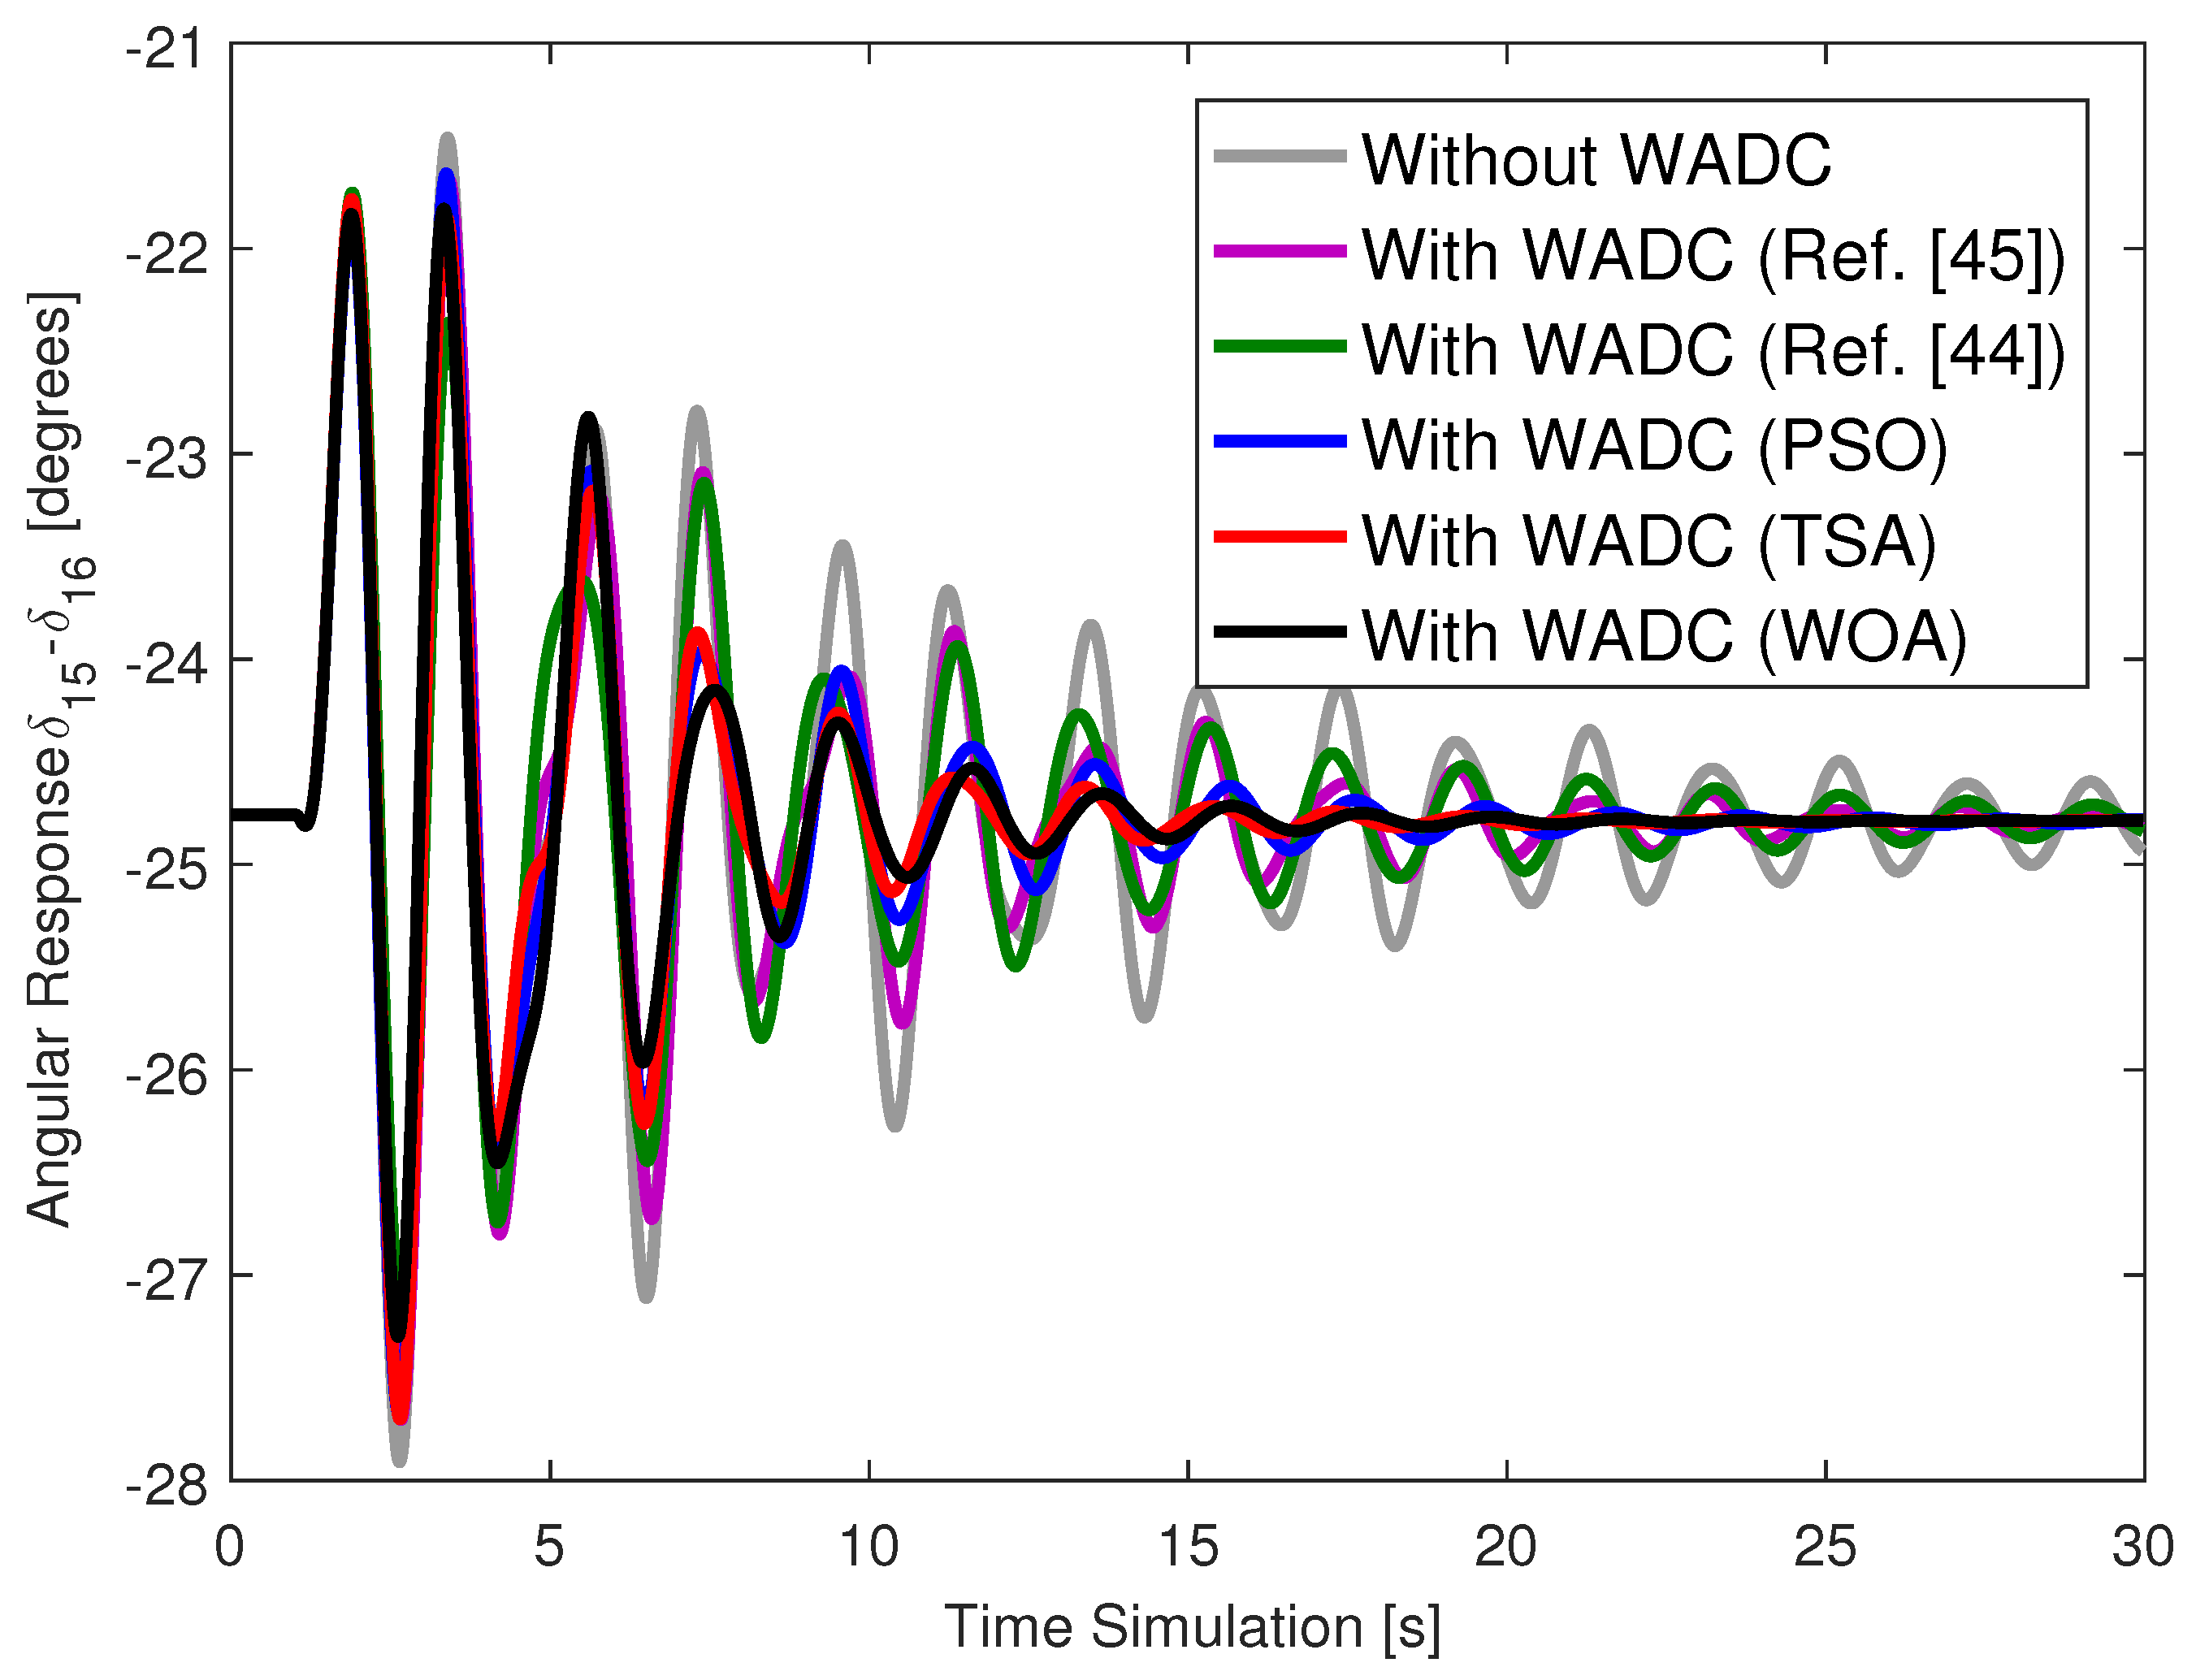
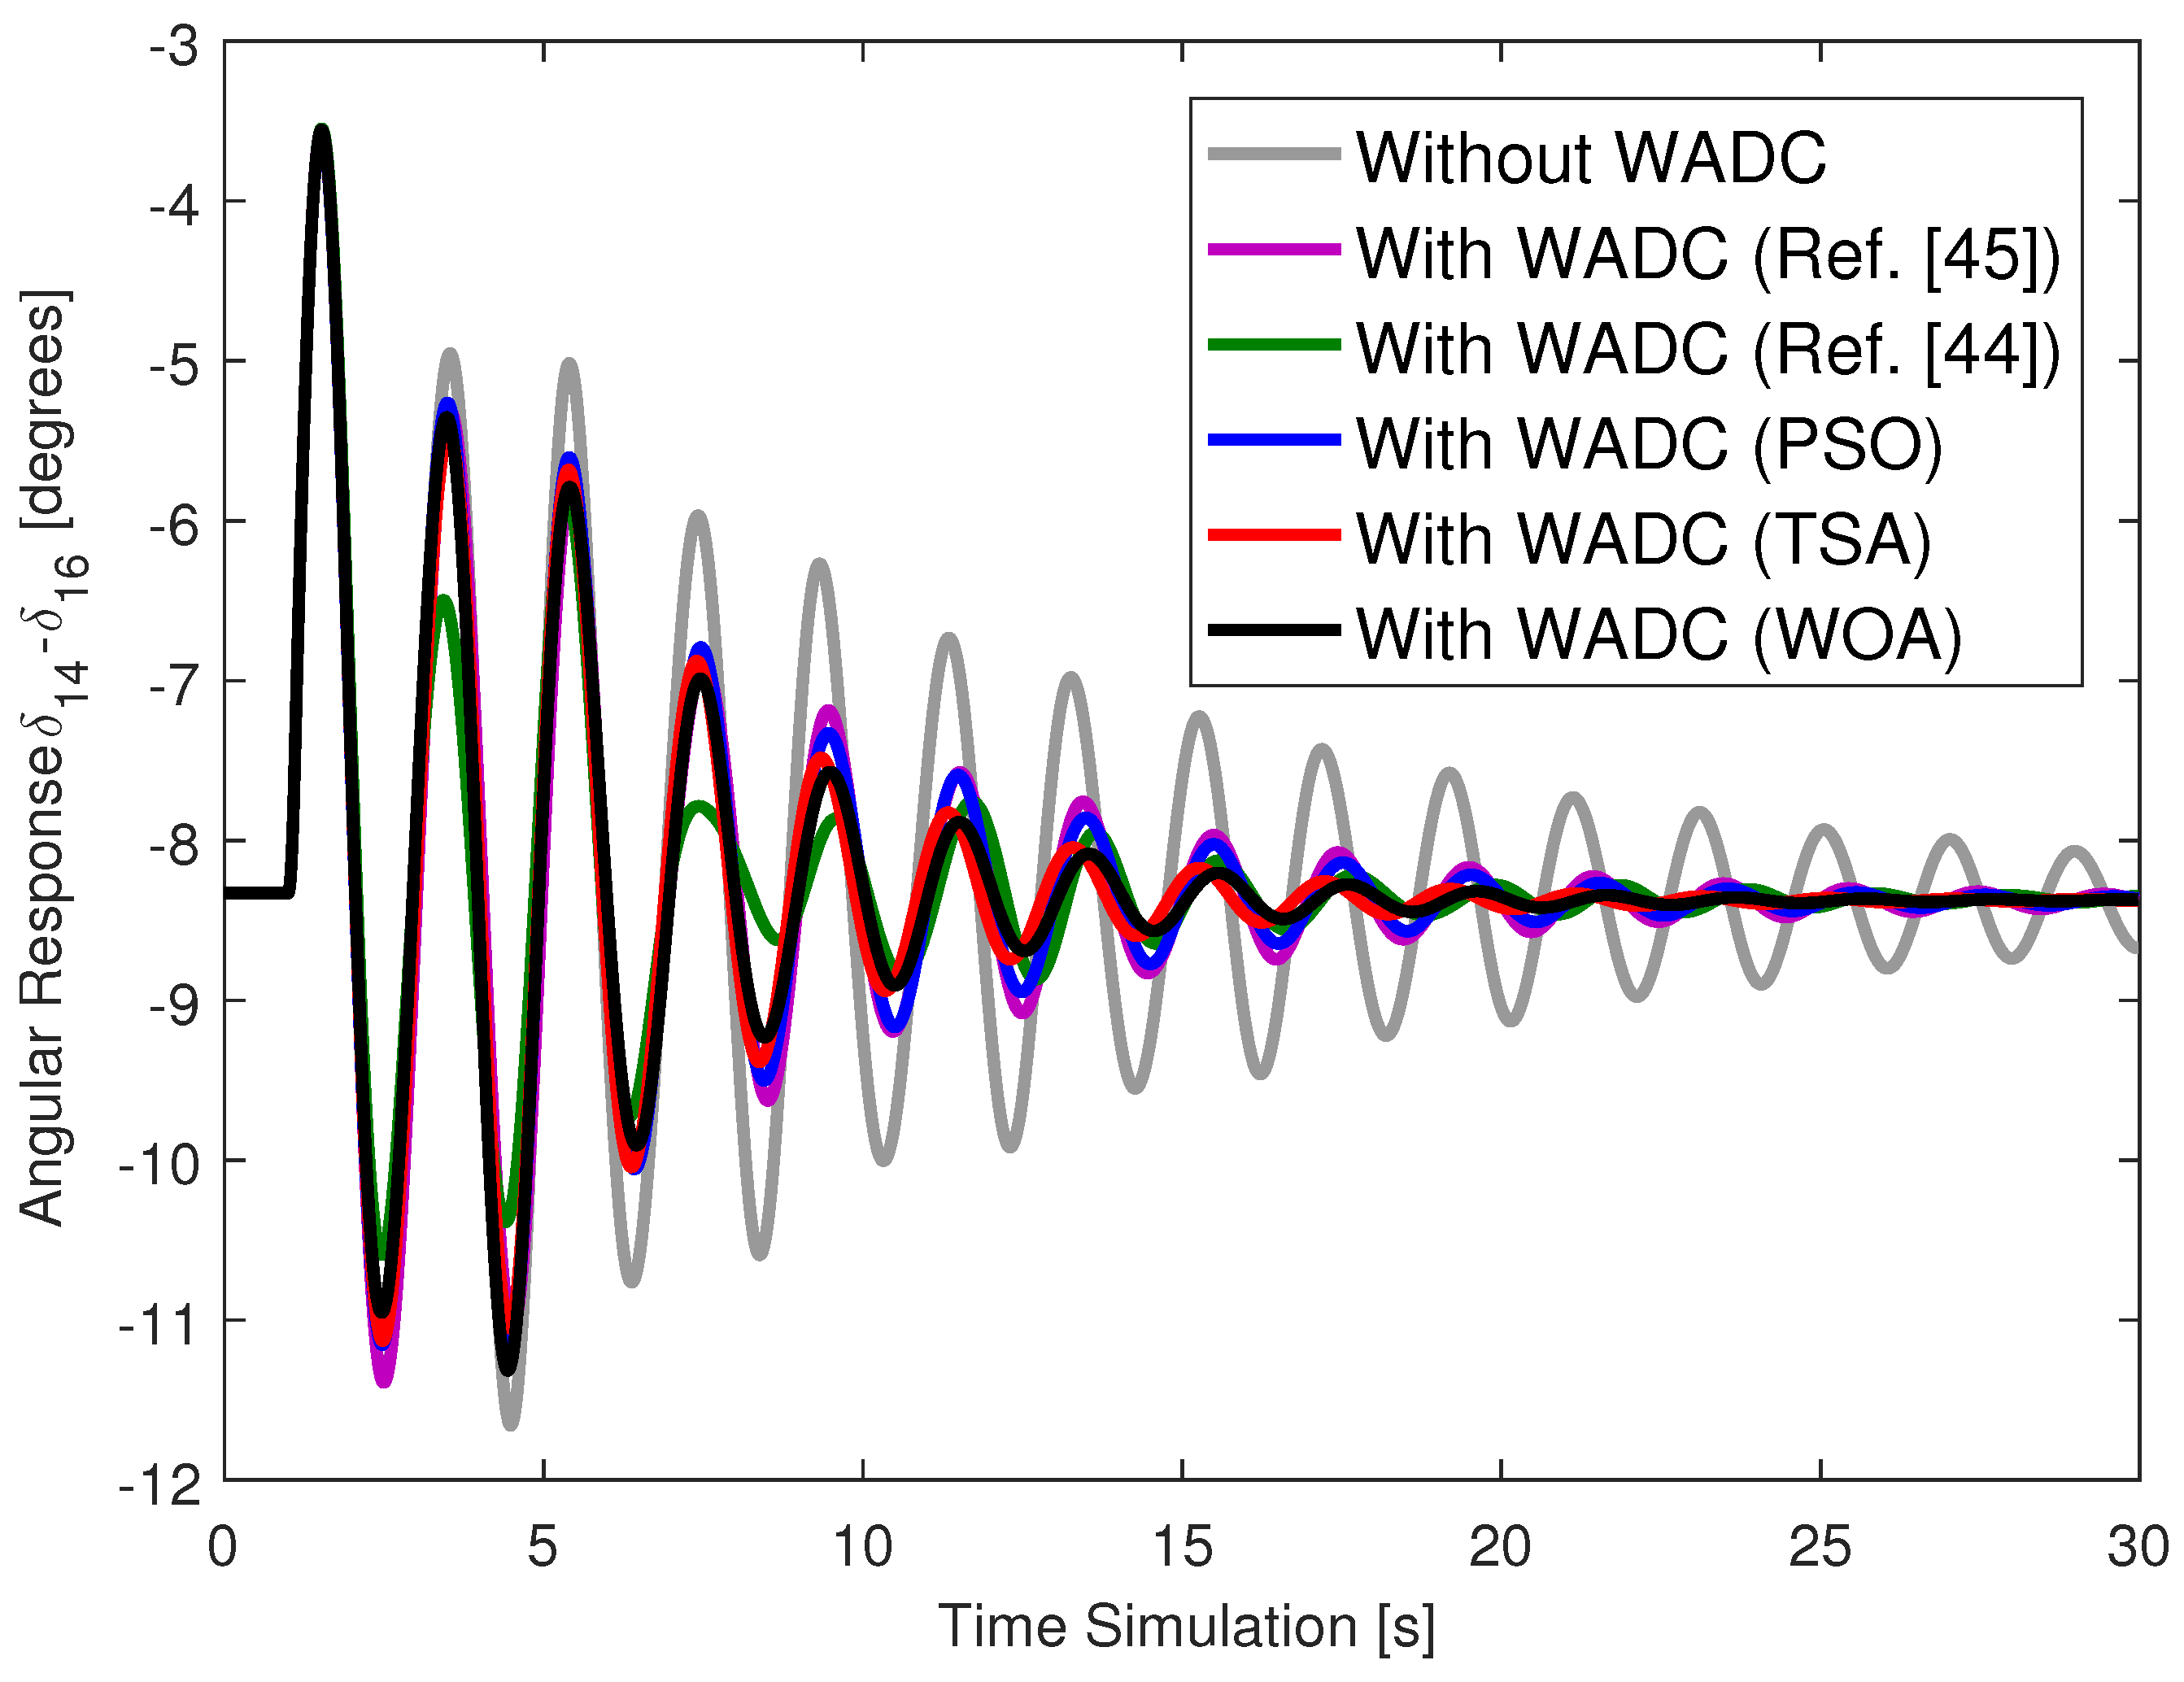
Dynamic simulations were conducted in a second operating case: case OC2 with disconnection of transmission line 31–53. A circuit was temporarily applied to bus 40 for 100 ms. The angular responses for this case without the WADC and with the WADC operating without communication failures are presented in Figure 4. Figure 5 presents the angular responses for this same case with loss of the speed signal (WADC input channel) from generator 16. Figure 6 presents the angular response of generator 15 for this same case with the loss of the WADC control output signal going to the AVR of generator 5.
The different results achieved in the case studies allow the following critical evaluations
  • The three BIAs presented low objective function values, as desired in this minimization problem. As reported in Table 2, the WOA algorithm presented the lowest values in the 100 different simulations (values between 2.65 × 10 6 and 6.60 × 10 6 ) and even presented the lowest standard deviation ( 1.16 × 10 6 ), evidencing a more uniform convergence. The PSO had difficulty achieving low multi-objective function values; the values were between 127.36 × 10 6 and 694.86 × 10 6 .
  • The damping ratios of the first pair of eigenvalues of the system were above 5%, as desired for all WADCs (PSO, TSA, and WOA) and reported in Table 8, Table 9 and Table 10. Again, the WADC provided by WOA gave the best damping ratios. Furthermore, the second pair of poles also presented damping ratios higher than 6%, as desired in the multi-objective optimization model. The design wanted the first pair of poles to be close to 6% ( ζ m i n * = 0.06 ) and the second pair to be close to 8% ( ζ m i n * * = 0.08 ).
  • Dynamic simulations of the system with contingency application without WADC and with the different WADCs (PSO, TSA, and WOA) showed better damped angular responses with WADC, as described in Figure 1 and Figure 4.
  • Dynamic simulations also show that the WADC was resilient even when a single failure occurred either at the input or output of the WADC, as described in Figure 2, Figure 3, Figure 5 and Figure 6. Communication failures do affect angular responses, but the strategy adopted in this research ensured that the system with the different WADCs had well-damped angular responses.
  • The WADC designed using the technique in [44] did not present high damping ratio values for all LFOMs. This technique presented convergence difficulties because it does not use reduced-mode models of the system. Furthermore, this technique aims to increase the minimum damping of the system and ended up drastically reducing the damping of the other modes. The WADC gains had high values (above 80). The angular responses of the system with this WADC prove to be poorly damped when compared to the WADCs of the proposed method.
  • The WADC designed using the technique in [45] also resulted in poorly damped angular responses and design difficulties. There are several reasons for these design difficulties and the limited performance. The technique in [45] has many variable matrices to determine, making convergence difficult. Furthermore, convergence results in a WADC of the same order as the system, and thus this controller needs to be reduced. The order-reduction technique can lead to a loss of performance requirements. The technique in [45] guarantees a minimum damping ratio only for the mode with the lowest damping ratio; thus, the other modes can have their damping ratios reduced.
5. Conclusions

A constrained multi-objective optimization model based on LQR theory was developed in this research to identify the parameters of a WADC resilient to communication failures, such as DoS attacks that cause permanent communication failures. The results allow some conclusions to be drawn
  • Minimizing the control effort through LQR theory and meeting the desired damping ratio values for the two modes with the lowest damping ratios was achieved in this research by the WADC designed with three different BIAs. The LFOMs of the system with the three different WADCs presented damping ratios close to 6% and 8% for the modes with the lowest damping ratios.
  • The objective function values were best for WOA ( 2.65 × 10 6 ), followed by TSA ( 40.64 × 10 6 ) and PSO ( 127.36 × 10 6 ). Each new BIA simulation can yield different WADCs with different performances. Incorporating a WADC gain constraint between −30 and 30 helped obtain a WADC that does not cause saturation of the output control signals.
  • The use of linearized model reduction techniques such as those presented in [51] reduced the system size, the number of design variables, and the sparsity of the system matrices. These factors facilitated faster convergence of the method and achieved good objective function values.
  • Comparative analyses with the method in [44] highlight the benefits of evaluating different BIAs, reducing large power system models, incorporating WADC gain constraints, and applying multi-objective functions to the design of fault-resilient WADC.
  • Another comparative analysis performed with the method in [45] highlighted other benefits of the method proposed in this article. The method in [45] presents convergence difficulties in large systems; therefore, order-reduction techniques should be applied to the designed WADC because it has the same size as the system, but this reduction may cause the loss of some performance requirements.
  • The proposed method ensured the system’s resilience to permanent communication failures caused, for example, by a Denial-of-Service attack. Dynamic simulations of the system subjected to a communication failure demonstrated damped angular responses of the system with the designed WADC. However, Denial-of-Service attacks may cause other effects that will be evaluated in future research.
  • The proposed method should be applied offline because it requires a long processing time and an iterative process with a high number of iterations. Larger systems than the test system evaluated in this research may require the application of order-reduction techniques to speed up the convergence process.
The results achieved in this work opened new directions for future research, such as (i) evaluation of the proposed method in large systems and how the reduction techniques can be made adequate and reliable, (ii) evaluation of other WADC design techniques in systems with different dimensions, (iii) evaluation how different choices of WADC poles and input and output signals affect the results and performance of the WADC, (iv) evaluation and optimization of the method for temporary Denial-of-Service attacks, multiple communication failures, and other types of cyberattack, and (v) evaluation and optimization of how measurement errors and parameter uncertainties can affect WADC design and system performance with WADC.

Funding

This study was financed by the São Paulo Research Foundation (FAPESP) under Grant 2015/24245-8 and the Coordenação de Aperfeiçoamento de Pessoal de Nível Superior-Brasil (CAPES)—Finance Code 001.

Data Availability Statement

Data are contained within the article.

Conflicts of Interest

The funders had no role in the design of the study; in the collection, analyses, or interpretation of data; in the writing of the manuscript; or in the decision to publish the results.

Abbreviations

The following abbreviations are used in this manuscript:
AVRAutomatic Voltage Regulator
BIABio-Inspired Algorithms
DoSDenial-of-Service
LFOMLow-Frequency Oscillation Mode
LQRLinear Quadratic Regulator
PMUPhasor Measurement Unit
PSOParticle Swarm Optimization
PSSPower System Stabilizer
TSATunicate Swarm Algorithm
WADCWide-Area Damping Controller
WOAWhale Optimization Algorithm

References

  1. Voropai, N. Electric Power System Transformations: A Review of Main Prospects and Challenges. Energies 2020, 13, 5639. [Google Scholar] [CrossRef]
  2. Pal, B.; Chaudhuri, B. Robust Control in Power Systems; Springer Nature: Cham, Switzerland, 2005. [Google Scholar] [CrossRef]
  3. Rogers, G.; Elliott, R.T.; Trudnowski, D.J.; Wilches-Bernal, F.; Osipov, D.; Chow, J.H. Power System Oscillations: An Introduction to Oscillation Analysis and Control; Springer Nature: Cham, Switzerland, 2025. [Google Scholar] [CrossRef]
  4. Le-Huy, P.; Lemieux, E.; Guay, F. Lessons learned in porting offline large-scale power system simulation to real-time for wide-area monitoring, protection and control. Electr. Power Syst. Res. 2023, 223, 109663. [Google Scholar] [CrossRef]
  5. Dileep, G. A survey on smart grid technologies and applications. Renew. Energy 2020, 146, 2589–2625. [Google Scholar] [CrossRef]
  6. Pazderin, A.; Zicmane, I.; Senyuk, M.; Gubin, P.; Polyakov, I.; Mukhlynin, N.; Safaraliev, M.; Kamalov, F. Directions of Application of Phasor Measurement Units for Control and Monitoring of Modern Power Systems: A State-of-the-Art Review. Energies 2023, 16, 6203. [Google Scholar] [CrossRef]
  7. Zhu, J.; Gao, W.; Li, Y.; Guo, X.; Zhang, G.; Sun, W. Power System State Estimation Based on Fusion of PMU and SCADA Data. Energies 2024, 17, 2609. [Google Scholar] [CrossRef]
  8. Mahdi Soleymani, M.; Abazari, A.; Ghafouri, M.; Jafarigiv, D.; Atallah, R.; Assi, C. Data-Enabled Modeling and PMU-Based Real-Time Localization of EV-Based Load-Altering Attacks. IEEE Trans. Smart Grid 2024, 15, 6063–6079. [Google Scholar] [CrossRef]
  9. Vosughi, A.; Pannala, S.; Srivastava, A.K. Event Detection, Classification and Localization in an Active Distribution Grid Using Data-Driven System Identification, Weighted Voting and Graph. IEEE Trans. Smart Grid 2023, 14, 1843–1854. [Google Scholar] [CrossRef]
  10. Gelli, R.; Govindarasu, M. Anomaly Detection and Mitigation for Wide-Area Damping Control Using Machine Learning. IEEE Trans. Smart Grid 2024, 15, 5939–5951. [Google Scholar] [CrossRef]
  11. Decker, I.C.; e Silva, A.S.; Agostini, M.N.; Prioste, F.B.; Mayer, B.T.; Dotta, D. Experience and applications of phasor measurements to the Brazilian interconnected power system. Eur. Trans. Electr. Power 2010, 21, 1557–1573. [Google Scholar] [CrossRef]
  12. Lu, C.; Shi, B.; Wu, X.; Sun, H. Advancing China s Smart Grid: Phasor Measurement Units in a Wide-Area Management System. IEEE Power Energy Mag. 2015, 13, 60–71. [Google Scholar] [CrossRef]
  13. Rihan, M.; Ahmad, M.; Beg, M.S. Phasor measurement units in the Indian smart grid. In Proceedings of the ISGT2011-India, Kollam, India, 1–3 December 2011; pp. 261–267. [Google Scholar] [CrossRef]
  14. Arrieta Paternina, M.R.; Castrillón-Franco, C.; Zamora-Mendez, A.; Mejia-Ruiz, G.E.; Zelaya-Arrazabal, F.; Correa, R.E.; Sevilla, F.R.S. Enhancing wide-area damping controllers via data-assisted power system linear models. Electr. Power Syst. Res. 2023, 217, 109085. [Google Scholar] [CrossRef]
  15. Vavdareh, M.B.; Ghafouri, M.; Ameli, A. Securing FACTS-Based Wide Area Damping Controllers Using Modified Conditional Generative Adversarial Networks. IEEE Trans. Smart Grid 2025, 16, 1817–1832. [Google Scholar] [CrossRef]
  16. Zenelis, I.; Wang, X.; Kamwa, I. Online PMU-Based Wide-Area Damping Control for Multiple Inter-Area Modes. IEEE Trans. Smart Grid 2020, 11, 5451–5461. [Google Scholar] [CrossRef]
  17. Bento, M.E.C. A Hybrid Particle Swarm Optimization Algorithm for the Wide-Area Damping Control Design. IEEE Trans. Ind. Inform. 2022, 18, 592–599. [Google Scholar] [CrossRef]
  18. Bai, F.; Zhu, L.; Liu, Y.; Wang, X.; Sun, K.; Ma, Y.; Patel, M.; Farantatos, E.; Bhatt, N. Design and implementation of a measurement-based adaptive wide-area damping controller considering time delays. Electr. Power Syst. Res. 2016, 130, 1–9. [Google Scholar] [CrossRef]
  19. Beiraghi, M.; Ranjbar, A.M. Adaptive Delay Compensator for the Robust Wide-Area Damping Controller Design. IEEE Trans. Power Syst. 2016, 31, 4966–4976. [Google Scholar] [CrossRef]
  20. Darabian, M.; Bagheri, A. Design of adaptive wide-area damping controller based on delay scheduling for improving small-signal oscillations. Int. J. Electr. Power Energy Syst. 2021, 133, 107224. [Google Scholar] [CrossRef]
  21. Gajjar, K.K.; Dey, K.; Kulkarni, A.M. Design and simplified stability analysis of wide-area damping control with variable feedback delay. Electr. Power Syst. Res. 2023, 223, 109558. [Google Scholar] [CrossRef]
  22. Alghamdi, S.; Markovic, U.; Stanojev, O.; Schiffer, J.; Hug, G.; Aristidou, P. Wide-area oscillation damping in low-inertia grids under time-varying communication delays. Electr. Power Syst. Res. 2020, 189, 106629. [Google Scholar] [CrossRef]
  23. Maddela, C.O.; Subudhi, B. Delay-dependent supplementary damping controller of TCSC for interconnected power system with time-delays and actuator saturation. Electr. Power Syst. Res. 2018, 164, 39–46. [Google Scholar] [CrossRef]
  24. Liang, G.; Weller, S.R.; Zhao, J.; Luo, F.; Dong, Z.Y. The 2015 Ukraine Blackout: Implications for False Data Injection Attacks. IEEE Trans. Power Syst. 2017, 32, 3317–3318. [Google Scholar] [CrossRef]
  25. Zadsar, M.; Ghafouri, M.; Ameli, A.; Moussa, B. Integrated Deep Learning-Based Detection and Robust State Observer Mitigation of Time-Synchronization Attacks: A WADC Case Study. IEEE Trans. Smart Grid 2024, 15, 5055–5071. [Google Scholar] [CrossRef]
  26. Wang, Z.; Bu, S. Design and Defense of Modal Resonance-Oriented Cyber-Attack Against Wide-Area Damping Control. IEEE Trans. Smart Grid 2024, 15, 2164–2178. [Google Scholar] [CrossRef]
  27. Patel, A.; Roy, S.; Baldi, S. Wide-Area Damping Control Resilience Towards Cyber-Attacks: A Dynamic Loop Approach. IEEE Trans. Smart Grid 2021, 12, 3438–3447. [Google Scholar] [CrossRef]
  28. Zhang, S.; Vittal, V. Design of Wide-Area Power System Damping Controllers Resilient to Communication Failures. IEEE Trans. Power Syst. 2013, 28, 4292–4300. [Google Scholar] [CrossRef]
  29. Shen, Y.; Yao, W.; Wen, J.; He, H.; Jiang, L. Resilient Wide-Area Damping Control Using GrHDP to Tolerate Communication Failures. IEEE Trans. Smart Grid 2019, 10, 2547–2557. [Google Scholar] [CrossRef]
  30. Bento, M.E.C. Design of a Decentralized Wide-Area Damping Controller Resilient to Permanent Communication Failures. IEEE Trans. Ind. Appl. 2025, 61, 4936–4947. [Google Scholar] [CrossRef]
  31. Naguru, N.R. Design of a decentralized wide-area control system to tolerate the loss of communication paths based on coherency analysis. Electr. Power Syst. Res. 2023, 222, 109500. [Google Scholar] [CrossRef]
  32. Yao, W.; Nan, J.; Zhao, Y.; Fang, J.; Ai, X.; Zuo, W.; Wen, J.; Cheng, S. Resilient Wide-Area Damping Control for Inter-Area Oscillations to Tolerate Deception Attacks. IEEE Trans. Smart Grid 2021, 12, 4238–4249. [Google Scholar] [CrossRef]
  33. Sun, Z.; Long, H.; Li, Z.; Gao, B.; Wei, X.; Levron, Y.; Belikov, J. Wide-Area damping control enhanced by non-invasive data verification against false data injection attacks. Electr. Power Syst. Res. 2025, 242, 111448. [Google Scholar] [CrossRef]
  34. Liu, S.; Zenelis, I.; Li, Y.; Wang, X.; Li, Q.; Zhu, L. Markov Game for Securing Wide-Area Damping Control Against False Data Injection Attacks. IEEE Syst. J. 2021, 15, 1356–1365. [Google Scholar] [CrossRef]
  35. Li, M.; Chen, Y. Wide-Area Robust Sliding Mode Controller for Power Systems with False Data Injection Attacks. IEEE Trans. Smart Grid 2020, 11, 922–930. [Google Scholar] [CrossRef]
  36. Zhao, Y.; Yao, W.; Zhang, C.K.; Ai, X.; Wen, J. Resilient Wide-Area Damping Control to Mitigate Strong Cyber Attack: A Multiple-Controller Switching Approach. IEEE Trans. Smart Grid 2023, 14, 2326–2337. [Google Scholar] [CrossRef]
  37. Dotta, D.; e Silva, A.S.; Decker, I.C. Wide-Area Measurements-Based Two-Level Control Design Considering Signal Transmission Delay. IEEE Trans. Power Syst. 2009, 24, 208–216. [Google Scholar] [CrossRef]
  38. Bento, M.E.C.; Dotta, D.; Ramos, R.A. Performance analysis of Wide-Area Damping Control Design methods. In Proceedings of the 2016 IEEE Power and Energy Society General Meeting (PESGM), Boston, MA, USA, 17–21 July 2016; IEEE: Piscataway, NJ, USA, 2016. [Google Scholar] [CrossRef]
  39. Xie, X.; Li, J.; Xiao, J.; Han, Y. Inter-area damping control of STATCOM using wide-area measurements. In Proceedings of the 2004 IEEE International Conference on Electric Utility Deregulation, Restructuring and Power Technologies. Proceedings, Hong Kong, China, 5–8 April 2004; IEEE: Piscataway, NJ, USA, 2004. DRPT-04. pp. 222–227. [Google Scholar] [CrossRef]
  40. Bento, M.E.C.; Dotta, D.; Ramos, R.A. Wide-area measurements-based two-level control design considering power system operation uncertainties. In Proceedings of the 2017 IEEE Manchester PowerTech, Manchester, UK, 18–22 June 2017; IEEE: Piscataway, NJ, USA, 2017; pp. 1–6. [Google Scholar] [CrossRef]
  41. Bento, M.E.C. A hybrid procedure to design a wide-area damping controller robust to permanent failure of the communication channels and power system operation uncertainties. Int. J. Electr. Power Energy Syst. 2019, 110, 118–135. [Google Scholar] [CrossRef]
  42. Bento, M.E.C. Fixed Low-Order Wide-Area Damping Controller Considering Time Delays and Power System Operation Uncertainties. IEEE Trans. Power Syst. 2020, 35, 3918–3926. [Google Scholar] [CrossRef]
  43. Prakash, A.; Moursi, M.S.E.; Parida, S.K.; Kumar, K.; El-Saadany, E.F. Damping of Inter-Area Oscillations with Frequency Regulation in Power Systems Considering High Penetration of Renewable Energy Sources. IEEE Trans. Ind. Appl. 2024, 60, 1665–1679. [Google Scholar] [CrossRef]
  44. Bento, M.E.C. Wide-Area Measurement-Based Two-Level Control Design to Tolerate Permanent Communication Failures. Energies 2023, 16, 5646. [Google Scholar] [CrossRef]
  45. Bento, M.E.C.; Kuiava, R.; Ramos, R.A. Design of Wide-Area Damping Controllers Incorporating Resiliency to Permanent Failure of Remote Communication Links. J. Control. Autom. Electr. Syst. 2018, 29, 541–550. [Google Scholar] [CrossRef]
  46. Kennedy, J.; Eberhart, R. Particle swarm optimization. In Proceedings of the ICNN’95—International Conference on Neural Networks, Perth, Australia, 27 November–1 December 1995; ICNN-95. Volume 4, pp. 1942–1948. [Google Scholar] [CrossRef]
  47. Kaur, S.; Awasthi, L.K.; Sangal, A.L.; Dhiman, G. Tunicate Swarm Algorithm: A new bio-inspired based metaheuristic paradigm for global optimization. Eng. Appl. Artif. Intell. 2020, 90, 103541. [Google Scholar] [CrossRef]
  48. Mirjalili, S.; Lewis, A. The Whale Optimization Algorithm. Adv. Eng. Softw. 2016, 95, 51–67. [Google Scholar] [CrossRef]
  49. Liu, S.; Liu, X.P.; El Saddik, A. Denial-of-Service (dos) attacks on load frequency control in smart grids. In Proceedings of the 2013 IEEE PES Innovative Smart Grid Technologies Conference (ISGT), Washington, DC, USA, 24–27 February 2013. [Google Scholar] [CrossRef]
  50. Lewis, F.L.; Vrabie, D.L.; Syrmos, V.L. Optimal Control; Wiley: Hoboken, NJ, USA, 2012. [Google Scholar] [CrossRef]
  51. Safonov, M.G.; Chiang, R.Y. A Schur method for balanced-truncation model reduction. IEEE Trans. Autom. Control 1989, 34, 729–733. [Google Scholar] [CrossRef]
  52. Alshannaq, A.M.; Haj-ahmed, M.A.; Aldwaik, M.; Abualnadi, D. Interline Power Flow Controller Allocation for Active Power Losses Enhancement Using Whale Optimization Algorithm. Energies 2024, 17, 6318. [Google Scholar] [CrossRef]
  53. Puma, D.W.; Molina, Y.P.; Atoccsa, B.A.; Luyo, J.E.; Ñaupari, Z. Distribution Network Reconfiguration Optimization Using a New Algorithm Hyperbolic Tangent Particle Swarm Optimization (HT-PSO). Energies 2024, 17, 3798. [Google Scholar] [CrossRef]
  54. Du, C.; Zhang, J. An Enhanced Tunicate Swarm Algorithm with Symmetric Cooperative Swarms for Training Feedforward Neural Networks. Symmetry 2024, 16, 866. [Google Scholar] [CrossRef]
  55. Mahdavi, E.; Asadpour, S.; Macedo, L.H.; Romero, R. Reconfiguration of Distribution Networks with Simultaneous Allocation of Distributed Generation Using the Whale Optimization Algorithm. Energies 2023, 16, 4560. [Google Scholar] [CrossRef]
  56. Li, Z.; Xiong, J. Reactive Power Optimization in Distribution Networks of New Power Systems Based on Multi-Objective Particle Swarm Optimization. Energies 2024, 17, 2316. [Google Scholar] [CrossRef]
  57. Canizares, C.; Fernandes, T.; Geraldi, E.; Gerin-Lajoie, L.; Gibbard, M.; Hiskens, I.; Kersulis, J.; Kuiava, R.; Lima, L.; DeMarco, F.; et al. Benchmark Models for the Analysis and Control of Small-Signal Oscillatory Dynamics in Power Systems. IEEE Trans. Power Syst. 2017, 32, 715–722. [Google Scholar] [CrossRef]
  58. CEPEL. ANATEM User’s Manual. 2018. Available online: https://see.cepel.br/manual/anatem/ (accessed on 1 August 2025).
Figure 1. Angular responses of generator 14 in the OC2 case with and without WADC [44,45].
Energies 18 05323 g001
Figure 2. Angular responses of generator 14 in the OC2 case without WADC and with WADC with signal loss from generator 16 (WADC input channel) [44,45].
Energies 18 05323 g002
Figure 3. Angular responses of generator 14 in the OC2 case without WADC and with WADC with loss of the control output signal of generator 5 [44,45].
Energies 18 05323 g003
Figure 4. Angular responses of generator 15 in the OC2 case with disconnection of transmission line 31–53 operating with and without WADC [44,45].
Energies 18 05323 g004
Figure 5. Angular responses of generator 15 in the OC2 case with disconnection of line 31–53 operating without WADC and with WADC with signal loss from generator 16 (WADC input channel) [44,45].
Energies 18 05323 g005
Figure 6. Angular responses of generator 15 in the OC2 case with disconnection of line 31–53 operating without WADC and with WADC with loss of the control output signal of generator 5 [44,45].
Energies 18 05323 g006
Table 1. Modes with lower damping rates for each operating case.
CaseModesEigenvaluesDamping [%]
NOCM1 0.1657 ± i 4.8917 3.3851
M2 0.1184 ± i 3.2665 3.6236
OC2M3 0.0927 ± i 3.2037 2.8921
M4 0.1643 ± i 4.8855 3.3614
Table 2. Objective function results for 100 simulations of each BIA.
BIAMinimumAverageMaximumStandard Deviation
[ × 10 6 ] [ × 10 6 ] [ × 10 6 ] [ × 10 6 ]
PSO127.36408.14694.86153.63
TSA40.6489.86142.1629.66
WOA2.654.716.601.16
Table 3. WADC parameters provided by PSO.
w k , m num ( s )
w 5 , 12 123.98 s 2 2579.4 s 8723.6
w 5 , 13 2659.3 s 2 13 , 453 s 16 , 472
w 5 , 14 7.1549 s 2 + 165.14 s + 478.3
w 5 , 15 1545.9 s 2 + 7278.6 s + 8474
w 5 , 16 4480.2 s 2 18 , 306 s 18 , 698
w 9 , 12 7.2033 s 2 355.78 s 1143
w 9 , 13 165.78 s 2 + 1197 s + 1777.3
w 9 , 14 2995.7 s 2 + 13 , 597 s + 15 , 327
w 9 , 15 796.39 s 2 + 7425.1 s + 15 , 995
w 9 , 16 37.585 s 2 6110.3 s 16 , 770
w 10 , 12 0.056285 s 2 + 27.059 s + 669.49
w 10 , 13 586.69 s 2 + 6604 s + 18 , 581
w 10 , 14 1.133 s 2 850.5 s 15 , 387
w 10 , 15 4361.9 s 2 17 , 909 s 18 , 377
w 10 , 16 62.791 s 2 4981.2 s 18 , 659
w 11 , 12 257.42 s 2 + 3092.2 s + 9274.9
w 11 , 13 848.18 s 2 + 5275.3 s + 7937.3
w 11 , 14 0.71459 s 2 131.19 s 552.53
w 11 , 15 5.0319 s 2 + 5794.1 s + 18 , 531
w 11 , 16 4263.2 s 2 + 17 , 688 s + 18 , 347
w 12 , 12 27.967 s 2 485.22 s 1542
w 12 , 13 367.93 s 2 3754.9 s 8899.6
w 12 , 14 2785.4 s 2 + 14 , 707 s + 18 , 696
w 12 , 15 167.48 s 2 + 3557 s + 16 , 419
w 12 , 16 263.07 s 2 + 5128.3 s + 9420.4
Table 4. WADC parameters provided by TSA.
w k , m num ( s )
w 5 , 12 8.7524 s 2 + 172.28 s + 809.9
w 5 , 13 356.07 s 2 2486.9 s 3612.8
w 5 , 14 0.20567 s 2 49.843 s 1676.9
w 5 , 15 3734.5 s 2 + 16 , 758 s + 18 , 734
w 5 , 16 4576.3 s 2 18 , 513 s 18 , 722
w 9 , 12 10.025 s 2 + 79.031 s + 133.79
w 9 , 13 184.89 s 2 3217.5 s 13 , 020
w 9 , 14 3347 s 2 + 15 , 887 s + 18 , 641
w 9 , 15 323.78 s 2 + 5532.2 s + 18 , 506
w 9 , 16 187.77 s 2 4526.2 s 13 , 946
w 10 , 12 23.138 s 2 + 166.86 s + 286.01
w 10 , 13 1150 s 2 + 10 , 714 s + 17 , 608
w 10 , 14 111.25 s 2 1073.5 s 2208.3
w 10 , 15 33.02 s 2 + 1558.8 s + 18 , 350
w 10 , 16 50.373 s 2 2024.4 s 18 , 723
w 11 , 12 0.58013 s 2 203.68 s 16 , 694
w 11 , 13 1079.7 s 2 + 6110.4 s + 8117.4
w 11 , 14 722.93 s 2 + 4825.6 s + 7773
w 11 , 15 13.275 s 2 + 2531.7 s + 14 , 072
w 11 , 16 4461.4 s 2 + 18 , 080 s + 18 , 317
w 12 , 12 127.66 s 2 1028.3 s 1846.6
w 12 , 13 447.04 s 2 + 3886.9 s + 8262.8
w 12 , 14 177.37 s 2 + 2850.6 s + 5409.9
w 12 , 15 2.8991 s 2 + 496.36 s + 18 , 420
w 12 , 16 5.323 s 2 503.94 s 11 , 890
Table 5. WADC parameters provided by WOA.
w k , m num ( s )
w 5 , 12 3120.7 s 2 13 , 642 s 14 , 897
w 5 , 13 278.28 s 2 + 2613.6 s + 5443.7
w 5 , 14 184.65 s 2 + 4015.6 s + 9591.6
w 5 , 15 11.389 s 2 3627 s 12 , 403
w 5 , 16 1.6364 s 2 + 351.53 s + 18 , 717
w 9 , 12 0.58919 s 2 2451 s 8386
w 9 , 13 5.7505 s 2 652.16 s 10 , 084
w 9 , 14 3972.2 s 2 + 16 , 597 s + 17 , 324
w 9 , 15 1091.2 s 2 5384.2 s 6591.4
w 9 , 16 270.32 s 2 9678.3 s 18 , 725
w 10 , 12 2255.9 s 2 + 12 , 391 s + 16 , 761
w 10 , 13 3470.8 s 2 + 15 , 854 s + 18 , 001
w 10 , 14 4590 s 2 + 18 , 395 s + 18 , 430
w 10 , 15 51.46 s 2 + 9060.2 s + 18 , 713
w 10 , 16 24.225 s 2 8518.2 s 18 , 646
w 11 , 12 57.792 s 2 + 307.31 s + 386.22
w 11 , 13 172.36 s 2 3394.4 s 14 , 534
w 11 , 14 1025.9 s 2 + 4278.1 s + 4458.4
w 11 , 15 4636.8 s 2 18 , 628 s 18 , 709
w 11 , 16 4655.1 s 2 + 18 , 660 s + 18 , 700
w 12 , 12 1.0834 s 2 + 138.54 s + 3182.5
w 12 , 13 5.6233 s 2 + 351.33 s + 2329.2
w 12 , 14 4.1134 s 2 + 2337.3 s + 17 , 954
w 12 , 15 3047.2 s 2 + 15 , 367 s + 18 , 604
w 12 , 16 0.2589 s 2 + 6.0067 s + 25.868
w 5 , 12 1.0783 s 2 42.526 s 195.89
w 5 , 13 174.43 s 2 2224.1 s 6580.9
w 5 , 14 167.23 s 2 + 6652.4 s + 13 , 527
Table 6. WADC parameters after applying the method in [44].
w k , m num ( s )
w 5 , 15 44.264 s 2 3326.4 s 42 , 832
w 5 , 16 6.0334 s 2 + 635.63 s + 11 , 551
w 9 , 12 17.978 s 2 + 426.93 s + 1986.5
w 9 , 13 246.09 s 2 2119.8 s 4248.9
w 9 , 14 904.83 s 2 6962.5 s 13 , 125
w 9 , 15 35.732 s 2 1208.3 s 4599.1
w 9 , 16 2763.8 s 2 27 , 006 s 53 , 919
w 10 , 12 59.115 s 2 + 1765.9 s + 13 , 092
w 10 , 13 1648.4 s 2 + 21 , 560 s + 37 , 017
w 10 , 14 47.225 s 2 1402.4 s 9784
w 10 , 15 197.7 s 2 931.98 s 1082.8
w 10 , 16 3494.6 s 2 + 18 , 163 s + 22 , 524
w 11 , 12 45.557 s 2 1221.7 s 4932.5
w 11 , 13 5.3883 s 2 + 421.16 s + 7898.5
w 11 , 14 93.359 s 2 + 2577.7 s + 6970.5
w 11 , 15 1270.5 s 2 + 21 , 240 s + 55 , 031
w 11 , 16 2546.7 s 2 + 11296 s + 12 , 459
w 12 , 12 1066.7 s 2 7847.7 s 13 , 611
w 12 , 13 99.053 s 2 + 2367.2 s + 5278.2
w 12 , 14 285.58 s 2 + 1336.2 s + 1535.9
w 12 , 15 274.59 s 2 + 12 , 938 s + 36 , 108
w 12 , 16 1.5771 s 2 + 219.06 s + 1897.5
Table 7. WADC parameters after applying the method in [45].
w k , m num ( s ) den ( s )
w 5 , 12 1633.66 s 2 + 35 , 097.36 s + 159 , 016.35 s 3 + 153.43 s 2 + 6955.53 s + 91 , 685.76
w 5 , 13 344 , 016.89 s 2 1 , 576 , 130.35 s 1 , 800 , 769.42 s 3 + 153.43 s 2 + 6955.53 s + 91 , 685.76
w 5 , 14 16 , 966.27 s 2 720 , 248.44 s 1 , 802 , 419.26 s 3 + 153.43 s 2 + 6955.53 s + 91 , 685.76
w 5 , 15 147 , 303.33 s 2 + 1 , 334 , 375.10 s + 2 , 994 , 402.50 s 3 + 153.43 s 2 + 6955.53 s + 91 , 685.76
w 5 , 16 133 , 011.03 s 2 950 , 695.73 s 1 , 406 , 272.25 s 3 + 153.43 s 2 + 6955.53 s + 91 , 685.76
w 9 , 12 51 , 093.49 s 2 798 , 847.54 s 2 , 679 , 994.70 s 3 + 153.43 s 2 + 6955.53 s + 91 , 685.76
w 9 , 13 22 , 195.20 s 2 + 418 , 071.14 s + 1 , 431 , 806.70 s 3 + 153.43 s 2 + 6955.53 s + 91 , 685.76
w 9 , 14 30 , 551.79 s 2 + 168 , 257.58 s + 215 , 855.89 s 3 + 153.43 s 2 + 6955.53 s + 91 , 685.76
w 9 , 15 135 , 579.09 s 2 + 1 , 531 , 403.72 s + 3 , 760 , 972.77 s 3 + 153.43 s 2 + 6955.53 s + 91 , 685.76
w 9 , 16 78 , 673.50 s 2 + 567 , 650.36 s + 1 , 023 , 924.18 s 3 + 153.43 s 2 + 6955.53 s + 91 , 685.76
w 10 , 12 8715.05 s 2 + 70 , 538.65 s + 136 , 696.56 s 3 + 153.43 s 2 + 6955.53 s + 91 , 685.76
w 10 , 13 50 , 063.31 s 2 + 923 , 812.34 s + 2 , 866 , 224.84 s 3 + 153.43 s 2 + 6955.53 s + 91 , 685.76
w 10 , 14 32 , 931.30 s 2 + 432 , 354.83 s + 1 , 171 , 703.27 s 3 + 153.43 s 2 + 6955.53 s + 91 , 685.76
w 10 , 15 10 , 903.84 s 2 + 191 , 604.02 s + 699 , 010.66 s 3 + 153.43 s 2 + 6955.53 s + 91 , 685.76
w 10 , 16 587 , 283.85 s 2 + 2 , 773 , 641.42 s + 3 , 257 , 656.66 s 3 + 153.43 s 2 + 6955.53 s + 91 , 685.76
w 11 , 12 3070.66 s 2 + 164 , 565.28 s + 1 , 310 , 445.27 s 3 + 153.43 s 2 + 6955.53 s + 91 , 685.76
w 11 , 13 25 , 545.77 s 2 + 575 , 125.83 s + 1 , 713 , 455.14 s 3 + 153.43 s 2 + 6955.53 s + 91 , 685.76
w 11 , 14 151 , 767.64 s 2 1 , 174 , 008.04 s 1 , 797 , 822.25 s 3 + 153.43 s 2 + 6955.53 s + 91 , 685.76
w 11 , 15 178 , 444.75 s 2 + 1 , 327 , 664.01 s + 2 , 467 , 530.53 s 3 + 153.43 s 2 + 6955.53 s + 91 , 685.76
w 11 , 16 109 , 671.95 s 2 1 , 042 , 399.30 s 2 , 370 , 115.36 s 3 + 153.43 s 2 + 6955.53 s + 91 , 685.76
w 12 , 12 57 , 220.35 s 2 589 , 380.63 s 1 , 103 , 855.07 s 3 + 153.43 s 2 + 6955.53 s + 91 , 685.76
w 12 , 13 10 , 856.05 s 2 + 169 , 894.58 s + 520 , 099.71 s 3 + 153.43 s 2 + 6955.53 s + 91 , 685.76
w 12 , 14 28 , 246.99 s 2 + 979 , 862.22 s + 3 , 183 , 357.29 s 3 + 153.43 s 2 + 6955.53 s + 91 , 685.76
w 12 , 15 15 , 728.07 s 2 + 143 , 965.16 s + 293 , 272.02 s 3 + 153.43 s 2 + 6955.53 s + 91 , 685.76
w 12 , 16 84 , 600.89 s 2 1 , 214 , 263.51 s 2 , 981 , 517.61 s 3 + 153.43 s 2 + 6955.53 s + 91 , 685.76
Table 8. Modes with lower damping rates for each operating case with the WADC provided by PSO.
CaseSignalModesFrequencyDamping
Loss (Eigenvalues) [Hz] [%]
NOCNone 0.4963 ± j 4.9375 0.785810.0010
0.3392 ± j 2.5275 0.402313.3001
V R E F 5 0.3308 ± j 5.0152 0.79826.5826
0.2157 ± j 3.0879 0.49156.9678
V R E F 9 0.3190 ± j 4.9248 0.78386.4635
0.2377 ± j 3.4164 0.54376.9409
V R E F 10 0.1315 ± j 2.4852 0.39555.2840
0.3446 ± j 4.8720 0.77547.0562
V R E F 11 0.3135 ± j 4.9575 0.78906.3104
0.2578 ± j 2.6607 0.42359.6447
V R E F 12 0.4580 ± j 4.9451 0.78709.2212
0.3642 ± j 3.0157 0.480011.9906
Δ ω 12 0.2260 ± j 2.6372 0.41978.5378
0.4996 ± j 4.9078 0.781110.1277
Δ ω 13 0.3035 ± j 4.9572 0.78906.1114
0.2699 ± j 3.8730 0.61646.9520
Δ ω 14 0.3293 ± j 4.8420 0.77066.7859
0.2421 ± j 3.4803 0.55396.9408
Δ ω 15 0.3009 ± j 5.0170 0.79855.9865
0.3181 ± j 2.9423 0.468310.7473
Δ ω 16 0.3449 ± j 4.9564 0.78886.9411
0.2709 ± j 3.1785 0.50598.4922
OC2None 0.2965 ± j 3.2213 0.51279.1648
0.5596 ± j 4.9371 0.785811.2632
V R E F 5 0.1871 ± j 3.1272 0.49775.9715
0.3505 ± j 5.0247 0.79976.9581
V R E F 9 0.1783 ± j 3.2594 0.51885.4625
0.3426 ± j 4.9239 0.78376.9407
V R E F 10 0.3653 ± j 4.8615 0.77377.4932
0.3000 ± j 3.2557 0.51829.1771
V R E F 11 0.3203 ± j 4.9642 0.79016.4379
0.3733 ± j 3.1101 0.495011.9183
V R E F 12 0.2429 ± j 3.1998 0.50937.5699
0.4995 ± j 4.9398 0.786210.0600
Δ ω 12 0.5523 ± j 4.8890 0.778111.2259
0.3962 ± j 3.2719 0.520712.0207
Δ ω 13 0.3198 ± j 4.9627 0.78986.4310
0.2142 ± j 3.0403 0.48397.0275
Δ ω 14 0.1945 ± j 3.2951 0.52445.8916
0.3427 ± j 4.8194 0.76707.0930
Δ ω 15 0.3112 ± j 5.0258 0.79996.1811
0.2639 ± j 3.1512 0.50158.3464
Δ ω 16 0.1584 ± j 3.1603 0.50305.0064
0.3591 ± j 4.9654 0.79037.2124
Table 9. Modes with lower damping rates for each operating case with WADC provided by TSA.
CaseSignalModesFrequencyDamping
Loss (Eigenvalues) [Hz] [%]
NOCNone 0.2893 ± j 2.5596 0.407411.2327
0.6721 ± j 5.3522 0.851812.4594
V R E F 5 0.3773 ± j 5.0184 0.79877.4978
0.3655 ± j 3.2167 0.512011.2901
V R E F 9 0.3466 ± j 4.9768 0.79216.9469
0.3000 ± j 3.3648 0.53558.8819
V R E F 10 0.3993 ± j 4.9536 0.78848.0350
0.2144 ± j 2.5964 0.41328.2308
V R E F 11 0.3012 ± j 4.9265 0.78416.1030
0.2465 ± j 2.9061 0.46258.4516
V R E F 12 0.2366 ± j 2.6663 0.42448.8405
0.4627 ± j 4.9438 0.78689.3181
Δ ω 12 0.5423 ± j 4.8657 0.774411.0770
0.6778 ± j 5.5813 0.888312.0557
Δ ω 13 0.3021 ± j 4.9949 0.79506.0369
0.2885 ± j 3.8168 0.60757.5368
Δ ω 14 0.3388 ± j 4.7957 0.76337.0480
0.2639 ± j 3.5068 0.55817.5040
Δ ω 15 0.2979 ± j 5.0642 0.80605.8729
0.2795 ± j 3.0269 0.48179.1936
Δ ω 16 0.3678 ± j 4.9968 0.79537.3416
0.2503 ± j 3.1910 0.50797.8213
OC2None 0.3214 ± j 3.2631 0.51939.8016
0.5759 ± j 5.3686 0.854410.6668
V R E F 5 0.2516 ± j 3.1970 0.50887.8468
0.4180 ± j 5.0423 0.80258.2606
V R E F 9 0.2056 ± j 3.2516 0.51756.3098
0.3860 ± j 4.9926 0.79467.7094
V R E F 10 0.4478 ± j 4.9590 0.78938.9940
0.3315 ± j 3.2963 0.524610.0069
V R E F 11 0.3107 ± j 4.9283 0.78446.2923
0.2324 ± j 3.0939 0.49247.4891
V R E F 12 0.3324 ± j 3.2771 0.521610.0908
0.5040 ± j 4.9320 0.785010.1657
Δ ω 12 0.3142 ± j 3.1984 0.50909.7756
0.6343 ± j 5.5504 0.883411.3537
Δ ω 13 0.3115 ± j 4.9981 0.79556.2199
0.4005 ± j 3.7370 0.594810.6557
Δ ω 14 0.2050 ± j 3.3162 0.52786.1691
0.3570 ± j 4.7480 0.75577.4972
Δ ω 15 0.3131 ± j 5.0807 0.80866.1508
0.2759 ± j 3.1333 0.49878.7730
Δ ω 16 0.1722 ± j 3.1798 0.50615.4080
0.3805 ± j 5.0178 0.79867.5604
Table 10. Modes with lower damping rates for each operating case with WADC provided by WOA.
CaseSignalModesFrequencyDamping
Loss (Eigenvalues) [Hz] [%]
NOCNone 0.6875 ± j 7.0419 1.12089.7164
0.6108 ± j 5.5544 0.884010.9307
V R E F 5 0.7506 ± j 7.0143 1.116410.6397
0.3367 ± j 3.0461 0.484810.9865
V R E F 9 0.2506 ± j 3.4372 0.54707.2703
0.4161 ± j 5.0210 0.79918.2582
V R E F 10 0.3763 ± j 5.0673 0.80657.4057
0.2174 ± j 2.6026 0.41428.3251
V R E F 11 0.4277 ± j 4.8873 0.77788.7186
0.2524 ± j 2.8053 0.44658.9614
V R E F 12 0.4438 ± j 5.3738 0.85538.2312
0.6924 ± j 7.1212 1.13349.6777
Δ ω 12 0.4304 ± j 5.1455 0.81898.3357
0.2566 ± j 2.9982 0.47728.5270
Δ ω 13 0.4526 ± j 5.2551 0.83648.5815
0.6634 ± j 7.1855 1.14369.1928
Δ ω 14 0.2557 ± j 3.4197 0.54437.4561
0.4072 ± j 4.9149 0.78228.2576
Δ ω 15 0.3639 ± j 5.0146 0.79817.2382
0.6331 ± j 7.0596 1.12368.9327
Δ ω 16 0.3039 ± j 3.2374 0.51539.3446
0.5113 ± j 5.3265 0.84779.5544
OC2None 0.6821 ± j 7.0568 1.12319.6214
0.3430 ± j 3.2176 0.512110.6008
V R E F 5 0.2575 ± j 3.1065 0.49448.2605
0.7421 ± j 7.0313 1.119110.4965
V R E F 9 0.2053 ± j 3.2612 0.51906.2836
0.4392 ± j 5.0199 0.79898.7156
V R E F 10 0.3765 ± j 5.0695 0.80687.4072
0.3240 ± j 3.3005 0.52539.7703
V R E F 11 0.2416 ± j 3.0837 0.49087.8112
0.4199 ± j 4.8795 0.77668.5744
V R E F 12 0.2518 ± j 3.1558 0.50237.9549
0.4464 ± j 5.3871 0.85748.2575
Δ ω 12 0.2271 ± j 3.0511 0.48567.4217
0.4419 ± j 5.1436 0.81868.5588
Δ ω 13 0.4466 ± j 5.2620 0.83758.4561
0.6585 ± j 7.1981 1.14569.1105
Δ ω 14 0.2100 ± j 3.2721 0.52086.4048
0.4204 ± j 4.8971 0.77948.5523
Δ ω 15 0.3725 ± j 5.0151 0.79827.4071
0.6320 ± j 7.0710 1.12548.9027
Δ ω 16 0.1909 ± j 3.1756 0.50546.0019
0.5008 ± j 5.3199 0.84679.3720
Table 11. Modes with lower damping rates for each operating case with WADC provided by the method in [44].
CaseSignalModesFrequencyDamping
Loss (Eigenvalues) [Hz] [%]
NOCNone 0.1878 ± j 3.7951 0.60404.9425
0.2760 ± j 4.6928 0.74695.8706
V R E F 5 0.1717 ± j 3.7867 0.60274.5302
0.2745 ± j 4.7249 0.75205.8005
V R E F 9 0.1125 ± j 2.4555 0.39084.5753
0.1775 ± j 3.4796 0.55385.0956
V R E F 10 0.2177 ± j 4.7837 0.76144.5466
0.2266 ± j 3.7131 0.59106.0922
V R E F 11 0.2198 ± j 4.7642 0.75824.6091
0.1658 ± j 3.0949 0.49265.3479
V R E F 12 0.1825 ± j 3.8712 0.61614.7093
0.2511 ± j 4.7538 0.75665.2748
Δ ω 12 0.1852 ± j 3.9230 0.62444.7153
0.2797 ± j 4.7311 0.75305.9020
Δ ω 13 0.2187 ± j 4.7831 0.76134.5685
0.2106 ± j 3.6842 0.58645.7061
Δ ω 14 0.1991 ± j 3.8373 0.61075.1826
0.2779 ± j 4.7109 0.74985.8881
Δ ω 15 0.2192 ± j 4.8534 0.77244.5129
0.1818 ± j 3.8178 0.60764.7562
Δ ω 16 0.2587 ± j 4.7166 0.75075.4773
0.2041 ± j 3.4034 0.54175.9865
OC2None 0.2774 ± j 4.6293 0.73685.9816
0.2082 ± j 3.0553 0.48636.7979
V R E F 5 0.1781 ± j 3.0741 0.48935.7837
0.2197 ± j 3.7155 0.59135.9014
V R E F 9 0.2086 ± j 3.2365 0.51516.4311
0.3539 ± j 5.3182 0.84646.6400
V R E F 10 0.2295 ± j 4.7408 0.75454.8345
0.3040 ± j 3.6082 0.57438.3965
V R E F 11 0.1409 ± j 3.1178 0.49624.5133
0.2244 ± j 4.7285 0.75264.7413
V R E F 12 0.1507 ± j 3.1316 0.49844.8077
0.2509 ± j 4.7263 0.75225.3013
Δ ω 12 0.1649 ± j 3.1278 0.49785.2647
0.2922 ± j 4.6812 0.74506.2299
Δ ω 13 0.2233 ± j 4.7458 0.75534.7000
0.2850 ± j 3.5898 0.57137.9145
Δ ω 14 0.2777 ± j 4.6500 0.74015.9608
0.1837 ± j 3.0307 0.48236.0509
Δ ω 15 0.2210 ± j 4.8466 0.77144.5557
0.1443 ± j 3.1524 0.50174.5725
Δ ω 16 0.1441 ± j 3.1869 0.50724.5155
0.2787 ± j 4.6543 0.74085.9768
Table 12. Modes with lower damping rates for each operating case with WADC provided by the method in [45].
CaseSignalModesFrequencyDamping
Loss (Eigenvalues) [Hz] [%]
NOCNone 0.2173 ± j 4.7974 0.76354.5249
0.2685 ± j 3.5047 0.55787.6393
V R E F 5 0.2228 ± j 4.7962 0.76334.6400
0.2266 ± j 3.8040 0.60545.9454
V R E F 9 0.1788 ± j 4.8533 0.77243.6811
0.2853 ± j 3.1641 0.50368.9813
V R E F 10 0.1951 ± j 4.7946 0.76314.0668
0.2742 ± j 3.4847 0.55467.8454
V R E F 11 0.2127 ± j 4.8783 0.77644.3561
0.2060 ± j 3.4839 0.55455.9038
V R E F 12 0.1281 ± j 3.3470 0.53273.8258
0.2267 ± j 4.8037 0.76454.7149
Δ ω 12 0.2336 ± j 4.8124 0.76594.8482
0.2632 ± j 3.2332 0.51468.1134
Δ ω 13 0.1925 ± j 4.8276 0.76833.9847
0.1709 ± j 3.5009 0.55724.8763
Δ ω 14 0.2458 ± j 4.7930 0.76285.1207
0.2396 ± j 3.4299 0.54596.9674
Δ ω 15 0.1607 ± j 4.8867 0.77773.2877
0.3350 ± j 3.5977 0.57269.2710
Δ ω 16 0.1962 ± j 4.7937 0.76294.0895
0.2286 ± j 3.3672 0.53596.7735
OC2None 0.2128 ± j 4.7764 0.76024.4507
0.2005 ± j 3.2079 0.51066.2384
V R E F 5 0.2209 ± j 4.7736 0.75974.6233
0.1666 ± j 3.1503 0.50145.2814
V R E F 9 0.1733 ± j 4.8399 0.77033.5789
0.1568 ± j 3.1593 0.50284.9557
V R E F 10 0.1900 ± j 4.7774 0.76033.9730
0.2026 ± j 3.2123 0.51136.2929
V R E F 11 0.2111 ± j 4.8700 0.77514.3304
0.2007 ± j 3.2800 0.52206.1082
V R E F 12 0.1052 ± j 3.2274 0.51373.2574
0.2298 ± j 4.7818 0.76104.8000
Δ ω 12 0.1465 ± j 3.1689 0.50434.6189
0.2366 ± j 4.7927 0.76284.9316
Δ ω 13 0.1870 ± j 4.8130 0.76603.8824
0.1989 ± j 3.3128 0.52725.9924
Δ ω 14 0.1454 ± j 3.1938 0.50834.5478
0.2471 ± j 4.7669 0.75875.1766
Δ ω 15 0.1544 ± j 4.8792 0.77653.1639
0.1698 ± j 3.1806 0.50625.3313
Δ ω 16 0.1932 ± j 4.7768 0.76034.0407
0.1530 ± j 3.2205 0.51264.7456
Disclaimer/Publisher’s Note: The statements, opinions and data contained in all publications are solely those of the individual author(s) and contributor(s) and not of MDPI and/or the editor(s). MDPI and/or the editor(s) disclaim responsibility for any injury to people or property resulting from any ideas, methods, instructions or products referred to in the content.