Abstract
Power outages pose considerable risks to the reliability of electric grids, affecting both consumers and utilities through service disruptions and potential economic losses. This study analyzes a historical outage dataset from a Regional Transmission Organization (RTO) to reveal key patterns and trends that suggest outage management strategies. By integrating exploratory data analysis, predictive modeling, and a Large Language Model (LLM)-based interface integration, as well as data visualization techniques, we identify and present critical drivers of outage duration and frequency. A random forest regressor trained on features including planned duration, facility name, outage owner, priority, season, and equipment type proved highly effective for predicting outage duration with high accuracy. This predictive framework underscores the practical value of incorporating planning information and seasonal context in anticipating outage timelines. The findings of this study not only deepen the understanding of temporal and spatial outage dynamics but also provide valuable insights for utility companies and researchers. Utility companies can use these results to better predict outage durations, allocate resources more effectively, and improve service restoration time. Researchers can leverage this analysis to enhance future models and methodologies for studying outage patterns, ensuring that artificial intelligence (AI)-driven methods can contribute to improving management strategies. The broader impact of this study is to ensure that the insights gained can be applied to strengthen the reliability and resilience of power grids or energy systems in general.
1. Introduction
Electrical grids play a critical role in maintaining the quality of life and supporting economic and social activities by ensuring the uninterrupted delivery of electricity from generation facilities to consumers [1,2,3]. The complex nature of power grids, which incorporate substations, transformers, circuit breakers, and extensive transmission lines, highlights the need for a robust analysis of outage events to identify vulnerabilities and improve infrastructure [4]. Disruptions in this system can have far-reaching consequences, including economic losses, safety risks, reduced productivity, and negative impacts on infrastructure, particularly for emerging transportation systems. This issue is critical not only in urban areas but also in rural regions, where the adoption of autonomous electric vehicles is expected to increase. A stable and reliable power system is essential to support the necessary charging infrastructure in these areas [5].
Power outages present substantial challenges to the reliability and stability of electrical grids, disrupting the lives of residential users in rural and urban areas and the operations of industrial facilities. With growing electricity demand and the increasing complexity of power distribution infrastructure, understanding the causes and patterns of outages becomes essential for improving grid resilience and operational efficiency [6]. Previous research efforts have identified several causes of power outages, including weather-related disruptions such as lightning, wind, snow, and ice, which account for a large percentage of outages [7]. Adverse weather conditions can compromise the performance and reliability of critical infrastructure systems by altering energy demand patterns and increasing stress on system operations. For example, microsimulation studies have shown that inclement weather conditions can significantly affect operational efficiency and resource consumption in dynamic traffic and infrastructure systems [8,9]. Shield et al. (2021) [10] examined the impact of weather events on power grid disruptions in the United States. They found that weather causes 50% of outages and affects 83% of customers. Thunderstorms lead to 47% of disruptions, followed by winter storms (31.5%) and tropical cyclones (19.5%). The median restoration cost is $12 million, with an average time of 117.5 h. The findings of these studies underscore the broader implications of extreme weather, emphasizing the need for resilient systems capable of maintaining functionality across sectors during such events. Other causes include over-demand, human errors, vandalism (such as copper theft), and natural disasters like earthquakes, floods, and wildfires. These outages can be classified into blackouts, brownouts, and permanent faults, each with varying levels of severity [11].
Xu et al. (2006) [12] investigated tree-caused faults in power distribution systems using outage data from Duke Energy. The goal was to better understand fault patterns and improve fault diagnosis and prevention strategies. The methodology involves applying four data mining measures: actual, normalized, relative, and likelihood, to analyze fault characteristics across different regions and conditions (e.g., weather, season, time of day). Additionally, logistic regression is used to assess the statistical significance of six influential factors. The findings reveal that all six factors, namely, circuit ID, weather, season, time of day, number of phases affected, and protective devices, significantly influence tree-caused outages, offering valuable insights for system reliability improvement. Nateghi et al. (2011) [13] compared statistical methods for predicting power outage durations caused by hurricanes, with the goal of helping utilities improve restoration efforts and resource allocation. The authors evaluated five models: Accelerated Failure Time (AFT) regression, Cox Proportional Hazards (Cox PH) regression, Bayesian Additive Regression Trees (BART), Regression Trees (CART), and Multivariate Adaptive Regression Splines (MARS). These models were tested using data from Hurricane Ivan (2004), which included 14,320 outage records and 93 covariates, and were validated with data from Hurricanes Katrina and Dennis. The findings revealed that BART outperforms all other models in predictive accuracy, followed by the AFT model. The Cox PH model performed the least well.
Wang et al. (2016) [14] explored the resilience of power systems during natural disasters, aiming to examine methods for forecasting power system disturbances, pre-storm preparations, grid hardening, and restoration strategies. The study reviewed several forecasting models, including statistical models like Generalized Linear Models (GLMs) and BART, as well as simulation-based models. It also covered strategies for power grid hardening and corrective actions during disasters, such as distribution automation and microgrid integration for load restoration. The findings emphasized the need for better integration of smart grid technologies, including microgrids and distributed generation, to enhance system resilience. Simulation-based models provided deeper insights into damage mechanisms, while statistical models focused more on data-driven predictions. The paper noted that challenges remained in optimizing investment in hardening measures, improving forecasting accuracy, and enhancing the integration of interdependent infrastructures, like communication and transportation networks, for more robust disaster response and recovery. Jaech et al. (2019) [15] predicted the duration of unplanned power outages in real time. A neural network model was first used to estimate duration based on initial features like weather and infrastructure. As repair logs arrived, the model updated predictions using natural language processing. Results showed that combining onset data with repair log analysis significantly improved accuracy, enabling more reliable outage duration forecasts.
Doostan et al. (2019) [16] aimed to predict monthly vegetation-related outages to improve power distribution system reliability. The methodology involves a data-driven framework combining statistical and machine learning techniques. It utilizes k-means clustering to define prediction areas, time series models (SARIMA, Holt-Winters) for growth-related outages, and machine learning regressors (Support Vector Machines (SVM), Random Forest (RF), Neural Network (NN) for weather-related outages. Key features capturing weather, geography, and time are engineered and ranked by importance. Results show the hybrid approach outperforms naive and benchmark models, enabling accurate, area-specific outage prediction using commonly available data. Bashkari et al. (2021) [17] identified dominant factors causing power distribution system outages related to vegetation, animals, and equipment. The methodology integrated real outage, weather, and load datasets, applying data preprocessing, visualization, and association rule mining using the Apriori algorithm, along with chi-square testing to assess rule significance. Outages were reclassified into binary subdatasets (e.g., vegetation vs. others), and rules were mined for each cause, including specific equipment types. Findings revealed that weather (e.g., wind, temperature, humidity), time (season and daytime), and load significantly influenced outage types, with high load being a major factor in equipment failures.
Mohammed Rizv (2023) [18] explored the use of deep learning algorithms for predicting power outages and detecting faults in electrical power systems. The methodology involved a comprehensive literature review of various deep learning models, including Convolutional Neural Networks (CNNs) for spatial analysis, Recurrent Neural Networks (RNNs) and Long Short-Term Memory networks (LSTMs) for temporal pattern recognition, and Generative Adversarial Networks (GANs) for synthetic data generation. The study evaluated model performance using historical data, focusing on accuracy and classification effectiveness. Findings showed that deep learning models achieved high prediction accuracy (95%) and fault classification precision (92%), highlighting their potential for improving power systems.
Han and Cho (2023) [19] supported smart power grid management by developing an interactive visualization interface for exploring system efficiency and outage events. The methodology involved integrating heterogeneous datasets: geographic information systems (GIS), advanced metering infrastructure (AMI), and outage management system (OMS), into a web-based platform using technologies such as Node.js, React, and D3.js. The interface included views for visualizing topological efficiency data, geospatial outage patterns, and categorical relationships among outage causes, locations, and equipment. The findings demonstrated the interface’s potential to help grid managers analyze historical outages and performance issues intuitively. Fatima et al. (2024) [20] aimed to support power outage prediction (POP) during hurricanes by reviewing and guiding the application of machine learning (ML) techniques. The methodology included a comparative review of various ML models used globally, along with a sequential approach for selecting optimal models based on performance metrics. The findings demonstrated the effectiveness of ML in predicting outages and highlighted key challenges in integrating ML with existing power system networks.
Extensive research on analytical and predictive methodologies has been conducted by previous researchers to address the substantial challenges that power outages pose to the stability and resilience of electrical grids. Traditional approaches and research progress in this field often focus on identifying key drivers of outages, such as equipment failures, environmental stressors, and utility operational practices. While many utility companies maintain outage databases, existing reporting frameworks often lack real-time accessibility, automated insights, and dynamic querying capabilities, limiting flexibility in decision-making and response strategies.
To complement the current infrastructure and the development trend of improving the reliability and resilience of energy systems, the primary goal of these studies is to develop effective strategies for preventing outages, minimizing their impact, and enhancing grid reliability. This study introduces an integrated approach combining exploratory data analysis, machine learning-based predictive modeling, and a Large Language Model (LLM) interface to enhance outage management. The LLM-powered system bridges the gap between raw outage data and actionable intelligence, enabling natural language querying, automated report generation, and improved decision support for utility operators and researchers.
Analysis of historical outage data provides an opportunity to uncover patterns and trends contributing to grid instability. By examining the frequency, duration, and equipment type causing outages, utility companies can target high-risk components, implement preventative maintenance, and allocate resources more effectively. For instance, seasonal trends and specific equipment failures can inform better planning and response strategies, reducing the overall impact of outages. Additionally, data-driven approaches offer utility companies the ability to simulate potential outage scenarios, allowing for proactive mitigation of future risks. This study advances data-driven outage management by integrating predictive modeling with artificial intelligence (AI)-driven interfaces, enhancing grid reliability, operational efficiency, and overall energy system resilience.
The remainder of this paper is organized as follows. Section 2 positions the present study within the broader research landscape. Section 3 introduces the dataset and methodology, while Section 4 presents the results and discussion. Finally, Section 5 concludes the paper and outlines future research directions.
2. Positioning the Present Study
As demonstrated in prior research, hybrid approaches that combine statistical analysis with machine learning techniques often outperform traditional methods that rely solely on statistical modeling. Conventional approaches in outage prediction have included methods such as AFT regression, Cox PH models, Generalized Linear Models (GLM), logistic regression, and decision trees. More recent studies have also explored BART, SVM, and deep learning models such as CNNs and RNNs. Building upon this evolving landscape, the present study integrates descriptive statistical analysis with an RF-based predictive model to more accurately estimate power outage durations. A summary of comparative outage prediction studies from previous literature is presented in Table 1.

Table 1.
Comparative summary of outage prediction studies.
Another key contribution of this research is its use of a unique dataset from a Regional Transmission Organization (RTO) that has received relatively limited attention in previous studies. This dataset includes detailed features such as equipment type, facility, priority, season, and planned duration, which allow for a more granular exploration of outage dynamics. By analyzing these parameters in combination, this study reveals nuanced patterns that may be obscured in aggregated national datasets.
Furthermore, this research introduces an innovative integration of an LLM-based natural language interface that allows end users to query and interact with the predictive system using unstructured input. This novel feature bridges the gap between complex data analytics and practical usability, making the model’s insights more accessible to utility operators, planners, and even non-technical stakeholders. Collectively, these contributions advance the fields of power systems engineering, predictive maintenance, and AI-driven infrastructure analytics. The study offers valuable benefits for utility companies, outage coordination teams, and energy infrastructure planners by providing tools that enhance decision-making, improve reliability, and support the transition toward more resilient grid operations.
3. Methodology
This study focuses on the analysis of a historical transmission outage dataset obtained from an RTO responsible for managing the electric grid and wholesale power market across the central United States. By leveraging a combination of statistical analysis, machine learning, and data visualization techniques, the research aims to uncover meaningful relationships among key outage parameters and to develop a predictive model for estimating actual outage durations. A Random Forest Regressor model is trained using several critical features from the dataset, including Planned Duration, Facility, Outage Owner, Priority, Season, and Equipment Type. The model demonstrates high predictive accuracy, emphasizing the value of integrating historical outage data with advanced analytical tools.
The insights gained from this research contribute significantly to the broader literature on power grid resilience and reliability. They are particularly beneficial to several sectors within the energy industry. Utility companies can use the predictive insights to enhance outage response strategies, improve maintenance scheduling, and optimize resource planning. Grid operators benefit from more accurate reliability assessments and improved coordination of outage management. For researchers and analysts, the study offers a robust framework for building and refining data-driven models to better understand and anticipate outage behavior. Additionally, the findings support energy policy makers and infrastructure planners in designing more adaptive and resilient grid systems that are better equipped to handle rising demand and environmental uncertainty.
3.1. Dataset Introduction
The RTO is responsible for managing the electric grid and wholesale electricity markets across parts of 14 states in the United States, namely, Arkansas, Iowa, Kansas, Louisiana, Minnesota, Missouri, Montana, Nebraska, New Mexico, North Dakota, Oklahoma, South Dakota, Texas, and Wyoming, ensuring non-discriminatory access, optimizing grid operations, and maintaining reliability. The provided dataset focuses on these states because they fall within the RTO’s operational jurisdiction, which oversees power grid management and reliability for the region. Since RTOs are responsible for transmission coordination within their designated areas, the outage data reflects incidents specific to their service territory rather than a nationwide scope. Despite the region-specific dataset, the proposed methodology can be scaled to a nationwide or global energy infrastructure by incorporating several strategies, such as aggregating data from all RTOs with other standard reporting and methodologies.
The bar chart in Figure 1 illustrates the total number of major outages for each state from 2000 to 2023. This highlights the considerable variation among states, with Texas experiencing the highest number of outages, primarily due to its large geographic size and high population density. Louisiana ranks second, followed by Arkansas, representing the third highest outage frequency. On the other hand, Wyoming, South Dakota, and North Dakota report a negligible number of outages because these states typically have lower population densities and lower electricity demand compared to more urbanized areas. Additionally, they benefit from more stable grid infrastructure and fewer transmission congestion issues. Well-maintained energy distribution networks may also influence the reliability of their power systems.
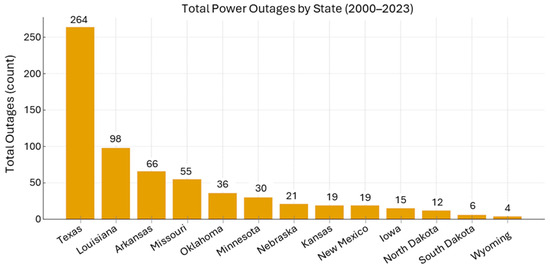
Figure 1.
Number of major power outage events from 2000 to 2023, based on data from Ref. [21].
3.2. Dataset Description
The dataset used in this study was sourced from the publicly accessible platform provided by the RTO in the form of a CSV file. It comprised 207,189 rows and the following columns:
- Crow ID and Rev Number: Stands for the unique identifiers for outage records, ensuring traceability and version control.
- Outage Owner: Identifies the entity responsible for managing the outage, which can be crucial in determining patterns in outage handling efficiency.
- Equip Type and Facility: Specifies the type of equipment affected and the facility where the outage occurred, providing essential context for impact analysis.
- Rating: Describes operational characteristics of the affected equipment, which can influence outage response strategies.
- Submitted Time and Priority: Signifies when the outage request was filed and its assigned priority level, which is often used for scheduling and resource allocation decisions. The priority categories are discretionary, emergency, forced, operational, opportunity, planned, or urgent.
- Outage Request Status: Indicates the current state of the outage request, whether approved, cancelled, completed, denied, implemented, preapproved, or submitted.
- Planned Start Time and Planned End Time: Defines the expected outage duration based on initial scheduling.
- Actual Start Time and Actual End Time: Captures the real-world occurrence of outages, enabling an analysis of deviations from planned schedules.
- Duration: Represents the total outage time in hours (h), essential for performance tracking and predictive modeling.
These columns provided detailed temporal and categorical information on historic outages from 2004 to 2023, including metadata about the equipment, facilities, and timestamps for planned and actual outage durations in hours. This data is essential for predicting outage durations, which is a key component in improving operational efficiency and minimizing disruptions, according to previous research on outage management systems [22].
3.3. Methodology Steps
The proposed methodology follows a structured, multi-phase approach to ensure a robust and effective analytical framework. It is divided into four distinct phases, each playing a critical role in the overall workflow: data cleaning, feature engineering and encoding, model development, and LMM-powered interface integration. Each of these phases is illustrated in Figure 2, with detailed descriptions provided below.
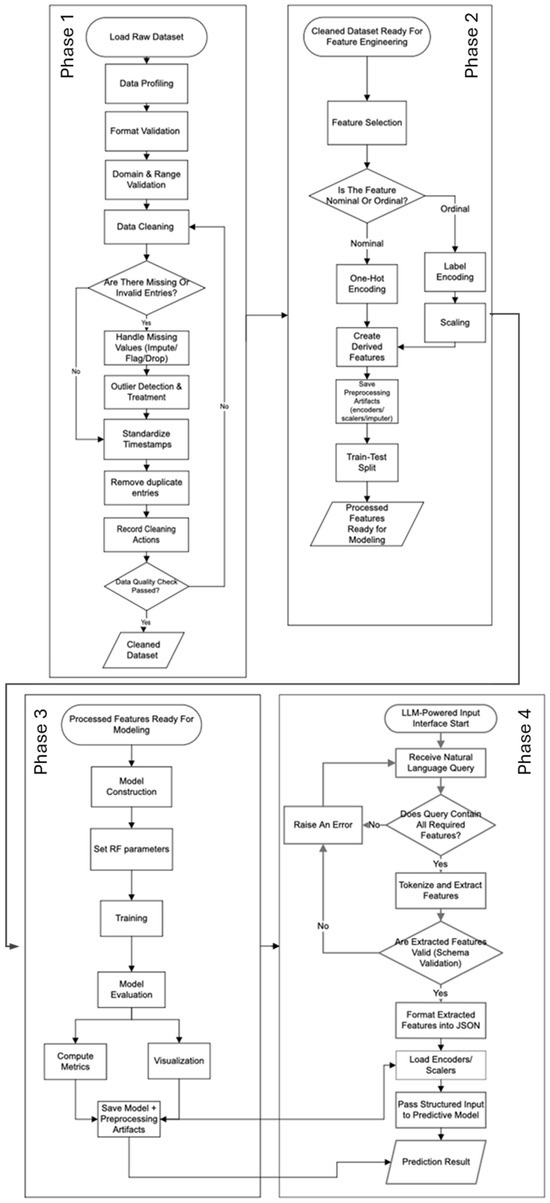
Figure 2.
Proposed methodology flow chart in four phases.
3.3.1. Phase 1: Data Cleaning
Data cleaning was a critical first step to ensure the quality and reliability of the dataset for subsequent analysis and modeling. Incomplete, inconsistent, and erroneous data entries can introduce biases and inaccuracies, leading to unreliable predictive models. This phase focused on addressing missing values, standardizing data formats, and validating numerical entries, following established best practices in predictive modeling.
To handle missing values, rows lacking essential information in critical columns such as Facility, Actual Start Time, and Actual End Time were removed. By excluding these rows, we ensured that the dataset was robust and free from ambiguities, which is particularly important when using machine learning models sensitive to incomplete data.
Timestamp standardization was another essential step. Columns containing temporal data, such as Submitted Time, Planned Start Time, and Actual Start Time, were converted from string formats to the datetime data type to facilitate accurate time-based computations. This step also included handling invalid timestamps, which were replaced with NaT (Not a Time). Such standardization is crucial for ensuring that planned and actual durations are calculated consistently, a necessity for deriving meaningful insights. Textual data in columns such as Equip Type, Priority, and Outage Request Status were cleaned to remove leading and trailing spaces and to standardize capitalization. This preprocessing ensured that grouping and filtering operations performed during feature engineering and analysis were not affected by textual inconsistencies. Standardizing text data is an important step in preparing categorical variables for encoding, which is required for machine learning models.
To optimize memory usage and improve computational efficiency, categorical columns with a limited number of unique values, such as Equip Type and Priority, were converted to categorical data types. This optimization was particularly useful for reducing the computational burden of handling large datasets, as demonstrated in similar studies on predictive modeling of outages. Duplicate rows, which could distort statistical analyses and introduce biases in model training, were identified and removed. Additionally, numerical data in the Rating column was validated to ensure all values were non-negative. Any invalid or outlier entries were removed to prevent the introduction of noise into the analysis. Such steps are critical for maintaining the integrity of numerical data and ensuring that the model learns from clean, consistent inputs. By focusing on complete records, we ensured the reliability of time-based metrics used for both analysis and prediction. After completing this data cleaning phase, the dataset was reduced to 187,304 rows, ensuring high-quality, consistent data for the next steps in the methodology.
3.3.2. Phase 2: Feature Engineering and Encoding
Feature engineering and encoding were performed to transform the cleaned dataset into a format suitable for machine learning models. This phase involved selecting relevant features, encoding categorical variables, and splitting the data into training and testing subsets. Effective feature engineering is a cornerstone of machine learning, as it enhances the model’s ability to capture relationships and patterns within the data. The process began with feature selection, where six key predictors were identified: Equip Type, Facility, Outage Owner, Priority, Season, and Planned Duration. These features were chosen based on domain expertise and exploratory data analysis. For instance, Equip Type and Facility capture the physical and operational context of outages, while Priority reflects the urgency of addressing the issue. Season accounts for temporal variations, which can significantly influence outage durations. These features were selected to ensure the inclusion of variables that are both meaningful and informative for predicting outage durations. This study mainly focuses on Outage Duration (h), representing the actual duration of each outage event. Prediction of this variable has practical implications for outage management and resource allocation, enabling operators to plan more effectively and minimize disruptions.
Categorical features such as Equip Type, Facility, and Priority were encoded using Label Encoder, converting textual data into numerical representations. For example, Equip Type values like “Transformer” and “Circuit Breaker” were mapped to integer codes. This transformation preserves the relationships between categories while ensuring compatibility with machine learning algorithms, which typically require numerical inputs. The dataset was split into training and testing subsets, with 80% of the data allocated for training and 20% reserved for testing. This split ensures that the model’s performance can be evaluated on unseen data, providing a reliable measure of its generalization ability. Stratified sampling was used to maintain the distribution of categorical variables across the subsets, reducing the risk of overfitting and ensuring that the test set is representative of the overall dataset.
3.3.3. Phase 3: Model Development
In this study, the goal was to develop a predictive model capable of accurately forecasting the duration of power outages based on a variety of features. After carefully considering multiple modeling approaches, the Random Forest Regressor was selected for its robustness, flexibility, and ability to handle both categorical and continuous variables, making it ideal for the dataset at hand [23]. The Random Forest model is an ensemble learning method based on the principle of constructing multiple decision trees. Unlike a single decision tree, which is prone to overfitting due to its reliance on a single predictive path, a Random Forest mitigates this issue by combining the outputs of multiple independently constructed trees, resulting in more robust and reliable predictions [24].
Furthermore, while Gradient Boosting Machines (GBMs) aim to improve performance by building trees sequentially and correcting errors, this process increases complexity and the risk of overfitting [25]. In contrast, Random Forest builds all trees in parallel, striking a balance between simplicity and predictive power [26]. Its ability to deliver consistent results with minimal hyperparameter tuning makes it an efficient choice for achieving accuracy without unnecessary computational overhead [27]. Random Forest was chosen over other machine learning models due to its balance between predictive accuracy, robustness, and computational efficiency [23,26]. Several alternatives were considered during the evaluation phase. Still, after multiple trials, they were found less suitable for the specific task of predicting outage durations based on features such as Equip Type, Priority, and Season.
Linear regression, though simple and computationally efficient, assumes a linear relationship between features and the target variable [28,29]. This assumption makes it unsuitable for capturing the likely non-linear interactions in the dataset, leading to poor performance and bias. Support Vector Machines (SVM), particularly Support Vector Regression (SVR), can handle non-linear relationships and high-dimensional spaces effectively [30,31]. However, SVMs are computationally expensive, require careful feature scaling and normalization, and their hyperparameters, such as regularization and kernel functions, are challenging to tune [32].
Neural networks, while capable of capturing complex patterns, require large datasets to avoid overfitting and are computationally intensive, with longer training times [33]. Although the dataset contained a substantial number of rows, deep learning models generally demand even larger datasets for reliable performance [34]. Moreover, the objective of this study emphasized obtaining a reliable and interpretable model with minimal computational overhead, making deep learning models less suitable. Gradient Boosting Machines (GBM), including XGBoost and LightGBM, were also considered. These models are highly accurate as they sequentially build trees, correcting errors from previous iterations [25]. However, GBMs are more prone to overfitting in noisy datasets and require extensive hyperparameter tuning [32]. They are also more computationally expensive compared to Random Forests, particularly with large datasets [35].
The model was trained using the training dataset, and the prediction for each data point was computed as the average of predictions from all individual decision trees in the forest. This ensemble approach reduces the variance compared to individual decision trees, producing more reliable and stable predictions. The general prediction equation for Random Forest is as follows [36]:
where is the predicted value, ntrees is the number of trees in the forest, and is the prediction of the i-th decision tree.
The hyperparameters and their corresponding values used in the Random Forest model are summarized in Table 2 below.

Table 2.
Hyperparameters of the model and their assigned values.
The Random Forest model is particularly well-suited to handle the mixed data types in the dataset, including categorical features like Equip Type and Facility, as well as continuous features like Planned Duration (h). It also automatically handles interactions between variables, without requiring explicit specification of feature interactions as in other models like linear regression.
For model evaluation, the performance of the trained Random Forest model was evaluated using the R-squared (R2) metric. This metric, also known as the coefficient of determination, quantifies the proportion of variance in the target variable that is explained by the model [37].
where the numerator is the residual sum of squares that measures the difference between the observed value y and the predicted value , and the denominator is the total sum of squares, which measures the variance of the observed values y from the mean .
An R2 score closer to 1 indicates that the model captures the majority of the variability in the data, while a score closer to 0 suggests poor performance. The Random Forest model achieved an R2 score of 0.91, indicating that 91% of the variance in outage durations was explained by the model. An R2 of 0.91 on unseen data indicates the model explains a large proportion of variance in outage durations, suggesting it will generalize well. The evaluation metrics used to assess the performance of the Random Forest model are summarized in Table 3.

Table 3.
Model Performance Evaluation Metrics.
3.3.4. Phase 4: LLM-Powered Interface Integration
To enhance the functionality and usability of the predictive model, this study integrates OpenAI’s GPT-4o API as a natural language interface. The Large Language Model (LLM) serves as an intermediary, dynamically extracting structured features from unstructured natural language descriptions to ensure compatibility with the predictive model. The use of pre-trained large language models (LLMs) for extracting structured data is gaining widespread attention across research fields, demonstrating their efficacy and making them appropriate for our research purpose [38]. Its integration in our study automates the preprocessing workflow, enabling the transformation of complex outage descriptions into structured data suitable for machine learning models. Below are the details of the interface integration.
- Step 1: Feature extraction and schema definition
For feature extraction and schema definition, the LLM is configured to extract and validate key features required by the predictive model, including Facility, Equip Type, Priority, Season, Month, and Planned Duration. For each feature, a schema is defined to specify the permissible values, ensuring data consistency and compatibility. Valid values for the attributes “equipment type” and “priority” can be found in Table 4. These predefined schemas are fundamental to the validation process, ensuring that the extracted features align with the requirements of the Random Forest Regressor.

Table 4.
Valid values for selected feature attributes.
To guide the behavior of the LLM, custom instructions and prompt engineering techniques are employed. These instructions define the required features, their valid values, and the desired output format. For example, given an input query such as:
- Input Query:“Estimate the duration of a forced outage at Horseshoe Lake involving a transformer in December”.
The LLM tokenizes the text and extracts features based on contextual and semantic patterns. The extracted features are formatted into a structured JavaScript Object Notation (JSON). The tokenization process splits the text into smaller units called tokens [39]. Depending on the model’s design, tokens can be individual words, phrases, or even characters [40]. This step helps the model understand the structure of the text. The model analyzes contextual and semantic patterns within the text, examining word relationships, sentence structure, and meaning to extract relevant features. In our application, these extracted features establish key associations, for example, linking “Horseshoe Lake” to a facility, identifying “Transformer” as the equipment type, classifying “Forced” as the priority, and recognizing “Winter” as the related season. This extracted feature JSON output is directly compatible with the input requirements of the Random Forest Regressor, facilitating seamless integration between the LLM and the predictive model.
- Step 2: Validation of extracted features
The extracted features undergo a rigorous validation process to ensure compliance with the predefined schema, maintaining data integrity and accuracy. Each feature is cross-validated against the schema, and any invalid, inconsistent, or unrecognized values trigger an error. The following pseudocode in Figure 3 demonstrates an illustrative subset of the validation process for Equip Type and Priority.
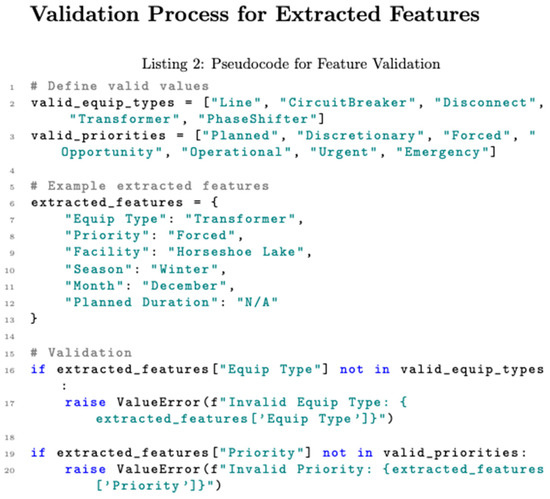
Figure 3.
Pseudocode for the feature validation process.
For instance, if the LLM extracts an invalid value for Priority, such as “Critical,” the system raises an error and flags the input for correction, preventing inaccurate classifications. “Critical” is not part of the valid phrases listed in Table 4. Similarly, the validation process ensures that the EquipType matches one of the permissible values, eliminating potential mismatches that could disrupt downstream analysis. The permissible values for EquipType are “Line”, “CircuitBreaker”, “Disconnect”, “Transformer”, and “PhaseShifter” as listed in Table 4.
If the facility name is invalid or ambiguous, the script halts processing and requests clarification from the user, ensuring that data inconsistencies do not propagate. Additionally, temporal features such as Season and Month are validated to ensure they align with logical and seasonal contexts. This prevents errors resulting from misclassified timeframes.
- Step 3: Handling ambiguous or incomplete inputs
On ambiguous or incomplete inputs, the LLM is configured to detect missing features and handle them appropriately to maintain data accuracy and integrity. If a required feature is missing, the system raises an error and rejects the input to prevent incomplete or misleading outputs. For example, if the required features are EquipType, Priority, Facility, Season, and Month, and the query omits Priority, the system halts execution and raises an exception. The following pseudocode in Figure 4 illustrates this scenario.
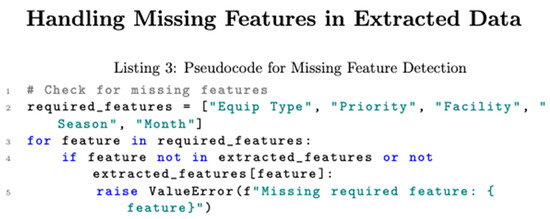
Figure 4.
Pseudocode for handling missing or incomplete data.
Additionally, the system incorporates predefined rules and exception handling protocols to differentiate between minor omissions and severe inconsistencies. For example:
- If a high-priority feature is missing, such as Facility or Equip Type, the system flags the input for correction rather than proceeding with inaccurate assumptions.
- For ambiguous feature values, such as an unclear Facility name, the system requests clarification from the user rather than assigning an arbitrary designation.
- For temporal features, such as Season and Month, it undergoes context-based validation to ensure logical consistency. If an input specifies “Winter” but lists “July” as the month, the system detects a discrepancy and requests correction before proceeding.
To evaluate the robustness of our LLM integration, we tested the system on 50 queries exhibiting varied word orders, combinations, and levels of completeness, including queries with mismatched or contradictory data. Utilizing the OpenAI GPT-4o API, the system correctly extracted features in 46 instances, either providing accurate results or requesting clarification on ambiguous inputs, resulting in an overall extraction and validation accuracy of approximately 92%. This empirical evaluation demonstrates the system’s effective handling of both error-prone and well-formed queries.
- Step 4: Parsing and model integration
The structured JSON output generated by the LLM undergoes a parsing process, converting it into a native data structure suitable for integration into the predictive model. This transformation ensures the extracted features are structured in a way that facilitates seamless data processing and model integration. Once parsed, the data is validated again for consistency and completeness before being fed into the Random Forest Regressor for prediction.
By automating feature extraction, validation, and formatting, the integration of the LLM significantly streamlines the preprocessing workflow. This approach ensures that only schema-compliant data is passed to the predictive model, reducing errors and improving prediction accuracy. The integration of the LLM establishes a scalable framework for adapting natural language inputs to predictive modeling applications. This approach enables extensions to include new features or schema updates without requiring retraining of the predictive model. As a result, the methodology ensures adaptability and robustness in handling diverse and evolving datasets, paving the way for broader applications in predictive modeling.
4. Results and Discussion
Using the performance outage data provided by the RTO and the proposed model, this section presents key findings derived from the processed data, examining trends and patterns while situating the results within existing literature and practical applications.
4.1. Predictive Model Performance
A Random Forest Regressor was employed to predict outage durations, achieving an R2 score of 0.91, demonstrating its strong predictive capabilities. The model used six key features: planned duration, facility, outage owner, priority, season, and equipment type to estimate outage durations with high accuracy. The ensemble learning approach effectively handled the mix of categorical and numerical data, making it ideal for this dataset. Feature importance analysis revealed planned duration as the most influential variable, followed by facility and outage owner. These findings align with operational realities, where planned outages are carefully scheduled, and facility-specific factors often dictate the time required for repairs. The model’s robust performance underscores its potential as a tool for operational planning, enabling utilities to anticipate outage durations and optimize resource allocation.
4.2. Analysis of Outage Patterns and Equipment Types
Understanding the frequency and duration of outages across different equipment types and priority categories is critical for improving the stability and reliability of the power grid. This study provides a detailed analysis of the prediction results on vulnerabilities in the grid infrastructure, highlighting areas for targeted intervention and predictive planning.
4.2.1. Outage Frequency by Equipment Type
Outage frequency refers to how often outages occur within a given timeframe. It counts the number of power disruptions affecting a specific region, facility, or equipment type. High outage frequency may suggest persistent reliability issues, potentially indicating infrastructure weaknesses, environmental stressors, or operational inefficiencies. From the prediction results, transmission lines, transformers, and disconnects emerge as the most vulnerable components in the power grid. Transmission lines account for the highest frequency of outages, comprising 46.6% of all incidents (Figure 5). This is largely due to their exposure to environmental stressors such as wind, storms, and vegetation interference. The frequent failures of transmission lines underscore the importance of implementing robust weatherproofing measures and regular inspections. Additionally, investments in internet-of-things (IoT)-based monitoring systems for real-time condition tracking can significantly enhance the resilience of transmission infrastructure.
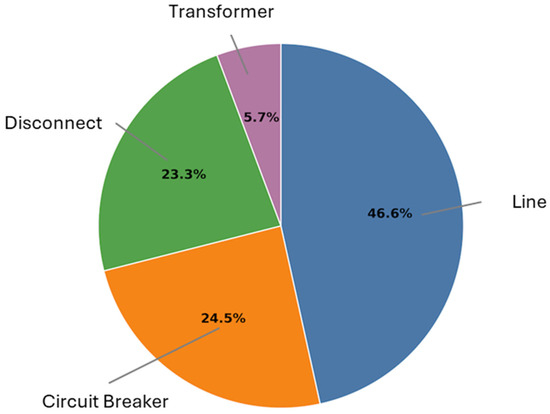
Figure 5.
Percentage of equipment-related outages.
Transformers, while contributing to a smaller proportion of outages (5.7%), exhibit high vulnerability to overloading, aging, and thermal stress. These failures often occur during peak demand periods, such as summer and winter, when operational stress is at its maximum. Effective cooling mechanisms and routine maintenance practices are essential to minimize the risk of transformer failures. Disconnects and circuit breakers also contribute significantly to outages. Ensuring their reliability through advanced condition monitoring and timely inspections can enhance their performance, reducing the risk of cascading failures that can disrupt grid stability.
4.2.2. Average Outage Duration by Equipment Type
The duration of outages provides additional insights into the operational challenges of different equipment types. Average outage duration measures how long each outage lasts before power is restored. It represents the severity of outages, showing how quickly utilities can respond and resolve service interruptions. A longer average outage duration suggests challenges in repair processes, resource availability, or emergency response strategies.
As shown in Figure 6, transformers and disconnects experience the longest average outage durations, exceeding 200 h. The prolonged duration associated with transformer repairs highlights the complexity of their maintenance, which often requires significant resources and time. Transmission lines also exhibit high average durations, reflecting the logistical difficulties of repairing extensive outdoor infrastructure. Conversely, phase shifters exhibit the shortest average outage durations, suggesting efficient repair and robust design. However, given their critical function, even brief outages can have severe repercussions. Addressing these issues through targeted investments in repair efficiency and maintenance schedules can significantly improve overall grid resilience.
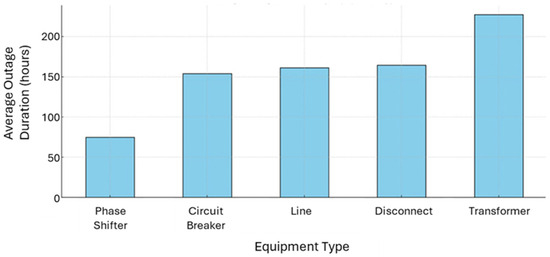
Figure 6.
Average outage duration by equipment type.
4.3. Seasonal Impact on Outages
Understanding the seasonal impact of outages is crucial because weather patterns and environmental conditions directly affect power grid reliability. Seasonality significantly influences both the frequency and duration of outages, as shown in Figure 7 and Figure 8. Spring and Fall exhibit the highest number of outages, driven by transitional weather patterns such as storms, high winds, and vegetation growth. These conditions place significant stress on transmission lines and other exposed electrical components, including circuit breakers and phase shifters. In the spring, vegetation growth intensifies, leading to branches potentially encroaching on power lines and increasing the likelihood of service disruptions. Thunderstorms become more frequent, bringing lightning strikes that can damage critical components of the grid. High winds and heavy precipitation further increase outage risks, affecting urban and rural areas.
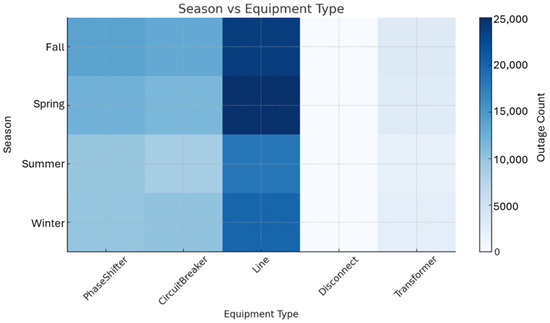
Figure 7.
Number of outages for each equipment type by season.
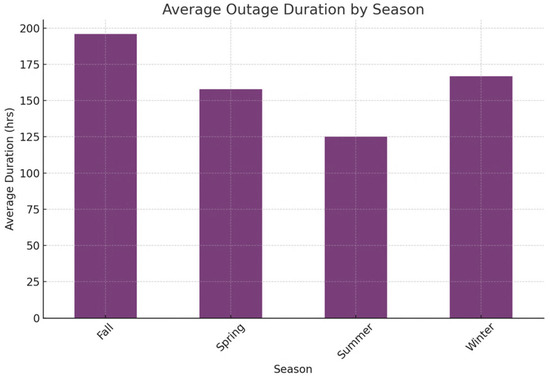
Figure 8.
Average outage duration by season.
Similarly, during the fall, strong winds and severe storms, often accompanied by heavy rainfall, can weaken power lines, uproot trees, and cause widespread electrical faults. These conditions, combined with the gradual temperature shifts leading into winter, place additional stress on aging infrastructure, accelerating wear and increasing the likelihood of prolonged outages. The average outage duration in the fall was found to be the longest, approaching 200 h, significantly higher than the average of more than 150 h recorded in the spring. This extended outage duration may be attributed to several factors, including increased storm severity, compounded equipment strain from seasonal transitions, and delayed maintenance efforts as utilities prepare for the harsher winter months. Therefore, proactive maintenance and vegetation management before these high-risk seasons can help mitigate the frequency of unplanned outages [41].
Winter outages often last longer to repair, with an average duration exceeding 150 h. This extended restoration time is primarily driven by harsh environmental conditions, logistical challenges, and infrastructure vulnerabilities exacerbated by extreme cold [7]. Freezing temperatures, heavy snowfall, and ice accumulation not only damage transmission lines and substations but also hinder access to affected areas, slowing repair efforts [42]. Additionally, frozen ground conditions may complicate excavation work for underground cables, further extending recovery time.
In contrast, summer outages have the shortest average duration, typically around 125 h. While high temperatures and increased electricity demand contribute to grid strain, repair and accessibility challenges are generally less severe than winter conditions. Rapid response times, favorable weather for fieldwork, and fewer environmental obstacles enable quicker resolution of summer outages. However, extreme heat waves and storms still pose reliability risks, highlighting the importance of season-specific outage mitigation strategies [43].
4.4. Outage Prioritization and Durations
The frequency of outages across priority categories sheds light on operational practices and highlights areas for improvement in outage management strategies. The seven prioritization categories, Discretionary, Emergency, Forced, Operational, Opportunity, Planned, and Urgent, classify outages based on severity, response requirements, and system impact. Figure 9 illustrates the relationship between outage prioritization and equipment type, offering a comprehensive view of how different assets are affected across varying priority levels.
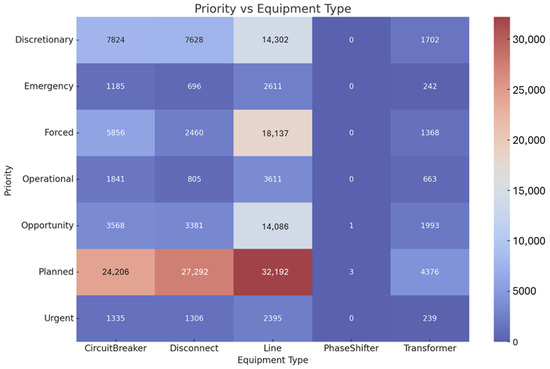
Figure 9.
Heatmap of outage priorities across equipment types, showing frequency by priority level and equipment category.
Planned outages constitute the majority of incidents, reflecting a proactive approach by utility companies to perform necessary maintenance and upgrades while minimizing disruption to consumers. By scheduling these outages, utilities can efficiently allocate resources and address system vulnerabilities. The analysis shows that planned outages primarily affect transmission lines, disconnect switches, and circuit breakers, in that order. Planned outages often target transmission lines first because they require extensive maintenance, inspections, and upgrades to ensure grid stability. Since transmission lines impact large areas, utilities schedule outages strategically to minimize disruptions.
Forced outages, on the other hand, occur with significant frequency and highlight ongoing vulnerabilities in the grid. These outages are typically caused by unexpected equipment failures or external factors, such as severe weather. Transmission lines experience the highest incidence of forced priority, emphasizing the need for enhanced inspection protocols and resilience measures. Addressing these vulnerabilities through predictive maintenance and real-time monitoring can help reduce their occurrence. IoT-based monitoring systems, for example, can detect early signs of wear and tear, allowing utilities to address potential failures before they lead to forced outages.
Emergency and urgent outages, although less frequent, demand immediate attention due to their critical impact on grid stability. These outages require well-trained response teams and robust contingency plans to ensure rapid recovery. Enhancing the ability to respond swiftly to these types of outages is vital for maintaining the integrity of the power distribution system and ensuring consumer safety.
Figure 10 shows the distribution of average outage duration across all priority categories. The analysis reveals that operational priority outages account for the longest average duration, exceeding 650 h. This extended timeframe can be attributed to the nature of operational outages, which often involve complex system upgrades, extensive repairs, or scheduled maintenance requiring prolonged equipment downtime.
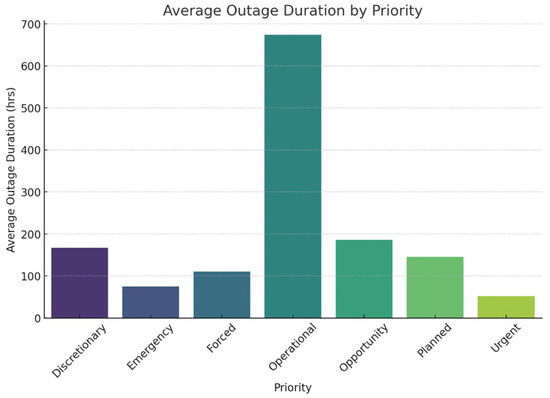
Figure 10.
Average outage duration by priority.
In contrast, emergency and urgent outages exhibit significantly shorter durations, averaging less than 100 h. This is likely due to the high-priority nature of these outages, which demand rapid response and immediate restoration efforts to minimize disruptions to critical infrastructure and essential services. Emergency outages typically result from unforeseen failures requiring swift intervention, while urgent outages necessitate expedited repairs to prevent further system instability. The large difference in the average outage duration between operational and high-priority outages underscores the importance of balancing long-term system improvements with emergency response efficiency. Understanding these patterns helps utilities refine maintenance strategies, optimize resource allocation, and improve outage mitigation efforts across varying priority levels.
4.5. Facility Ownership and Seasonal Interactions
The interaction between facility owners and seasonal outage patterns reveals concentrated vulnerabilities in specific facilities during high-risk seasons. Figure 11 illustrates vulnerability hotspots and operational differences among facilities, revealing concentrated risks during high-risk seasons. External environmental factors such as extreme weather conditions, fluctuating energy demands, and infrastructure aging can drive seasonal outage trends. These vary across facility types, geographical locations, and ownership structures.
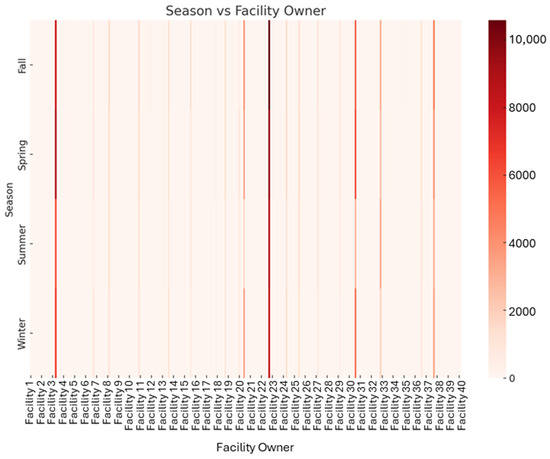
Figure 11.
Seasonal outage trends by facility ownership.
Identifying these seasonal vulnerability patterns allows utilities to tailor maintenance strategies for facilities prone to seasonal disruptions. By proactively addressing seasonal outage trends, operators can implement preventive maintenance schedules, reinforce infrastructure resilience, and optimize contingency plans before peak outage seasons arise, especially in the Spring and Fall.
Additionally, understanding operational differences between facilities can inform resource allocation and planning. Some facilities may have more robust emergency response mechanisms due to ownership-specific investment priorities, while others may require additional intervention based on historical performance data. By leveraging this knowledge, utilities can allocate personnel, equipment, and emergency response protocols more effectively, ensuring a more stable and efficient power distribution network.
5. Conclusions and Future Works
In summary, this research presents an end-to-end data-to-prediction workflow for outage-duration estimation across 14 U.S. states. Through exploratory data analysis, we identified dominant causes and patterns of outages, providing empirical focus areas for reliability improvements. Using predictive modeling, we showed that outage durations can be estimated using machine learning (Random Forest), supporting outage response planning and maintenance scheduling. By integrating an LLM-based interface, we introduced a novel way to communicate these insights, making complex analytics accessible through natural language. To our knowledge, this combination of techniques is one of the first implementations in the power sector that combines data analysis, AI prediction, and conversational interfaces. The findings have tangible significance for utility operations: they enable more data-driven decision-making in both planning (e.g., reinforcing infrastructure against common causes) and real-time operations (allocating resources based on predicted outage severity). Utilities adopting such methods can expect improvements in reliability indices by reducing the frequency of outages (through preventative measures guided by cause analysis) and the duration of outages (through faster, informed response). Additionally, the improved communication facilitated by the LLM interface can enhance situational awareness among operators and improve transparency with customers and regulators.
For future research, several avenues emerge from this work. One important direction is to refine the predictive models further. For instance, incorporating real-time sensor data, such as from supervisory control and data acquisition (SCADA) system inputs or smart meter outage flags, could allow the model to update predictions as conditions evolve during an outage. Advanced deep learning models (like LSTM or Transformer-based time-series predictors) could be explored to capture temporal dependencies and possibly achieve even higher accuracy, as suggested by recent studies by Ghasemkhani et al. [44] with extreme gradient boosting and neural networks. Future extensions may also draw from related advances such as multi-agent reinforcement learning [45] and spatiotemporal multi-task learning frameworks [46], which have shown strong performance in complex prediction tasks.
It would also be valuable to test the framework on other regions or utility datasets to ensure its generality; what holds for RTO may differ in areas with different climate or grid topology. Another future research area is enhancing the LLM interface with greater domain knowledge. For example, it could be integrated with utility GIS and crew management systems. Ensuring the reliability and security of LLMs in operations will be a parallel challenge, echoing concerns about trust and verification in AI applications for critical infrastructure [47].
In conclusion, our novel approach, combining exploratory analysis, predictive modeling, and LLM-based interaction, offers a practical and scalable framework for advancing power system reliability and resilience in both research and real-world applications. By validating the proposed approach with the RTO-provided outage dataset, we have demonstrated its feasibility, effectiveness, and real-world applicability. As utilities continue to modernize and adopt smart grid technologies, AI-driven tools like the proposed integration protocol will be instrumental in enhancing grid resilience, optimizing operational efficiency, and minimizing service disruptions. This work underscores the growing potential of AI in the energy sector, offering a scalable and data-driven solution for a more reliable and adaptive power system.
Author Contributions
Conceptualization, K.A., Y.H. and N.Y.; methodology, K.A.; software, K.A.; validation, K.A., Y.H. and N.Y.; formal analysis, K.A.; investigation, K.A.; resources, Y.H.; data curation, K.A. and Y.H.; writing—original draft preparation, K.A. and N.Y.; writing—review and editing, Y.H. and N.Y.; visualization, K.A. and N.Y.; supervision, Y.H. and N.Y.; project administration, Y.H.; funding acquisition, Y.H. All authors have read and agreed to the published version of the manuscript.
Funding
The National Science Foundation (NSF) EPSCoR RII Track-2 Program under the NSF award # 2119691.
Data Availability Statement
The dataset contains semi-confidential information and is subject to restrictions. Access and distribution require prior authorization from the relevant RTOs.
Acknowledgments
This research is made possible through funding from the National Science Foundation (NSF) EPSCoR RII Track-2 Program under the NSF award # 2119691. Additionally, the authors would like to express their gratitude to the RTO staff for providing the data and their valuable support throughout this research. The findings and opinions presented in this manuscript are those of the authors only and do not necessarily reflect the perspective of the sponsors and RTO.
Conflicts of Interest
The authors declare no conflicts of interest.
References
- Shuai, M.; Chengzhi, W.; Shiwen, Y.; Hao, G.; Jufang, Y.; Hui, H. Review on Economic Loss Assessment of Power Outages. Procedia Comput. Sci. 2018, 130, 1158–1163. [Google Scholar] [CrossRef]
- Andresen, A.X.; Kurtz, L.C.; Hondula, D.M.; Meerow, S.; Gall, M. Understanding the social impacts of power outages in North America: A systematic review. Environ. Res. Lett. 2023, 18, 053004. [Google Scholar] [CrossRef]
- Ghodeswar, A.; Bhandari, M.; Hedman, B. Quantifying the economic costs of power outages owing to extreme events: A systematic review. Renew. Sustain. Energy Rev. 2025, 207, 114984. [Google Scholar] [CrossRef]
- Kezunovic, M.; Obradovic, Z.; Djokic, T.; Roychoudhury, S. Systematic Framework for Integration of Weather Data into Prediction Models for the Electric Grid Outage and Asset Management Applications. In Proceedings of the Hawaii International Conference on System Sciences, Hilton Waikoloa Village, HI, USA, 3–6 January 2018. [Google Scholar]
- Ansarinejad, M.; Ansarinejad, K.; Lu, P.; Huang, Y.; Tolliver, D. Autonomous vehicles in rural areas: A review of challenges, opportunities, and solutions. Appl. Sci. 2025, 15, 4195. [Google Scholar] [CrossRef]
- Mahmood, Y.; Yasir, N.; Yodo, N.; Huang, Y.; Wu, D.; McCann, R.A. Comprehensive Risk Assessment of Power Grids Using Fuzzy Bayesian Networks Through Expert Elicitation: A Technical Analysis. Algorithms 2025, 18, 321. [Google Scholar] [CrossRef]
- Ahmed, T.; Mahmood, Y.; Yodo, N.; Huang, Y. Weather-Related Combined Effect on Failure Propagation and Maintenance Procedures towards Sustainable Gas Pipeline Infrastructure. Sustainability 2024, 16, 5789. [Google Scholar] [CrossRef]
- Ansarinejad, M.; Huang, Y.; Qiu, A. Impact of fog on vehicular emissions and fuel consumption in a mixed traffic flow with autonomous vehicles (AVS) and human-driven vehicles using VISSIM microsimulation model. Int. Conf. Transp. Dev. 2023, 2023, 253–262. [Google Scholar] [CrossRef]
- Huang, Y.; Ansarinejad, M.; Lu, P. Assessing Mobility under Inclement Weather Using VISSIM Microsimulation—A Case Study In US. In Proceedings of the 9th International Conference on Civil Structural and Transportation Engineering (ICCSTE’24), Toronto, ON, Canada, 13–15 June 2024; pp. 12–16. [Google Scholar]
- Shield, S.A.; Quiring, S.M.; Pino, J.V.; Buckstaff, K. Major impacts of weather events on the electrical power delivery system in the United States. Energy 2021, 218, 119434. [Google Scholar] [CrossRef]
- Salman, H.M.; Pasupuleti, J.; Sabry, A.H. Review on Causes of Power Outages and Their Occurrence: Mitigation Strategies. Sustainability 2023, 15, 15001. [Google Scholar] [CrossRef]
- Xu, L.; Chow, M.; Taylor, L. Data Mining and Analysis of Tree-Caused Faults in Power Distribution Systems. In Proceedings of the 2006 IEEE PES Power Systems Conference and Exposition, Atlanta, GA, USA, 29 October–1 November 2006; pp. 1221–1227. [Google Scholar]
- Nateghi, R.; Guikema, S.D.; Quiring, S.M. Comparison and Validation of Statistical Methods for Predicting Power Outage Durations in the Event of Hurricanes. Risk Anal. 2011, 31, 1897–1906. [Google Scholar] [CrossRef]
- Wang, Y.; Chen, C.; Wang, J.; Baldick, R. Research on Resilience of Power Systems Under Natural Disasters—A Review. IEEE Trans. Power Syst. 2016, 31, 1604–1613. [Google Scholar] [CrossRef]
- Jaech, A.; Zhang, B.; Ostendorf, M.; Kirschen, D.S. Real-Time Prediction of the Duration of Distribution System Outages. IEEE Trans. Power Syst. 2019, 34, 773–781. [Google Scholar] [CrossRef]
- Doostan, M.; Sohrabi, R.; Chowdhury, B. A data-driven approach for predicting vegetation-related outages in power distribution systems. Int. Trans. Electr. Energy Syst. 2020, 30, e12154. [Google Scholar] [CrossRef]
- Bashkari, M.S.; Sami, A.; Rastegar, M. Outage Cause Detection in Power Distribution Systems Based on Data Mining. IEEE Trans. Ind. Inf. 2021, 17, 640–649. [Google Scholar] [CrossRef]
- Rizvi, M. Leveraging Deep Learning Algorithms for Predicting Power Outages and Detecting Faults: A Review. AIR 2023, 24, 80–88. [Google Scholar] [CrossRef]
- Han, D.; Cho, I. Interactive Visualization for Smart Power Grid Efficiency and Outage Exploration. In Proceedings of the 2023 IEEE International Conference on Big Data (BigData), Sorrento, Italy, 15–18 December 2023; pp. 656–661. [Google Scholar]
- Fatima, K.; Shareef, H.; Costa, F.B.; Bajwa, A.A.; Wong, L.A. Machine learning for power outage prediction during hurricanes: An extensive review. Eng. Appl. Artif. Intell. 2024, 133, 108056. [Google Scholar] [CrossRef]
- Weather-Related Power Outages Rising. 2024. Available online: https://www.climatecentral.org/climate-matters/weather-related-power-outages-rising (accessed on 15 June 2025).
- Strielkowski, W.; Vlasov, A.; Selivanov, K.; Muraviev, K.; Shakhnov, V. Prospects and challenges of the machine learning and data-driven methods for the predictive analysis of power systems: A review. Energies 2023, 16, 4025. [Google Scholar] [CrossRef]
- Roy, M.-H.; Larocque, D. Robustness of random forests for regression. J. Nonparametr. Stat. 2012, 24, 993–1006. [Google Scholar] [CrossRef]
- Afrin, T.; Yodo, N.; Huang, Y. AI-Driven Framework for Predicting Oil Pipeline Failure Causes Based on Leak Properties and Financial Impact. J. Pipeline Syst. Eng. Pract. 2025, 16, 04025009. [Google Scholar] [CrossRef]
- Natekin, A.; Knoll, A. Gradient boosting machines, a tutorial. Front. Neurorobot. 2013, 7, 21. [Google Scholar] [CrossRef]
- Salman, H.A.; Kalakech, A.; Steiti, A. Random forest algorithm overview. Babylon. J. Mach. Learn. 2024, 2024, 69–79. [Google Scholar] [CrossRef]
- Probst, P.; Wright, M.N.; Boulesteix, A. Hyperparameters and tuning strategies for random forest. Wiley Interdiscip. Rev. Data Min. Knowl. Discov. 2019, 9, e1301. [Google Scholar] [CrossRef]
- James, G.; Witten, D.; Hastie, T.; Tibshirani, R.; Taylor, J. Linear regression. In An Introduction to Statistical Learning: With Applications in Python; Springer: Berlin/Heidelberg, Germany, 2023; pp. 69–134. [Google Scholar]
- Maulud, D.; Abdulazeez, A.M. A review on linear regression comprehensive in machine learning. J. Appl. Sci. Technol. Trends 2020, 1, 140–147. [Google Scholar] [CrossRef]
- Basak, D.; Pal, S.; Patranabis, D.C. Support vector regression. Neural Inf. Process.-Lett. Rev. 2007, 11, 203–224. [Google Scholar]
- Gunn, S.R. Support Vector Machines for Classification and Regression; Citeseer: University Park, PA, USA, 1997. [Google Scholar]
- Raiaan, M.A.K.; Sakib, S.; Fahad, N.M.; Al Mamun, A.; Rahman, M.A.; Shatabda, S.; Mukta, M.S.H. A systematic review of hyperparameter optimization techniques in convolutional neural networks. Decis. Anal. J. 2024, 11, 100470. [Google Scholar] [CrossRef]
- Oyedotun, O.K.; Olaniyi, E.O.; Khashman, A. A simple and practical review of over-fitting in neural network learning. Int. J. Appl. Pattern Recognit. 2017, 4, 307–328. [Google Scholar] [CrossRef]
- Chen, X.-W.; Lin, X. Big data deep learning: Challenges and perspectives. IEEE Access 2014, 2, 514–525. [Google Scholar] [CrossRef]
- Kalusivalingam, A.K.; Sharma, A.; Patel, N.; Singh, V. Enhancing Hospital Readmission Rate Predictions Using Random Forest and Gradient Boosting Algorithms. Int. J. AI ML 2012, 1. Available online: https://www.cognitivecomputingjournal.com/index.php/IJAIML-V1/article/view/129 (accessed on 15 June 2025).
- Breiman, L. Random forests. Mach. Learn. 2001, 45, 5–32. [Google Scholar] [CrossRef]
- Seber, G.A.F.; Lee, A.J. Linear Regression Analysis, 2nd ed.; Wiley: Hoboken, NJ, USA, 2003. [Google Scholar] [CrossRef]
- Ansarinejad, M.; Gaweesh, S.M.; Ahmed, M.M. Assessing the efficacy of pre-trained large language models in analyzing autonomous vehicle field test disengagements. Accid. Anal. Prev. 2025, 220, 108178. [Google Scholar] [CrossRef]
- Song, X.; Salcianu, A.; Song, Y.; Dopson, D.; Zhou, D. Fast wordpiece tokenization. arXiv 2020, arXiv:2012.15524. [Google Scholar]
- Mielke, S.J.; Alyafeai, Z.; Salesky, E.; Raffel, C.; Dey, M.; Gallé, M.; Raja, A.; Si, C.; Lee, W.Y.; Sagot, B. Between words and characters: A brief history of open-vocabulary modeling and tokenization in NLP. arXiv 2021, arXiv:2112.10508. [Google Scholar] [CrossRef]
- Yodo, N.; Afrin, T.; Yadav, O.P.; Wu, D.; Huang, Y. Condition-based monitoring as a robust strategy towards sustainable and resilient multi-energy infrastructure systems. Sustain. Resilient Infrastruct. 2023, 8, 170–189. [Google Scholar] [CrossRef]
- Guddanti, K.P.; Bharati, A.K.; Nekkalapu, S.; Mcwherter, J.; Morris, S. A Comprehensive Review: Impacts of Extreme Temperatures Due to Climate Change on Power Grid Infrastructure and Operation. IEEE Access 2025, 13, 49375–49415. [Google Scholar] [CrossRef]
- Majowicz, A.; Popli, C.; Odonkor, P. Quantifying household vulnerability to power outages: Assessing risks of rapid electrification in smart cities. J. Smart Cities Soc. 2024, 3, 237–252. [Google Scholar] [CrossRef]
- Ghasemkhani, B.; Kut, R.A.; Yilmaz, R.; Birant, D.; Arıkök, Y.A.; Güzelyol, T.E.; Kut, T. Machine Learning Model Development to Predict Power Outage Duration (POD): A Case Study for Electric Utilities. Sensors 2024, 24, 4313. [Google Scholar] [CrossRef]
- Gao, H.; Jiang, S.; Li, Z.; Wang, R.; Liu, Y.; Liu, J. A two-stage multi-agent deep reinforcement learning method for urban distribution network reconfiguration considering switch contribution. IEEE Trans. Power Syst. 2024, 39, 7064–7076. [Google Scholar] [CrossRef]
- Shang, Y.; Li, D.; Li, Y.; Li, S. Explainable spatiotemporal multi-task learning for electric vehicle charging demand prediction. Appl. Energy 2025, 384, 125460. [Google Scholar] [CrossRef]
- Chen, Y.; Fan, X.; Huang, R.; Huang, Q.; Li, A.; Guddanti, K. Artificial Intelligence/Machine Learning Technology in Power System Applications; PNNL: Richland, WA, USA, 2024. [Google Scholar] [CrossRef]
Disclaimer/Publisher’s Note: The statements, opinions and data contained in all publications are solely those of the individual author(s) and contributor(s) and not of MDPI and/or the editor(s). MDPI and/or the editor(s) disclaim responsibility for any injury to people or property resulting from any ideas, methods, instructions or products referred to in the content. |
© 2025 by the authors. Licensee MDPI, Basel, Switzerland. This article is an open access article distributed under the terms and conditions of the Creative Commons Attribution (CC BY) license (https://creativecommons.org/licenses/by/4.0/).