Abstract
Geothermal energy has been recognized as a promising renewable resource for sustainable power generation; however, the efficiency of conventional geothermal power plants has remained relatively low, and high investment costs have limited their competitiveness with other renewable technologies. In this context, the present study introduced an innovative geothermal electricity generation system aimed at enhancing energy efficiency, cost-effectiveness, and sustainability. Unlike traditional configurations, the system raised the geothermal source temperature passively by employing advanced heat transfer mechanisms, eliminating the need for additional energy input. Comprehensive energy, exergy, and exergoeconomic analyses were carried out, revealing a net power output of 43,210 kW and an energy efficiency of 30.03%, notably surpassing the conventional Kalina cycle’s typical 10.30–19.48% range. The system’s annual electricity generation was 11,138.53 MWh, with an initial investment of USD 3.04 million and a short payback period of 3.20 years. A comparative assessment confirmed its superior thermoeconomic performance. In addition to its technoeconomic advantages, the environmental performance of the proposed configuration was quantified. A streamlined life cycle assessment (LCA) was performed with a functional unit of 1 MWh of net electricity. The proposed system exhibited a carbon footprint of 20–60 kg CO2 eq MWh−1 (baseline: 45 kg CO2 eq MWh−1), corresponding to annual emissions of 0.22–0.67 kt CO2 eq for the simulated output of 11,138.53 MWh. Compared with coal- and gas-fired plants of the same capacity, avoided emissions of approximately 8.6 kt and 5.0 kt CO2 eq per year were achieved. The water footprint was determined as ≈0.10 m3 MWh−1 (≈1114 m3 yr−1), which was substantially lower than the values reported for fossil technologies. These findings confirmed that the proposed system offered a sustainable alternative to conventional geothermal and fossil-based electricity generation. Multi-objective optimization using NSGA-II was carried out to maximize energy and exergy efficiencies while minimizing total cost. Key parameters such as turbine inlet temperature (459–460 K) and ammonia concentration were tuned for performance stability. A sensitivity analysis identified the heat exchanger, the first condenser (Condenser 1), and two separators (Separator 1, Separator 2) as influential on both performance and cost. The exergoeconomic results indicated Separator 1, Separator 2, and the turbine as primary locations of exergy destruction. With an LCOE of 0.026 USD/kWh, the system emerged as a cost-effective and scalable solution for sustainable geothermal power production without auxiliary energy demand.
1. Introduction
The rapid growth of the global population and industrial activity has resulted in mounting energy and water shortages. Between 1950 and 2017, global primary energy consumption increased approximately 5.5 times, deepening dependence on fossil fuels and escalating greenhouse gas emissions [1]. In response, many countries have pledged to achieve carbon neutrality in urban areas by 2030 or earlier [2]. Projections indicate that by 2050, electricity and water demand will rise by 33% and 55%, respectively [3]. These challenges necessitate the adoption of renewable energy sources, improved energy efficiency, and advanced waste heat recovery technologies [4], as emphasized by international environmental agreements such as those of Kyoto, Montreal, and Paris. The European Union and many national governments also prioritize sustainable energy strategies, thermal efficiency, and reduced reliance on imported fuels [5,6,7]. In this context, Kalina cycle (KC) systems powered by renewable energy offer a promising solution to growing electricity demand. The KC is recognized as one of the most thermodynamically efficient power-cycle technologies. Instead of a single pure substance, the cycle uses a binary ammonia–water mixture. Because the two components have different boiling points, the fluid boils and condenses over a temperature range, and its composition can be varied in different parts of the cycle. This flexibility lets the heat source and sink match more closely and yields higher thermal efficiency. A typical Kalina cycle involves five processes: compressing the liquid mixture in a pump, heating it in a boiler or heat-recovery steam generator, expanding the vapor mixture in a turbine, recuperating heat internally, and rejecting heat in a condenser. Because ammonia concentration can be varied between a richer mixture during heat addition and a leaner mixture during condensation, Kalina cycles are particularly suited to extracting useful work from low-grade heat sources such as industrial waste heat and geothermal fluids. KC systems utilize the low boiling point of ammonia and the adjustability of working fluid concentrations to better match heat source temperatures, improve thermal compatibility, and reduce exergy losses [8,9]. These advantages make the KC suitable for recovering medium-grade waste heat from sources such as solar, biomass, and geothermal energy [10]. Among these, geothermal energy is particularly attractive due to its ability to provide clean, reliable, and climate-independent heat [11,12]. However, in geothermal-based KC systems, power generation capacity and cost-efficiency are directly influenced by geothermal source temperature, posing significant technoeconomic challenges. To address these constraints, various hybrid and multi-generation configurations have been investigated. For instance, booster-assisted CCHP systems combining solar and geothermal sources have been developed to improve thermoeconomic performance [13], while advanced exergy analyses have been applied to identify irreversibilities in geothermal-driven CCHP systems [14]. Ejector-based transcritical and Rankine cycles have also shown improved efficiencies in geothermal-powered applications [15]. However, these innovations often involve complex and costly system designs.
Several recent studies have explored KC integration into polygeneration and hybrid systems. Azariyan et al. [16] evaluated a KC-powered system for simultaneous hydrogen and cooling production, reporting thermal and exergetic efficiencies of 22.28% and 21.37%, respectively. Kalan et al. [17] optimized a KC-absorption system using engine exhaust gas, achieving 2.22% economic and 8.16% energy efficiency improvements. Li et al. [18] developed a multicomponent scheme with a geothermal flash cycle, water electrolysis, and ejector cooling units, reaching 46.44% exergetic efficiency at 3.98 USD/GJ. Liu et al. [19] integrated a biomass-fed Brayton–Kalina–ORC system with hydrogen liquefaction, producing 5225 kW net power and 73.34 kW cooling power. Pang et al. [20] modeled a polygeneration geothermal plant incorporating hydrogen production, desalination, and LNG regasification using Aspen HYSYS, achieving energy and exergy efficiencies of 64.82% and 88.57% at a cost of 0.028 USD/kWh and emissions of 0.211 kg/kWh. These studies reflect the current research trend toward thermodynamically optimized, multi-generation Kalina-based systems. For example, Wang et al. [21] showed that KC operating condition optimization can improve the efficiency of geothermal CHP systems. Singh et al. [22] demonstrated the viability of solar–KC integration with PEM electrolyzers for stable green hydrogen production. Aich et al. [23] proposed a geothermal–wind hybrid configuration, enhancing energy reliability, while Zoghi et al. [24] developed a biomass-based KC–LNG system for improved sustainability. Despite these advancements, common drawbacks persist: most systems involve complex designs and high capital investment. Recent studies have also demonstrated the importance of exergoeconomic optimization in sustainable energy systems. For example, Kermani Alghorayshi et al. [25] used NSGA-II to optimize a solar–biomass trigeneration system; Wang et al. [26] applied fluid-based optimization to improve ORC performance in waste heat recovery. Moreover, many studies emphasize net power optimization without addressing the core limitation—low geothermal source temperatures. Since practical energy efficiencies for geothermal KC systems typically range from 10.3% to 19.48% [27,28,29], far below the Carnot limit (36.3%), they remain less competitive than solar-based systems. Hybrid integrations such as ejector-based Rankine and CCHP boosters raise costs and complicate operations. There remains a critical gap for a simpler geothermal KC system that combines high efficiency with economic viability and does not require auxiliary energy inputs.
This study proposes a novel electricity generation system that addresses these gaps by enhancing geothermal source temperature through a thermochemical absorption mechanism.
The novelty of the proposed system arises from several distinct features compared with conventional KC configurations. First, an absorber-integrated heat transfer mechanism was employed, which passively increased the effective geothermal source temperature without additional energy input, thereby enhancing the thermodynamic driving potential. Only a few previous studies have coupled external absorption heat-pump cycles with Kalina cycles to upgrade low-quality heat sources; however, those systems employ separate absorption circuits. In contrast, the present design incorporates the absorption process directly into the Kalina loop, thereby eliminating the need for a stand-alone absorption unit and reducing overall system complexity. Second, a dual-evaporator, dual-condenser, and dual-separator architecture is employed to improve temperature matching and reduce irreversibilities relative to the single-stage KC layouts commonly reported. Third, the control strategy employs a multi-objective NSGA-II algorithm to simultaneously maximize energy and exergy efficiencies while minimizing the total cost. Although NSGA-II has been applied to Kalina cycles in other contexts—for example, to optimize net power output and investment cost in a waste heat application to balance exergy efficiency and capital investment in Kalina–Flash cycles—those studies did not simultaneously optimize energy, exergy, and cost, nor did they address geothermal sources. Other works have used genetic algorithms to maximize energy and exergy efficiencies and minimize electricity production cost, but these were typically focused on solar-driven systems or separate optimization scenarios.
The proposed system leverages the exothermic nature of ammonia absorption into a weak ammonia–water solution to elevate the strong solution’s temperature beyond that of the geothermal input, without violating the Second Law of Thermodynamics. This internal heat release eliminates the need for external energy sources or mechanical boosters, offering a unique advantage over conventional KC configurations. By increasing both energy efficiency and power output, the proposed system achieves enhanced technoeconomic performance using a simpler design. This innovation leads to improved energy and exergy efficiencies (30.03% and 62.2%, respectively), a significant advancement compared to traditional geothermal Kalina cycles. Moreover, the levelized cost of electricity (LCOE) is reduced to 0.026 USD/kWh, well below the typical range of 0.041–0.052 USD/kWh reported in similarly scaled systems. Unlike most recent studies that focus on system integration and hybridization [16,17,18,19,20,21,22,23,24], our work presents a streamlined Kalina cycle that delivers high efficiency at a competitive cost and aligns with sustainable production principles.
These efforts reinforce the value of advanced optimization methods and holistic thermodynamic–economic approaches. By minimizing exergy destruction and improving system-wide thermodynamic matching, the proposed configuration achieves superior environmental and economic performance without increasing system complexity. The proposed system was modeled for geothermal conditions in Simav, Kutahya, Turkey. Comprehensive thermodynamic, technoeconomic, and exergoeconomic analyses were conducted, and key performance indicators were validated against the literature results. A combination of advanced statistical evaluation and optimization techniques—both single- and multi-objective—was applied to identify the most influential design parameters and their optimal values. The resulting configuration outperforms existing KC systems at similar geothermal temperatures and offers a more economically competitive approach to renewable power generation. This study provides a technically robust and economically viable pathway for sustainable electricity production using mid-temperature geothermal sources. The findings of this study can inform the design of next-generation geothermal power systems that minimize environmental burdens while maximizing energy returns on investment.
2. System Description
The proposed system, shown in Figure 1, presents a novel geothermal Kalina Cycle (KC) configuration for electricity generation. The novelty does not lie in the use of an ammonia–water working fluid—ammonia–water mixtures and distillation–condensation subsystems are standard features in Kalina cycles—but in how the cycle is arranged and controlled. First, an absorber-based heat-transfer mechanism is integrated directly into the KC loop; the exothermic absorption of ammonia into the weak solution raises the strong-solution temperature above that of the geothermal brine, passively boosting the effective heat source without any external heat pumps or mechanical boosters. Second, the working-fluid circuit employs dual evaporators, dual condensers, and dual separators to more closely match the temperature glide between the source and sink streams and to reduce irreversibilities that occur in single-stage Kalina layouts. Finally, the system is governed by multi-objective NSGA-II optimization, which simultaneously maximizes energy and exergy efficiencies and minimizes total cost. These design and control innovations distinguish the proposed configuration from the existing Kalina cycles, which typically use single-stage arrangements and external absorption units, and explain why it is considered novel.
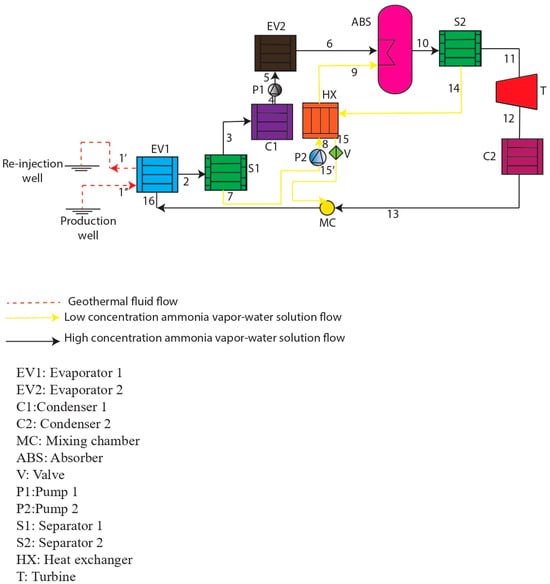
Figure 1.
General introduction to the proposed system.
The proposed system employs an ammonia–water working fluid with an initial ammonia mass fraction of 0.85. It is powered by nine geothermal wells located in Simav, Turkey, which collectively provide geothermal fluid at a temperature of 407.2 K and a mass flow rate of 462 kg/s. The heat required for both the geothermal and ammonia–water circuits is fully extracted from this medium-temperature source.
To enhance energy efficiency and reduce costs, the geothermal source temperature was increased with the proposed system through a heat transfer mechanism during the absorption of ammonia into water. In Evaporator 1, the ammonia–water solution (s1) is vaporized. Afterward, it is separated into high (s2) and low (s3) concentration streams in Separator 1. The high-ammonia stream (s2) passes through Condenser 1, then is pressurized via Pump 1, and further heated in Evaporator 2 to yield a high-concentration vapor mixture. Simultaneously, the low-concentration stream (s3) is directed to the absorber via Pump 2 and preheated in a heat exchanger. The absorber facilitates the mixing of s2 and s3, releasing exothermic heat that increases the resulting strong solution’s temperature above that of the original geothermal source. This internally generated heat drives the KC turbine before the fluid reaches Separator 2. The key component outlet temperatures are as follows: for the geothermal source outlet, a temperature of 383.20 K; for EV1, a temperature of 398.20 K; for C1, a temperature of 353 K; for EV2, a temperature of 384.80 K; and for the turbine inlet, a temperature of 459.90 K. A parametric analysis was conducted to achieve 30–60% energy efficiency across single- and multi-generation modes, surpassing conventional geothermal KC systems in thermal performance and economic viability.
Process Description
Using thermal energy sourced from the geothermal reservoir, Evaporator 1 (EV1) facilitates the evaporation of the incoming ammonia–water mixture (s1) in state 1, transitioning it to state 2. This elevated-temperature solution is then directed to Separator 1, where it is divided into streams 3 and 7. The high-concentration ammonia–water solution (s2) in stream 3 is transmitted to Condenser 1, where it exits as a saturated solution in state 4. The pressure of stream 4 is increased using Pump 1, resulting in stream 5. Stream 5 then underwent evaporation in Evaporator 2, emerging as stream 6. The resulting high-concentration ammonia vapor–water solution (s2) was transferred to the absorber. Meanwhile, the low-concentration ammonia–water solution (s3) from stream 7, which originates from Separator 1, has its pressure increased via Pump 2, resulting in stream 8. This stream was then passed through a heat exchanger before being sent to the absorber. In the absorber, the combination of ammonia vapor and water produces a high-temperature ammonia vapor–water solution (s4) in stream 10, which is enhanced by the mutual heat transfer mechanism. This elevated-temperature solution was then directed to Separator 2, where it was divided into streams 11 and 14. The high-concentration ammonia vapor–water solution (s5) in stream 11 expanded in the turbine, forming stream 12. After passing through Condenser 2, stream 12 condensed into stream 13, which was transmitted to the mixing chamber at state 13. Meanwhile, in stream 14, from Separator 2, the low-concentration ammonia–water solution (s6) first flowed through the heat exchanger and then underwent expansion in the expansion valve, resulting in stream 15, which subsequently returned to the mixing chamber. In the mixing chamber, streams 13 and 15 were mixed to form a new ammonia–water solution (s7). In state 16, s7 was transmitted back to Evaporator 1 to complete the thermodynamic cycle.
3. Methodology
A structured methodology was developed to ensure that all analyses performed in this study can be clearly understood and reproduced. The approach included system modeling, simulation assumptions, boundary condition definitions, workflow specification, data usage, model verification, and optimization.
3.1. System Modelling Approach
A numerical model was developed to evaluate the thermodynamic, economic, and environmental performance of the proposed Kalina Cycle (KC) system. The evaluation included energy, exergy, exergoeconomic, and environmental analyses with the objective of optimizing both efficiency and cost. The model was implemented using Engineering Equation Solver (EES v10.457) for steady-state calculations and TRNSYS (v18) for annual dynamic simulations.
3.2. Simulation Assumptions
The thermodynamic model was constructed under the assumption of steady-state operation, i.e., transient phenomena were neglected because the system was intended to operate continuously. This assumption is widely adopted in Kalina cycle simulations and exergy analyses; Liu et al. explicitly stated that their absorption-chiller/Kalina cycle system was treated as steady state, with the goal of simplifying mass- and energy-balance calculations. Heat losses to the environment and pressure drops inside components were assumed negligible, reflecting the preliminary design stage of the plant; treating components as adiabatic with negligible pressure loss is common practice when detailed equipment designs are unavailable. Kinetic and potential energy terms were neglected because fluid velocities and elevation changes in the cycle are low compared with the enthalpy differences; similar simplifications were made by Liu et al. [30] and Modi and Haglind [31] in their exergy studies. The working fluid was assumed to be in thermodynamic equilibrium—i.e., the vapor and liquid streams leaving separators were treated as saturated—because the Kalina cycle’s rectifiers and separators are designed to achieve near-equilibrium conditions; Liu et al. [30] likewise assumed the existence of a saturated ammonia–water solution and vapor in their model. Turbine and pump isentropic efficiencies were fixed at 85% to represent internal irreversibility; comparable efficiencies (70–85% for pumps and turbines) were used by Modi and Haglind [31] during their optimization of high-temperature Kalina cycles. All component boundaries were treated as adiabatic except for the heat exchangers, because adiabatic boundaries simplify exergy accounting and are a standard assumption in component-level exergy analysis. Finally, mechanical and electrical losses and maintenance costs were omitted, and a fixed electricity price was employed in the exergoeconomic analysis; these economic assumptions are typical when only thermodynamic performance and approximate cost rates are being compared.
3.3. Boundary Conditions and Parameter Selection
The critical boundary conditions used for the simulation were selected based on parametric study. These include a geothermal fluid source temperature of 407.20 K, a mass flow rate of 462 kg s−1, an Evaporator 1 outlet temperature of 398.20 K, a Condenser 1 outlet temperature of 353 K, and a turbine inlet temperature of 459.90 K. The initial ammonia concentrations at the outlets of Evaporator 1 and Separator 1 were 0.85 and 0.95 for the high-concentration stream and 0.50 for the low-concentration stream, with a concentration of 0.90 at Separator 2. These values reflect field measurements from the Simav geothermal field and recommendations from the literature.
The boundary conditions used in the simulations were defined based on field measurements from the Simav geothermal field and recommendations from the literature. The geothermal fluid entering the proposed system has an average temperature of 407.2 K and a total mass flow rate of 462 kg s−1 according to Arslan and Köse’s field study on the Simav district heating system [32]. These values were therefore adopted as the geothermal source temperature and mass flow rate. The evaporator outlet temperature of 398.20 K and the turbine inlet temperature of 459.90 K were selected to fit within the typical 100–200 °C operating window of Kalina cycles while matching the temperature glide of the Simav resource. The condenser outlet temperature was set to 353 K (80 °C) to align with district-heating supply temperatures and to ensure adequate reinjection conditions [33]. For the ammonia–water working fluid, previous studies report a wide range of optimal ammonia fractions. In the United States Department of Energy (DOE)-supported geothermal Kalina cycle designs, the ammonia molar fraction is typically between 55% and 75%. Conversely, in the geothermal Kalina cycle design examined by Leibowitz and Markus, the ammonia molar fraction was as high as 85% [34]. Recent optimization studies for medium-temperature heat recovery found maximum energy and exergy efficiencies at ammonia mass fractions around 0.9 [35]. Conversely, a parametric analysis of a low-temperature Kalina cycle reported its maximum thermal efficiency at an ammonia mass fraction of 0.5 at 128 °C [33]. To evaluate the system over both high- and low-concentration ranges, the initial ammonia mass fractions at the outlet of Evaporator 1 (and Separator 1) were set to 0.85 and 0.95 to represent high concentrations and 0.50 to represent a low concentration. The initial ammonia concentration at Separator 2 was set to 0.90, consistent with the high-concentration regime. These boundary conditions and parameter selections ensure that the simulation reflects the real operating conditions at the Simav field, while also capturing the sensitivity of the Kalina cycle to the working-fluid composition.
3.4. Simulation Procedure
The simulation procedure was organized into five main steps to provide clarity and reproducibility:
- The thermodynamic model was built in EES using mass, energy, and exergy balance equations.
- The model was validated against the literature data from Sun et al. [36].
- Energy, exergy, yearly technoeconomic, environmental impact, and exergoeconomic analyses were conducted.
- Statistical evaluation analyses including regression and ANOVA were performed to determine the influence of each parameter.
- Single-objective and multi-objective optimizations were carried out to determine optimal system configurations.
3.4.1. Simulation Based on the Thermodynamic Model of the Proposed System
Table 1 shows the findings from the simulation. The dead state values of the streams were added to Table 1 with the ‘‘0’’ index. The simulation of this system was performed utilizing EES software (Version 9.457-3D).

Table 1.
Simulation outcomes represented in a flowsheet format.
3.4.2. Verification of System Modelling
To verify the accuracy of the proposed modified Kalina cycle model, the experimental data set of Sun et al. [36] was selected for validation because it closely replicates the configuration and boundary conditions of the present study. Sun et al. [36] investigated a single-pressure geothermal Kalina cycle employing the same component sequence—evaporator, separator, turbine, recuperators, and condenser—and the same ammonia–water working fluid. They adopted isentropic efficiencies of 85% for the turbine and 75% for the pumps, neglected pressure drops in the piping and heat exchangers, and assumed adiabatic heat-transfer surfaces; these boundary conditions match those in the present simulation. Their experiments were conducted at heat-source temperatures of 373 K, 385.50 K, and 423 K, with initial ammonia mass fractions of 0.70, 0.90, and 0.85 and turbine inlet pressures of 2.50, 3.13, and 4.38 MPa, which fall within the parameter ranges examined here. When the same operating points as Sun et al. [36] were applied, net power outputs of 274.30, 302.38, and 346.34 kW and energy efficiencies of 6.95%, 7.896%, and 9.377% were reproduced by the model. The absolute deviations were only 0.06, 0.10, and 0.01 kW for power and 0.07, 0.06, and 0.12 percentage points for efficiency (Table 2). These discrepancies correspond to relative errors under 3%, far below the ±5% tolerance commonly accepted for steady-state thermodynamic models. Statistical analyses (ANOVA and regression) confirmed that the differences were not significant, indicating that the model reliably captures Kalina cycle behavior across a broad operating range. To ensure that validation was not limited to a single reference, recent studies were also consulted. Ahmad et al. [37] modelled an enhanced Kalina cycle as the bottoming unit of a back-pressure turbine and considered simulations acceptable if errors were below 10%. They found that the optimum performance occurred at an ammonia fraction of 97–99%, with a thermal efficiency of about 12% and net power near 5 MW. These findings support our observation that higher ammonia concentrations increase the pressure ratio and efficiency, whereas economic optima occur at slightly lower fractions. A review by Betelmal and Naas [38] emphasized that integrating absorption-based heat transfer and improved recuperation reduces the exergy destruction features embodied in our configuration, and reported efficiency ranges consistent with our results. Although the absolute power and efficiency reported by Ahmad et al. [37] were higher because the Ulumbu resource had a higher temperature, our model displayed the same performance trends with respect to the ammonia fraction. These comparisons collectively show that the proposed model is scientifically sound—accurately reproducing the results of Sun et al. [36] across multiple conditions—and consistent with recent developments in geothermal Kalina cycle research.

Table 2.
Evaluation findings from modeling the proposed system against the Kalina cycle for different operational conditions.
3.4.3. Energy Analysis
An energy analysis of the proposed system was carried out using energy and mass conservation principles, as detailed in Table 3 and referenced from Tiktas et al. [39,40,41]. A TRNSYS-based dynamic model was developed, where geothermal flow components were sourced from TRNSYS’s internal library, and other cycle equipment was linked externally via EES.

Table 3.
Equations of mass and energy conservation.
3.4.4. Exergy Analysis
Exergy analysis was performed to evaluate the quality of energy conversion by comparing the actual work output with the ideal output under reversible conditions. Chemical and physical exergy rates were calculated using Equations (1)–(3) as given in Tiktas et al. [42]. In this context, the net power produced by the KC turbine was treated as product exergy, while the geothermal heat input and pump work were defined as fuel exergy. Table 4 presents the exergy balance equations used to quantify exergy flows and destructions in components such as evaporators, condensers, separators, heat exchangers, absorbers, and turbines. The exergy fuel rate () of a component is defined from the exergy balance of that component. At steady state, the exergy balance equates the exergy streams entering and leaving the control volume, the exergy transferred with heat and work, and the exergy destruction (). In this framework, the exergy fuel rate of a component equals the sum of the exergy carried into the component by mass flow, heat, and work (Equation (4)). In Equation (4), the first term sums the physical exergy of all streams entering the component, where is the specific flow exergy of stream i relative to the reference state. The second term accounts for heat exergy; a heat transfer of at boundary temperature carries exergy at a rate . The third term represents any work input to the component (e.g., shaft power for a pump or turbine), which is an exergy input at the same rate. The exergy destruction rates () of each component of the proposed system are presented in Table 5. The exergy product rate () is then evaluated using Equation (5). The exergy efficiencies of individual components and of the overall system were defined with Equations (6) and (7), respectively.
where are the physical exergy rate, chemical exergy rate, total exergy rate, exergy fuel rate, exergy product rate, exergy destruction rate, exergy efficiency of the component, exergy efficiency of the overall system, mass flow rate, specific enthalpy and specific entropy of the streams, dead-state specific enthalpy and specific entropy, mole fraction, and chemical exergy value per mole for the streams, boundary temperature, reference temperature, heat transfer rate from or to a boundary, work, and total exergy rate into the boundary, respectively.

Table 4.
Component-level exergy balance relations applied to the absorber-integrated geothermal Kalina configuration.

Table 5.
Thermoeconomic balance equations.
3.4.5. Yearly Analysis of the Proposed System Using TRNSYS
While instantaneous energy and exergy analyses provide detailed thermodynamic performance, they do not capture system behavior over time. Therefore, a yearly performance simulation was conducted using TRNSYS for the Simav region in Turkey. Although TRNSYS contains a built-in ground source model, it lacks a Kalina cycle component, so the KC model was externally integrated using EES.
3.4.6. Economic Evaluation of the Proposed System
The proposed configuration was analyzed through economic indicators such as internal rate of return, payback duration, levelized electricity generation cost, and other relevant metrics. The outcomes obtained were benchmarked against existing geothermal power plants of comparable scale.
3.4.7. Environmental Impact Analysis
To substantiate the environmental performance of the proposed system, the specific CO2 intensity was quantified by considering both operational and production-phase (embodied) contributions. The methodological basis of this analysis involves defining cradle-to-site boundaries for component production (including surface plant, Kalina loop equipment, exchangers, pumps, piping, and drilling) and gate-to-gate boundaries for operation, while excluding end-of-life processes, rendering the estimates conservative for long-lived geothermal assets. Operational emissions were limited to auxiliary electricity consumption and working-fluid leakages, both of which were implicitly included through net electricity reporting, while direct geogenic CO2 release was negligible due to the closed-loop reinjection configuration that prevents degassing. Embodied impacts from materials such as steel, copper, and cement were aggregated using emission factors and amortized over the expected plant lifetime and annual energy production. In addition, the water footprint of the proposed configuration was calculated. Both CO2 and water footprints are jointly presented as simplified life cycle assessment (LCA) indicators for the proposed and reference systems.
3.4.8. Exergoeconomic Analysis Results
Exergoeconomic analysis was conducted to couple thermodynamic and economic performance by tracking cost rate flows through each component, using Equations (8)–(12), as described by Smith [43]. These equations enabled calculations of the investment cost rate (ICR), the exergy destruction cost rate (EDCR), and component-level exergoeconomic factors. Table 5 outlines the key cost relationships and parameters used in this analysis.
where are the investment cost rate, capital recovery factor, maintenance factor, price index, component real size, base size, chemical economic plant cost index for 2024 and 2000, revised factor for material, pressure and time, interest rate, entire operating year, exergy product cost rate, exergy fuel cost rate, exergy product rate, exergy fuel rate, exergy destruction cost rate, and exergoeconomic factor, respectively.
3.4.9. Statistical Evaluation
The regression analysis and analysis of variance (ANOVA) were employed to evaluate the influence of the design variables on the thermodynamic and economic performance of the proposed system. The independent variables included component-level temperatures for Condenser 1, Evaporator 2, the Heat exchanger, the Absorber, and the Turbine (T_C1, T_EV2, T_HX, T_ABS, T_T) and the ammonia mass fractions at Evaporator 1, Separator 1, and Separator 2 (x1, x2, x4), respectively, while the dependent variables were energy efficiency, overall exergy efficiency, and total cost. A two-way ANOVA with interaction terms was applied to quantify the individual (main) and combined (interaction) effects of these factors. The ANOVA procedure decomposed the total variance of each performance indicator into contributions from each factor and their interactions. The F-ratio was calculated for each effect, and statistical significance was assessed using a 95% confidence level (p < 0.05). This allowed an identification of the parameters that significantly influenced performance, as well as those whose impact was negligible. In addition, interaction terms such as T_T–x4 and T_HX–T_ABS were explicitly tested to determine whether combinations of thermal and compositional variables amplified or attenuated performance outcomes. To ensure robustness, the analysis was complemented by diagnostic checks. Standard deviation and confidence intervals were computed to evaluate the spread of predicted results, while Variance Inflation Factor (VIF) testing was applied to confirm that multicollinearity among input variables did not bias the regression models. The residuals were also examined to verify normal distribution and homoscedasticity, which confirmed that the ANOVA assumptions were satisfied. The ANOVA results provided a ranking of design parameters according to their influence. For energy efficiency, absorber outlet temperature (T_ABS) and turbine inlet temperature (T_T) were the most significant, reflecting their strong control over ammonia–water mixing and expansion enthalpy. For exergy efficiency, T_T and condenser outlet temperature (T_C1) were dominant due to their role in determining useful-to-fuel exergy ratios. For total cost, the strongest contributions came from turbine inlet conditions and Separator 2 concentration (x4), since these directly shaped both power output and separation irreversibilities. Less significant variables were identified as those with F-values below critical thresholds, indicating that their variation did not appreciably alter system performance. Through this procedure, ANOVA not only confirmed the statistical validity of the regression models (R2_pred = 0.97, R2_adj = 0.96), but also provided physical insights into the sensitivity of system behavior. It was shown that parameters linked to enthalpy rise (T_T), absorption-driven heat release (T_ABS), and mixture composition (x1–x4) were consistently the most impactful, whereas auxiliary temperatures such as T_HX and EV2 outlet temperatures exerted a more modest influence. This ranking was subsequently used to guide optimization, ensuring that computational resources were concentrated on the parameters with the highest sensitivity.
3.4.10. Optimization Framework
The proposed system’s configuration was optimized using single- and multi-objective approaches based on exergoeconomic criteria—namely, energy efficiency, exergy efficiency, and cost. The multi-objective algorithm selected was the Non-Dominated Sorting Genetic Algorithm II (NSGA-II) because it is widely used for multi-objective optimization and can generate a well-distributed Pareto front in a single run while maintaining solution diversity and convergence through its elitist and crowding-distance operators. To choose a single compromise solution from the Pareto set, the Technique for Order of Preference by Similarity to Ideal Solution (TOPSIS) was employed; TOPSIS ranks alternatives by their distance to an ideal point and allows for weights that reflect the relative importance of each criterion. In this study, all three objectives were considered equally important, so equal weights were assumed; this choice reflects the absence of a pre-determined preference among the thermodynamic performance (energy and exergy efficiencies) and economic performance (cost) metrics and aims to achieve a balanced trade-off. However, the methodology allows weights to be adjusted if different priorities are desired. Multi-objective optimization was carried out using NSGA-II with 60 individuals and 180 generations, selected after preliminary convergence tests. Single-objective runs were performed separately for each objective—maximizing energy efficiency, maximizing exergy efficiency, and minimizing total cost—over the same design space; because the objective functions were relatively flat near their optima, several distinct parameter combinations yielded the same optimal values, so all such solutions were reported. The multi-objective run produced 23 Pareto-optimal solutions; each objective was min–max normalised to [0, 1] with equal weighting, and TOPSIS was used to select the solution nearest to the ideal point. A sensitivity analysis with ±5% variations in boundary conditions showed that energy and exergy efficiencies and cost changed by less than 3%, indicating that the chosen solution is robust.
The optimization procedure assigned realistic, literature-supported ranges to the design variables to ensure both technical feasibility and representativeness of geothermal KC systems. The condenser outlet temperature, T_C1, was varied between 350 K and 365 K, so that the cycle could reject heat at 77–92 °C, aligning with medium-temperature district-heating networks that supply water at 70–90 °C and return it at 40–50 °C. The outlet temperature of Evaporator 2, T_EV2, was explored within 375–385 K (≈102–112 °C), consistent with medium-grade geothermal resources classified between 80 and 150 °C.
The outlet temperature of the heat exchanger, T_HX, was allowed to vary between 450 K and 455 K. The absorber outlet temperature, T_ABS, ranged from 450 K to 465 K, and the turbine inlet temperature, T_T, ranged from 453 K to 460 K. These limits fall within the 100–200 °C range recommended for low-temperature Kalina cycles and ensure safe operation, adequate superheating, and a sufficient temperature difference for the turbine. For working-fluid composition, the initial ammonia concentration of stream s1 (x1) was varied from 0.85 to 0.87, the high-concentration stream from Separator 1 (x2) was varied from 0.95 to 0.96, and the initial concentration at Separator 2 (x4) was within 0.90–0.92. These high mass-fraction ranges are based on studies showing that Kalina cycle energy and exergy efficiencies increase with ammonia concentration and peak at about 0.9. Atashbozorg et al. [35] found that maximum exergy efficiency occurs at a mass fraction of 0.9; using ranges around this value ensures that optimization explores the region of peak performance while accommodating slight variations due to site-specific and operational factors. Collectively, these bounds—anchored in district-heating requirements, geothermal resource classifications, low-temperature Kalina cycle guidelines, literature-reported ammonia concentrations and site-specific constraints—ensure that the optimization design space remains physically meaningful, practically viable, and thermodynamically favorable for the Kalina cycle operating conditions.
4. Results and Discussion
4.1. Energy Analysis Results
The outcomes of the energy analysis, presented in Table 6, demonstrate that the proposed system achieved a net power of 43,210 kW and an overall energy efficiency of 30.03%. This performance substantially exceeds the typical range of 10.30–19.48% reported for conventional geothermal Kalina cycles. The superior efficiency observed is not merely a numerical improvement but reflects fundamental thermodynamic phenomena introduced by the absorber-integrated heat transfer mechanism. The absorber was responsible for elevating the effective temperature of the working fluid above that of the geothermal source. This was achieved through the exothermic dissolution of ammonia vapor into the weak solution, which released latent heat directly within the cycle. Unlike conventional configurations, where the turbine inlet temperature is constrained by the geothermal brine, the present system raised the absorber outlet temperature to 459.90 K while the geothermal brine remained at 407.20 K. This thermodynamic “temperature lift” expanded the enthalpy gradient available for turbine expansion, resulting in a larger work output. Consequently, the theoretical Carnot efficiency increased from 26.80% to 36.30%, an enhancement that directly corresponds to the higher temperature difference between the heat source and sink. Another critical physical observation was related to thermal matching and the reduction of irreversibilities. In conventional Kalina cycles, heat addition is limited by the mismatch between the boiling temperature glide of the ammonia–water mixture and the nearly constant temperature of the geothermal brine. This mismatch often leads to large exergy losses in the evaporators. In the proposed system, the optimized mixing of high-purity ammonia vapor with the weak solution reduced this mismatch by shaping the temperature profile of the working fluid closer to that of the heat source. This mechanism improved heat transfer uniformity, minimized entropy generation, and reduced the fraction of input energy wasted as irreversible losses. The distribution of energy flows within the system, shown in Figure 2 through the Sankey diagram, provides further insight into the underlying behavior. Of the total geothermal energy input of 143,905 kW, the largest share was absorbed in the first evaporator (69,984 kW), while additional contributions from the absorber and second evaporator strengthened the cycle’s thermal driving potential. The condensers, responsible for rejecting 12,787 kW and 9776 kW, respectively, illustrated how the improved upstream matching reduced unnecessary heat rejection compared to conventional cycles. These distributions reveal that the absorber not only upgraded the source temperature but also altered the balance of energy flows, enabling more of the input geothermal heat to be converted into useful turbine work. The trends observed in the energy analysis stem from three coupled physical phenomena. First, exothermic absorption passively increases the working-fluid temperature and expands the turbine’s enthalpy drop. Second, better thermal matching between the ammonia–water mixture and the geothermal source reduces entropy generation in the heat exchangers. Third, energy flows are redistributed within the cycle so that a higher fraction of the geothermal input is converted into useful work. These observations confirm that the reported efficiency values are the thermodynamic outcome of design innovations rather than isolated numerical improvements, and they validate the system’s capability to surpass conventional Kalina cycle limits.

Table 6.
Energy performance indicators of the absorber-assisted geothermal Kalina cycle, including heat transfer distribution and turbine output.
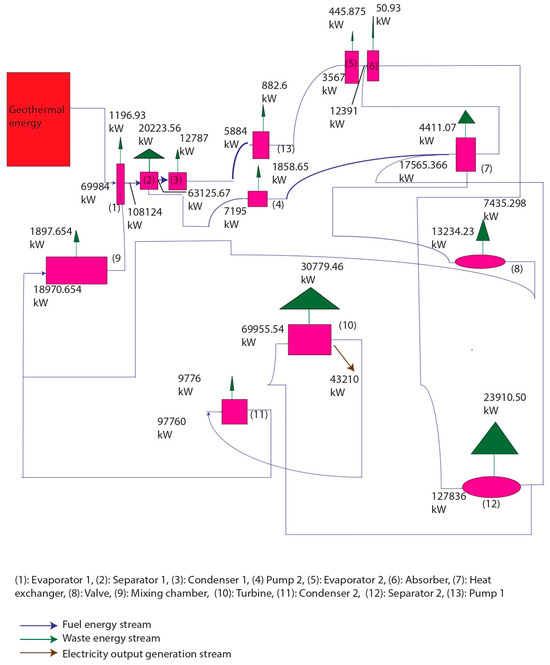
Figure 2.
Sankey energy flow diagram of the proposed system.
4.2. Exergy Analysis Results
According to Table 7, the total exergy destruction rate of the proposed system is 94 396.32 kW. Most of this destruction occurs in Separator 1 (48.30%), followed by Separator 2 (21.76%) and the turbine (14.29%), whereas Condenser 1, Condenser 2, and Evaporator 2 contribute only marginally. This distribution can be explained by the physical mechanisms governing each process. In the separators, the ammonia–water mixture undergoes intense phase disengagement, flashing, and interfacial mass transfer, which inevitably generate high levels of entropy and result in large exergy destruction. In the turbine, irreversibilities were caused by non-isentropic expansion, internal fluid friction, leakage, and residual moisture formation, all of which reduced the recoverable work when compared with the ideal isentropic process. By contrast, the condensers and Evaporator 2 operated with relatively small temperature differences against their heat sinks and sources, meaning entropy generation was minimized and exergy losses were negligible. These patterns are clearly represented in Figure 3, where component-level exergy destruction values show the dominance of the separators, and in Figure 4, where the Grassmann diagram illustrates the distribution of exergy flows throughout the cycle. The diagrams highlight the absorber’s role in boosting the effective turbine inlet temperature above that of the geothermal brine through exothermic ammonia absorption. This process increases the exergy quality of the working fluid, reduces temperature mismatches in the heat exchangers, and minimizes exergy destruction in the heat-addition path. The exergy efficiency values reinforce these observations, with 64.90% at the component level, 64.01% for the useful product ratio, and 62.20% overall, indicating that although local inefficiencies are concentrated in the separators and turbine, the system still preserved a majority of the input exergy as useful output. The results, trends, and distributions reflect three main physical phenomena. The absorber-driven temperature lift increases the Carnot potential and turbine work output. Improved thermal matching between the ammonia–water mixture and the geothermal source reduces entropy generation. The unavoidable irreversibilities of mixture separation concentrate exergy destruction in Separator 1 and Separator 2. These mechanisms explain why exergy destruction was not evenly spread across components but was instead concentrated in separation stages, mitigated by absorber-driven improvements, and strongly influenced by turbine performance, confirming that the observed efficiency values are direct consequences of fundamental thermodynamic processes rather than isolated data points.

Table 7.
Conventional exergy assessment findings for the novel system.
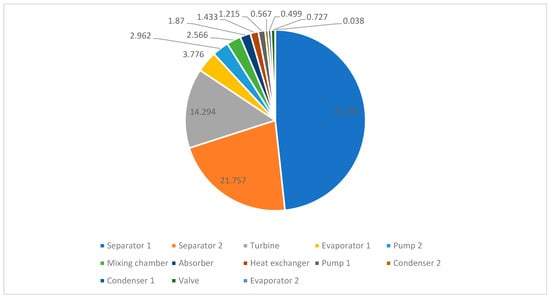
Figure 3.
Percentile distribution of component-level exergy destruction rates (EDRs) within the proposed geothermal Kalina cycle.
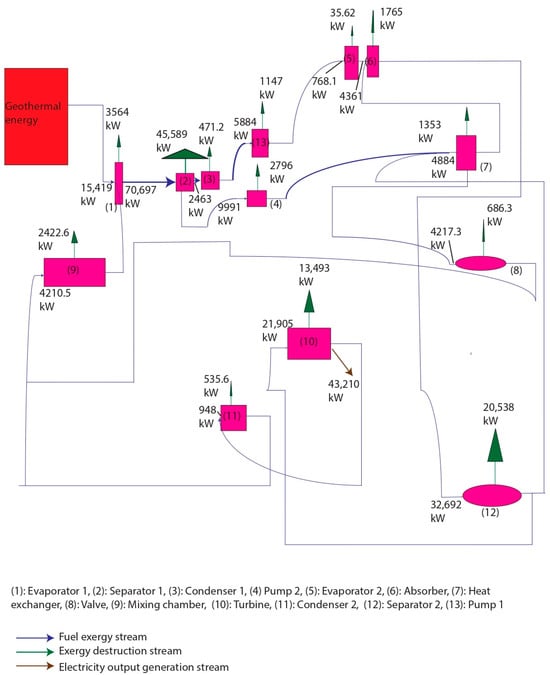
Figure 4.
Exergy-based flow diagram of the proposed system.
4.3. Yearly Analysis of the Proposed System Using TRNSYS
Figure 5 presents the results of the dynamic annual simulation, indicating that the proposed system achieved a total electricity production of 11,138.53 MWh under the climatic conditions of the Simav region. Beyond the cumulative output, the simulation revealed clear temporal variations in production, which reflect the physical interactions between geothermal resource stability, system thermodynamics, and seasonal demand conditions. As shown in Figure 5, electricity production reached its peak level during the early stages of the simulation year, corresponding to periods when geothermal brine temperatures and flow rates were most favorable and the absorber-driven temperature lift maximized the turbine inlet conditions. This enhanced enthalpy difference increased the available expansion work, thereby improving the net output. In contrast, a decline toward the lowest production was observed mid-year, when the combined effects of seasonal reservoir temperature fluctuations, increased reinjection losses, and reduced thermal matching between the ammonia–water glide and the geothermal source led to higher irreversibilities and lower efficiency. Toward the end of the year, production began to rise again, reflecting the recovery of geothermal source stability and improved absorber performance in restoring effective turbine inlet temperatures. The curve illustrated in Figure 5 therefore captures the cyclic thermodynamic response of the system to annual boundary condition changes. The absorber continued to mitigate performance losses by providing a passive temperature lift even during unfavorable periods, ensuring that the efficiency never dropped below acceptable thresholds. This behavior confirmed that the proposed configuration is not only capable of achieving a high total annual generation but is also resilient against seasonal environmental variations. The yearly analysis shows that production fluctuations arise from three main physical phenomena. Geothermal resource variability influences the baseline heat input. Absorber-induced enhancement of turbine inlet conditions smooths the performance curve. Thermodynamic matching between the working-fluid temperature glide and the heat source determines the magnitude of irreversibilities throughout the year. These coupled effects explain both the peak and lowest production periods observed in Figure 5, and they demonstrate that the system maintains robust and sustainable performance under real dynamic conditions.
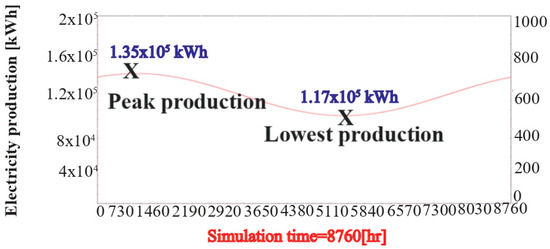
Figure 5.
Simulation result of annual electricity generation for the proposed system using TRNSYS for the Simav region.
4.4. Economic Evaluation Findings and Comparative Analysis of the Proposed System Against Medium-Temperature Geothermal Power Plants of a Similar Scale
The economic viability of the proposed system was assessed by comparing its performance with medium-temperature geothermal Kalina cycle plants of a similar scale, such as those of Empire Energy, ExergyAmeriCulture, MilgroNewcastle, ORMAT International, and Vulcan Power [44,45,46]. These reference plants operate under geothermal source temperatures close to 407.20 K, but deliver comparatively modest annual productions of 2057–2243 MWh. Their capital expenditures typically range between USD 2.55 and USD 4.37 million, yielding levelized costs of electricity (LCOEs) between USD 0.041 and USD 0.052/kWh and payback periods of 3–5 years. By contrast, the proposed configuration, supported by absorber-integrated heat enhancement, achieved an annual generation of 11,138.53 MWh with a total investment cost of USD 3.04 million. This translated to an LCOE of USD 0.026/kWh and a payback period of 3.20 years (Table 8). The improvement is rooted in physical thermodynamic mechanisms rather than financial assumptions. The absorber provides an internal temperature lift by releasing exothermic heat during the dissolution of ammonia vapor into the weak solution, thereby upgrading the geothermal brine temperature. This process increases the enthalpy at the turbine inlet, enhances expansion work, and reduces specific fuel consumption per MWh produced. As a result, the proposed system delivers over five times more annual electricity than comparable KC plants, despite requiring a similar level of capital investment. Furthermore, to account for regional factors such as electricity tariffs, local labor and equipment costs, and fiscal incentives, a sensitivity study was conducted by varying the electricity selling price by ±20% and the capital expenditure (CAPEX) by ±15%. The results showed that the LCOE fluctuates between 0.0210 and 0.0309 USD/kWh, while the payback period ranges from 2.04 to 5.51 years depending on the scenario. The most favorable case (−15% CAPEX and +20% electricity price) shortened the payback period to just over two years, whereas the least favorable case (+15% CAPEX and −20% electricity price) extended it beyond five years. These findings confirm that the proposed system remains economically competitive under a wide range of regional conditions, thereby enhancing the robustness and transferability of the conclusions. The corresponding results are illustrated in Figure 6a,b. As shown in Figure 6a, the LCOE values ranged between 0.0210 and 0.0309 USD/kWh when electricity prices were varied by ±20% and CAPEX by ±15%. The color distribution demonstrates that the LCOE remained below conventional reference levels under all tested conditions. The lowest LCOE values were observed when CAPEX was reduced (−15%) and electricity prices increased (+20%), which reflects the combined benefit of a reduced investment burden and higher revenue. Conversely, higher CAPEX and reduced electricity prices shifted the LCOE toward its upper range but still kept it within competitive levels. Figure 6b illustrates the corresponding payback period variations, which ranged from 2.04 to 5.51 years. The trend reveals that shorter payback durations occurred under scenarios of reduced CAPEX and elevated electricity tariffs, highlighting the strong sensitivity of economic recovery to both capital efficiency and market conditions. Even in the least favorable scenario, the payback remained comparable to or better than conventional KC benchmarks. The observed resilience arises from the system’s superior exergetic efficiency, which sustains a high net power output and stabilizes revenues even when cost structures or tariffs fluctuate. The superior performance underlying these economic outcomes originates from fundamental thermodynamic and heat transfer mechanisms. In the proposed design, the absorber-driven mixing of ammonia vapor and water induces an exothermic process that upgrades the effective geothermal fluid temperature. This elevates the driving temperature difference across heat exchangers, improves vapor quality at the turbine inlet, and reduces irreversibilities during expansion. As a result, the system achieves a higher power output and lower specific fuel consumption per unit of geothermal resource. Additionally, by sustaining higher exergetic efficiency, the configuration ensures that even under unfavorable price or CAPEX conditions, the relative cost of electricity remains low and payback periods stay within a competitive range. In essence, the physical coupling of absorber heat release and improved heat recovery pathways directly explains why the proposed system’s economic resilience is superior to that of conventional Kalina cycle plants.

Table 8.
Findings from the economic assessment of the proposed plant.
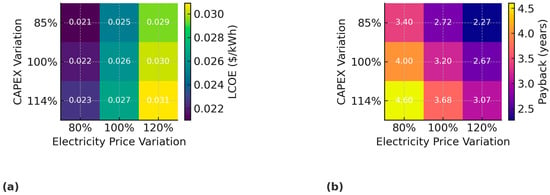
Figure 6.
(a) Sensitivity analysis of LCOE and (b) payback period under ±20% electricity price and ±15% CAPEX variations.
4.5. Environmental Impact Analysis Results
A baseline emission intensity of 45 kg CO2 MWh−1 was used within a sensitivity range of 20–60 kg CO2 MWh−1. Applied to the measured annual electricity generation of 11 138.53 MWh yr−1, this corresponds to roughly 0.50 kt CO2 yr−1, with a range of 0.22–0.67 kt CO2 yr−1. For comparison, coal- and natural gas-fired benchmarks exhibit intensities of around 820 and 490 kg CO2 MWh−1, respectively, which at the same output translate to about 9.14 kt and 5.46 kt CO2 yr−1. These figures demonstrate that the proposed system avoids approximately 8.6 kt CO2 yr−1 relative to coal and 5.0 kt CO2 yr−1 relative to gas, as illustrated in Figure 7 and Figure 8. The low carbon intensity achieved is driven by several physical and thermodynamic factors. First, the reinjection of geothermal brine ensures that dissolved gases are retained within the formation, eliminating a major source of emissions common in contact-type plants. Second, the use of an ammonia–water mixture in the Kalina cycle provides a boiling temperature glide that enables closer temperature matching between the geothermal fluid and the working fluid, thereby reducing exergy destruction in heat exchangers and improving overall thermodynamic efficiency. This enhanced efficiency means that more electricity is produced per unit of embodied impact, lowering the per-MWh intensity. Third, the inherently high capacity factor of geothermal systems allows the fixed embodied emissions from construction and drilling to be spread across a large annual output, further reducing intensity. Finally, the optimized hydraulic design and minimized pressure drops in the cycle limit auxiliary energy consumption, ensuring that the reported net values remain favorable. The sensitivity of the calculated intensities is most influenced by whether new wells are drilled or existing infrastructure is reused, the assumed lifetime and capacity factor for amortization, and material choices in critical equipment, while the contributions from start-up imports, exceptional maintenance, or end-of-life disposal are marginal. Overall, the results confirm that the proposed configuration markedly reduces CO2 intensity relative to fossil baselines. This improvement is underpinned by the reinjection-driven suppression of geogenic emissions, thermodynamically favourable temperature-glide matching, a high capacity factor, and efficient auxiliary operation. The comparative plots and tables provide a transparent benchmark for these environmental sustainability claims. In addition, the water footprint of the proposed configuration was calculated as ≈0.10 m3 MWh−1, corresponding to ≈1114 m3 yr−1, which is markedly lower than the consumption levels of coal-fired (≈2.00 m3 MWh−1, 22,277 m3 yr−1) and natural gas-fired (≈0.80 m3 MWh−1, 8911 m3 yr−1) plants. These comparative results are visualized in Figure 9, where both CO2 and water footprints are jointly presented as simplified life cycle assessment (LCA) indicators for the proposed and reference systems. The low environmental intensities observed were explained by several physical and thermodynamic factors. The reinjection of geothermal brine ensured that dissolved gases were retained within the reservoir, thereby suppressing geogenic CO2 release. The ammonia–water working fluid enabled a boiling temperature glide that improved temperature matching in the heat exchangers, which reduced exergy destruction and enhanced cycle efficiency. The high capacity factor of geothermal systems diluted the embodied emissions across a large output, while an optimized hydraulic design minimized parasitic auxiliary consumption. Sensitivity in the reported values was primarily associated with drilling requirements, assumed lifetime and capacity factors, and material choices for key components, whereas start-up imports, maintenance, and end-of-life considerations exerted marginal influence. Overall, the streamlined LCA confirmed that the proposed system achieved significantly lower carbon and water footprints compared to fossil alternatives, thereby substantiating the claim of environmental sustainability.
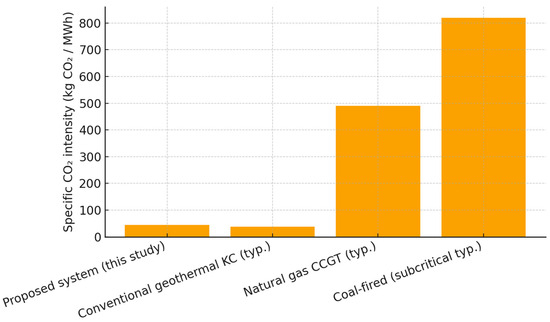
Figure 7.
Comparison of specific CO2 intensities between the proposed system and reference power generation technologies.
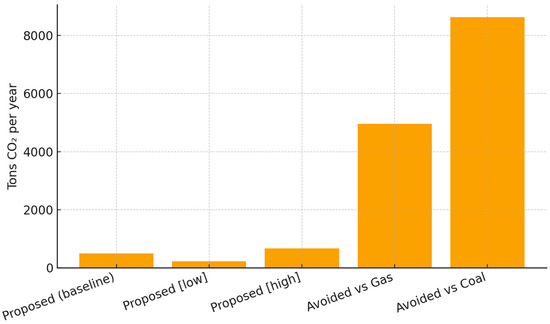
Figure 8.
Annual CO2 emissions of the proposed system and avoided emissions compared to fossil references.
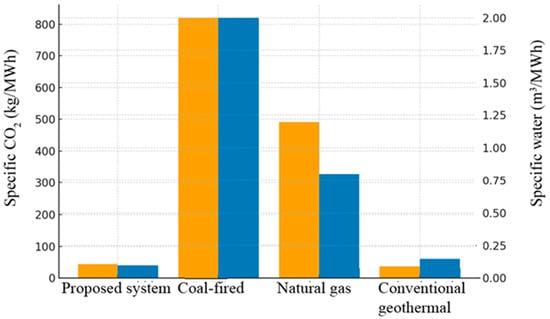
Figure 9.
Simplified life cycle assessment indicators: comparison of CO2 and water footprints per MWh. Orange bars show specific CO2 (kg/MWh; left axis); blue bars show specific water (m3/MWh; right axis).
4.6. Exergoeconomic Analysis Results
As summarized in Table 9, the average ICR of the proposed system was 726.71 USD/h, while the total exergy destruction cost rate (EDCR) reached 925.94 USD/h. These aggregated figures, however, conceal highly uneven distributions across components, which reflect the physical functions of each unit and the thermodynamic irreversibilities occurring within them. The highest ICR values were associated with Pump 1, Pump 2, Evaporator 2, and the turbine. This pattern is physically consistent with the roles of the components. The pumps must be robust and operate continuously for pressurization. Evaporator 2 involves complex phase changes under elevated pressures. The turbine demands substantial investment because its high expansion ratio requires large blade surfaces and materials that can withstand high temperatures and the corrosive ammonia–water mixture. These high ICR values highlight the capital-intensive nature of fluid circulation and power generation units. By contrast, the largest EDCRs were concentrated in Condenser 1 (15.43%), Separator 1 (9.85%), and the heat exchanger (56.85%). Each of these values can be traced back to physical mechanisms that amplify exergy destruction, causing economic penalties. In Condenser 1, condensation losses resulted from large temperature gradients between the working fluid and cooling stream, leading to entropy generation and high cost penalties. In Separator 1, turbulent flashing and compositional splitting of the ammonia–water mixture introduced unavoidable irreversibilities, and because a large portion of the system flow passes through this component, its destruction costs were amplified. The heat exchanger displayed the single largest share of EDCR due to imperfect thermal matching between the geothermal source and working fluid; small mismatches in glide temperature profiles generated large entropy production, which translated directly into cost losses. These distributions are clearly shown in Figure 10, where the relative contributions of investment costs and destruction costs are compared. The figure demonstrates that some components (e.g., pumps and turbine) are dominated by investment costs, while others (e.g., heat exchanger and separators) are dominated by destruction costs. The imbalance underscores the need for differentiated optimization strategies: capital-intensive equipment should be targeted with cost-reduction measures, while thermodynamically inefficient units require design improvements to lower irreversibility. Figure 11, the exergy cost flow diagram, illustrates how cost rates propagate alongside exergy flows throughout the cycle. It reveals that the degradation of exergy is not evenly distributed but is concentrated in specific components, particularly Separator 1 and the heat exchanger. The diagram also shows that the absorber reduced cost propagation by enhancing turbine inlet conditions and lowering destruction in the upstream heat addition process, thereby redistributing cost burdens away from the turbine. The observed cost and efficiency trends can be explained by three main phenomena. High-pressure expansion and fluid-circulation equipment (turbine, pumps, and evaporator) drive capital costs because of their structural and material demands. Separation and heat-exchange processes generate the largest irreversibilities, which appear as destruction costs. The absorber-driven temperature lift mitigates some of these losses by improving thermodynamic matching and reducing entropy generation in the heat exchangers. Taken together, the results indicate that while the turbine and pumps dominate investment-related expenses, the separators and heat exchanger dominate irreversibility-related economic penalties. The synergy of these patterns clarifies why the overall exergoeconomic factor varies widely across components—from very low values in Separator 1 (0.03) to near unity in Evaporator 2 (0.97). These factors emphasize that investment alone cannot guarantee efficiency: components such as Separator 1, with intrinsically low exergoeconomic factors, remain thermodynamic bottlenecks despite relatively modest capital cost requirements. The exergoeconomic analysis confirms that the system’s economic competitiveness depends not only on reducing capital intensity but also on addressing irreversibility hotspots. Optimization of ammonia concentrations, refined separator design, and improved thermal matching in the heat exchanger were identified as the most effective strategies to reduce both destruction costs and overall cost burdens, thereby enhancing the system’s profitability and sustainability.

Table 9.
Outcomes of the conventional exergoeconomic analysis.
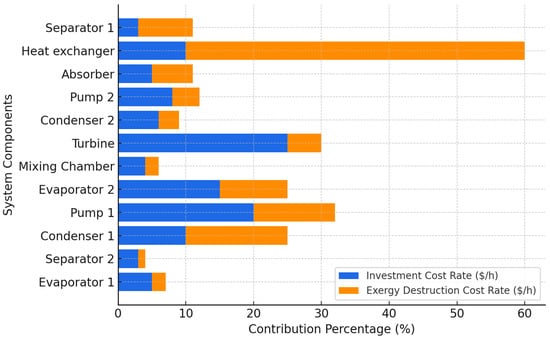
Figure 10.
Distribution of exergy destruction and ICRs across component percentiles derived from the results of the conventional exergoeconomic analysis.
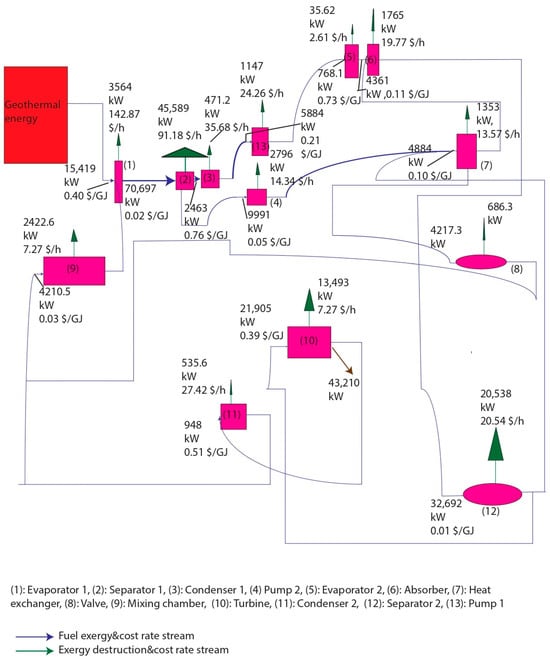
Figure 11.
Flow diagram illustrating the propagation of exergy-related cost rates across the components of the absorber-integrated Kalina cycle.
4.7. Statistical Evaluation Findings
The statistical evaluation of the proposed system using regression analysis and ANOVA achieved a predicted R2 of 0.97 and an adjusted R2 of 0.96, indicating that the model provided strong explanatory power without overfitting. This high degree of correlation shows that the variation in performance indicators was well captured by the selected design parameters and their interactions. The ANOVA results revealed that most of the main effects were statistically significant, confirming that the key variables exerted direct influence on system behavior. Among them, turbine inlet temperature (T_T) and ammonia concentrations (x1, x2, x4) emerged as the most influential factors in shaping both thermodynamic and economic outcomes. Physically, this reflects the dominant role of turbine inlet enthalpy in governing the power output and the critical function of ammonia mass fractions in controlling phase distribution, vapor quality, and absorber performance. By contrast, some parameters showed weaker or more selective impacts. Absorber temperature (T_ABS) was found to be critical only in the energy efficiency model, since exothermic absorption directly affects ammonia–water mass transfer and thermal lift. However, its influence on exergy efficiency remained limited, as the main sources of irreversibility were concentrated in the turbine and heat exchangers rather than in the absorber. Similarly, condenser outlet temperature (T_C1) was significant only for exergy efficiency because heat rejection strongly determines the potential to preserve or dissipate the available work during condensation. Interaction effects also provided key insights into system dynamics. The T_T–x4 interaction (turbine inlet temperature–Separator 2 ammonia concentration) emerged as significant in the cost model, reflecting the fact that enthalpy enhancement at the turbine inlet, when combined with optimized vapor composition, directly influenced investment-related cost recovery and the cost per unit of product exergy. On the other hand, the T_HX–T_ABS interaction was not significant for cost, suggesting that while heat exchanger and absorber temperatures influence thermal matching, economic outcomes were more sensitive to large-scale irreversibilities concentrated in the turbine and separators. The sensitivity analyses illustrated in Figure 12, Figure 13 and Figure 14 confirm these findings by showing the specific trends of the cost and destruction rates. As x2 and T_T increased (Figure 12), the product exergy cost rate rose while the total cost declined, highlighting that higher turbine inlet conditions improved efficiency and reduced the relative economic burden of irreversibilities. For x1 (Figure 13), increasing the concentration initially reduced costs until an optimum region around 0.8 was reached, after which diminishing returns occurred because an excessive ammonia fraction raised pumping and separation penalties. For x4 (Figure 14), increases in the Separator 2 concentration consistently lowered both the total and destruction costs, indicating that higher-quality vapor streams reduced irreversibility in the turbine and improved exergy recovery. The statistical analysis confirmed that the observed cost and efficiency trends are direct manifestations of underlying physical phenomena. An increase in turbine inlet enthalpy drives a higher work output and lowers cost rates. Ammonia concentration governs phase equilibrium and the absorber-driven temperature lift, thereby influencing exergy destruction. Strong localisation of irreversibilities in the separators and the turbine explains why certain parameters dominate cost behavior while others are less significant. These findings emphasize the need for precise control of turbine inlet conditions and ammonia concentrations during system operation, since they directly determine the balance between thermodynamic performance and economic competitiveness.
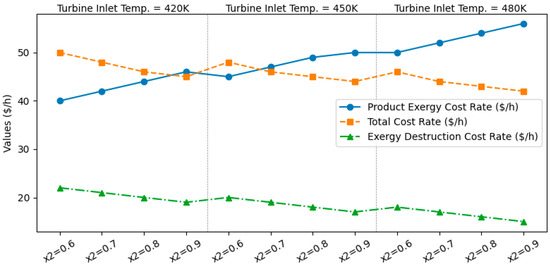
Figure 12.
Effect of x2 and turbine inlet temperature on system performance.
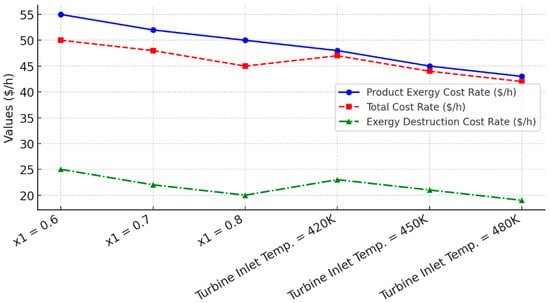
Figure 13.
Effect of x1 and turbine inlet temperature on system performance.
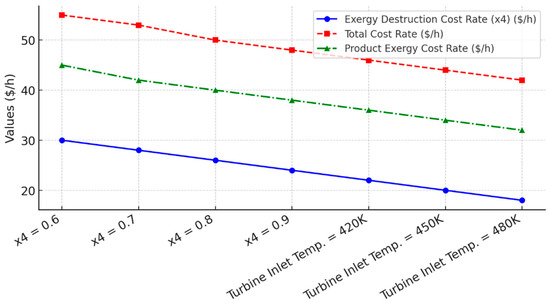
Figure 14.
Effect of x4 and turbine inlet temperature on system performance.
4.8. Optimization Results
To enhance the exergoeconomic performance of the proposed system, both single-objective and multi-objective optimizations were conducted using the Non-Dominated Sorting Genetic Algorithm II (NSGA-II), with the Technique for Order of Preference by Similarity to Ideal Solution (TOPSIS) applied to select compromise solutions [47,48]. The optimization objectives were to maximize overall energy efficiency, maximize overall exergy efficiency, and minimize the total investment cost. Key decision variables included the temperatures of Condenser 1, Evaporator 2, the heat exchanger, the absorber, and the turbine, as well as the ammonia concentrations at Evaporator 1 (x1), Separator 1 (x2), and Separator 2 (x4). The single-objective results summarized in Table 10 demonstrate that maximizing energy efficiency required an optimum turbine inlet temperature of 453.60 K and an absorber temperature of 461.06 K, together with relatively high ammonia concentrations (x1 = 0.8598, x2 = 0.9643, x4 = 0.9042). These values physically correspond to maximizing the enthalpy drop across the turbine and improving absorber mixing. A higher turbine inlet temperature expands the thermodynamic driving force for expansion, while an elevated absorber temperature improves vapor quality and reduces mismatches between the heat source and the ammonia–water mixture. The combination of these effects increased the available turbine work and raised the overall cycle efficiency. In contrast, exergy efficiency optimization shifted the absorber temperature slightly downward (456.03 K) while increasing the turbine inlet temperature (457.31 K). This reflects the physical reality that exergy optimization favors conditions that minimize irreversibilities rather than maximize raw power output. By reducing the absorber temperature, the cycle improved temperature matching during absorption and evaporation, which reduced entropy generation. The higher turbine inlet temperature simultaneously enhanced the exergy quality of the working fluid, leading to a better balance between useful work and destruction losses. Cost minimization exhibited different trends, with the condenser temperature reduced to 350.87 K and the turbine inlet temperature increased to 459.92 K, while the ammonia concentrations were slightly lowered. These settings reflect an economic compromise: lower condenser temperatures improve heat rejection efficiency and reduce operating costs, while slightly reduced ammonia concentrations lower pumping requirements and separator irreversibilities. Although these conditions yielded a slightly lower efficiency, the reduction in capital-related burdens resulted in a minimized investment cost. The multi-objective optimization results, presented in Table 11, highlighted the trade-offs between performance and cost. The Pareto-optimal points clustered around turbine and absorber temperatures between 459.75 K and 460.53 K and ammonia concentrations ranging from 0.872 to 0.908. These narrow ranges indicate that the efficiency-focused cases required slightly higher temperatures and concentrations to maximize output, while the cost-focused cases favored marginally lower values to control expenses. Figure 15a–c illustrates these Pareto frontiers. In Figure 15a, the positive correlation between energy efficiency and total investment cost indicates that higher efficiency required greater capital expenditures, particularly due to larger and more complex heat exchangers and absorber units. Figure 15b shows a similar relationship between exergy efficiency and cost, with diminishing returns at higher efficiency levels: while initial efficiency gains were achieved with moderate increases in cost, subsequent improvements required disproportionately higher investments due to the need for an advanced turbine design and high-performance materials. Figure 15c reveals the coupled behavior of energy and exergy efficiencies, demonstrating that improvements in one generally translated into improvements in the other, confirming that the optimization process aligned both first-law and second-law objectives. The physical interpretation of these trends can be summarized in three main observations. First, turbine inlet temperature emerged as the most critical driver of efficiency, as it directly governed the enthalpy available for expansion. Second, ammonia concentrations strongly influenced absorber performance and separator behavior, highlighting the dual role of working-fluid composition in enhancing turbine output while introducing separation-related irreversibilities. Third, economic trade-offs were dominated by the size and performance requirements of the absorber and heat exchangers, which controlled both capital intensity and the degree of thermal matching. The optimization results show that the proposed system achieves its best thermodynamic and economic balance at turbine inlet temperatures close to 460 K and ammonia concentrations around 0.90. These conditions maximize useful work output, reduce irreversibilities through improved thermal matching, and maintain capital expenditures within economically viable limits. The observed Pareto distributions confirm that while absolute maximum efficiency can only be achieved with higher costs, carefully balanced parameter selections allow for robust compromise solutions with both high performance and strong economic competitiveness.

Table 10.
Parameter sets corresponding to single-objective optimization scenarios (energy efficiency, exergy efficiency, and cost minimization) for the proposed system.

Table 11.
Pareto-optimal solutions from multi-objective optimization highlighting trade-offs between efficiency and cost.
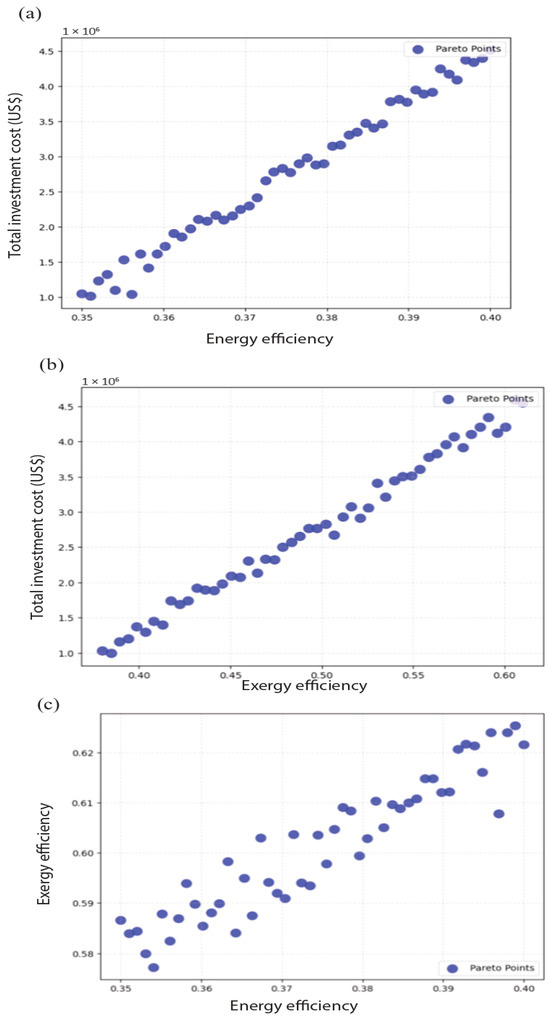
Figure 15.
Pareto-optimal relationships among investment cost, energy efficiency, and exergy efficiency: (a) Energy efficiency vs. total cost. (b) Exergy efficiency vs. total cost. (c) Energy efficiency vs. exergy efficiency.
4.9. Proposed System Limitations and Working-Fluid Flexibility
Although the proposed Kalina cycle configuration demonstrated strong technoeconomic and environmental performance, several intrinsic limitations should be acknowledged. The present design is inherently optimized for the NH3–H2O working-fluid pair, which provides a favorable boiling temperature glide, high latent heat, and established industrial experience. Nevertheless, other zeotropic mixtures such as R245fa–pentane or CO2–butane could, in principle, be explored. The use of such alternatives is constrained by multiple factors. From a thermophysical perspective, organic blends often exhibit lower critical temperatures and narrower boiling ranges, which reduce their capacity to match geothermal source–sink profiles efficiently. In terms of safety, hydrocarbons (pentane, butane) are flammable, while CO2 mixtures may operate at elevated pressures, both of which necessitate more complex safety systems. Corrosion and chemical compatibility also represent potential challenges, as NH3 itself requires inhibitors and specific materials, while alternative fluids may introduce additional issues. Finally, the economic feasibility of adopting less conventional fluids is limited by higher procurement costs, licensing requirements, and uncertainties in large-scale availability. These constraints indicate that, although alternative mixtures may offer theoretical performance advantages, their adoption in practical geothermal Kalina applications remains restricted. Future studies could address these challenges by experimentally testing zeotropic mixtures under real geothermal boundary conditions and by conducting comparative environmental and safety assessments.
4.10. Technical Feasibility and Operational Challenges
Although the proposed configuration demonstrated strong thermodynamic and environmental performance, several operational challenges were identified that must be addressed for practical deployment. Corrosion was recognized as one of the most critical concerns in ammonia–water systems, since NH3 could promote stress corrosion cracking and general material degradation in carbon steels and copper alloys. This issue was typically mitigated by the use of stainless steels, nickel-based alloys, or protective linings, as well as by the application of chemical inhibitors and continuous monitoring strategies. Ammonia leakage was also highlighted as a safety challenge, owing to the toxicity, pungent odor, and potential occupational hazards associated with NH3 exposure. To ensure safe operation, rigorous sealing, proper welding standards, redundant gaskets, detection sensors, and ventilation infrastructure were required. Maintenance difficulties were considered another drawback, particularly for absorbers, separators, and turbines operating under elevated pressures and involving non-ideal fluid behavior. Specialized expertise, scheduled inspections, and condition-based monitoring systems were necessary to sustain reliable performance, and downtime for maintenance could increase overall operating costs. Scaling and fouling due to geothermal brine composition were further identified as possible issues that could reduce heat exchanger effectiveness and flow stability. Such problems were typically mitigated through the use of anti-scaling chemical treatments, periodic cleaning, and surface coatings that minimize deposition. The importance of reinjection management was also emphasized, since long-term reservoir sustainability required reinjection at appropriate depths and pressures to prevent thermal breakthrough, pressure decline, or geochemical imbalances. Additional technical concerns included the energy penalty of auxiliary systems, such as circulation pumps and cooling units, which could reduce net cycle efficiency if not properly optimized. The availability of corrosion-resistant materials and the cost of specialized components were considered potential barriers for large-scale deployment. Moreover, the requirement for stringent safety protocols, emergency handling procedures, and compliance with environmental regulations could add further complexity to system operation. While these challenges did not negate the advantages of the proposed configuration, they provided a realistic perspective on the steps necessary for field implementation. It was concluded that future research should focus on advanced material development, improved sealing technologies, predictive maintenance strategies, and optimized brine pretreatment methods to address the identified challenges and ensure the safe, reliable, and cost-effective operation of Kalina-based geothermal power plants.
5. Conclusions
In the present study, a novel Kalina cycle (KC) configuration utilizing mid-temperature geothermal energy was proposed to enhance both energy efficiency and economic feasibility for electricity generation. The proposed system was modeled using EES (Version 9.457-3D) and TRNSYS software (Version 18.02.0002) under the geothermal conditions of Simav, Turkey. Comparative analysis revealed that at a minimum source temperature of 407.20 K, the proposed design offered lower investment and levelized electricity costs, along with a shorter payback period, relative to similarly scaled geothermal KC systems. As a result, it presents a robust alternative to traditional geothermal electricity production and stands competitive with other renewable energy technologies. The proposed system achieved a net power output of 43,210 kW and an energy efficiency of 30.03%, outperforming the typical geothermal KC range of 10.30–19.48%. Exergy analysis showed that the total exergy destruction rate was 94,396.32 kW, primarily concentrated in Separator 1, Separator 2, and the turbine. These inefficiencies were linked to phase separation and non-isentropic expansion processes. Conversely, Condenser 1, Condenser 2, and Evaporator 2 demonstrated minimal irreversibilities. The annual simulation projected electricity production at 11,138.53 MWh with an upfront investment of USD 3.04 million and a payback period of 3.20 years, compared to USD 2.55–4.37 million and 3–5 years for conventional systems. Exergoeconomic analysis revealed an exergy destruction cost rate of 925.94 USD/h and an investment cost rate of 726.71 USD/h. Condenser 1, Separator 1, and the heat exchanger had higher cost rates due to exergy product losses under increased temperature and concentration conditions. Single- and multi-objective optimizations using NSGA-II, guided by statistical evaluations and exergoeconomic data, demonstrated that higher turbine inlet temperatures (~459–460 K) and optimized ammonia concentrations significantly improved performance. Beyond the technoeconomic advantages, the environmental assessment, structured as a streamlined life cycle analysis (LCA), confirmed a low carbon footprint of 20–60 kg CO2 eq MWh−1 (baseline 45 kg CO2 eq MWh−1), corresponding to annual emissions of only 0.22–0.67 kt CO2 eq yr−1. Compared with fossil references, avoided emissions of ≈8.6 kt CO2 eq yr−1 relative to coal and ≈5.0 kt CO2 eq yr−1 relative to natural gas were achieved. In addition, the water footprint was determined as ≈0.10 m3 MWh−1 (≈1114 m3 yr−1), substantially lower than the values of ≈2.00 m3 MWh−1 (≈22,277 m3 yr−1) for coal and ≈0.80 m3 MWh−1 (≈8911 m3 yr−1) for natural gas. These findings confirmed that the proposed configuration not only improved efficiency and cost-effectiveness but also delivered tangible environmental benefits, substantiating the sustainability claim in the title and highlighting its suitability as a next-generation geothermal energy solution.
Author Contributions
Conceptualization, A.T.; methodology, A.T.; software, A.T.; validation, A.T.; formal analysis, A.T.; investigation, A.T.; resources, A.T.; data curation, A.T.; writing—original draft preparation, A.T.; writing—review and editing, A.T.; visualization, A.T.; project administration, A.T.; funding acquisition, A.T. The author has read and agreed to the published version of the manuscript.
Funding
This research received no external funding.
Data Availability Statement
The original contributions presented in this study are included in the article. Further inquiries can be directed to the corresponding author.
Acknowledgments
The author has reviewed and edited the output and takes full responsibility for the content of this publication. The author is very grateful to the reviewers and editor for their valuable and constructive comments, which led to increasing the quality of this paper.
Conflicts of Interest
The authors declare no conflicts of interest.
Abbreviations
The following abbreviations are used in this manuscript:
| EDR | Exergy destruction rate |
| EDCR | Exergy destruction cost rate |
| EV | Evaporator |
| ICR | Investment cost rate |
| P1 | Pump 1 |
| P2 | Pump 2 |
| P3 | Pump 3 |
| S | Separator |
| HX | Heat exchanger |
| T | Turbine |
| V | Valve |
References
- Mousavi, S.B.; Ahmadi, P.; Pourahmadiyan, A.; Hanafizadeh, P. A comprehensive techno-economic assessment of a novel compressed air energy storage (CAES) integrated with geothermal and solar energy. Sustain. Energy Technol. Assess. 2021, 47, 101418. [Google Scholar] [CrossRef]
- Cuesta-Fernández, I.; Vargas-Salgado, C.; Alfonso-Solar, D.; Gómez-Navarro, T. The contribution of metropolitan areas to decarbonize the residential stock in Mediterranean cities: A GIS-based assessment of rooftop PV potential in Valencia, Spain. Sustain. Cities Soc. 2023, 97, 104727. [Google Scholar] [CrossRef]
- Khan, Z.; Linares, P.; García-González, J. Integrating water and energy models for policy driven applications. A review of contemporary work and recommendations for future developments. Renew. Sustain. Energy Rev. 2017, 67, 1123–1138. [Google Scholar] [CrossRef]
- Chang, N.B.; Hossain, U.; Valencia, A.; Qiu, J.; Kapucu, N. The role of food-energy-water nexus analyses in urban growth models for urban sustainability: A review of synergistic framework. Sustain. Cities Soc. 2020, 63, 102486. [Google Scholar] [CrossRef]
- Razmi, A.; Soltani, M.; Kashkooli, F.M.; Farshi, L.G. Energy and exergy analysis of an environmentally-friendly hybrid absorption/recompression refrigeration system. Energy Convers. Manag. 2018, 164, 59–69. [Google Scholar] [CrossRef]
- Senegačnik, A.; Sekavčnik, M.; Oprešnik, S.R.; Mlakar, U.; Ivanjko, Š.; Stritih, U. Integration of renewable energy sources for sustainable energy development in Slovenia till 2050. Sustain. Cities Soc. 2023, 96, 104668. [Google Scholar] [CrossRef]
- Wang, X.; Wang, G.; Chen, T.; Zeng, Z.; Heng, C.K. Low-carbon city and its future research trends: A bibliometric analysis and systematic review. Sustain. Cities Soc. 2023, 90, 104381. [Google Scholar] [CrossRef]
- Jaćimović, B.; Genić, S.; Jaćimović, N. Application of modified Kalina cycle in biomass CHP plants. Int. J. Energy Res. 2020, 44, 8754–8768. [Google Scholar] [CrossRef]
- Hosseinpour, M.; Ozgoli, H.A.; Hajiseyed Mirzahosseini, S.A.; Hemmasi, A.H.; Mehdipour, R. Evaluation of performance improvement of the combined biomass gasifier power cycle using low-temperature bottoming cycles: Organic Rankine cycle, Kalina and Goswami. Environ. Prog. Sustain. Energy 2022, 41, e13855. [Google Scholar] [CrossRef]
- Eraiby, M.W.; Mak, D.F. A literature review of modification kalina cycle applications and advancements. Iraqi J. Mech. Mater. Eng. 2025, 24, 63–84. [Google Scholar] [CrossRef]
- Ozturk, M.; Dincer, I. Development of a combined flash and binary geothermal system integrated with hydrogen production for blending into natural gas in daily applications. Energy Convers. Manag. 2021, 227, 113501. [Google Scholar] [CrossRef]
- Parikhani, T.; Delpisheh, M.; Haghghi, M.A.; Holagh, S.G.; Athari, H. Performance enhancement and multi-objective optimization of a double-flash binary geothermal power plant. Energy Nexus 2021, 2, 100012. [Google Scholar] [CrossRef]
- Takleh, H.R.; Zare, V.; Mohammadkhani, F.; Sadeghiazad, M.M. Proposal and thermoeconomic assessment of an efficient booster-assisted CCHP system based on solar-geothermal energy. Energy 2022, 246, 123360. [Google Scholar] [CrossRef]
- Caliskan, H.; Açıkkalp, E.; Takleh, H.R.; Zare, V. Advanced, extended and combined extended-advanced exergy analyses of a novel geothermal powered combined cooling, heating and power (CCHP) system. Renew. Energy 2023, 206, 125–134. [Google Scholar] [CrossRef]
- Zare, V.; Takleh, H.R. Novel geothermal driven CCHP systems integrating ejector transcritical CO2 and Rankine cycles: Thermodynamic modeling and parametric study. Energy Convers. Manag. 2020, 205, 112396. [Google Scholar] [CrossRef]
- Azariyan, H.; Vajdi, M.; Takleh, H.R. Assessment of a high-performance geothermal-based multigeneration system for production of power, cooling, and hydrogen: Thermodynamic and exergoeconomic evaluation. Energy Convers. Manag. 2021, 236, 113970. [Google Scholar] [CrossRef]
- Kalan, A.S.; Ghiasirad, H.; Saray, R.K.; Mirmasoumi, S. Thermo-economic evaluation and multi-objective optimization of a waste heat driven combined cooling and power system based on a modified Kalina cycle. Energy Convers. Manag. 2021, 247, 114723. [Google Scholar] [CrossRef]
- Li, K.; Ding, Y.Z.; Ai, C.; Sun, H.; Xu, Y.P.; Nedaei, N. Multi-objective optimization and multi-aspect analysis of an innovative geothermal-based multi-generation energy system for power, cooling, hydrogen, and freshwater production. Energy 2022, 245, 123198. [Google Scholar] [CrossRef]
- Liu, X.; Hu, G.; Zeng, Z. Performance characterization and multi-objective optimization of integrating a biomass-fueled Brayton cycle, a Kalina cycle, and an organic Rankine cycle with a Claude hydrogen liquefaction cycle. Energy 2023, 263, 125535. [Google Scholar] [CrossRef]
- Pang, T.; Gao, L.; Wu, W.; Chi, F. Eco-friendly multi-heat recovery applied to an innovative integration of flue gas-driven multigeneration process and geothermal power plant: Feasibility characterization from thermo-economic-environmental aspect. J. Clean. Prod. 2024, 449, 141750. [Google Scholar] [CrossRef]
- Wang, J.; Wu, Y.; Liu, X. Thermodynamic and economic analysis of a Kalina cycle-based combined heating and power system for low-temperature heat source utilization. Therm. Sci. Eng. Prog. 2024, 55, 102904. [Google Scholar] [CrossRef]
- Singh, S.K.; Das, A.K.; Dixit, A.R. Performance of proton exchange membrane in solar-integrated Kalina cycle systems for green hydrogen production. Therm. Sci. Eng. Prog. 2025, 60, 103413. [Google Scholar] [CrossRef]
- Aich, W.; Basem, A.; Ghabra, A.A.; Mausam, K.; Ahmed, M.; Said, L.B.; Habibi, H. Multi-aspect assessment and optimization of a poly-generation layout composed of a geothermal power plant and a wind turbine. Therm. Sci. Eng. Prog. 2024, 51, 102660. [Google Scholar] [CrossRef]
- Zoghi, M.; Habibi, H.; Chitsaz, A.; Holagh, S.G. Multi-criteria analysis of a novel biomass-driven multi-generation system including combined cycle power plant integrated with a modified Kalina-LNG subsystem employing thermoelectric generator and PEM electrolyzer. Therm. Sci. Eng. Prog. 2021, 26, 101092. [Google Scholar] [CrossRef]
- Alghorayshi, S.T.K.; Imandoust, M.; Hemmatzadeh, A.; Abbasi, S.; Javidfar, M.; Seifollahi, M.; Zahedi, R. Design, simulation and investigation of the tri-generation process of fresh water, power and biogas using solar thermal energy and sewage sludge. Chem. Eng. Res. Des. 2024, 208, 242–257. [Google Scholar] [CrossRef]
- Wang, C.; Zhuang, Y.; Song, M.; Liu, L.; Dong, Y.; Zhang, L.; Du, J. Design and optimization of organic Rankine cycle using different working fluids for recovering waste heat in reaction-separation process of cumene synthesis. Chem. Eng. Res. Des. 2022, 186, 497–510. [Google Scholar] [CrossRef]
- Senturk, M. Thermodynamic and economic analysis of geothermal energy powered Kalina cycle. Isı Bilim. Tek. Derg. 2020, 40, 335–347. [Google Scholar] [CrossRef]
- Sharmin, T.; Khan, N.R.; Akram, M.S.; Ehsan, M.M. A state-of-the-art review on geothermal energy extraction, utilization, and improvement strategies: Conventional, hybridized, and enhanced geothermal systems. Int. J. Thermofluids 2023, 18, 100323. [Google Scholar] [CrossRef]
- Dokmak, H.; Faraj, K.; Faraj, J.; Castelain, C.; Khaled, M. Geothermal systems classification, coupling, and hybridization: A recent comprehensive review. Energy Built Environ. 2024, 6, 730–749. [Google Scholar] [CrossRef]
- Liu, Z.; Zeng, Z.; Deng, C.; Xie, N. Advanced exergy analysis of an absorption chiller/kalina cycle integrated system for low-grade waste heat recovery. Processes 2022, 10, 2608. [Google Scholar] [CrossRef]
- Modi, A.; Haglind, F. Thermodynamic optimisation and analysis of four Kalina cycle layouts for high temperature applications. Appl. Therm. Eng. 2015, 76, 196–205. [Google Scholar] [CrossRef]
- Arslan, O.; Kose, R. Exergoeconomic optimization of integrated geothermal system in Simav, Kutahya. Energy Convers. Manag. 2010, 51, 663–676. [Google Scholar] [CrossRef]
- Ahmad, M.; Karimi, M.N. Thermodynamic analysis of Kalina cycle. Int. J. Sci. Res. 2016, 5, 2244–2249. [Google Scholar]
- Boghossian, J.G. Dual-Temperature Kalina Cycle for Geothermal-Solar Hybrid Power Systems. Ph.D. Thesis, Massachusetts Institute of Technology, Cambridge, MA, USA, 2011. [Google Scholar]
- Atashbozorg, D.; Arasteh, A.M.; Salehi, G.; Azad, M.T. Analysis of different organic rankine and kalina cycles for waste heat recovery in the iron and steel industry. ACS Omega 2022, 7, 46099–46117. [Google Scholar] [CrossRef] [PubMed]
- Sun, F.; Zhou, W.; Ikegami, Y.; Nakagami, K.; Su, X. Energy–exergy analysis and optimization of the solar-boosted Kalina cycle system 11 (KCS-11). Renew. Energy 2014, 66, 268–279. [Google Scholar] [CrossRef]
- Ahmad, A.H.; Darmanto, P.S.; Juangsa, F.B.; Al Asy’ari, M.R.; Adityatama, D.; Purba, D. Thermodynamic and economic comparison of Organic Rankine Cycle and Kalina Cycle as bottoming unit to utilize exhaust steam from back pressure turbine geothermal power plant. In Proceedings of the 48th Workshop on Geothermal Reservoir Engineering*(SGP-TR-224), Stanford, CA, USA, 6–8 February 2023. [Google Scholar]
- Betelmal, E.H.; Naas, M.A. The Value of Kalina Cycle in Engineering. Int. J. Res. Sci. Innov. 2024, XI, 1028–1037. [Google Scholar] [CrossRef]
- Tiktas, A.; Gunerhan, H.; Hepbasli, A.; Açıkkalp, E. Extended exergy analysis of a novel integrated absorptional cooling system design without utilization of generator for economical and robust provision of higher cooling demands. Energy Convers. Manag. 2024, 307, 118350. [Google Scholar] [CrossRef]
- Tiktas, A. Introducing a novel wind-driven passive cooling strategy for polar shelters: Backed by flow dynamics and irreversibility mapping with exergy analysis. Energy Convers. Manag. 2025, 346, 120481. [Google Scholar] [CrossRef]
- Tiktas, A.; Hepbasli, A.; Gunerhan, H. Achieving ultra-high coefficient of performance in a novel solar-assisted trigeneration system integrating absorption and Rankine cycles. Energy Convers. Manag. 2025, 346, 120415. [Google Scholar] [CrossRef]
- Tiktas, A.; Gunerhan, H.; Hepbasli, A. Single and multigeneration Rankine cycles with aspects of thermodynamical modeling, energy and exergy analyses and optimization: A key review along with novel system description figures. Energy Convers. Manag. X 2022, 14, 100199. [Google Scholar] [CrossRef]
- Smith, R. Chemical Process: Design and Integration; John Wiley & Sons: Chichester, UK, 2005. [Google Scholar]
- Tiktaş, A.; Gunerhan, H.; Hepbasli, A.; Açıkkalp, E. Exergy-based techno-economic and environmental assessments of a proposed integrated solar powered electricity generation system along with novel prioritization method and performance indices. Process Saf. Environ. Prot. 2023, 178, 396–413. [Google Scholar] [CrossRef]
- Blanco-Marigorta, A.M.; Lozano-Medina, A.; Marcos, J.D. A critical review of definitions for exergetic efficiency in reverse osmosis desalination plants. Energy 2017, 137, 752–760. [Google Scholar] [CrossRef]
- Lior, N.; Zhang, N. Energy, exergy, and second law performance criteria. Energy 2007, 32, 281–296. [Google Scholar] [CrossRef]
- Tiktas, A.; Gunerhan, H.; Hepbasli, A. Exergoeconomic optimization of a proposed novel combined solar powered electricity and high-capacity cooling load production system for economical and potent generation via utilization of low-grade waste heat source. Therm. Sci. Eng. Prog. 2024, 55, 102976. [Google Scholar] [CrossRef]
- Tiktaş, A.; Gunerhan, H.; Hepbasli, A. Exergy and sustainability-based optimisation of flat plate solar collectors by using a novel mathematical model. Int. J. Exergy 2023, 42, 192–215. [Google Scholar] [CrossRef]
Disclaimer/Publisher’s Note: The statements, opinions and data contained in all publications are solely those of the individual author(s) and contributor(s) and not of MDPI and/or the editor(s). MDPI and/or the editor(s) disclaim responsibility for any injury to people or property resulting from any ideas, methods, instructions or products referred to in the content. |
© 2025 by the author. Licensee MDPI, Basel, Switzerland. This article is an open access article distributed under the terms and conditions of the Creative Commons Attribution (CC BY) license (https://creativecommons.org/licenses/by/4.0/).