1. Introduction
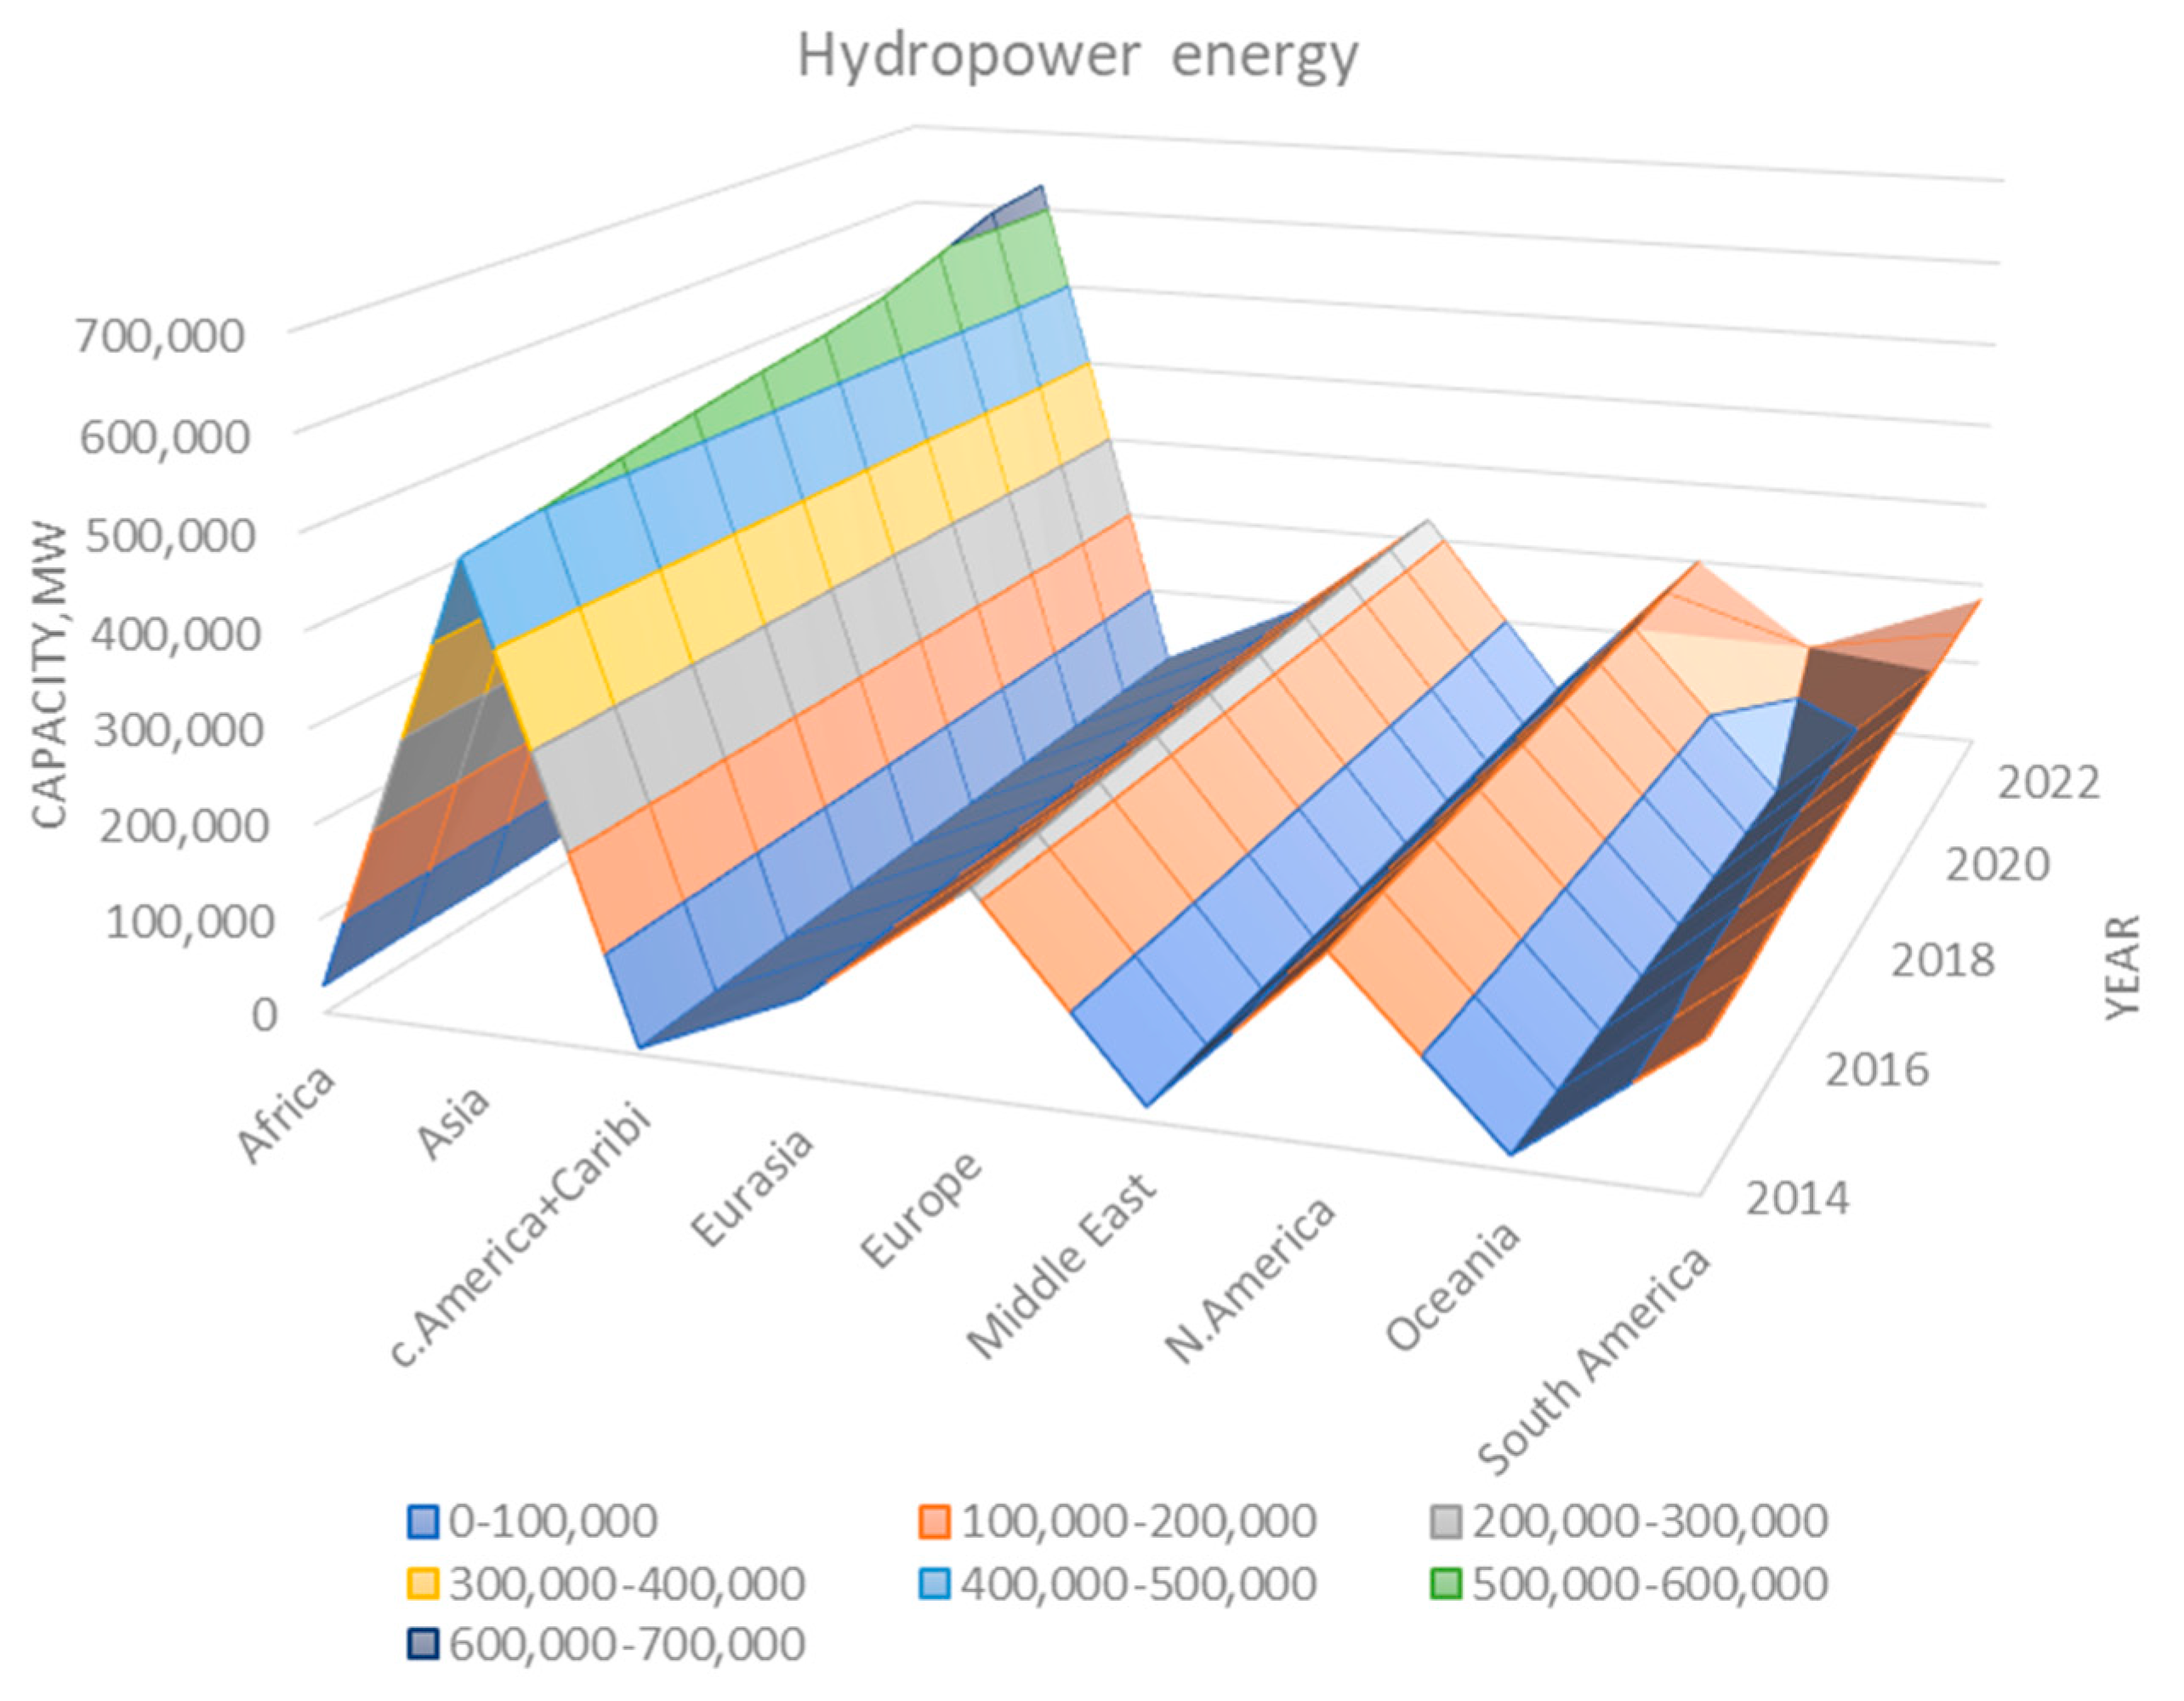
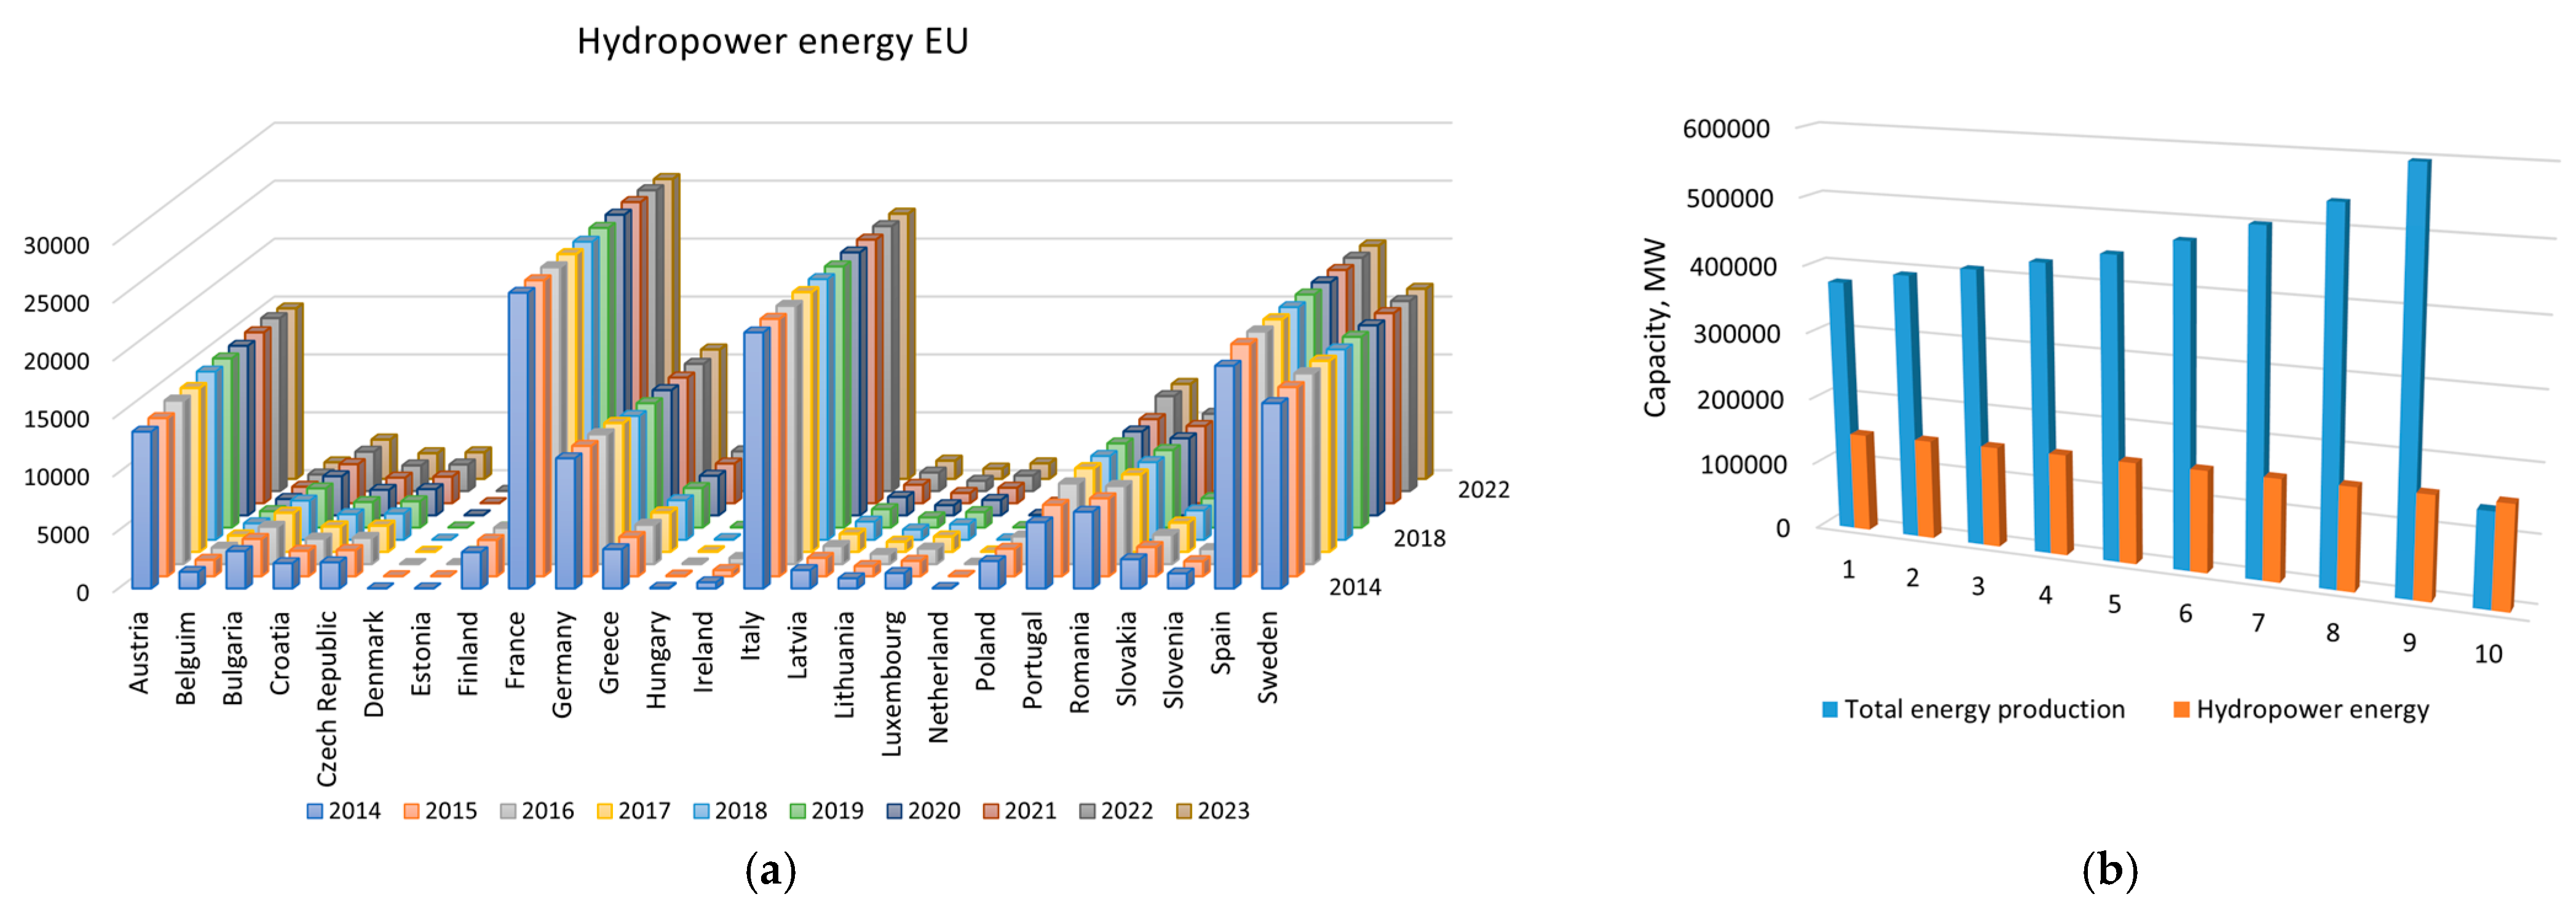
Globally, about two-thirds of greenhouse gas emissions come from burning fossil fuels for energy, used in heating, electricity, and various sectors like transportation, industry, agriculture, and tourism. In Europe, energy-related activities are the primary source of greenhouse gases, accounting for around three-quarters of the total emissions in the European Union [
1,
2].
As the world moves toward net-zero energy consumption goals, new energy solutions must be designed with three key factors in mind: reducing carbon emissions, securing energy supply, and fostering environmental restoration and sustainable growth. One such approach is utilizing renewable energy sources instead of fossil fuels [
3].
According to experts, today, approximately one-quarter of global electricity generation comes from renewable energy sources, and their share is expected to increase to one-third by 2040 [
4].
One such energy source is hydropower. Hydropower is the oldest, accessible, and sustainable source of energy worldwide. The power of falling water has been harnessed to generate electricity for more than 130 years. The world’s first hydroelectric power plant was built in 1882 in the state of Wisconsin, USA. A few years later, in 1895, Nikola Tesla and George Westinghouse engineered the largest hydro facility of its time—the Niagara Falls Hydroelectric Power Plant, which used the waters of the Fox River to power several lamps in buildings around the station [
5]. The first such facility in Europe that worked on the Tesla’s polyphase AC system is the hydropower plant built at river Djetinja near town Uzice in Serbia [
6]. The first hydroelectric power plant in Bulgaria, HPP “Prohodna,” was built in 1900. It used the energy of the Vit River and primarily supplied lighting [
7].
According to official data, 21% of the world’s electricity is generated by hydroelectric power plants (HPPs). In many countries, hydropower plays a leading role in the energy mix. For example, in Norway and Brazil, it provides more than 90% of total electricity consumption. Additionally, countries such as Albania, Iceland, and Paraguay generate 100% of their electricity from renewable energy sources. In Bulgaria, hydroelectric power supplies about 14% of the country’s total electricity consumption [
8,
9].
Another approach to harnessing the potential of rivers is through the design and deployment of hydrokinetic turbines, which harness the kinetic energy of flowing water, such as in a river. Utilizing the kinetic energy of moving water is a fundamental principle in generating hydroelectric power. This mechanical energy is converted into electrical energy by water turbines and generators [
11,
12,
13,
14,
15].
While small hydrokinetic turbines are unlikely to significantly influence global energy supplies, they offer substantial potential for providing electricity to small, rural, off-grid communities globally. These systems are particularly useful in areas where the conventional energy supply is difficult, climatic conditions make renewable sources like solar or wind energy impractical, or traditional micro-hydro options are not applicable.
The hydrokinetic turbines can be categorized based on the orientation of their rotational axis relative to water flow, distinguishing them as axial flow and cross-flow, or transversal turbines [
16]. Axial flow hydrokinetic turbines have a rotation axis aligned with the current and use propeller-like impellers. Generally, horizontal-axis turbines tend to be more efficient than vertical-axis types. The common vertical designs include Darrieus, Savonius, and Gorlov helical turbines Both horizontal- and vertical-axis turbines operate similarly to wind turbines by harnessing energy through hydrodynamic processes. A comparative analysis indicates that hydrokinetic turbines with horizontal axes tend to be more efficient because they experience fewer incidence losses [
17]. In-depth analysis on the advantages of the horizontal-axis hydrokinetic turbines is presented by Chica et al. [
18] while the vertical type turbines are discussed in detail by Ramadan et al. [
19].
Many reviews are available, although the hydrokinetic technology is still under development [
20,
21,
22,
23,
24,
25,
26,
27]. These works outline operating principles, definitions, characteristic parameters such as speed tip ratio, power coefficient, chord length, installations, and cost-effectiveness analyses. However, the local conditions of the area of installation are very specific, as well as the scale of the hydrokinetic turbines installed. Large-scale devices lead to very high costs, making it unaffordable for local communities. This problem is discussed by Tan et al. [
28]. The authors outline the four major issues facing the river energy harnessing units: Clogging caused by floating debris, a mismatch between turbine design speeds (~3 m/s) and typical river velocities (~1 m/s), insufficient river depths (<1 m) relative to turbine requirements, and limited affordability and maintenance capacity in remote off-grid communities.
From the environmental point of view, hydrokinetic technologies differ from other technologies with low environmental impact while producing zero emissions and clean energy. However, there are still challenges to be faced as the devices may disrupt the river ecosystems.
When studying the design, the characteristics and the performance of the hydrokinetic turbines and installations, numerical simulations are essential. CFD-based investigations offer faster, reliable, and relatively cheaper results. Studies involving different numerical methods, involving different turbulence models, along with various software packages, commercial and open source, have been published [
29,
30,
31,
32].
The use of hydrokinetic turbines in river conditions offers significant technical and economic benefits. From a technical point of view, these devices allow direct conversion of the kinetic energy of the flow into electricity, without the need to build large water-retention facilities or dams, which reduces capital intensity and preserves the river ecosystem. The economic effect is manifested by reducing the cost of electricity production, especially in remote areas where the connection to the electricity grid is limited. In addition, hydrokinetic turbines have the flexibility to adapt to different flow speeds, which optimizes efficiency and ensures stable energy production throughout the year. In the long term, this leads to the possibility of a faster return on investment and reduced maintenance costs compared to traditional hydroelectric power plants.
Nevertheless, despite the studies mentioned above (mostly conducted in laboratory conditions), there is still a gap in the scientific literature on the investigation of the detailed interaction between the real river flow parameters and the hydrokinetic turbine performance characteristics.
The present article presents an experimental study carried out under real-world conditions to capture the kinetic energy of flowing water in the Iskar River, Bulgaria. The goal of the study is to evaluate the potential for using scaled-down models of horizontal-axis hydrokinetic turbines in Bulgarian rivers with low flow velocities, as this technology is still not implemented in the country. This study distinguishes itself from previous research conducted in Bulgaria by employing two hydrokinetic turbine geometries that had not been previously tested within the country. Their performance was evaluated against a widely used conventional turbine, and the results demonstrate that the selected geometries exhibit significantly higher efficiency compared to standard designs.
2. Bulgarian Hydroenergy Potential
National Electric Company EAD is the largest producer of electricity from water resources in Bulgaria. The company is state-owned and operates 31 hydroelectric power plants (28 hydroelectric power plants (HPPs) and 3 pumped hydroelectric energy storage (PHES)) with a total installed capacity of 2737 MW in turbine mode and 931 MW in pump mode and some small hydroelectric power plants (SHP) listed in
Table 1. With its capacities, National Electric Company EAD actively participates in managing and regulating the country’s energy system. HPP and PHES are major contributors to Bulgaria’s electricity system with their fast-maneuvering capabilities and extensive coverage [
33,
34].
Table 2 illustrates the construction of hydroelectric power plants in Bulgaria over the years. Now, approximately 3.2 GW of hydropower capacity has been installed in Bulgaria, with roughly 290 plants in total [
34].
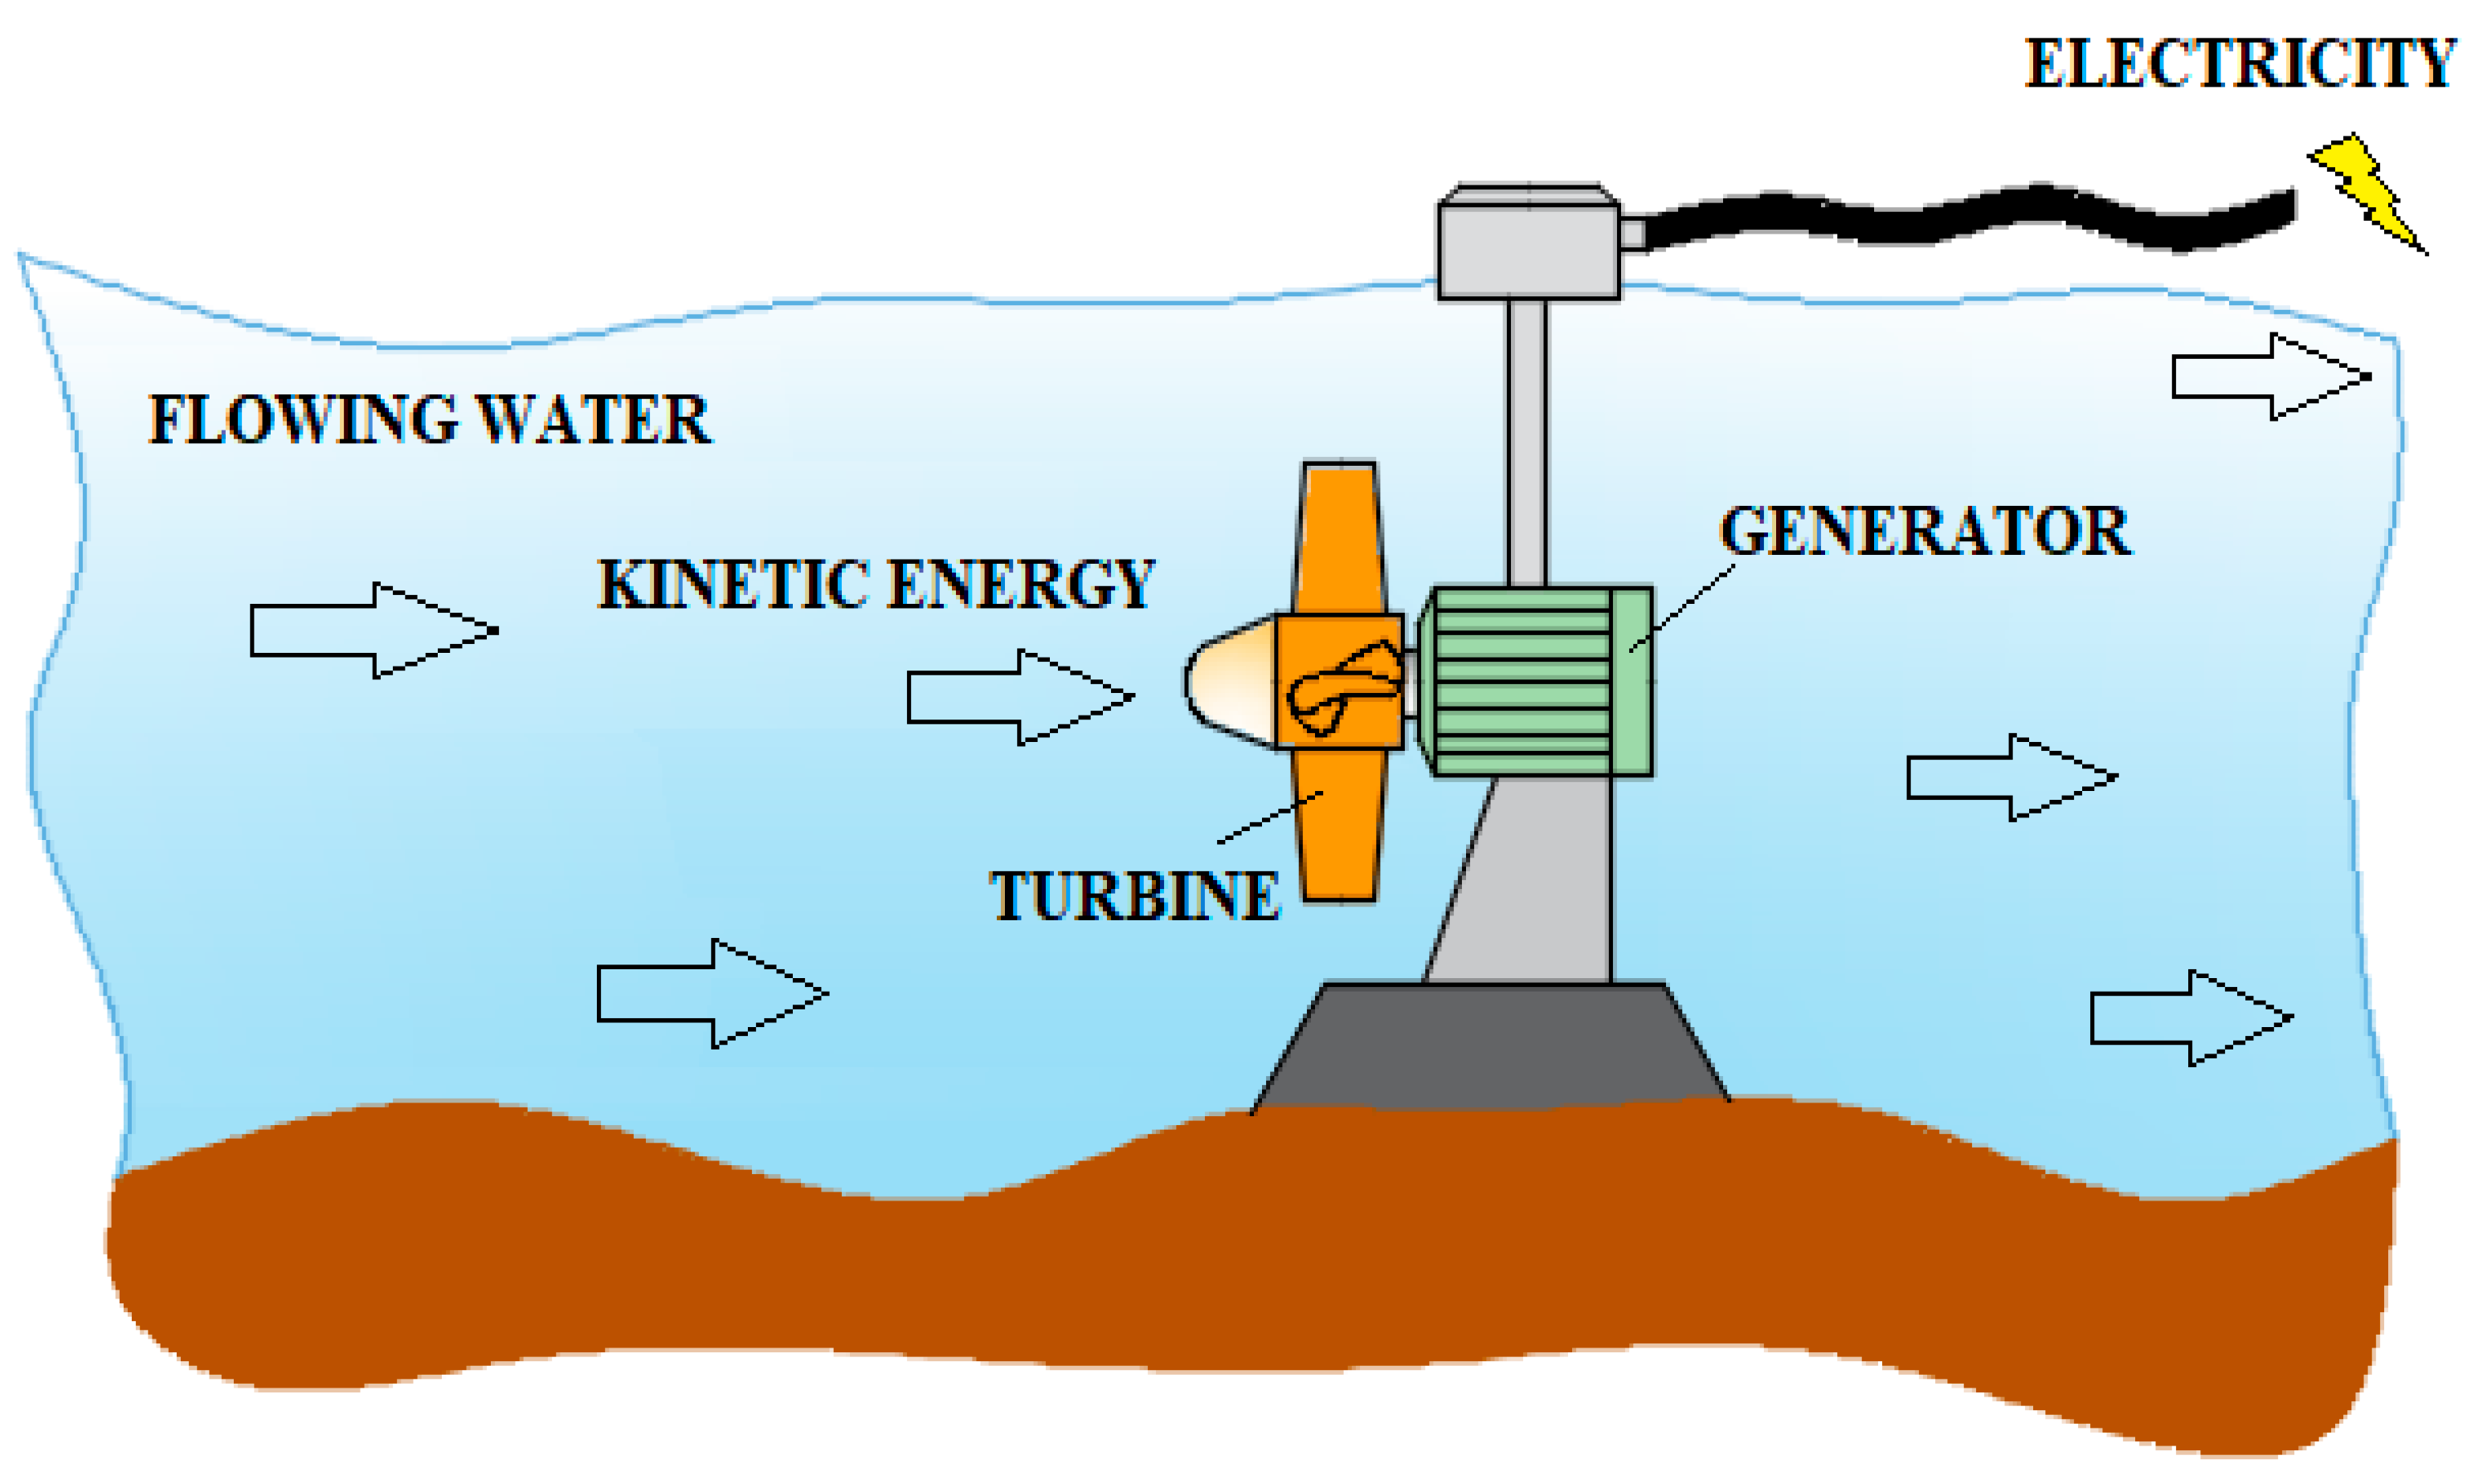
The utilization of the kinetic energy from flowing water is a fundamental principle in generating hydroelectric power. This mechanical energy is converted into electricity using hydraulic turbines and generators (
Figure 3). These systems offer an environmentally friendly option for producing electricity, thereby reducing their impact on natural ecosystems. Unlike conventional hydroelectric power plants, this type of power facility does not require storing water in reservoirs beforehand, making it especially sustainable and low-impact. For this purpose, so-called hydrokinetic turbines are employed. The power contained in the stream but not that provided by the turbines, which have an efficiency can be calculated with the following equation:
where
—water density [kg/m
3],
—turbine area [m
2], and
—flow velocity; [m/s].
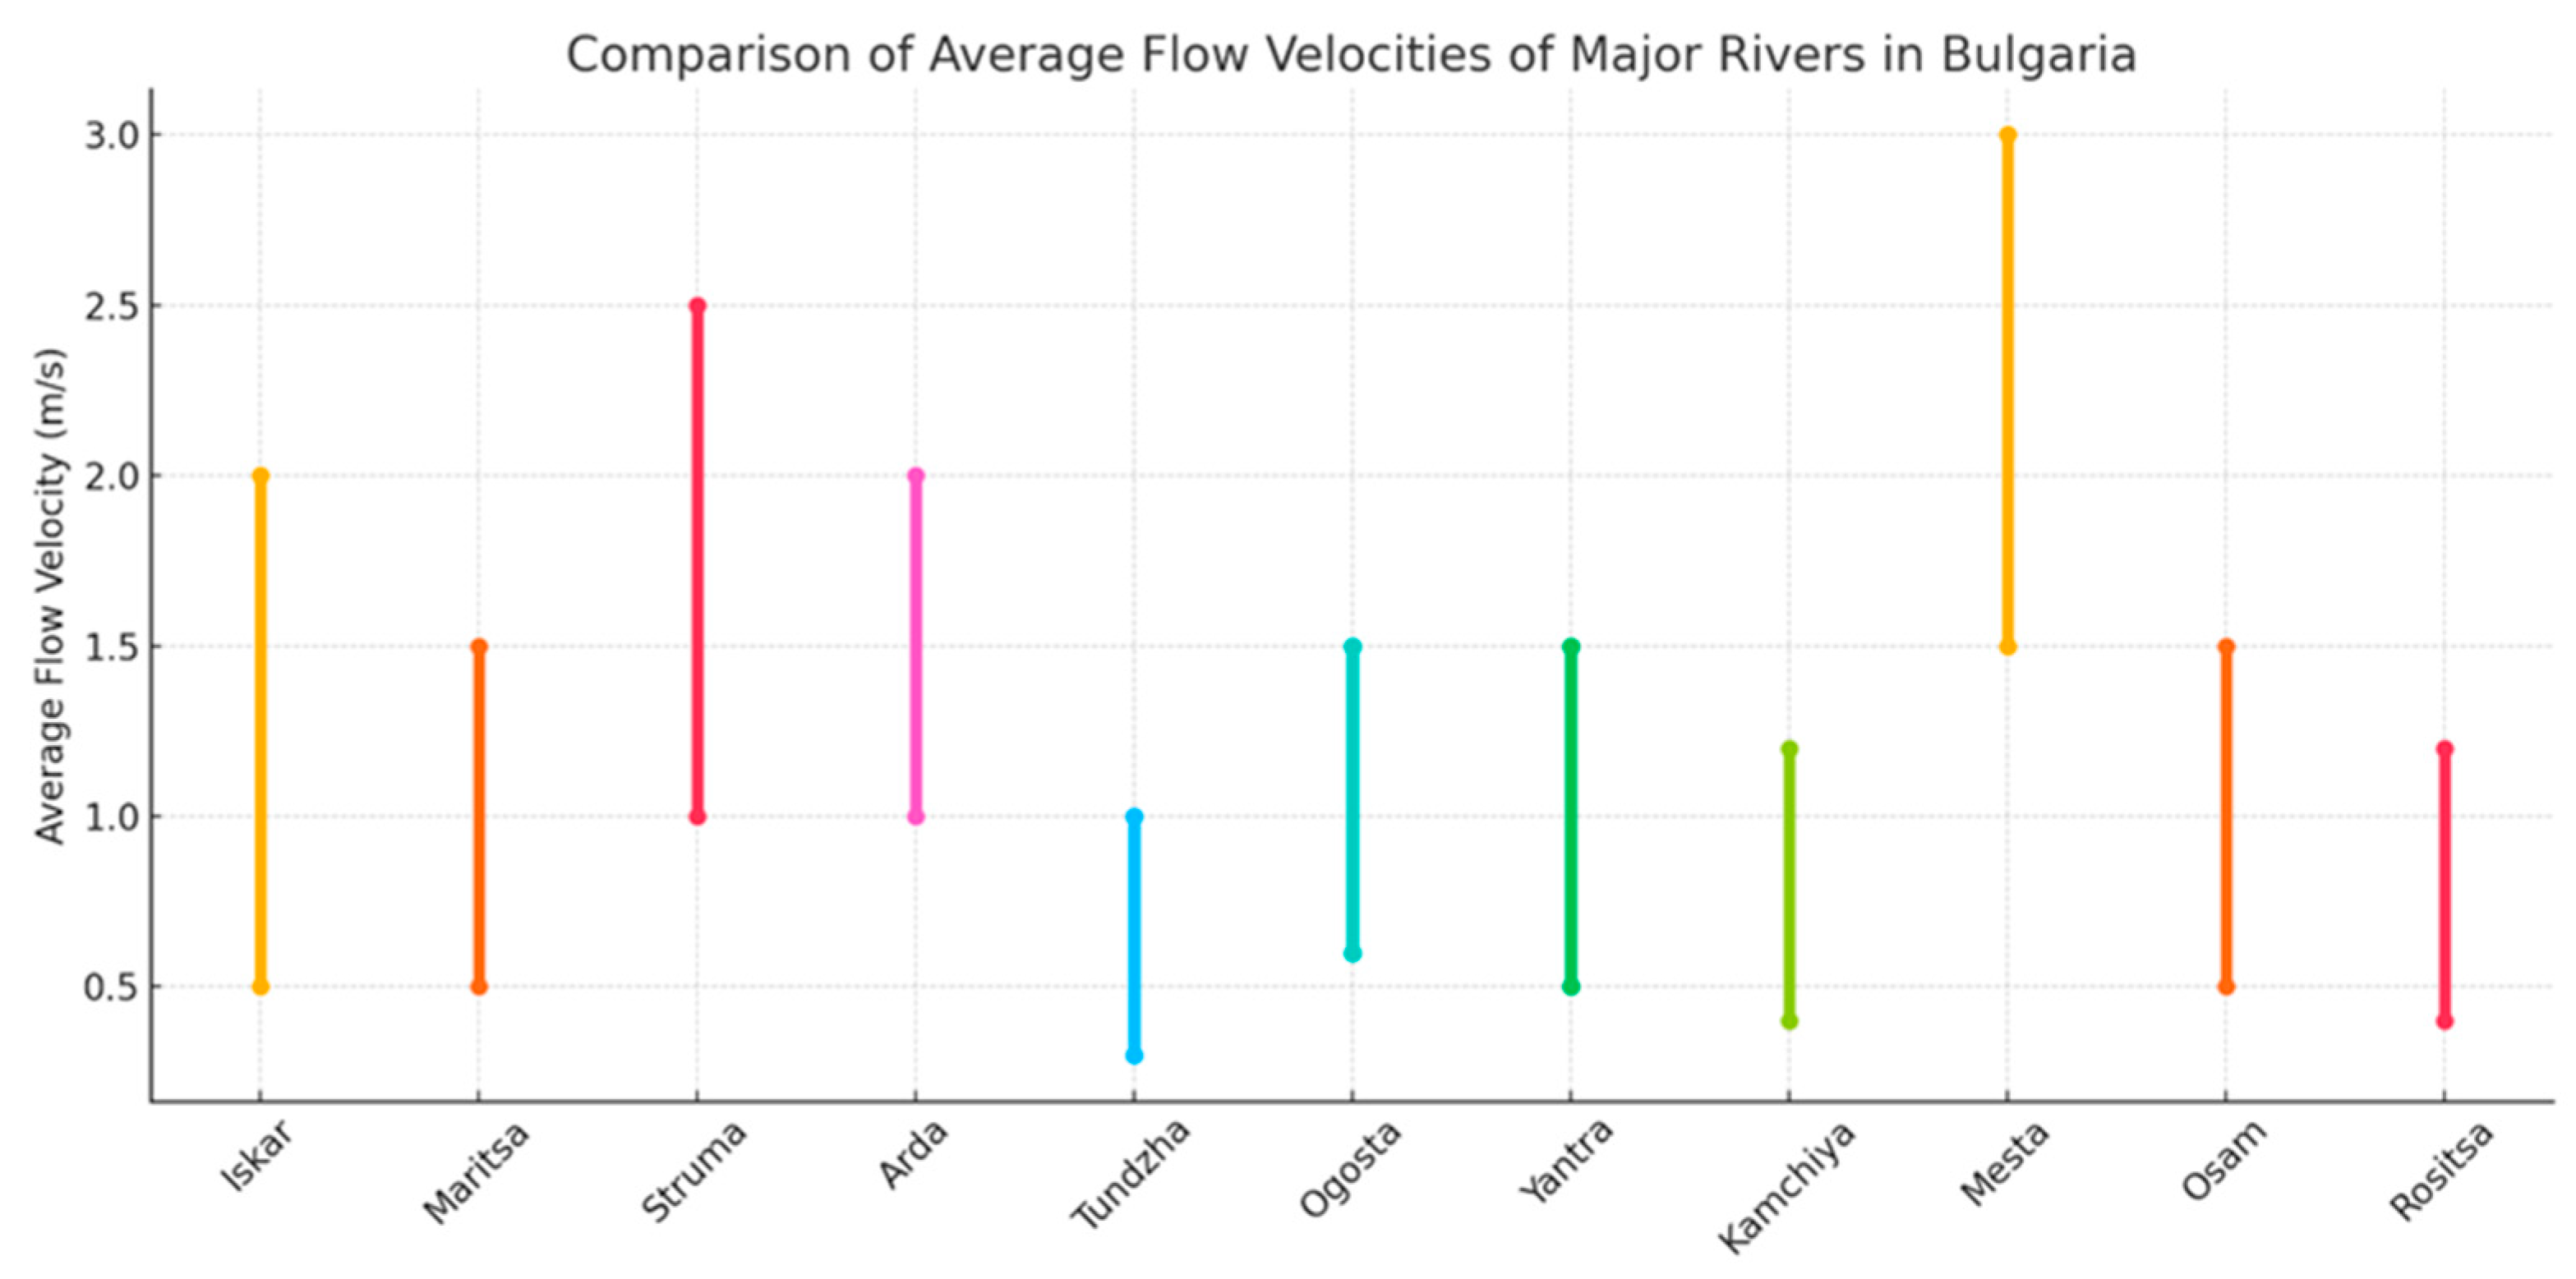
As shown in
Figure 4, the Mesta River has the highest recorded flow velocity, reaching up to 3 m/s. The lowest flow velocities are observed in the Tundzha and Rositsa Rivers. The Iskar, Arda, and Struma Rivers also have relatively high flow velocities. However, since the Mesta River is a protected natural reserve, the Iskar River was chosen for this experimental study.
3. Methodology of the Experiment
Field experiments of hydrokinetic turbines differ fundamentally from the studies in laboratory conditions in several key aspects that directly influence their performance.
The first factor is accessibility. In most cases, riverbanks do not provide ideal conditions for installing measurement equipment, which can lead to inaccuracies in data collection. For the present study, a specific site along the Iskar River was carefully chosen to ensure adequate accessibility to the riverbed, reducing potential measurement errors and facilitating the setup of the experimental equipment.
Figure 5 presents the location of the measurement site, along with a photograph taken on the day of the measurements.
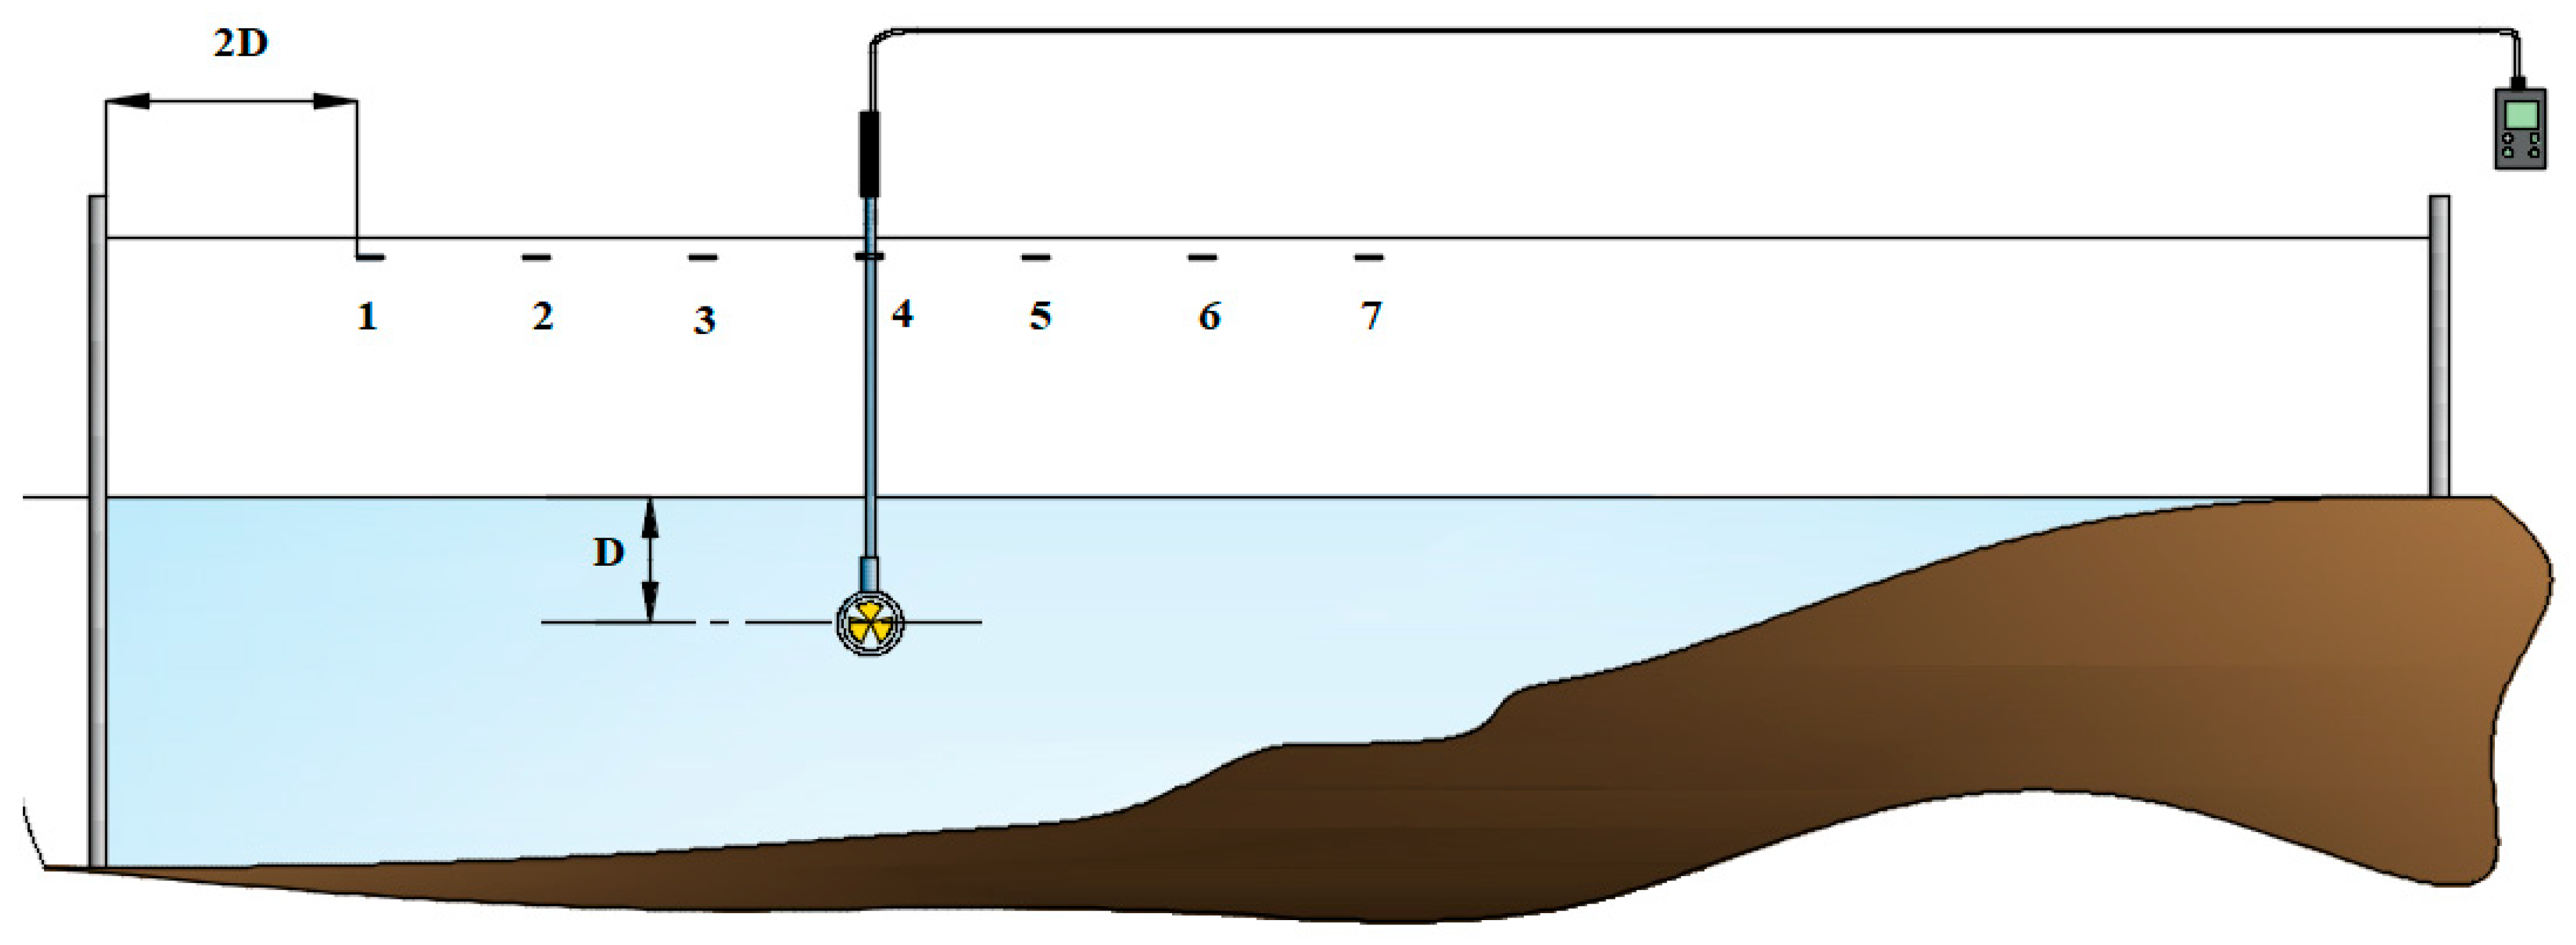
The second, more important difference when working with field experiments compared to laboratory conditions is the impact of boundary conditions. In laboratory settings, almost all flow parameters—such as velocity, depth, direction, and uniformity—can be precisely controlled. Consequently, performing field experiments necessitates multiple initial testing phases. The first phase involves measuring the average velocity and its stability within the designated experimental area. Initially, a velocimeter is employed to scan the riverbed and locate regions where the target flow velocity is achieved. For this phase, a Flow Watch device equipped with a 60 mm water propeller was employed, featuring a measurement range of 0.1–10 m/s and an accuracy of ±2%. The velocimeter has calibration certificates, and its error is ±5%. In this case, target velocities range from 0.4 to 0.5 m/s. This velocity range was selected to maintain consistency with the velocity field used during previous laboratory studies of the model hydrokinetic turbines. Once flow velocities within the target range are identified, the experimental section is marked by installing a metal pole (marker) to indicate the downstream boundary of the measurement zone. The marker is placed at a distance equal to twice the turbine rotor diameter in the direction of increasing velocity. A rope with distance indicators is then attached to the marker to establish reference points relative to the riverbank, allowing for the measurement of average flow velocities at specific points labeled 1 through 7. It is important to note that the velocity field is measured in a zone where the water depth (a tape measure was used to measure the depth) from the surface equals the diameter of the tested hydrokinetic turbines. A schematic example of the velocity field measurement setup is shown in
Figure 6. When placing the velocity probe, care is taken to avoid disturbing the flow. An intermediate handle attached to the probe is used to maintain accurate positioning without affecting the surrounding water movement.
To determine the average flow velocities as shown in
Figure 6, four separate measurement sessions were carried out over an hour. These points were revisited every 15 min, with both the maximum and minimum velocities at each site being recorded. This method provides insight into the range of velocity fluctuations at each point, enabling an assessment of flow variability. It is important to note that these measurements are taken within a natural riverbed, where boundary conditions are likely to influence the velocity field.
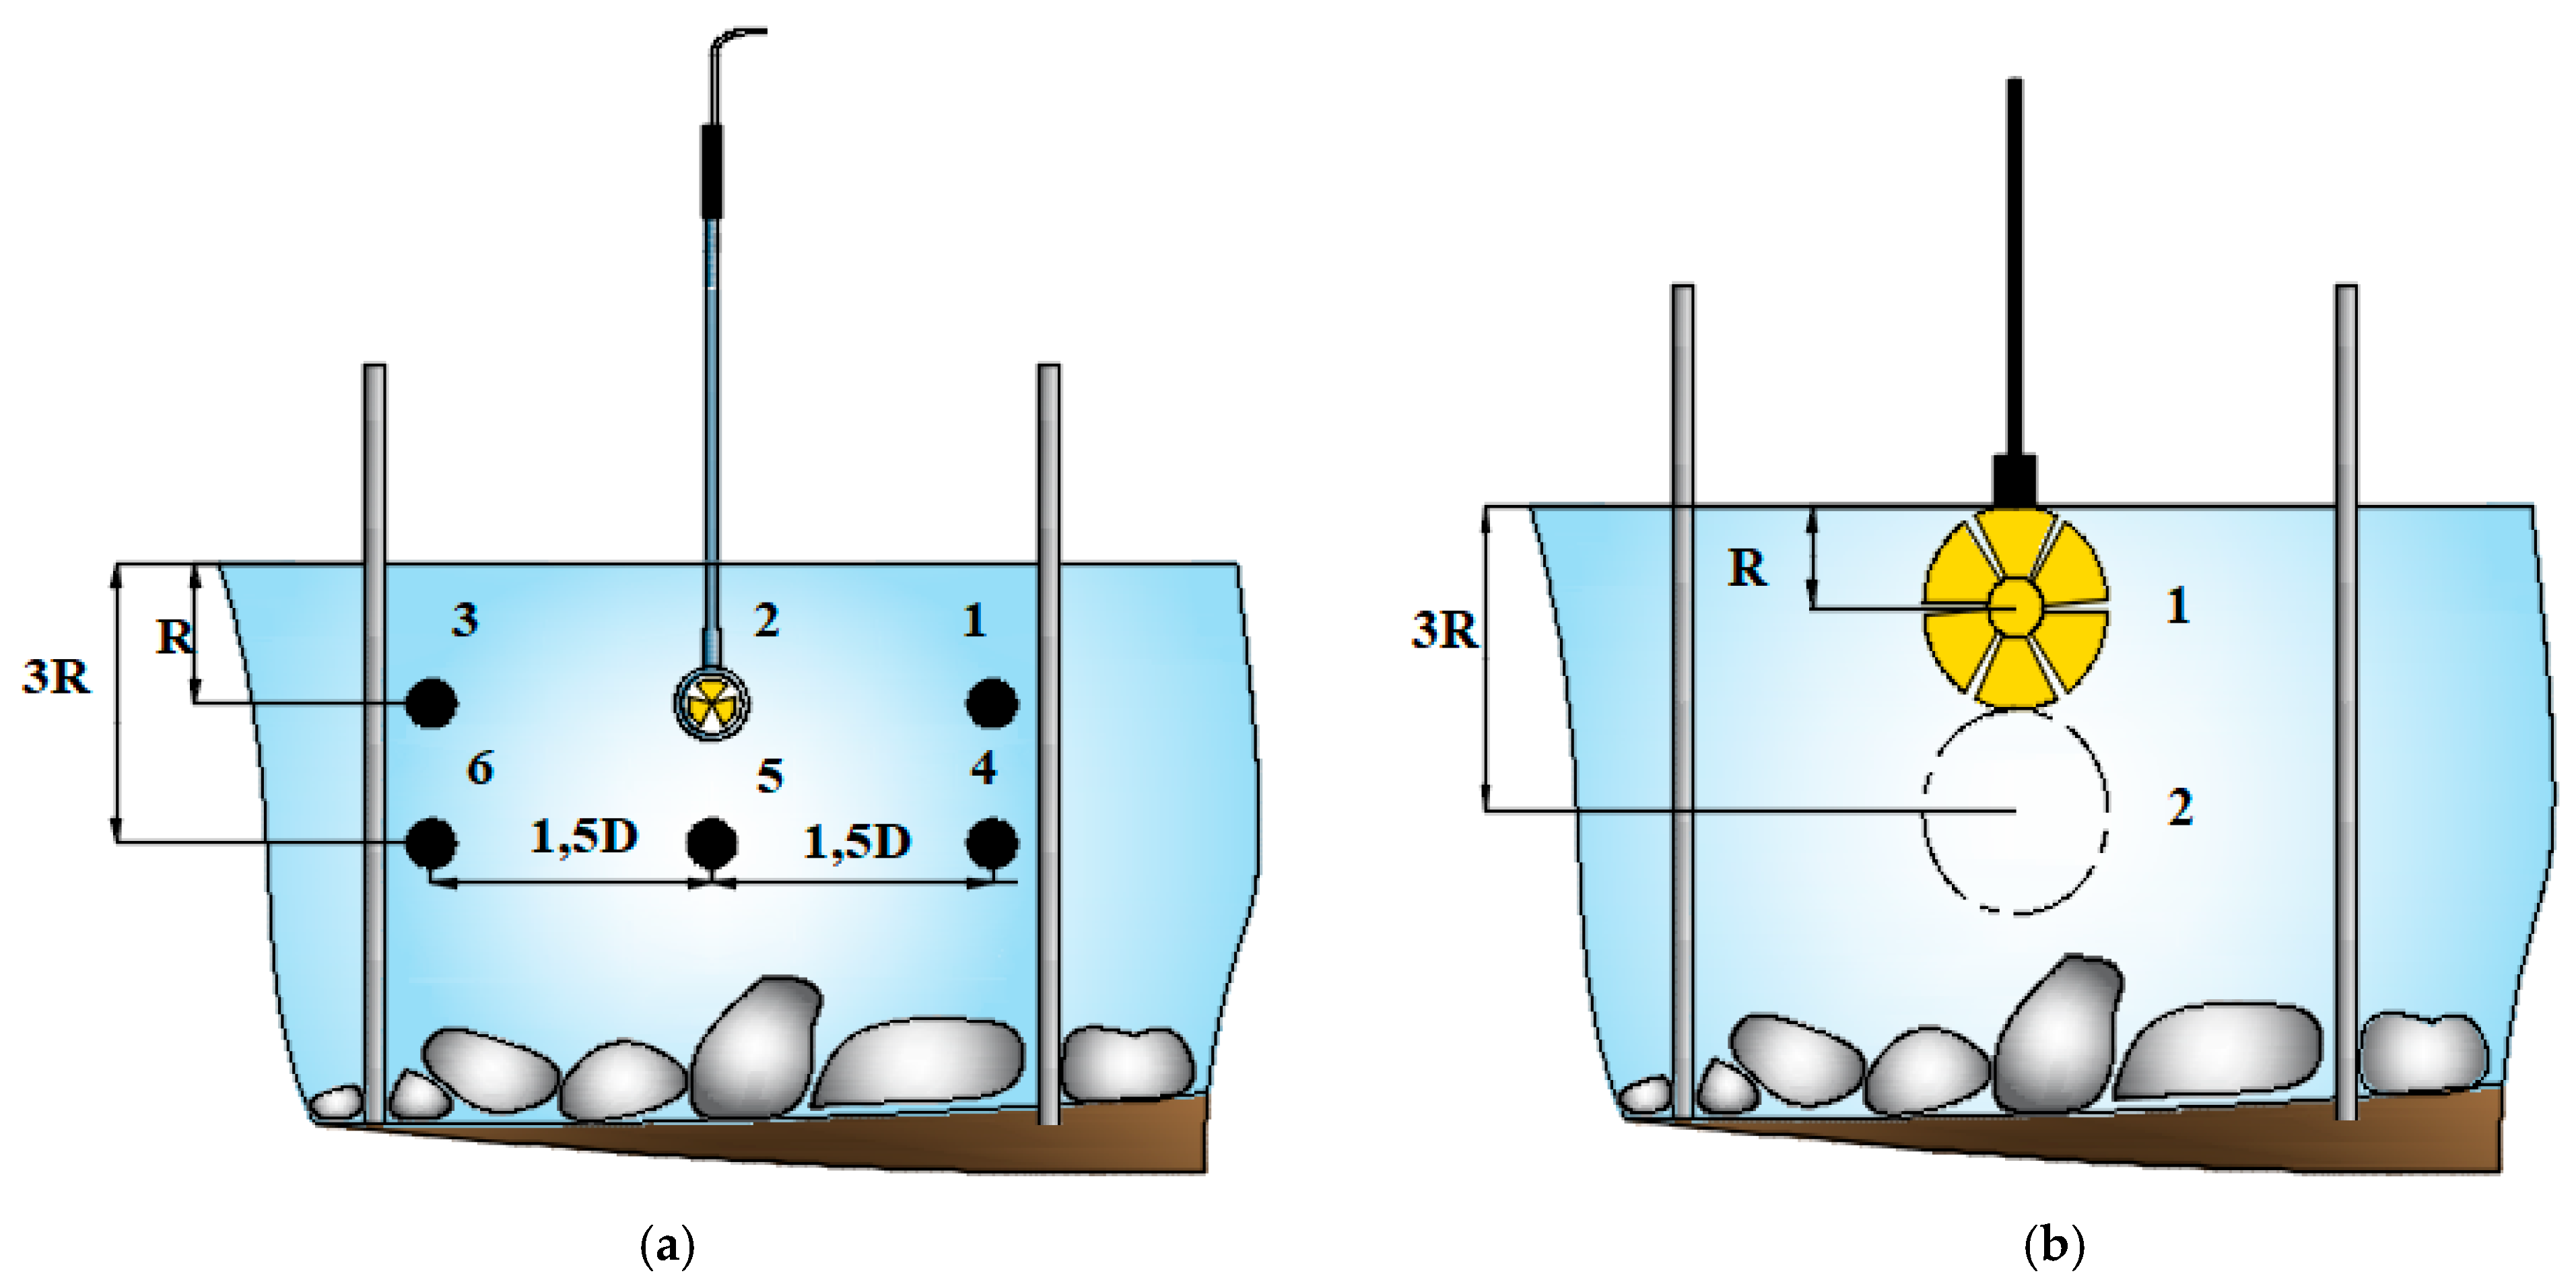
Once the suitable section for turbine installation was identified, the metal pole previously used for boundary marking was moved to define a new segment that includes the operational velocity area of the hydrokinetic turbine. Measurement points for velocity measurement and locations for turbine installation were then determined.
Figure 7 shows the locations of the velocity measurement points (a) and the designated sites for installing the tested turbines (b).
The measurement procedure was as follows: First, the velocity field was measured. Then, the turbine unit being studied was installed, and its operational parameters—specifically, rotational speed and torque—were recorded. Before installing each turbine, velocity field tests were repeated. This was necessary because the river’s flow conditions are dynamic and can vary due to external influences. Simultaneous testing of both the turbine unit and the velocity probe was not possible due to mutual interference between them. It is also important to highlight that, unlike laboratory experiments—where turbines are usually tested in open channels—the riverbed in this case is covered with stones. These stones affect the flow, especially in the areas immediately around them. Because of this specific feature, measurements were limited to two points at the center of the section defined by the markers, where it was possible to install the turbine to operate near the surface, submerged at a minimum depth of 3R from the axis.
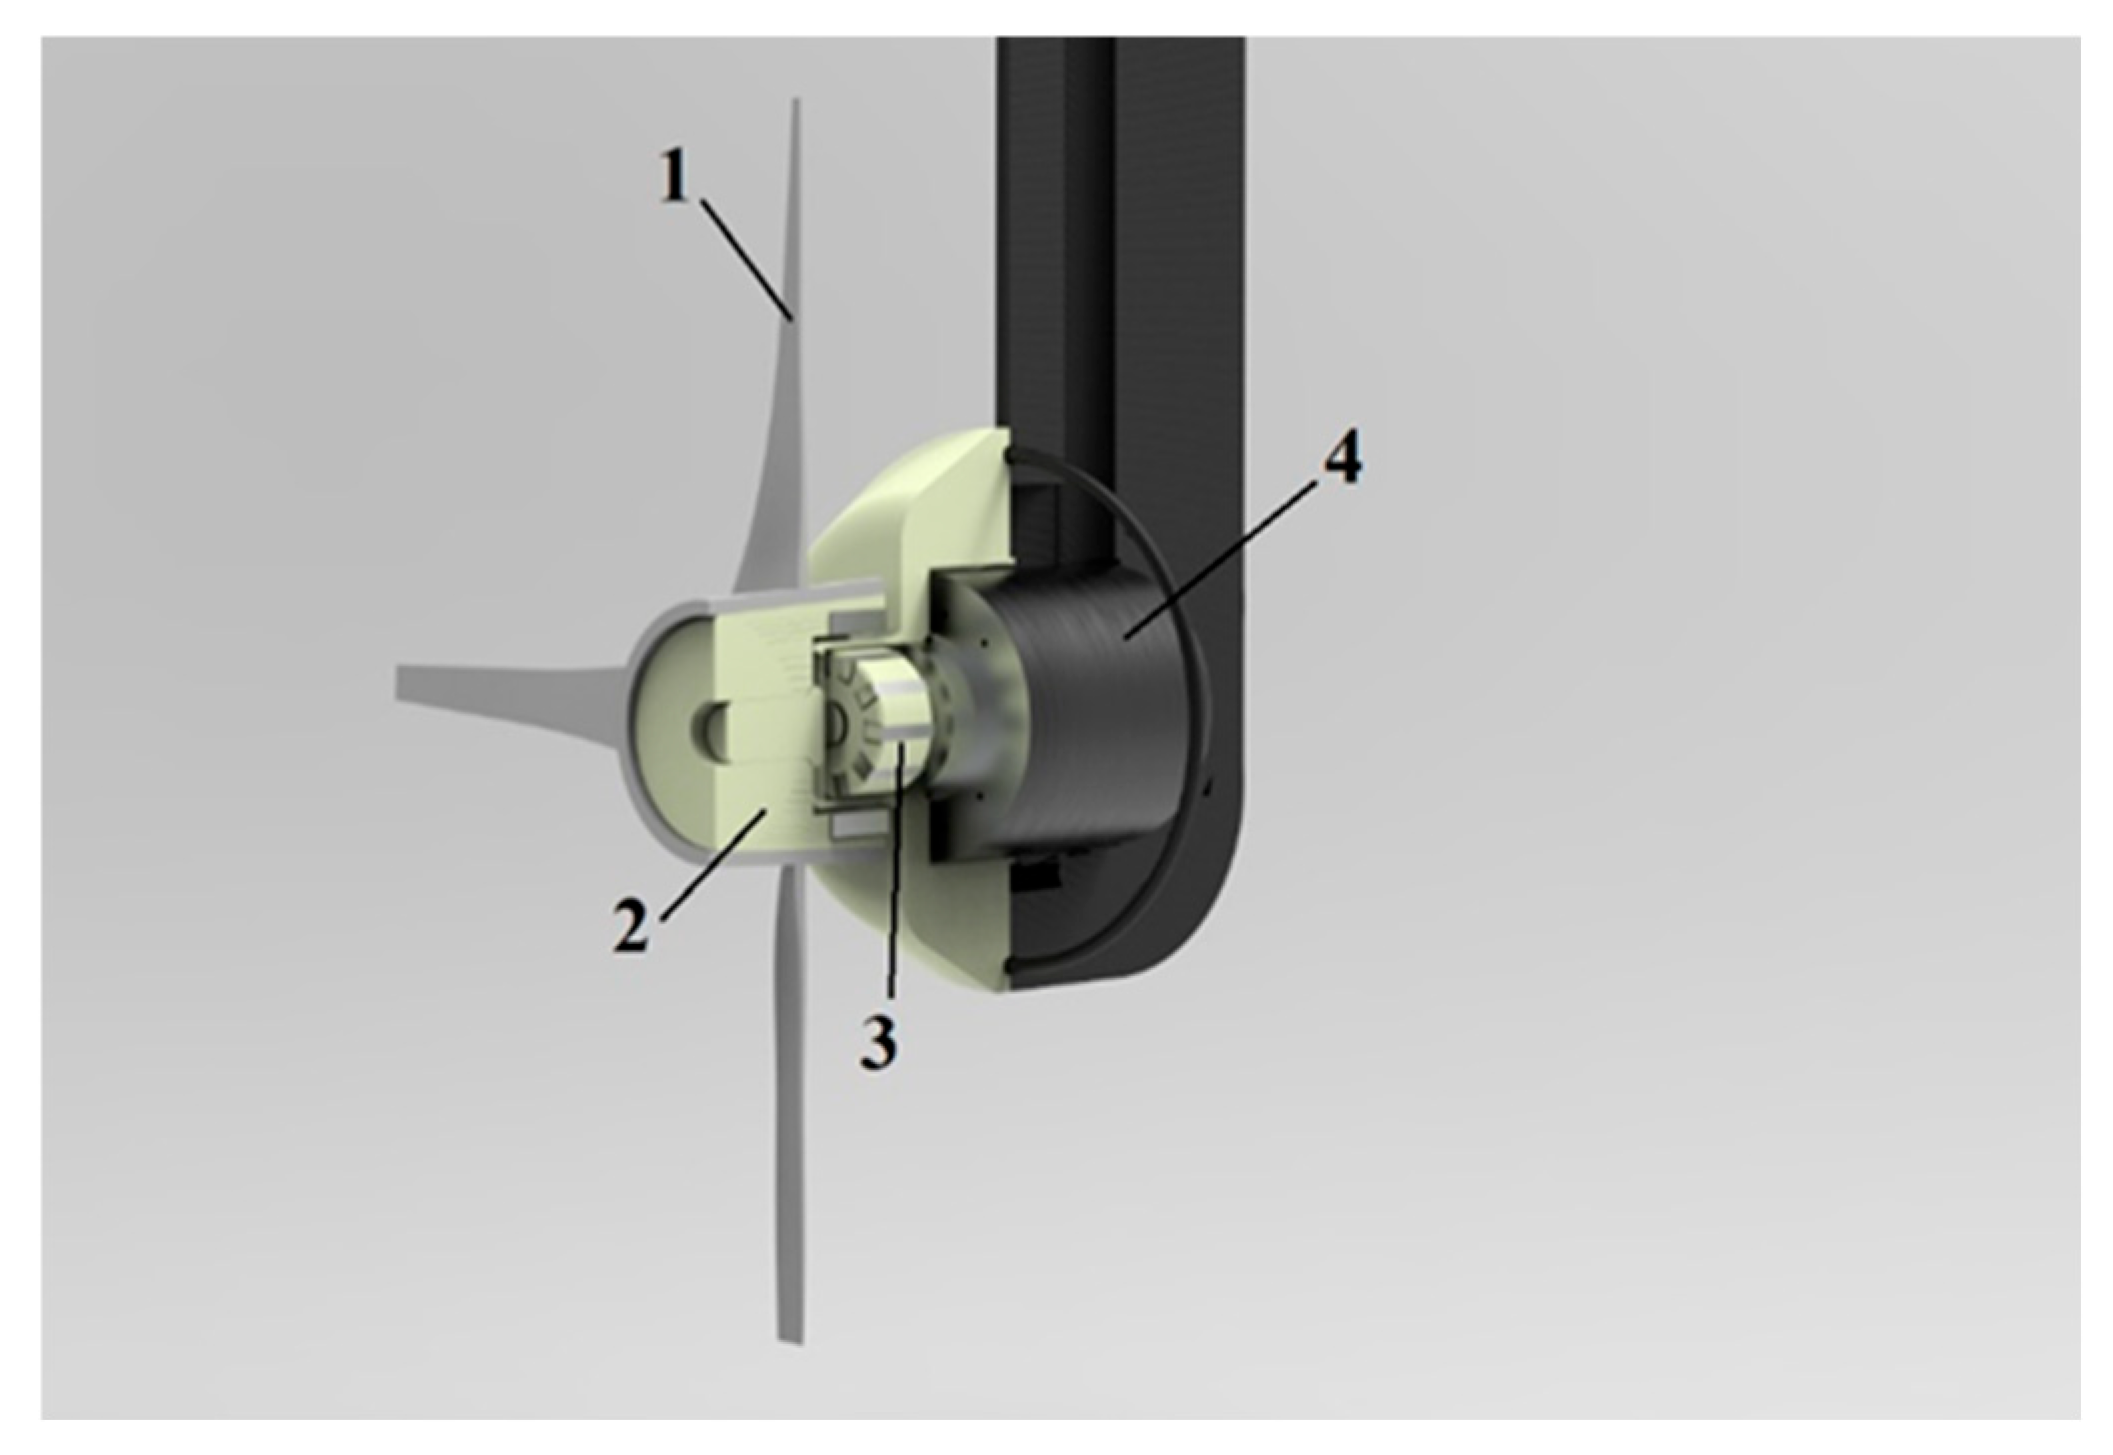
To ensure consistent flow velocity during the experiments, tests were performed to determine the rotational speed of the turbine units. The rotational speed, torque, and flow velocity stability were measured and recorded using an encoder integrated into the turbine unit. A schematic diagram of the assembly is provided in
Figure 8. From a design perspective, to maintain the watertight integrity of the system, torque transmission is achieved through a magnetic coupling consisting of a rotor (3) and a conical hub or “bell” (2). The model hydrokinetic turbines are mounted onto the bell. This setup ensures the encoder (4) is protected and sealed, enabling it to operate reliably underwater.
Where 1—runners, 2—bell, 3—rotor, 4—encoder.
The placement of the turbine is performed using a shaft extending from the unit, equipped with markers indicating the distance to the turbine runner axis, as shown in
Figure 7b.
The encoder measures two main parameters: the rotational frequency f and the measurement time t.
The rotational frequency is calculated based on the relationship given by Equation (2).
where
f, Hz—Frequency recorded by the encoder.
k—The encoder constant. It converts the frequency from Hz to min−1.
Calculation of the torque is performed according to Equation (3):
where
T, Nm—Torque.
I, kg m2—Total moment of inertia of the system, including the moments of inertia of the individual turbine runners, the coupling, and the encoder. These values have been pre-determined for all tested models.
α, rad.s−2—Angular acceleration of the unit.
The encoder can record data every 10 ms. This resolution is sufficient to capture the acceleration of each turbine runner from rest to its highest rotational speed. To minimize measurement error, each wheel undergoes a testing sequence that includes at least three complete stop-start cycles. The uncertainty of the whole measurement process is ±5%.
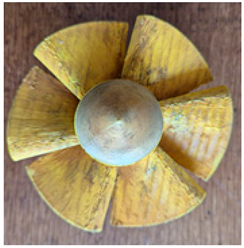
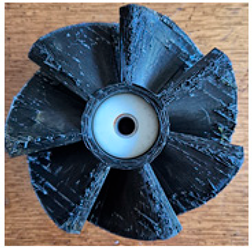
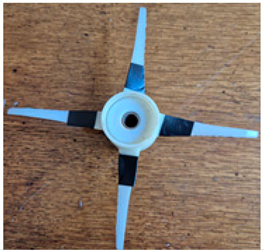
In the present experiment, tests are performed on three hydrokinetic turbine runner designs, each with a different blade profile and number of blades. The tested turbine runners are listed in
Table 3, where the number of blades z and the outer diameter D of each runner are provided.
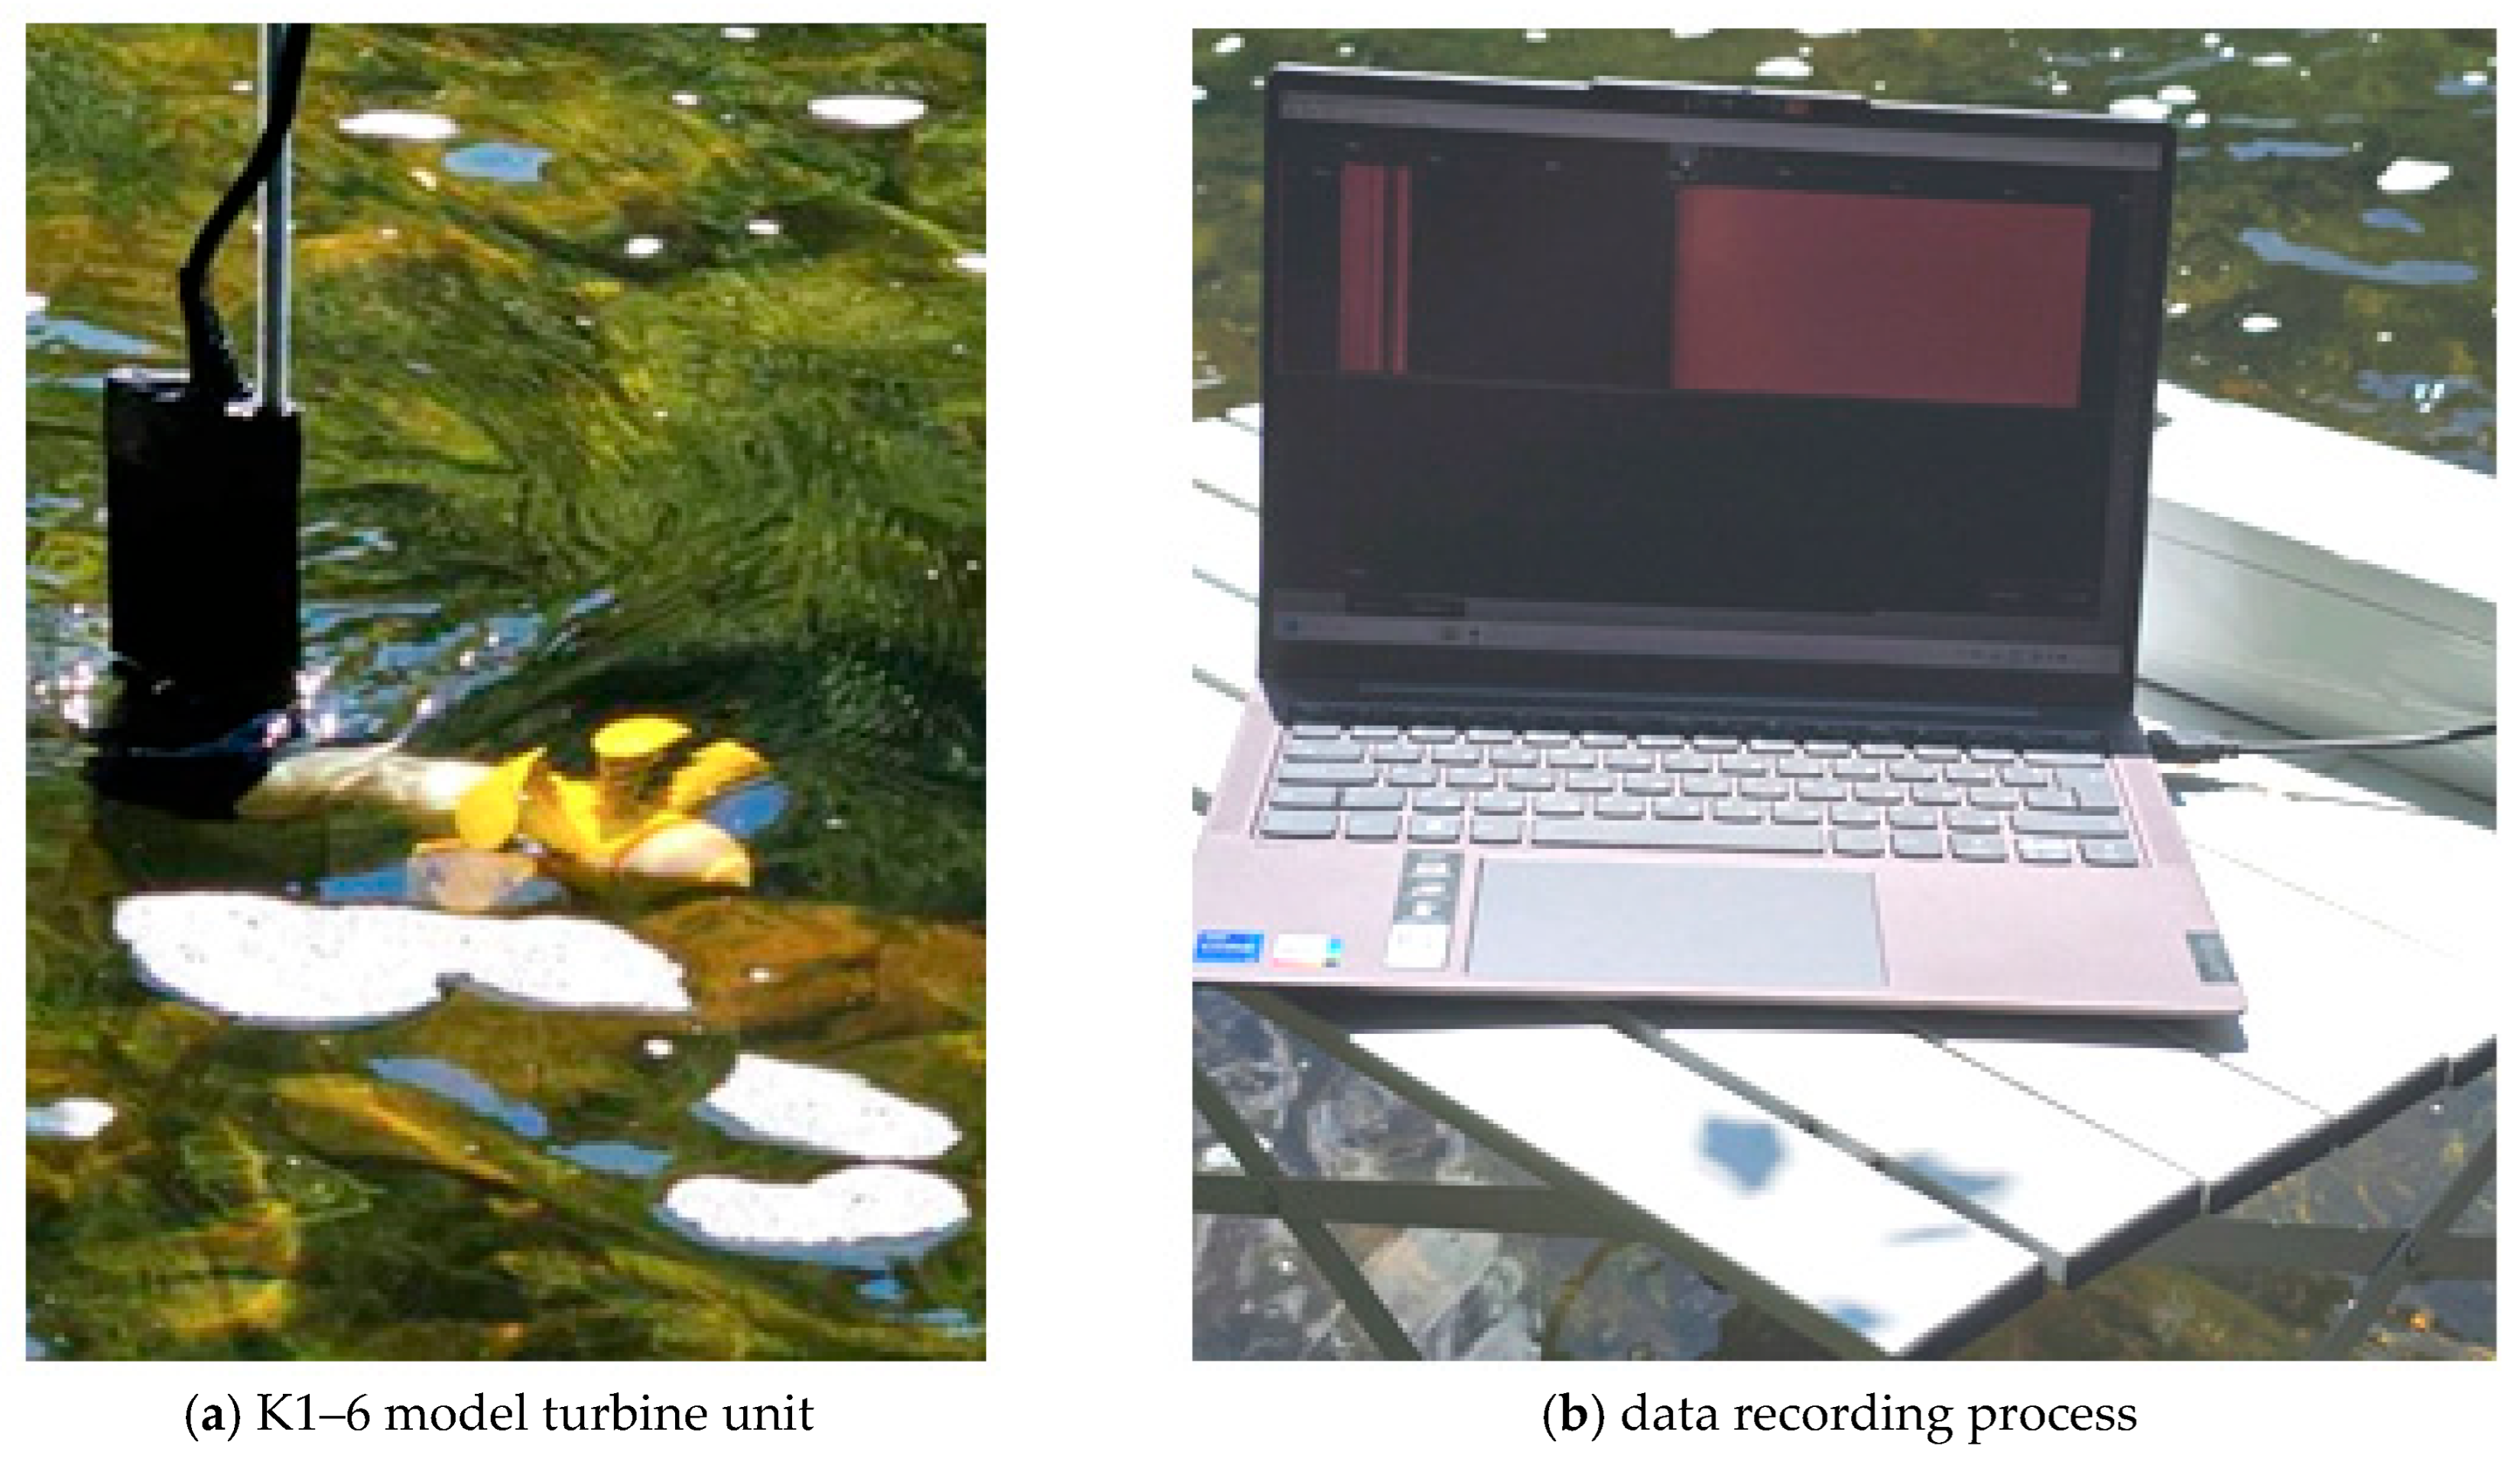
Images taken during the experiments are presented in
Figure 9, where the submersibility of turbine K1–6 (a) and the encoder recordings (b) are visible.
4. Experimental Results
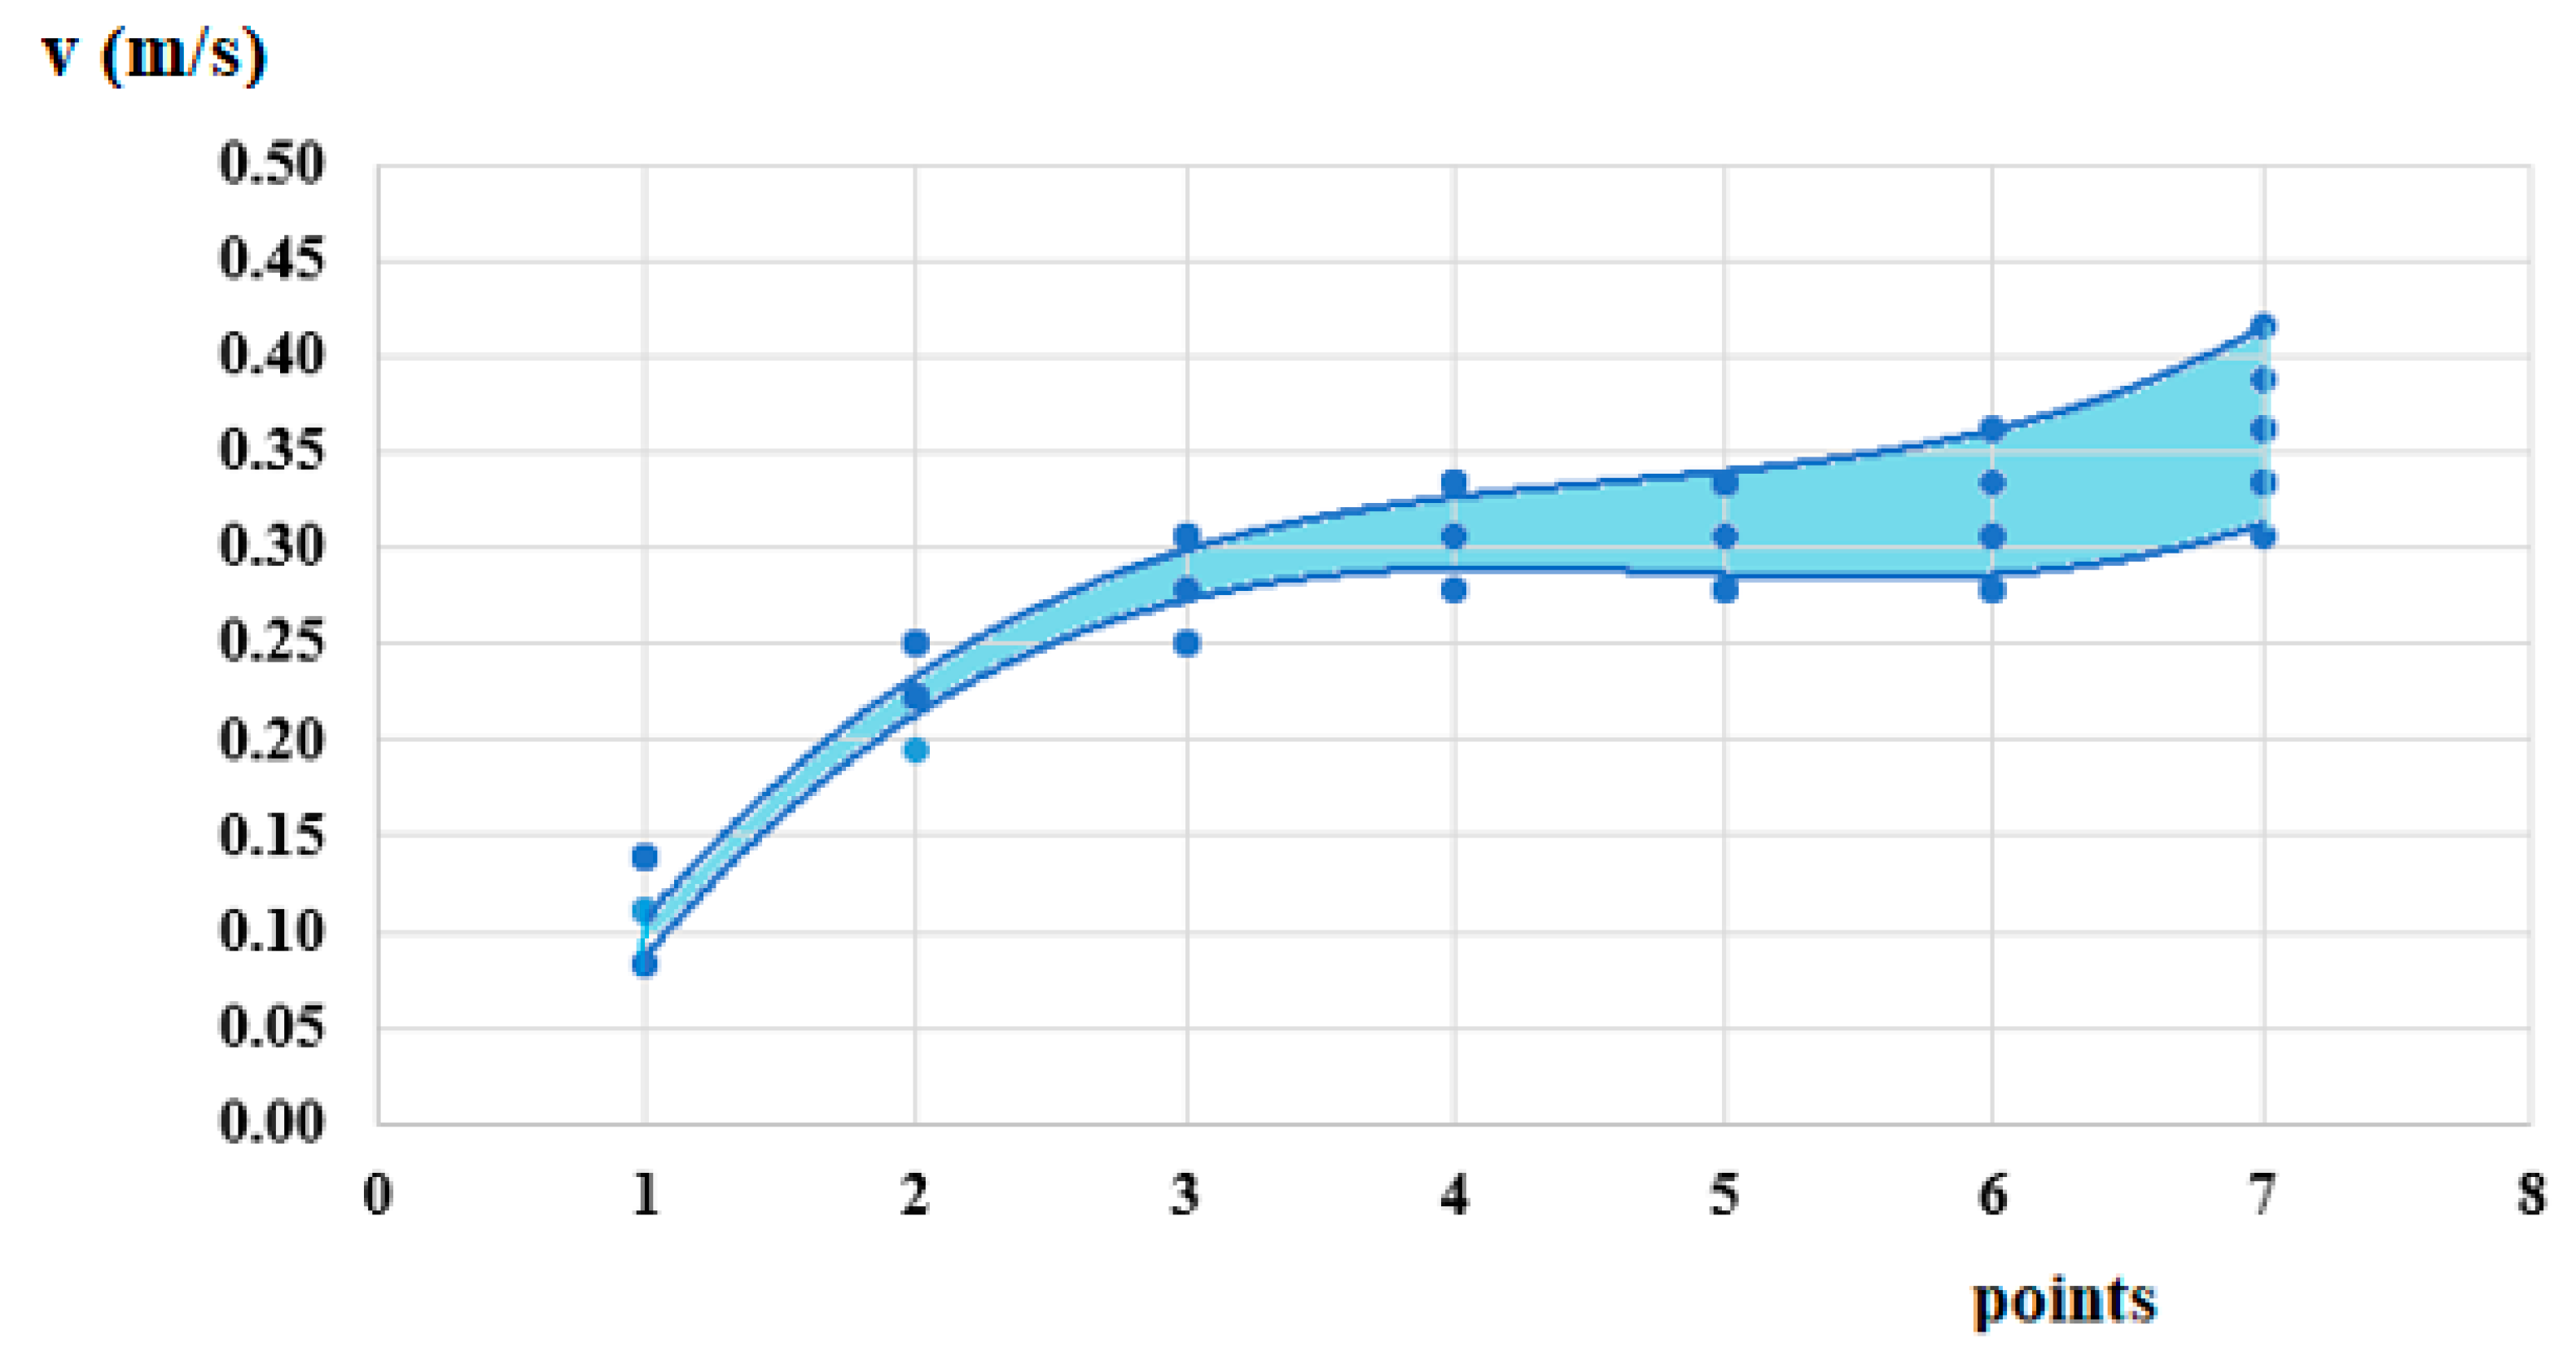
The results from the initial flow velocity tests, as outlined in
Figure 2, are presented in
Table 4 and shown in the graph in
Figure 10.
For certain positions of the velocimeter, the graph contains fewer data points due to overlapping or identical measured velocity values.
Despite the variability of river flow, influenced by numerous boundary conditions,
Figure 10 shows that in each section, velocity fluctuations remain within the range of 0.05 to 0.1 m/s. These fluctuations are expected to impact the power output and rotational frequency characteristics of the turbine unit. The average flow velocities were also recorded during the experiments, and based on this data, Section 7 was chosen as the turbine installation point. This choice was also guided by the design requirement that the turbine rotors operate optimally within a velocity range of 0.3 to 0.4 m/s.
Based on the presented results, Section 7—visualized in
Figure 10—was identified as the most suitable location for installing the hydrokinetic turbine.
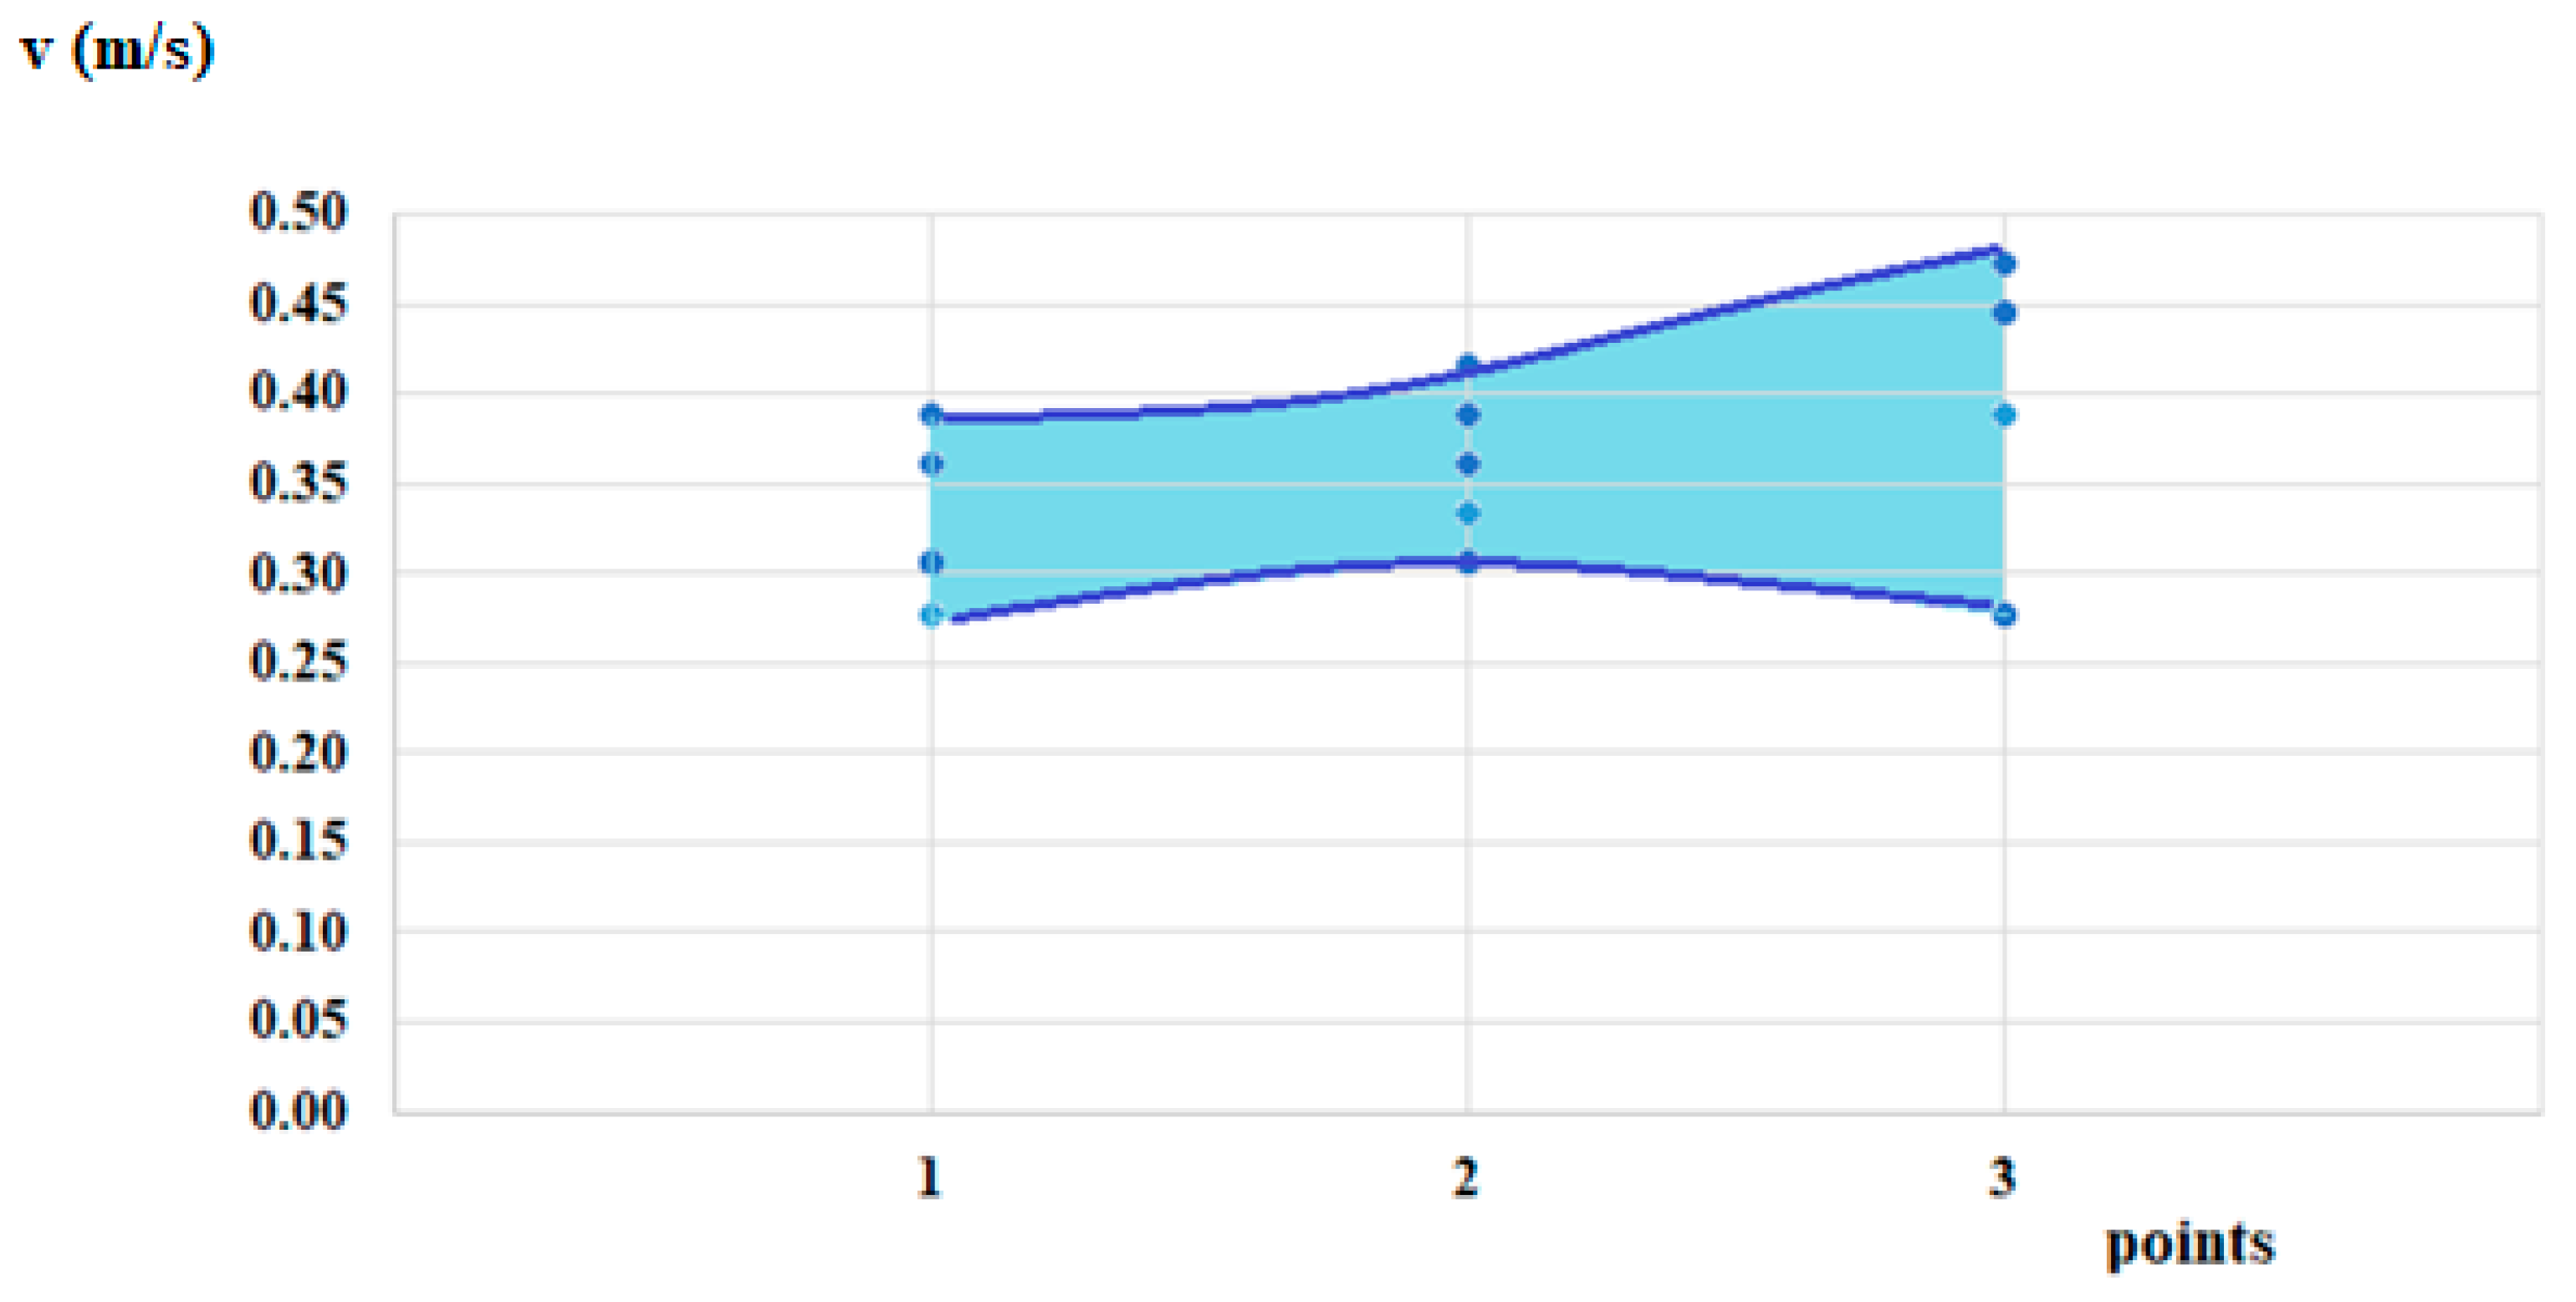
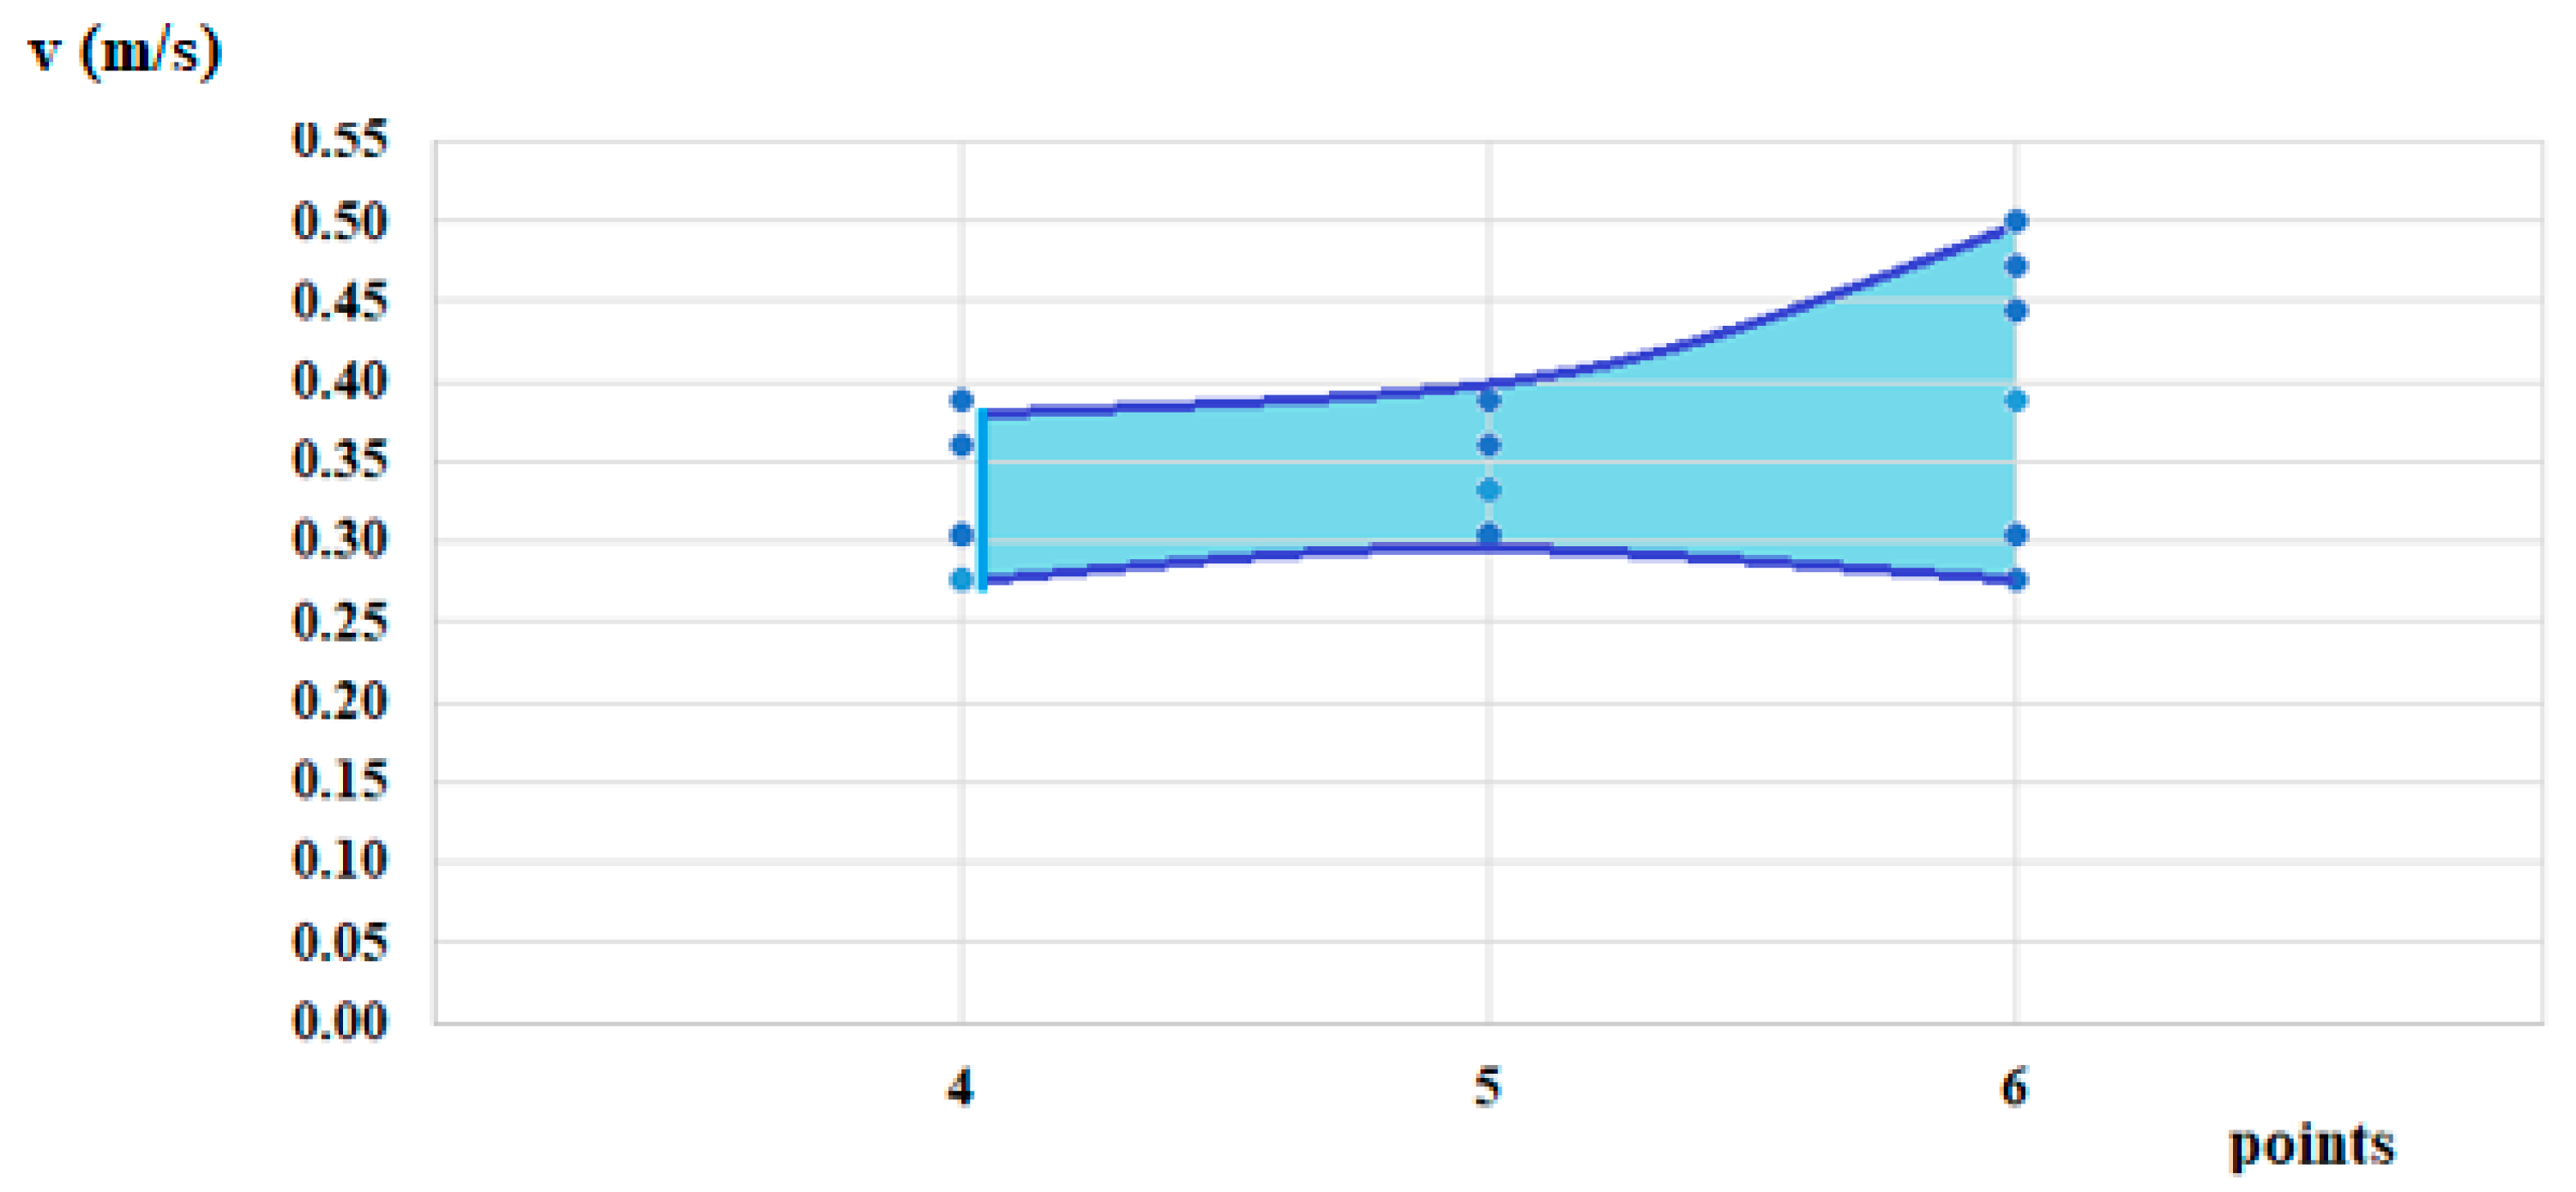
The data obtained from the velocity field measurements within the test section, as outlined in
Figure 7a,b of the methodology, are presented in
Table 5 and illustrated in
Figure 11.
Point 2 in the figure defines the first test zone of the turbine unit.
Point 5 from
Figure 12 defines the second testing zone for the turbine unit.
The two velocity fields form the basis for calculating the average flow velocities at the test cross-sections. Using instantaneous values would only be possible if multiple sensors and transmitters could record all parameters in real time. An important consideration is that the installed sensors must not interfere with each other or introduce noise into the measurements.
Therefore, in order to determine the effective available power, we will use the average flow velocities measured in both sections, which is approximately v = 0.35 m/s.
Table 6 displays the parameters that define the turbine unit’s output power.
It should be noted that the table shows the average values of the rotational frequency for each test, acting as an equivalent to the average flow velocity.
The parameter t in the table indicates the time it takes for the turbine unit to accelerate from rest to its maximum steady-state rotational frequency.
The formula used to calculate the shaft power is
where ω, rad/s—angular velocity of the turbine runner.
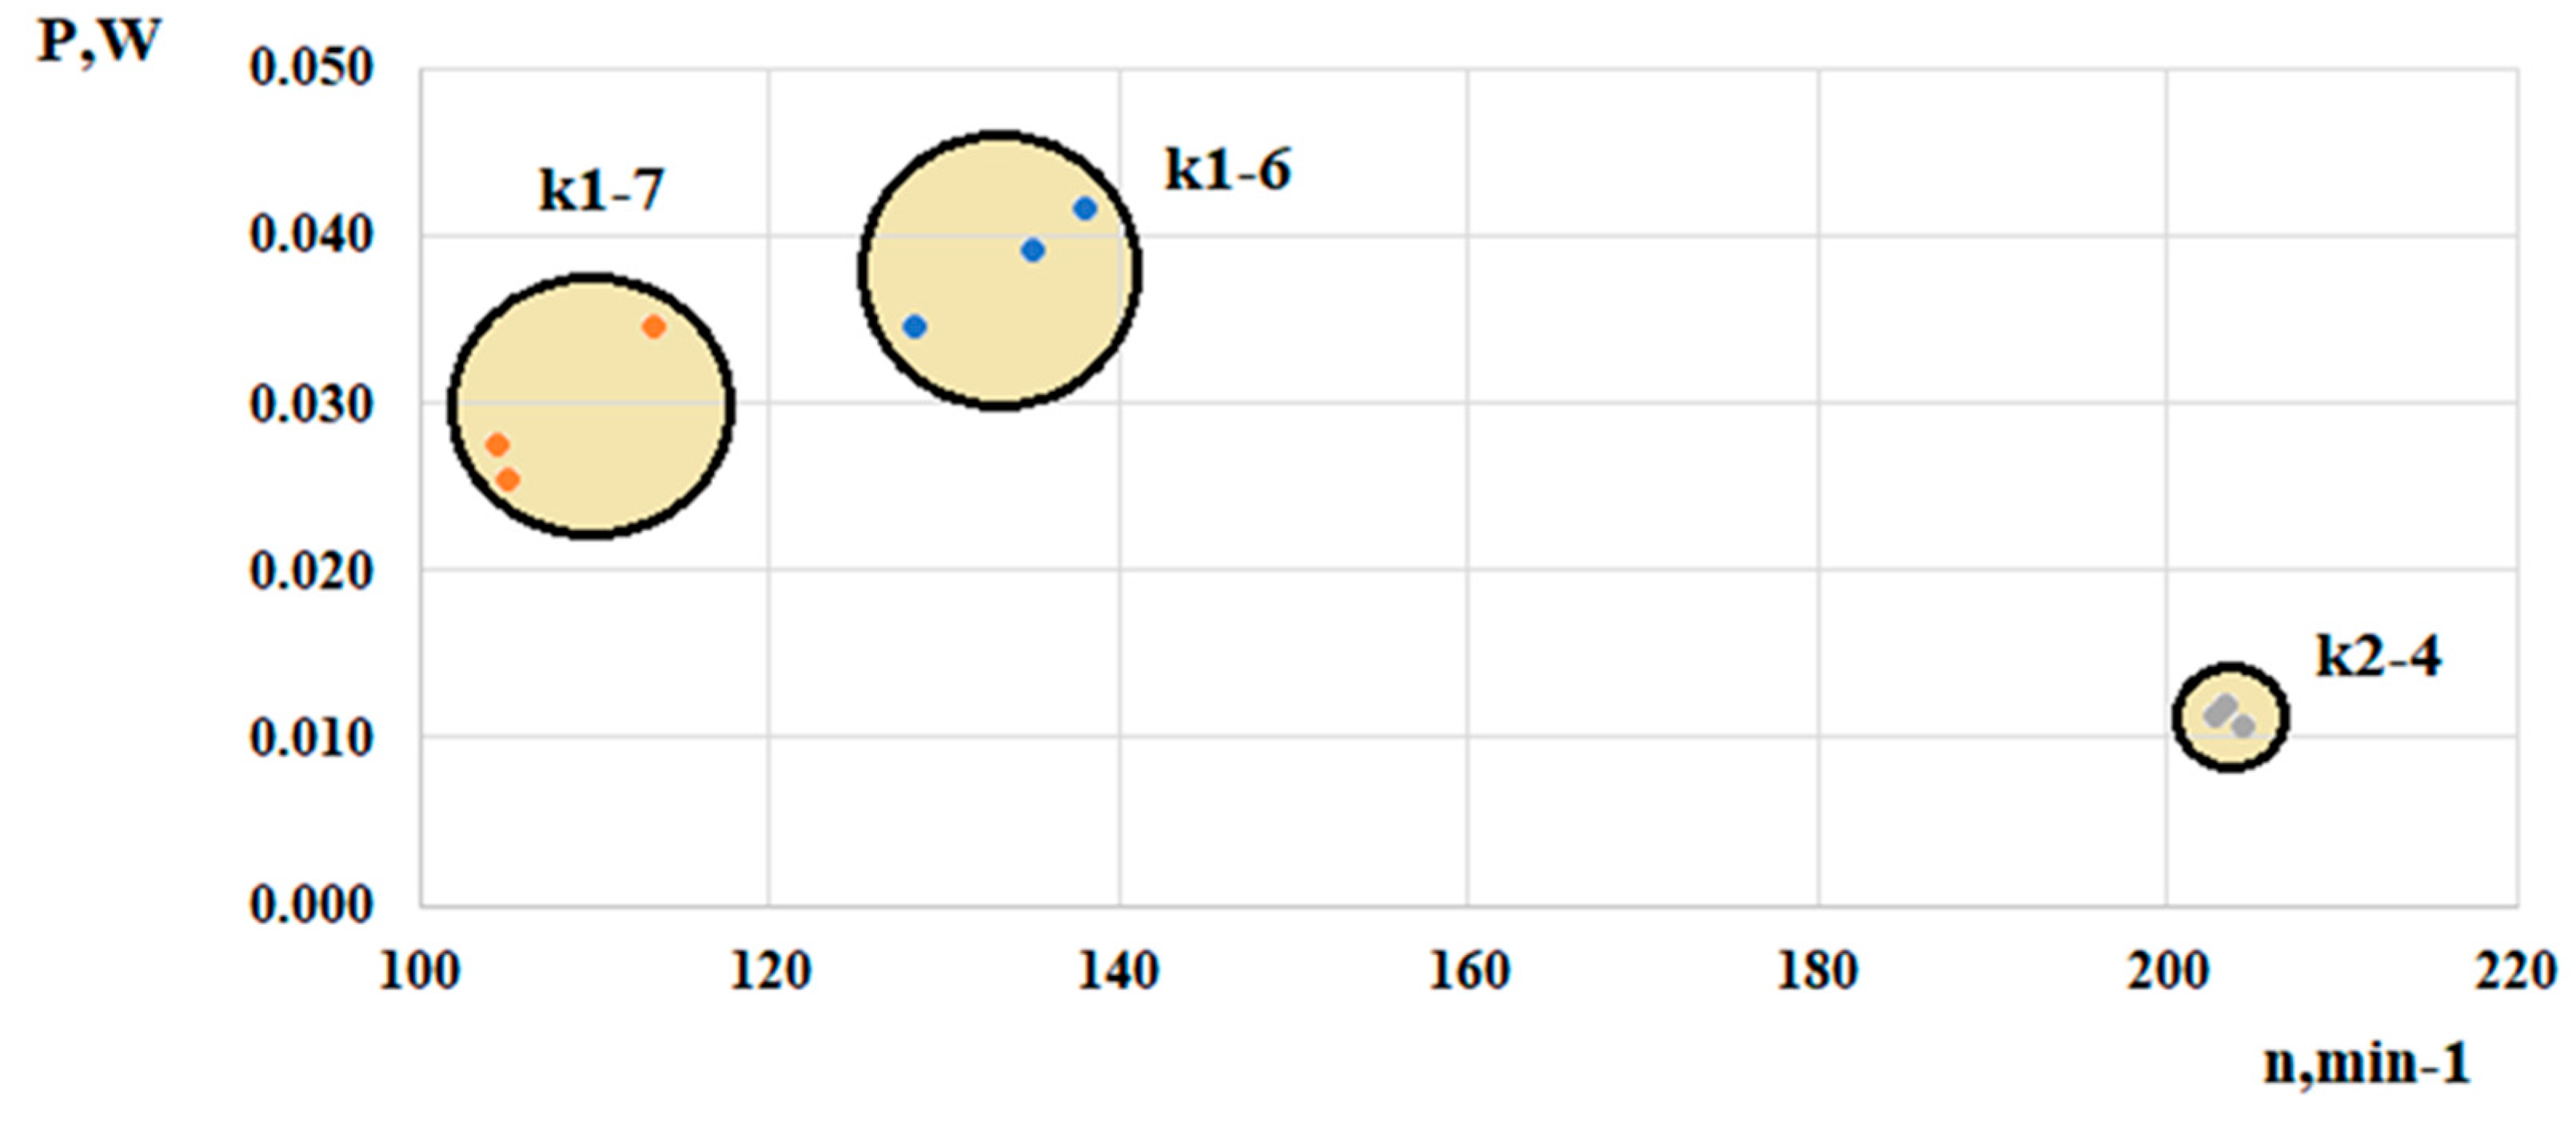
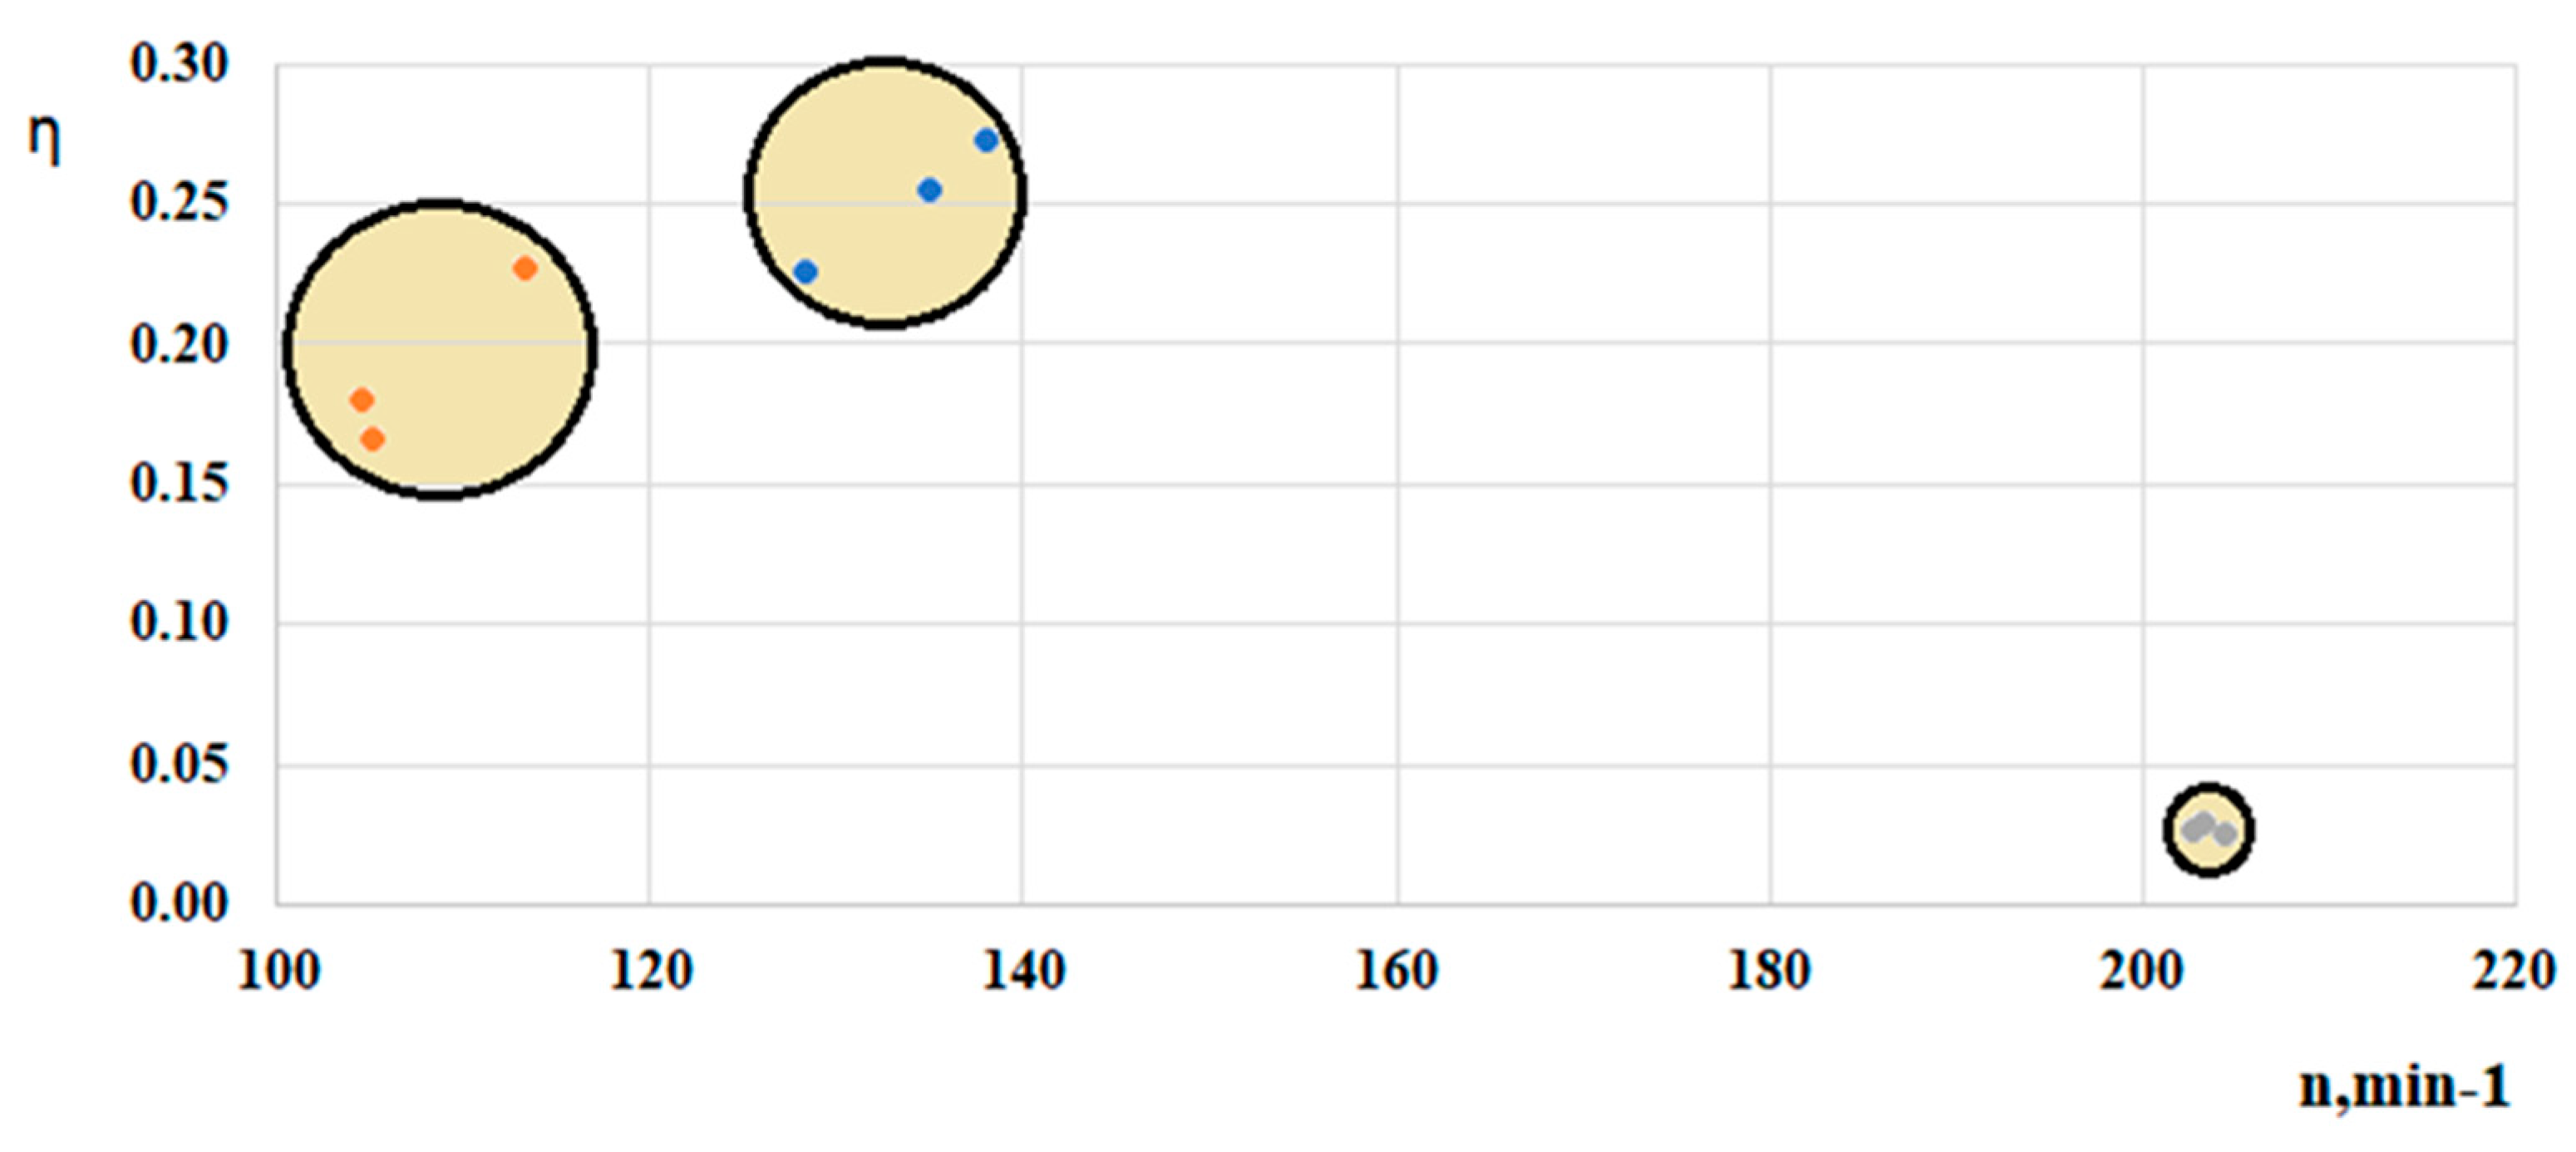
Figure 13 shows the results from testing the three turbine runners in the submergence zone equal to R (the radius of the wheel). Due to the similarity in the velocity fields, the results for the two submergence depths overlapped; therefore, the results for the 3R submergence are not presented in table or graph form.
In
Figure 13, the circles indicating the working area are illustrative.
where η—efficiency; Ph—hydraulic power.
Regarding the efficiency values, it should be noted that bearing losses have not been included, which could introduce some error given the relatively low output power values obtained. However, because the same test rig was used for all trials, a comparative analysis of the efficiency of the individual turbine runners can be performed while effectively removing the effect of bearing losses.
Table 7 presents the results of each turbine runner’s efficiency, calculated with the following formula.
The turbines’ efficiency and rotational frequency are illustrated graphically in
Figure 14.
5. Results and Discussion
The selection of the turbine installation site within the riverbed proved critical for both experimental evaluation and potential real-world deployment. Local flow boundary conditions, including velocity variability and river morphology, have a significant influence on turbine performance. For this study, a controlled section of the Iskar River was selected to maintain relatively steady flow velocities. Measurements conducted at both the riverbank and near each turbine unit revealed velocity fluctuations ranging from 0.05 to 0.1 m/s (
Figure 10), highlighting the inherent variability of natural river flows. These fluctuations necessitate that turbine runners be specifically designed to operate efficiently across the observed range of local flow velocities.
Turbine performance was evaluated across a submergence depth range from R to 3R. The performance metrics, including power output and efficiency, exhibited minimal variation within this range, indicating a high degree of operational consistency. While this depth range was suboptimal in terms of maximizing performance, it ensures full turbine submergence despite natural fluctuations in river water level, which is essential for reliable long-term operation.
The power output and efficiency of the tested turbine runners varied considerably depending on runner geometry and blade configuration. The K1–6 runner consistently demonstrated superior performance, achieving a maximum power output of 0.042 W and an efficiency of 0.28%. In contrast, the K1–7 runner accelerated more rapidly but attained lower rotational speeds (113 rpm) and slightly reduced overall efficiency (0.23%).
The K2–4 runner reached the highest rotational frequencies (204 rpm) but generated significantly lower power (0.012 W) due to its reduced mass and four-blade configuration. Its calculated efficiency was approximately one order of magnitude lower than that of K1–6 and K1–7, which can be attributed to the blade geometry being optimized for higher flow velocities and Reynolds numbers (Re) than those present in the experimental river section.
Despite lower power output, the K2–4 runner demonstrated remarkable operational stability, maintaining a near-constant rotational speed under fluctuating flow conditions (Δv ≈ 0.05–0.1 m/s). This stability translates into a more consistent power output, a critical factor for practical hydrokinetic applications, particularly in grid-connected or hybrid energy systems where fluctuations in generation must be minimized.
Experiments with hydrokinetic turbines in river conditions are limited by natural flow variability, seasonal fluctuations in water level, and local hydrological features. The small scale of pilot turbines and infrastructure limitations can affect the transferability of results to real, industrial applications. Additionally, measurement accuracy and environmental requirements place constraints on the time and scope of tests, and economic and personnel resources often limit the number and variety of experiments. However, such studies are essential for optimizing turbines and assessing their efficiency under real river conditions.
6. Conclusions
This study provides an experimental assessment of the performance of three hydrokinetic turbine runners tested under real river conditions in the Iskar River, Bulgaria. The results highlight the importance of site selection, as flow variability and river morphology significantly influence turbine behavior. Among the tested models, the K1–6 runner demonstrated the highest efficiency and power output, while the K2–4 runner, despite lower efficiency, exhibited superior operational stability under fluctuating flow conditions. These findings underline the trade-off between maximizing efficiency and ensuring stable energy production in variable environments.
The conducted experiments confirm that hydrokinetic turbines can be adapted to low-flow rivers, making them a promising solution for decentralized renewable energy generation in Bulgaria and similar regions. At the same time, the limitations identified—such as scale effects, measurement uncertainties, and natural flow variability—indicate the need for further large-scale testing and long-term monitoring. Future research should focus on optimizing blade geometry for specific hydrological conditions, exploring performance at higher flow velocities, and developing cost-effective deployment strategies.
From a deployment perspective, the potential for long-term energy harvesting depends strongly on the choice of installation method. Fixed-bed installations provide stability but require careful site preparation and may encounter challenges related to sediment accumulation and seasonal water-level fluctuations. Alternatively, several studies in the literature suggest the use of floating platforms, which allow easier deployment, maintenance, and repositioning of turbines in variable flow conditions. Floating structures also minimize the impact of riverbed morphology and can facilitate modular arrays of turbines. However, their feasibility depends on local constraints, such as embankment geometry, the presence of bridges, and proximity to power generators and grid connection infrastructure.
In this context, hybrid approaches that combine fixed and floating installations could provide practical solutions, especially in rivers experiencing fluctuating depths or seasonal variations. It is essential to assess the structural resilience of support systems, ensure secure anchoring, and incorporate monitoring and control technologies to enable the scaling of hydrokinetic turbines. Long-term feasibility should also examine operational costs, environmental effects, and how turbines fit into broader river management plans. These considerations will support the transition of hydrokinetic technologies from pilot projects to reliable, ongoing contributions to renewable energy systems.
