Article

Experimental Study on the Thin-Film Evaporation of Organic Solvent Droplets on Metal Surfaces

1
CHN Energy Jiangxi Engineering Technology Co., Ltd., Jiujiang 332500, China
2
School of Advanced Manufacturing, Nanchang University, Nanchang 330031, China
*
Author to whom correspondence should be addressed.
Energies 2025, 18(19), 5113; https://doi.org/10.3390/en18195113
Submission received: 21 August 2025 / Revised: 18 September 2025 / Accepted: 22 September 2025 / Published: 25 September 2025

Abstract

In order to meet the demand for enhanced heat transfer capabilities in practical application areas such as high heat flux density and high stability, the film evaporation heat dissipation method has been widely applied in fields such as microelectronic device cooling, heat pipe technology, solar steam generation, and seawater desalination. In the current study, film evaporation experiments are conducted on droplets of propylene glycol and ethanol using a film evaporation observation platform. The morphological changes and temperature of the droplets are investigated by varying the overheating degree, material, roughness, and wettability of the heating plate. The results indicate that the droplet thickness undergoes three stages of change with variations in overheating degree, and the droplet thickness decreases overall with increasing roughness. The thickness of ethanol droplets is higher than that of propylene glycol droplets in the low overheating degree range but lower in the high overheating degree range. Ethanol droplets are more sensitive to overheating degree than propylene glycol droplets. As the droplets enter the film evaporation state, the surface temperature of the droplets gradually approaches the wall temperature and the rate of change slows down. This trend shows a certain similarity to the change in droplet thickness. Increasing the surface roughness slightly raises the overall temperature, while altering the wettability has minimal impact on the temperature variation.

1. Introduction

With the significant growth in demand for efficient heat dissipation in various fields, gas–liquid phase-change heat transfer technology, which utilizes latent heat of vaporization for large-scale heat transfer, has become a key research area. It has shown great potential in applications such as pumped laser systems, seawater desalination and purification processes, and thermal management of high-power electronic devices [1,2,3,4]. To effectively mitigate the impact of heat on device performance and durability, researchers have focused on developing various gas–liquid phase-change heat transfer strategies, including boiling and evaporation, to achieve high heat flux and low superheat, thereby ensuring high heat transfer capability and efficiency. Compared to boiling phase change, thin-film evaporation also offers high heat dissipation efficiency and superior stability, playing a critical role in various applications such as electronic device cooling [5], heat pipe technology [6,7], solar steam generation [8,9,10,11], and seawater desalination [12]. Thin-film evaporation exhibits significant advantages in handling high heat flux and temperature-sensitive applications, particularly in scenarios requiring precise temperature control. In thin-film evaporation, the majority of the phase-change process occurs near the evaporation region around the three-phase contact line [13], which occupies only a small fraction of the total interface area. This limitation makes thin-film evaporation slightly less efficient than some ultra-high heat flux boiling methods. However, Wang et al. [14] significantly enhanced the number of menisci in thin-film evaporation by employing porous nano-alumina films, achieving a higher heat flux density than their previously developed thin-film boiling methods. This micro-nano structural approach has been widely adopted in evaporation applications [15,16], demonstrating that increasing the number of menisci can rapidly improve heat transfer efficiency and surpass boiling methods. Additionally, thin-film evaporation offers unique advantages of stability and ease of control compared to boiling phase change. In high-precision electronic components, where intense boiling heat transfer methods are unsuitable, this stable thin-film evaporation approach becomes the only viable option.
Many researchers have investigated the heat transfer characteristics of thin-film evaporation and explored how this phenomenon can be leveraged to achieve efficient heat transfer. G. Xia et al. [17] utilized anodized aluminum oxide films as nanoporous membranes to achieve thin-film evaporation, observing stable heat flux in the range of 40–55 W/cm2 on upward-facing surfaces. Daniel et al. [18] designed a microfluidic device employing nanoporous silicon membranes for evaporation, achieving an ultra-high heat flux dissipation of 665 ± 74 W/cm2 over an area of 0.172 mm × 10 mm. Xiao et al. [19] proposed a method based on nanoporous membranes to achieve high driving pressure and efficient liquid transport in thin-film evaporation by decoupling capillary pressure and viscous resistance. They demonstrated that a 1 µm-thick nanoporous membrane could achieve heat fluxes exceeding 1000 W/cm2. Cattani et al. [20] developed a method to estimate local convective wall heat flux density and heat transfer coefficients, validated it, and applied it to evaporation experiments of thin films in heated capillaries. Ermiyas et al. [21] analyzed the ultrathin liquid layer beneath vapor bubbles growing on a heated surface under atmospheric boiling conditions and modeled it using lubrication theory. This model is represented by a third-order nonlinear thin-film evolution equation. By comparing the film profiles at a series of time points during a single bubble eruption cycle, they inferred possible values of the evaporative heat transfer coefficient, which were found to lie within the range of previously reported estimates. Pang et al. [22] investigated the effects of fuel droplet characteristics and temperature on the evaporation process using experimental techniques such as ultrasonic standing-wave suspension and high-speed imaging. They found that the evaporation rate is positively correlated with temperature, with differences between hexadecane and diesel droplets ranging from 15% to 71%, and that both the initial droplet diameter and ambient temperature directly affect the evaporation rate. Wu et al. [23] employed a temperature–pressure separation technique to experimentally study the evaporation characteristics of asymmetric dimethylhydrazine droplets with varying initial diameters under subcritical conditions. They observed that droplets of different initial diameters follow a similar general evaporation pattern under these conditions, and that the expansion of the transient heating phase increases progressively with ambient pressure. Under subcritical conditions, the evaporation rate decreases linearly with decreasing droplet diameter, while the droplet lifetime increases linearly. Wu et al. [24] conducted transient numerical simulations using CFD to investigate multiphase flow reactions in a horizontal hot-wall α-Ga2O3 mist CVD system. Based on droplet migration and vaporization models, they studied factors affecting droplet evaporation time, revealed the influence of droplet migration length on the initial epitaxial quality and average growth rate of the film, and optimized key parameters—including substrate temperature, position, and angle—among the many variables influencing α-Ga2O3 film growth distribution. To further explore the unique phase-change phenomenon of thin-film evaporation, particularly the evaporation process in the meniscus region, researchers have conducted extensive studies on the heat transfer contribution and thickness of the meniscus. Hemanth et al. [25] investigated the characteristics of highly wetting heptane liquid menisci formed on heated quartz wafers. Using microscale infrared measurements in the meniscus region, they observed that the vapor-liquid interface expanded as heat flux density decreased and evaporation rate increased, unaffected by minor variations in channel width. Christopher et al. [26] examined the meniscus of heptane liquid open to the atmosphere in horizontal V-shaped grooves to determine the heat transfer contribution of the evaporative thin-film region. They found that nearly 45% of the heat transfer occurred within 50 µm of the meniscus region.
Additionally, some researchers have studied the impact of surface properties on thin-film evaporation phenomena. Manas et al. [27] experimentally investigated how surface roughness influences microscale transport processes occurring in the liquid corner meniscus contact line region. They calculated the contribution of surface roughness to interaction potential and established a direct relationship between liquid wettability and underlying surface properties. Wang et al. [14] explored the phase-change heat transfer mechanism on nanoporous membranes using four working fluids: deionized water, ethanol, IPA, and FC-72. They observed a transition from thin-film boiling to pore-level thin-film evaporation but noted that this phenomenon was absent with water due to its poor wettability. Hu et al. [28] developed a thin-film evaporation model to explain the influence of nanoscale surface roughness. They found that roughness enhances thin-film evaporation, especially when the effects of separation pressure become more significant.
Thin-film evaporation has attracted significant attention from researchers due to its unique phase-change mechanism, high heat transfer efficiency, and stable phase-change characteristics. In previous studies, most researchers focused on menisci formed within tubes or between plate gaps, conducting in-depth analyses of unique experimental phenomena during thin-film evaporation and achieving notable progress in understanding its phase-change principles and applications. However, the influence of factors such as changes in roughness, wettability, heating substrate material, and the chemical composition of the droplet on the film thickness and temperature distribution at the critical point of film evaporation remains an insufficiently explored area. Research on the thin film evaporation dynamics and heat transfer characteristics of organic solvent droplets on flat surfaces is still insufficient. The influence of heating surface properties on the overall performance of organic solvent droplet thin film evaporation remains an unresolved issue, presenting significant research opportunities and potential. In-depth research in this field is crucial for optimizing the thin film evaporation process and its applications. In the current study, an experimental platform is established for observing thin-film evaporation phenomena, processing the surfaces of aluminum, copper, and brass with varying degrees of roughness and different wettabilities. The variations in droplet thickness and surface temperature of propylene glycol and ethanol droplets during thin-film evaporation were investigated under surface conditions with different materials, surface roughness levels, and wettability. Based on the principles of thin-film evaporation, the thickness and temperature data were analyzed to determine the variation patterns of droplets as superheat increased.

2. Materials and Methods

2.1. Experimental Equipment

To investigate the dynamic characteristics of droplet thin-film evaporation, including the overall thickness of the liquid film and the surface temperature of the droplet, a thin-film evaporation observation system is established in the current study. The specific instruments and installation setup of the experimental system are shown in Figure 1. The core components of the experimental system include an electric heating device, a heat-conducting metal plate, LED lights, a high-speed camera, an infrared thermal imager, and a droplet dispensing syringe. Table 1 provides details about the instruments used in the experiment, including their names, models, and specifications. During the experiment, the electric heating device, serving as the heat source, was placed at the bottom of the system, with a heat-conducting metal plate on top to distribute heat evenly. Droplets were precisely dispensed via a syringe positioned directly above the heated plate. To ensure high-quality visual capture, a high-speed camera was positioned horizontally in front of the system, with LED lights strategically arranged to provide supplemental illumination. Additionally, an infrared thermal imager was mounted vertically above the experimental setup to monitor and record temperature variations in the droplet thin film. The thin-film evaporation of propylene glycol and ethanol droplets, owing to their efficient heat transfer and temperature control characteristics, holds promising applications in areas such as electronic device cooling. Ethanol is a low-boiling, highly volatile solvent, whereas propylene glycol is a medium-boiling, moderately volatile solvent. Therefore, these two organic solvent droplets were selected as the working fluids in this study.

2.2. Preparation of Samples

2.2.1. Preparation and Characterization of Surfaces with Different Roughness

In the current study, three different grits of sandpaper (1000 mesh, 2000 mesh, and 3000 mesh) were selected to perform unidirectional and uniform grinding on heating plates made from three types of metals (aluminum, copper, and brass), thereby creating surfaces with varying roughness. The ground surfaces were cleaned using anhydrous ethanol and deionized water, followed by thorough cleaning in an ultrasonic cleaner. After cleaning, the heating plates were placed in a dryer for drying. To observe and document the microscopic morphology of these surfaces in detail, a Keyence high-depth-of-field microscope was used to examine the treated surfaces of the heating plates. Figure S1 in Supplementary Materials displays the surface morphology after treatment with sandpaper. Table 2 lists the specific parameters of the surfaces with different roughness measured using the high-depth-of-field microscope. The data indicate that the surface roughness for the treatment with 1000 mesh sandpaper was 1.51 µm, 0.72 µm for 2000 mesh, and 0.65 µm for 3000 mesh.

2.2.2. Preparation and Characterization of Surfaces with Different Wettability

To investigate the effect of wettability on the thickness and temperature of droplets during thin-film evaporation, the surfaces of heating plates were subjected to hydrophilic treatment, hydrophobic treatment, and no wettability treatment, resulting in a total of 27 distinct surfaces. The hydrophilic surfaces were obtained by treating with an H2O2 solution [29], while the hydrophobic surfaces were prepared using a fluorosilane ethanol solution [30]. Detailed procedures for the hydrophilic and hydrophobic treatments are described in the Supplementary Materials. A contact-angle goniometer was used with deionized water to measure the contact angles of the prepared hydrophilic, hydrophobic, and untreated surfaces. The results of the contact-angle measurements are presented in Table 3, and Figure S2 in Supplementary Materials shows the corresponding goniometer images for untreated, hydrophilic, and hydrophobic surfaces.

2.3. Experimental Preparations

2.3.1. Temperature Calibration and Temperature Uniformity Verification

In the current study, temperature calibration was conducted for the infrared thermal imaging measurement system, with the detailed calibration procedures described in the Supplementary Materials. Figure S3 in Supplementary Materials illustrates the setup for infrared thermal imaging calibration. Figure S4 in Supplementary Materials presents a correlation analysis between measurements obtained via thermocouples and the infrared thermal imaging system. The correlation coefficient for propylene glycol reached 0.9885, while that for ethanol was 0.9953, thereby confirming the high accuracy of this experimental method. Rigorous testing and validation were performed on all heating plates used in this study, with the detailed testing procedures and results provided in the Supplementary Materials. Tables S1 and S2 in Supplementary Materials detail the uniformity of the surface temperature of the heating plates.

2.3.2. Measurement of the Thickness and Surface Temperature of Droplets During the Thin Film Evaporation

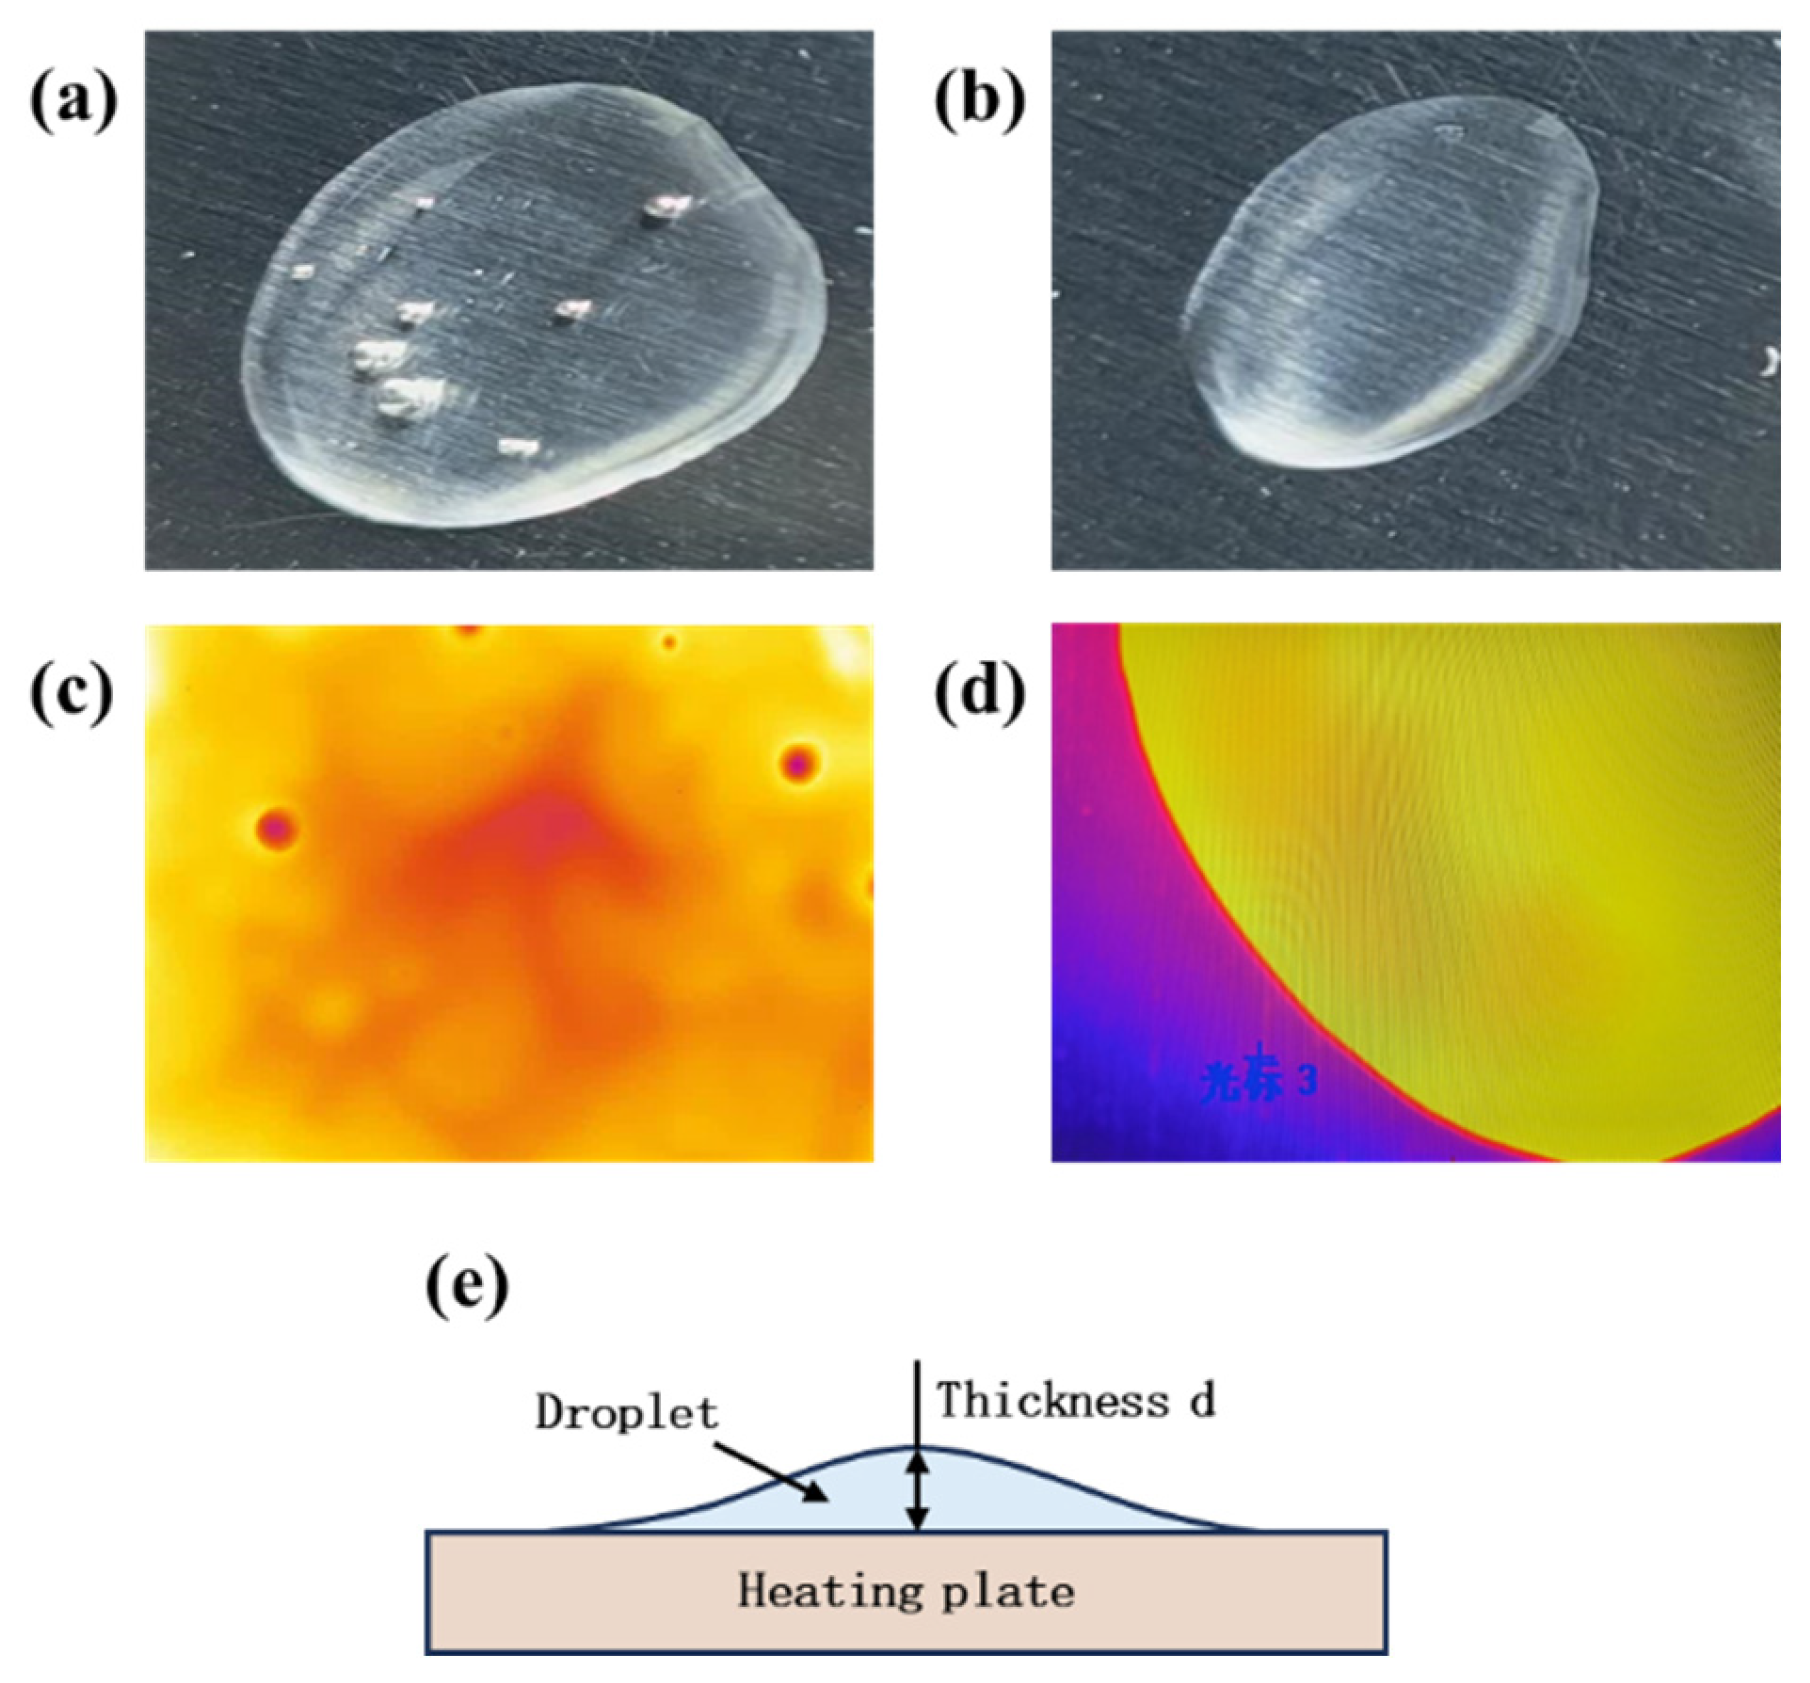
In the current experiment, the changes in droplet thickness and surface temperature of propylene glycol and ethanol droplets were investigated during the thin-film evaporation stage on heated surfaces with varying material properties, surface roughness, and wettability conditions. During the experiment, the heating platform temperature was set within a superheat range of 1 K to 7 K above the boiling points of the respective working fluids. Once the temperature stabilized, the differently treated heating plates were sequentially placed on the heating platform. After ensuring uniform and stable surface temperatures, 0.2 mL of propylene glycol or ethanol was added to each plate, and the phase transition process of the droplets was recorded. A high-speed camera was used to observe the droplets from the side, and droplet thickness was calculated by analyzing the pixel data. Additionally, infrared thermal imaging technology was employed to capture the heat distribution and phase transition state of the droplets in real time from a vertical perspective. Five temperature points were selected from the infrared images, averaged, and substituted into the infrared temperature fitting equation derived in Figure S4 to obtain the actual temperature. ΔTsw is defined as the temperature difference between the droplet surface and the surface of the heating plate. Figure 2a shows an image of a droplet in the boiling state, while Figure 2b depicts a droplet in the thin-film evaporation state. Figure 2c presents the infrared thermal image of a droplet in the boiling state, and Figure 2d illustrates the infrared thermal image of a droplet during the thin-film evaporation state. Figure 2e shows the specific locations corresponding to the measured droplet thickness data.

3. Results and Discussion

3.1. Thickness and Surface Temperature of Propylene Glycol Droplets During Film Evaporation
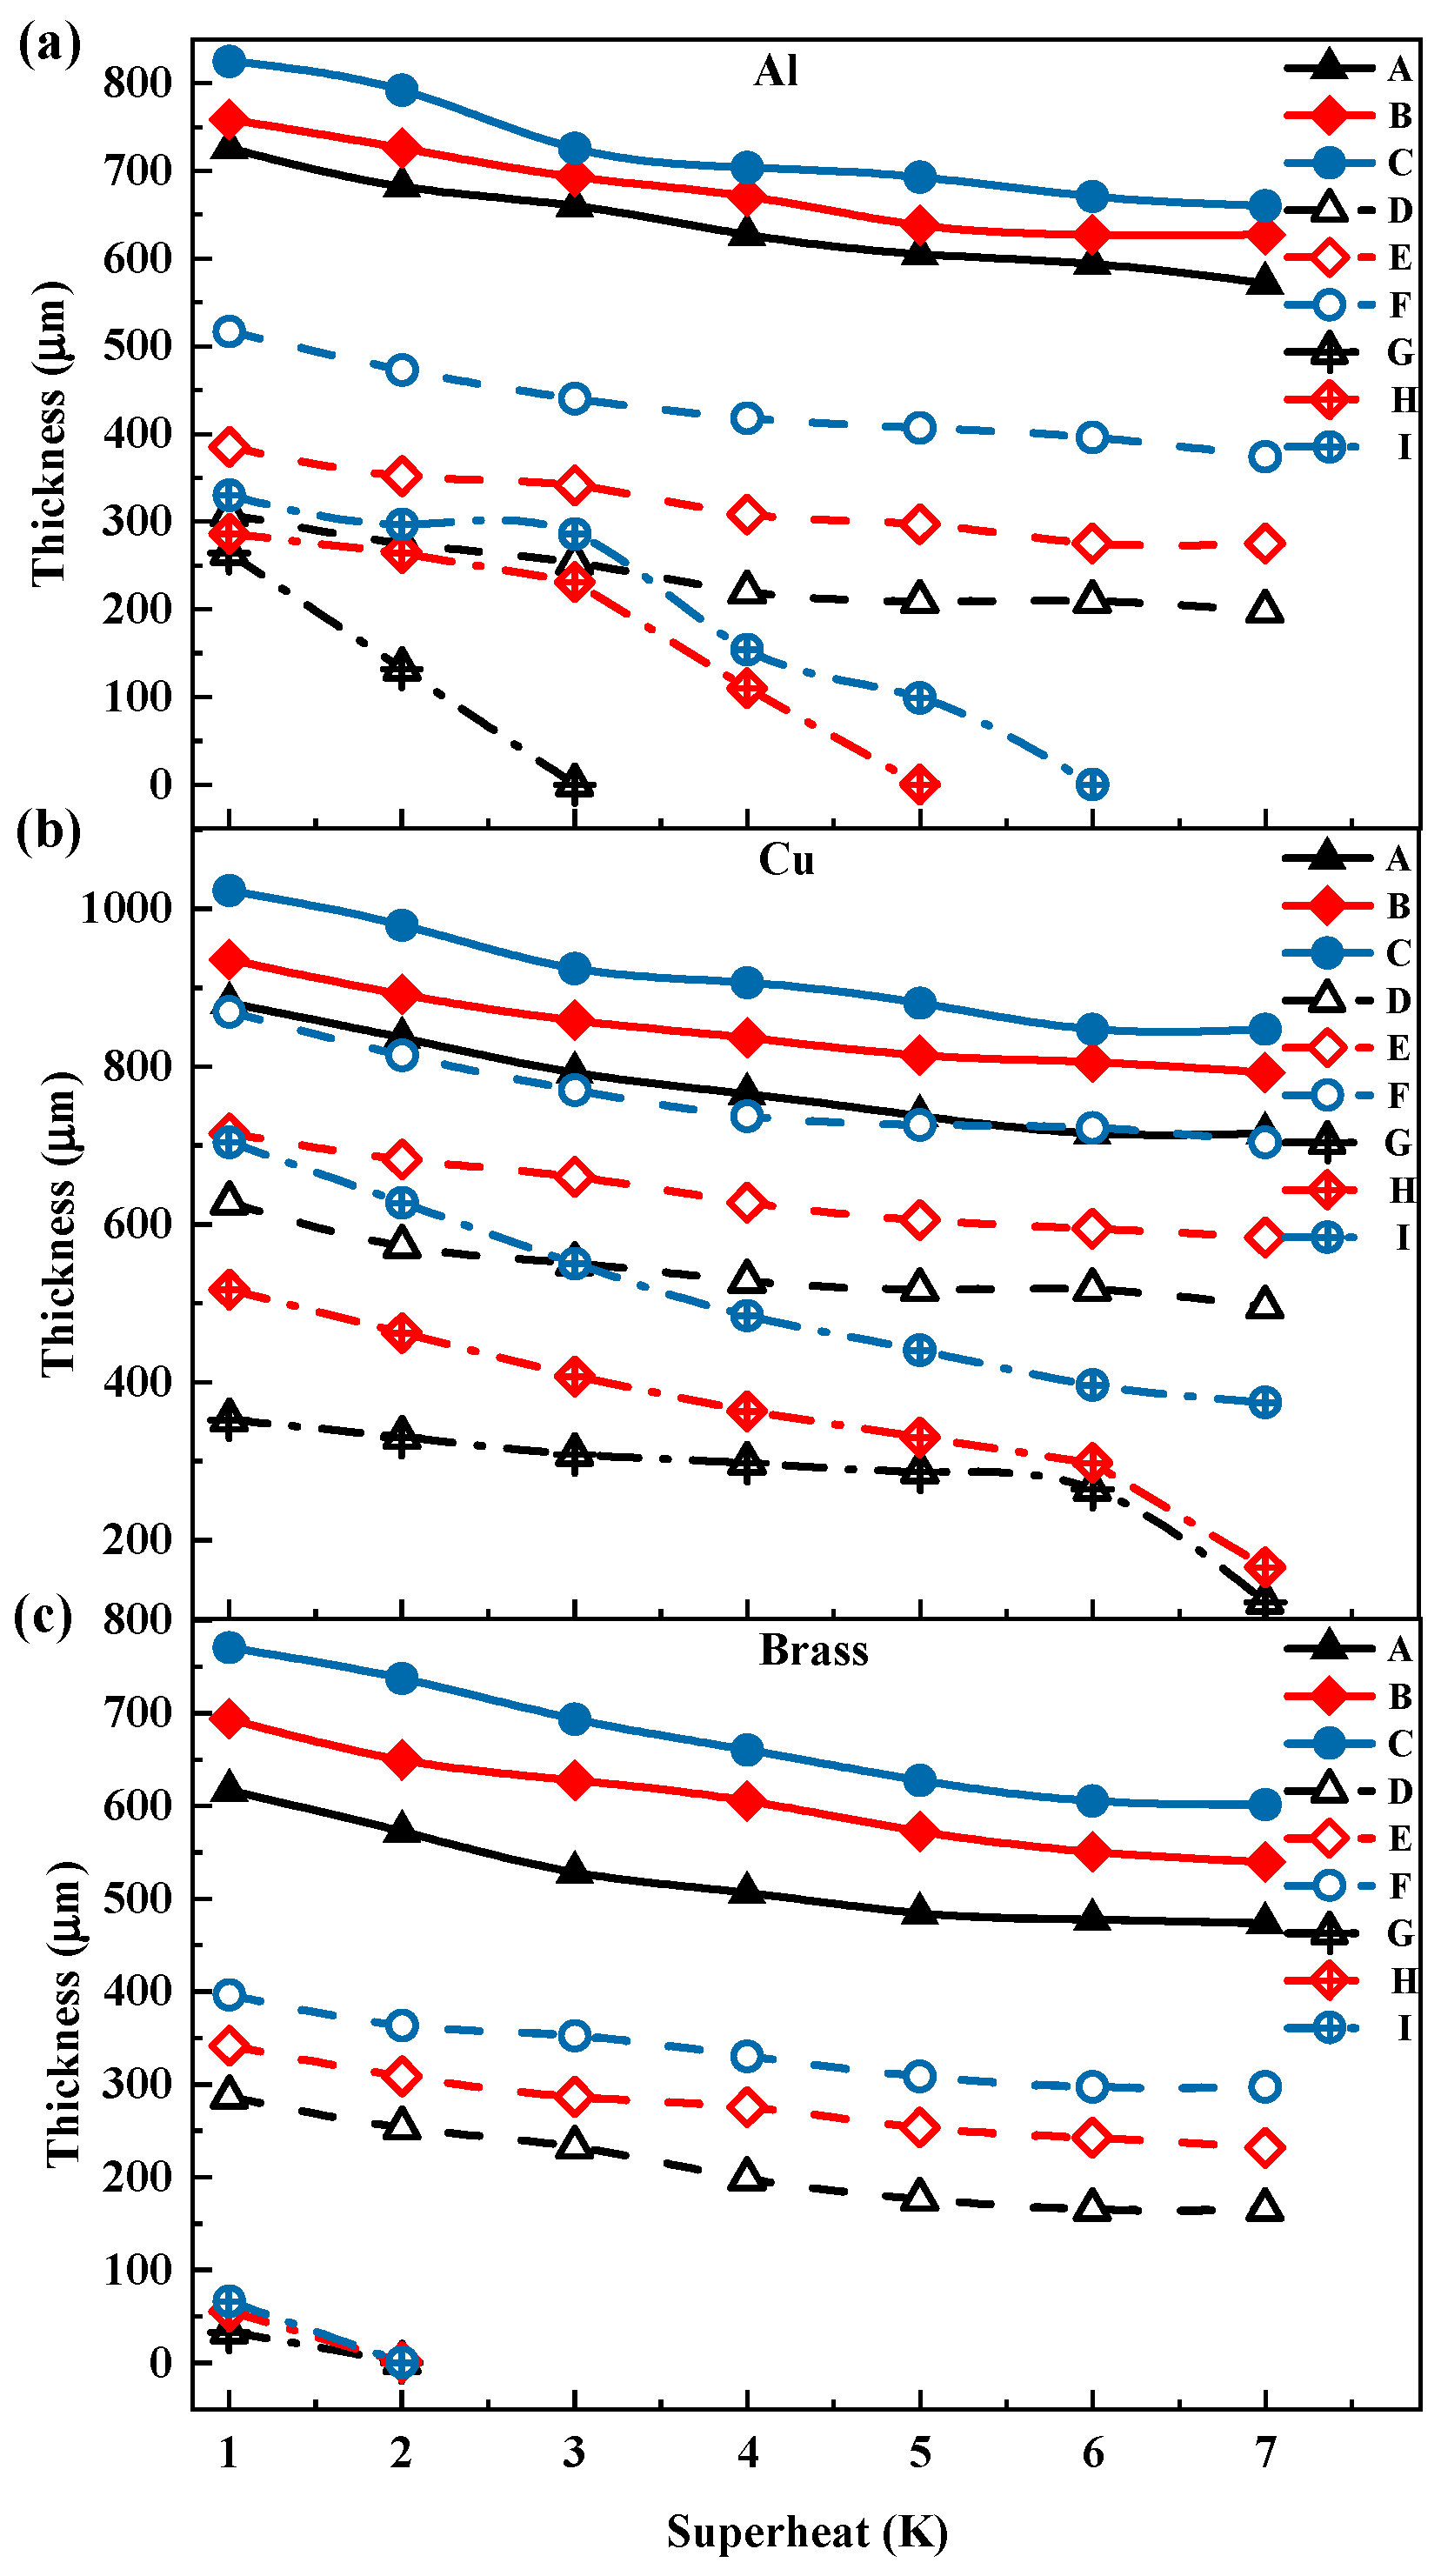
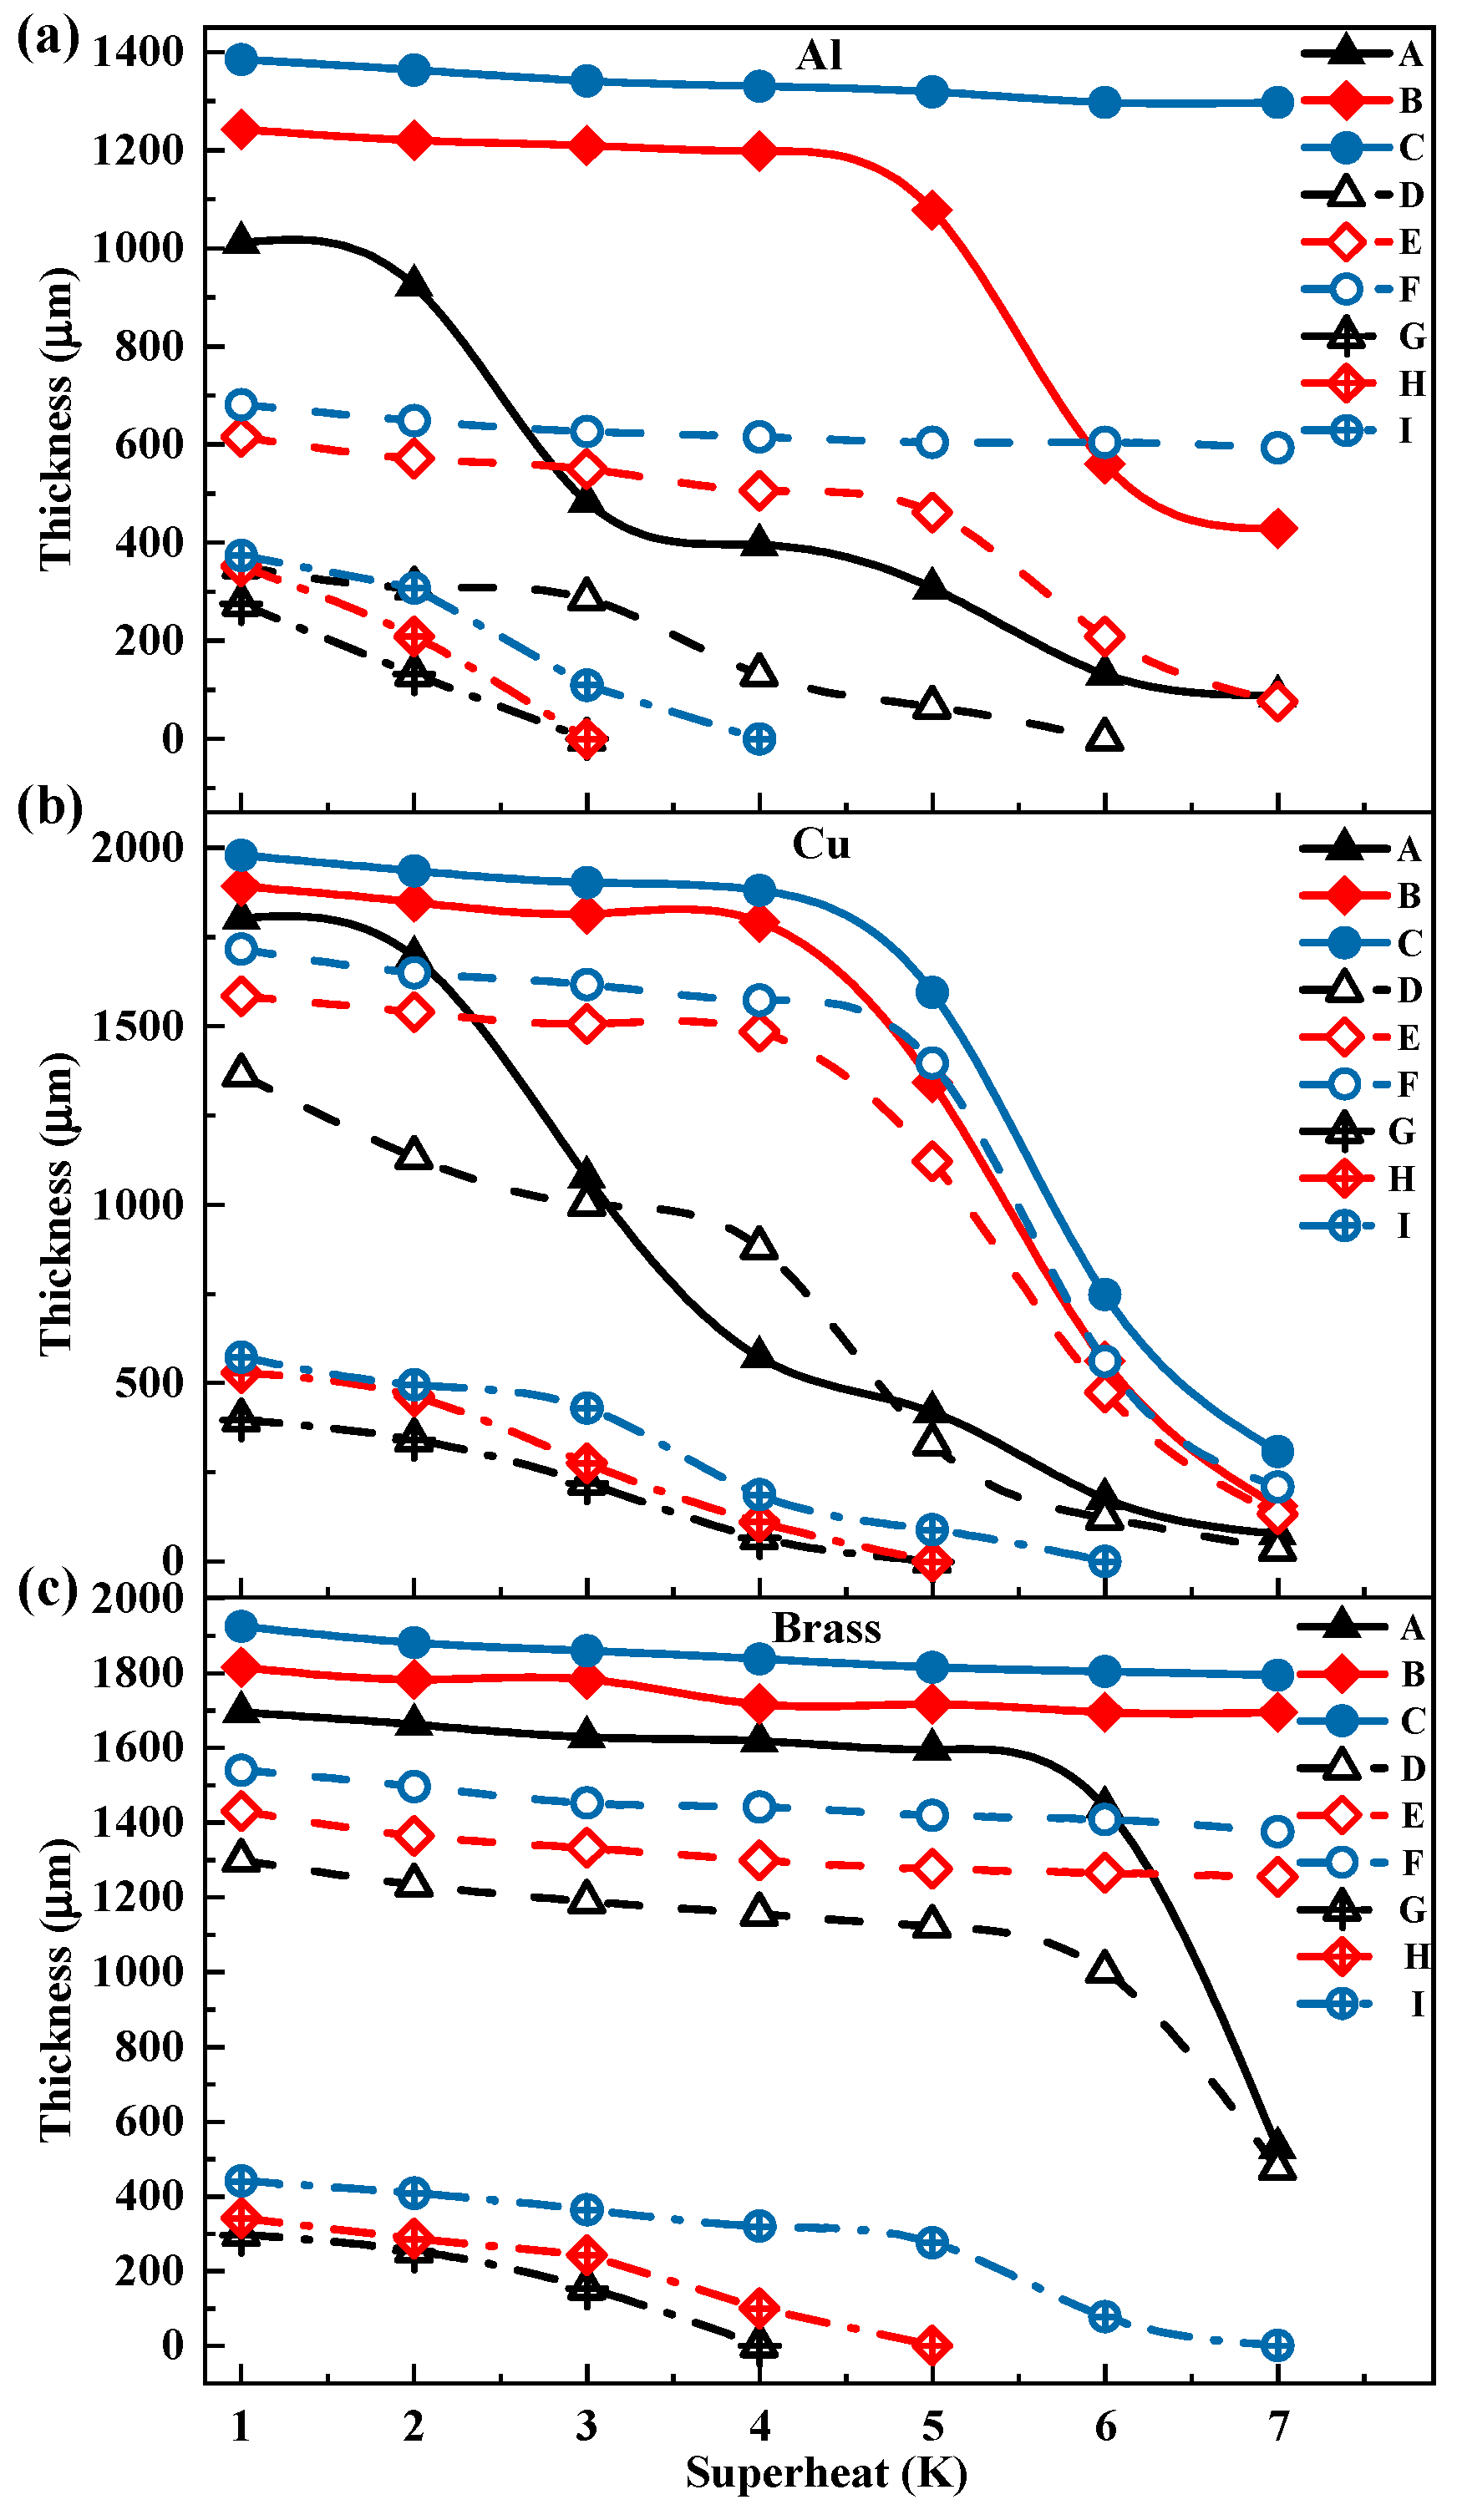
Figure 3 shows the change in droplet thickness of propylene glycol (PG) droplets when superheating the heating plate. Figure 3a–c reveal significant differences in droplet thickness on heating plates of different materials. Copper exhibits the biggest thickness, followed by aluminum, while brass shows the smallest thickness. This variation is attributed to the influence of the Hamaker constant [31] on the evaporation region thickness during thin-film evaporation.
Figure 3. Relationship between PG droplet thickness and superheating degree on surfaces with different roughness and wettability: (a) aluminum heating plate, (b) copper heating plate, (c) brass heating plate. (Labels A–I represent surfaces with different wettability and roughness; specific parameters are listed in Table 4).
Energies 18 05113 g003
Table 4. Detailed parameters of surfaces with different wettabilities and surface roughness.
SymbolSurface Treatment Sa   ( µ m )
AOriginal1.51
B0.72
C0.65
DHydrophilic1.51
E0.72
F0.65
GHydrophobic1.51
H0.72
I0.65
Additionally, as the surface roughness of the heating plates increases, the droplet thickness curves shift downward overall. The phase transition behavior of droplets on the heated surfaces can be categorized into two types: one where the droplet thickness decreases while the three-phase contact line remains unchanged, as shown in Figure 4a, and the other where the three-phase contact line retracts inward while the droplet thickness remains nearly constant, as depicted in Figure 4b.
For surfaces with original wettability, the reduction trend of droplet thickness increase when superheat decreases. This is because, within the superheat range shown in Figure 3, the morphological changes in PG droplets predominantly follow the pattern in Figure 4b, resulting in a continued but slower reduction in thickness as the superheat increases. On hydrophilic-treated surfaces, the trend of droplet thickness changes is similar to that on surfaces with original wettability, but the overall droplet thickness is significantly reduced. For droplets on hydrophilic surfaces, the total thickness reduction within the 1 K to 7 K superheat range is greater than on surfaces with original wettability. The primary reason for the reduced droplet thickness is that hydrophilic treatment decreases the surface’s contact angle, causing the droplet thickness to be substantially lower than that on surfaces with original wettability before the phase transition occurs. The thickness of droplets on hydrophobic surfaces differs significantly from those on hydrophilic and surfaces with original wettability. Compared to hydrophilic surfaces, the droplet thickness on hydrophobic surfaces is further reduced. This phenomenon is attributed to the increased contact angle (>90°) caused by hydrophobic treatment, which inhibits the formation of a meniscus necessary for thin-film evaporation and favors boiling heat transfer instead.
Furthermore, on hydrophobic surfaces, droplet thickness decreases sharply at specific superheat levels. For example, on aluminum surfaces, the surface with a roughness of 1.51 µm begins to thin significantly at a superheat of 1 K, while surfaces with roughness values of 0.72 µm and 0.65 µm show substantial reductions starting at 3 K. On copper surfaces, sharp reductions in droplet thickness occur at 6 K for surfaces with roughness values of 1.51 µm and 0.72 µm. On brass surfaces, rapid thickness reductions begin before a superheat of 1 K for all three roughness levels. The significant reduction in droplet thickness at specific superheat levels is attributed to the tendency of hydrophobic surfaces to favor boiling heat transfer. As the superheat increases and the droplet thickness decreases substantially, larger droplets evaporate more liquid with the same reduction distance, whereas smaller droplets evaporate much less. Consequently, as the droplet size decreases, more frequent alternation between the two contraction mechanisms is required. This results in a significant increase in the rate of droplet thickness reduction at a critical superheat level. While this phenomenon is also observed on hydrophilic and originally wettable surfaces, it occurs at higher superheat levels.
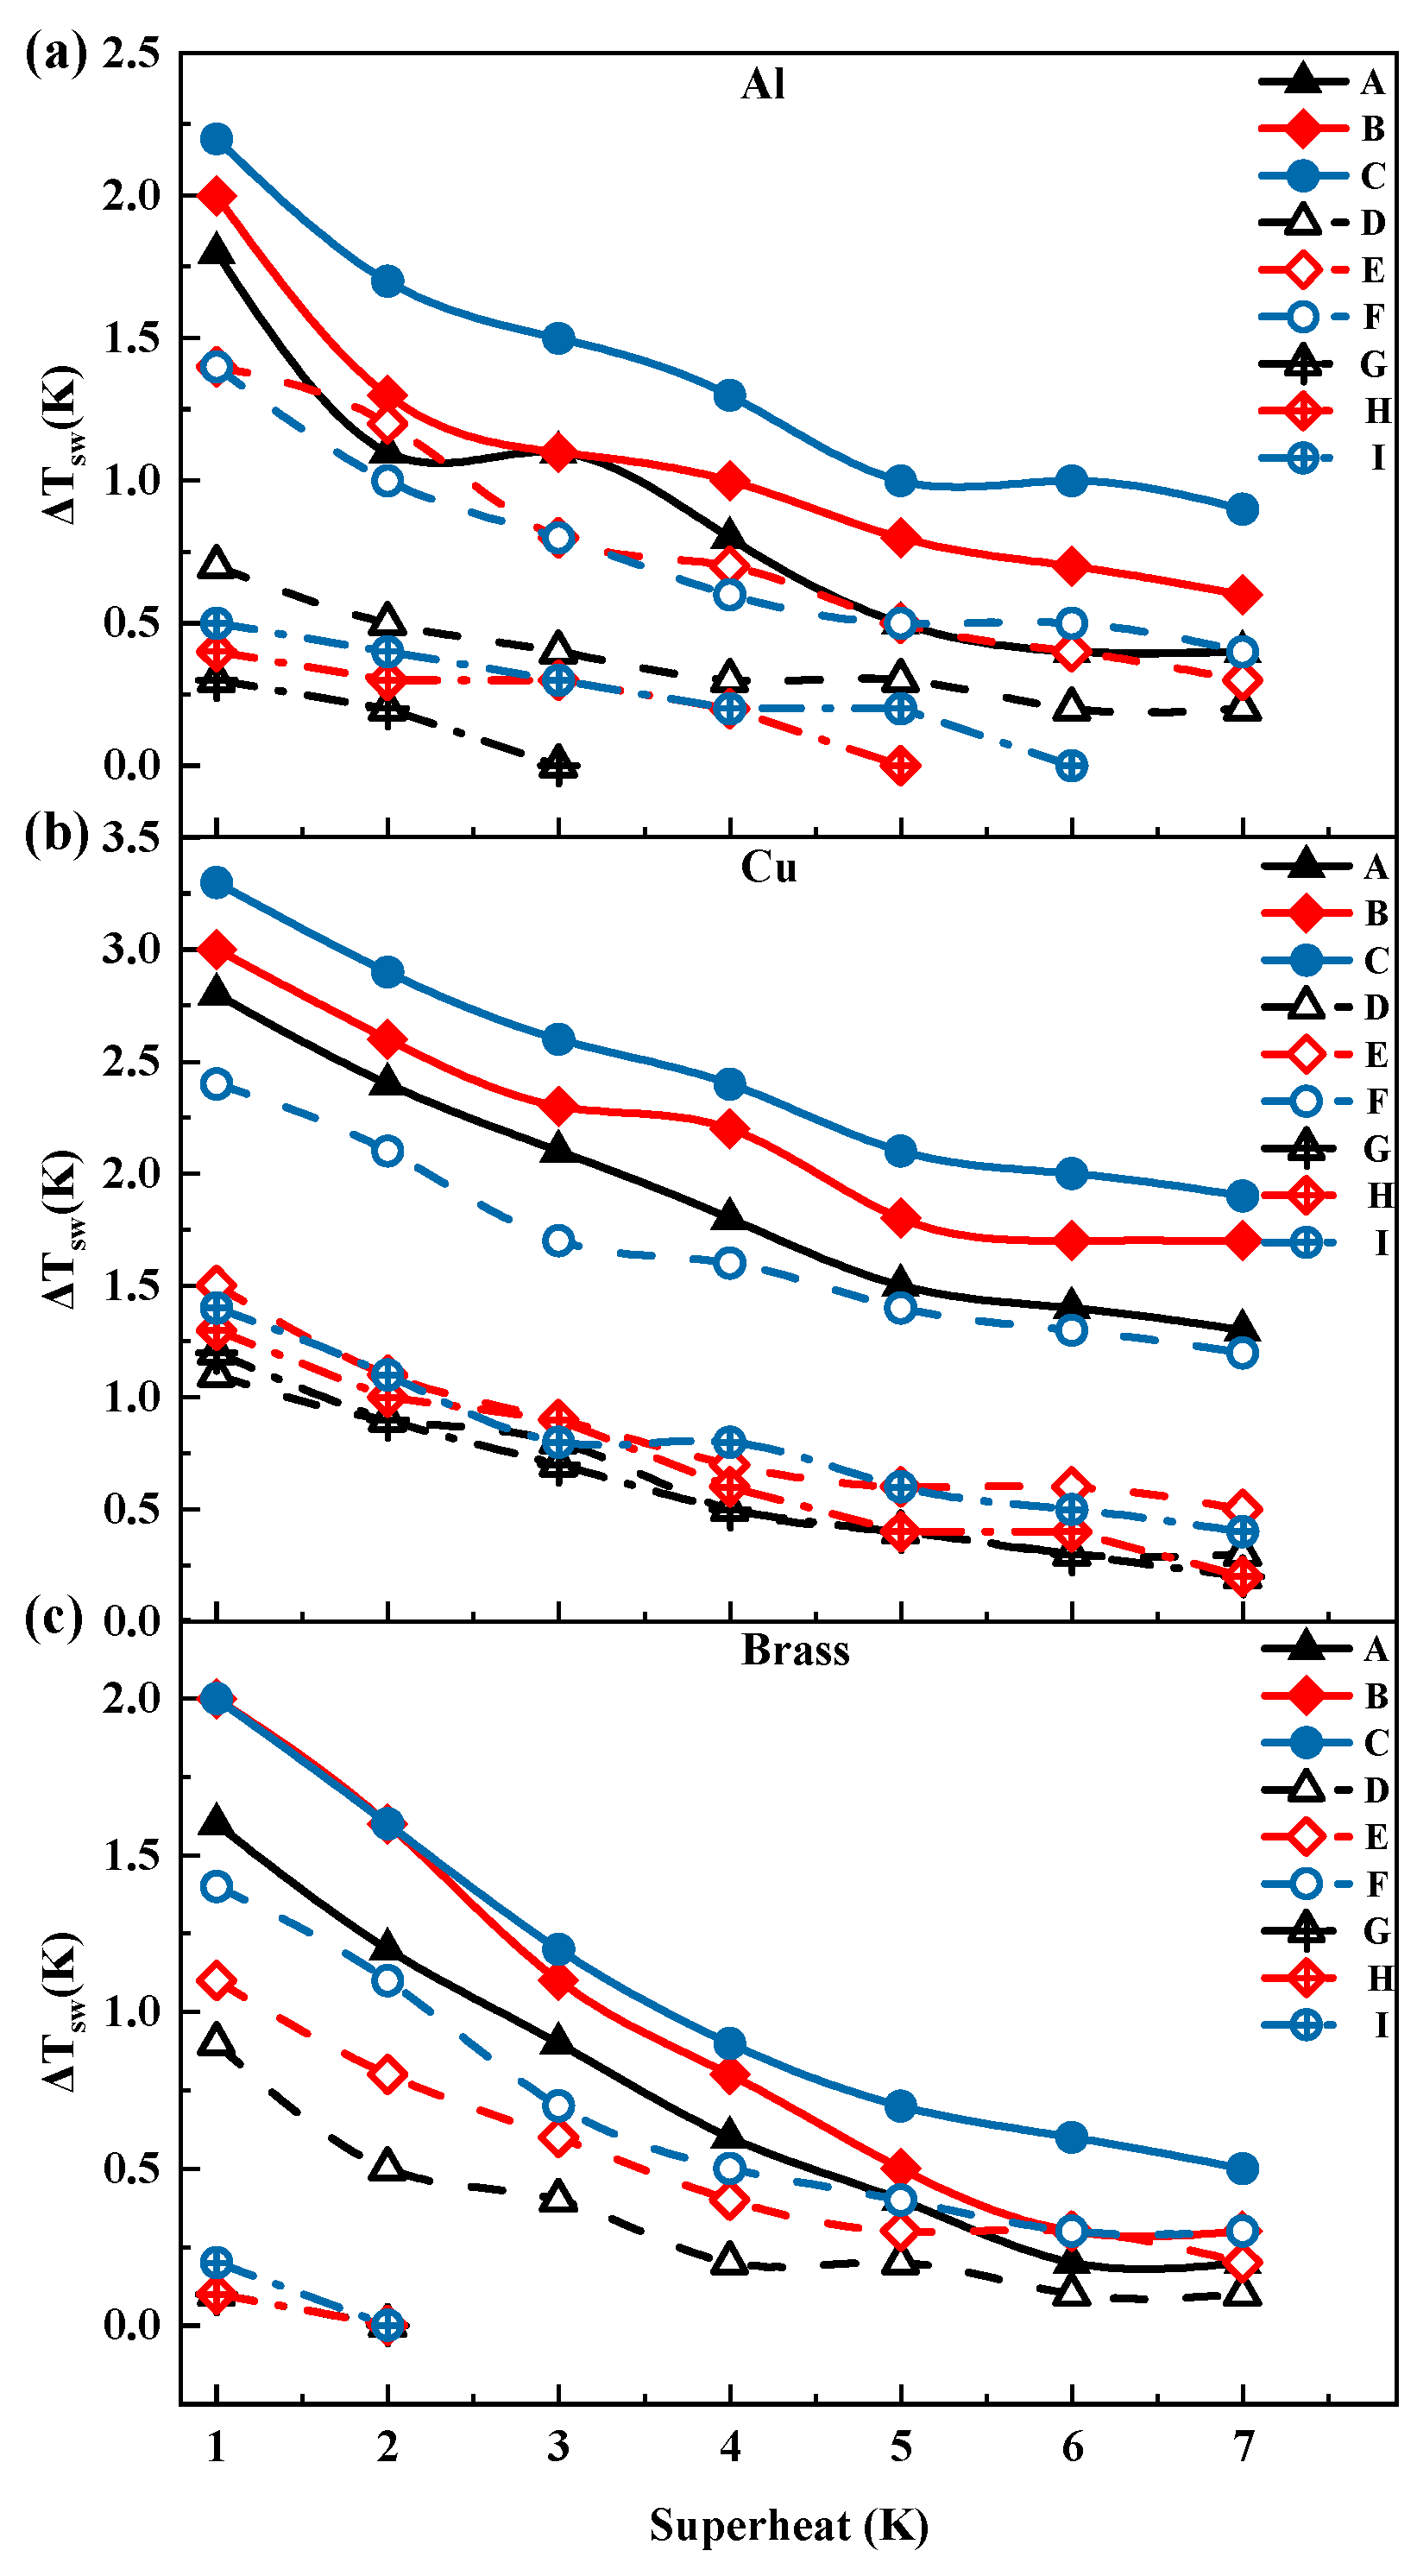
Figure 5a–c show that in the study of heat exchange between PG droplets and the surface, as the surface superheating increases, the droplet surface temperature gradually approaches the corresponding surface temperature. This phenomenon is particularly evident when the surface roughness increases, indicating that surface roughness is an important factor affecting heat exchange efficiency. The temperature distribution of droplets on the brass surface shows the smallest difference from the surface temperature, followed by aluminum, while the difference is most pronounced on the copper surface.
For surfaces with original wettability, as the superheating increases, the rate at which the droplet surface temperature approaches the surface temperature decreases, especially in the high superheating region, where the temperature difference changes minimally, even stabilizing. This is because, as the superheating increases, the droplet thickness gradually decreases, leading to an increase in the droplet surface temperature, further reducing the gap between the droplet and surface temperatures.
For hydrophilic-treated surfaces, the trend of the droplet surface temperature change is similar to that of the original wettability heating plates, but overall, the droplet temperature is closer to the surface temperature. This phenomenon can be attributed to the significant reduction in droplet thickness on hydrophilic surfaces, resulting in a smaller temperature difference between the droplet and the heating-plate surface.
For hydrophobic-treated surfaces, the droplet surface temperature change on hydrophobic heating surfaces is significantly greater than that on hydrophilic or original wettability heating surfaces. This phenomenon is primarily attributed to the significant change in droplet thickness on hydrophobic surfaces. In contrast, the droplet surface temperature fluctuations on copper hydrophobic surfaces are smaller. On aluminum and brass hydrophobic surfaces, due to the absence of film boiling under highly superheated conditions, the droplet surface temperature corresponding to film evaporation cannot be achieved as the superheating increases.

3.2. Thickness and Surface Temperature of Ethanol Droplets During Film Evaporation

Figure 6 shows the change in droplet thickness of ethanol droplets with superheat of heating plate. From Figure 6a–c, it can be seen that, compared to PG droplets, ethanol droplets have a higher initial thickness on the heating plate. However, as the superheating increases, ethanol thickness rapidly decreases to a lower level, with ethanol being more sensitive to changes in superheating than propylene glycol. On different material surfaces, there are variations in droplet thickness and response to superheating: ethanol droplets on copper surfaces have the greatest thickness, followed by brass, while droplets on aluminum surfaces have the thinnest thickness. Notably, the ethanol droplet thickness on copper surfaces is most sensitive to changes in superheating, while the response on brass surfaces is relatively smaller. The thin-film evaporation of ethanol exhibits significantly higher sensitivity to superheat compared with propylene glycol, which results from the combined effects of multiple thermophysical properties. Ethanol’s low boiling point and high vapor pressure allow it to more readily enter the rapid evaporation regime, while its low viscosity and low surface tension enhance internal convection and the Marangoni effect, thereby promoting evaporation. In contrast, propylene glycol’s high boiling point, low vapor pressure, and high viscosity suppress the enhancement of its evaporation rate.
Additionally, PG, due to its tendency to form hydrogen bonds between molecules, requires more energy for phase change. This difference leads to distinct morphological changes in ethanol and PG droplets on different material surfaces.
The phenomena observed on hydrophilic surfaces follow a pattern similar to that on surfaces with original wettability. This pattern and principle are consistent with the behavior of PG droplets on hydrophilic and original wettability surfaces. This indicates that the dynamic behavior of droplet thickness on hydrophilic surfaces is significantly influenced by the material surface characteristics and their interactions, with this influence showing a certain consistency under both original wettability and hydrophilic treatment conditions. For hydrophobic-treated surfaces, on aluminum surfaces, it is observed that when the surface roughness is 1.51 µm and 0.72 µm, the droplet thickness decreases significantly after reaching the 2 K temperature point. For surfaces with 0.65 µm roughness, this decrease begins to appear at the 3 K temperature point. On copper surfaces, the droplet thickness on surfaces with three different roughness levels starts to decrease significantly at the 2 K temperature point. On brass surfaces, droplets with 1.51 µm and 0.72 µm roughness begin to decrease significantly at the 3 K temperature point, while droplets with 0.65 µm roughness start to decrease significantly at the 5 K temperature point. This is because, as the degree of superheating increases, the heat flux delivered to the liquid-film interface rises significantly, causing the film evaporation rate to greatly exceed the liquid replenishment rate. The sharply increasing latent heat demand drives the local interface temperature toward the saturation temperature, resulting in a nonuniform distribution of surface tension. This, in turn, further intensifies interfacial flow and film instability, ultimately leading to a rapid decrease in droplet thickness.
In summary, during the heating process, the decrease in droplet thickness during film evaporation typically follows a three-stage trend. The trend of thickness reduction in the droplet slows down gradually before reaching a significant decrease. Furthermore, when the superheating reaches a certain point, the droplet thickness decreases significantly. When significant changes in droplet thickness occur, as shown in Figure S6 that in Supplementary Materials, the droplet thickness between adjacent superheating levels decreases by approximately 50% of the droplet thickness at the previous superheating level. In the final stage, when the droplet thickness decreases to a lower level, its rapid reduction begins to slow down until the film boiling phenomenon becomes difficult to observe. Additionally, when other working fluids or conditions are altered, although this pattern is not shown in the figure, similar phenomena may still occur. However, these conditions may require higher superheating, or the conditions may cause the system to directly enter the final dry-out stage without exhibiting the full set of phenomena.
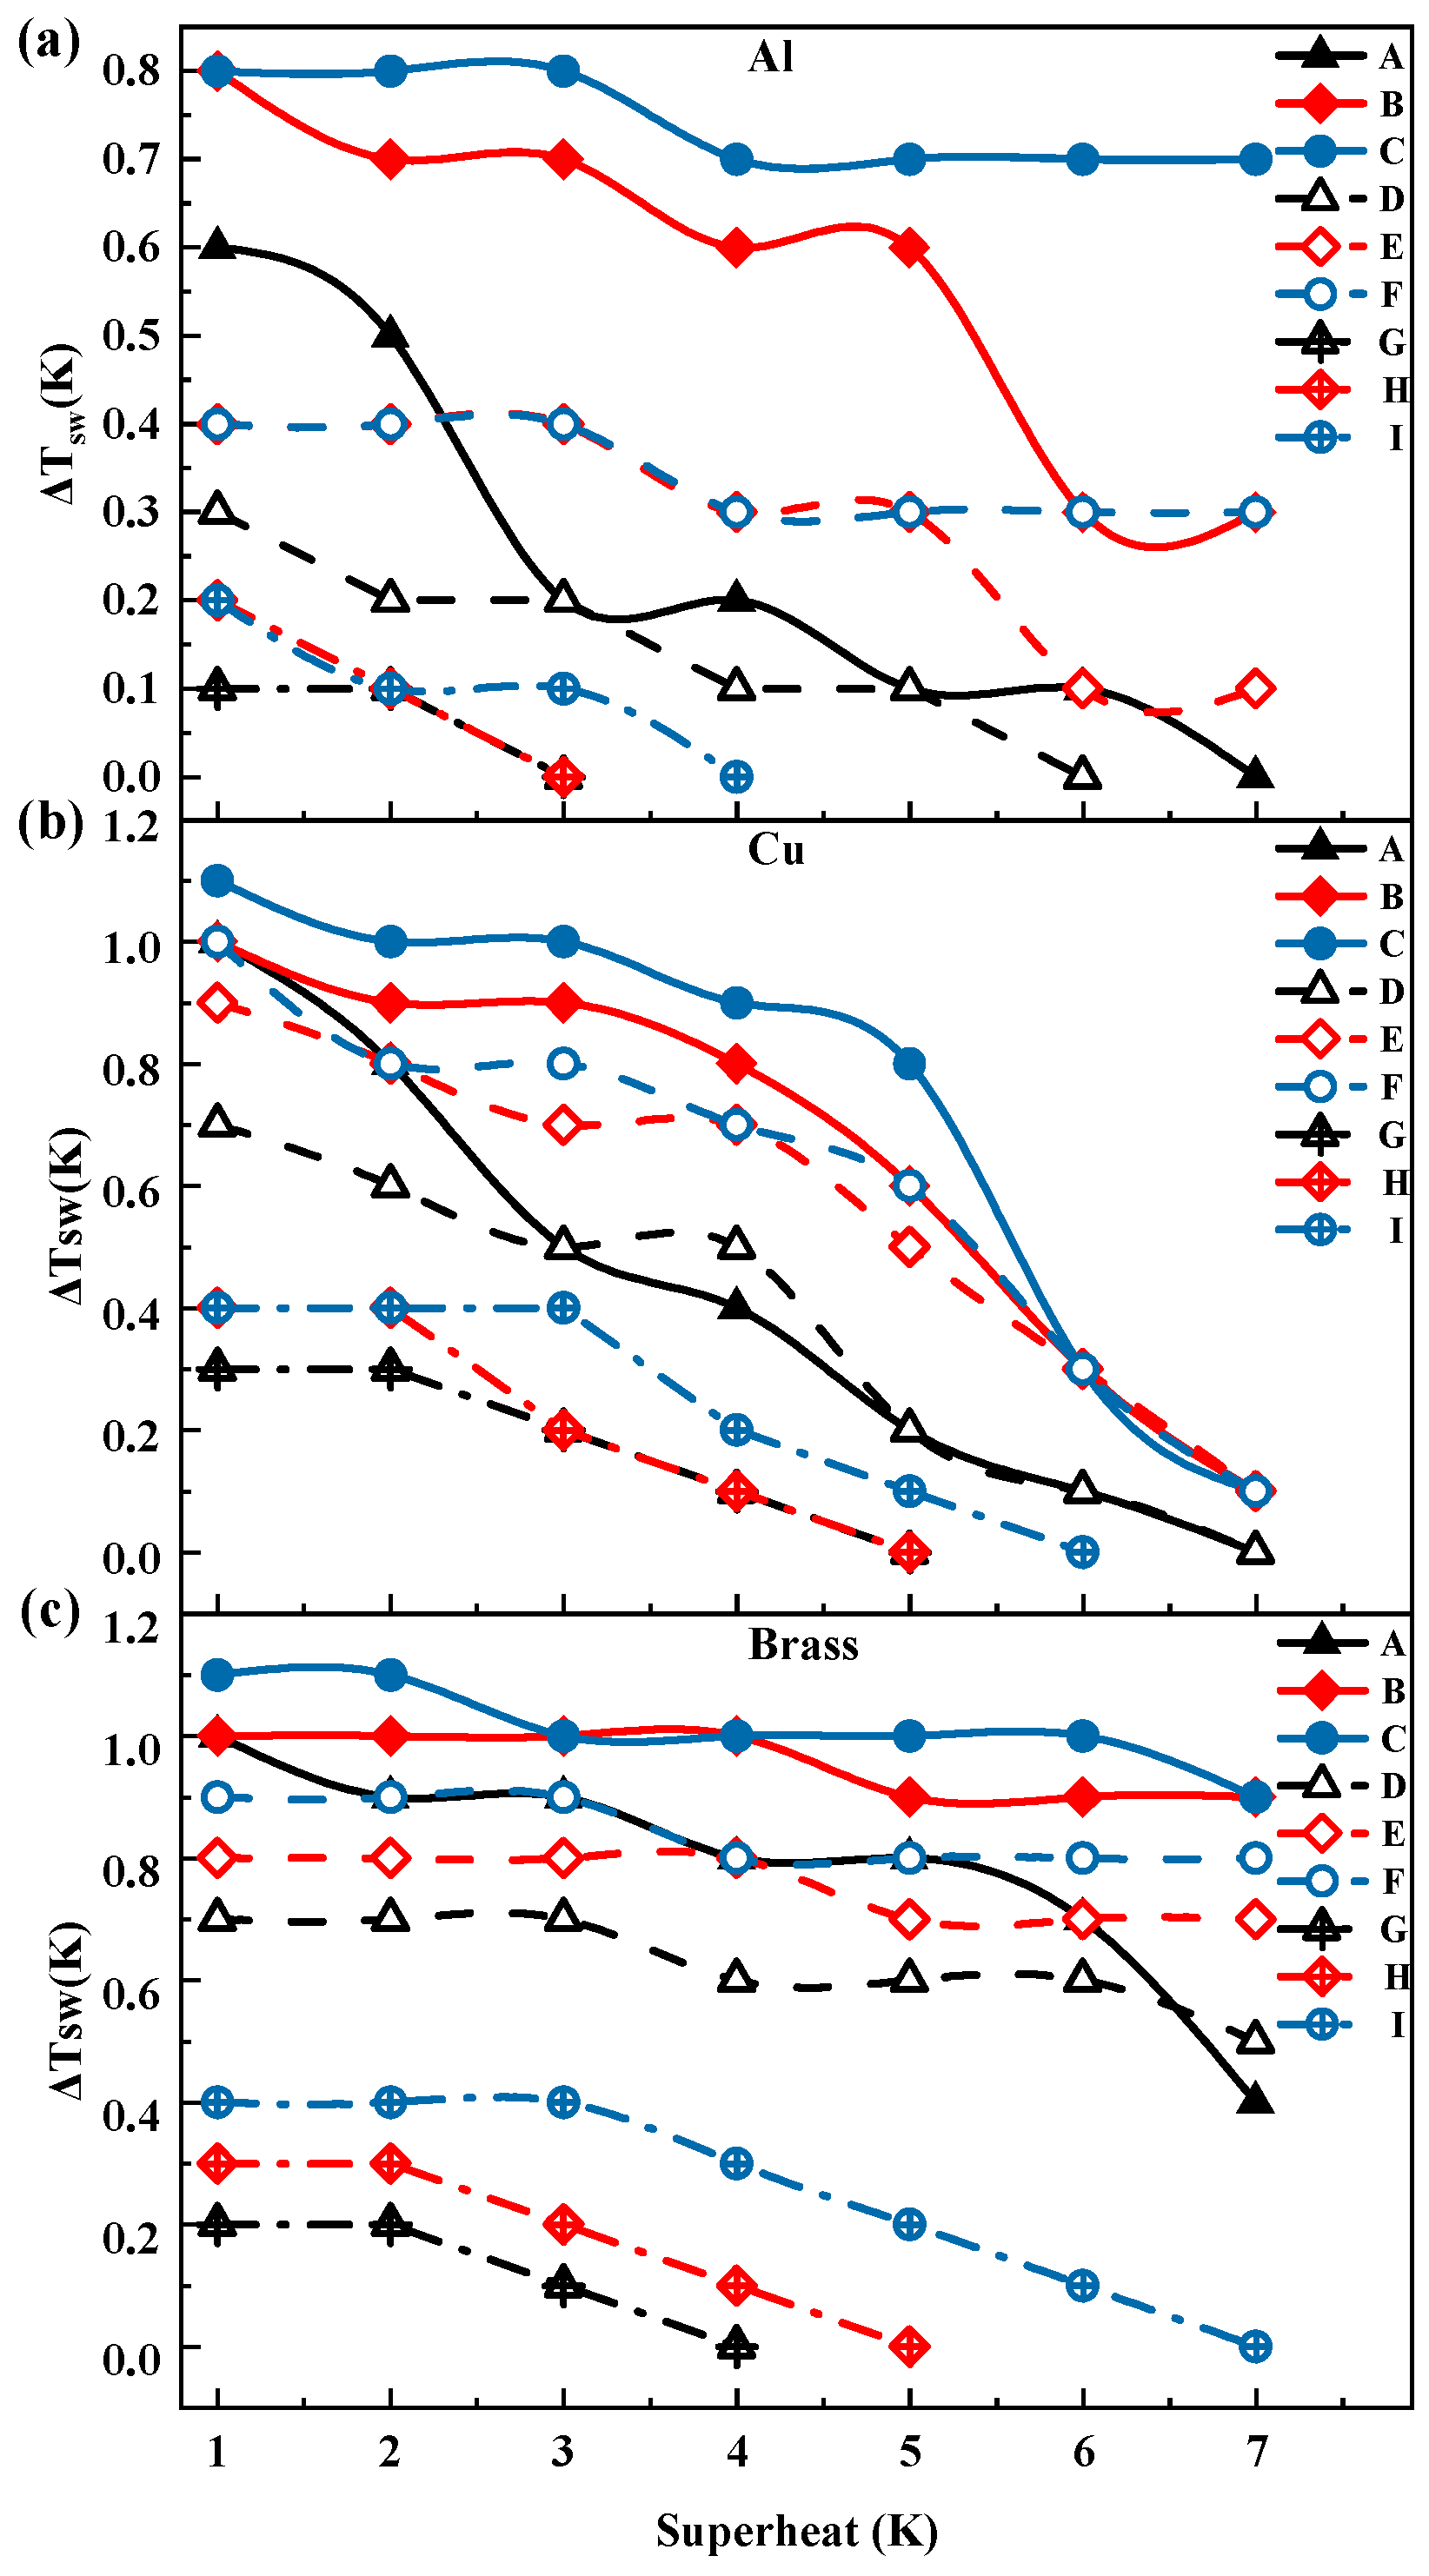
As shown in Figure 7a–c, in the ethanol droplet-wall heat exchange study, by comparing the experimental data of ethanol and PG droplets, it was observed that the temperature difference between the surface temperature of the ethanol droplet and the wall temperature was greater than that of the PG droplet. For surfaces with original wettability, droplets with a roughness of 0.65 µm on the aluminum substrate exhibited relatively stable temperature characteristics under superheating conditions, while droplets with a roughness of 0.72 µm showed significant temperature fluctuations when the superheating degree reached 6 K. Droplets with a roughness of 1.51 µm exhibited similar significant temperature changes at a superheating degree of 3 K. On the copper plate, droplets with roughness of 0.65 µm and 0.72 µm also showed significant temperature changes at a superheating degree of 6 K, while droplets with a roughness of 1.51 µm exhibited a continuous trend of temperature approaching the wall temperature. On the brass plate, droplets with roughness of 0.65 µm and 0.72 µm exhibited relatively small temperature changes, whereas droplets with a roughness of 1.51 µm experienced a significant temperature jump at a superheating degree of 7 K.
For hydrophilic-treated surfaces, the temperature fluctuations of droplets on copper and brass surfaces changed relatively less compared to those on surfaces with original wettability. On the aluminum heating plate, however, the surface temperature of the droplets increased more significantly, by approximately 50% of the original temperature difference. This change is also influenced by the thickness variation pattern. Due to the larger thickness variation on the aluminum heating surface, its temperature change is relatively more significant.
For hydrophobic-treated surfaces, on the aluminum surface, the droplet thickness significantly decreased as the superheating degree increased, leading to the surface temperature approaching the wall temperature. On copper plates with roughness of 1.51 µm and 0.72 µm, significant changes in surface temperature were observed when the superheating degree reached 3 K. On the copper plate with a roughness of 0.65 µm, this change occurred at a superheating degree of 4 K. On the brass surface, droplets with a roughness of 1.51 µm exhibited significant temperature changes at 3 K, while droplets with a roughness of 0.72 µm showed significant changes at 4 K. For the roughness of 0.65 µm, significant temperature changes occurred when the superheating degree reached 6 K. From the trend of thickness and temperature difference curves, it can be observed that the temperature difference and thickness have a certain similarity. As the droplet thickness changes, the temperature difference also exhibits a corresponding variation trend.

4. Conclusions

In the current study, a thin-film evaporation observation platform was used to investigate the thin-film evaporation of two types of droplets: propylene glycol and ethanol. The morphological changes and temperature variations in the droplets were explored by altering the superheating degree, material, roughness, and wettability of the heating plate. The following conclusions can draw from the study:
(1)
With the gradual increase in the degree of superheating, the droplet undergoes three distinct stages during the film evaporation process. In the initial stage, as the degree of superheating increases, the reduction in droplet thickness is relatively slow. In the intermediate stage, the droplet thickness decreases sharply as the degree of superheating further increases. In the final stage, as the droplet thickness reaches a relatively low level, its rapid reduction trend begins to slow down until the film evaporation phenomenon becomes difficult to observe.
(2)
The effects of the heating-plate material, roughness, and wettability on droplet thickness were further investigated. First, the droplet thickness was greatest on the copper plate, while the thickness was smaller on brass or aluminum plates. Second, increase in roughness led to decrease in the overall droplet thickness. Additionally, changes in wettability also affected droplet thickness. Hydrophilic and hydrophobic treatments reduced droplet thickness, with the reduction being more pronounced under hydrophobic treatment.
(3)
Under different superheat conditions, the thickness of ethanol droplets and propylene glycol droplets exhibited distinct trends. In the low superheat region, the thickness of ethanol droplets was higher, whereas the opposite trend was observed in the high superheat region, indicating that ethanol is more sensitive to changes in superheat compared to propylene glycol. Additionally, under certain superheat conditions, the droplet thickness may experience a sudden drop, where an increase of 1 K in superheat can result in a thickness reduction of up to 50%.
(4)
When entering the thin-film evaporation state, the droplet surface temperature gradually approaches the wall temperature, exhibiting a trend consistent with the thickness variation, indicating an intrinsic correlation. Increasing surface roughness slightly elevated the overall temperature level. Compared to propylene glycol droplets, ethanol droplets exhibited a more stable variation in the surface-to-wall temperature difference in the low superheat region, but showed more pronounced changes in the high superheat region.
This study qualitatively identified the variation trends of two organic solvent droplets with increasing superheat and obtained the thin-film evaporation characteristics of different organic solvent droplets. However, future work should focus on investigating the thin-film evaporation effects of a wider range of organic solvent droplets with diverse properties. It is also necessary to obtain more data on the thin-film evaporation characteristics of droplets under different operating conditions and to conduct further mechanistic studies on the factors influencing thin-film evaporation. Such efforts will contribute to the control and application of thin-film evaporation of organic solvent droplets under various practical requirements.

Supplementary Materials

The following supporting information can be downloaded at: https://www.mdpi.com/article/10.3390/en18195113/s1, Figure S1: Scanning electron microscope images of three surfaces with different roughness; Figure S2: Contact-angle measurement results for selected surfaces; Figure S3: Infrared thermography temperature calibration setup; Figure S4: Infrared thermography temperature calibration fitting curves: (a) propylene glycol (PG), (b) ethanol; Figure S5: Infrared images verifying the surface temperature uniformity of the aluminum plate: (a) for propylene glycol droplets, (b) for ethanol droplets; Figure S6: Percentage of decrease in droplet thickness during a significant reduction; Table S1: Temperatures, average temperature, and maximum deviation (°C) at different points on the heating surface for propylene glycol droplets within the superheating range of 1K to 7K; Table S2: Temperatures, average temperature, and maximum deviation (°C) at different points on the heating surface for ethanol droplets within the superheating range of 1K to 7K.

Author Contributions

Conceptualization, D.S.; Methodology, D.S.; Software, B.W.; Validation, B.W.; Formal analysis, M.X.; Investigation, B.W.; Resources, Y.L.; Data curation, Y.L.; Writing—original draft, Y.L.; Writing—review and editing, M.X.; Visualization, M.X.; Supervision, Y.Z.; Project administration, Y.Z.; Funding acquisition, Y.Z. All authors have read and agreed to the published version of the manuscript.

Funding

This research was funded by the National Natural Science Foundation of China (No. 52166009, 12372246), Jiangxi Provincial Natural Science Foundation (No. 20242BAB26072), and Key Research and Development Program of Jiangxi Province (No. 20224BBG72002).

Data Availability Statement

The original contributions presented in this study are included in the article/Supplementary Materials. Further inquiries can be directed to the corresponding author.

Conflicts of Interest

Author Deji Sun was employed by the company CHN Energy Jiangxi Engineering Technology Co., Ltd. The remaining authors declare that the research was conducted in the absence of any commercial or financial relationships that could be construed as a potential conflict of interest.

References

  1. Liu, X.S.; Hu, M.H.; Caneau, C.G.; Bhat, R.; Zah, C.E. Thermal management strategies for high power semiconductor pump lasers. IEEE Trans. Compon. Packag. Technol. 2006, 29, 268–276. [Google Scholar] [CrossRef]
  2. Zeng, J.; Wang, Q.Y.; Shi, Y.; Liu, P.; Chen, R.K. Osmotic Pumping and Salt Rejection by Polyelectrolyte Hydrogel for Continuous Solar Desalination. Adv. Energy Mater. 2019, 9, 1900552. [Google Scholar] [CrossRef]
  3. Gukeh, M.J.; Bao, C.B.; Mukhopadhyay, A.; Damoulakis, G.; Mazumder, S.K.; Megaridis, C.M. Air-cooled hybrid vapor chamber for thermal management of power electronics. Appl. Therm. Eng. 2023, 224, 120081. [Google Scholar] [CrossRef]
  4. Wang, J.X.; Yu, B.B.; Qian, C.Y.; Shi, J.Y.; Chen, J.P. Experimental study on the boiling heat transfer characteristics of a pump-driven two-phase cooling loop system for high heat flux avionics. Therm. Sci. Eng. Prog. 2023, 45, 102150. [Google Scholar] [CrossRef]
  5. Yang, X.; Liu, J.; Wang, G.; Wei, J. Experimental study of mechanical-capillary driven phase-change loop for heat dissipation of electronic devices and batteries. Appl. Therm. Eng. 2022, 210, 118350. [Google Scholar] [CrossRef]
  6. Tang, H.; Tang, Y.; Wan, Z.P.; Li, J.; Yuan, W.; Lu, L.S.; Li, Y.; Tang, K.R. Review of applications and developments of ultra-thin micro heat pipes for electronic cooling. Appl. Energy 2018, 223, 383–400. [Google Scholar] [CrossRef]
  7. Chhokar, C.; Ashouri, M.; Bahrami, M. Modeling the thermal and hydrodynamic performance of grooved wick flat heat pipes. Appl. Therm. Eng. 2024, 257, 124281. [Google Scholar] [CrossRef]
  8. Bae, K.; Kang, G.; Cho, S.K.; Park, W.; Kim, K.; Padilla, W.J. Flexible thin-film black gold membranes with ultrabroadband plasmonic nanofocusing for efficient solar vapour generation. Nat. Commun. 2015, 6, 10103. [Google Scholar] [CrossRef]
  9. Peng, G.L.; Ding, H.R.; Sharshir, S.W.; Li, X.J.; Liu, H.C.; Ma, D.K.; Wu, L.R.; Zang, J.F.; Liu, H.; Yu, W.; et al. Low-cost high-efficiency solar steam generator by combining thin film evaporation and heat localization: Both experimental and theoretical study. Appl. Therm. Eng. 2018, 143, 1079–1084. [Google Scholar] [CrossRef]
  10. Zhou, X.Y.; Zhao, F.; Guo, Y.H.; Zhang, Y.; Yu, G.H. A hydrogel-based antifouling solar evaporator for highly efficient water desalination. Energy Environ. Sci. 2018, 11, 1985–1992. [Google Scholar] [CrossRef]
  11. Guo, Y.H.; Zhao, F.; Zhou, X.Y.; Chen, Z.C.; Yu, G.H. Tailoring Nanoscale Surface Topography of Hydrogel for Efficient Solar Vapor Generation. Nano Lett. 2019, 19, 2530–2536. [Google Scholar] [CrossRef]
  12. Chen, X.F.; Zhu, Y.B.; Yu, H.; Liu, J.Z.; Easton, C.D.; Wang, Z.Y.; Hu, Y.X.; Xie, Z.L.; Wu, H.A.; Zhang, X.W.; et al. Ultrafast water evaporation through graphene membranes with subnanometer pores for desalination. J. Membr. Sci. 2021, 621, 118934. [Google Scholar] [CrossRef]
  13. Plawsky, J.L.; Fedorov, A.G.; Garimella, S.V.; Ma, H.B.; Maroo, S.C.; Chen, L.; Nam, Y. Nano- and Microstructures for Thin-Film Evaporation—A Review. Nanosc. Microsc. Therm. 2014, 18, 251–269. [Google Scholar] [CrossRef]
  14. Wang, Q.Y.; Shi, Y.; Chen, R.K. Transition between thin film boiling and evaporation on nanoporous membranes near the kinetic limit. Int. J. Heat Mass Transf. 2020, 154, 119673. [Google Scholar] [CrossRef]
  15. Zhang, Z.; Yan, Y. Effect of Photolithographic Biomimetic Surface Microstructure on Wettability and Droplet Evaporation Process. Biomimetics 2024, 9, 724. [Google Scholar] [CrossRef] [PubMed]
  16. Wen, R.F.; Xu, S.S.; Lee, Y.C.; Yang, R.G. Capillary-driven liquid film boiling heat transfer on hybrid mesh wicking structures. Nano Energy 2018, 51, 373–382. [Google Scholar] [CrossRef]
  17. Xia, G.D.; Wang, J.H.; Zhou, W.B.; Ma, D.D.; Wang, J. Orientation effects on liquid-vapor phase change heat transfer on nanoporous membranes. Int. Commun. Heat Mass Transf. 2020, 119, 104934. [Google Scholar] [CrossRef]
  18. Hanks, D.F.; Lu, Z.M.; Sircar, J.; Salamon, T.R.; Antao, D.S.; Bagnall, K.R.; Barabadi, B.; Wang, E.N. Nanoporous membrane device for ultra high heat flux thermal management. Microsyst. Nanoeng. 2018, 4, 1. [Google Scholar] [CrossRef]
  19. Xiao, R.; Maroo, S.C.; Wang, E.N. Negative pressures in nanoporous membranes for thin film evaporation. Appl. Phys. Lett. 2013, 102, 123103. [Google Scholar] [CrossRef]
  20. Cattani, L.; Bozzoli, F.; Ayel, V.; Romestant, C.; Bertin, Y. Experimental estimation of the local heat transfer coefficient for thin liquid film evaporation in a capillary tube. Appl. Therm. Eng. 2023, 219, 119482. [Google Scholar] [CrossRef]
  21. Lakew, E.; Sarchami, A.; Giustini, G.; Kim, H.; Bellur, K. Thin Film Evaporation Modeling of the Liquid Microlayer Region in a Dewetting Water Bubble. Fluids 2023, 8, 126. [Google Scholar] [CrossRef]
  22. Pang, B.; Yang, G.; Liu, X.; Huang, Y.; Li, W.; He, Y.; Shi, Z.; Yang, Z.; Dong, T. Experimental Study of Evaporation Characteristics of Acoustically Levitated Fuel Droplets at High Temperatures. Energies 2024, 17, 271. [Google Scholar] [CrossRef]
  23. Wu, G.; Nie, W.; Yang, C.; Zhou, S.; Wang, H. Experimental Study of the Effect of the Initial Droplet Diameter on the Evaporation Characteristics of Unsymmetrical Dimethylhydrazine Droplets in a Subcritical Environment. Aerospace 2024, 11, 297. [Google Scholar] [CrossRef]
  24. Wu, S.; Chen, L.; Jiang, S.; Guo, F.; Tao, Z. Droplet migration and early deposition of Mist CVD. Electron. Compon. Mater. 2024, 43, 454–460,467. [Google Scholar] [CrossRef]
  25. Dhavaleswarapu, H.K.; Garimella, S.V.; Murthy, J.Y. Microscale Temperature Measurements Near the Triple Line of an Evaporating Thin Liquid Film. J. Heat Transf. 2009, 131, 061501. [Google Scholar] [CrossRef]
  26. Migliaccio, C.P.; Dhavaleswarapu, H.K.; Garimella, S.V. Temperature measurements near the contact line of an evaporating meniscus V-groove. Int. J. Heat Mass Transf. 2011, 54, 1520–1526. [Google Scholar] [CrossRef]
  27. Ojha, M.; Chatterjee, A.; Dalakos, G.; Wayner, P.C.; Plawsky, J.L. Role of solid surface structure on evaporative phase change from a completely wetting corner meniscus. Phys. Fluids 2010, 22, 052101. [Google Scholar] [CrossRef]
  28. Hu, H.; Weibel, J.A.; Garimella, S.V. Role of nanoscale roughness in the heat transfer characteristics of thin film evaporation. Int. J. Heat Mass Transf. 2020, 150, 119306. [Google Scholar] [CrossRef]
  29. Xiaohuan, Z.; Xianbing, J.; Ye, W.; Jinliang, X. Pool boiling heat transfer on superhydrophilic and superhydrophobic surfaces. Chem. Prog. 2016, 35, 3793–3798. [Google Scholar] [CrossRef]
  30. Qian, B.T.; Shen, Z.Q. Fabrication of superhydrophobic surfaces by dislocation-selective chemical etching on aluminum, copper, and zinc substrates. Langmuir 2005, 21, 9007–9009. [Google Scholar] [CrossRef]
  31. Gregory, J. The calculation of Hamaker constants. Adv. Colloid Interface Sci. 1970, 2, 396–417. [Google Scholar] [CrossRef]
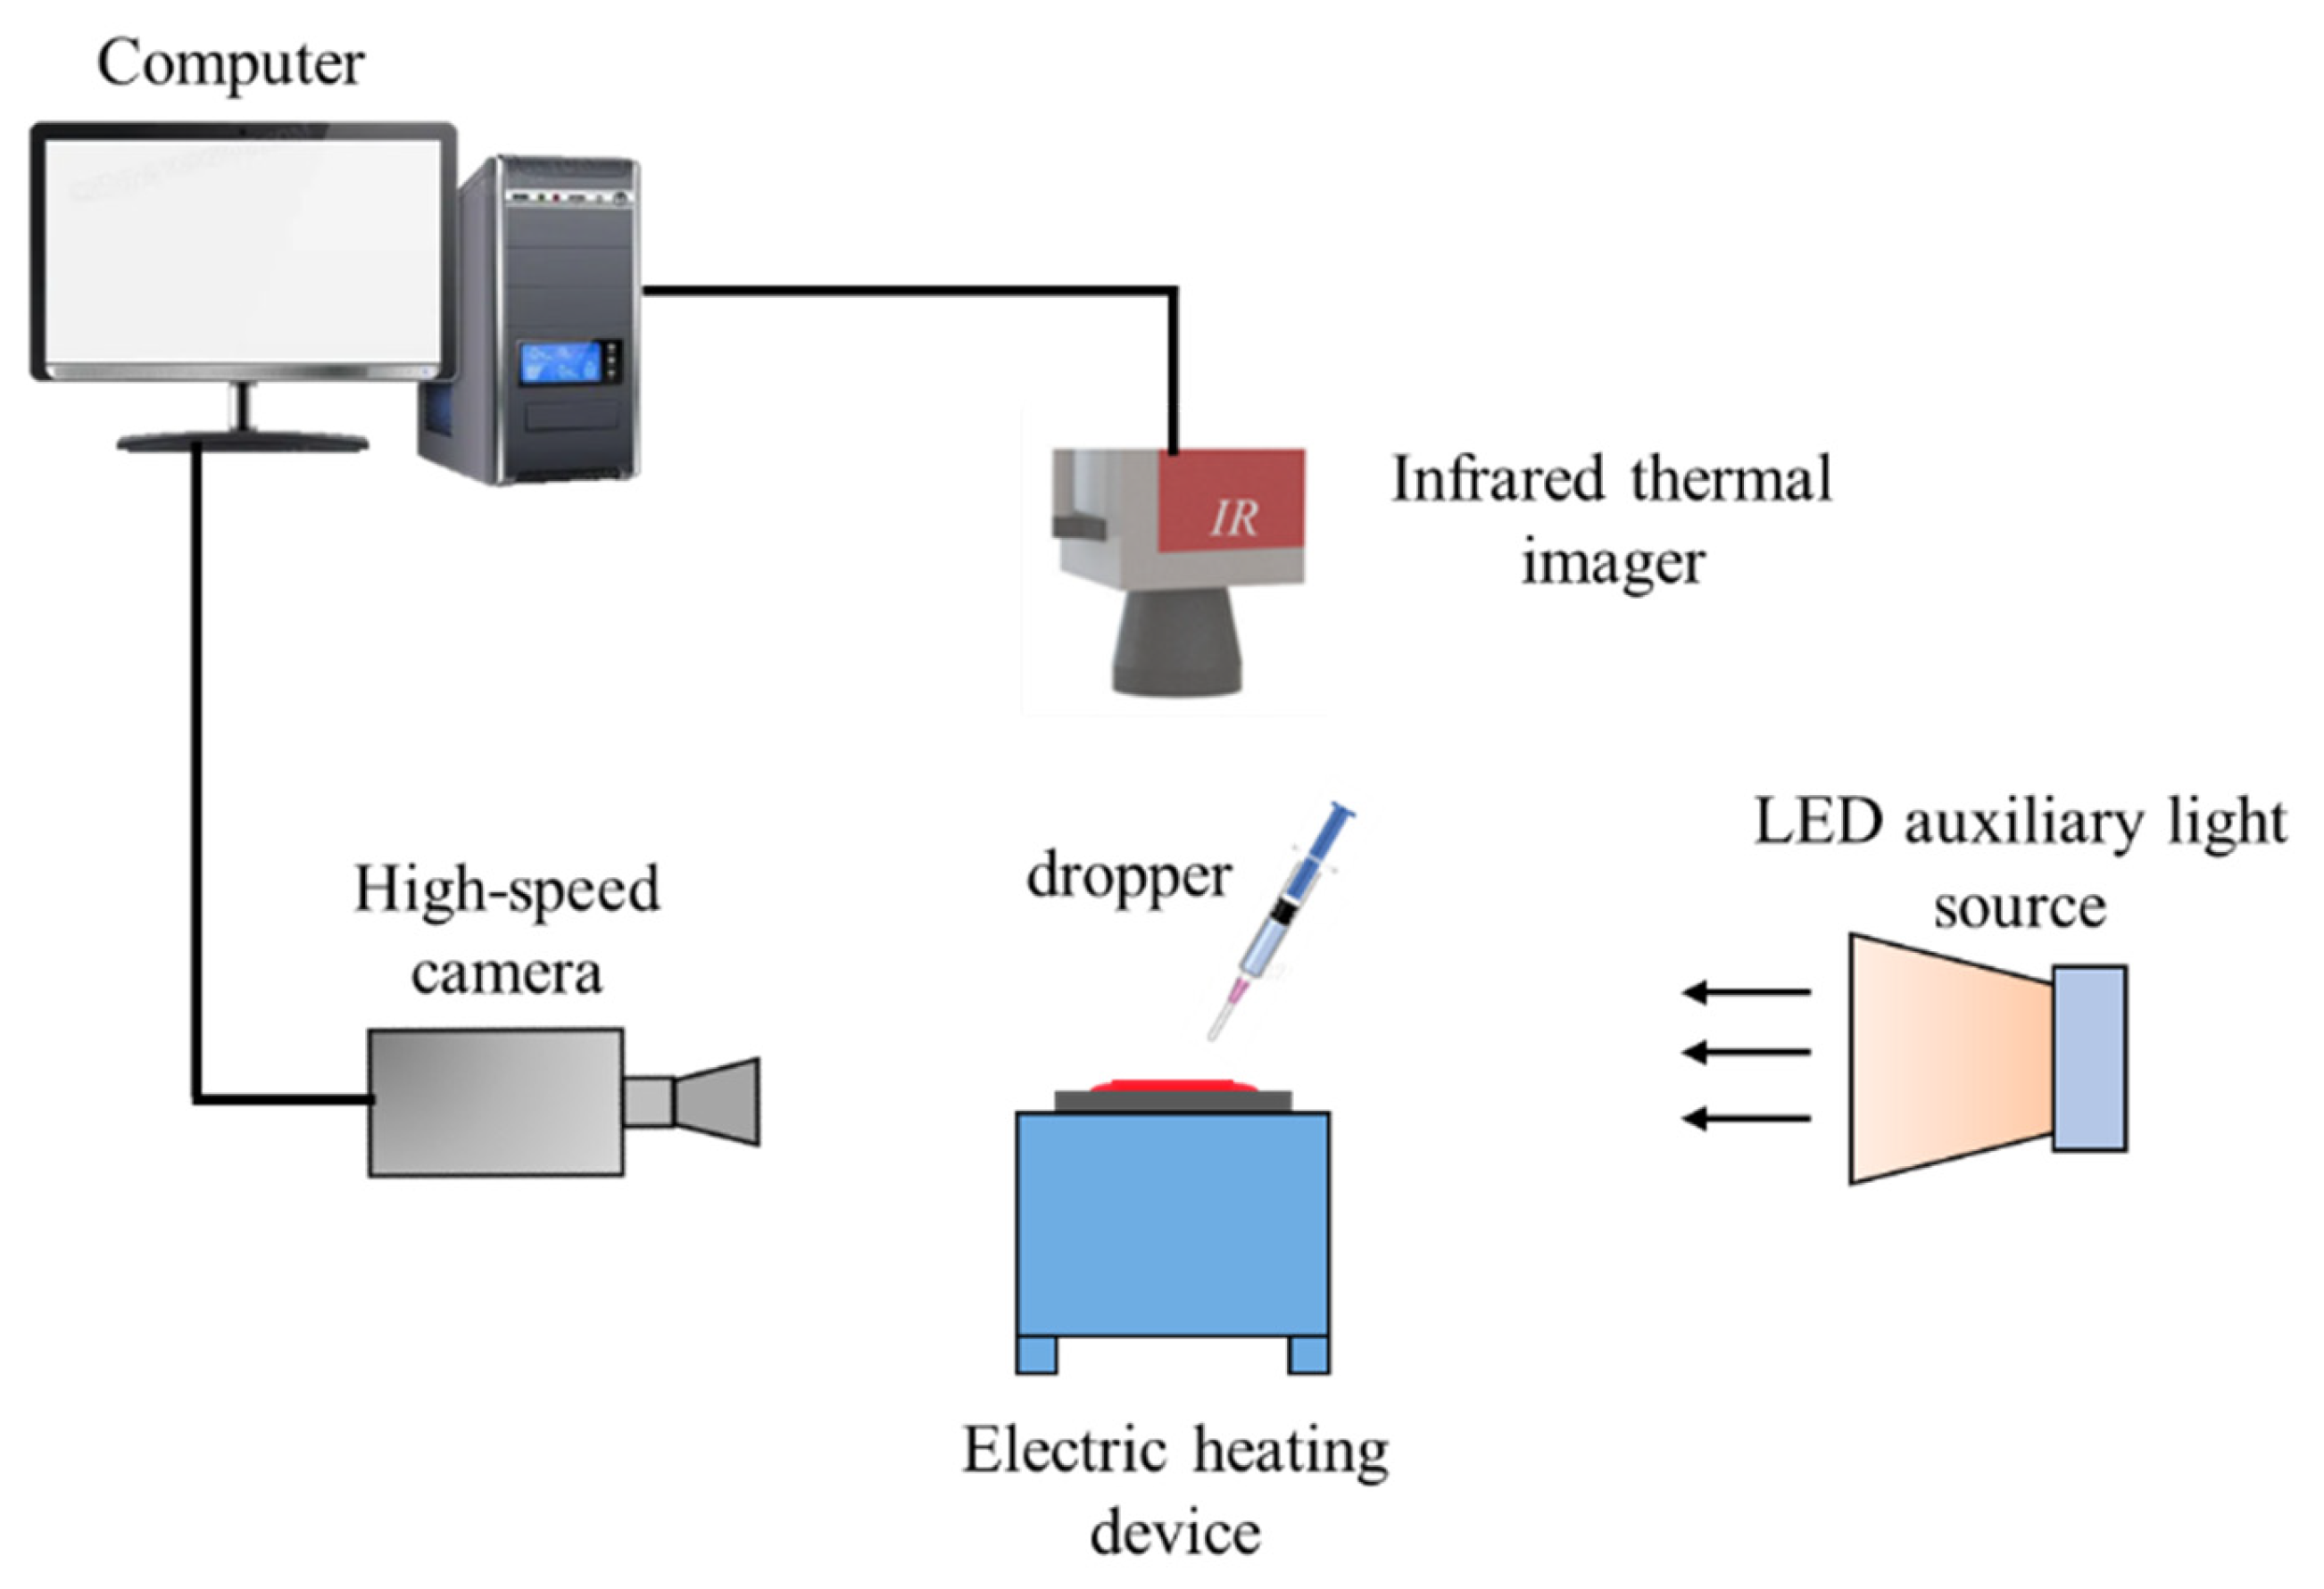
Figure 1. Experimental setup for observing thin-film evaporation phenomena.
Energies 18 05113 g001
Figure 2. (a) Boiling state of the droplet, (b) Film evaporation state of the droplet, (c) Infrared image of the boiling state, (d) Infrared image of the film evaporation state, (e) Position for measuring the thickness of the droplet. (The red–yellow regions indicate higher temperatures, whereas the blue–purple regions correspond to lower temperatures).
Energies 18 05113 g002
Figure 4. Schematic diagram of the modes of droplet morphological changes: (a) constant contact line, (b) constant contact angle. (The solid and dashed lines denote the droplet profiles before and after evaporation, respectively, while the arrows indicate the main direction of morphological change).
Energies 18 05113 g004
Figure 5. Variation in the temperature difference between the PG droplet surface and the heating-plate surface with the superheating degree: (a) aluminum heating plate, (b) copper heating plate, (c) brass heating plate. (Labels A–I represent surfaces with different wettability and roughness; specific parameters are listed in Table 4).
Energies 18 05113 g005
Figure 6. Relationship between ethanol droplet thickness and superheating degree on surfaces with different roughness and wettability: (a) aluminum heating plate, (b) copper heating plate, (c) brass heating plate. (Labels A–I represent surfaces with different wettability and roughness; specific parameters are listed in Table 4).
Energies 18 05113 g006
Figure 7. Variation in the temperature difference between the ethanol droplet surface and the heating-plate surface with the superheating degree: (a) aluminum heating plate, (b) copper heating plate, (c) brass heating plate. (Labels A–I represent surfaces with different wettability and roughness; specific parameters are listed in Table 4).
Energies 18 05113 g007
Table 1. Experimental equipment information.
Experimental EquipmentEquipment TypeManufacturerKey Parameters
Electric heating deviceJF966-1010JFTOOLS, Dongguan, China300W
High-speed cameradimax.HS1PCO AG, Kelheim, Germany1.8 × 105 fps
LED auxiliary light sourceRF-200WLan Yihe, Dongguan, China200 W
Contact-angle measuring instrumentSDC-200SSindin, Dongguan, China0.001°
Infrared thermal imagerA655scTeledyne FLIR, Wilsonville, OR, USA−40~650 °C
high-depth-of-field microscopeVHX-7000Keyence, Osaka, Japan1222 W pixels
Temperature data acquisition systemLR8431-30HIOKI E.E., Nagano, Japan0.1 °C
Ultrasonic cleaning apparatusVGT-2120QTDGTSONIC, Guangdong, China20–80 kHz
Heat collecting thermostatic magnetic stirrerDF-101SYushen Instrument Co., Ltd., Shanghai, China±1 °C
Table 2. Roughness measurement results of the polished surfaces at different mesh counts.
1000 Mesh2000 Mesh3000 Mesh
S a   µ m 1.510.720.65
S z   µ m 9.486.075.61
where Sa denotes the surface arithmetic mean height; Sz denotes the contour maximum height.
Table 3. Measurement results of contact angles for different surface treatments.
MaterialSurface Treatment
1.51
Sa   ( µ m )
0.72

0.65
CuHydrophilic19.01720.50019.223
Hydrophobic119.143120.618119.522
Unprocessed44.75444.68044.868
AlHydrophilic18.34020.09620.436
Hydrophobic122.383119.886121.072
Unprocessed42.07443.89042.421
BrassHydrophilic19.21022.83518.224
Hydrophobic122.145121.862122.120
Unprocessed42.58742.42143.344
Disclaimer/Publisher’s Note: The statements, opinions and data contained in all publications are solely those of the individual author(s) and contributor(s) and not of MDPI and/or the editor(s). MDPI and/or the editor(s) disclaim responsibility for any injury to people or property resulting from any ideas, methods, instructions or products referred to in the content.