Article

Research on Adaptive Control Optimization of Battery Energy Storage System Under High Wind Energy Penetration

1
Department of Electrical Engineering, National Chin-Yi University of Technology, Taichung 411, Taiwan
2
Department of Electrical Engineering, National Taiwan University of Science and Technology, Taipei 106, Taiwan
*
Author to whom correspondence should be addressed.
Energies 2025, 18(19), 5057; https://doi.org/10.3390/en18195057
Submission received: 26 August 2025 / Revised: 19 September 2025 / Accepted: 22 September 2025 / Published: 23 September 2025
(This article belongs to the Section A3: Wind, Wave and Tidal Energy)

Abstract

With the increasing penetration of renewable energy, power system frequency stability faces multiple challenges. In addition to the decline of system inertia traditionally provided by synchronous machines, uncertainties such as wind power forecast errors, converter control characteristics, and stochastic load fluctuations further exacerbate the system’s sensitivity to power disturbances, increasing the risks of frequency deviation and instability. Among these factors, insufficient inertia is widely recognized as one of the most direct and critical drivers of the initial frequency response. This study focuses on this issue and explores the use of battery energy storage system (BESS) parameter optimization to enhance system stability. To this end, a simulation platform was developed in PSS®E V34 based on the IEEE New England 39-bus system, incorporating three wind turbines and two BESS units. The WECC generic models were adopted, and three wind disturbance scenarios were designed, including (i) disconnection of a single wind turbine, (ii) derating of two turbines to 50% output, and (iii) derating of three turbines to 50% output. In this study, a one-at-a-time (OAT) sensitivity analysis was first performed to identify the key parameters affecting frequency response, followed by optimization using an improved particle swarm optimization (IPSO) algorithm. The simulation results show that the minimum system frequency was 59.888 Hz without BESS control, increased to 59.969 Hz with non-optimized BESS control, and further improved to 59.976 Hz after IPSO. Compared with the case without BESS, the overall improvement was 0.088 Hz, of which IPSO contributed an additional 0.007 Hz. These results clearly demonstrate that IPSO can significantly strengthen the frequency support capability of BESS and effectively improve system stability under different wind disturbance scenarios.

1. Introduction

With the global energy transition, the share of wind and solar power in grids is rapidly increasing. However, their intermittency and lack of rotational inertia make systems more sensitive to fluctuations [1,2]. High penetration of wind power can lead to frequency deviations and low-frequency oscillations under disturbances, threatening grid security [3].
Battery Energy Storage Systems (BESS) offer fast response and precise control, making them essential for frequency regulation and oscillation damping. However, most applications still rely on fixed parameter settings that cannot adapt to changing system conditions, limiting regulation efficiency. Heuristic algorithms such as Particle Swarm Optimization (PSO) have been used for parameter tuning [4,5,6,7], previous studies have confirmed that heuristic algorithms such as PSO can improve system frequency response [8,9], and recent works on hybrid or improved algorithms in the energy storage domain [10,11,12,13] further demonstrate their potential to enhance energy management and system performance. However, most remain limited: some are validated only on single-case scenarios, lacking cross-system generalizability, while others focus on static sizing without considering dynamic scheduling or uncertainty. In contrast, the improved particle swarm optimization (IPSO) balances global and local search by dynamically adjusting inertia weight and velocity updates, effectively avoiding premature convergence. Compared with genetic algorithms (GA), wolf pack, or bee colony algorithms, IPSO typically achieves faster convergence, lower and more controllable computational cost, and stronger adaptability. Hence, IPSO is well suited for the multi-scenario BESS parameter optimization required in this study, offering robust and efficient solutions.
On the other hand, BESS models contain numerous control parameters, and applying global optimization directly would create a heavy computational burden, making parameter screening necessary. Previous studies [14] used global sensitivity analysis (GSA) to identify key parameters in photovoltaic plants, while others showed that the one-at-a-time (OAT) method, though simple, can effectively identify major factors when full mathematical models are unavailable [15,16,17]. It should be clarified that this study adopts OAT rather than GSA methods such as Sobol or Morris. The choice reflects the large number and strong nonlinearity of BESS control parameters: Sobol provides accurate variance decomposition but requires excessive sampling and computational cost; Morris reduces computation but may underestimate parameter interactions. By contrast, OAT offers a practical balance between accuracy and feasibility. Although it cannot fully capture parameter interactions, it is sufficient to identify the key parameters influencing frequency response and to reduce the dimensionality of IPSO.
Based on these considerations, this study proposes a combined OAT–IPSO approach. OAT is first used to identify the key parameters, thereby reducing dimensionality, while IPSO improves search capability and adaptability through dynamic adjustment of inertia weight and velocity update strategies to address challenges under different wind disturbance conditions. Simulation results show that, compared with cases without energy storage or with fixed-parameter control, IPSO-optimized BESS controllers more effectively enhance frequency response and system stability, providing strong practicality and scalability. It should be emphasized that the proposed method is not intended to replace other strategies (e.g., virtual inertia control [18] or traditional primary/secondary frequency regulation [19,20,21]) but rather to complement and strengthen overall system stability.

2. Introduction to Research System, Grouping and Inventory Model

2.1. IEEE 39-Bus New England Power System

The IEEE 39-bus system, or 10-machine New England system, is a standard test model based on the New England power grid. It includes 39 buses, 10 generators, 46 transmission lines, and several transformers, and is widely used in research and simulations of power flow and dynamic behavior [22].
Based on the 39-bus system, this study adds three wind turbines and two battery energy storage systems to analyze their impact on frequency response. The system structure is shown in Figure 1.

2.2. General Model of WECC Wind Turbine

WT3 is a generic wind turbine stability model developed by WECC to simulate the operating behavior of wind turbines equipped with doubly fed induction generators (DFIGs). It has been widely implemented in simulation platforms such as PSS®E and PSLF. The model consists of four main modules: generator and converter, converter control, wind turbine and drive-train system, and pitch controller [23].
The converter control is divided into active and reactive power, regulated by current and voltage reference signals. Reactive power is set by a fixed value or an external controller, while active power depends on rotor speed and output. A simplified aerodynamic model is used without a full power coefficient curve, and a PI-based pitch controller adjusts rotor speed and power errors. Figure 2 shows the component relationships, and this study employs the Type-3 generic wind turbine model.

2.3. WECC Energy Storage General Model

This study adopts the WECC generic BESS models (REPC_A, REEC_C, REGC_A), primarily because these models have been widely applied in North American grid planning and stability analyses and are standard built-in models in commercial software such as PSS®E and PSLF. Compared with simplified models or custom-built control frameworks proposed in academia, the WECC models more accurately reflect the dynamic characteristics of practical BESS controllers in their structural design, while offering high portability and comparability that facilitate benchmarking with other studies. In addition, these models incorporate functionalities such as voltage/reactive power control, frequency/active power control, and SOC management, enabling a more comprehensive representation of BESS response under grid disturbances. For these reasons, they are regarded as a modeling approach that meets the requirements of practical applications.
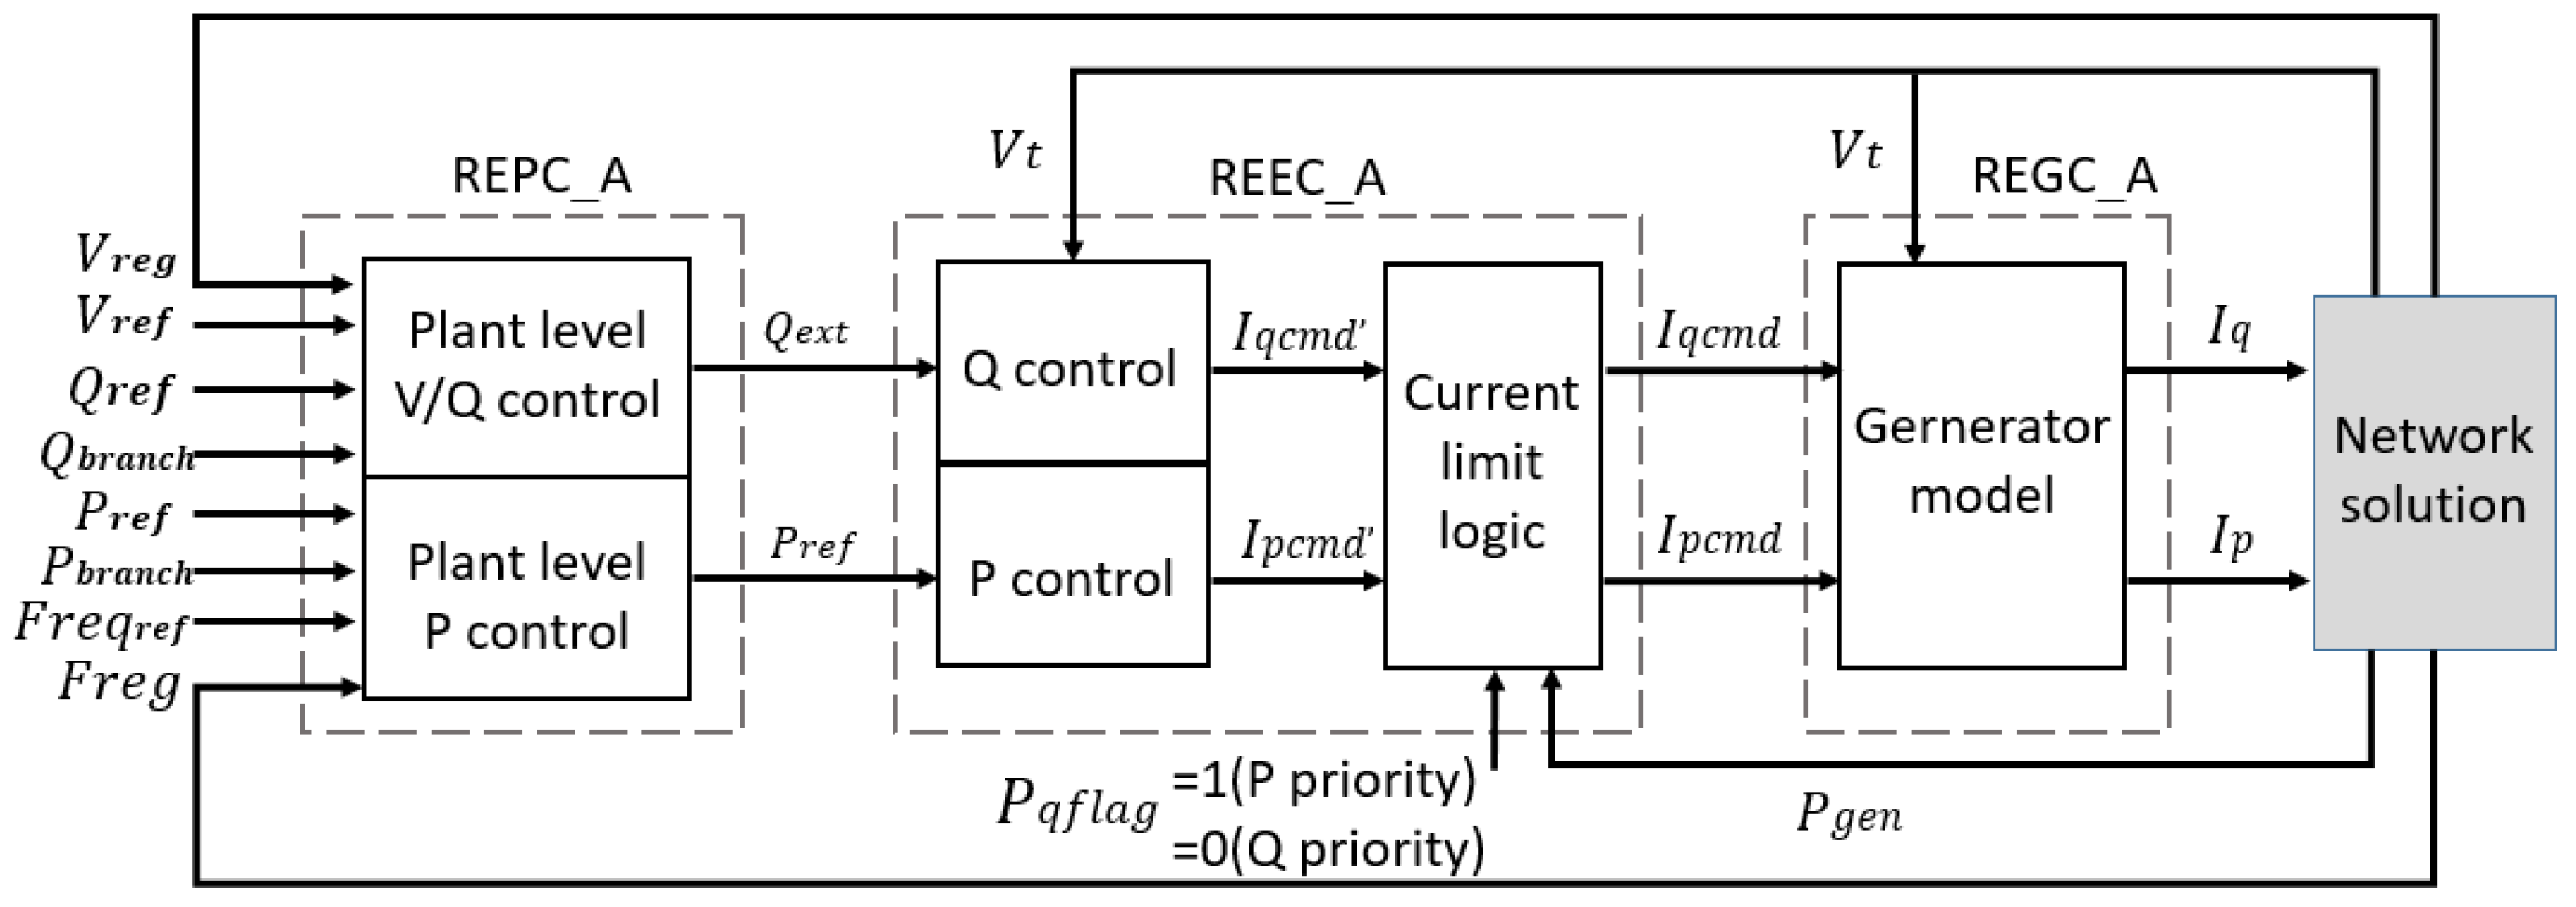
Therefore, this study uses the second-generation WECC generic model to build the energy storage system, integrating REPC, REGC, and REEC modules (Figure 3) [24]. The model supports active power, reactive power, and voltage control, with outputs limited by parameter settings. The control diagrams of each module are shown in Figure 4, Figure 5 and Figure 6 from the PSS®E documentation, with their functions described in the following sections.

2.3.1. REPC_A Model

Figure 4 shows the REPC_A plant controller, which works with REEC_A/B/C modules to regulate reactive power via Qext and active power via Pref. It supports voltage and reactive power control, and includes functions such as line-loss compensation, droop control, and deadband settings.

2.3.2. REEC_C Model

Figure 5 illustrates the REEC_C model, which simulates converter active and reactive power control. It supports fixed power factor or reactive power control via external signals, using PI controllers enabled by VFlag and QFlag. The model includes voltage dip handling, current limiting, protective logic, and output constraints based on P m a x /Pmin.

2.3.3. REGC_A Model

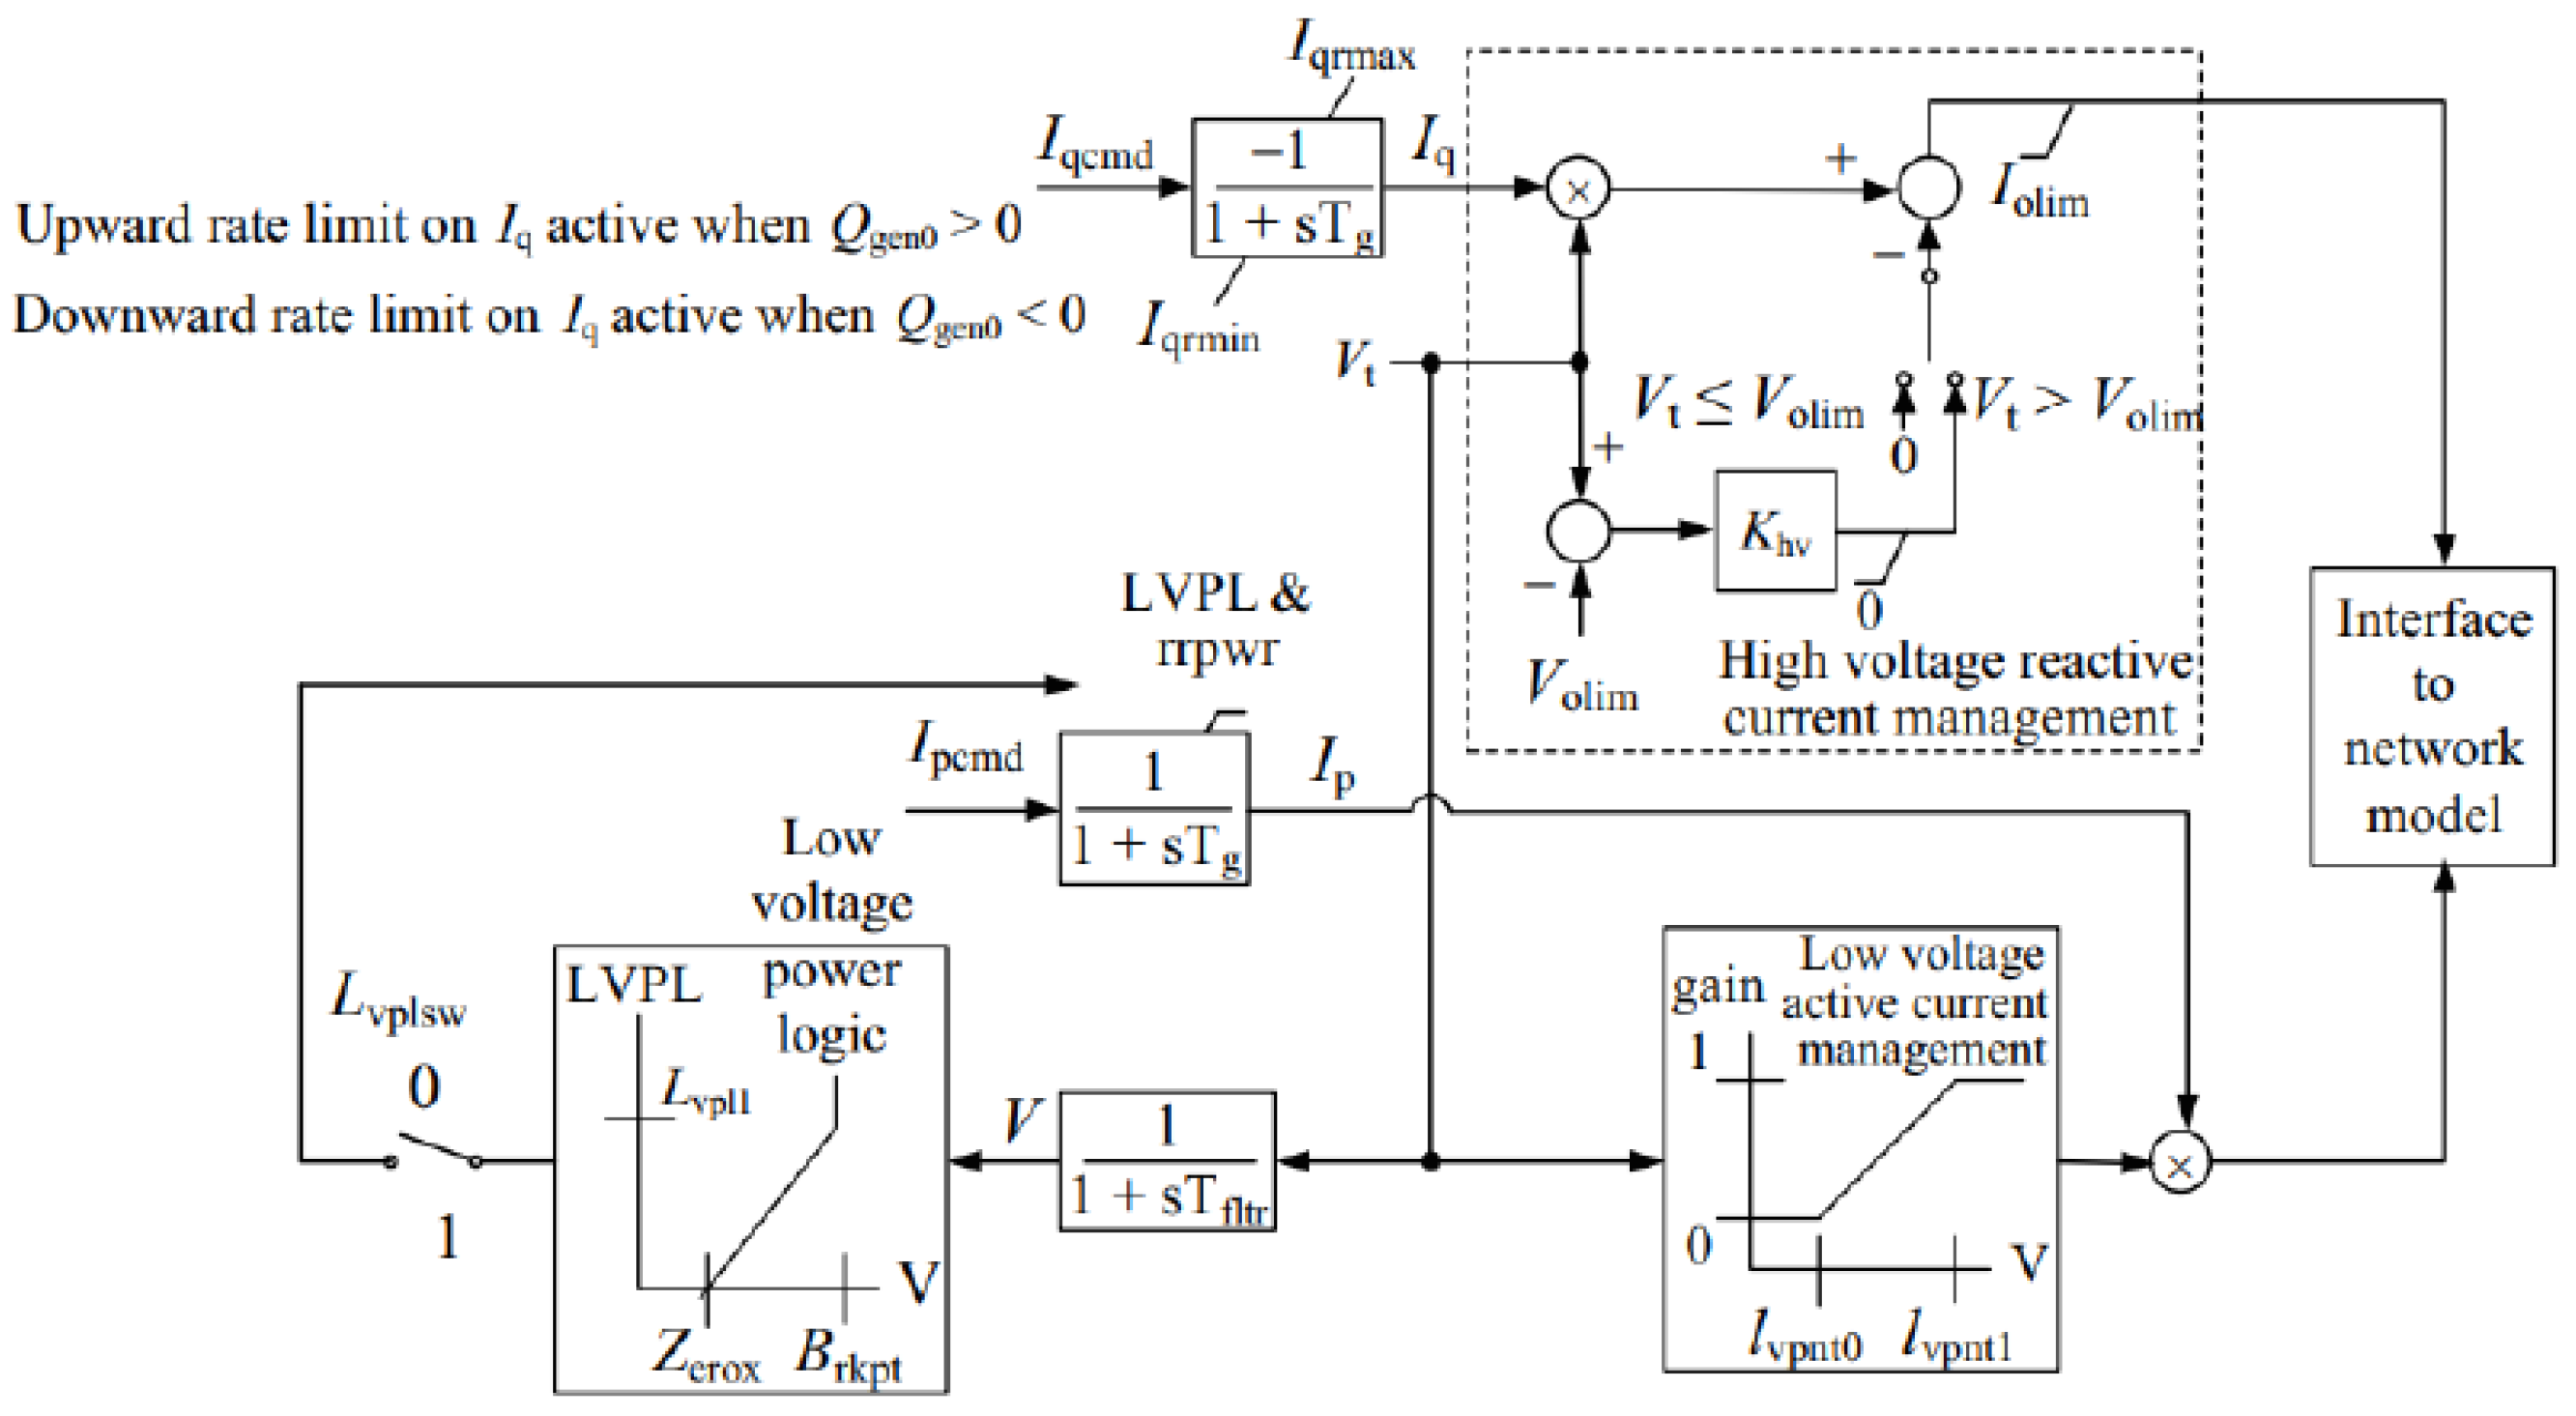
The REGC_A model is the standard representation of renewable energy generators/converters and is widely applied to Type-3 and Type-4 wind turbines as well as photovoltaic systems. Its key feature is that it allows users to specify the current response constant (Tg) and the voltage filter constant (Tfltr), while also incorporating a reactive current rate limiter to more accurately reflect inverter behavior during fault and recovery processes. The model includes both active and reactive power control loops, enabling it to limit surge current during voltage disturbances and provide corresponding grid signals. The structure of the model is shown in Figure 6

2.4. Summarize

In summary, the wind turbine and BESS models adopted in this study are both based on the generic model framework developed by WECC and ESIG [23,25]. This framework has been widely applied in North American grid stability analyses and reflects the requirements specified in reliability standards such as those of NERC, including low-voltage ride-through (LVRT) capability and active/reactive current control. Therefore, the models employed in this study not only ensure standardization and reproducibility but also maintain consistency with commonly used international practices in power system stability analysis. The parameter sources for each model are summarized in Table 1.

3. Energy Storage Control Strategy Optimization Combining OAT and IPSO

3.1. Key Parameter Identification Method

The energy storage model has many parameters, and optimizing all of them would be computationally expensive. Since parameters affect system response differently, it is essential to first identify the key ones. This reduces computational cost while preserving accuracy, thus improving optimization efficiency [26].
This study uses the OAT method for key parameter identification, where one parameter is varied at a time while others remain fixed, and its impact is assessed through frequency response. The method is simple and effective for preliminary screening but cannot capture parameter interactions. Figure 7 illustrates the OAT process, from parameter adjustment to result analysis, supporting key parameter identification.

3.2. Improved Particle Swarm Optimization Method

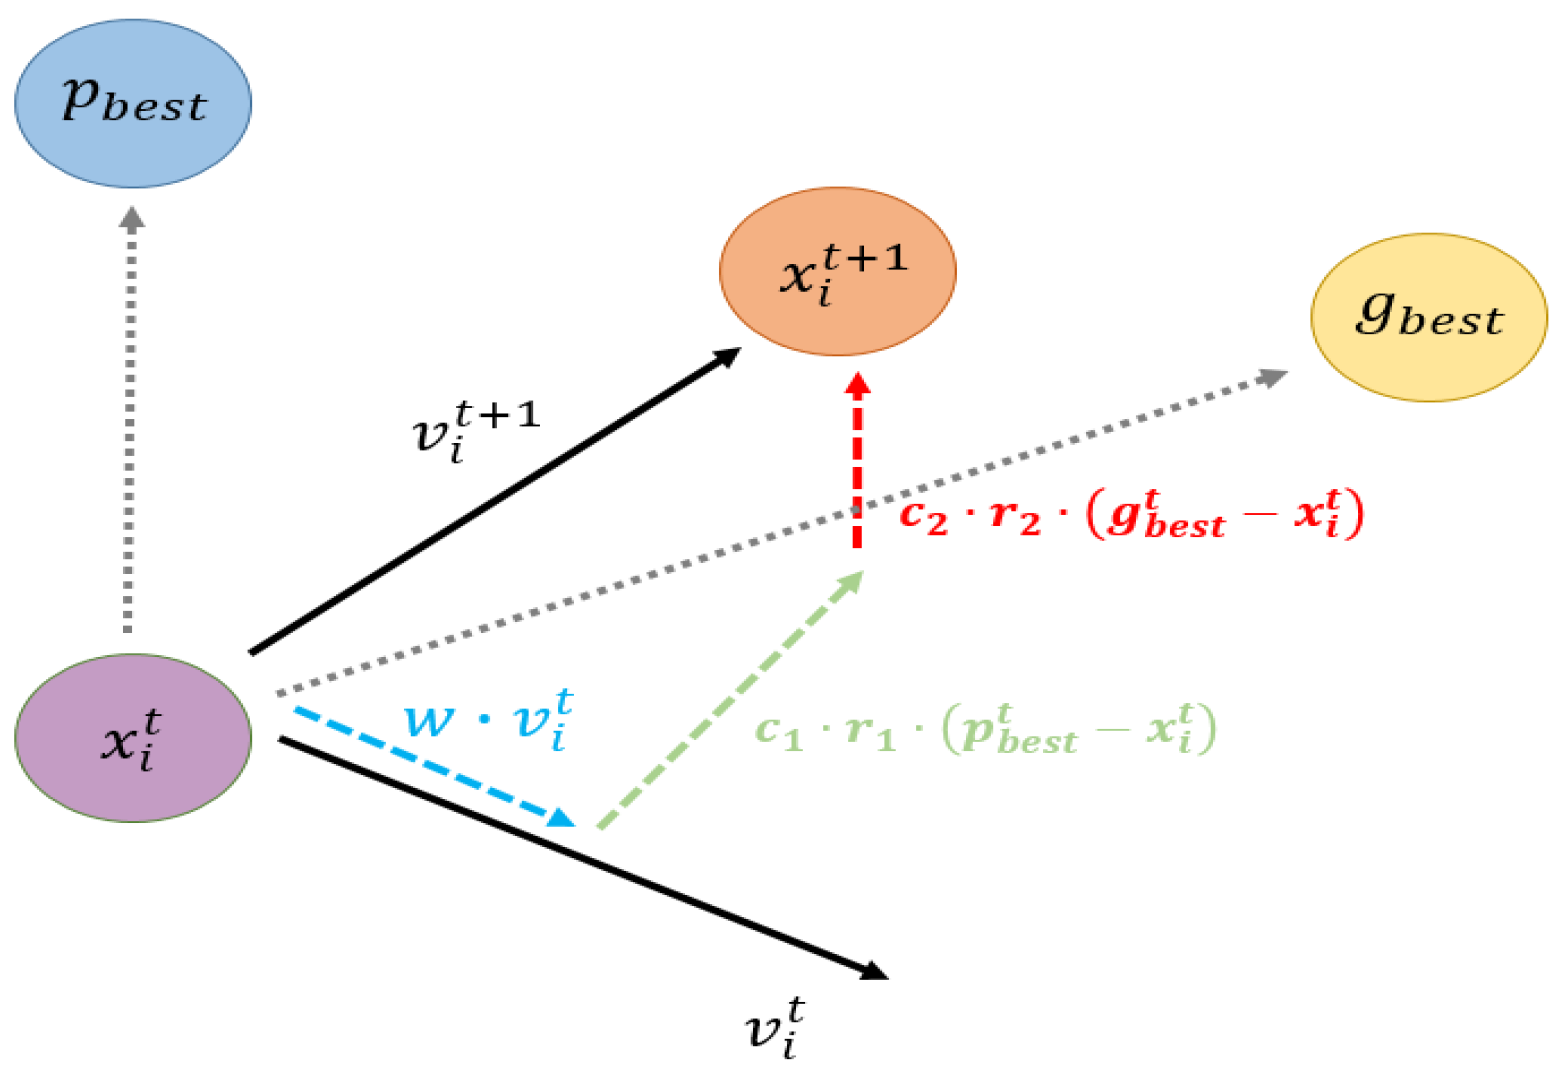
PSO is an intelligent algorithm inspired by the foraging behavior of bird flocks. Each particle represents a potential solution and iteratively approaches the optimal solution by exchanging information with other particles. Owing to its simplicity, small number of parameters, and strong search capability, PSO has been widely applied to optimization problems. As shown in Figure 8, particles update their positions under the influence of inertia, their personal best solution ( p b e s t t ), and the global best solution ( g b e s t t ), ultimately converging to the global optimum [27,28].
The velocity and position update rules in PSO are given in Equations (1) and (2). Equation (1) updates velocity using inertia, personal best ( p b e s t t ), and global best ( g b e s t t ), while Equation (2) updates position based on the new velocity. These equations together define particle movement in the search process [29]
Here, x i t denotes the position of the i -th particle at iteration t , and v i t represents its velocity. p b e s t t is the best position found so far by the i -th particle, while g b e s t t is the best position identified by the entire swarm. The inertia weight w is used to control the persistence of velocity, whereas c 1 and c 2 are learning factors that influence the attraction toward the personal best and global best solutions, respectively. r 1 and r 2 are random numbers uniformly distributed in the range [0, 1].
v i t + 1 = w · v i t + c 1 · r 1 · p b e s t t x i t + c 2 · r 2 · g b e s t t x i t
x i t + 1 = x i t + v i t + 1
However, conventional PSO, as a stochastic heuristic algorithm, often suffers from problems such as being easily trapped in local optima, premature convergence, and insufficient robustness [30,31]. Adjusting the inertia weight has been used to improve convergence characteristics: larger inertia weights help expand the global search space, while smaller inertia weights accelerate local convergence. Nevertheless, most traditional PSO studies still employ fixed inertia weights and static acceleration coefficients, which lack sufficient adaptability under varying levels of renewable energy penetration and fluctuating power deficits. As a result, they fail to adequately capture the complexity of nonlinear search processes and are prone to premature convergence.
To overcome these limitations, this study adopts an improved particle swarm optimization (IPSO) method. Unlike conventional PSO, which relies solely on swarm experience, IPSO dynamically adjusts inertia weights and acceleration coefficients to balance exploration and exploitation, while also incorporating a gradient descent mechanism that allows particles to exploit local gradient information to strengthen search capability. This design significantly enhances convergence efficiency, reduces the risk of local minima entrapment, and improves global search ability and robustness under different wind power scenarios. Experimental results further confirm that IPSO consistently outperforms conventional PSO across multiple tests, exhibiting superior convergence characteristics and reliability [32].
To enhance the global exploration ability of conventional PSO during the search process and to avoid premature convergence, this study improves the inertia weight and learning coefficients by designing w , c 1 , and c 2 to adaptively adjust with the number of iterations. The adaptive adjustment formulas for the inertia weight and learning factors are given in Equations (3)–(5) [33], where w m a x and w m i n denote the maximum and minimum values of the inertia weight, respectively, and c m a x and c m i n represent the maximum and minimum values of the learning factors c 1 and c 2 . Here, i is the current iteration number, and N is the total number of iterations.
w = w m a x ( w m a x w m i n ) × ( i N ) 2
c 1 = c m a x c m i n × N i N + c m i n
c 2 = c m i n c m a x × N i N + c m a x
In terms of boundary control, IPSO no longer simply restricts particles that exceed the search range to the boundary points, as this approach often leads to overly rapid convergence and a lack of diversity in the swarm. To address this issue, Reference [34] proposed the method shown in Equation (6), allowing particles that cross the boundary to return to the feasible solution space in a more random and flexible manner. Here, v i j n e w ( t + 1 ) denotes the updated velocity of the i -th particle in the j -th dimension when it crosses the boundary, v i j ( t + 1 ) is the original velocity in that dimension, D represents the total range of the search space in that dimension, and d is the distance between the particle’s current position and the nearest boundary.
v i j n e w ( t + 1 ) = d D · v i j ( t + 1 )
The flow chart of IPSO is shown in Figure 9.

3.3. Objective Function

In this study, the overall objective of the experiments is to adjust and optimize the control parameters of the energy storage system to improve the frequency response of the power system. To comprehensively evaluate system frequency performance, five assessment indices are designed, corresponding to Equations (7)–(13). These indices provide a more complete characterization of the system’s frequency behavior under different control parameter settings. The frequency performance indicators and their explanations are summarized in Table 2.
Equation (7) is used to calculate the minimum frequency after a disturbance, where f 1 , f 2 , f n represent the frequency data obtained from each simulation, and f m i n denotes the lowest frequency point recorded during the simulation process.
f m i n = m i n ( f 1 , f 2 , f n )
Equation (8) is used to calculate the steady-state frequency at the end of the simulation, in order to evaluate the system’s recovery capability after a disturbance. Here, f n represents the frequency data at the final second of the simulation, and f e n d denotes the frequency value at the end of the simulation.
f e n d = f n
Equation (10) calculates the standard deviation of frequency after 10 s, which reflects the stability of the system frequency. The required parameters are obtained from Equation (9). Here, t i denotes the time points of the frequency data, f i is the frequency value when t i > 10 s, m is the number of data samples satisfying this condition, μ represents the mean frequency for t i > 10 s, and f s t e a d y is the standard deviation of the frequency within the steady-state interval after 10 s.
μ = 1 m i = 1 m f i , f o r   t i > 10
f s t e a d y = 1 m i = 1 m f i u 2 , f o r   t i > 10
Equation (11) is used to calculate the frequency oscillation range after 10 s, serving as a measure of the amplitude of frequency fluctuations. Here, R a n g e s t e a d y represents the frequency range after 10 s.
R a n g e s t e a d y = max f i min f i , f o r   t i > 10
Equation (13) is used to calculate the number of oscillations, which serves to evaluate the system’s stability during the dynamic response process. Its calculation relies on Equations (9) and (12). Here, N c r o s s denotes the number of times the frequency crosses the mean value, while O s c i l l a t i o n s represents the number of oscillations occurring after 10 s.
N c r o s s = f i 1 μ × f i μ < 0
Oscillations = N c r o s s 2
The OAT method primarily observes the impact of a single parameter variation on system frequency. In addition to the five aforementioned formulas, Equation (14) is introduced to compare the frequency response with the baseline scenario, while Equation (15) normalizes the influence score to a range of 0–10. A higher score indicates a greater parameter impact, which is useful for identifying key parameters. Here, X represents the index value after parameter adjustment, X b a s e l i n e is the simulation index value under the baseline scenario, ϵ is a very small value added to avoid division by zero, Z s c o r e denotes the influence score, S i is the raw score of each parameter, S m a x is the maximum score among all parameters, and S i is the normalized score.
Z s c o r e   = | X X b a s e l i n e | s t d X , X b a s e l i n e + ϵ
S i = 10 S m a x × S i
The IPSO method explores optimal parameter combinations through population-based search and iterative updates to improve frequency response. To address dimensional differences, the indicators in Equations (7)–(13) are normalized using Equations (16)–(20). The weighted total score, calculated by Equation (21), serves as the objective function, where higher scores indicate better performance. Here, N o r m m i n ,     N o r m f steady ,     N o r m e n d ,     N o r m r a n g e ,     N o r m o s c represent the normalized values of minimum frequency, frequency standard deviation, terminal frequency, frequency range, and oscillation count, while w 1 w 5 are their weights, and S c o r e is the weighted sum of all indices.
In this study, the allocation of weights is determined based on system stability criteria and practical considerations. The minimum frequency is regarded as the top priority, as it directly determines whether the grid can maintain secure operation after a disturbance and avoid triggering under-frequency load shedding; therefore, w1 is assigned the highest weight. The next priority is the final recovered frequency, which serves as an important measure of system recovery capability, and thus w2 is assigned the second-highest weight. By contrast, frequency stability, oscillation count, and fluctuation range are considered supplementary indicators that reflect mid- to long-term steady-state and damping characteristics, and are therefore assigned relatively lower weights. The final weight combination was validated through multiple simulation tests to ensure that both short-term nadir support and long-term recovery and stability are adequately considered, thereby enhancing the rationality and reliability of the objective function design.
N o r m m i n = 1 1 + e 200 ( f m i n 59.957 )
N o r m f steady = 1 1 + 60 × f steady
N o r m e n d = e ( | f e n d 60 | 0.01 ) 2
N o r m r a n g e = 1 1 + 1000 × R a n g e s t e a d y
N o r m o s c = 1 1 + 0.6 × Oscillations
S c o r e = w 1 × N o r m m i n + w 2 × N o r m f steady + w 3 × N o r m e n d + w 4 × N o r m r a n g e + w 5 × N o r m o s c

4. Research Results

4.1. Overall Research Process

The experimental procedure of this study is illustrated in Figure 10. First, wind power output scenarios are defined to simulate different system conditions. Next, the OAT analysis is applied to identify key parameters affecting frequency, followed by IPSO to search for the optimal parameter combinations. Finally, the results are implemented in PSS®E for simulation verification to evaluate the frequency improvement effects under different scenarios.

4.2. OAT Parameter Sensitivity Analysis Results

In this study, the OAT method is used for sensitivity analysis by varying each parameter’s scaling factor and observing its effect on system frequency response. Five indicators—minimum frequency, final frequency, standard deviation, oscillation range, and oscillation count—are compared with baseline results to assess parameter influence. The parameters are then ranked, and curves are plotted to guide subsequent optimization.
In this study, the state of charge (SOC) of the energy storage system is assumed to be sufficient, such that its output is not constrained by capacity and can respond at the maximum possible rate. Consequently, no numerical upper or lower bounds or ramp-rate limits are imposed during parameter analysis. Furthermore, according to Taipower’s dReg0.25 technical specifications, the Ddn and Dup values in the REPC_A model are fixed and therefore excluded from the sensitivity analysis. Table 3 summarizes the controller time constants and gain parameters considered for parameter identification in this study [35].
In the OAT analysis, the initial settings of the WECC energy storage model are taken as the baseline. Each parameter scaling factor is individually adjusted within the range of 0.01 to 2.0 for simulation, and the resulting system frequency variations are observed to evaluate their influence. Figure 11 illustrates the distribution of parameter influence under different scaling factors, while Table 2 summarizes and ranks the impact of each parameter, identifying those most critical to frequency response.
As shown in Figure 11, the impact of each parameter on frequency varies across different scaling factors. The influence of Kpg and Kig increases significantly when the scaling factor exceeds 0.95 or falls below 1.05, whereas the variations in Tg and Tp are relatively minor. Both Tft and Tfltr exhibit consistently low influence across all scaling factors, indicating their limited effect on frequency. Overall, the OAT method effectively identifies key parameters with high sensitivity within specific scaling ranges
From a practical perspective, these results carry significant implications. The high sensitivity of gain parameters (e.g., Kpg, Kig) indicates that BESS must possess sufficient power regulation capability to support frequency stability during the initial stage of a disturbance, and this also allows estimation of the minimum capacity requirements in practical applications. The sensitivity of time constant parameters (e.g., Tp, Tg) underscores the importance of controller response speed for system recovery, implying that both real-time responsiveness and scalability must be considered during design and deployment. Parameters with lower sensitivity, while still requiring proper configuration in model development, have limited impact on actual frequency control and can be treated as secondary considerations. In other words, the experimental results in this chapter can help system operators and planners focus on the most influential parameters when planning BESS capacity and designing control strategies, thereby improving the efficiency and reliability of frequency regulation. Table 4 summarizes and ranks the influence of each parameter, identifying those most critical to frequency response.
Table 4 shows that, according to the OAT analysis, Kpg and Kig (the active power control gains in REPC_A) have the most significant impact on system frequency. This is because these parameters directly determine the response strength and regulation rate of BESS to frequency deviations, thereby substantially affecting the minimum frequency and recovery speed under fault conditions or power deficits. Following these, Tp and Tg (controller time constants) exhibit high sensitivity, reflecting their critical role in determining the speed of regulation dynamics; excessively large time constants can cause delayed responses and worsen frequency stability. In addition, Tpord and several control parameters in REEC_A show moderate influence, still affecting the regulation process under specific scenarios. By contrast, parameters such as Khv, Ki, and Kqv, which are mainly associated with voltage, reactive power, or secondary controls, exert only limited direct impact on frequency response and thus receive lower sensitivity scores in the OAT analysis. Overall, gain parameters are identified as the dominant influencing factors because they directly affect the magnitude of power regulation, while time constants play a secondary but critical role by governing the controller’s response speed.
Finally, based on the OAT analysis results, the key parameters with the most significant impact on system frequency are identified, as shown in Table 5. These parameters exhibit high sensitivity across different scaling factors. Therefore, they are selected in this study as the adjustment targets for the subsequent IPSO process.

4.3. IPSO Results

Before applying IPSO for storage parameter optimization, algorithm parameters and controller search ranges must be defined. The algorithm settings include learning factors, inertia weight, swarm size, and iteration count (see Section 3.2), while controller parameters are bounded to avoid insufficient response at low values or oscillations at high values. These settings, summarized in Table 6 and Table 7, ensure system stability and optimization efficiency.

4.3.1. Algorithm Comparison

To validate the advantages of IPSO, this study compares it with standard PSO and the genetic algorithm (GA) under the same objective function and parameter boundaries. The optimization results of the three algorithms are shown in Figure 12. GA, through operations such as selection, crossover, and mutation, demonstrates strong global search capability but suffers from slow convergence and high computational cost. PSO offers better computational efficiency but is prone to premature convergence, with unstable performance particularly under multi-scenario conditions. In contrast, IPSO dynamically adjusts inertia weights and velocity updates, effectively balancing global and local search, avoiding premature convergence, and achieving faster convergence speed and superior optimization quality.
As shown in Figure 12, without algorithmic control, the system frequency nadir reached 59.966 Hz. With the introduction of GA and PSO, the nadir improved to 59.961 Hz and 59.960 Hz, respectively, indicating that both methods mitigated the frequency drop to some extent. By comparison, IPSO further raised the nadir to 59.968 Hz, thereby reducing the frequency deviation more effectively. In addition, IPSO demonstrated faster convergence following the disturbance, smoother frequency trajectories, and significantly better oscillation damping and recovery time than GA and PSO, fully highlighting its robustness and optimization quality under multi-scenario conditions. Regarding computational time, GA, PSO, and IPSO required 6618.53, 6840.20, and 6920.92 (units can be specified, e.g., seconds or milliseconds), respectively. Although IPSO incurred a slight increase in computational cost, its superior stability and optimization performance provide greater practical value.

4.3.2. Simulation Scenario Settings

After parameter settings, three disturbance scenarios are designed: (i) tripping of one wind turbine, (ii) two turbines at half load, and (iii) three turbines at half load. IPSO is applied in each case to optimize storage control parameters, and dynamic simulations are compared with cases without storage and with non-optimized storage. This comparison evaluates IPSO’s effectiveness in improving frequency regulation, storage output, and system stability, with results presented in the following sections.

4.3.3. Case 1: One Switch Is Disconnected

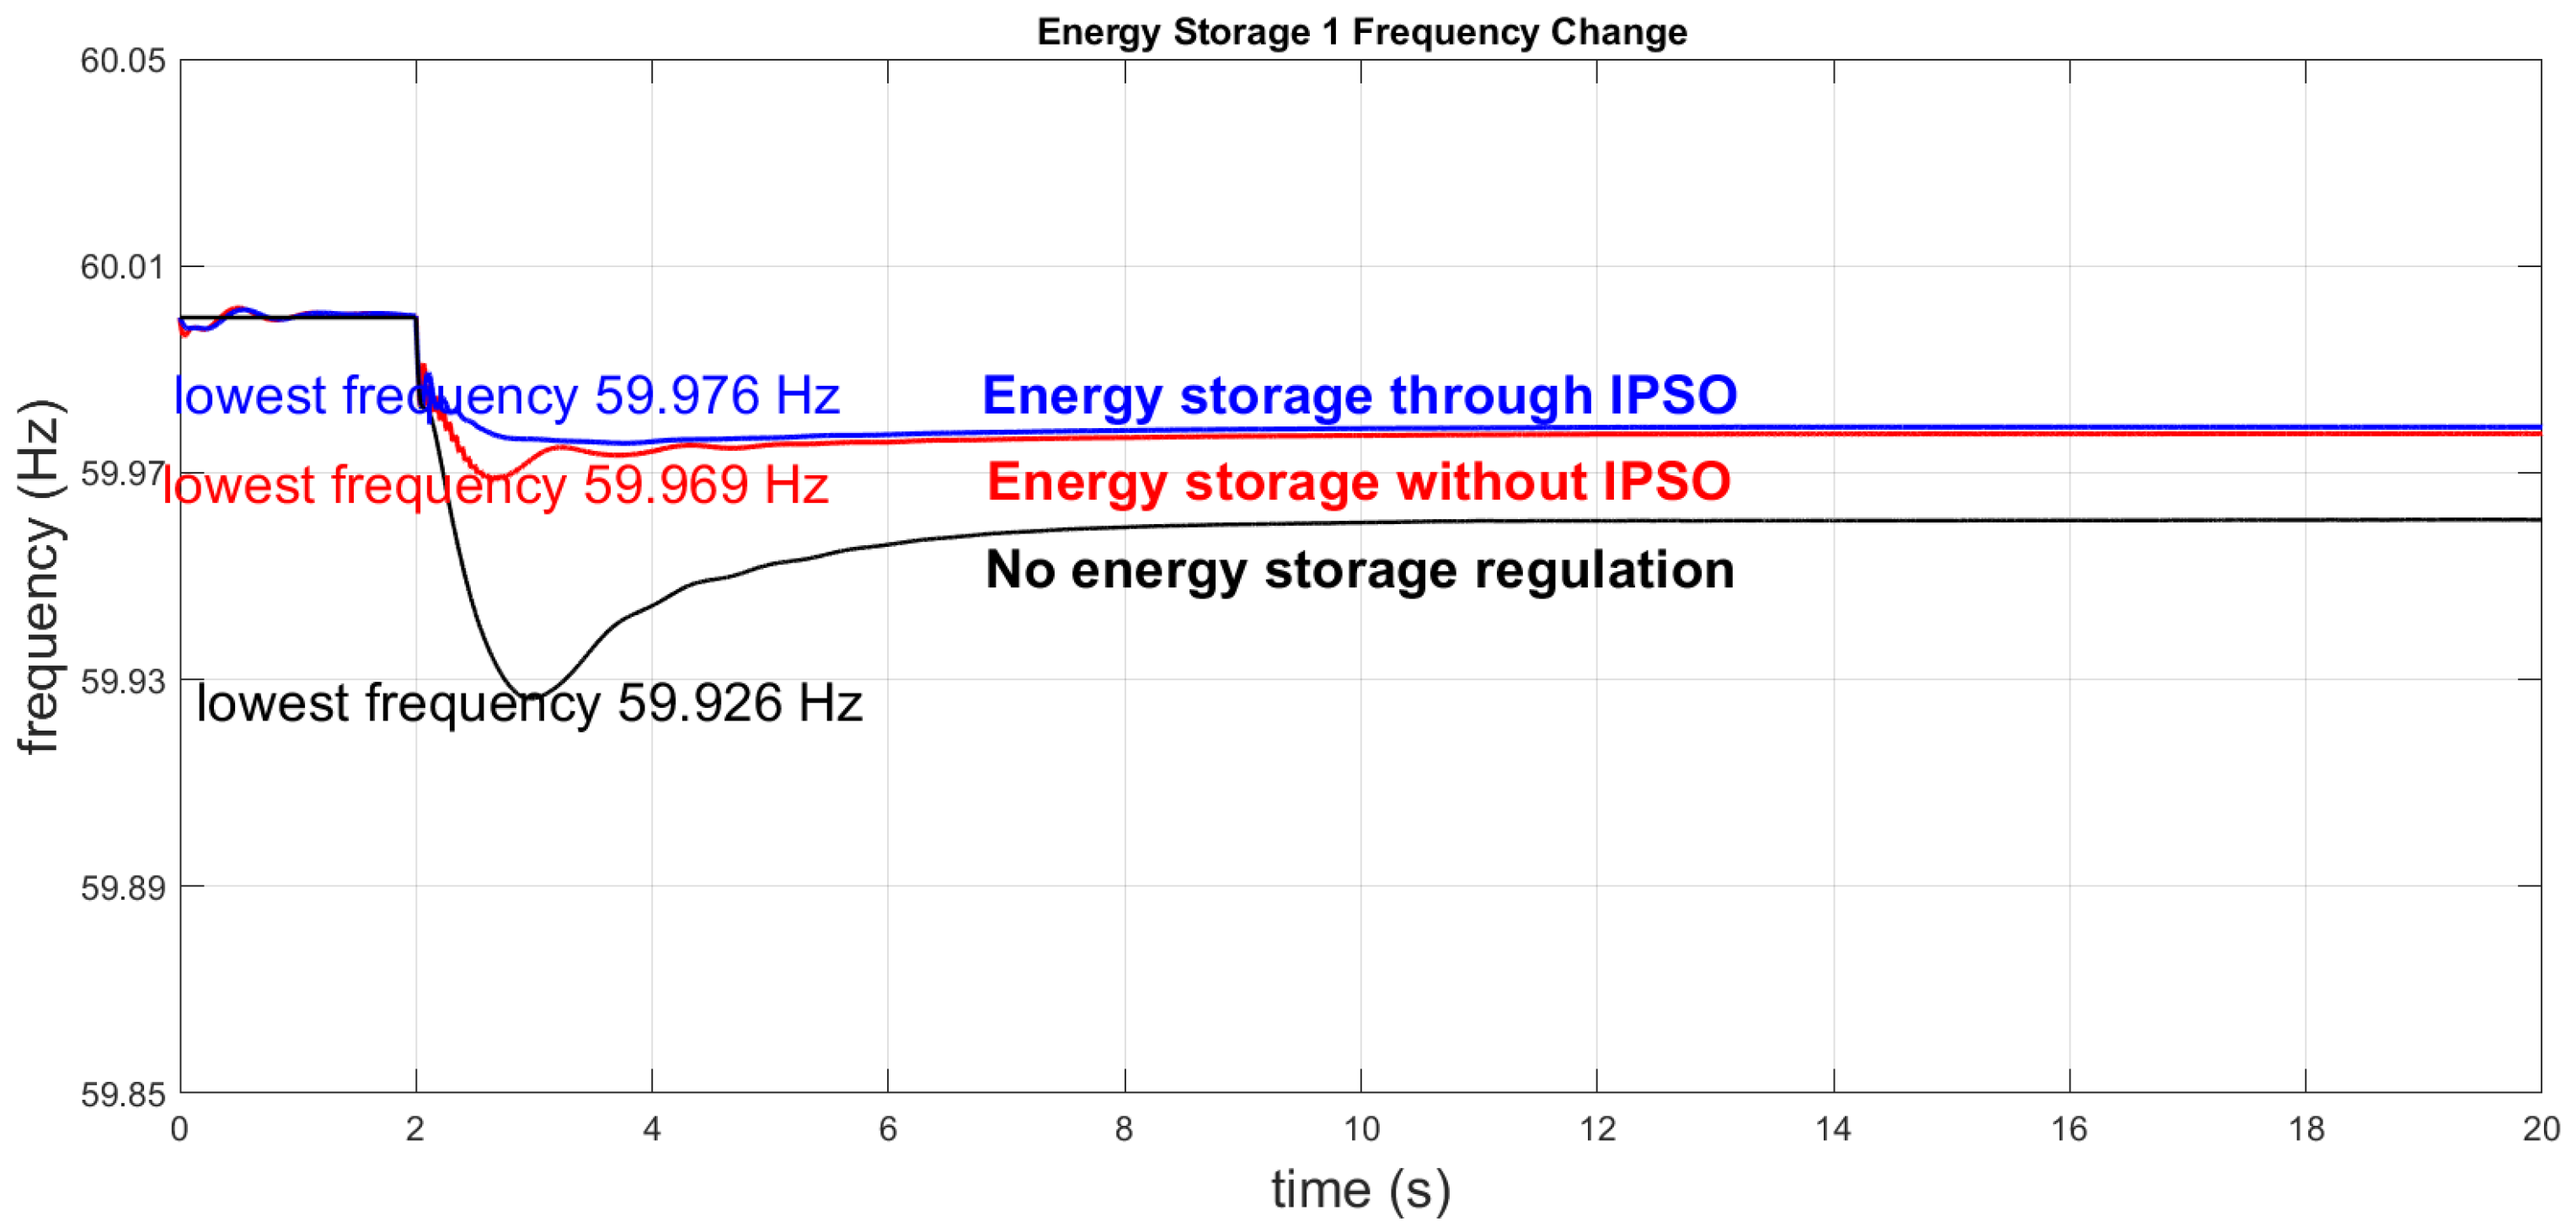
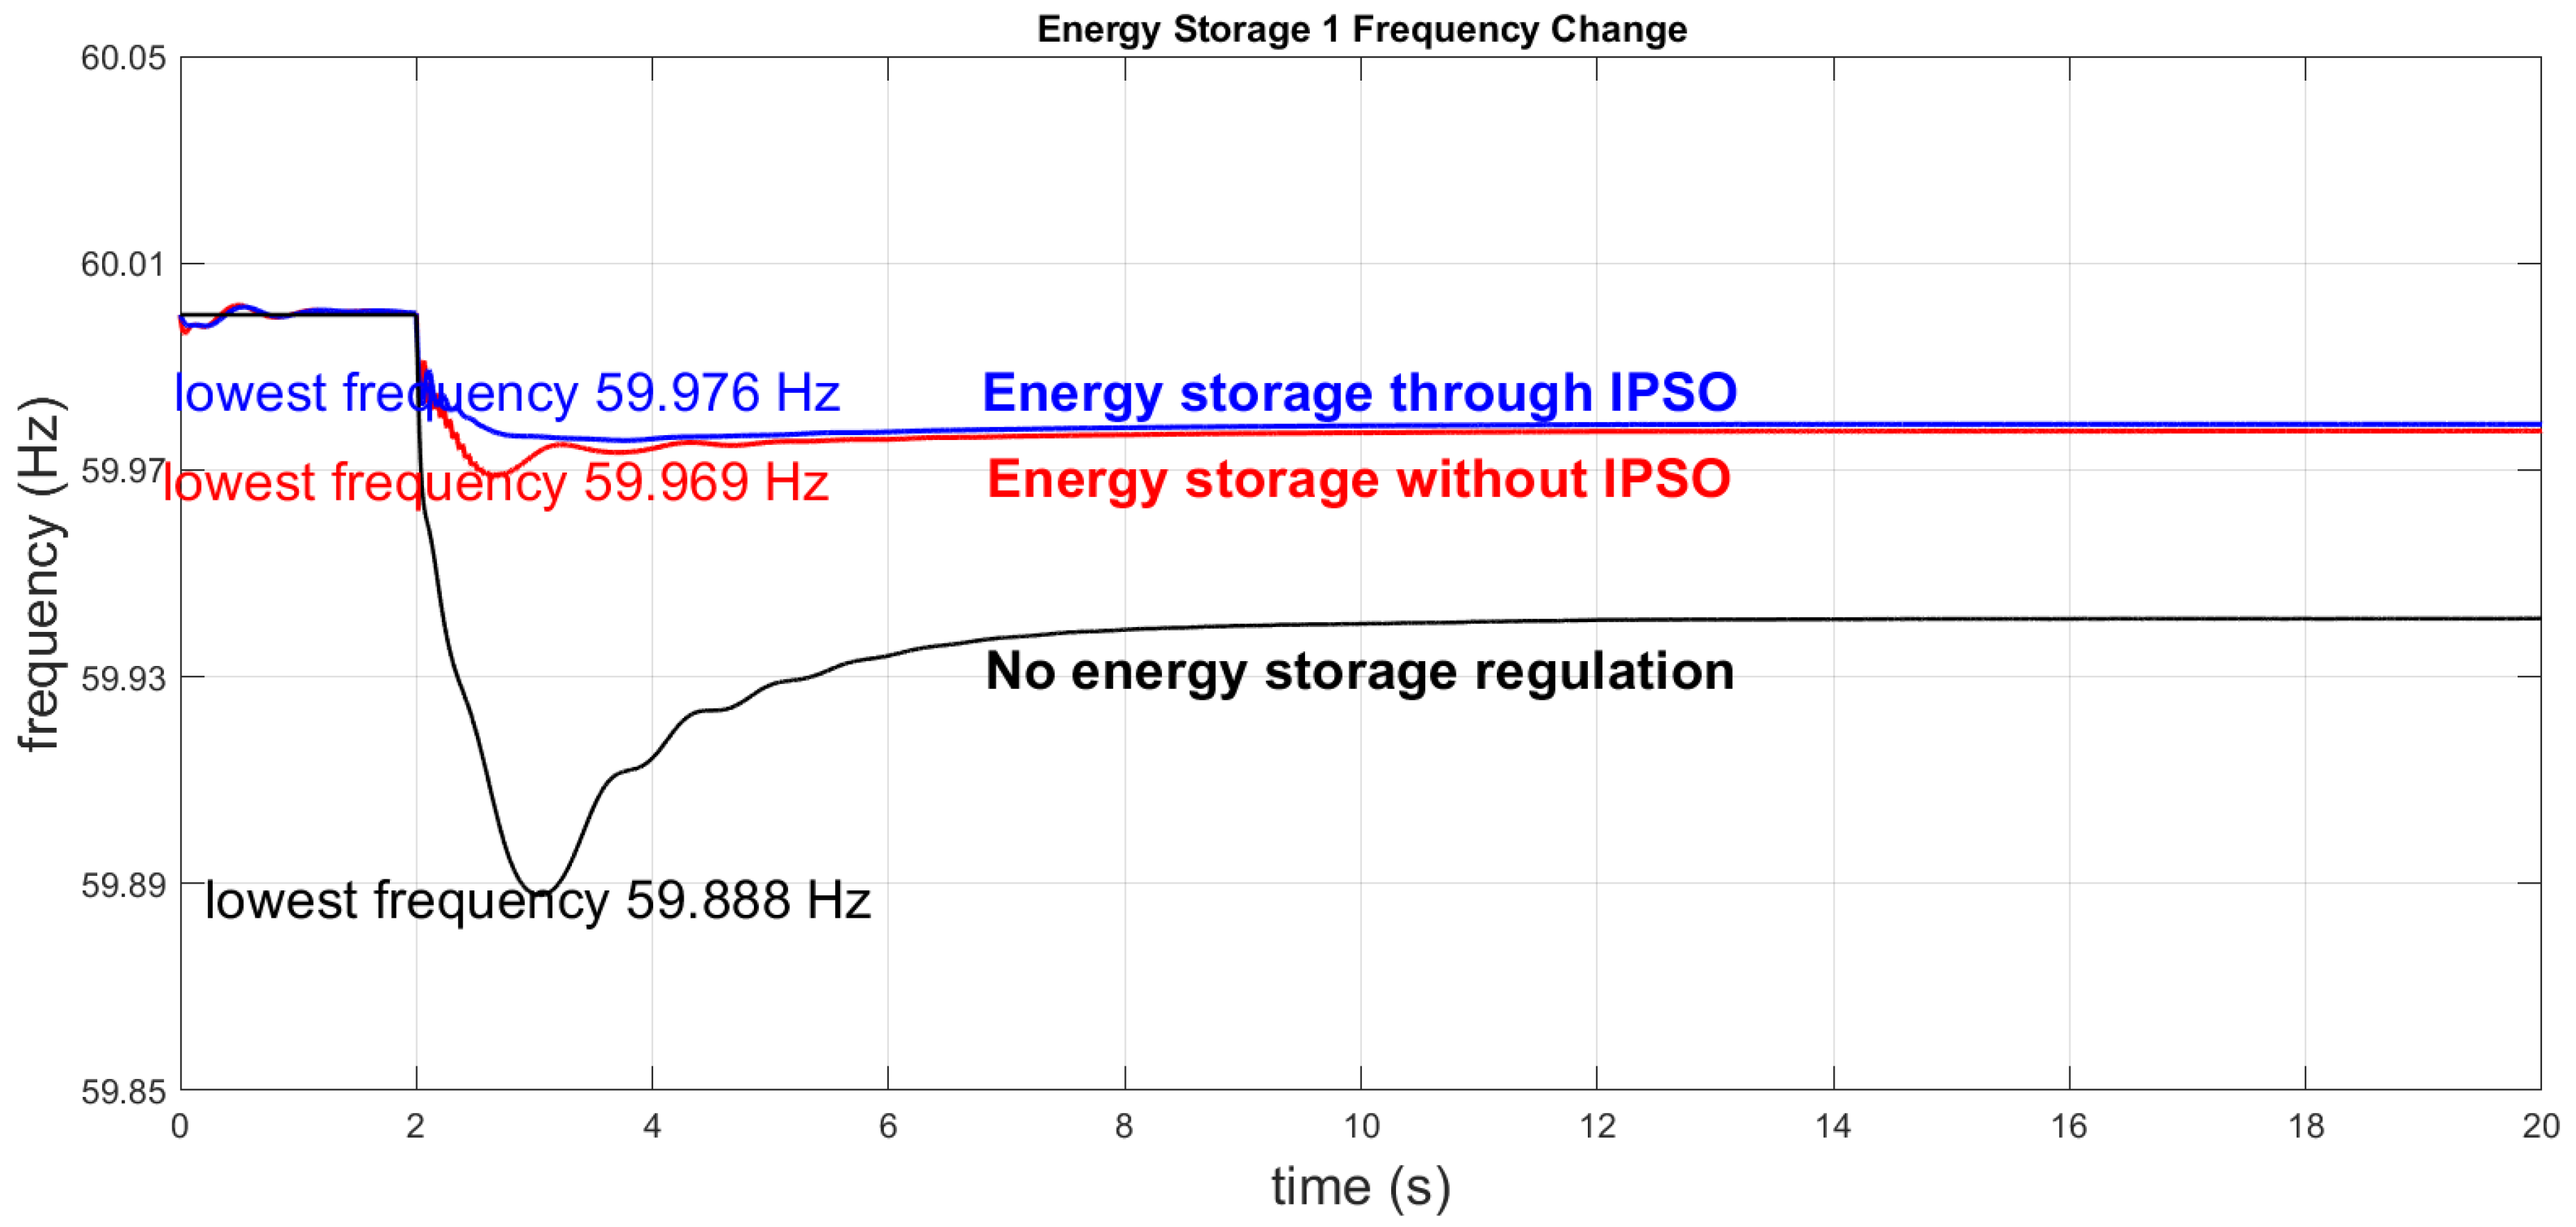
At 2 s, one wind turbine is tripped to simulate an outage, and frequency responses are compared across three cases: without storage, with non-optimized storage, and with IPSO-optimized storage. Table 8 lists the optimal parameters from IPSO, while Figure 13 and Figure 14 show the frequency responses of Storage Units 1 and 2 under these configurations.
Figure 13 and Figure 14 show that, in the first scenario, the minimum frequency drops to 59.929 Hz without energy storage, with a slow recovery. When non-optimized energy storage is added, the minimum frequency improves to 59.970 Hz, though oscillations remain. After IPSO, the minimum frequency further rises to 59.976 Hz, with a smoother curve and faster convergence, demonstrating that IPSO effectively enhances frequency regulation capability and overall system stability. Figure 15 further illustrates, under the same scenario, the complete simulation process, including the system frequency response, BESS output, and wind turbine output.
Figure 15 shows. At 2 s, the tripping of Wind Turbine 1 causes an active power loss of about 2 pu, which is promptly compensated by BESS1 and BESS2 with outputs of 0.983 pu and 1.213 pu, respectively. As a result, the system frequency drops only to 59.976 Hz, with the decline effectively limited, and gradually returns to stability under the continued support of the storage systems.

4.3.4. The Second Case: Two Wind Turbines Are Reduced to Half Load

Table 9 lists the IPSO-optimized energy storage parameters for the first disturbance scenario, while Figure 16 and Figure 17 present the frequency response curves of BESS1 and BESS2, respectively, under the three configurations.
It can be observed that, in the second disturbance scenario, the system performance is similar to that of the first case. With IPSO, the energy storage system effectively enhances frequency regulation capability, not only improving the minimum frequency but also suppressing oscillations, thereby maintaining greater system stability. Figure 18 further illustrates, under this scenario, the complete simulation process, including the system frequency response, BESS output, and wind turbine output.
Figure 18 shows. When the wind turbine output is reduced to half load at 2 s, the energy storage system quickly releases power to fill the gap, with the combined maximum output of the two BESS units reaching 2.312 pu, where BESS2 contributes slightly more than BESS1. Thanks to the immediate support from the storage systems, the system frequency drops only to 59.976 Hz, with the decline effectively suppressed, and gradually recovers to stability under continued output.

4.3.5. Case 3: Three Wind Turbines Reduced to Half Load

Table 10 presents the optimal energy storage control parameters obtained using the IPSO algorithm for the third disturbance scenario. Figure 19 shows the frequency response curves of the BESS1 system under the three configurations, while Figure 20 illustrates the frequency response curves of the BESS2 system under the same configurations.
Figure 19 and Figure 20 show that in the third disturbance scenario, the system response is similar to the previous cases. With IPSO, the storage system improves frequency regulation by raising the minimum frequency and reducing oscillations, thus enhancing system stability. Figure 21 further illustrates, under this scenario, the complete simulation process, including the system frequency response, BESS output, and wind turbine output.
Figure 21 shows, where all wind turbines drop to half load at 2 s, causing a 3 pu power loss. BESS1 and BESS2 provide maximum outputs of 1.498 pu and 1.445 pu, totaling 2.918 pu and nearly offsetting the deficit. Consequently, system frequency falls only to 59.967 Hz before recovering to stability
Table 11 summarizes the observed data of each backup, switch output and system frequency under three conditions. Table 12 summarizes all frequency performance indicators and the corresponding improvements across the three scenarios, with and without IPSO. The results clearly demonstrate the advantages of IPSO in enhancing the minimum frequency, recovery capability, and steady-state stability.
From Table 12, it can be observed that the percentage improvements in the minimum frequency ( f m i n i ) and final frequency ( f e n d ) are relatively limited. A possible reason is that in the baseline case (non-optimized BESS), a certain degree of power support is already provided, so the extent of frequency drop and recovery is not substantial, resulting in only marginal improvements after optimization. In contrast, the improvements in stability-related indicators are more significant. This indicates that IPSO is effective in reducing residual oscillations and shortening the convergence process after disturbances. At the same time, the more pronounced relative percentage improvements are also influenced by the smaller magnitudes of the baseline values for these indicators.

5. Conclusions

This study investigates optimal parameter settings for energy storage systems under different wind power scenarios using the Improved Particle Swarm Optimization (IPSO) algorithm. The WECC generic storage model and its control strategies are first analyzed to clarify parameter functions. Simulation cases are then designed to represent power fluctuations from faults or wind output variations. The one-at-a-time (OAT) method is applied for sensitivity analysis to identify key parameters, which are optimized by IPSO to enhance frequency support under varying wind conditions.
From Figure 13, Figure 14, Figure 15, Figure 16, Figure 17, Figure 18, Figure 19, Figure 20 and Figure 21, the simulation results show that without the integration of energy storage systems, system frequency exhibits a more pronounced decline following a disturbance. However, with the introduction of energy storage, the frequency drop is effectively suppressed. Furthermore, by optimizing the storage control parameters through IPSO, the frequency response is further improved—not only by reducing the minimum frequency dip but also by enhancing overall system stability. At the same time, the storage units are able to exploit greater output potential, thereby strengthening their support capability.
However, this study also has several limitations. First, the simulations were validated only under step-disturbance scenarios and did not account for more complex operating conditions such as stochastic wind fluctuations, load uncertainties, or multiple fault combinations. Second, the study assumes sufficient BESS capacity and SOC availability, without incorporating dynamic SOC constraints. Future results may differ if energy limitations and charge–discharge management are included. In addition, the models used in this study are based on a single-site configuration and do not consider the issue of coordinated control among geographically distributed BESS units.
Therefore, future research can be extended in three directions: (i) validating the robustness of the IPSO approach under more complex disturbances and stochastic input conditions; (ii) incorporating dynamic SOC management into the model to assess the impact of capacity constraints on optimization strategies; and (iii) exploring the application potential of distributed multi-BESSs across different geographic locations and evaluating the feasibility of IPSO in distributed cooperative control. Further studies will help comprehensively assess the suitability and scalability of IPSO for practical deployment in real power grids.

Author Contributions

Conceptualization, M.-H.W. and C.-C.H.; methodology, Y.-C.C.; software, Y.-C.C.; validation, Y.-C.C.; investigation, Y.-C.C.; resources, M.-H.W. and C.-C.H.; data curation, Y.-C.C.; writing—original draft preparation, Y.-C.C.; writing—review and editing, M.-H.W.; visualization, Y.-C.C.; supervision, M.-H.W. and C.-C.H. All authors have read and agreed to the published version of the manuscript.

Funding

This research was supported by the National Science Council under Grant No. NSTC 113-2221-E-167-013-MY3.

Data Availability Statement

The original contributions presented in this study are included in the article. Further inquiries can be directed to the corresponding author.

Conflicts of Interest

The authors declare no conflicts of interest.

References

  1. Gayathri, K.; Jena, M.K.; Moharana, A.K. Impact of Different Penetration Level of Type-IV Renewable Energy Resources on Power System Dynamics. In Proceedings of the 2021 9th IEEE International Conference on Power Systems (ICPS), Kharagpur, India, 16–18 December 2021; pp. 1–6. [Google Scholar] [CrossRef]
  2. Olivares, D.E.; Mehrizi-Sani, A.; Etemadi, A.H.; Cañizares, C.A.; Iravani, R.; Kazerani, M.; Hajimiragha, A.H.; Gomis-Bellmunt, O.; Saeedifard, M.; Palma-Behnke, R.; et al. Trends in Microgrid Control. IEEE Trans. Smart Grid 2014, 5, 1905–1919. [Google Scholar] [CrossRef]
  3. Alqahtani, S.; Shaher, A.; Garada, A.; Cipcigan, L. Frequency Stability in Renewable-Rich Modern Power Systems, Saudi Grid Case Study. In Proceedings of the 2022 57th International Universities Power Engineering Conference (UPEC), Istanbul, Turkey, 30 August 2022; pp. 1–6. [Google Scholar] [CrossRef]
  4. Zhang, W.; Yang, L.; Qi, Y.; Zhao, J.; Zhang, M.; Shi, T. Parameter optimization method of energy storage controller based on power system transient stability. In Proceedings of the 2024 3rd International Conference on Smart Grids and Energy Systems (SGES), Zhengzhou, China, 25–27 October 2024; pp. 204–210. [Google Scholar] [CrossRef]
  5. Wang, R. Parameter Identification of Photovoltaic Cell Model Based on Enhanced Particle Swarm Optimization. Sustainability 2021, 13, 840. [Google Scholar] [CrossRef]
  6. Balamurali, A.; Mollaeian, A.; Sangdehi, S.M.; Kar, N.C. Parameter identification of permanent magnet synchronous machine based on metaheuristic optimization. In Proceedings of the 2015 IEEE International Electric Machines & Drives Conference (IEMDC), Coeur d’Alene, ID, USA, 10–13 May 2015; pp. 1729–1734. [Google Scholar] [CrossRef]
  7. Wan, Y.; Xing, M.; Wang, H. Parameter Identification of PSS/E Wind Turbine Generator Model Using Improved Particles Swarm Optimization Algorithm. In Proceedings of the 2023 6th International Conference on Energy, Electrical and Power Engineering (CEEPE), Guangzhou, China, 12–14 May 2023; pp. 350–355. [Google Scholar] [CrossRef]
  8. Singh, S.V.; Revathi, V.; Babu, B.S.; Bhavana, M.; Singh, N.; Nagamani, G. Enhancing Microgrid Stability: Optimal BESS Sizing via Modified PSO for Frequency Control and Cost Efficiency. In Proceedings of the 2024 7th International Conference on Contemporary Computing and Informatics (IC3I), Greater Noida, India, 18–20 September 2024; pp. 627–632. [Google Scholar] [CrossRef]
  9. Ayaz, M.; Dur-e-Zehra; Rizv, S.M.H.; Akbar, M. Optimal Load Frequency Control Using Particle Swarm Optimization for Power System Stability. In Proceedings of the 2024 International Conference on Engineering & Computing Technologies (ICECT), Islamabad, Pakistan, 23 May 2024; pp. 1–6. [Google Scholar] [CrossRef]
  10. Huang, H.-C. Intelligent motion controller design for four-wheeled omnidirectional mobile robots using hybrid GA-PSO algorithm. In Proceedings of the 2011 IEEE International Conference on Systems, Man, and Cybernetics, Anchorage, AK, USA, 9–12 October 2011; pp. 2267–2272. [Google Scholar] [CrossRef]
  11. Ahmad, S.R.C.; Sendrasaran, K.; Naidu, K.; Awalin, L.J. Hybrid PSO-FA Optimization for Photovoltaic and Biomass Systems with Battery Energy Storage System (BESS) in Water Treatment Plant. In Proceedings of the 2022 IEEE International Conference on Power and Energy (PECon), Langkawi, Kedah, Malaysia, 5–6 December 2022; pp. 431–436. [Google Scholar] [CrossRef]
  12. Tjandra, R.; Wen, S.; Zhou, D.; Tang, Y. Optimal Sizing of BESS for Hybrid Electric Ship Using Multi-Objective Particle Swarm Optimization. In Proceedings of the 2019 10th International Conference on Power Electronics and ECCE Asia (ICPE 2019—ECCE Asia), Busan, Republic of Korea, 27–30 May 2019; pp. 1460–1466. [Google Scholar] [CrossRef]
  13. Irshad, K.; Khan, A.I.; Zayed, M.E.; Algarni, S.; Alqahtani, T. Performance analysis of air conditioning system integrated with thermal energy storage using enhanced machine learning modelling coupled with fire hawk optimizer. J. Build. Eng. 2024, 98, 111308. [Google Scholar] [CrossRef]
  14. Guddanti, B.; Roychowdhury, R.; Illindala, M.S. Evaluation of Modified Global Sensitivity Analysis Techniques for Power System Dynamic Studies. In Proceedings of the 2022 IEEE Industry Applications Society Annual Meeting (IAS), Detroit, MI, USA, 9–14 October 2022; pp. 1–6. [Google Scholar] [CrossRef]
  15. Zhang, P.; Zhao, F.; Guo, Y.; Zhao, H.; Zhao, Y.; Dong, L. Sensitivity analysis of the row model’s input parameters. In Proceedings of the 2014 The Third International Conference on Agro-Geoinformatics, Beijing, China, 11–14 August 2014; pp. 1–5. [Google Scholar] [CrossRef]
  16. Saltelli, A.; Annoni, P. How to avoid a perfunctory sensitivity analysis. Environ. Model. Softw. 2010, 25, 1508–1517. [Google Scholar] [CrossRef]
  17. Abera, B.; Wik, T.; Bekele, G.; Mamo, M. Parametric Sensitivity Analysis of the Modified AMOCO Model for an Anaerobic Digester. In Proceedings of the 2024 IEEE PES/IAS PowerAfrica, Johannesburg, South Africa, 7–11 October 2024; pp. 1–5. [Google Scholar] [CrossRef]
  18. Zhao, Y.; Zhang, W.; Wang, W.; Pan, Z. Grid Forming Control with Inertial and Virtual Admittance Characteristics for Grid-tied Converters. In Proceedings of the 2020 39th Chinese Control Conference (CCC), Shenyang, China, 27–29 July 2020; pp. 6164–6189. [Google Scholar] [CrossRef]
  19. Li, X.; Li, D.; Liu, Y.; Li, H. Study on Power Low Frequency Oscillation Caused by Primary Frequency Modulation. In Proceedings of the 2020 IEEE 9th Joint International Information Technology and Artificial Intelligence Conference (ITAIC), Chongqing, China, 11–13 December 2020; pp. 2271–2276. [Google Scholar] [CrossRef]
  20. Tian, Y.; Chen, Y.; Wei, W.; Xia, Y. A Review on Control Strategies of Grid-connected Energy Storage Systems for Frequency Regulation. In Proceedings of the 2023 5th International Academic Exchange Conference on Science and Technology Innovation (IAECST), Guangzhou, China, 8–10 December 2023; pp. 1319–1325. [Google Scholar] [CrossRef]
  21. Ren, Y.; Meng, Q.; Xu, C. Research on Frequency Modulation Control Strategy of Power System Based on Optimized Design of Energy Storage SOC. In Proceedings of the 2024 IEEE 7th International Conference on Information Systems and Computer Aided Education (ICISCAE), Dalian, China, 27–29 September 2024; pp. 682–686. [Google Scholar] [CrossRef]
  22. New England IEEE 39-Bus System. Available online: https://icseg.iti.illinois.edu/ieee-39-bus-system-2/ (accessed on 19 August 2025).
  23. WT3-Gerneric-Wind-Model. Available online: https://www.esig.energy/wiki-main-page/wt3-generic-wind-model/#Generator.2FConverter_Model_.28WT3G.29 (accessed on 16 August 2025).
  24. Lee, C.-C.; Hsin, Y.-M.; Dai, S.-C.; Kuo, C.-C. Optimal Modeling for Dynamic Response of Energy Storage Systems. Appl. Sci. 2023, 13, 4943. [Google Scholar] [CrossRef]
  25. WECC REMWG. Modeling Renewable Energy/Battery Energy Storage System Hybrid Power Plants; Western Electricity Coordinating Council: Salt Lake City, UT, USA, 2020. [Google Scholar]
  26. Zhu, X.; Liu, R.; Wang, S. Implementation of Parameter Estimation in Mechanistic Models by Dynamic Optimization. In Proceedings of the 2006 6th World Congress on Intelligent Control and Automation, Dalian, China, 21–23 June 2006; pp. 7683–7687. [Google Scholar] [CrossRef]
  27. Li, X. Application of Particle Swarm Optimization Algorithm in Computer Neural Network. In Proceedings of the 2017 International Conference on Computer Systems, Electronics and Control (ICCSEC), Dalian, China, 25–27 December 2017; pp. 446–449. [Google Scholar] [CrossRef]
  28. Robinson, J.; Sinton, S.; Rahmat-Samii, Y. Particle swarm, genetic algorithm, and their hybrids: Optimization of a profiled corrugated horn antenna. In Proceedings of the IEEE Antennas and Propagation Society International Symposium (IEEE Cat. No.02CH37313), San Antonio, TX, USA, 16–21 June 2002; Volume 1, pp. 314–317. [Google Scholar] [CrossRef]
  29. Zhang, X.; Zou, D.; Shen, X. A Novel Simple Particle Swarm Optimization Algorithm for Global Optimization. Mathematics 2018, 6, 287. [Google Scholar] [CrossRef]
  30. Shi, Y.; Eberhart, R. A modified particle swarm optimizer. In Proceedings of the 1998 IEEE International Conference on Evolutionary Computation Proceedings. IEEE World Congress on Computational Intelligence (Cat. No.98TH8360), Anchorage, AK, USA, 4–9 May 1998; pp. 69–73. [Google Scholar] [CrossRef]
  31. Khaleghi, S.; Moghaddam, R.K.; Mousavi, A.E.; Ghahremani, E. Solution to economic dispatch problem with valve-point loading effect using IPSO algorithm. In Proceedings of the 2014 International Congress on Technology, Communication and Knowledge (ICTCK), Mashhad, Iran, 26–27 November 2014; pp. 1–4. [Google Scholar] [CrossRef]
  32. Uriarte, A.; Melin, P.; Valdez, F. An improved Particle Swarm Optimization algorithm applied to Benchmark Functions. In Proceedings of the 2016 IEEE 8th International Conference on Intelligent Systems (IS), Sofia, Bulgaria, 4–6 September 2016; pp. 128–132. [Google Scholar] [CrossRef]
  33. Zhou, Y.; Zhao, L.; Lee, W.-J. Robustness Analysis of Dynamic Equivalent Model of DFIG Wind Farm for Stability Study. IEEE Trans. Ind. Appl. 2018, 54, 5682–5690. [Google Scholar] [CrossRef]
  34. Li, W.T.; Shi, X.W.; Hei, Y.Q.; Liu, S.F.; Zhu, J. A Hybrid Optimization Algorithm and Its Application for Conformal Array Pattern Synthesis. IEEE Trans. Antennas Propag. 2010, 58, 3401–3406. [Google Scholar] [CrossRef]
  35. Siemens Industry, Inc.; Siemens Power Technologies International. PSS®E 33.4 Model Library/Program Operation Manual; Siemens Industry, Inc.: Schenectady, NY, USA, 2013. [Google Scholar]
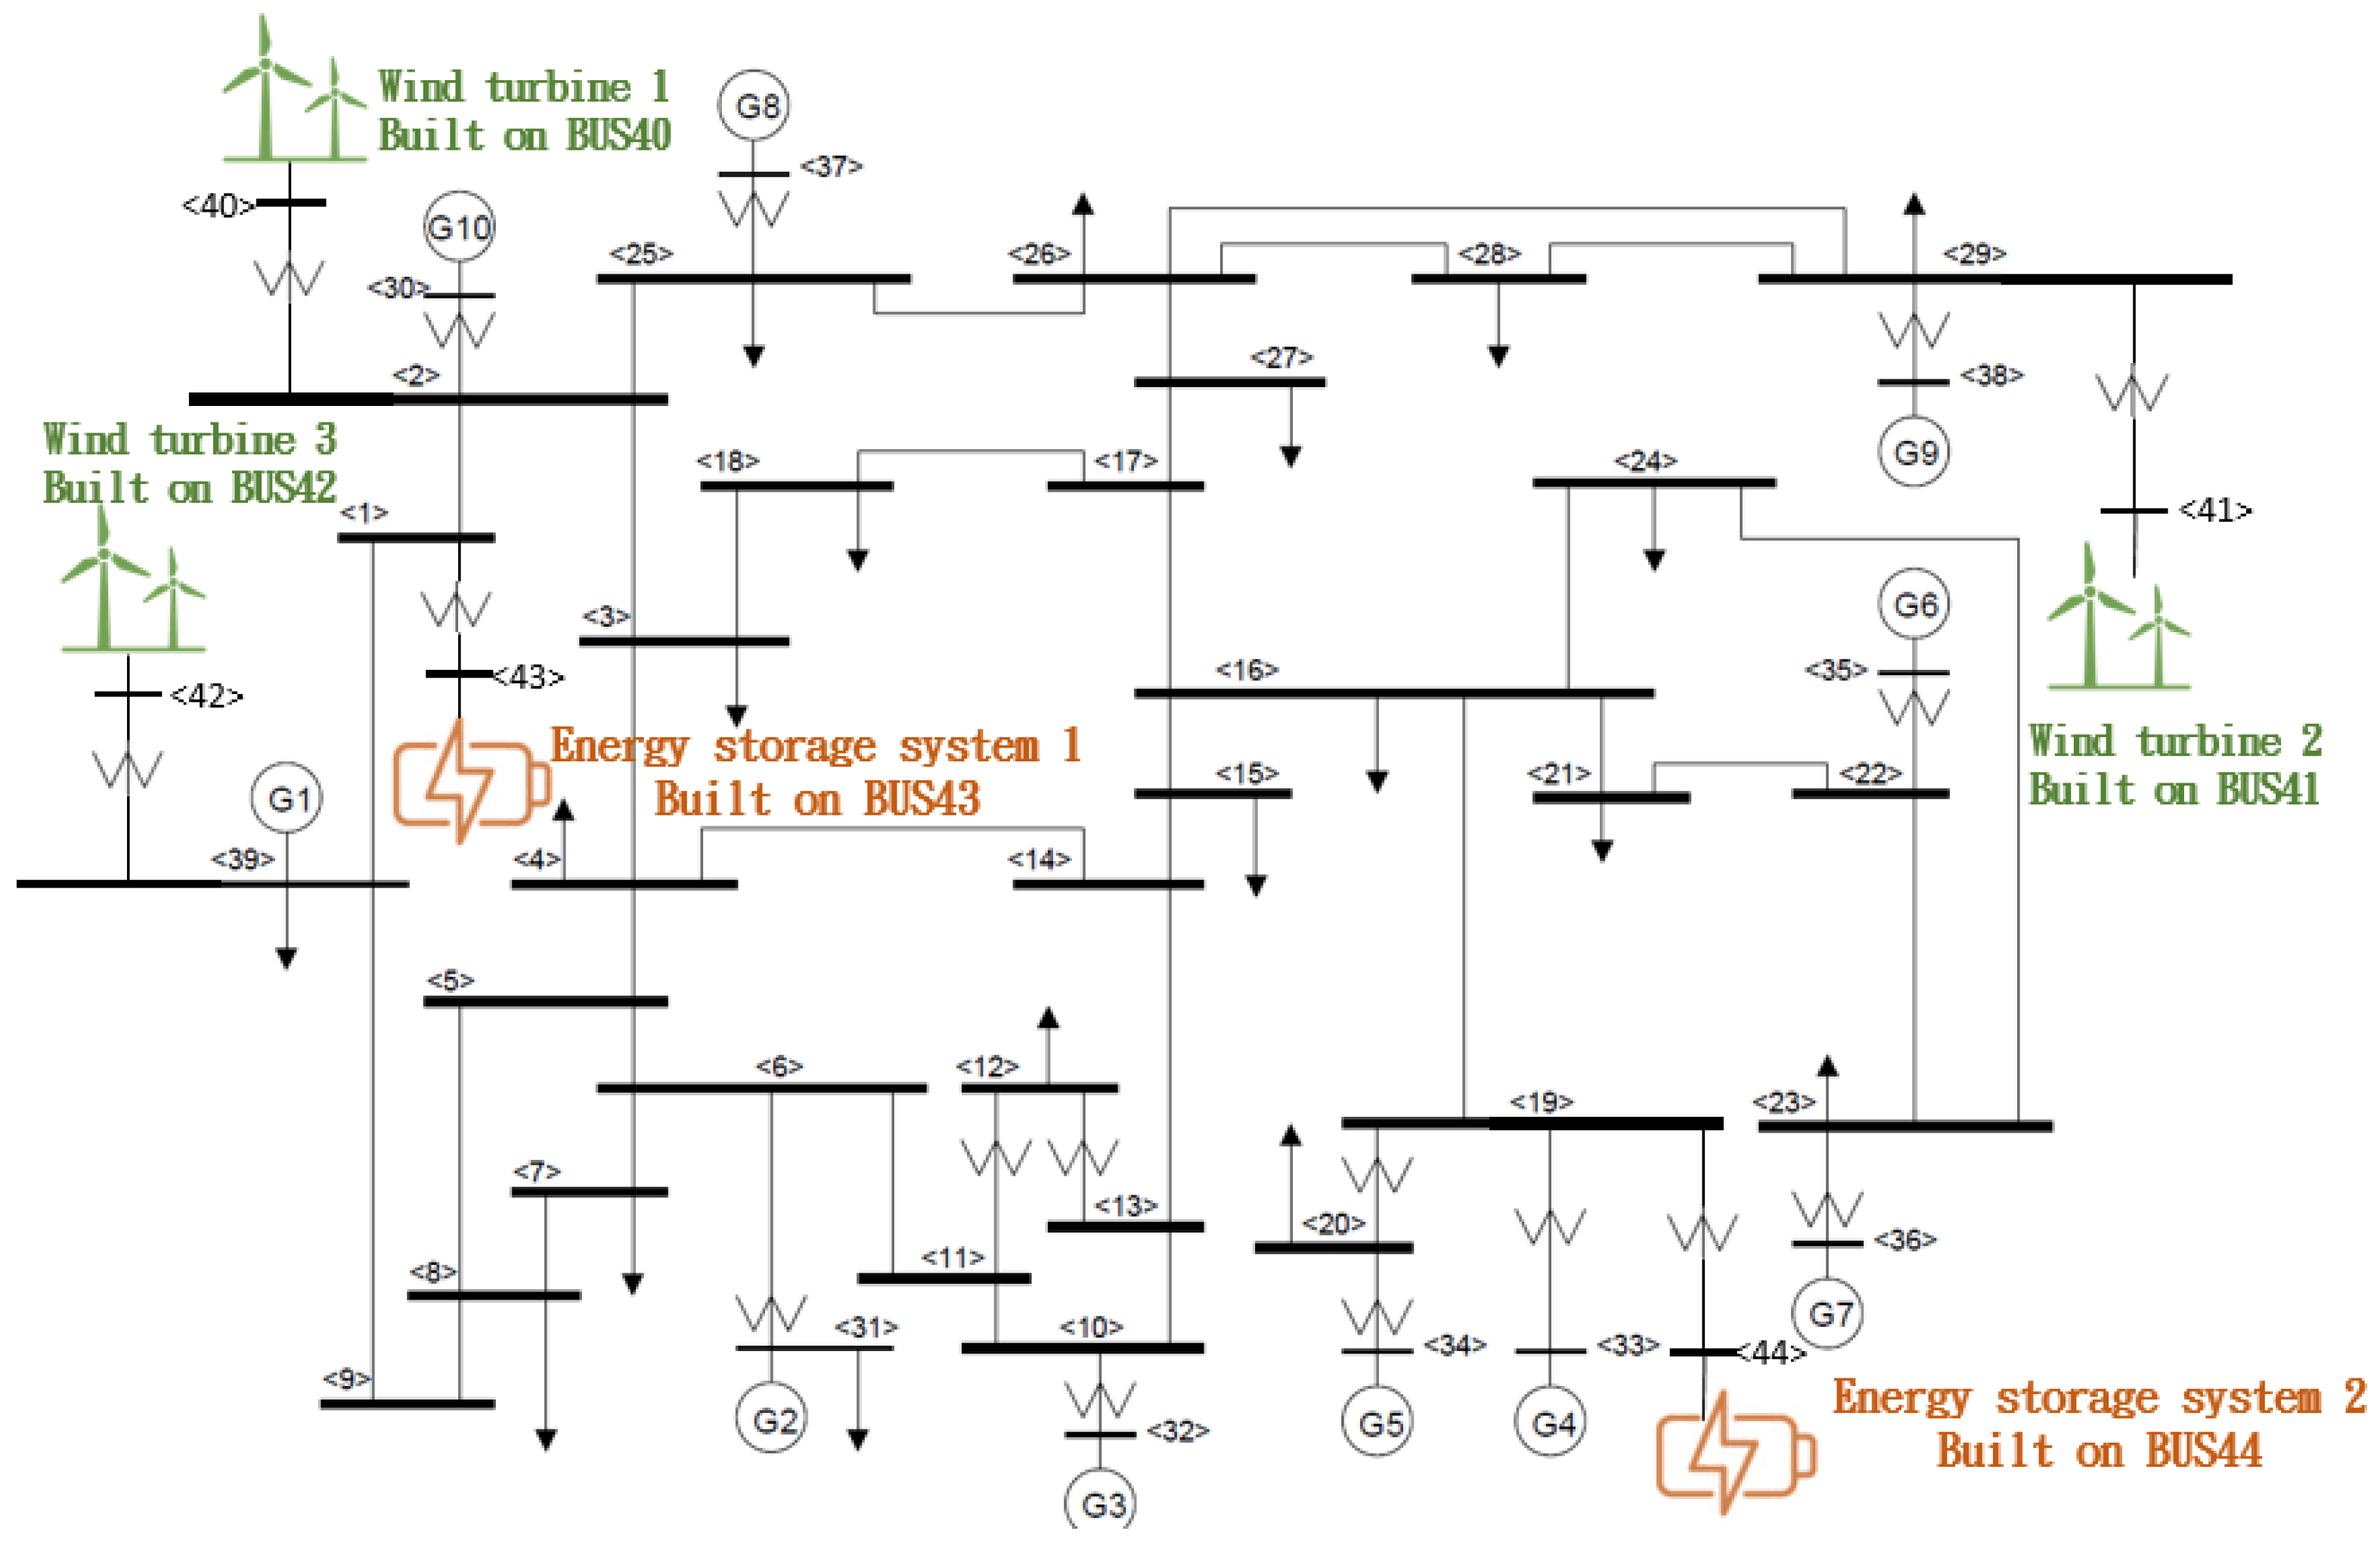
Figure 1. IEEE 39-Bus combined redundancy and backup system structure diagram.
Energies 18 05057 g001
Figure 2. WECC general turbine stability relationship model diagram.
Energies 18 05057 g002
Figure 3. WECC universal energy storage model relationship diagram.
Energies 18 05057 g003
Figure 4. REPC_A model control block diagram.
Energies 18 05057 g004
Figure 5. REEC_C model control block diagram.
Energies 18 05057 g005
Figure 6. REGC_A model control block diagram.
Energies 18 05057 g006
Figure 7. OAT flow chart.
Energies 18 05057 g007
Figure 8. PSO process.
Energies 18 05057 g008
Figure 9. IPSO flow chart.
Energies 18 05057 g009
Figure 10. Overall experimental flow chart.
Energies 18 05057 g010
Figure 11. The distribution of the influence of parameters on frequency in different magnification ranges.
Energies 18 05057 g011
Figure 12. Optimization results of three algorithms.
Energies 18 05057 g012
Figure 13. Case 1: System frequency change curves under three configurations of energy storage 1.
Energies 18 05057 g013
Figure 14. Case 1: System frequency change curves under three configurations of energy storage 2.
Energies 18 05057 g014
Figure 15. Case 1 complete simulation process diagram.
Energies 18 05057 g015
Figure 16. Case 2: System frequency change curves under three configurations of energy storage 1.
Energies 18 05057 g016
Figure 17. Case 2: System frequency change curves under three configurations of energy storage 2.
Energies 18 05057 g017
Figure 18. Case 2 complete simulation process diagram.
Energies 18 05057 g018
Figure 19. Case 3: System frequency change curves under three configurations of energy storage 1.
Energies 18 05057 g019
Figure 20. Case 3: System frequency change curves under three configurations of energy storage 2.
Energies 18 05057 g020
Figure 21. Case 3 complete simulation process diagram.
Energies 18 05057 g021
Table 1. The parameter sources for each model are summarized.
ModelParameter Source
39Bus-SystemIEEE 39-Bus System Information
WT3ESIG default
REPC_AWECC default
REEC_CWECC default
REGC_AWECC default
Table 2. Frequency performance indicators and explanations.
ParameterDenotationSignificance
f m i n The lowest frequency point obtained during the simulationDetermine the lowest point of frequency drop
f e n d Simulate the final frequency valueDetermine the frequency point of the last rebound
f s t e a d y Frequency standard deviation after steady stateReflects the oscillation degree and stability of the system in the steady state stage
R a n g e s t e a d y Amplitude of frequency fluctuation after steady stateMeasure the steady-state oscillation amplitude of the system
OscillationsFrequency oscillation times after steady stateReflects the system damping effect and stability
Table 3. System parameters used for parameter identification in this study.
ModelParameterDenotation
REPC_ATfltrVoltage or reactive power measurement filter time constant (s)
KpReactive power PI control proportional gain (pu)
KiReactive power PI control integral gain (pu)
TftLead time constant (s)
TfvLag time constant (s)
KpgProportional gain for power control (pu)
KigProportional gain for power control (pu)
TpReal power measurement filter time constant (s)
TgPower Controller lag time constant (s)
REEC_CTrvVoltage filter time constant
Kqvgain during over and undervoltage conditions
TpFilter time constant for electrical power
TiqTime constant on delay s4
TpordPower filter time constant
REGC_ATgConverter time constant (s)
KhvOvervoltage compensation gain used in the high voltage reactive current management
Table 4. The influence degree of all parameters obtained from OAT analysis.
RankingParameterScore
1Kpg (REPC)10
2Kig (REPC)7.77
3Tp (REPC)6.86
4Tg (REPC)6.85
5Tpord (REEC)6.2
6Tg (REGC)5.71
7Tp (REEC)4.51
8Tiq (REEC)4.09
9Trv (REEC)4.01
10Khv (REGC)0
11Tfv (REPC)0
12Ki (REPC)0
13Tfltr (REGC)0
14Tfltr (REPC)0
15Kqv (REEC)0
16Kp (REPC)0
17Tft (REPC)0
Table 5. As an adjustment parameter for the subsequent IPSO process.
ModelParameter
REPC_AKpg
Kig
Tp
Tg
REEC_CTp
Trv
Tiq
Tpord
REGC_ATg
Table 6. Related parameter settings of IPSO algorithm.
ParameterDenotationValue
SWARMSIZEThe number of particles per generation10
MAXITERMaximum iteration number20
INERTIA_W_MAXInitial inertia weight0.9
INERTIA_W_MINfinal inertia weight0.4
C_MAXLearning factor upper limit2.5
C_MINLearning factor lower limit0.5
Table 7. Parameter search range of energy storage controller.
ModelParameterValue
REPC_AKpg0.0001–50
Kig0.0001–50
Tp0.02–0.5
Tg0.05–0.5
REEC_ATp0.0001–0.1
Trv0.0001–0.1
Tiq0.0001–0.1
Tpord0.01–0.1
REGC_ATg0.01–0.05
Table 8. The optimal energy storage control parameters obtained by the IPSO algorithm in the first case.
ModelParameterValue
REPC_AKpg5.78525
Kig33.20066
Tp0.43394
Tg0.24379
REEC_ATp0.03235
Trv0.01906
Tiq0.00819
Tpord0.04740
REGC_ATg0.04032
Table 9. The optimal energy storage control parameters obtained by the IPSO algorithm in the second case.
ModelParameterValue
REPC_AKpg2.59187
Kig17.53082
Tp0.497
Tg0.08561
REEC_CTp0.07276
Trv0.07684
Tiq0.05206
Tpord0.01401
REGC_ATg0.03006
Table 10. The optimal energy storage control parameters obtained by the IPSO algorithm in the third case.
ModelParameterValue
REPC_AKpg2.59187
Kig17.53082
Tp0.497
Tg0.08561
REEC_ATp0.07276
Trv0.07684
Tiq0.05206
Tpord0.01401
REGC_ATg0.03006
Table 11. Observed data of storage, wind turbine output, and system frequency under three conditions.
Simulated SituationFan 1
Output Power
Fan 2 Output PowerFan 3 Output PowerTotal Fan Output PowerInstantaneous Total Power Loss of FanBESS1
Instantaneous Maximum Output Power
BESS 2
Instantaneous Maximum Output Power
BESS Instantaneous Maximum Total Output PowerBESS 1
Lowest Frequency
BESS 2
Lowest Frequency
Case 10 pu2 pu2 pu4 pu2 pu0.983 pu1.213 pu2.166 pu59.976 Hz59.976 Hz
Case 21 pu1 pu2 pu4 pu2 pu1.067 pu1.244 pu2.312 pu59.976 Hz59.976 Hz
Case 31 pu1 pu1 pu3 pu3 pu1.498 pu1.445 pu2.918 pu59.976 Hz59.976 Hz
Table 12. All frequency performance indicators and improvements in the three scenarios with and without IPSO.
Simulated SituationFrequency IndexNO BESSBESS
Without IPSO
BESS
with IPSO
Improvement (%)
Case 1 f m i n 59.928 Hz59.971 Hz59.976 Hz0.00833%
f e n d 59.958 Hz59.975 Hz59.978 Hz0.005%
f s t e a d y 0.002456 Hz0.002135 Hz0.000067 Hz96.8%
R a n g e s t e a d y 0.007141 Hz0.006541 Hz0.000289 Hz95.58%
Oscillations000
Case 2 f m i n 59.926 Hz59.969 Hz59.976 Hz0.011%
f e n d 59.958 Hz59.976 Hz59.9788 Hz0.011%
f s t e a d y 0.002146 Hz0.00211 Hz0.0000755 Hz96.42%
R a n g e s t e a d y 0.001068 Hz0.000904 Hz0.000311 Hz65.59%
Oscillations000
Case 3 f m i n 59.884 Hz59.967 Hz59.976 Hz0.15%
f e n d 59.943 Hz59.974 Hz59.975 Hz0.0016%
f s t e a d y 0.001911 Hz0.001987 Hz0.000131 Hz93.4%
R a n g e s t e a d y 0.007652 Hz0.007694 Hz0.000641 Hz91.6%
Oscillations000
Disclaimer/Publisher’s Note: The statements, opinions and data contained in all publications are solely those of the individual author(s) and contributor(s) and not of MDPI and/or the editor(s). MDPI and/or the editor(s) disclaim responsibility for any injury to people or property resulting from any ideas, methods, instructions or products referred to in the content.