Article

Comparative Study on the Effects of Diesel Fuel, Hydrotreated Vegetable Oil, and Its Blends with Pyrolytic Oils on Pollutant Emissions and Fuel Consumption of a Diesel Engine Under WLTC Dynamic Test Conditions

1
Faculty of Mechanical Engineering and Aeronautics, Rzeszow University of Technology, 12 Powstancow Warszawy Str., 35-959 Rzeszow, Poland
2
Faculty of Mechanical Engineering, Bialystok University of Technology, 45 Wiejska Str., 15-351 Bialystok, Poland
3
Faculty of Mechanical Engineering, Lublin University of Technology, 36 Nadbystrzycka Str., 20-618 Lublin, Poland
*
Author to whom correspondence should be addressed.
Energies 2025, 18(18), 5038; https://doi.org/10.3390/en18185038
Submission received: 16 August 2025 / Revised: 11 September 2025 / Accepted: 16 September 2025 / Published: 22 September 2025
(This article belongs to the Section I2: Energy and Combustion Science)

Abstract

The search for alternative liquid fuels for compression-ignition (CI) internal combustion engines includes waste-derived fuels such as hydrotreated vegetable oil (HVO) and pyrolytic oils from end-of-life tires (tire pyrolytic oil, TPO) and plastics—polystyrene pyrolytic oil (PSO). The application of these fuels requires meeting a number of criteria, including exhaust pollutant emissions. The scientific objective of this study was to compare pollutant emissions—carbon dioxide (CO2), carbon monoxide (CO), total hydrocarbons (THC), nitrogen oxides (NOx), particulate matter (PM)—and fuel consumption of a passenger car CI engine fueled with diesel B7, HVO, and a blend consisting of 90% HVO, 5% TPO, and 5% PSO (vol.), hereinafter referred to as HVO–TPO–PSO. The tests were carried out using a chassis dynamometer equipped for conducting standardized WLTC Class 3b driving cycles, with exhaust gases measured by laboratory-grade analyzers to ensure accuracy and repeatability. Fueling the engine with HVO resulted in the lowest CO2, CO, THC, NOx, and PM emissions across all phases of the driving cycle. The addition of pyrolytic oils to HVO increased NOx and CO2 levels while maintaining benefits in PM, THC, and CO reduction compared to the B7 reference fuel. The results demonstrated the applicability of HVO–TPO–PSO blends in engine applications while indicating the need for further durability studies. The adopted research approach addresses a significant knowledge gap by providing a unique analysis of the impact of HVO blends with tire and plastic pyrolysis oils on pollutant emissions and internal combustion engine fuel consumption under WLTC 3b operating conditions.

1. Introduction

The phase-out of fossil fuels in the transportation and energy sectors stems from the need to reduce greenhouse gas (GHG) emissions [1]. In addition, the unstable geopolitical situation underscores the importance of ensuring energy security, once again drawing attention to the development of renewable energy sources. Given the insufficient progress toward achieving sustainable development goals [2], intensifying efforts to implement alternative fuels is of key importance. Current trends indicate that transportation electrification yields noticeable results only in the case of light-duty vehicles and primarily in selected regions of the world [3]. At the same time, diesel engines remain the dominant solution in heavy-duty transportation. Projections indicate that their share in global energy consumption may increase to 50% by 2040 [4], which, in the context of stagnant crude oil production, makes the search for diesel fuel (DF) alternatives essential. At the same time, the share of alternative fuels in the total fuel pool is expected to reach only 15% by 2040, which will not offset the growing energy demand [5,6].
Currently, two types of alternative fuels dominate the commercial market for CI engines: FAME and HVO. Both are drop-in fuels that can fully replace DF without requiring engine modifications. FAME is produced through the transesterification of vegetable oil with methanol, whereas HVO is obtained via the hydrotreating of plant-based feedstocks or organic waste. These are second-generation fuels that do not compete with food production [7], providing an alternative to the less effective attempts to use PVO [8]. Studies have shown that FAME can serve as a substitute for DF without significant differences in engine energy efficiency or emissions. HVO, although slightly less energy-dense (approximately 5% lower energy density), is characterized by a higher cetane number and low toxicity [9,10]. However, its increased reactivity may lead to earlier autoignition during the premixed combustion phase, potentially causing higher maximum cylinder pressures, lower thermal efficiency, and increased NOx emissions [11]. The use of HVO during cold start enables a reduction in noise and exhaust emissions [12]. According to Prokopowicz et al. [13], adding 30% HVO to DF resulted in more than a 50% reduction in CO emissions during cold start and a (5.2–11.8)% decrease in PM emissions. Bortel et al. [14] confirmed the neutral or positive impact of HVO on engine performance and emissions of CO, THC, PM, NOx, and CO2, as well as an increase in engine output power. Full substitution of DF with HVO can reduce GHG emissions from well to wheel by up to 85%. Due to its paraffinic structure and the absence of aromatic compounds and sulfur, HVO provides clean diffusive combustion with lower soot formation tendencies, while its stable storage temperature offers a clear advantage over FAME [15]. Pirjola et al. [16] tested a mobile machinery engine equipped with a common-rail fuel injection system, a DOC, and an SCR system under real-world conditions and on an engine dynamometer, confirming that replacing DF with HVO reduced NOx emissions by 20% and PM emissions by 44%. Particle size distribution and volatility measurements revealed that in real-world experiments, small nucleation-mode particles were generated during uphill and downhill engine braking. This was not observed under laboratory conditions. Nucleation-mode particles were also recorded during high-load braking tests at constant speed. Under steady-state conditions, emissions were strongly dependent on engine load and speed. An important property of fuels used in diesel engines is lubricity, which may deteriorate when alternative fuels are used—one example being the reduced lubricity of HVO or diesel–ethanol blends [17]. Huynh et al. [18] used POB in proportions of (60–90)% to improve the lubricity of HVO to a level comparable to DF. Parravicini et al. [19] achieved EN 590-compliant properties by blending HVO with OME and GTL fuels. They also demonstrated that adding GTL and OME to HVO reduced PM and NOx emissions compared to DF. Furthermore, it was found that the efficiency of fuel–air mixing also depends on the chain length of the paraffins.
The availability of HVO in Europe remains limited, and its price exceeds that of DF, which promotes research on waste-derived alternatives [20]. For engine applications, the most promising method of obtaining fuel from waste is the pyrolysis of plastics and tires, which converts them into liquid oil, gas, and solid substances. Pyrolysis processes of HDPE, PP, and PS in a 1:1:1 ratio require further refining (vacuum distillation, hydrotreating) to meet the EN 590 and ASTM D975 standards [21,22]. The use of hydrothermal technology as a method of plastic waste utilization, compared to pyrolysis, enhances CO2 emission reduction, carbon neutrality, and the sustainable development of society [23]. The production of fuels from plastics and tires is often associated with high exergy destruction [24].
Comparisons in the maritime sector indicate that TPO has a lower sustainability index than conventional marine fuels. According to Bayramoğlu and Nuran [25], the energy value of TPO was determined at 2.8 MW, thermal efficiency at 38%, and second-law efficiency at 58%. Standard marine fuels achieved a sustainability index of 2.7, while TPO reached 1.42. Bodisco et al. [26] evaluated NOx emissions from a delivery van engine fueled with a blend of DF and TPO in driving cycles representative of a typical courier route. The driver reported no noticeable difference in the driving characteristics of the vehicle when fueled with DF or the DF–TPO blend. NOx emissions were comparable for both fuels.
Waste plastic pyrolysis oil (WPPO) can improve cylinder pressure and thermal efficiency while reducing fuel consumption [27], but NOx and HC emission results are inconsistent due to feedstock variability [28,29]. Mustayen et al. [30] recommended using WPPO–DF blends in the range of (10–90)% in CI engines without hardware modifications. The addition of hexane or jatropha biodiesel was shown to improve the fuel properties of WPPO, reducing NOx emissions and increasing thermal efficiency [31]. The majority of plastic waste consists of HDPE grocery bags. Sharma et al. [32] subjected HDPE to pyrolysis and distillation, and by adding oxidants to the resulting oil, they were able to meet ASTM D975 and EN 590 legislative requirements, except for density. The oil exhibited a cetane number of 73.4, and its lubricity (198 μm, 60 °C, ASTM D6890) exceeded that of DF. Sunaryo et al. [33] found that operating a CI engine on oil derived from LDPE pyrolysis increased average power and torque by 5% and 3%, respectively, indicating a higher heating value. LDPE concentrations in the range of (10–50)% in blends with DF reduced fuel consumption and increased efficiency, while decreasing thermal efficiency. Mohan et al. [34] confirmed that DF blends with WPPO (up to 40%) did not cause any engine performance issues. Tests were conducted at loads of (25–100)%, engine speeds of (1200–1800) rpm, and compression ratios of (15–9). Mustayen et al. [30] evaluated the performance and emissions of an engine fueled with WPPO produced via pyrolysis of HDPE, PP, and PS in equal proportions, followed by vacuum distillation. Three WPPO proportions (5, 10, and 20)% in blends with ultra-low sulfur DF showed that brake power, brake torque, and brake thermal efficiency of engines fueled with WPPO–DF blends were higher by (2.9–3.84)%, (3.01–3.21)%, and (3.9–4.74)%, respectively, compared to DF under all tested conditions. BSFC decreased by about 3.77% with 20% WPPO in the DF blend and by about 7.8% and 4.22% with 5% and 10% WPPO blends, respectively. HC emissions were lower only with 20% WPPO, by (15.1–18.7)% relative to DF. NOx emissions decreased by 2.06%, 3.01%, and 3.95% for WPPO–DF blends compared to DF alone.
The conflicting results of studies on DF–WPPO blends reported in the literature are most likely due to differences in the feedstocks used in the pyrolysis process. Various additives used in the production of plastics to modify their functional properties are reflected in the composition of the pyrolysis products. The introduction of such fuels into widespread use will always require compliance with a range of legal standards [35].
The target application of conventional and alternative fuels in diesel engines is evaluated in driving tests according to different schedules, depending on the vehicle type-approval requirements or the region in which a given schedule applies. Literature reports mainly focus on assessing the applicability of DF blends with various alternative fuels. Some studies compare HVO with DF, while comparisons of WPPO with HVO or DF are lacking. Armas et al. [36] conducted an emission assessment of a Euro 4-compliant diesel engine used in a light-duty vehicle. The tests were carried out on a chassis dynamometer according to the NEDC schedule, with the engine fueled by animal fat biodiesel, GTL, HVO, and DF containing 5.8% biodiesel as the reference fuel. The tested fuels showed a reduction in CO emissions and minor fluctuations in total THC and NOx content relative to DF. Both the particle number and particle mass were below the Euro 5b limits for all tested fuels due to the use of a diesel particulate filter. Karavalakis et al. [37] tested two Cummins engines (ISX15 and ISB6.7) using the UDDS schedule for heavy-duty trucks and the heavy heavy-duty diesel truck (HHDDT) cycle. The results confirmed lower THC, NMHC, and CH4 emissions when fueling with HVO compared to the biodiesel blend and CARB ULSD. NOx emissions showed mixed results for the two engines, with both increases and decreases observed for HVO. CO2 emissions were generally lower for HVO compared to CARB ULSD, with the highest values recorded for the biodiesel blend. BSFC was lowest when fueling with HVO. PM mass emissions were higher for HVO and biodiesel, whereas particle number emissions were lower. Chassis dynamometer tests conducted by Biržietis et al. [38] on the external characteristics of an M1-class passenger car engine showed a 2% increase in power and torque and a 3.9% reduction in fuel consumption when using a DF–HVO blend (9.15% HVO) compared to DF. Fueling with the DF–HVO blend reduced fuel consumption in both steady-speed (50, 90, and 110 km/h) and transient driving (IM-240 and “Jelgava” schedules). At speeds of 50, 90, and 110 km/h, fuel consumption for the DF–HVO blend decreased by 1.5%, 0.7%, and 3.7%, respectively, compared to DF. In the IM-240 and “Jelgava” cycles, fuel consumption decreased by 2.9% and 3.9%, respectively, for the blend compared to DF. Jaroonjitsathian et al. [39] demonstrated in the NEDC cycle that a blend of 20% HVO and 5% FAME with DF was compatible with advanced diesel engine technology. GTL and HVO were also tested in blends with DF, producing three fuel types: 0%, 50%, and 100%. GTL and HVO blends with DF showed some improvement in CI engine performance compared to DF. Increasing GTL and HVO content in the blend reduced ignition delay for both the pilot and main injections. The GTL and HVO content in the blend reduced all emissions except NOx. Napolitano et al. [40] tested a small-power Euro 5-compliant diesel engine fueled with blends of HCK and HVO with DF. The NEDC results indicated that HCK–HVO blends were compatible with Euro 5 engines, with the potential to improve all emissions and comfort parameters due to the high cetane number of HVO. Mata et al. [41] confirmed the advantages of HVO during real-world urban driving. Performance and emission results indicated that HVO can be used as a partial or complete substitute for DF. Tests according to the NEDC and WLTP schedules [42] with fuels B0 (pure DF), B7 (7% biodiesel), B15 (15% biodiesel), B100 (pure biodiesel), and HVO15 (15% HVO) showed that complete replacement of DF with alternative fuels is not the most cost-effective solution. Differences between the NEDC and WLTP results were not significant. The use of HVO showed no significant differences in fuel consumption compared to B0 (+0.58% NEDC and +0.05% WLTP), which compares favorably with biodiesel (−1.74% NEDC and −0.69% WLTP for B7, and +1.48% NEDC and 1.89% WLTP for B15). Considering engine power output with the tested fuels, the differences were small, being less than 2% for B7, B15, and HVO15.
The literature review revealed a research gap in comparative studies on emissions and fuel consumption of engines fueled with DF, HVO, and other waste-derived fuels under a selected standardized driving cycle. The scientific objective of this study was to demonstrate the differences in emissions and fuel consumption of an engine subjected to a standardized driving cycle when fueled with fossil fuel in the form of diesel containing 7% FAME (B7) as the reference, and with waste-derived fuels in the form of HVO and an HVO blend with TPO and PSO. To achieve this objective, it was necessary to use, in addition to exhaust gas analysis equipment on a chassis dynamometer, a vehicle that applied engine control unit adaptations to a limited extent. The goal was attained through the evaluation of (i) exhaust gas components (CO2, CO, THC, NOx, and PM) and (ii) fuel consumption.
Although many studies have investigated the combustion and emission behavior of HVO and diesel blends with either biodiesel or waste plastic pyrolysis oils, direct comparative analyses under WLTC conditions remain scarce. In particular, studies jointly addressing HVO and its blends with both tire and plastic pyrolytic oils are not available in the literature. The present work therefore contributes to filling this gap by providing the first comparative assessment of regulated emissions and fuel consumption for B7, neat HVO, and an HVO–TPO–PSO blend under WLTC Class 3b conditions. The scientific contribution of this study thus lies not only in the assessment of the applicability of waste-derived fuels for powering CI engines under dynamic driving cycles, but also in highlighting a novel experimental framework that has not yet been reported in the literature.

2. Materials and Methods

The tests were conducted on a chassis dynamometer under load at the Automotive Ecology Laboratory of Rzeszow University of Technology [43], based on the standardized WLTC Class 3b driving cycle at an ambient temperature of 23 ± 3 °C. For the measurement of gaseous pollutants (CO2, CO, THC, and NOx), an OBS-2200 system (HORIBA Ltd., Kyoto, Japan) was used, while PM concentration was measured using an AVL Soot System analyzer (AVL List GmbH, Graz, Austria). A detailed description of the measurement equipment was provided in [44]. The technical specifications of the equipment used, along with measurement uncertainties, were presented in Supplementary Materials (Table S1) [45,46,47,48]. Exhaust mass flow rate was measured using a SEMTECH EFM 4 flowmeter (Sensors Inc., Saline, MI, USA) [45]. The tests were carried out on a CI engine vehicle (VW Polo III 1.9 SDI, model year 2000), with its basic technical specifications listed in Table 1. The choice of engine was dictated by the low complexity of the control system, which could otherwise negatively influence the test results. Overly complex CI engine control systems could significantly interfere with fuel supply and combustion processes by applying continuous adaptations and corrections. In such cases, it became difficult to clearly determine whether the study was evaluating the fuel or the engine control algorithm. An example of excessive use of engine control algorithms in diesel engine fueling was “dieselgate” [49]. The choice of a Euro 3 emission class vehicle was also related to the highest share of passenger cars of this emission class in Poland [50], which could potentially also be fueled with waste-derived fuels. Table 1 additionally presents the coefficients of the road load function applied during the tests.
The test fuels used were B7 (reference), HVO, and a volumetric blend of 90% HVO, 5% TPO, and 5% PSO. B7, as explained earlier, was the European commercial designation for typical diesel fuel with an allowable FAME content of up to 7% by volume, purchased from the ORLEN network. HVO was sourced from the NESTE network. TPO and PSO were obtained through the pyrolysis process described in [11,52]. The basic parameters of the base fuels used in the tests are presented in Table 2. A comparison of the higher heating value of the tested fuels is shown in Figure 1. The scope of the present work was limited to short-term emission and fuel consumption testing under standardized WLTC conditions. Fuel stability, deposit formation, and potential wear-related effects were not assessed and are planned to be addressed in future studies.
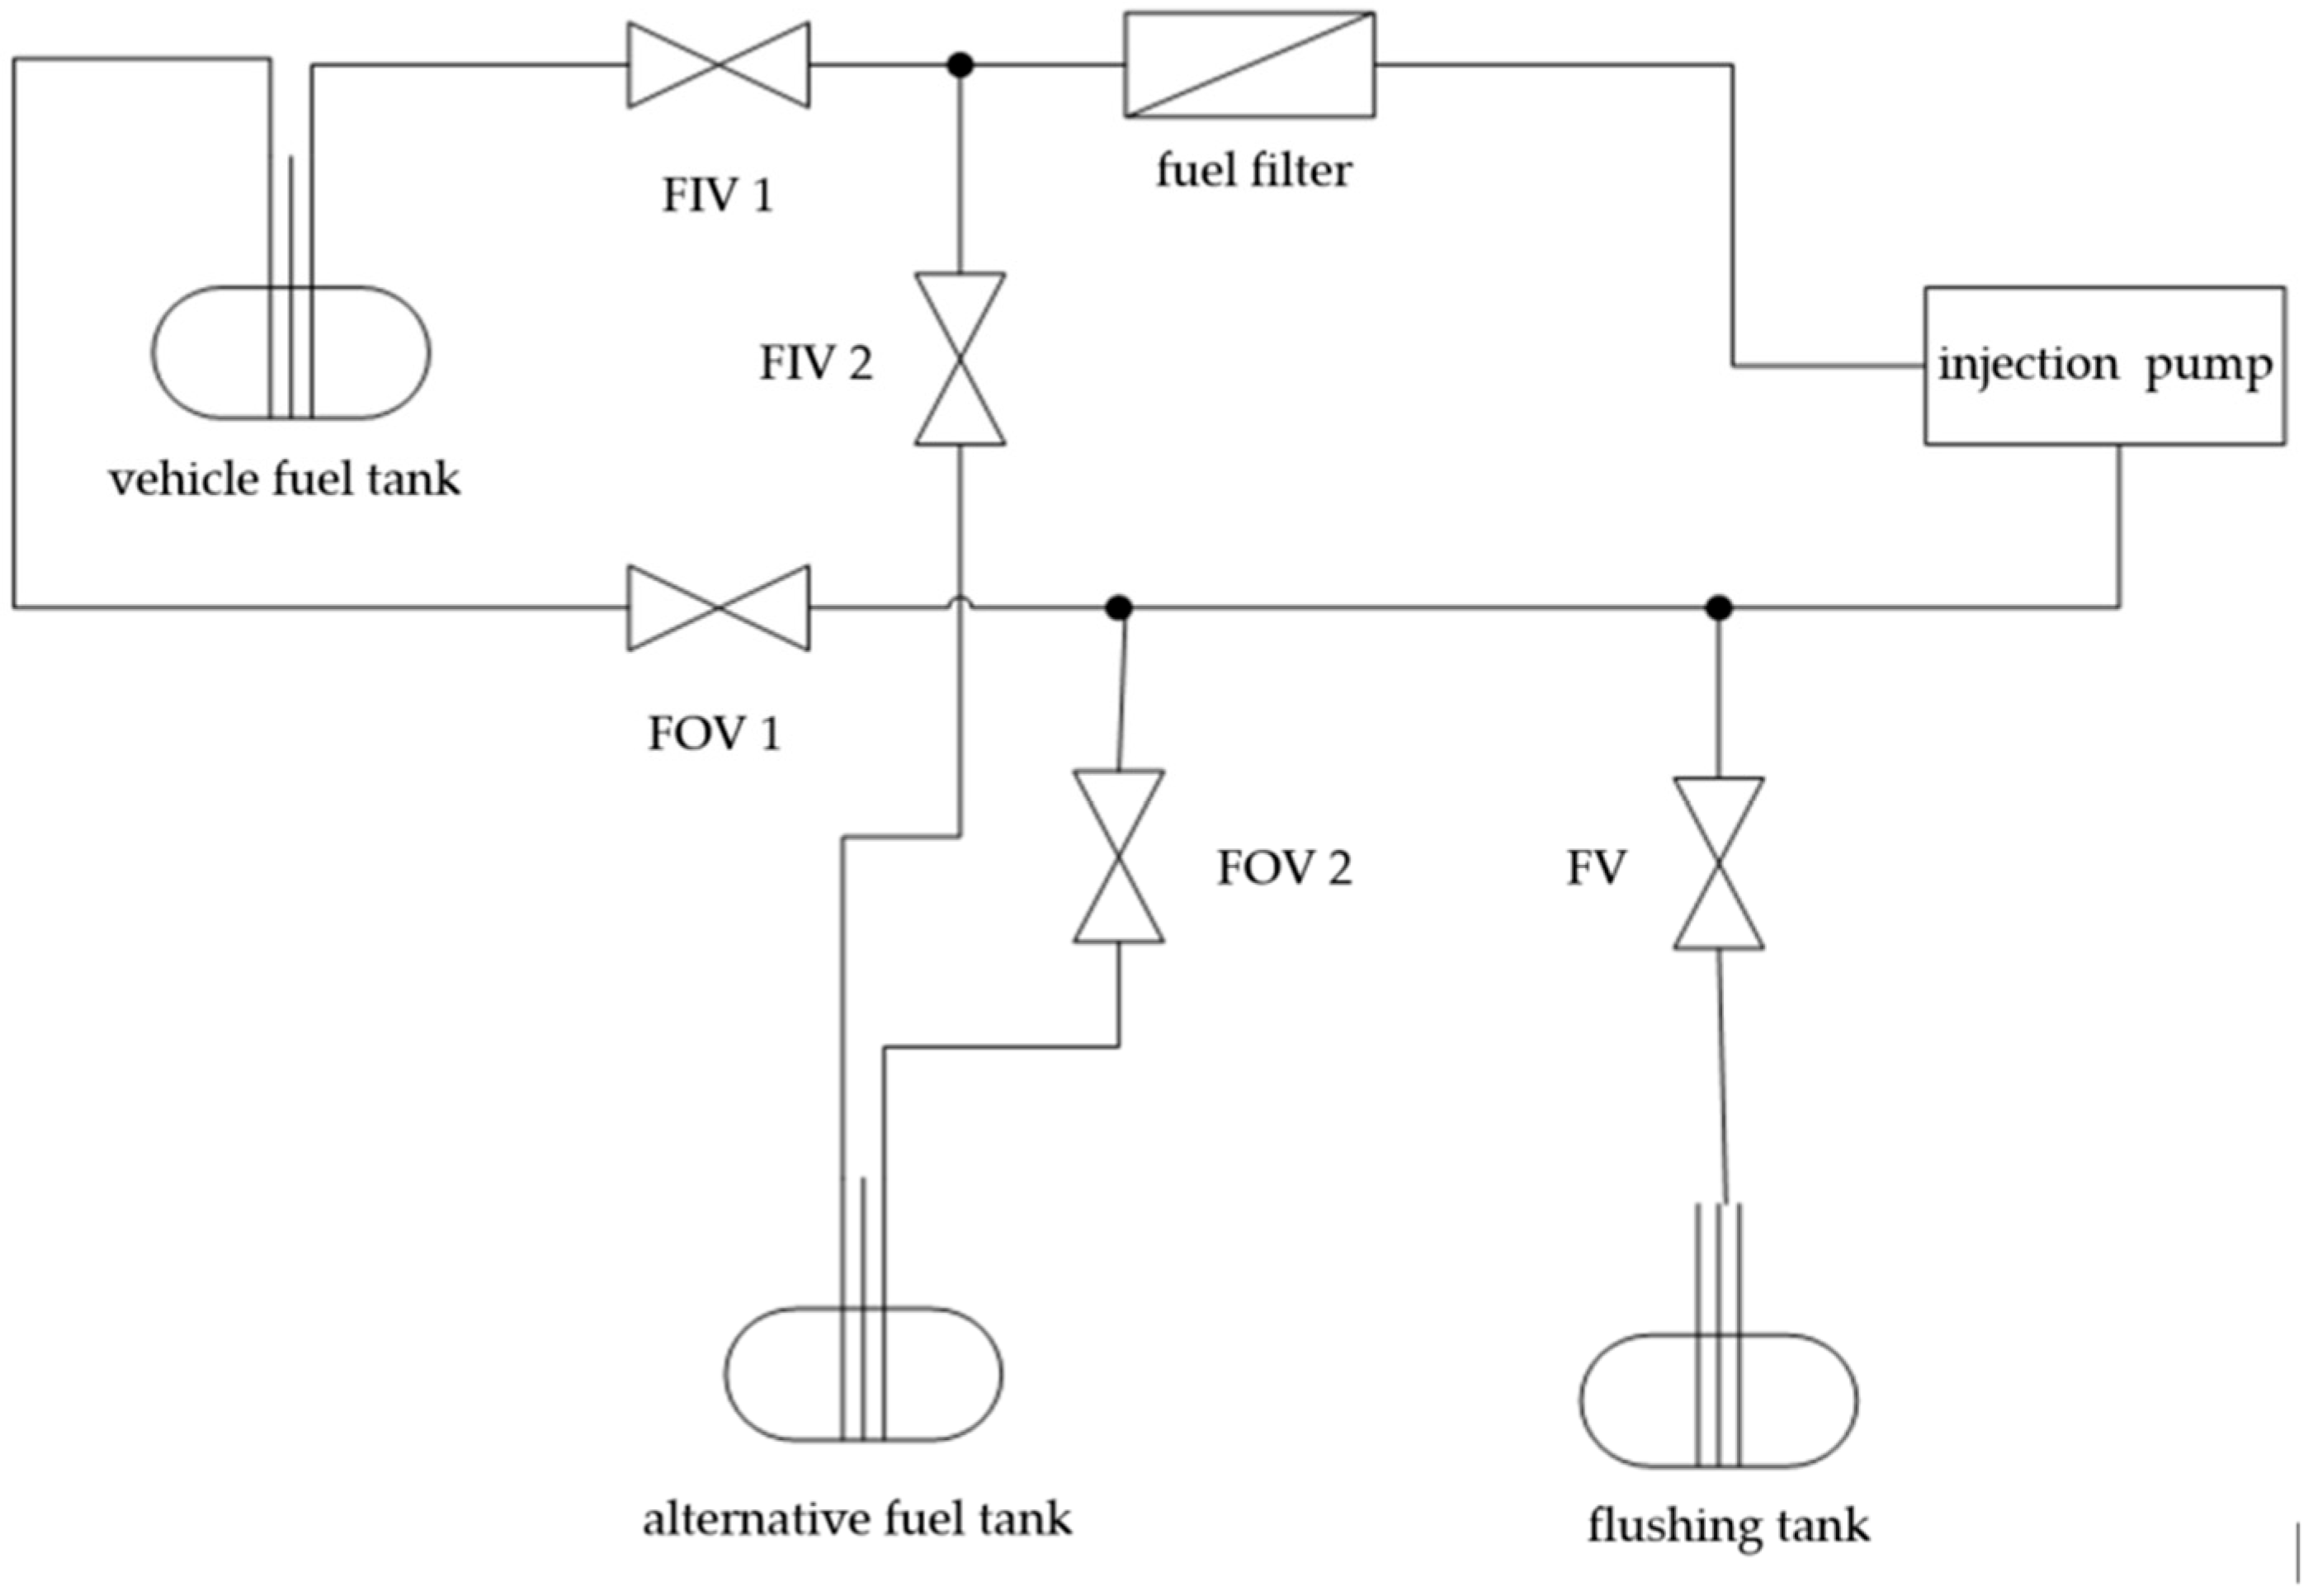
Conducting the tests in accordance with the specified procedure required appropriate preparation of the vehicle, which was equipped with two additional fuel tanks. One of them was used to supply the engine with the alternative fuel, while the other was used to flush the fuel system after changing the type of fuel. A schematic of the modified fuel supply system is presented in Figure 2.
The developed fuel supply system allowed a rapid transition from one type of fuel to another. Valve FIV 1 enabled disconnection of the fuel from the vehicle’s standard tank, and after opening valve FIV 2, the fuel could be delivered from the additional tank directly to the fuel filter. At the same time, to prevent the alternative fuel from entering the vehicle’s main tank, valve FOV 1 was closed, and valve FV was opened, allowing the fuel to flow from the filter and the injection pump to the additional tank. In this way, the system was completely filled with the alternative fuel. After the flushing process was completed, valve FV was closed, while valve FOV 2 was simultaneously opened, enabling fuel flow to the alternative fuel tank. As a result, the vehicle was ready for testing.
The exhaust emission measurements were carried out using the standard procedures specified for the applied analyzers of CO2, CO, THC, NOx, and PM.
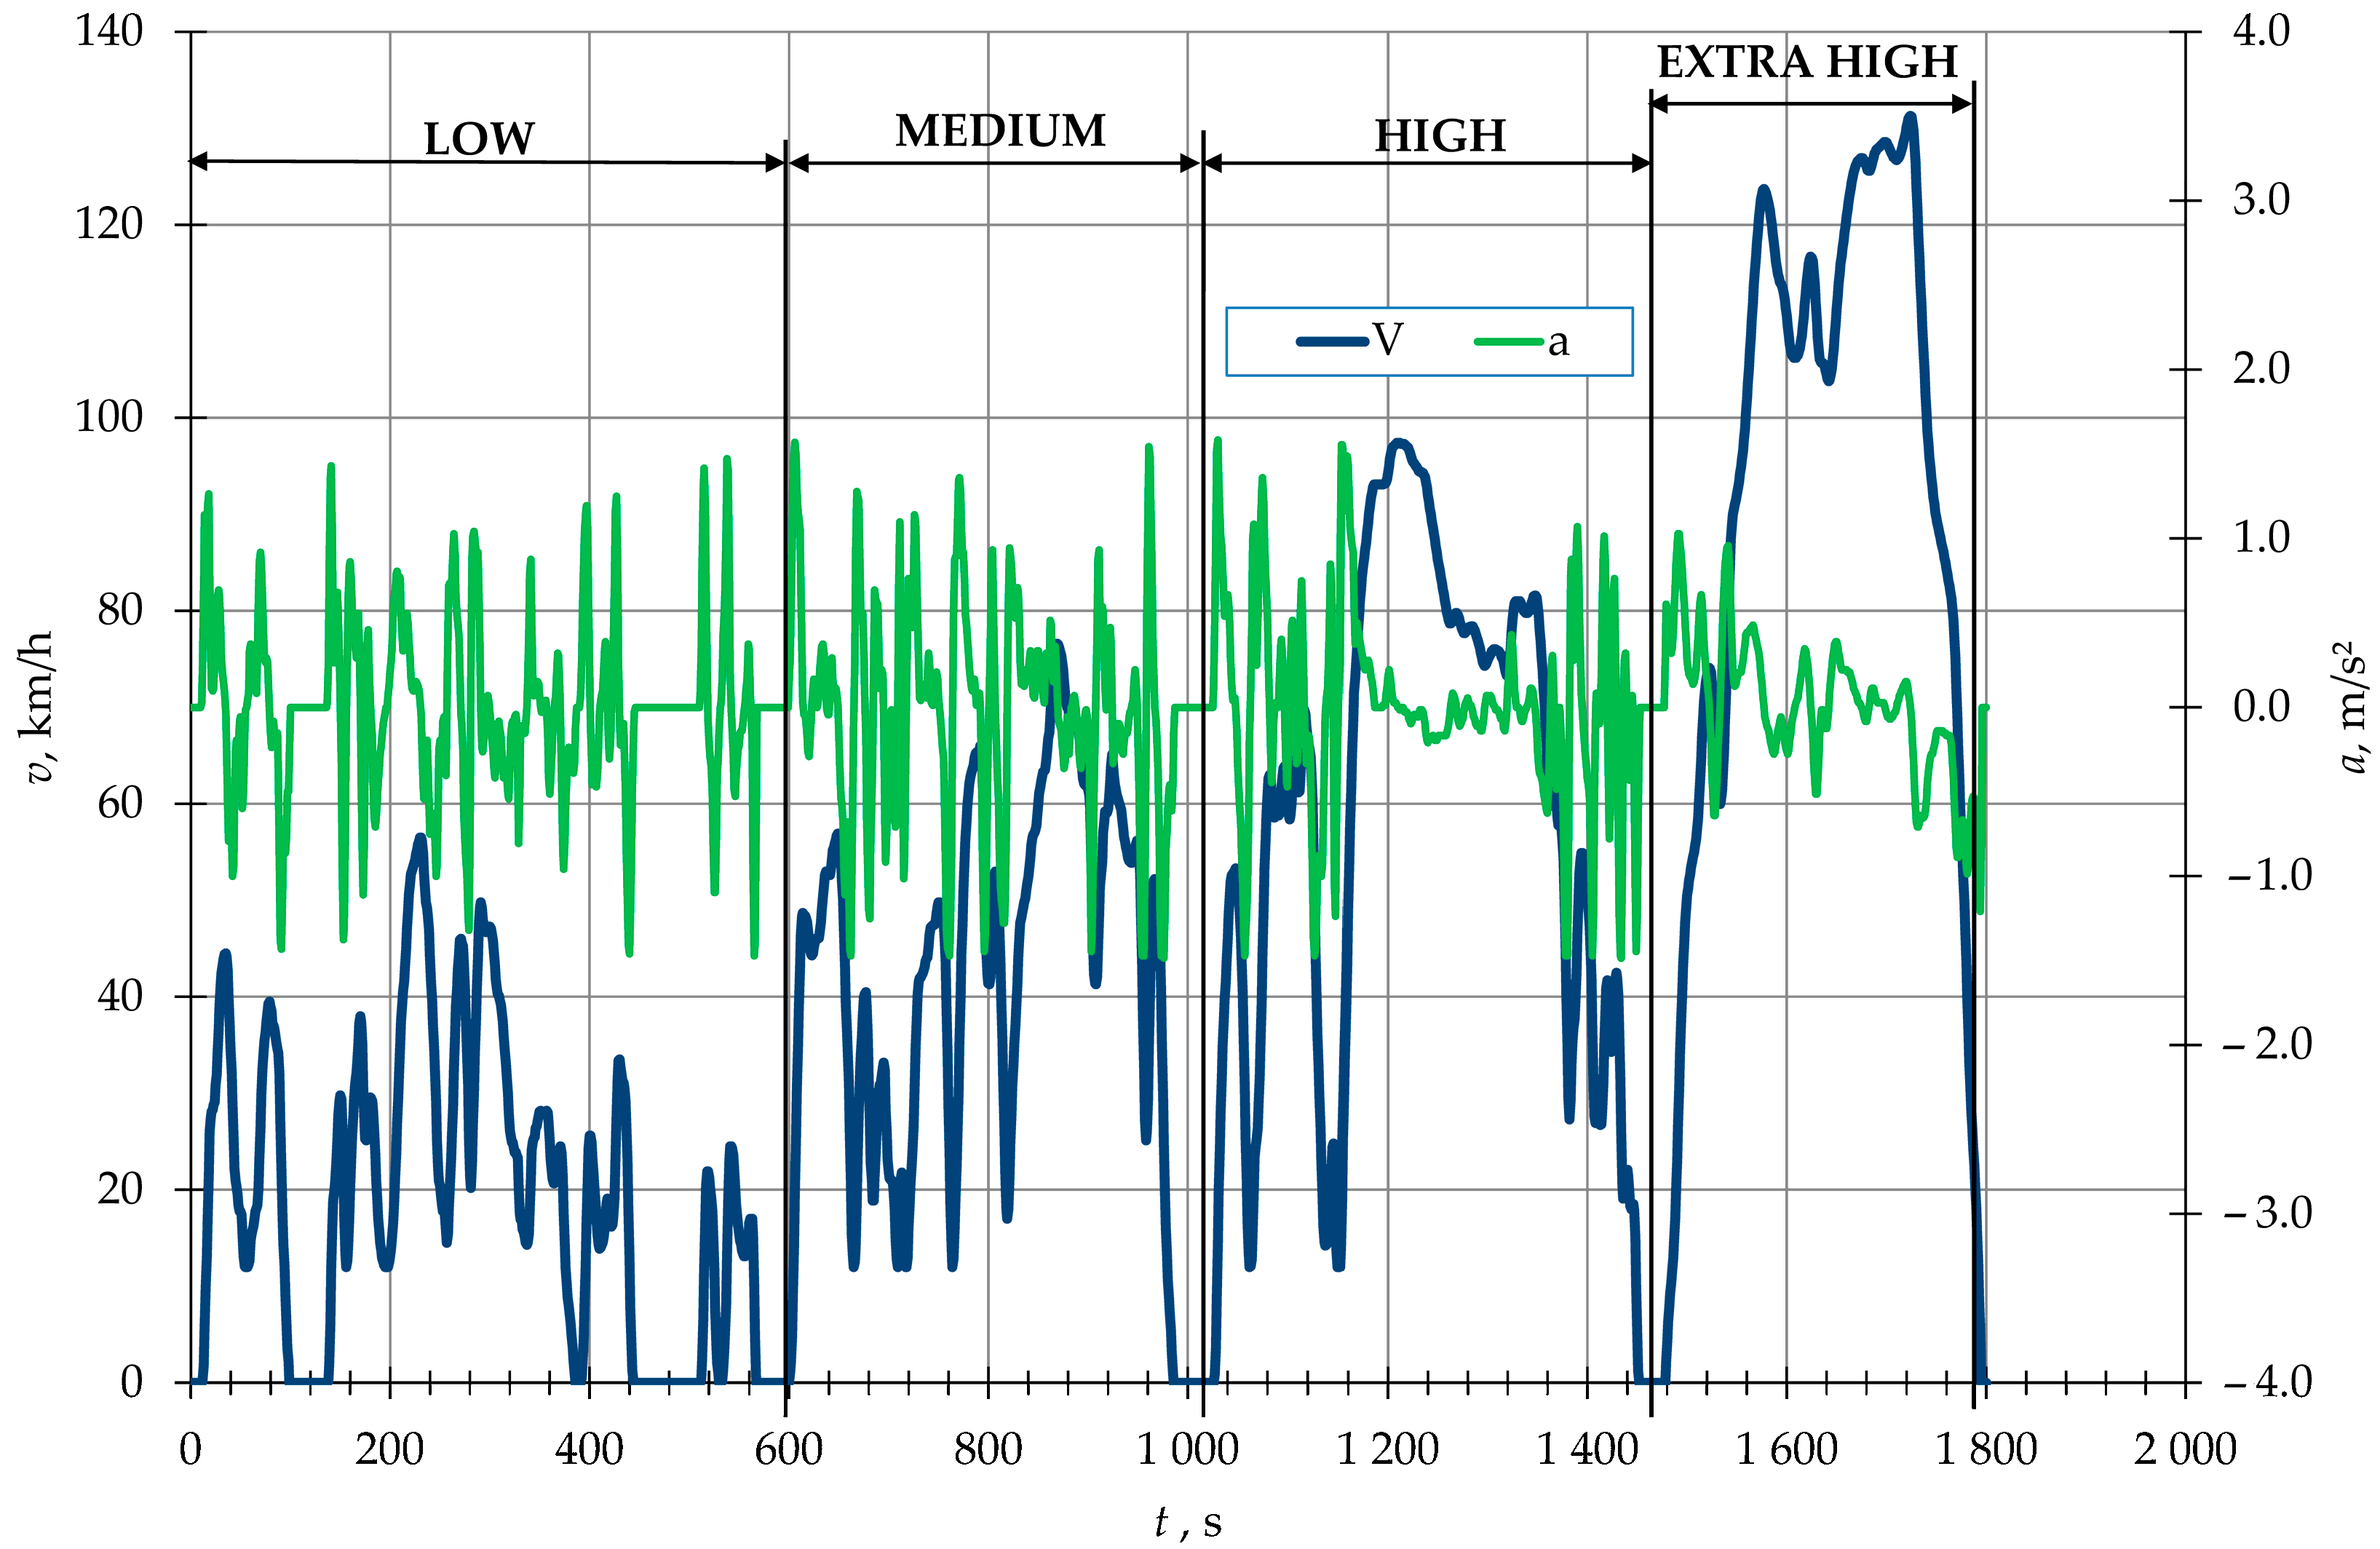
The tests for each fuel were conducted twice, starting from a hot start. Emission analysis was performed using the modal method, which enabled the assessment of changes in the concentrations of the measured pollutants and emissions as a function of time for the individual phases of the WLTC Class 3b cycle [53,54] (Figure 3). The driving cycle applied in the study consisted of four phases: Low, Medium, High, and Extra High. The Low and Medium phases represented urban driving at low and elevated speeds, respectively. The High phase corresponded to rural driving conditions, while the Extra High phase represented highway driving. The speed profile and acceleration changes realized in each phase were shown in the graph. Detailed data of the WLTC Class 3b driving cycle can be found in [54].
Based on the recorded exhaust mass flow rate and pollutant concentrations as a function of time at a frequency of 5 Hz, the emissions of CO2, CO, THC, NOx, and PM were calculated. The mass emission rate of an exhaust gas component egas in a given phase (or the entire test cycle) was calculated using the following equation [54]:
e g a s = i = 1 n q m e w , i · ρ g a s · k h · c g a s , i 10 6 · d ,       g / k m
where q m e w v , i —volumetric exhaust gas flow rate over time, L/s; ρ g a s —density of the exhaust gas component in g/L under standard conditions (273.15 K (0 °C) i 101.325 kPa); k h —humidity correction factor included in the NOx emission calculations (for the study carried out kh = 0.77); c g a s , i volumetric concentration of the measured exhaust gas component at time i, ppm; and d distance of the given phase of the test cycle (or the entire cycle), km.
The emission MPM was calculated using the following equation [46]:
M P M = i = 1 n c i · r d · q m e w , i · Δ t i 3600 · ρ 0 · d ,       m g
where q m e w , i —mass exhaust flow rate at time i, kg/h; c i —soot concentration in the exhaust gas at time i, mg/m3; rd—dilution ratio (rd = 2 = const); ρo—density of the exhaust gas under standard conditions (0 °C, 1013 mbar); and Δti—sampling step, s (Δti = 1 s).
The distance-specific fuel consumption values were calculated using the carbon balance method. The calculations were performed taking into account PM emissions in accordance with equation [54]:
F C = M W C + H C · M W H + O C · M W O M W C · ρ f u e l · 10 · M W C M W C + H C · M W H + O C · M W O · H C + M W C M W C O · C O + M W C M W C O 2 · C O 2 + P M ,       L / 100 k m
where H/C—hydrogen-to-carbon ratio for a given fuel CXHYOZ, (1.9—for diesel fuel, 2.125—for HVO; the same value was assumed for HVO–TPO–PSO); O/C—oxygen-to-carbon ratio for a given fuel CXHYOZ; MWC—molar mass of carbon (12.011 g/mol); MWH—molar mass of hydrogen (1.008 g/mol); MWO—molar mass of oxygen (15.999 g/mol), ρfuel—fuel density, kg/L; HC—hydrocarbon emissions, g/km; CO—carbon monoxide emissions, g/km; CO2—carbon dioxide emissions, g/km; and PM—particulate matter emissions, g/km.

3. Results and Discussion

3.1. Exhaust Pollutant Emissions

3.1.1. CO2 Emission

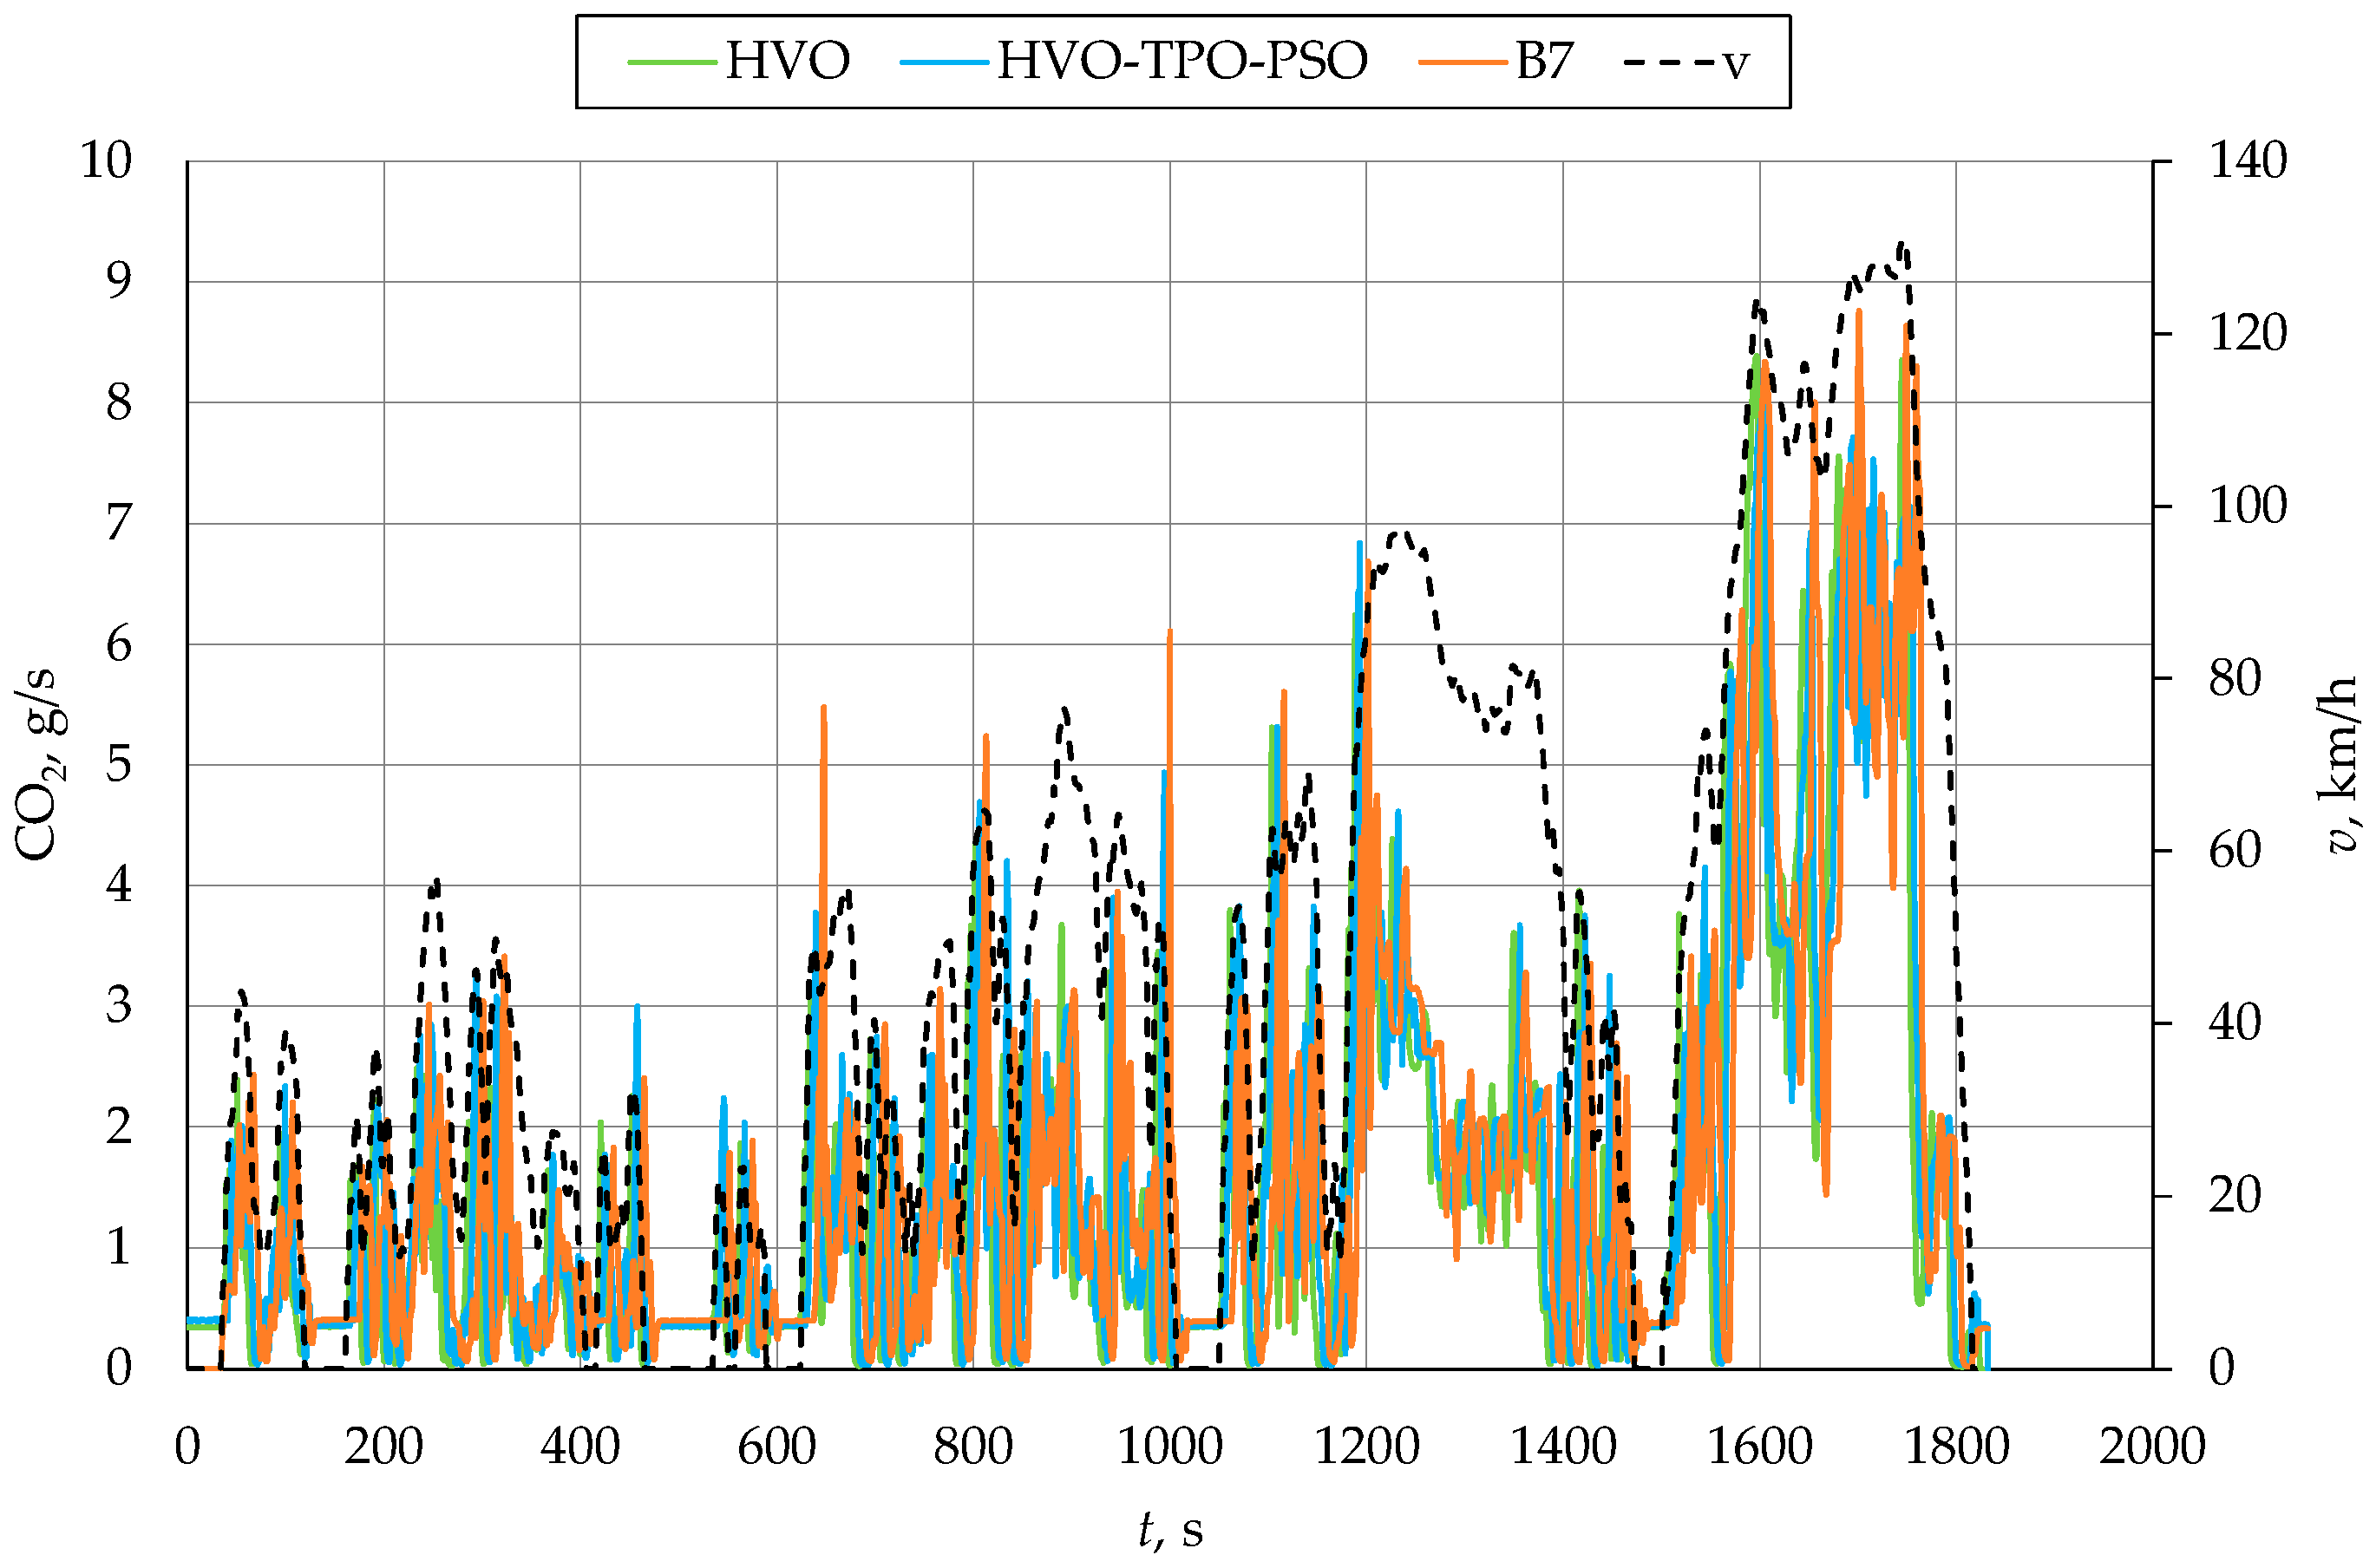
Figure 4 shows an example of changes in instantaneous CO2 emission over the WLTC Class 3b test cycle when fueled with B7, HVO, and HVO–TPO–PSO. This figure showed the changes in CO2 emissions and the speed profile (illustrated by the black dashed line), which made it possible to determine the emission variations when the engine was fueled with the tested fuels, taking into account the individual phases of the driving cycle.
The average CO2 emission values for the individual phases of the WLTC cycle are presented in Figure 5. The values represent the averages of two tests for each fuel, while the error bars indicate the difference between the results. The average emission results were calculated for four characteristic phases (Low, Medium, High, and Extra High), for the entire WLTC Class 3b cycle, and additionally for the urban part (Low + Medium).
Fueling the engine with HVO (Figure 5) resulted in the lowest CO2 emissions across all phases of the cycle compared to fueling with the reference fuel B7 and the HVO–TPO–PSO blend. The largest difference in average CO2 emission relative to the reference fuel B7, approximately 9%, was observed for the Low (urban) phase, while the smallest difference, about 5%, was recorded for the High phase. The addition of 5% TPO and 5% PSO to HVO increased CO2 emissions compared to fueling the engine with HVO alone. An approximately 3% higher CO2 emission was also recorded in relation to fueling with B7 in the Low phase. An approximately 5% lower average CO2 emission for the HVO–TPO–PSO blend compared to B7 was observed in the Extra High (highway) phase. The lower CO2 emission when using HVO was associated with its high cetane number and reactivity, as well as its lower carbon content and the highest higher heating value among the tested fuels (47.2 MJ/kg, Figure 1), which promoted efficient combustion [55]. The addition of TPO and PSO (with lower higher heating values—42.0 MJ/kg and 39.8 MJ/kg, respectively) reduced this parameter for the blend while increasing aromatic compound content, leading to higher CO2 emissions. Differences between driving phases resulted from varying engine operating conditions—during urban phases with frequent load changes, the influence of fuel properties was more pronounced, whereas in steady-state phases, such as Extra High, these differences were smaller.

3.1.2. CO Emission

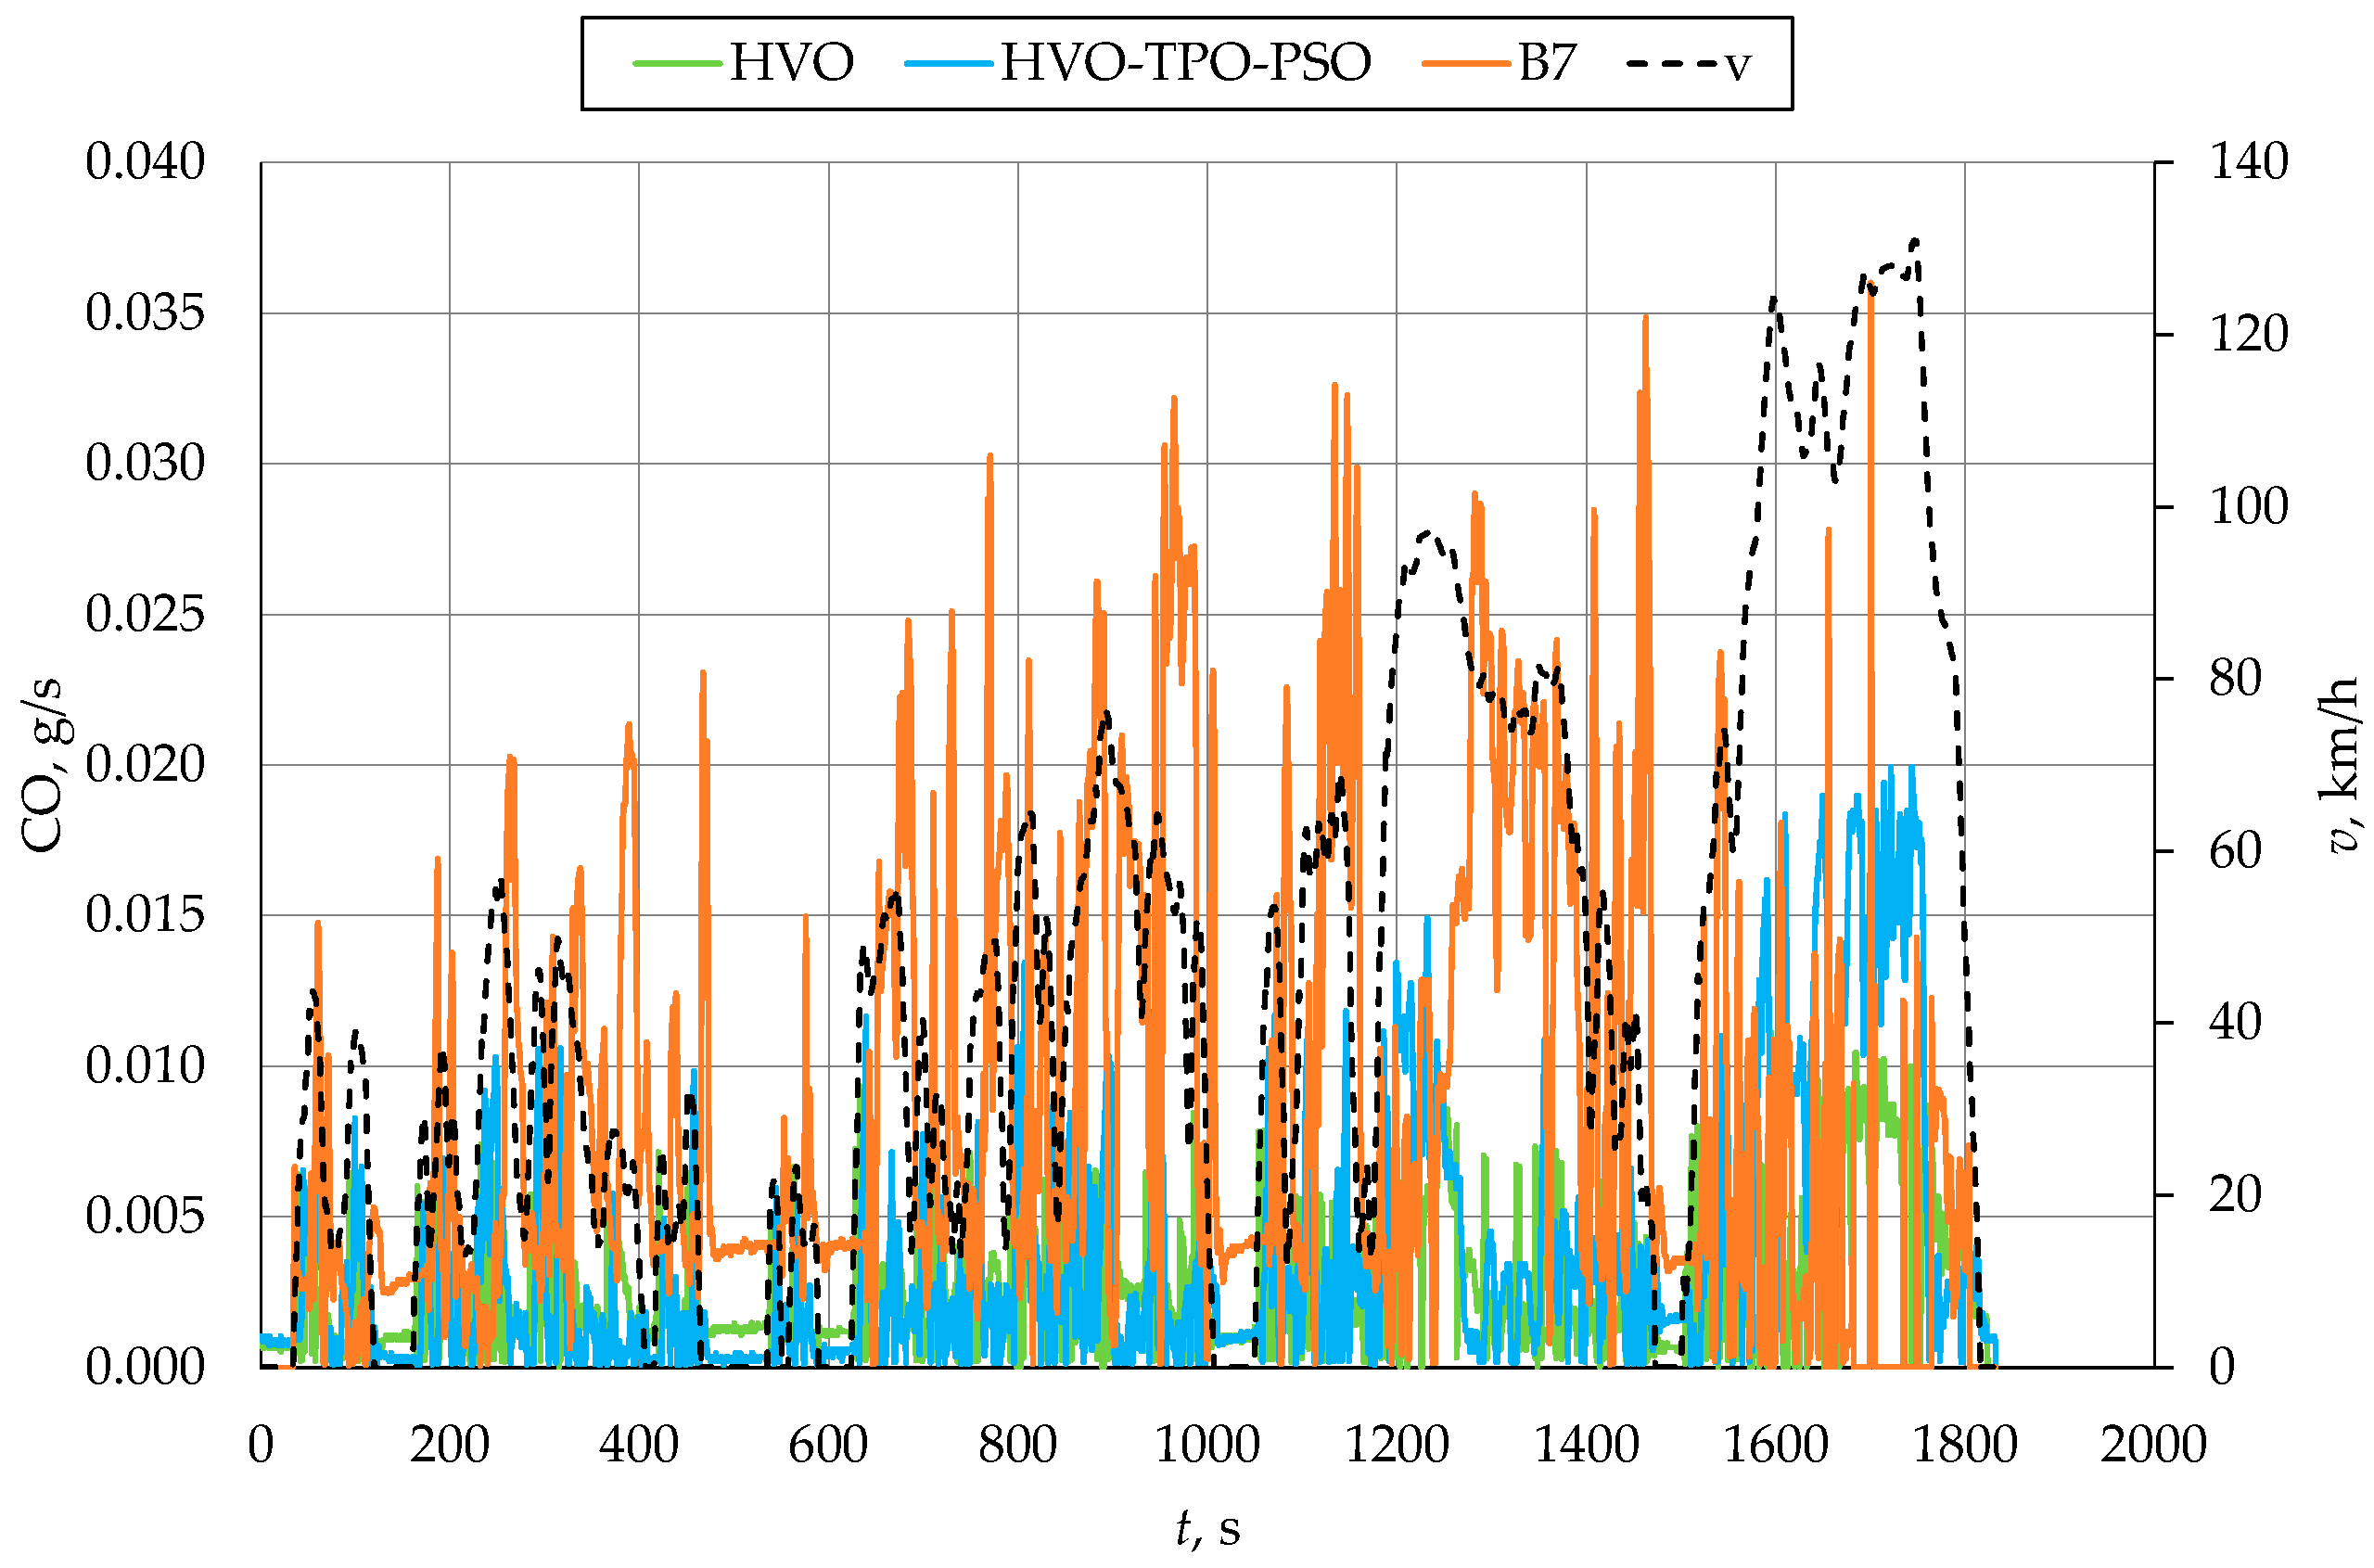
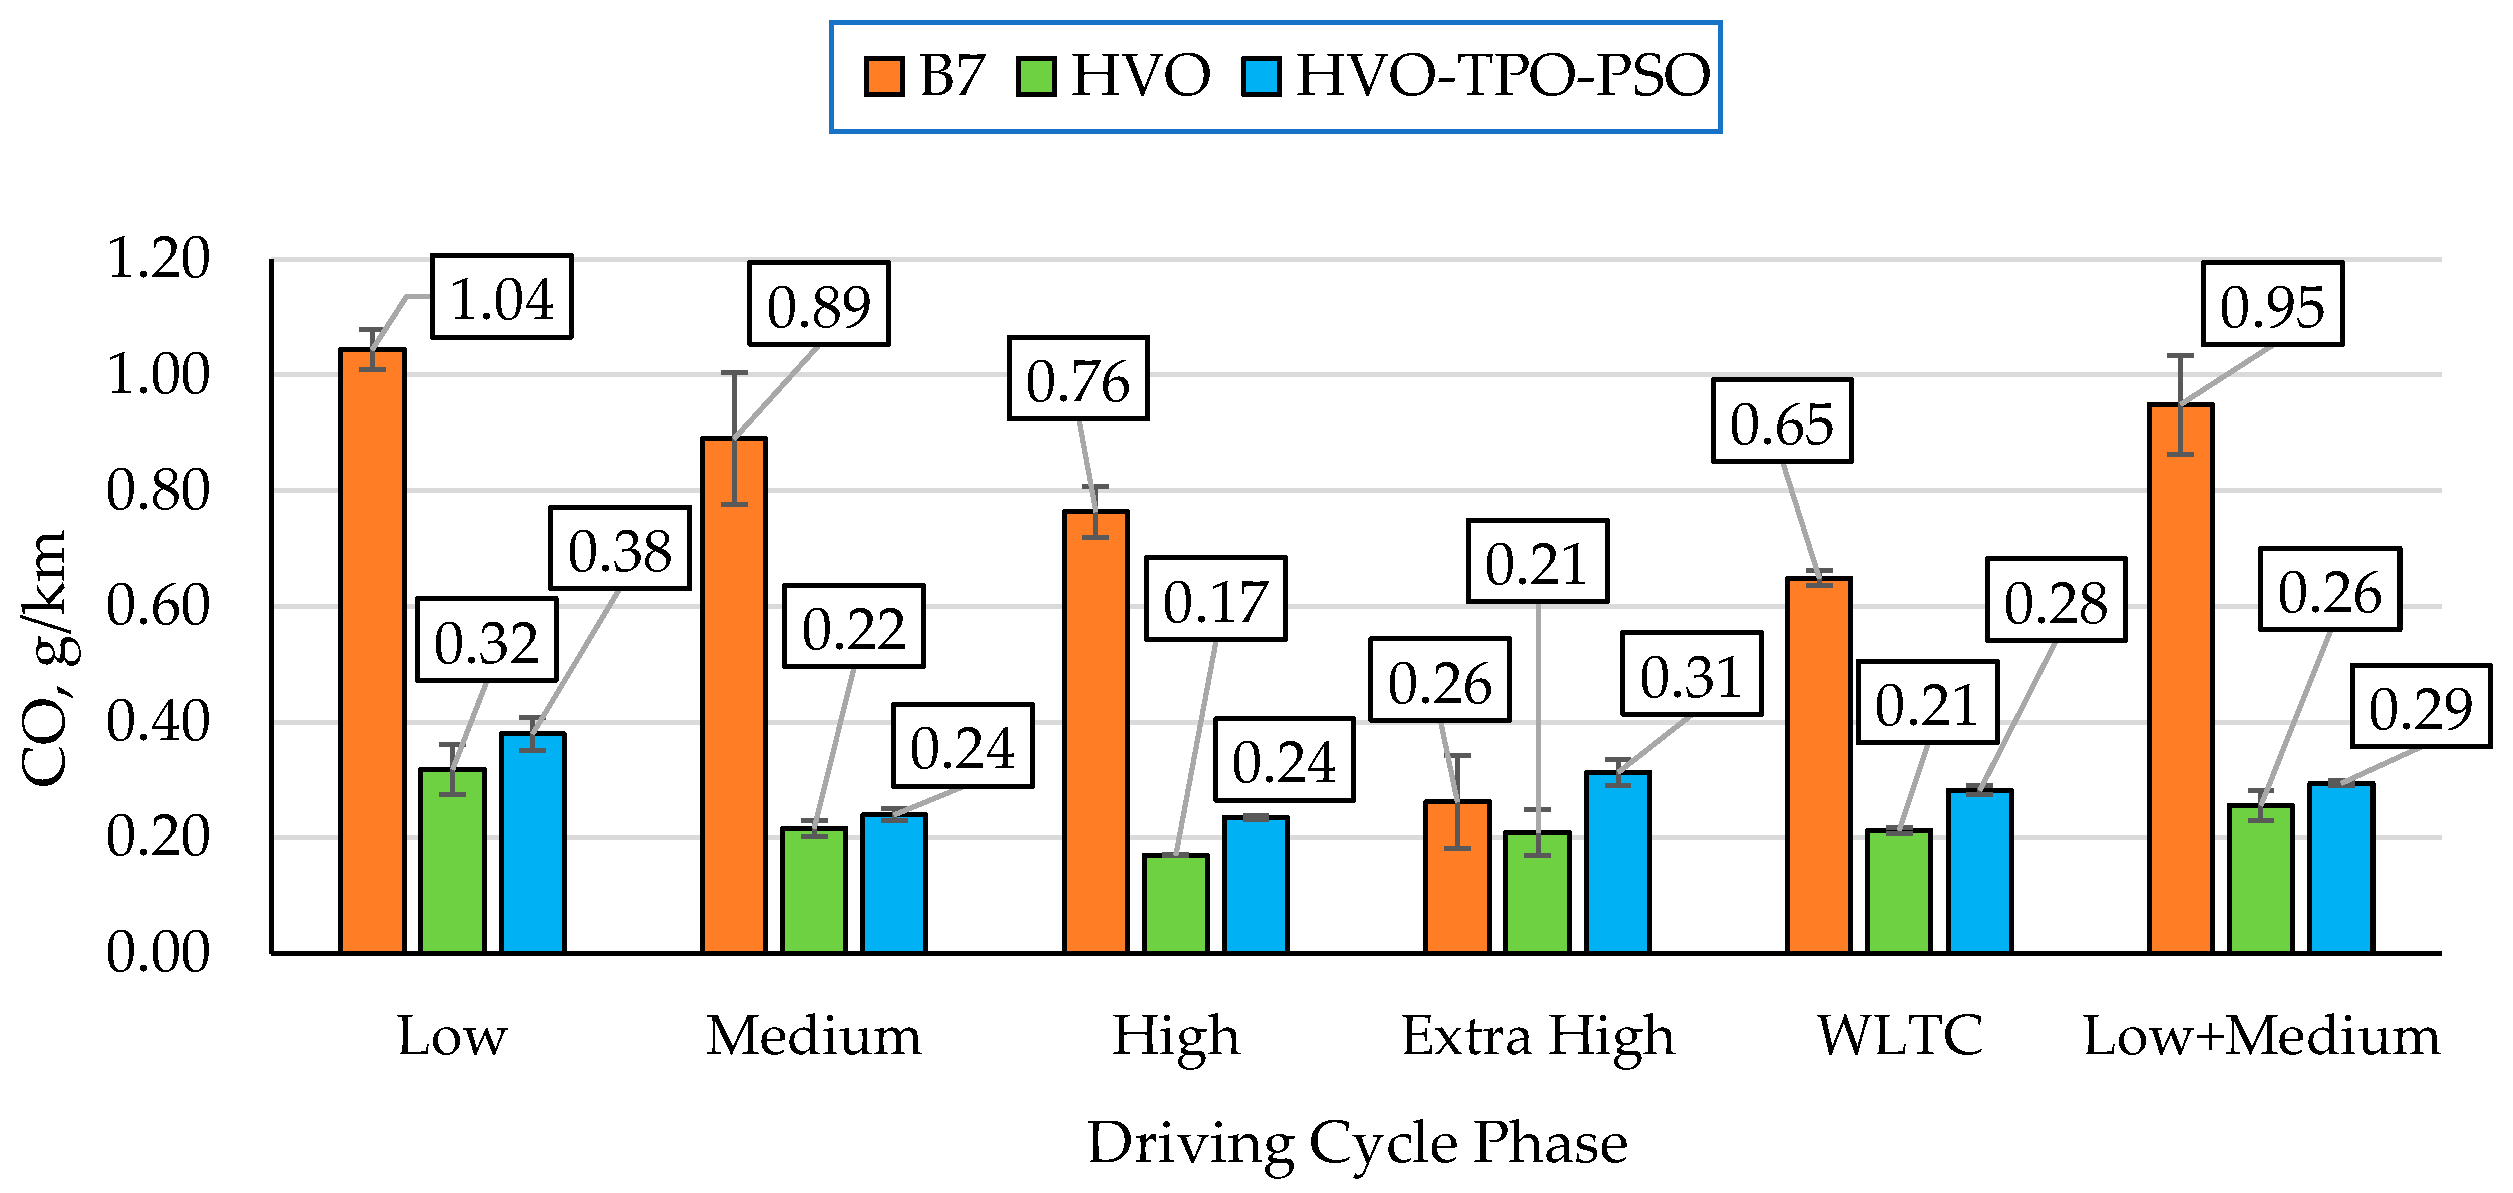
The instantaneous CO emission values expressed in g/s during the WLTC test cycle are presented in Figure 6, while the average CO emissions for the individual phases of the WLTC Class 3b cycle are shown in Figure 7. Similarly to the average CO2 emissions, fueling the engine with HVO resulted in lower CO emissions compared to fueling with the reference fuel B7. The changes in the instantaneous CO emissions (Figure 6) differed from those of CO2. For the instantaneous CO emissions, higher values were observed in the Medium and High phases, whereas for CO2 the highest emission levels occurred in the Extra High phase.
CO emissions were also lower when fueling the tested vehicle’s engine with the HVO–TPO–PSO blend. For the entire WLTC cycle, the average CO emission was approximately 0.65 g/km when fueled with B7, while the lowest average emission for the entire cycle, about 0.21 g/km, was achieved when using HVO. Fueling the engine with the HVO–TPO–PSO blend resulted in an average CO emission for the entire cycle of about 0.28 g/km. The highest average CO emissions occurred in the Low (urban) phase, amounting to approximately 1.04 g/km for B7, 0.32 g/km for HVO, and 0.38 g/km for the HVO–TPO–PSO blend. The reduction in CO emissions may have been caused by several factors related to the chemical and physical properties of HVO and its blend with pyrolytic oils compared to the reference fuel B7. HVO has a higher cetane number, resulting in shorter ignition delay and more complete combustion [11]. HVO, PSO, and TPO also contain fewer aromatic compounds, which are more difficult to burn completely and contribute to the formation of incomplete combustion products. Additionally, the simpler chemical structure of HVO and the presence of lighter and more volatile fractions in the pyrolytic oils facilitate fuel oxidation. Improved atomization and fuel–air mixing, resulting from the favorable physical properties of these fuels, also promote cleaner and more efficient combustion.

3.1.3. THC Emission

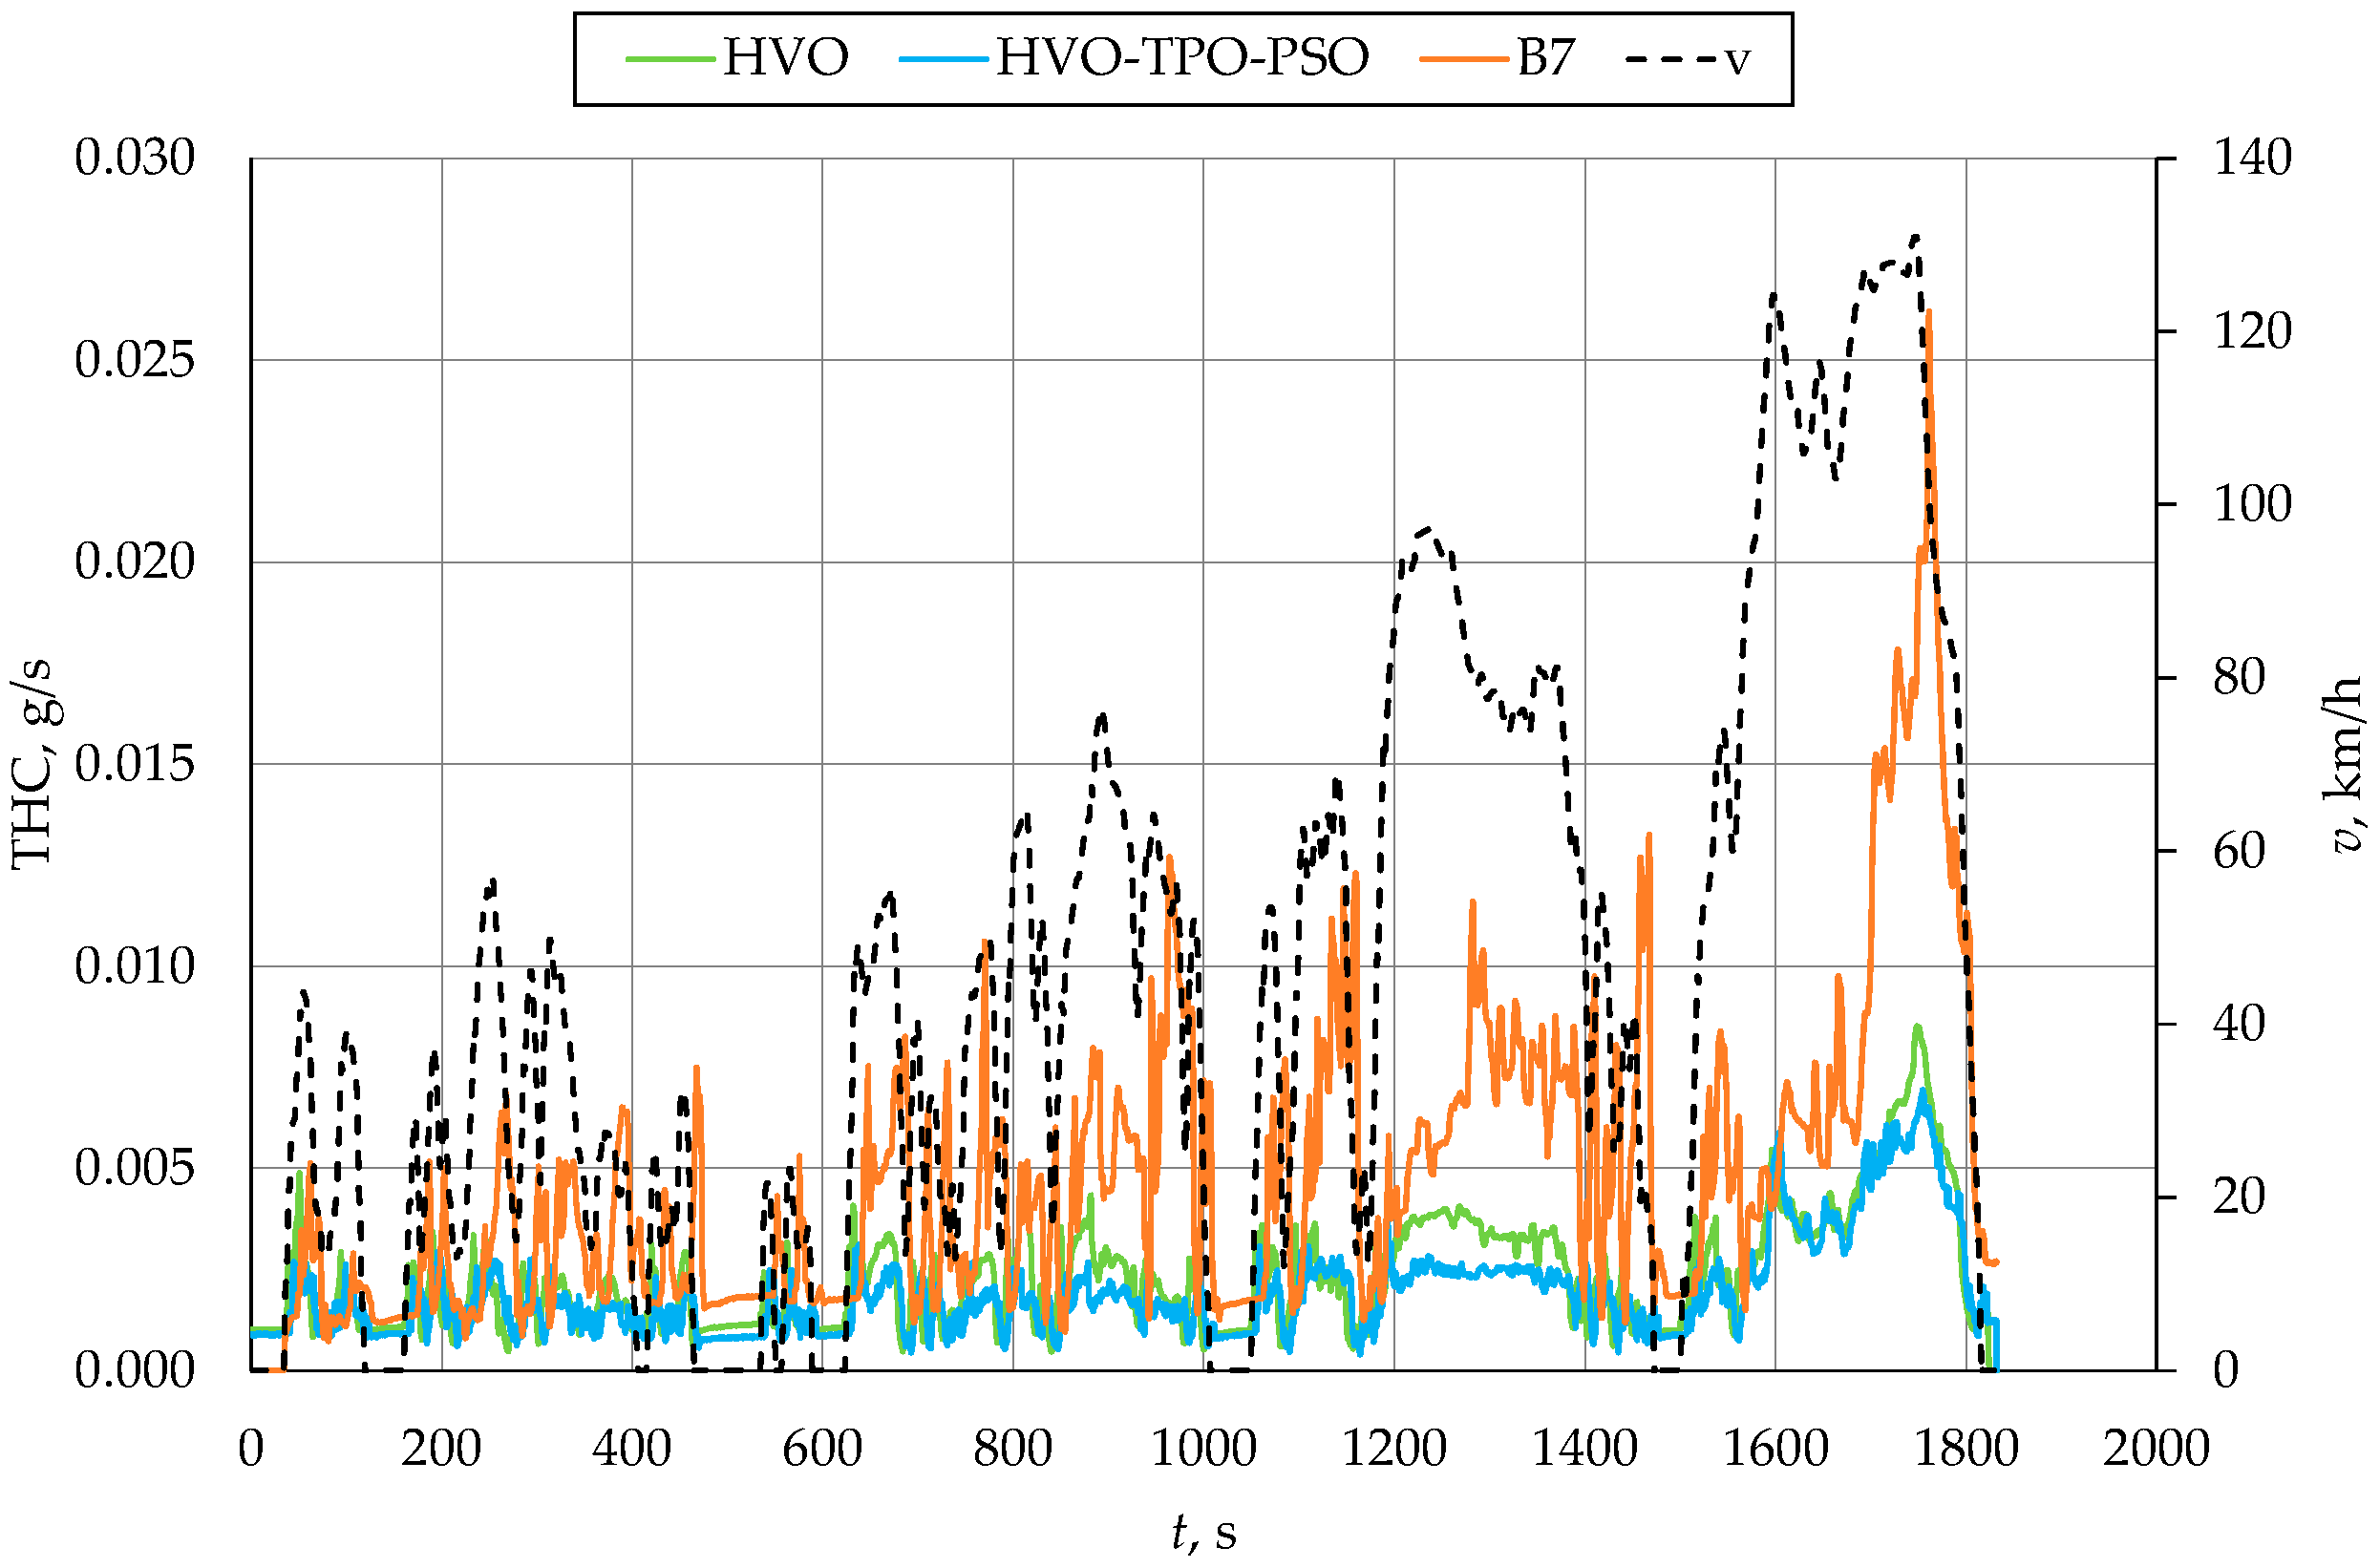
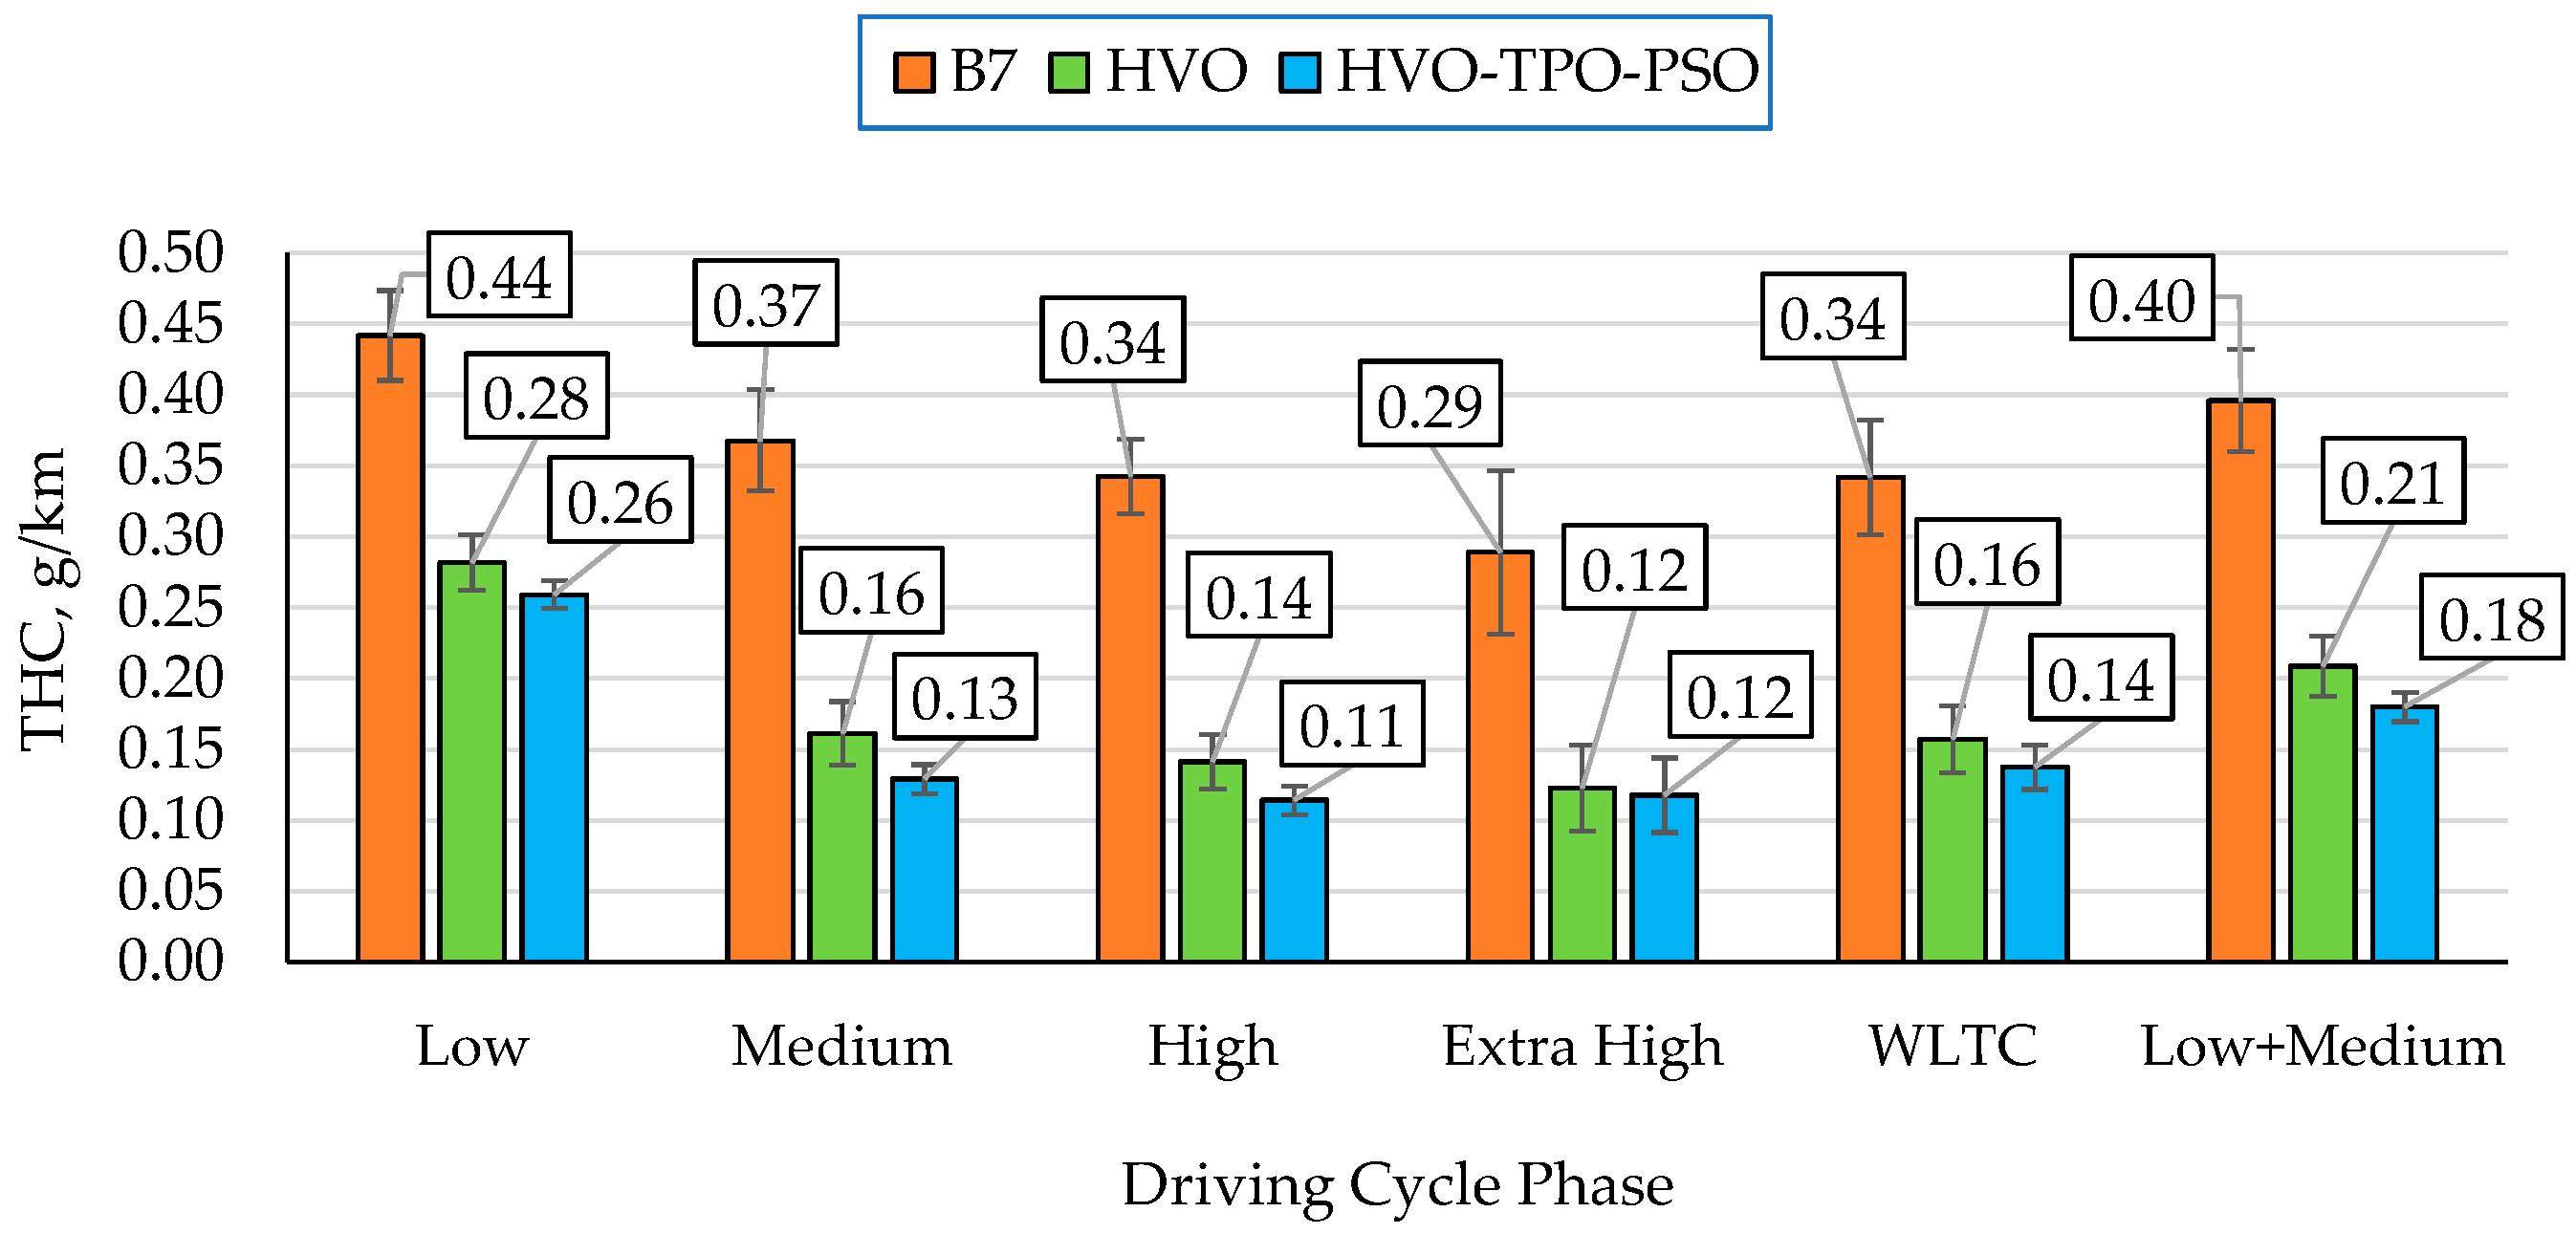
The instantaneous THC emission values are presented in Figure 8, while the average THC emissions for the individual phases of the WLTC Class 3b cycle are shown in Figure 9. It was evident that fueling the engine with waste-derived fuels (HVO, HVO–TPO–PSO) resulted in lower average hydrocarbon emissions compared to fueling with the reference fuel B7.
The reduction in THC emissions when fueling with HVO and its blend with TPO and PSO, compared to THC emission values when fueling with B7, may be attributed to similar factors as for carbon monoxide. In the case of HVO, its high cetane number (typically >70) results in a short ignition delay, enabling a faster and more controlled start of the combustion process. This combustion profile promotes more complete burning of the fuel–air mixture, which limits the formation of unburned hydrocarbons. Furthermore, the paraffinic chemical nature of HVO (mainly n-alkanes) and the absence of aromatic compounds and contaminants reduce the tendency for THC formation [56].

3.1.4. NOx Emission

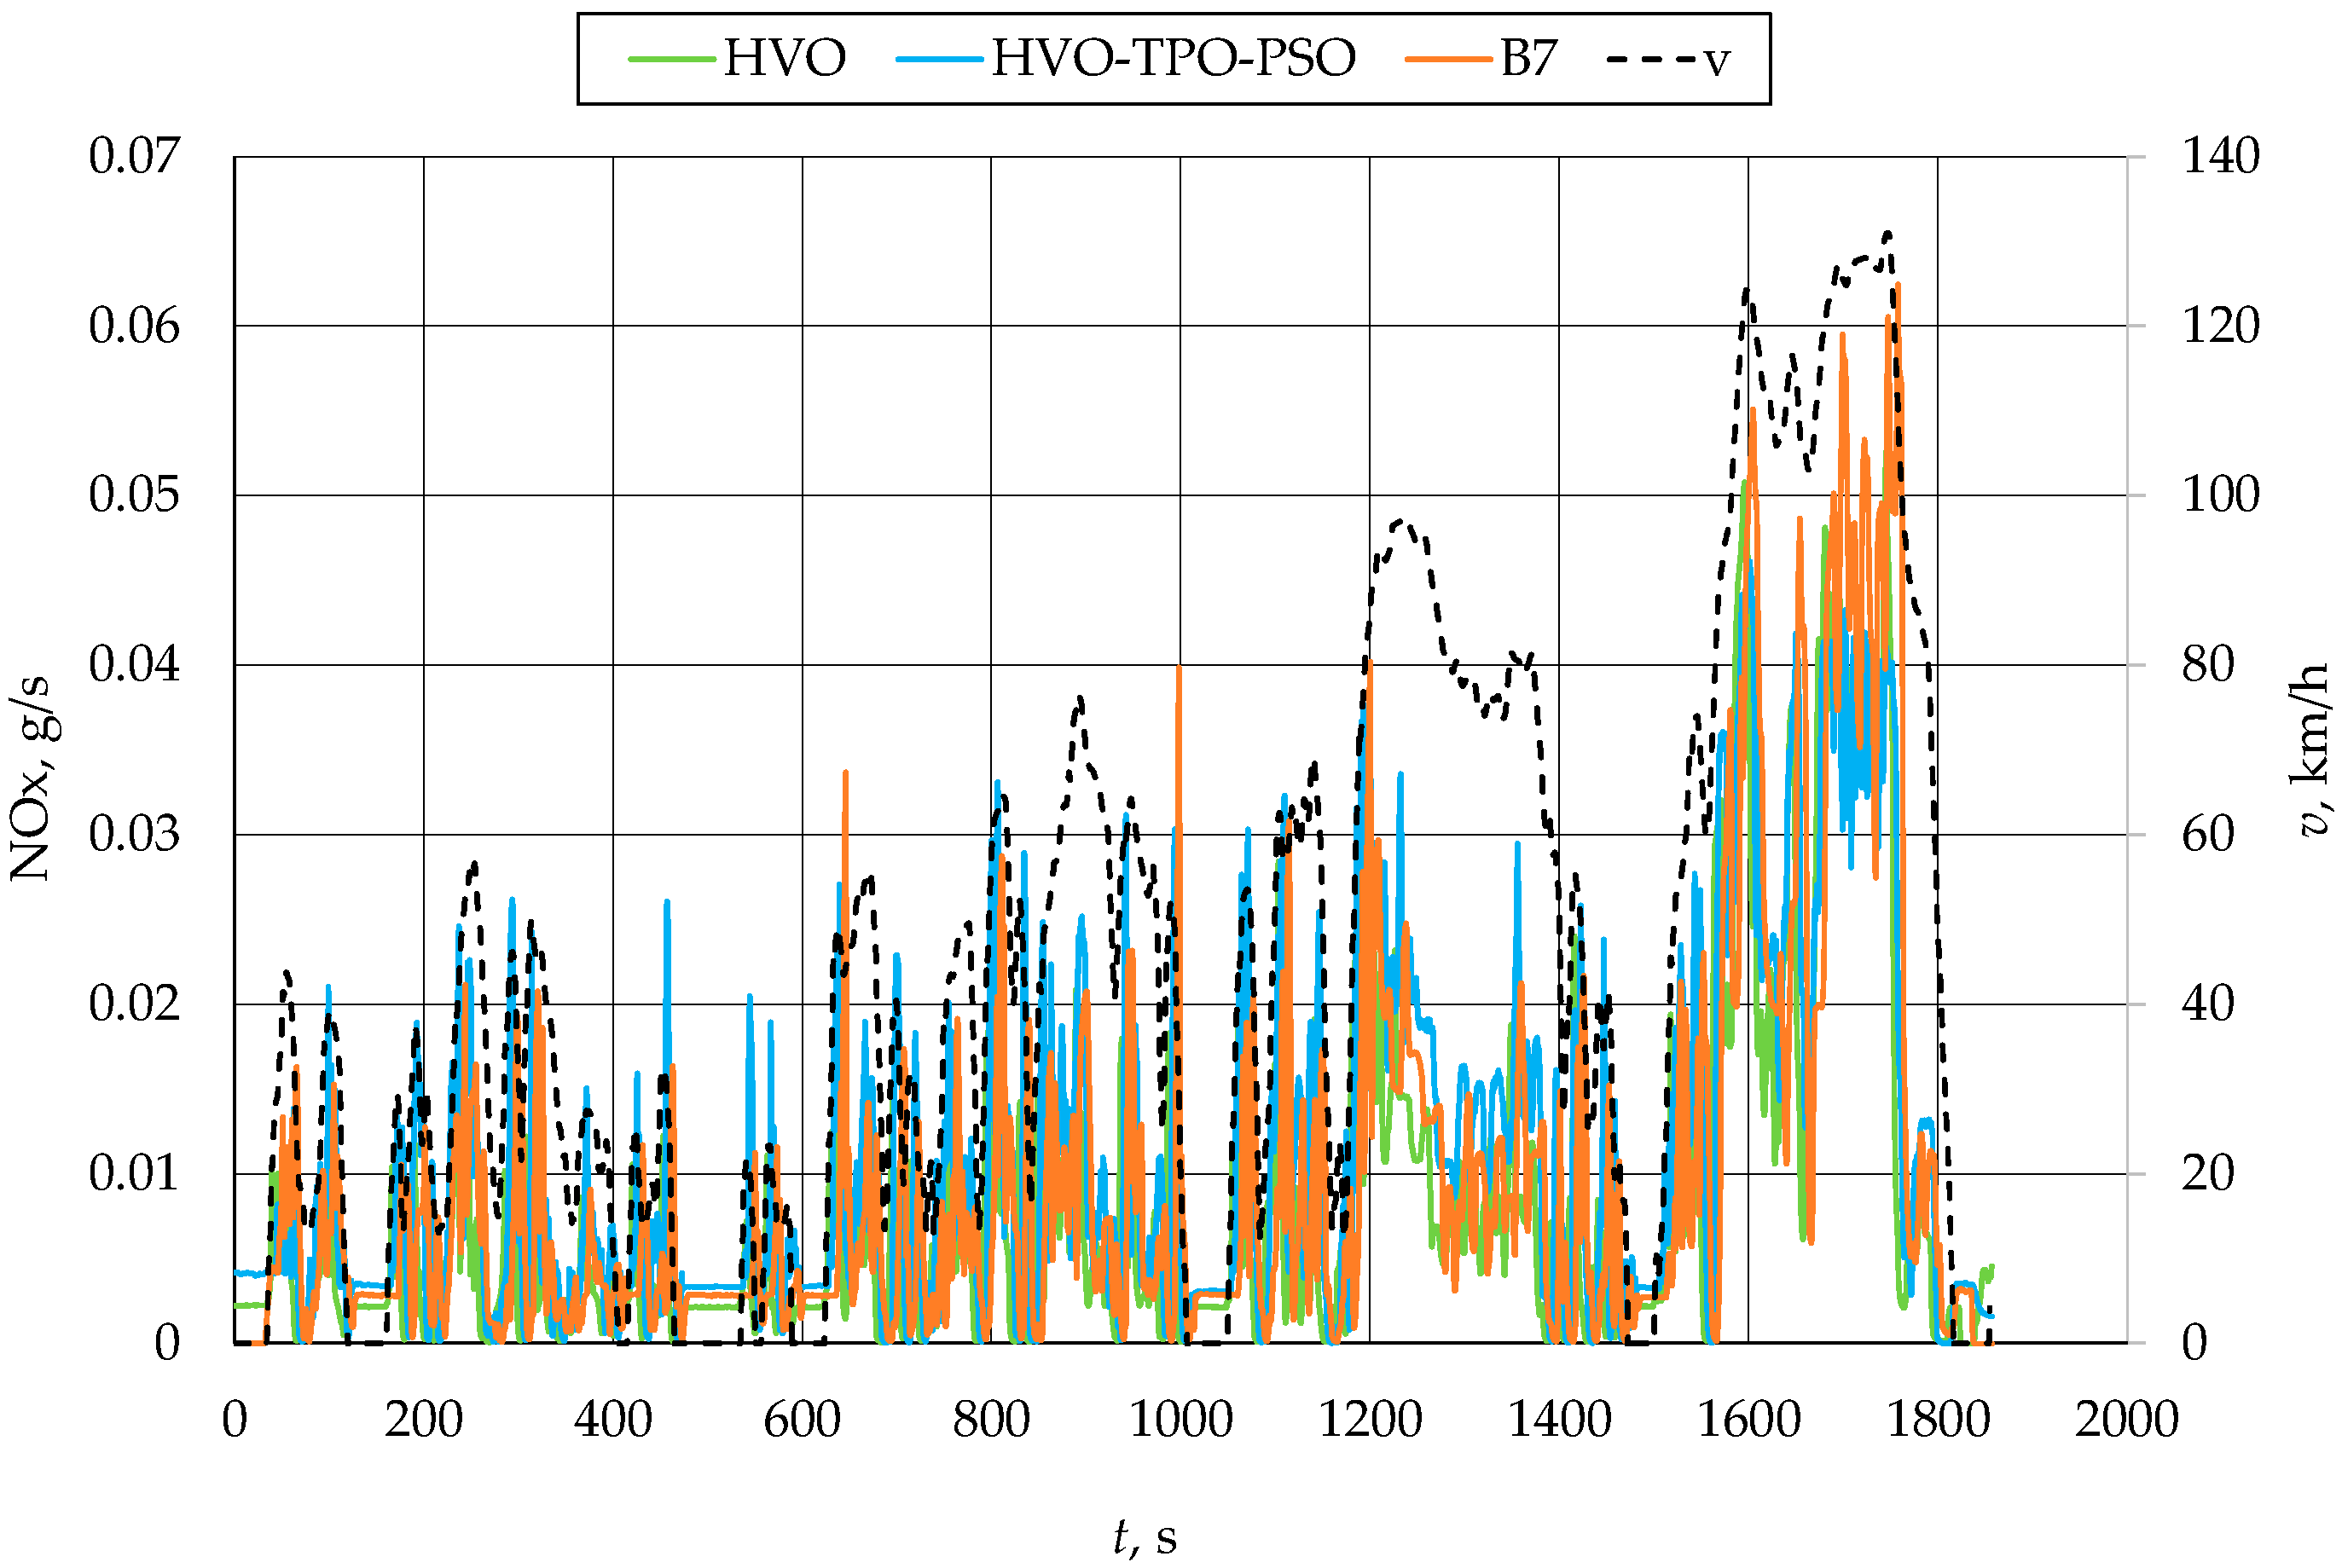
Figure 10 presents the instantaneous NOx emission values in the exhaust gas during the test cycles for the individual fuels. A higher emission level was visible for the Extra High phase, particularly when fueling with the reference fuel B7 and the HVO–TPO–PSO blend.
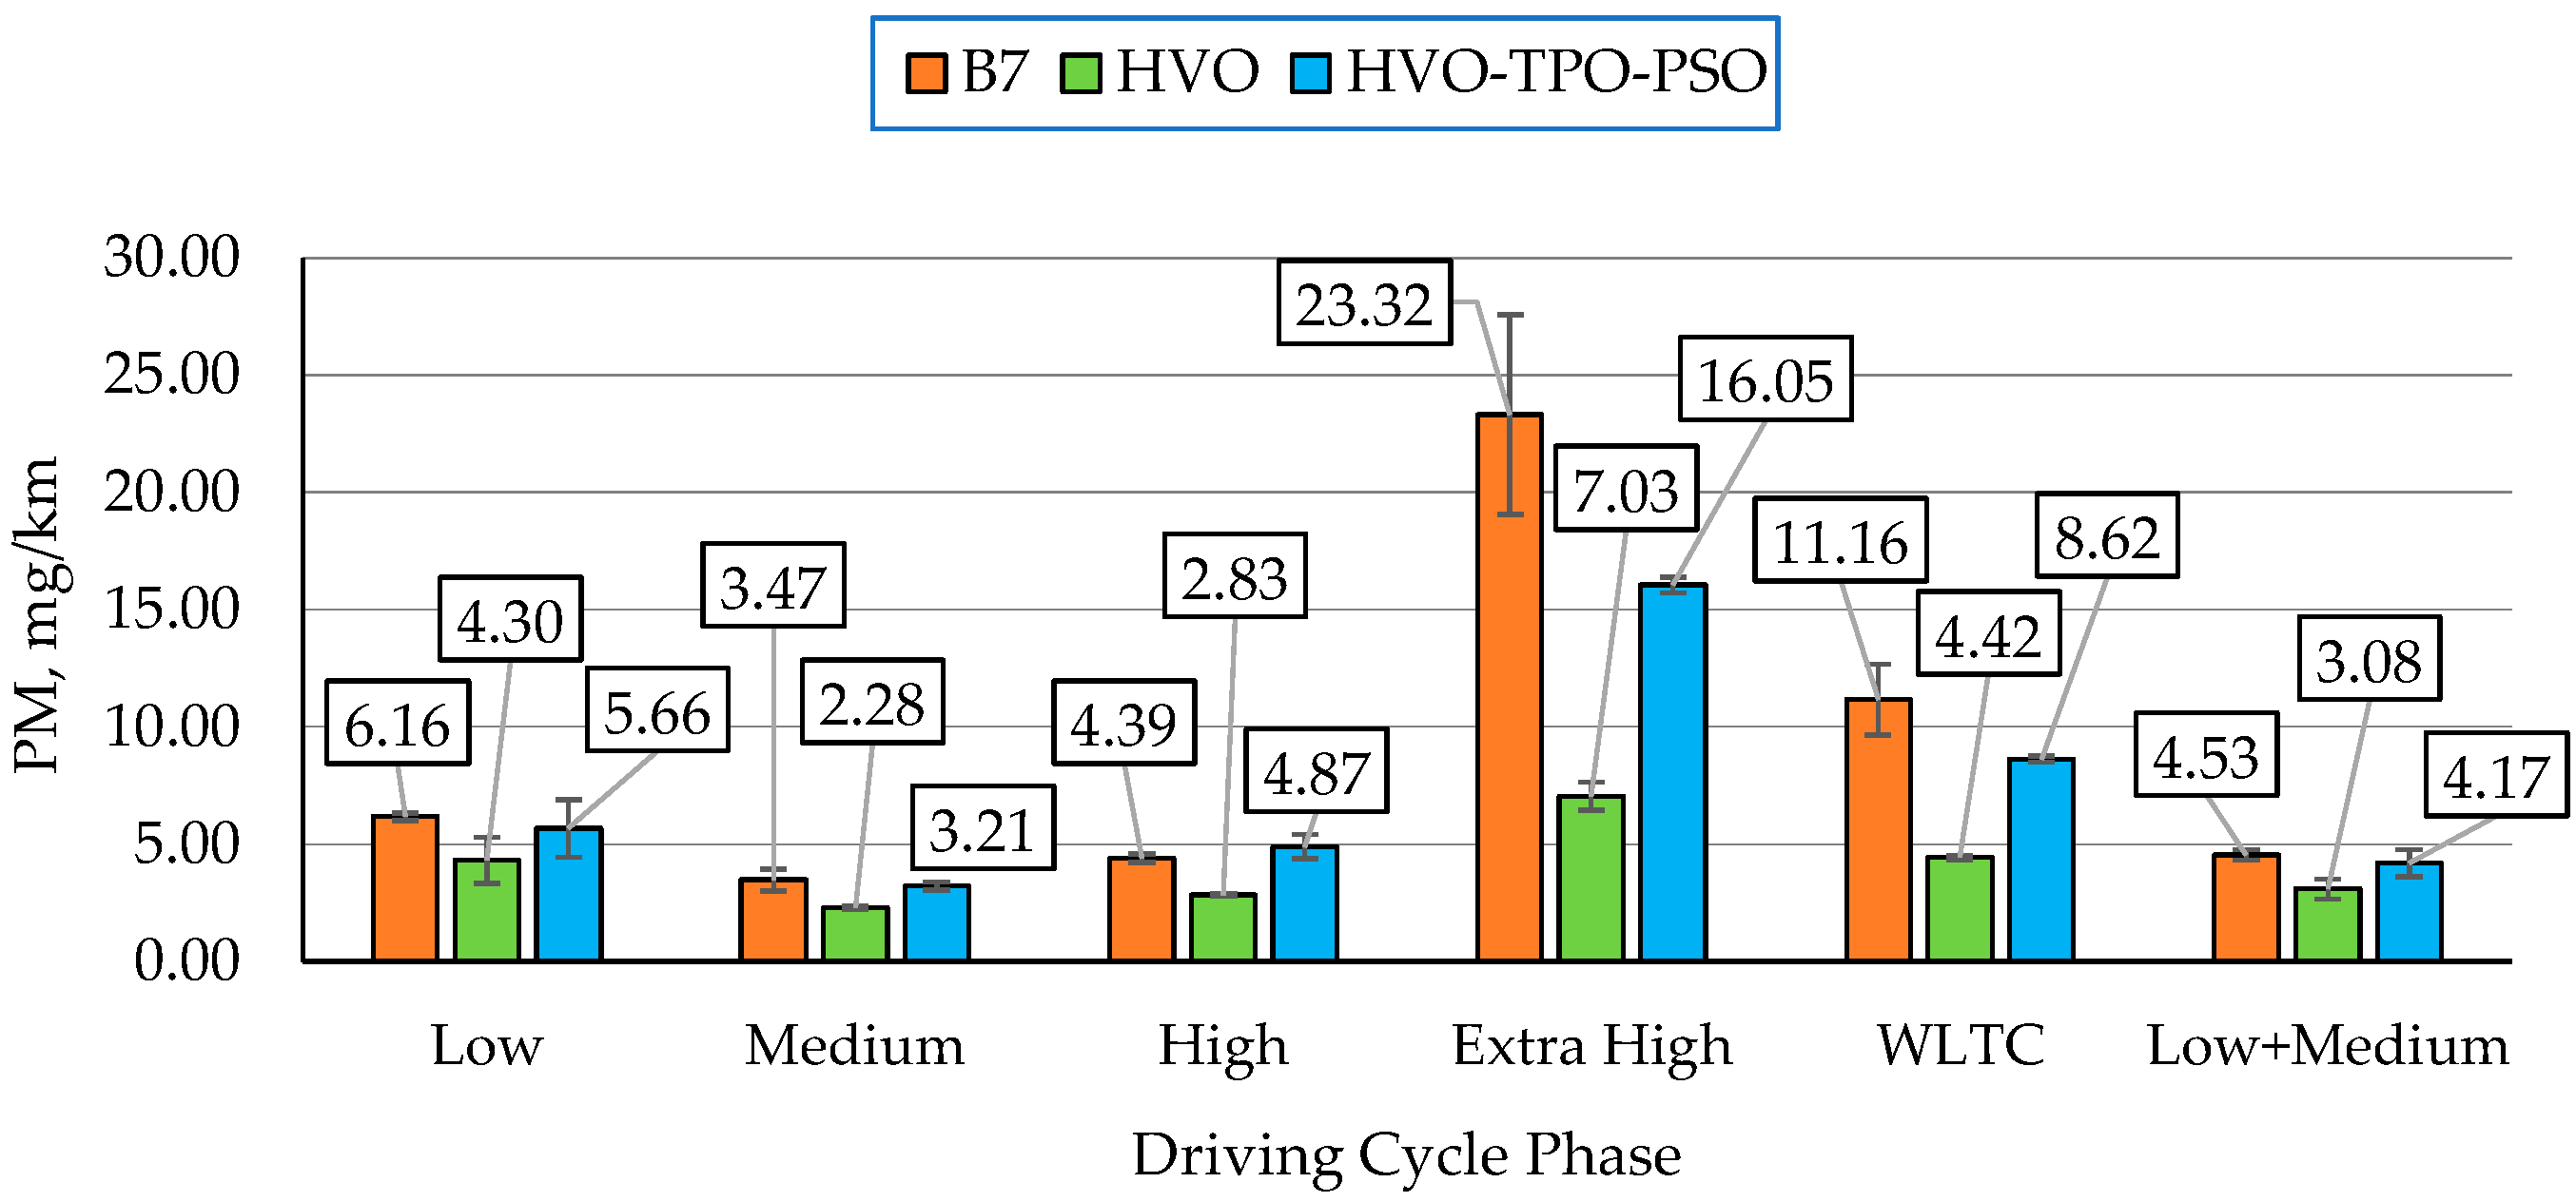
The average NOx emission values for the individual phases of the WLTC Class 3b cycle are presented in Figure 11. The average NOx emission over the entire WLTC Class 3b cycle was lower when fueling with HVO than when fueling with the reference fuel B7 [56]. The addition of TPO and PSO to HVO resulted in an increase in NOx emissions compared to fueling with B7. For HVO, the NOx emission reduction was approximately 15% lower for the urban phases of the test cycle (Low and Medium) and about 14% lower in the rural phase (High). In the Extra High phase, NOx emissions were comparable to those obtained when fueling with the reference fuel B7. For the entire WLTC cycle, NOx emissions were approximately 0.76 g/km for B7 and about 0.70 g/km for HVO (a decrease of about 8%). When fueling with the HVO–TPO–PSO blend, the average NOx emissions increased significantly, being about 36% higher than those for B7 in the urban and rural phases. In the Extra High phase, the average NOx emission for HVO–TPO–PSO was approximately 0.88 g/km, which was about 0.07 g/km lower than for B7 and HVO.
The reduction in NOx emissions when fueling the diesel engine with HVO may have resulted from changes in combustion conditions in the combustion chamber and differences in the chemical composition and physical properties of these fuels compared to the reference fuel B7. For the tested engine, this could have been attributed to improved fuel atomization and more uniform combustion (due to the low viscosity and high cetane number of HVO) [57,58], which reduced local temperature peaks and may have led to lower nitrogen oxide formation. In contrast, the addition of pyrolytic oils contributed to increased NOx emissions compared to fueling with B7. This may have been due to the presence of lighter fractions associated with faster and more intense combustion (increased combustion dynamics) [11]. Furthermore, it may have been related to lower viscosity and a lower ignition temperature (particularly in the case of PSO).
The more pronounced CO2 reduction observed for HVO in the low-speed (urban) phase can be attributed to frequent load and speed changes, where the high cetane number and favorable elemental composition of HVO promote efficient combustion. In turn, the greater increase in NOx emissions for the HVO–TPO–PSO blend is related to the presence of lighter fractions and aromatic compounds in the pyrolytic oils, which accelerate combustion under high load and temperature conditions, leading to more intense local temperature peaks and increased NOx formation.

3.1.5. PM Emission

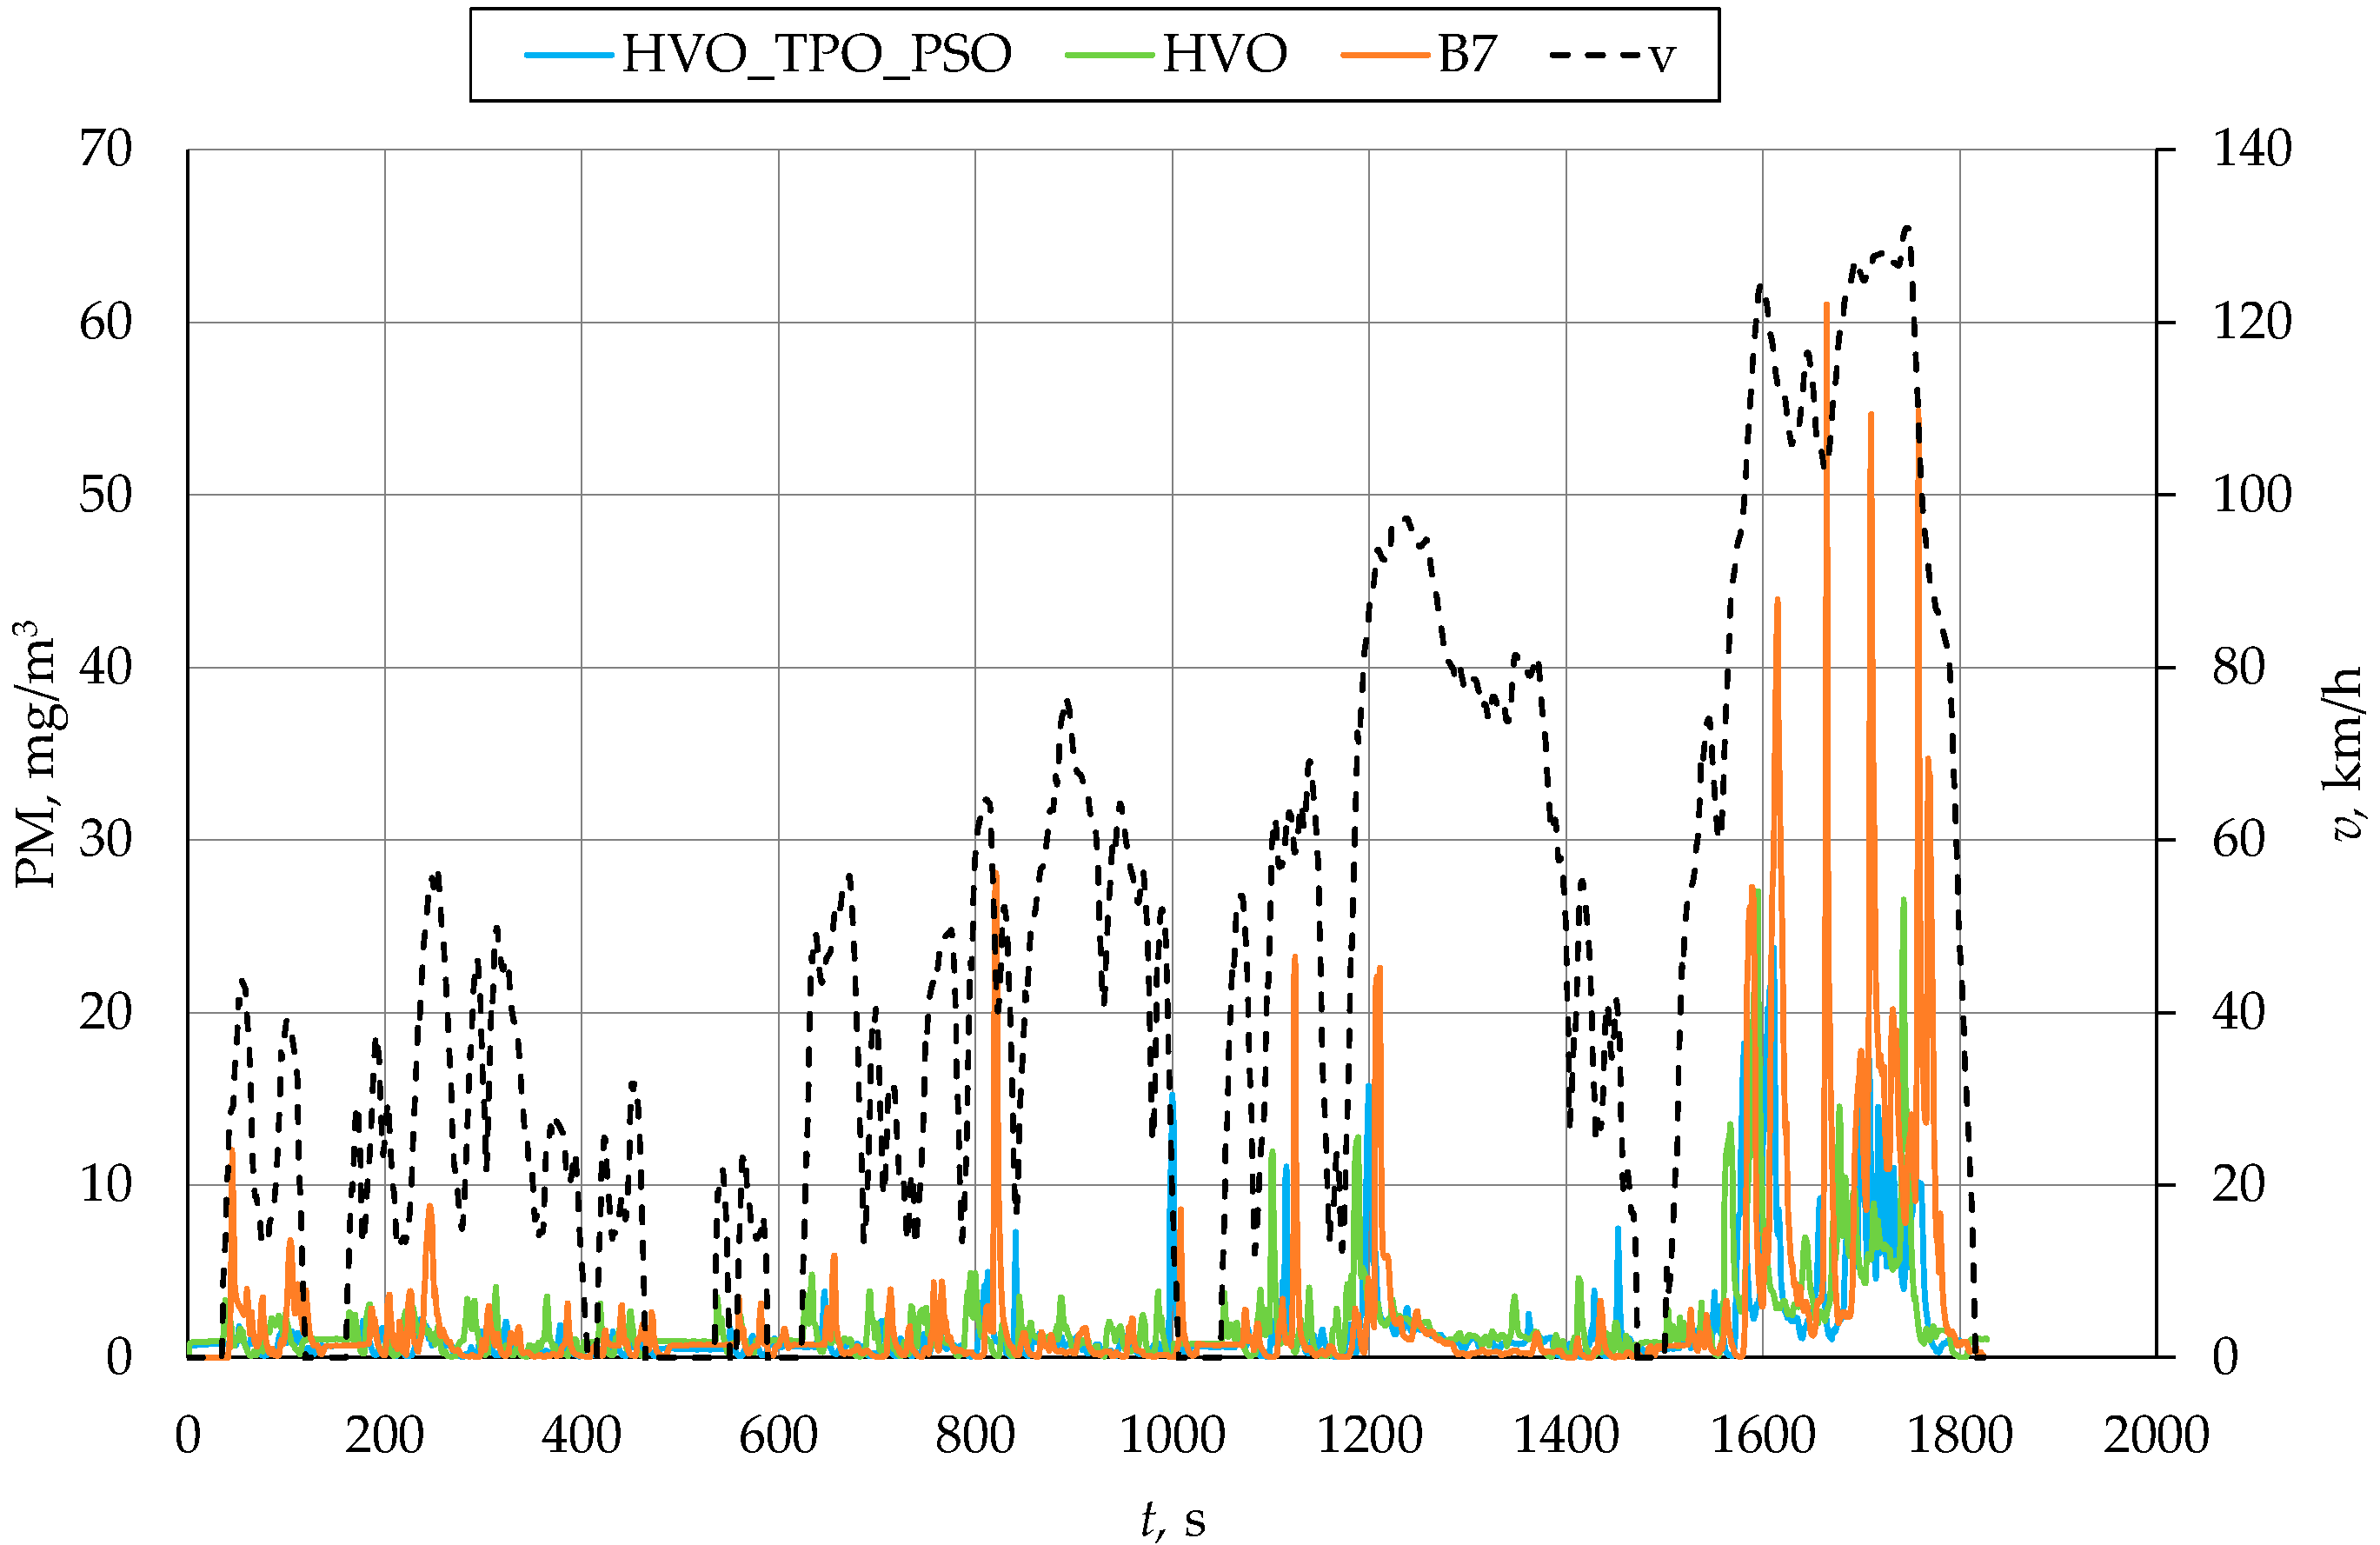
Figure 12 presents the instantaneous PM concentration values in diluted exhaust gas (for a dilution ratio of 2) during the test cycle for the individual fuels. Similarly to NOx emissions, a higher PM concentration level was visible for the Extra High phase when fueling with the reference fuel B7.
The average PM emission values for the individual phases of the WLTC Class 3b cycle are presented in Figure 13. The average PM emission when fueling the engine with HVO and HVO–TPO–PSO was lower than when fueling with B7. The addition of TPO and PSO to HVO resulted in a reduction in PM emissions compared to fueling with HVO alone. The low content of aromatic compounds and other impurities in HVO significantly limited PM formation. The paraffinic chemical structure of HVO [59] promoted complete and clean combustion, leading to reductions in average PM emissions of up to about 70% for the Extra High phase and about 60% for the entire WLTC cycle compared to B7. In addition, the better atomization of HVO and its higher cetane number accelerated autoignition, which improved combustion conditions and reduced particle formation [60]. The addition to HVO of oils derived from the pyrolysis of TPO and PSO, which may have contained higher amounts of aromatic compounds, polycyclic hydrocarbons, and impurities, contributed to increased PM emissions. In the High phase, PM emissions when fueling with the HVO–TPO–PSO blend were approximately 11% higher than the average emissions when fueling with B7. For the remaining phases, including the entire WLTC cycle, emissions were lower than when fueling with B7.

3.2. Fuel Consumption

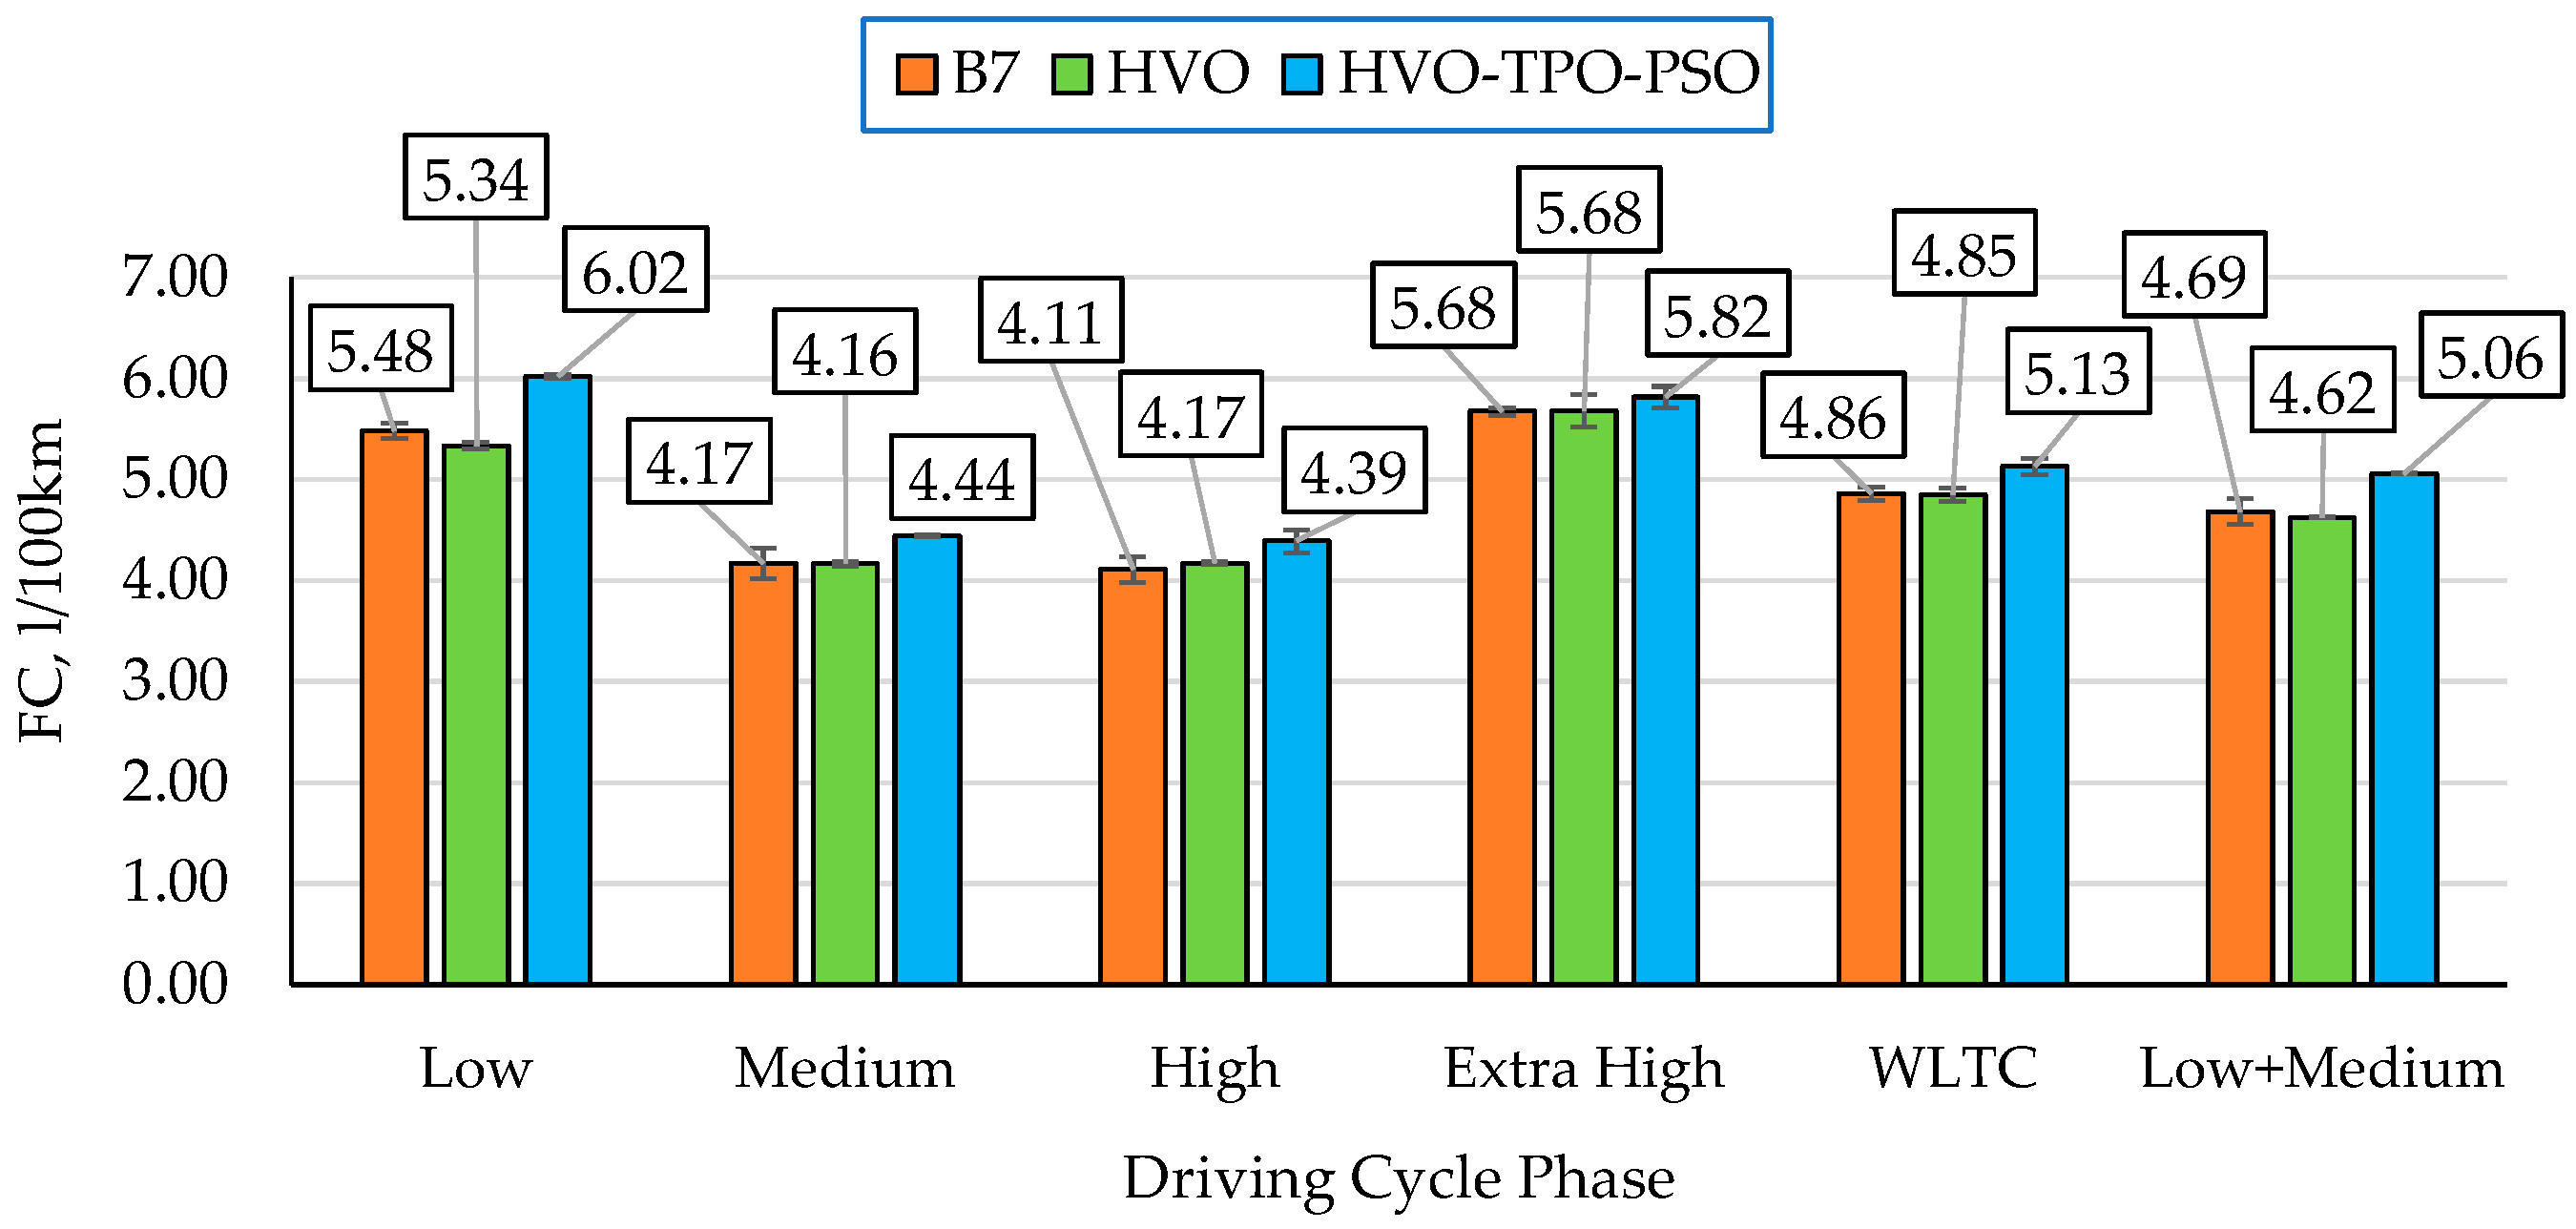
Based on the obtained exhaust emission values, the average distance-specific fuel consumption (FC) was calculated using the carbon balance method. The calculation results are presented in Figure 14.
When the engine was fueled with HVO, fuel consumption was comparable to that with the reference fuel B7. This could have been attributed to HVO’s higher cetane number and higher heating value, which, despite its lower density, ensured a more optimal combustion process [61]. The addition of TPO and PSO to HVO resulted in a slight increase in distance-specific fuel consumption, mainly due to the lower heating values of TPO and PSO (Table 2). Similar trends were reported in [62], where the addition of waste tire-derived fuel contributed to increased fuel consumption. The heating value of waste-derived fuels, as with renewable fuels, is often lower than that of diesel [63,64]. The largest difference was observed in the Low phase, where the average fuel consumption with HVO–TPO–PSO was approximately 6.02 L/100 km. In the Low phase, average fuel consumption was about 5.48 L/100 km for B7 and 5.34 L/100 km for HVO. Over the entire WLTC cycle, average fuel consumption with B7, HVO, and HVO–TPO–PSO was 4.86 L/100 km, 4.85 L/100 km, and 5.13 L/100 km, respectively.
The analysis of the results was limited to findings from other authors comparing DF with HVO. A lack of available studies comparing DF with HVO and its blends with PSO and TPO was identified, making this aspect a novel contribution of the present work. On this basis, it was concluded that the research gap had been addressed and the scientific objective achieved. Tests conducted on a diesel engine with a low-complexity control system using a chassis dynamometer equipped with the necessary measurement systems made it possible to demonstrate differences in emissions and fuel consumption when fueled with B7, HVO, and the HVO–TPO–PSO blend. The scientific contribution of this study lay in demonstrating the applicability of HVO–TPO–PSO blends in engine applications. Given the short duration of driving cycles, further assessment of applicability can only be performed through durability testing.

4. Conclusions

In response to the growing demand for fuels for diesel engines, continuous efforts are being made to identify suitable liquid fuel substitutes. Increasing attention is being given to fuels derived from waste materials of plant and animal origin, plastics, and scrap tires. With this in mind, tests were carried out to evaluate the emissions and fuel consumption of a CI engine on a chassis dynamometer under the WLTC 3b schedule using various fuels: diesel fuel B7 (reference fuel), HVO, and a blend consisting of 90% HVO, 5% TPO, and 5% PSO (HVO–TPO–PSO). The scientific objective was to compare the emissions of CO2, CO, THC, NOx, and PM, as well as fuel consumption. The conducted tests, calculations, and analyses made it possible to draw the following conclusions:
  • Replacing the reference fuel B7 with HVO resulted in a reduction of CO2, CO, THC, NOx, and PM emissions in all driving phases of the WLTC 3b cycle. The largest CO2 emission reduction (approximately 9%) was observed in the Low phase, while the smallest reduction (approximately 5%) occurred in the High phase. This effect was likely due to the high cetane number of HVO, its higher calorific value, and its lower carbon and aromatic content compared to B7, all of which promoted more efficient combustion.
  • The HVO–TPO–PSO blend exhibited higher CO2 and NOx emissions compared to pure HVO and, in some phases of the cycle, also relative to B7. This was attributed to the lower calorific values and higher aromatic content of TPO and PSO. Nevertheless, PM emissions for HVO–TPO–PSO were lower than for B7 in most driving phases, except for the High phase.
  • CO and THC emissions for both HVO and the HVO–TPO–PSO blend were lower than those for B7, with the lowest values obtained for HVO (approximately 0.21 g/km CO for the entire cycle). NOx emissions with HVO were about 22% lower over the entire cycle compared to B7. The HVO–TPO–PSO blend exhibited the highest NOx emissions among the tested fuels in all cycle phases, particularly in the Low phase.
  • The greatest reduction in PM emissions was achieved with HVO (approximately 70%) in the Extra High phase of the cycle and about 60% over the entire cycle compared to B7. The addition of TPO and PSO to HVO caused a slight increase in PM emissions relative to HVO; however, PM levels remained lower than those for B7.
  • Fuel consumption when using HVO was comparable to that of B7, whereas the HVO–TPO–PSO blend showed a slight increase, particularly in the Low phase of the cycle. This was likely due to the lower calorific value of the pyrolysis oils.
In summary, the study’s objective was achieved. HVO proved to be the most effective fuel in reducing all measured emissions without negatively affecting fuel consumption. The addition of small amounts of pyrolysis oils influenced the emission characteristics, increasing NOx and CO2 levels while reducing PM and CO emissions compared to B7. These findings confirmed the applicability of HVO–TPO–PSO blends in engine applications, although further durability testing is required in subsequent research stages. It should be emphasized that the increased NOx emissions observed for the HVO–TPO–PSO blend may limit its compliance with current stringent emission regulations (e.g., Euro 6). A detailed evaluation of legal and regulatory aspects is therefore necessary in future research aimed at the commercialization of waste-derived fuels. Future research should also focus on durability aspects, including the impact of long-term operation on injector wear, deposit formation, and the deterioration of lubricating oil when using waste-derived fuel blends.
In more modern engines equipped with advanced exhaust aftertreatment systems, such as diesel oxidation catalysts, diesel particulate filters, and selective catalytic reduction systems, the absolute emission levels would be significantly lower for all fuels; however, the relative differences observed in this study may still affect the efficiency and durability of these systems, for example, through changes in the frequency of diesel particulate filter regeneration or increased load on selective catalytic reduction systems.

Supplementary Materials

The following supporting information can be downloaded at https://www.mdpi.com/article/10.3390/en18185038/s1, Table S1. Technical specifications of the measurement equipment used in the study.

Author Contributions

Conceptualization, A.J., P.W., D.S. and M.S.G.; methodology, A.J., H.K., A.U. and K.B.; software, A.J., A.U. and K.B.; validation, A.J., D.S., H.K. and P.W.; formal analysis, D.S., M.J. and A.R.; investigation, A.J., H.K. and K.B.; resources, D.S., A.J., A.K., M.J., G.M., A.R. and A.B.; data curation, A.J. and K.B.; writing—original draft preparation, A.J., D.S., H.K., P.W., K.B., M.S.G., A.R., G.M. and A.B.; writing—review and editing, A.J., H.K., K.B., M.J., A.U., A.K. and D.S.; visualization, A.J.; supervision, A.J., D.S., P.W. and M.S.G. All authors have read and agreed to the published version of the manuscript.

Funding

The research leading to these results has received funding from the commissioned task entitled “Polytechnic Network VIA CARPATIA named after President of the Republic of Poland Lech Kaczynski”, financed by a special purpose grant from the Minister of Science and Higher Education contract no: MEiN/2022/DPI/2575, MEiN/2022/DPI/2577, MEiN/2022/DPI/2578, activity “ISKRA—building inter-university research teams”.

Institutional Review Board Statement

Not applicable.

Informed Consent Statement

Not applicable.

Data Availability Statement

The original contributions presented in this study are included in the article/Supplementary Material. Further inquiries can be directed to the corresponding author.

Conflicts of Interest

The authors declare no conflicts of interest.

Abbreviations

The following abbreviations are used in this manuscript:
HVOHydrotreated Vegetable Oil
WLTCWorldwide Harmonized Light Vehicles Test Cycle
CICompression Ignition
TPOTire Pyrolysis Oil
PSOPolystyrene Pyrolysis Oil
RDEReal Driving Emissions
CO2Carbon Dioxide
COCarbon Monoxide
THCTotal Hydrocarbons
NOxNitrogen Oxides
PMParticulate Matter
FAMEFatty Acid Methyl Esters
B7Diesel fuel containing up to 7% biodiesel (FAME)
GHGGreenhouse Gases
DFDiesel Fuel
PVOPure Vegetable Oil
DOCDiesel Oxidation Catalyst
SCRSelective Catalytic Reduction
POBPalm Oil Biodiesel
OMEOligomeric Methyl Ethers
GTLGas-to-liquids
HDPEHigh-Density Polyethylene
PPPolypropylene
PSPolystyrene
WPPOWaste Plastic Pyrolysis Oil
BSFCBrake Specific Fuel Consumption
HCHydrocarbons
NEDCNew European Driving Cycle
UDDSUrban Dynamometer Driving Schedule
HHDDTHeavy Heavy-Duty Diesel Truck
NMHCNon-Methane Hydrocarbons
CH4Methane
CARBCalifornia Air Resources Board
ULSDUltra-Low Sulfur Diesel
HCKHydrocracking
WLTPWorldwide Harmonized Light Vehicles Test Procedure
B0Diesel fuel with 0% biodiesel
B7Diesel fuel with 7% biodiesel
B15Diesel fuel with 15% biodiesel
HHVHigher Heating Value
CFPPCold Filter Plugging Point
FCFuel Consumption
HVO–TPO–PSOFuel containing 90% HVO, 5% TPO, and 5% PSO (by volume)
FIVfuel inlet valve
FOVfuel outlet valve
FVflush valve
vSpeed
aAcceleration
dDistance
rdDilution ratio
qmew,iExhaust mass flow rate at time i
egasMass emission rate of an exhaust gas component
ρgasDensity of the exhaust gas component in g/L under standard conditions
ciSoot concentration in the exhaust gas at time i
ρoDensity of the exhaust gas under standard conditions
ΔtiSampling interval

References

  1. Clairotte, M.; Suarez-Bertoa, R.; Zardini, A.A.; Giechaskiel, B.; Pavlovic, J.; Valverde, V.; Ciuffo, B.; Astorga, C. Exhaust emission factors of greenhouse gases (GHGs) from European road vehicles. Environ. Sci. Eur. 2020, 32, 125. [Google Scholar] [CrossRef]
  2. European Economic and Social Committee. Opinion European Economic and Social Committee CO2 Performance Standards/New Cars; European Economic and Social Committee: Brussels, Belgium, 2022. Available online: https://dm-publicapi.eesc.europa.eu/v1/documents/EESC-2021-04839-00-01-AC-TRA-EN.docx/content (accessed on 15 May 2025).
  3. Diouf, B. The electric vehicle transition. Environ. Sci. Adv. 2024, 3, 332–345. [Google Scholar] [CrossRef]
  4. ExxonMobil Energy Demand: Global Outlook. All Energy Types Will Be Needed| ExxonMobil. Available online: https://corporate.exxonmobil.com/sustainability-and-reports/global-outlook/all-energy-types-are-needed (accessed on 15 May 2025).
  5. Koszalka, G.; Hunicz, J. Comparative study of energy losses related to the ring pack operation in homogeneous charge compression ignition and spark ignition combustion. Energy 2021, 235, 121388. [Google Scholar] [CrossRef]
  6. British Petroleum. The Energy Outlook Explores the Forces Shaping the Global Energy Transition out to 2040 and the Key Uncertainties Surrounding That Transition; BP Energy Outlook 2019 Edition; BP Energy Outlook 2019; Brunel International NV: Amsterdam, The Netherlands, 2019; pp. 22–24, 72–76, 144, 118. [Google Scholar]
  7. Bezergianni, S.; Dimitriadis, A. Comparison between different types of renewable diesel. Renew. Sustain. Energy Rev. 2013, 21, 110–116. [Google Scholar] [CrossRef]
  8. Chiaramonti, D.; Prussi, M. Pure vegetable oil for energy and transport. Int. J. Oil Gas Coal Technol. 2009, 2, 186–198. [Google Scholar] [CrossRef]
  9. Vásquez, M.C.; Silva, E.E.; Castillo, E.F. Hydrotreatment of vegetable oils: A review of the technologies and its developments for jet biofuel production. Biomass Bioenergy 2017, 105, 197–206. [Google Scholar] [CrossRef]
  10. Aatola, H.; Larmi, M.; Sarjovaara, T.; Mikkonen, S. Hydrotreated vegetable Oil (HVO) as a renewable diesel fuel: Trade-off between NOx, particulate emission, and fuel consumption of a heavy duty engine. SAE Int. J. Engines 2009, 1, 1251–1262. [Google Scholar] [CrossRef]
  11. Hunicz, J.; Yang, L.; Rybak, A.; Ji, S.; Gęca, M.S.; Mikulski, M. Comparison of diesel and hydrotreated vegetable oil as the high-reactivity fuel in reactivity-controlled compression ignition. Energy Convers. Manag. 2025, 323, 119264. [Google Scholar] [CrossRef]
  12. Hunicz, J.; Matijošius, J.; Rimkus, A.; Kilikevičius, A.; Kordos, P.; Mikulski, M. Efficient hydrotreated vegetable oil combustion under partially premixed conditions with heavy exhaust gas recirculation. Fuel 2020, 268, 117350. [Google Scholar] [CrossRef]
  13. Prokopowicz, A.; Zaciera, M.; Sobczak, A.; Bielaczyc, P.; Woodburn, J. The Effects of Neat Biodiesel and Biodiesel and HVO Blends in Diesel Fuel on Exhaust Emissions from a Light Duty Vehicle with a Diesel Engine. Environ. Sci. Technol. 2015, 49, 7473–7482. [Google Scholar] [CrossRef]
  14. Bortel, I.; Vávra, J.; Takáts, M. Effect of HVO fuel mixtures on emissions and performance of a passenger car size diesel engine. Renew. Energy 2019, 140, 680–691. [Google Scholar] [CrossRef]
  15. Millo, F.; Jafari, M.J.; Piano, A.; Postrioti, L.; Brizi, G.; Vassallo, A.; Pesce, F.; Fittavolini, C. A fundamental study of injection and combustion characteristics of neat Hydrotreated Vegetable Oil (HVO) as a fuel for light-duty diesel engines. Fuel 2025, 379, 132951. [Google Scholar] [CrossRef]
  16. Pirjola, L.; Rönkkö, T.; Saukko, E.; Parviainen, H.; Malinen, A.; Alanen, J.; Saveljeff, H. Exhaust emissions of non-road mobile machine: Real-world and laboratory studies with diesel and HVO fuels. Fuel 2017, 202, 154–164. [Google Scholar] [CrossRef]
  17. Kuszewski, H.; Jaworski, A.; Mądziel, M. Lubricity of Ethanol–Diesel Fuel Blends—Study with the Four-Ball Machine Method. Materials 2021, 14, 2492. [Google Scholar] [CrossRef]
  18. Huynh, K.K.; Pham, S.T.; Tieu, K.A.; Wan, S. Tribocatalysis Induced Carbon-Based Tribofilms—An Emerging Tribological Approach for Sustainable Lubrications. Lubricants 2023, 11, 327. [Google Scholar] [CrossRef]
  19. Parravicini, M.; Barro, C.; Boulouchos, K. Experimental characterization of GTL, HVO, and OME based alternative fuels for diesel engines. Fuel 2021, 292, 120177. [Google Scholar] [CrossRef]
  20. Kumar, J.S.; Bapu, B.R.R.; Sivasaravanan, S.; Prabhu, M.; Kumar, S.M.; Abubacker, M.A. Experimental studies on emission reduction in a DI diesel engine by using a nano catalyst coated catalytic converter. Int. J. Ambient Energy 2019, 43, 1241–1247. [Google Scholar] [CrossRef]
  21. Mirkarimi, S.M.R.; Bensaid, S.; Chiaramonti, D. Conversion of mixed waste plastic into fuel for diesel engines through pyrolysis process: A review. Appl. Energy 2022, 327, 120040. [Google Scholar] [CrossRef]
  22. Faisal, F.; Rasul, M.G.; Ahmed Chowdhury, A.; Schaller, D.; Jahirul, M.I. Uncovering the differences: A comparison of properties of crude plastic pyrolytic oil and distilled and hydrotreated plastic diesel produced from waste and virgin plastics as automobile fuels. Fuel 2023, 350, 128743. [Google Scholar] [CrossRef]
  23. Zheng, Q.; Li, Z.; Watanabe, M. Production of solid fuels by hydrothermal treatment of wastes of biomass, plastic, and biomass/plastic mixtures: A review. J. Bioresour. Bioprod. 2022, 7, 221–244. [Google Scholar] [CrossRef]
  24. Ferdoush, M.R.; Aziz, R.A.; Karmaker, C.L.; Debnath, B.; Limon, M.H.; Bari, A.B.M.M. Unraveling the challenges of waste-to-energy transition in emerging economies: Implications for sustainability. Innov. Green Dev. 2024, 3, 100121. [Google Scholar] [CrossRef]
  25. Bayramoğlu, K.; Nuran, M. Energy, exergy, sustainability evaluation of the usage of pyrolytic oil and conventional fuels in diesel engines. Process Saf. Environ. Prot. 2024, 181, 324–333. [Google Scholar] [CrossRef]
  26. Bodisco, T.A.; Rahman, S.M.A.; Hossain, F.M.; Brown, R.J. On-road NOx emissions of a modern commercial light-duty diesel vehicle using a blend of tyre oil and diesel. Energy Rep. 2019, 5, 349–356. [Google Scholar] [CrossRef]
  27. Yaqoob, H.; Tan, E.S.; Ali, H.M.; Ong, H.C.; Jamil, M.A.; Farooq, M.U. Sustainable energy generation from plastic waste: An in-depth review of diesel engine application. Environ. Technol. Innov. 2024, 34, 103467. [Google Scholar] [CrossRef]
  28. Januszewicz, K.; Hunicz, J.; Kazimierski, P.; Rybak, A.; Suchocki, T.; Duda, K.; Mikulski, M. An experimental assessment on a diesel engine powered by blends of waste-plastic-derived pyrolysis oil with diesel. Energy 2023, 281, 128330. [Google Scholar] [CrossRef]
  29. Mikulski, M.; Ambrosewicz-Walacik, M.; Hunicz, J.; Nitkiewicz, S. Combustion engine applications of waste tyre pyrolytic oil. Prog. Energy Combust. Sci. 2021, 85, 100915. [Google Scholar] [CrossRef]
  30. Mustayen, A.G.M.B.; Rasul, M.G.; Wang, X.; Hazrat, M.A.; Islam, M.J.; Negnevitsky, M. Plastic-made diesel (PMD) from pyrolysis via vacuum distillation process—A waste recycling fuel to diesel engine performance and emissions improvement. J. Energy Inst. 2023, 107, 101198. [Google Scholar] [CrossRef]
  31. Kumar, R.; Mishra, M.K.; Roy, M.K. Effects of Hexane Addition in Waste Plastic Fuel-Biodiesel-Diesel Blends on the Performance and Emission Characteristics of DI Diesel Engine. Automot. Exp. 2022, 5, 416–432. [Google Scholar] [CrossRef]
  32. Sharma, B.K.; Moser, B.R.; Vermillion, K.E.; Doll, K.M.; Rajagopalan, N. Production, characterization and fuel properties of alternative diesel fuel from pyrolysis of waste plastic grocery bags. Fuel Process. Technol. 2014, 122, 79–90. [Google Scholar] [CrossRef]
  33. Sunaryo, S.; Sesotyo, P.A.; Saputra, E.; Sasmito, A.P. Performance and fuel consumption of diesel engine fueled by diesel fuel and waste plastic oil blends: An experimental investigation. Automot. Exp. 2021, 4, 20–26. [Google Scholar] [CrossRef]
  34. Mohan, R.K.; Sarojini, J.; Rajak, U.; Verma, T.N.; Ağbulut, Ü. Alternative fuel production from waste plastics and their usability in light duty diesel engine: Combustion, energy, and environmental analysis. Energy 2023, 265, 126140. [Google Scholar] [CrossRef]
  35. Muthukumar, K.; Kasiraman, G. Utilization of fuel energy from single-use Low-density polyethylene plastic waste on CI engine with hydrogen enrichment—An experimental study. Energy 2024, 289, 129926. [Google Scholar] [CrossRef]
  36. Armas, O.; García-Contreras, R.; Ramos, Á.; López, A.F. Impact of Animal Fat Biodiesel, GTL, and HVO Fuels on Combustion, Performance, and Pollutant Emissions of a Light-Duty Diesel Vehicle Tested under the NEDC. J. Energy Eng. 2015, 141, C4014009. [Google Scholar] [CrossRef]
  37. Karavalakis, G.; Jiang, Y.; Yang, J.; Durbin, T.; Nuottimäki, J.; Lehto, K. Emissions and Fuel Economy Evaluation from Two Current Technology Heavy-Duty Trucks Operated on HVO and FAME Blends. SAE Int. J. Fuels Lubr. 2016, 9, 177–190. [Google Scholar] [CrossRef]
  38. Birzietis, G.; Pirs, V.; Dukulis, I.; Gailis, M. Effect of commercial diesel fuel and hydrotreated vegetable oil blend on automobile performance. Agron. Res. 2017, 15, 964–970. [Google Scholar]
  39. Jaroonjitsathian, S.; Saisirirat, P.; Sivara, K.; Tongroon, M.; Chollacoop, N. Effects of GTL and HVO Blended Fuels on Combustion and Exhaust Emissions of a Common-Rail DI Diesel Technology; SAE Technical Paper 2014-01-2763; SAE: Warrendale, PA, USA, 2014. [Google Scholar] [CrossRef]
  40. Napolitano, P.; Beatrice, C.; Guido, C.; Del Giacomo, N.; Pellegrini, L.; Scorletti, P. Hydrocracked Fossil Oil and Hydrotreated Vegetable Oil (HVO) Effects on Combustion and Emissions Performance of “Torque-Controlled” Diesel Engines; SAE Technical Paper 2015-24-2497; SAE: Warrendale, PA, USA, 2015. [Google Scholar] [CrossRef]
  41. Mata, C.; Cárdenas, D.; Esarte, C.; Soriano, J.A.; Gómez, A.; Fernández-Yáñez, P.; García-Contreras, R.; Sánchez, L.; Nogueira, J.I.; Armas, O. Performance and regulated emissions from a Euro VI-D hybrid bus tested with fossil and renewable (hydrotreated vegetable oil) diesel fuels under urban driving in Bilbao city, Spain. J. Clean. Prod. 2023, 383, 135472. [Google Scholar] [CrossRef]
  42. Serrano, L.; Santana, B.; Pires, N.; Correia, C. Performance, Emissions, and Efficiency of Biodiesel versus Hydrotreated Vegetable Oils (HVO), Considering Different Driving Cycles Sensitivity Analysis (NEDC and WLTP). Fuels 2021, 2, 448–470. [Google Scholar] [CrossRef]
  43. Jaworski, A.; Kuszewski, H.; Balawender, K.; Woś, P.; Lew, K.; Jaremcio, M. Assessment of CH4 Emissions in a Compressed Natural Gas-Adapted Engine in the Context of Changes in the Equivalence Ratio. Energies 2024, 17, 2095. [Google Scholar] [CrossRef]
  44. Jaworski, A.; Kuszewski, H.; Lew, K.; Wojewoda, P.; Balawender, K.; Woś, P.; Longwic, R.; Boichenko, S. Assessment of the Effect of Road Load on Energy Consumption and Exhaust Emissions of a Hybrid Vehicle in an Urban Road Driving Cycle—Comparison of Road and Chassis Dynamometer Tests. Energies 2023, 16, 5723. [Google Scholar] [CrossRef]
  45. SENSORS SEMTECH EFM-4. Available online: https://sensors-inc.com/Products/SEMTECH/EFM (accessed on 12 January 2020).
  46. AVL Micro Soot Sensor. Product Guide. AVL, 2010. Available online: https://www.avl.com (accessed on 15 September 2025).
  47. HORIBA OBS-2200. Service Manual; HORIBA Ltd.: Kioto, Japan, 2010; Available online: https://www.horiba.com (accessed on 15 September 2025).
  48. Service Manual AVL-ROADSIM 48; AVL List GmbH: Graz, Austria, 2014; Available online: https://www.avl.com (accessed on 15 September 2025).
  49. Puškár, M.; Jahnátek, A.; Kádárová, J.; Šoltésová, M.; Kovanič, Ľ.; Krivosudská, J. Environmental study focused on the suitability of vehicle certifications using the new European driving cycle (NEDC) with regard to the affair “dieselgate” and the risks of NOx emissions in urban destinations. Air Qual. Atmos. Health 2019, 12, 251–257. [Google Scholar] [CrossRef]
  50. Average Age of the EU Vehicle Fleet, by Country. ACEA. Driving Mobility for Europe. 2024. Available online: https://www.acea.auto/figure/average-age-of-eu-vehicle-fleet-by-country/ (accessed on 10 January 2025).
  51. Autogidas. Volkswagen Polo III 1.9 SDI Specifications. 2012. Available online: https://autogidas.lt/en/auto-katalogas/volkswagen/polo/iii-1.9-sdi-2000-2001-k72196 (accessed on 10 June 2025).
  52. Hunicz, J.; Rybak, A.; Szpica, D.; Gęca, M.S.; Woś, P.; Yang, L.; Mikulski, M. Waste plastic pyrolysis oils as diesel fuel blending components: Detailed analysis of combustion and emissions sensitivity to engine control parameters. Energy 2024, 313, 134093. [Google Scholar] [CrossRef]
  53. Adamiak, B.; Andrych-Zalewska, M.; Merkisz, J.; Chłopek, Z. The uniqueness of pollutant emission and fuel consumption test results for road vehicles tested on a chassis dynamometer. Eksploat. Niezawodn. Maint. Reliab. 2025, 27, 1. [Google Scholar] [CrossRef]
  54. UN Regulation No 154—Uniform Provisions Concerning the Approval of Light Duty Passenger and Commercial Vehicles with Regards to Criteria Emissions, Emissions of Carbon Dioxide and Fuel Consumption and/or the Measurement of Electric Energy Consumption and Electric Range (WLTP) [2021/2039]. Available online: https://eur-lex.europa.eu/legal-content/EN/TXT/PDF/?uri=CELEX:42021X2039 (accessed on 15 September 2025).
  55. Ajeeb, W.; Gomes, D.M.; Neto, R.C.; Baptista, P. Life cycle analysis of hydrotreated vegetable oils production based on green hydrogen and used cooking oils. Fuel 2025, 390, 134749. [Google Scholar] [CrossRef]
  56. Dobrzyńska, E.; Szewczyńska, M.; Pośniak, M.; Szczotka, A.; Puchałka, B.; Woodburn, J. Exhaust emissions from diesel engines fueled by different blends with the addition of nanomodifiers and hydrotreated vegetable oil HVO. Environ. Pollut. 2020, 259, 113772. [Google Scholar] [CrossRef]
  57. Bohl, T.; Smallbone, A.; Tian, G.; Roskilly, A.P. Particulate number and NOx trade-off comparisons between HVO and mineral diesel in HD applications. Fuel 2018, 215, 90–101. [Google Scholar] [CrossRef]
  58. Sihlovec, F.; Vrtiška, D.; Šimáček, P. The use of multivariate statistics and mathematically modeled IR spectra for determination of HVO content in diesel blends. Fuel 2025, 379, 132963. [Google Scholar] [CrossRef]
  59. Bays, J.T.; Gieleciak, R.; Viola, M.B.; Lewis, R.P.; Cort, J.R.; Campbell, K.B.; Coffey, G.W.; Linehan, J.C.; Kusinski, M. Detailed Compositional Comparison of Hydrogenated Vegetable Oil with Several Diesel Fuels and Their Effects on Engine-Out Emissions. SAE Int. J. Fuels Lubr. 2022, 16, 193–220. [Google Scholar] [CrossRef]
  60. McCaffery, C.; Zhu, H.; Sabbir Ahmed, C.M.; Canchola, A.; Chen, J.Y.; Li, C.; Johnson, K.C.; Durbin, T.D.; Lin, Y.H.; Karavalakis, G. Effects of hydrogenated vegetable oil (HVO) and HVO/biodiesel blends on the physicochemical and toxicological properties of emissions from an off-road heavy-duty diesel engine. Fuel 2022, 323, 124283. [Google Scholar] [CrossRef] [PubMed]
  61. Smigins, R.; Sondors, K.; Pirs, V.; Dukulis, I.; Birzietis, G. Studies of Engine Performance and Emissions at Full-Load Mode Using HVO, Diesel Fuel, and HVO5. Energies 2023, 16, 4785. [Google Scholar] [CrossRef]
  62. Jakubowski, M.; Jaworski, A.; Kuszewski, H.; Balawender, K. Performance of a Diesel Engine Fueled by Blends of Diesel Fuel and Synthetic Fuel Derived from Waste Car Tires. Sustainability 2024, 16, 6404. [Google Scholar] [CrossRef]
  63. Jaworski, A.; Kuszewski, H.; Longwic, R.; Sander, P. Assessment of Self-Ignition Properties of Canola Oil–n-Hexane Blends in a Constant Volume Combustion Chamber and Compression Ignition Engine. Appl. Sci. 2023, 13, 10558. [Google Scholar] [CrossRef]
  64. Jamrozik, A.; Tutak, W.; Gnatowska, R.; Nowak, Ł. Comparative Analysis of the Combustion Stability of Diesel-Methanol and Diesel-Ethanol in a Dual Fuel Engine. Energies 2019, 12, 971. [Google Scholar] [CrossRef]
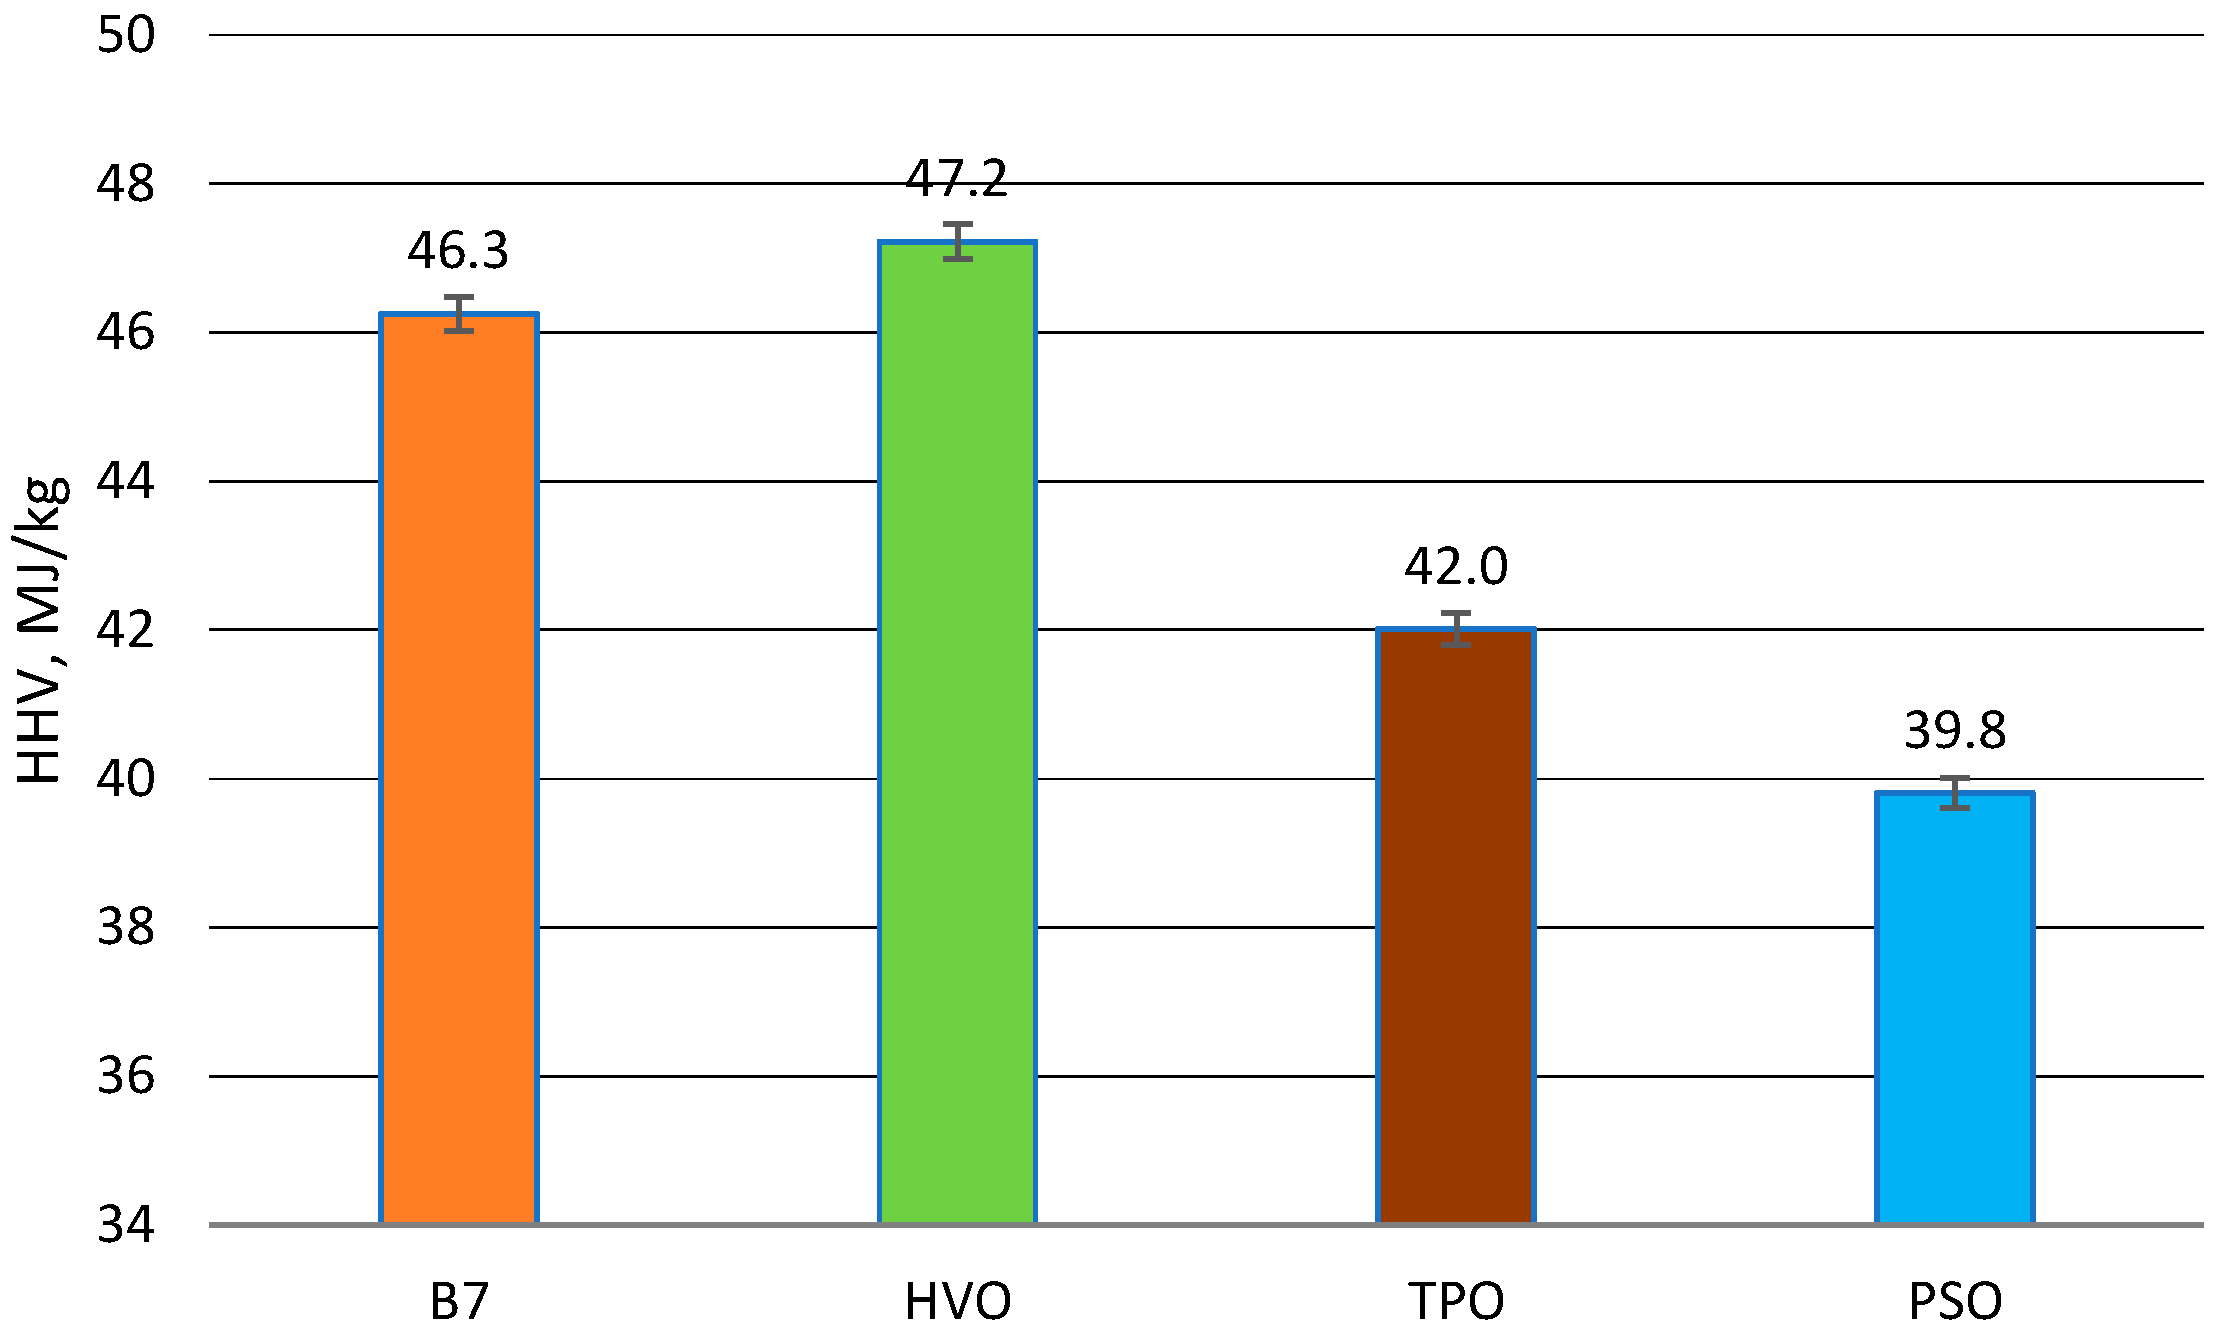
Figure 1. Comparison of the higher heating value of the analyzed base fuels.
Energies 18 05038 g001
Figure 2. Schematic of the modified fuel supply system of the VW Polo III 1.9 SDI vehicle used during the tests: FIV—fuel inlet valve, FOV—fuel outlet valve, and FV—flush valve.
Energies 18 05038 g002
Figure 3. Speed profile and acceleration changes in the WLTC Class 3b cycle [53,54].
Energies 18 05038 g003
Figure 4. Instantaneous CO2 emission profiles in the exhaust gas of the tested vehicle’s engine when fueled with the analyzed fuels during the WLTC Class 3b cycle.
Energies 18 05038 g004
Figure 5. Comparison of average distance-specific CO2 emissions for the tested fuels.
Energies 18 05038 g005
Figure 6. Instantaneous CO emission profiles in the exhaust gas of the tested vehicle’s engine when fueled with the analyzed fuels during the WLTC Class 3b cycle.
Energies 18 05038 g006
Figure 7. Comparison of average distance-specific CO emissions for the tested fuels.
Energies 18 05038 g007
Figure 8. Instantaneous THC emission profiles in the exhaust gas of the tested vehicle’s engine when fueled with the analyzed fuels during the WLTC Class 3b cycle.
Energies 18 05038 g008
Figure 9. Comparison of average distance-specific THC emissions for the tested fuels.
Energies 18 05038 g009
Figure 10. Comparison of instantaneous NOx emissions for the tested fuels during the WLTC Class 3b test cycle.
Energies 18 05038 g010
Figure 11. Comparison of average distance-specific NOx emissions for the tested fuels.
Energies 18 05038 g011
Figure 12. Comparison of instantaneous PM concentration values in the exhaust gas of the tested vehicle’s engine when fueled with the tested fuels.
Energies 18 05038 g012
Figure 13. Comparison of average PM emission values in the exhaust gas of the tested vehicle’s engine when fueled with the tested fuels.
Energies 18 05038 g013
Figure 14. Comparison of average distance-specific fuel consumption values of the tested vehicle’s engine in different phases of the test cycle when fueled with the analyzed fuels.
Energies 18 05038 g014
Table 1. Basic technical specifications of the vehicle used in the tests [51].
Analyzed ParameterValue
Length/Width/Height3926 mm/1650 mm/1465 mm
Wheelbase2454 mm
Curb weight1083 kg
Engine typeCompression-ignition
FuelDiesel
Fuel supply systemDirect injection with mechanical distributor pump
Engine displacement1896 cm3
Maximum engine power/speed47 kW/4200 rpm
Maximum torque/speed125 Nm/1600 rpm
Number of cylinders4
Number of valves8
Emission standardEuro 3
Number of gears (manual transmission)5
Mileage~193,000 km
Drive axleFront
Tire size165/70 R14
Road load parameters: f0, f1, f2 67.24 N, 0.06451 N/(km/), 0.04371
Test mass 1130 kg
Engine designationT9V/T2Q/T0X/T96
Fuel supply systemElectronically controlled distributor pump
Exhaust aftertreatment systemOxidation catalyst
Table 2. Basic physicochemical properties of the base fuels.
ParameterB7HVOTPOPSO
Density, g/cm3 (T = 15 °C)0.8340.7820.9100.945
Kinematic viscosity, mm2/s (T = 40 °C)2.812.902.711.20
Flash point, °C63.564.054.5<23.0
Water content, ppm2819870207
HHV, MJ/kg46.347.242.039.8
CFPP, °C−21−34−19−15
Disclaimer/Publisher’s Note: The statements, opinions and data contained in all publications are solely those of the individual author(s) and contributor(s) and not of MDPI and/or the editor(s). MDPI and/or the editor(s) disclaim responsibility for any injury to people or property resulting from any ideas, methods, instructions or products referred to in the content.