Article

Numerical Simulation and Theoretical Analysis of Wave Loads on Truss Legs for Offshore Energy Platforms

1
Department of Mechanical and Electrical Engineering, Ocean University of China, Qingdao 266100, China
2
State Key Laboratory of Coastal and Offshore Engineering, Ocean University of China, Qingdao 266100, China
3
School of Energy Science and Engineering, Harbin Institute of Technology, Harbin 150001, China
*
Authors to whom correspondence should be addressed.
Energies 2025, 18(18), 5032; https://doi.org/10.3390/en18185032
Submission received: 22 August 2025 / Revised: 15 September 2025 / Accepted: 19 September 2025 / Published: 22 September 2025
(This article belongs to the Section A3: Wind, Wave and Tidal Energy)

Abstract

Jack-up offshore platforms, supported by truss legs, are integral to the development of marine energy resources, including oil, gas, and offshore wind. Due to the structural complexity of truss legs, accurately quantifying wave loads is crucial for ensuring the safety and efficiency of energy extraction operations. In this work, a numerical wave tank approach combined with theoretical analysis is employed comprehensively to investigate wave loads on truss legs, with a particular emphasis on the effects of component forces and inflow angle. The results demonstrate that wave loads are not solely dependent on member dimensions. The influencing factors affecting component forces include water depth and phase differences between structural units, which amplify the contribution of the component forces of members near the free surface and without phase difference to the total force. Furthermore, the total force varies periodically with the inflow angle in cycles of 60°. Notably, the influence of inflow angle on the total force becomes negligible when the wavelength substantially exceeds the pile spacing. This framework fundamentally provides a theoretical basis for the structural optimization of Jack-up offshore platform support systems, thereby enhancing the safety and reliability of energy infrastructure.

1. Introduction

As strategic energy resources, oil, gas, and offshore wind resources also play an important role in the fields of machinery, the chemical industry, and the economy. Jack-up offshore platforms play an irreplaceable role in the exploitation of oil and gas resources. The platform is subjected to complex environmental loads, including wind, waves, earthquakes, and other loads. Under self-existence and operation conditions, it is mainly subjected to wave load. Most of the major accidents on the platform are caused by the leg. Therefore, it is of great significance to study the truss leg of jack-up offshore platforms to enhance the design and manufacturing capacity of marine engineering equipment.
The legs of the jack-up platform are mostly truss structures. However, most scholars take cylindrical piles as the research object, and there are relatively few studies on truss legs. Considering the complexity of the truss leg and working conditions, it is of great significance to study the effect of the components on the wave loads of the truss leg.
The study of wave loads on truss legs began with vertical cylindrical piles. Its theoretical basis is the Morison equation proposed by Morison et al. [1], which can calculate the wave loads of small-scale structures. Most of the early scholars adopted experimental methods. Keulegan and Carpenter [2] obtained the wave loads on cylinders and spheres through experiments. Chakrabarti et al. [3] conducted a hydrodynamic experiment on a vertical cylindrical pile under the condition of low Reynolds number. The drag force coefficient and inertia force coefficient were calculated by experimental data. The relationship between these hydrodynamic coefficients and the Reynolds number was analyzed. Sarpkaya [4] studied the force on a cylindrical pile and compared the theoretical values of the inertia force coefficient with the experimental values at low KC numbers. Raed and Soares [5] analyzed four different approaches for determining the hydrodynamic coefficients of irregular waves acting on vertical cylindrical piles. Raed proposed that incorporating linear random wave theory would provide a more accurate numerical solution. When waves act on a vertical cylindrical pile, vortex detachment often occurs, which will cause drag and lift forces to the pile structure. Liu et al. [6] comprehensively introduced the principle and research methods of vortex-induced vibration of marine risers. Compared to the vertical cylindrical pile, there is relatively less research on the inclined cylindrical pile. Sundar et al. [7] conducted experiments to measure wave loads on inclined cylindrical piles in wave tanks with different water depths of 1 m and 3 m. The least square method was used for calculating the hydrodynamic coefficients. The curves of the drag force coefficient and inertia force coefficient with the KC number at different angles were given.
There are significant structural differences between truss legs and single cylindrical piles, making it necessary to conduct research on both group piles and truss legs. Chakrabarti [8] conducted an analysis on the wave loads of parallel piles and studied the influence of the relative pile spacing. Bonakdar et al. [9,10] conducted a series of studies on pile groups and conducted experiments on pile groups with different arrangements of pile spacing and pile number. Liu et al. [11] conducted a numerical simulation study on two partially submerged vertical piles in waves. The results indicated that the wave load on the front pile was greater than that of a single pile due to the blocking effect caused by the presence of the back pile. Deng et al. [12] conducted a simulation study on the free surface waves of two horizontal piles using a two-dimensional numerical model based on the Navier–Stokes equations. The results indicated that the pile spacing had a significant influence on the back pile. When the pile spacing was sufficiently large, the influence of the front pile could be disregarded. Koterayama and Matsumoto [13] determined the hydrodynamic coefficient through a forced sway experiment conducted on a truss leg. Tian et al. [14] investigated the wave loads and hydrodynamic coefficients of a truss leg chord. They employed a combination of physical model testing and numerical simulations. Specifically, they examined the influence of the scale ratio and rack on these parameters. Xie et al. [15] conducted research on the truss leg of a jack-up offshore platform. They focused on simulating the truss leg structure in reality. The study involved conducting model experiments on both single and three-pile legs. Furthermore, they derived the hydrodynamic coefficient based on the experimental conditions. The effect of a three-pile leg model under various working conditions was quantitatively analyzed based on the single pile leg model by defining the component force coefficient and total force coefficient. Ye et al. [16] verified the stability of the jack-up platform under three conventional wave conditions. Gao et al. [17] established a finite element model of a three-legged jack-up platform. The overall performance of the jack-up platform under multiple working conditions was simulated. These studies have all focused on the truss leg as a whole, but there is little research available on the components of the truss leg.
With the development and progress of computer processing power, the use of computational fluid dynamics (CFD) code to build a numerical wave tank (NWT) instead of a physical model has been gradually realized. Finnegan and Goggins [18] described in detail how to create the NWT model that can accurately produce both deep-water linear waves and finite-depth linear waves. Prasad et al. [19] used the Volume of Fluid (VOF) method to capture free surfaces and simulate waves in a three-dimensional NWT. The correctness of the numerical method was verified by experimental data. Tian et al. [20] analyzed the hydrodynamic characteristics of cylindrical piles by a three-dimensional NWT. Qiao et al. [21] established a CFD numerical model using a macroscopic method to simulate the interaction between waves and vertical porous plates. An efficient wave absorption model was proposed. Oliveira et al. [22] developed and explored the capabilities of the CFD-based NWT. The selection of the numerical wave makers determined the accuracy and efficiency of the NWT. The results demonstrated that the model could be adopted to study the novel multipurpose wave energy converter. De Vita et al. [23] presented a new method to avoid the inconsistency between the viscous and inviscid solutions. The accuracy of the method had been verified by simulating a sinusoidal monochromatic wave and the wave transformation over a submerged bar. Yu et al. [24] extended an immersed-boundary generalized harmonic polynomial cell method to solve two-phase flow problems. The newly developed NWT model is adopted to simulate perforated plates in oscillating flow, orbital flow, and beneath incident waves.
In summary, there are relatively few studies on truss legs, while accurately quantifying wave loads on truss legs is crucial for ensuring the safety and efficiency of energy extraction operations. Based on the fluid experimental data, numerical simulations and theoretical analysis of wave loads on truss legs are carried out. After mutual verification with the experimental data, numerical simulations and theoretical analysis are adopted to analyze the effect of the component force and the inflow angle on the total force of the truss leg.

2. Research Method

2.1. Theoretical Method

The truss leg belongs to a small-scale structure (small-scale refers to the fact that the ratio of feature length D to wavelength L of components is less than 0.2). Wave loads are commonly calculated using the Morison equation [1]. The wave loads in the equation contain two parts: drag force and inertia force. The wave load acting on unit length is as follows:
f = 1 2 ρ C D D U x U x + ρ C M π D 2 4 U x t
where CD represents the drag force coefficient, CM represents the inertia force coefficient, ρ represents the fluid density, and Ux represents the velocity vector of water particles in the direction perpendicular to the axial direction of the cylinders.
The wave loads of unit length on the inclined components are defined as follows:
f x f y f z = 1 2 C D ρ D U n U x U y U z + C M ρ π D 2 4 U x t U y t U z t
where U represents the velocity vector of the water particles, and the velocity vectors of water particles in different directions are distinguished by subscripts x, y, and z.
There are two key issues in the application of the Morison equation: the acquisition of the hydrodynamic coefficient and the selection of the wave theory [15]. The hydrodynamic coefficient is affected by various factors. Therefore, it is usually obtained by model experiments. In addition, the practical flow field is mostly an irregular wave, but the regular wave is often chosen to approximate the flow field in the actual calculation. Moreover, the influence of structures and other factors is disregarded.
The selection of the wave theory is consistent with the experimental conditions. Therefore, the second-order Stokes wave and the fifth-order Stokes wave are adopted for theoretical calculation. The wave parameters are taken as input. The wave load is obtained by integrating the Morison equation along the path of the cylinder. There are a number of components of a truss leg. Therefore, the total force of the truss leg can be solved by means of solving component forces one by one and linear superposition.

2.2. Numerical Method

Numerical simulation using computers has increasingly become an important approach for solving complex engineering problems. The three-dimensional numerical wave tank (NWT) constructed as a representation of the experimental wave tank is illustrated in Figure 1. The two phases are separated by an interface. The VOF method is employed to resolve the transient fluctuations of the water–air free surface [20].
The NWT contains six boundaries. The left boundary is defined as the velocity-inlet. The velocity of water particles is set in a User Defined Function (UDF). The top boundary is defined as the pressure-inlet, and the relative pressure is set as 0 MPa [20]. The right boundary is set as the pressure-outlet, and the pressure is distributed in a gradient with water depth. Additionally, all other boundaries are defined as no-slip walls, thereby preventing any relative motion between the fluid and the solid surface at their interface.
DEFINE_PROFILE (name, thread, and position) macro is employed to define the velocity of water particles and liquid-phase volume fraction at the inlet boundary. Equations (3) and (4) are the velocity of water particles in the x and y directions, respectively. Equation (5) is the wave surface equation η at the inlet boundary:
u = π H T cosh k y   sinh k d cos ( ω t ) + 3 4 π H T π H L cosh 2 k y   sinh k d 4 cos 2 ( ω t )
v = π H T sinh k y sinh k d sin ( ω t ) + 3 4 π H T π H L sinh 2 k y   sinh k d 4 cos 2 ( ω t )
η = H 2 cos ( ω t ) + π H 8 H L cosh k d   sinh k d 3 cos 2 ( ω t ) × 2 + cosh 2 k d
where H represents the wave height, T represents the wave period, d represents the water depth, k represents the wave number, and ω represents the angular frequency.
To absorb the wave reflecting from the structure and outlet boundary, the damping zone is set in the NWT. The damping zone is located two wavelengths from the outlet boundary. The additional momentum source in the momentum equation is modified according to the velocity of the inflow wave in the x and y directions. In this study, the linear wave damping coefficient is adopted for wave absorption. The momentum equations are shown as follows:
( u ) t + u ( u ) x + v ( u ) y = 1 ρ p x + v 2 u x 2 + 2 u y 2 σ u
( v ) t + u ( v ) x + v ( v ) y = 1 ρ p y + g y + v 2 v x 2 + 2 v y 2 σ v
σ x = α x x 1 x 2 x 1                                 x 1 x x 2
where σ represents the damping coefficient, α represents the empirical coefficient, x and y represent the coordinate components, and x1 and x2 are the starting and ending locations of the damping zone, respectively.
For mesh convergence validation [21], four mesh characteristics are listed in Table 1. The characteristic length of the mesh cells in the x direction is refined to Δx. In the y direction, the characteristic length of the mesh cells is refined to Δy in the region of one wave height above and below the free surface. The characteristic length of mesh cells in the remaining region is equivalent to Δx.
The wave height is adopted as the validation metric to confirm the accuracy of the numerical wave field simulation, which serves as the fundamental basis for subsequent wave load analysis. Table 2 compares the simulated wave heights in the numerical wave tank under different mesh types. The results indicate that, for all mesh configurations except Mesh 1, the relative tolerance between the simulated wave height and the target wave height is less than 2.5%, demonstrating that the established numerical wave tank can accurately generate the target wave field with high precision. To improve computational efficiency, Mesh 2 is ultimately selected for subsequent numerical simulations.
The selection of the time step is primarily governed by the Courant–Friedrichs–Lewy (CFL) condition. For the VOF method employed in this study, the CFL number is generally kept below 0.5 to ensure numerical accuracy. The specific calculation is given by Equation (9). Based on this criterion, the maximum allowable time step is calculated to be 0.00729 s. A more conservative value of 0.005 s is, therefore, selected to rigorously ensure simulation accuracy:
CFL = c Δ t Δ x
where c represents the wave velocity and Δt represents the time step size.
In fluid experiments, the piston wave makers (Dalian University of Technology, Dalian, China) are installed at one end of the wave tank to generate regular waves with varying characteristics. Data acquisition is carried out by a synchronized measurement system consisting of BE120-3AA strain gauges (Shenzhen Yangminghongye Technology, Shenzhen, China) with a sensitivity coefficient of 2.2 and a TD-BGJ wave gauge (Beijing Tongde Venture Technology, Beijing, China) with a maximum range of 1 m [15,20]. The truss leg model was rigidly connected to the support structure via a top connection device. While the wave height is recorded in real time by the wave gauge, the strain gauges simultaneously measure the strain on the dynamometric bar. The strain signals are converted into electrical signals and transmitted to a DH5908 wireless dynamic strain acquisition unit.
Referring to the scale of the experimental tank as shown in Figure 2a, the NWT is refined to be 10 m, 20 m, and 30 m in length under different wave conditions, and 2 m in depth. The immersion depth of the truss leg is 1.6 m. The simulation layout of the truss leg at 0° inflow angle is shown in Figure 2b.
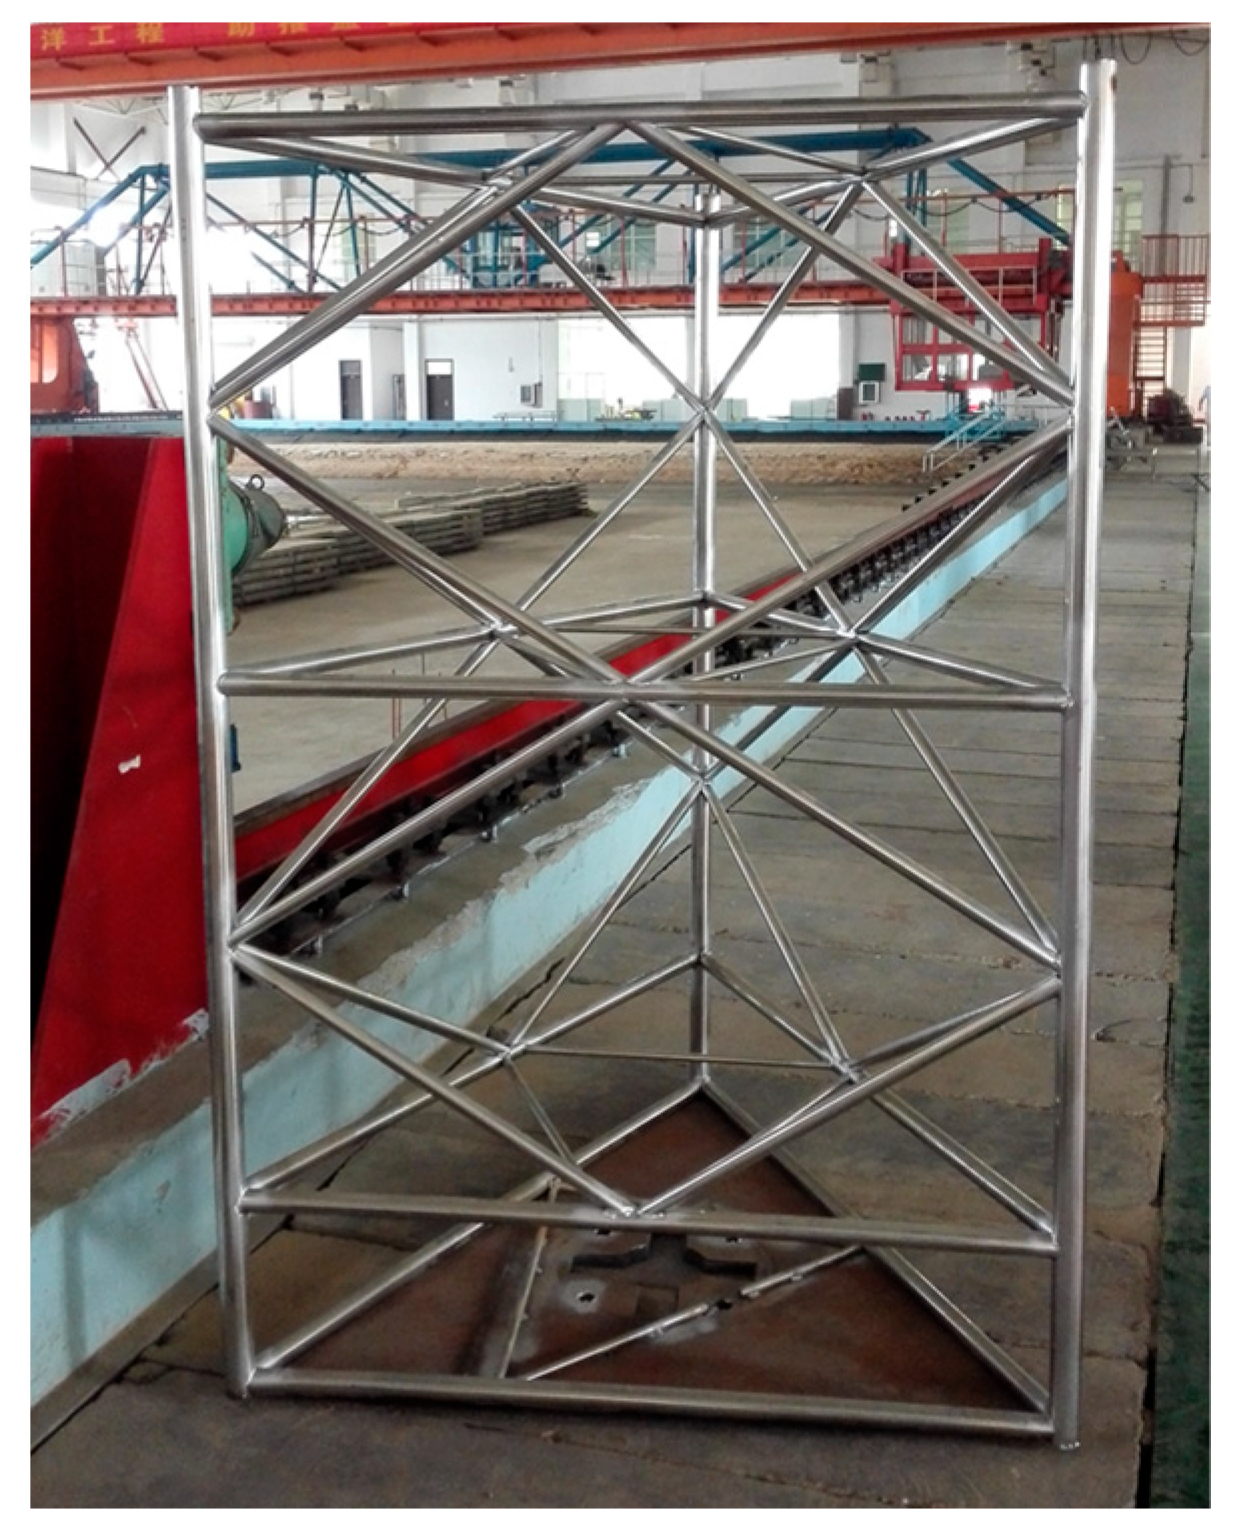
The truss leg is located at two wavelengths of the distance from the inlet boundary. According to the equipment conditions, the scale ratio of the experimental model is determined as 1:10 by taking geometric similarity and dynamic similarity (mainly gravity similarity) as similarity criteria. The experimental model of the truss leg is constructed from 304 stainless steel. The dimensions of each component of the experimental model are listed in Table 3. Two pitches of the truss leg are selected as the research object, as shown in Figure 3. Therefore, the total height of the experimental model is about 2.1 m. The simulation model is consistent with the experimental model.
The numerical model is meshed with a hexahedral element. Local mesh refinement is required around the structure due to its geometric complexity. The tetrahedral element is employed to refine the mesh near the truss leg. Figure 4 illustrates the multi-block mesh strategy adopted for the NWT with the truss leg.
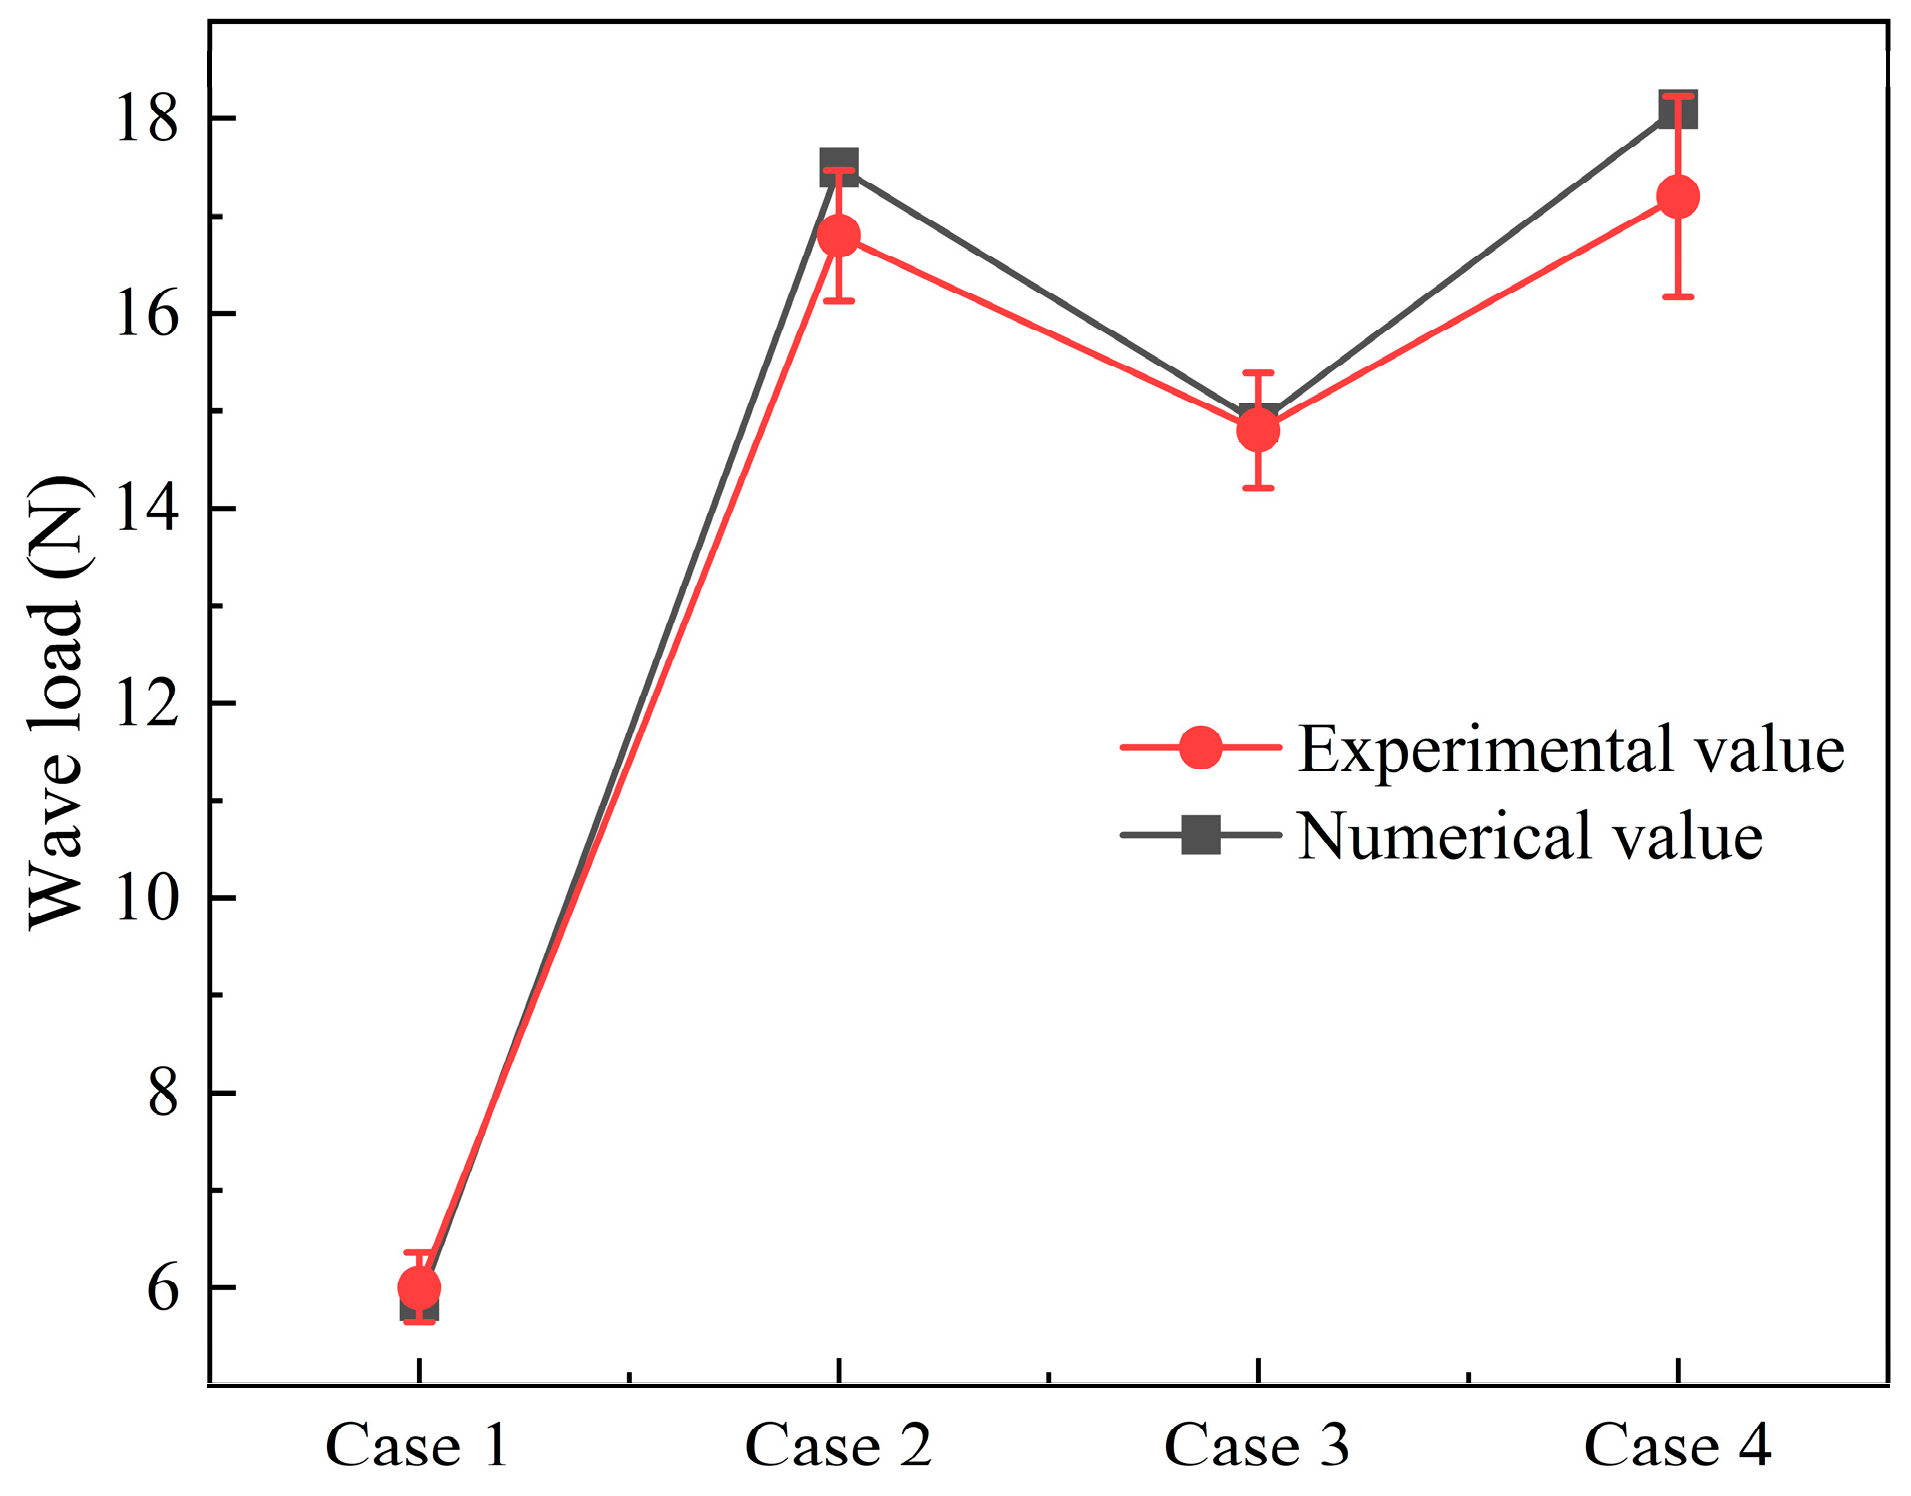
The detailed test parameters are listed in Table 4 [15,20]. Each case is tested at least three times to ensure the scientific validity and reliability of the acquired data. To further validate the reliability of the numerical simulation method, Figure 5 presents a comparison between the experimentally measured and numerically simulated wave loads. The results show that the numerical values fall within the experimental standard deviation, demonstrating that the selected Mesh 2 not only ensures accuracy in wave field generation but also in wave load resolution.

3. Results and Discussion

3.1. Wave Loads of the Truss Leg Under Different Wave Conditions

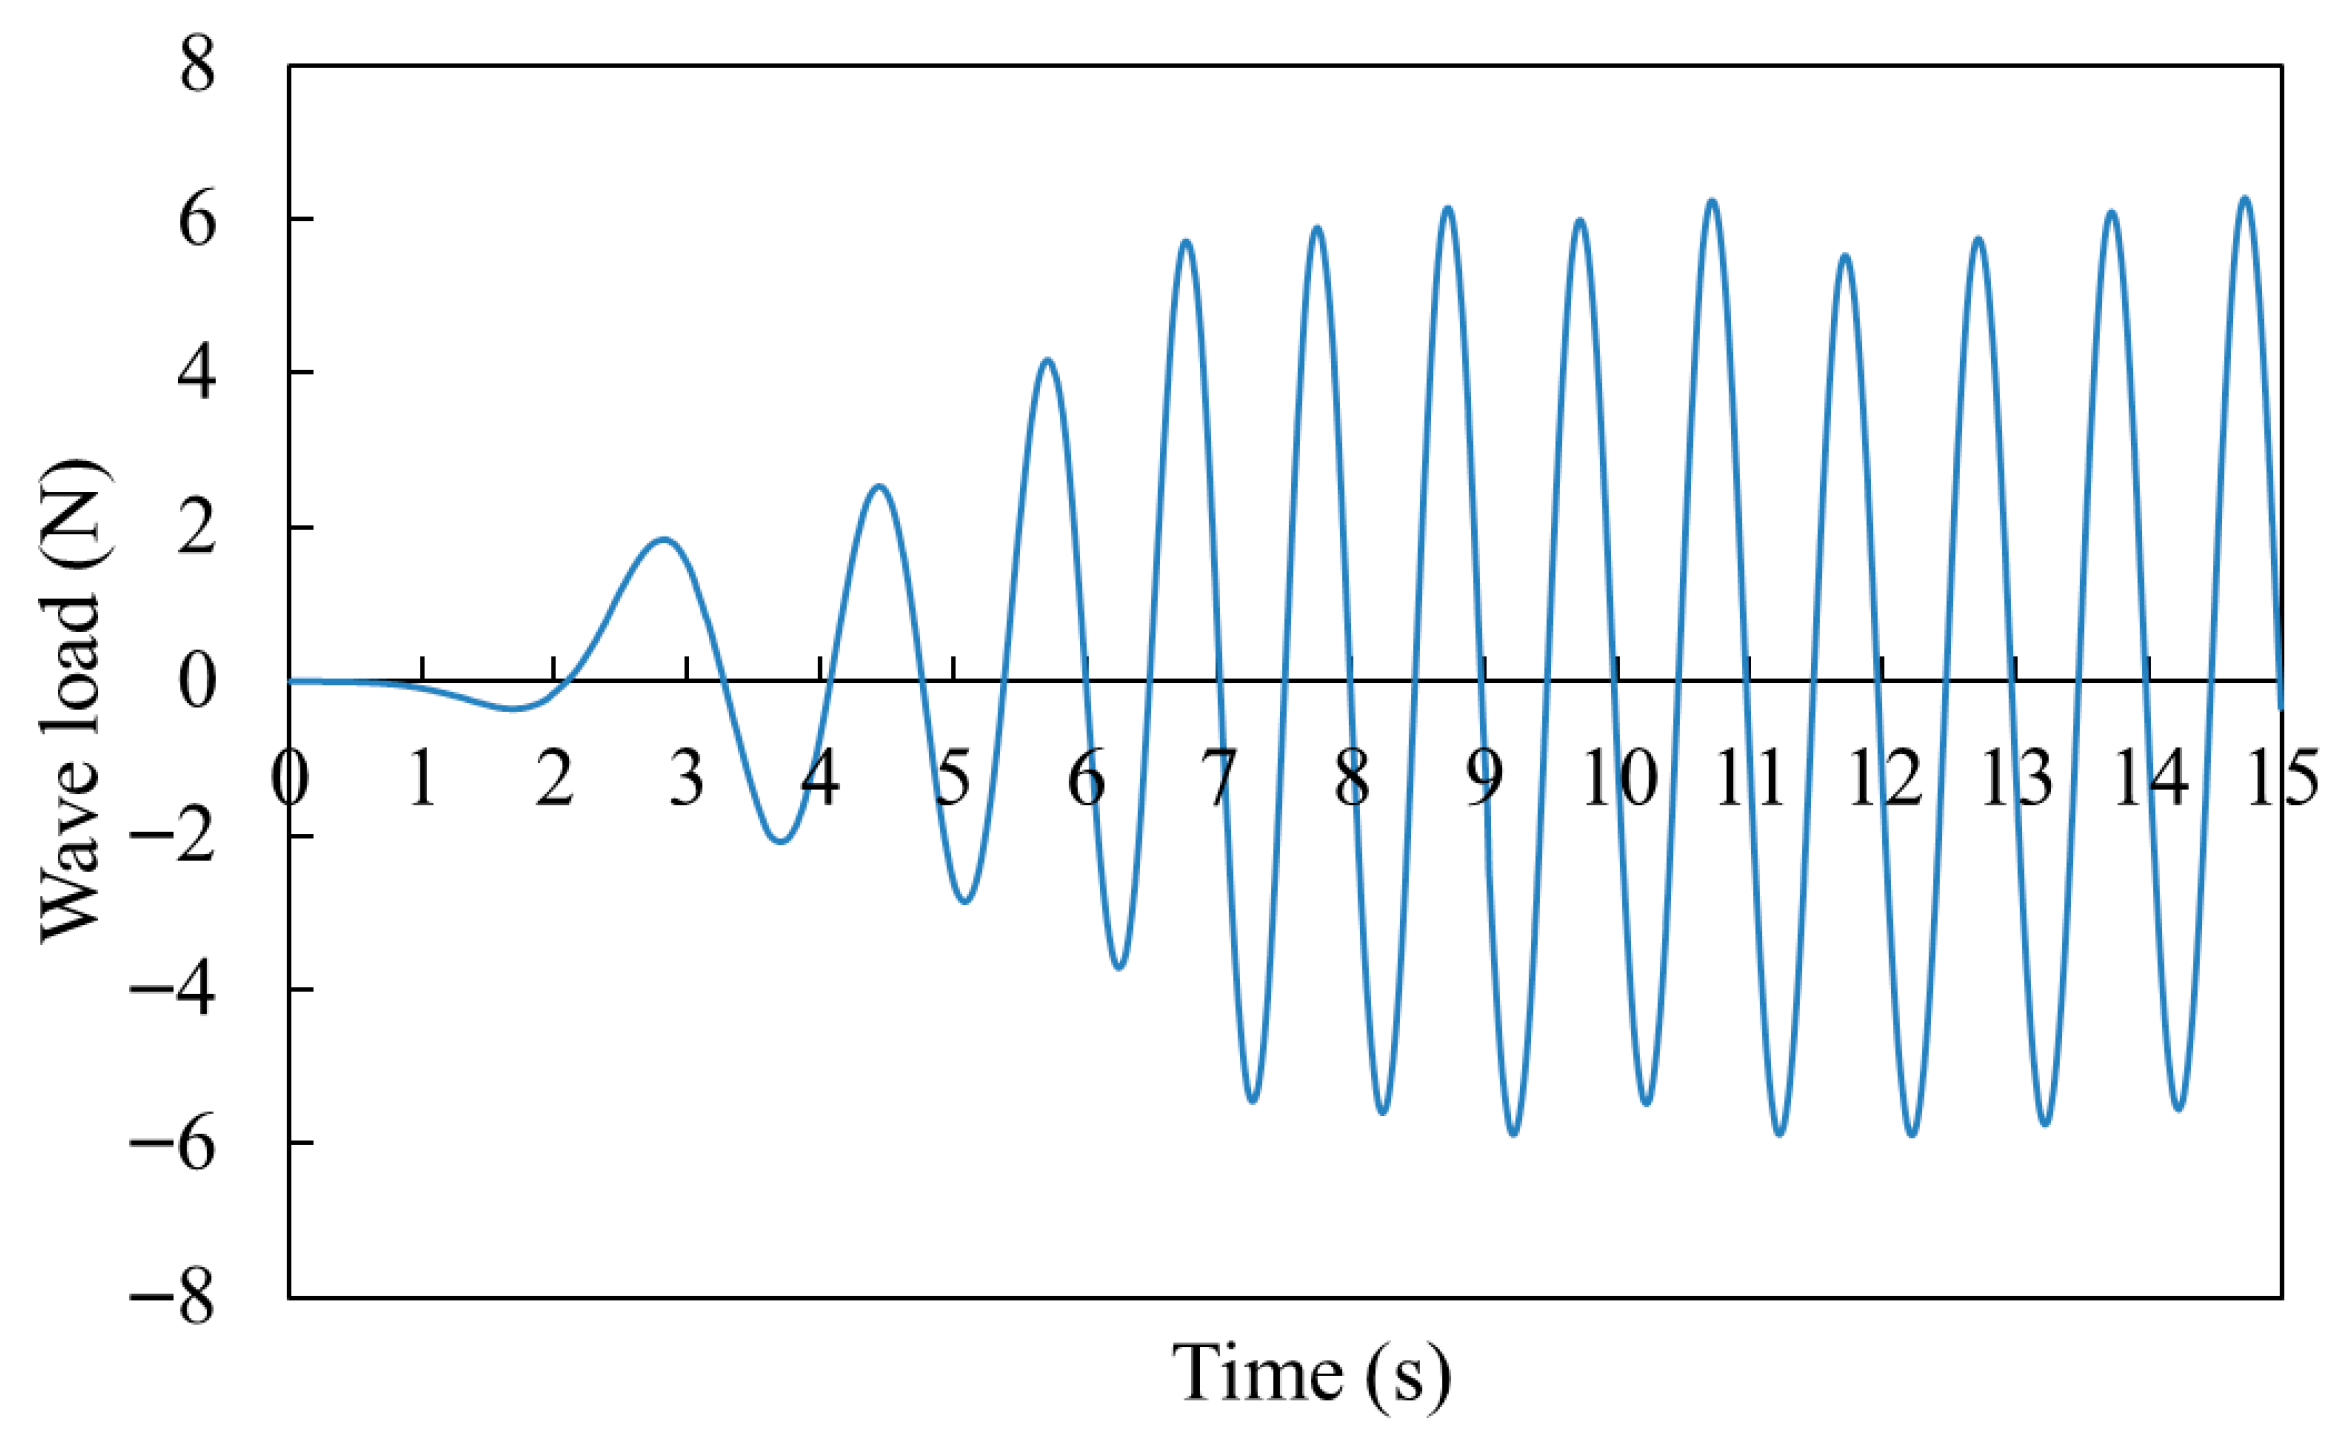
In the experimental test, the wave load of the truss leg is obtained through the strain data transformation of the dynamometric bar. In the numerical simulation, the air-phase in the NWT does not exert loads on the truss leg. Therefore, the wave load on the truss leg exerted only by the water-phase is obtained by monitoring the wave load on the surface of each component. The simulated wave load of the truss leg in Case 1 is shown in Figure 6.
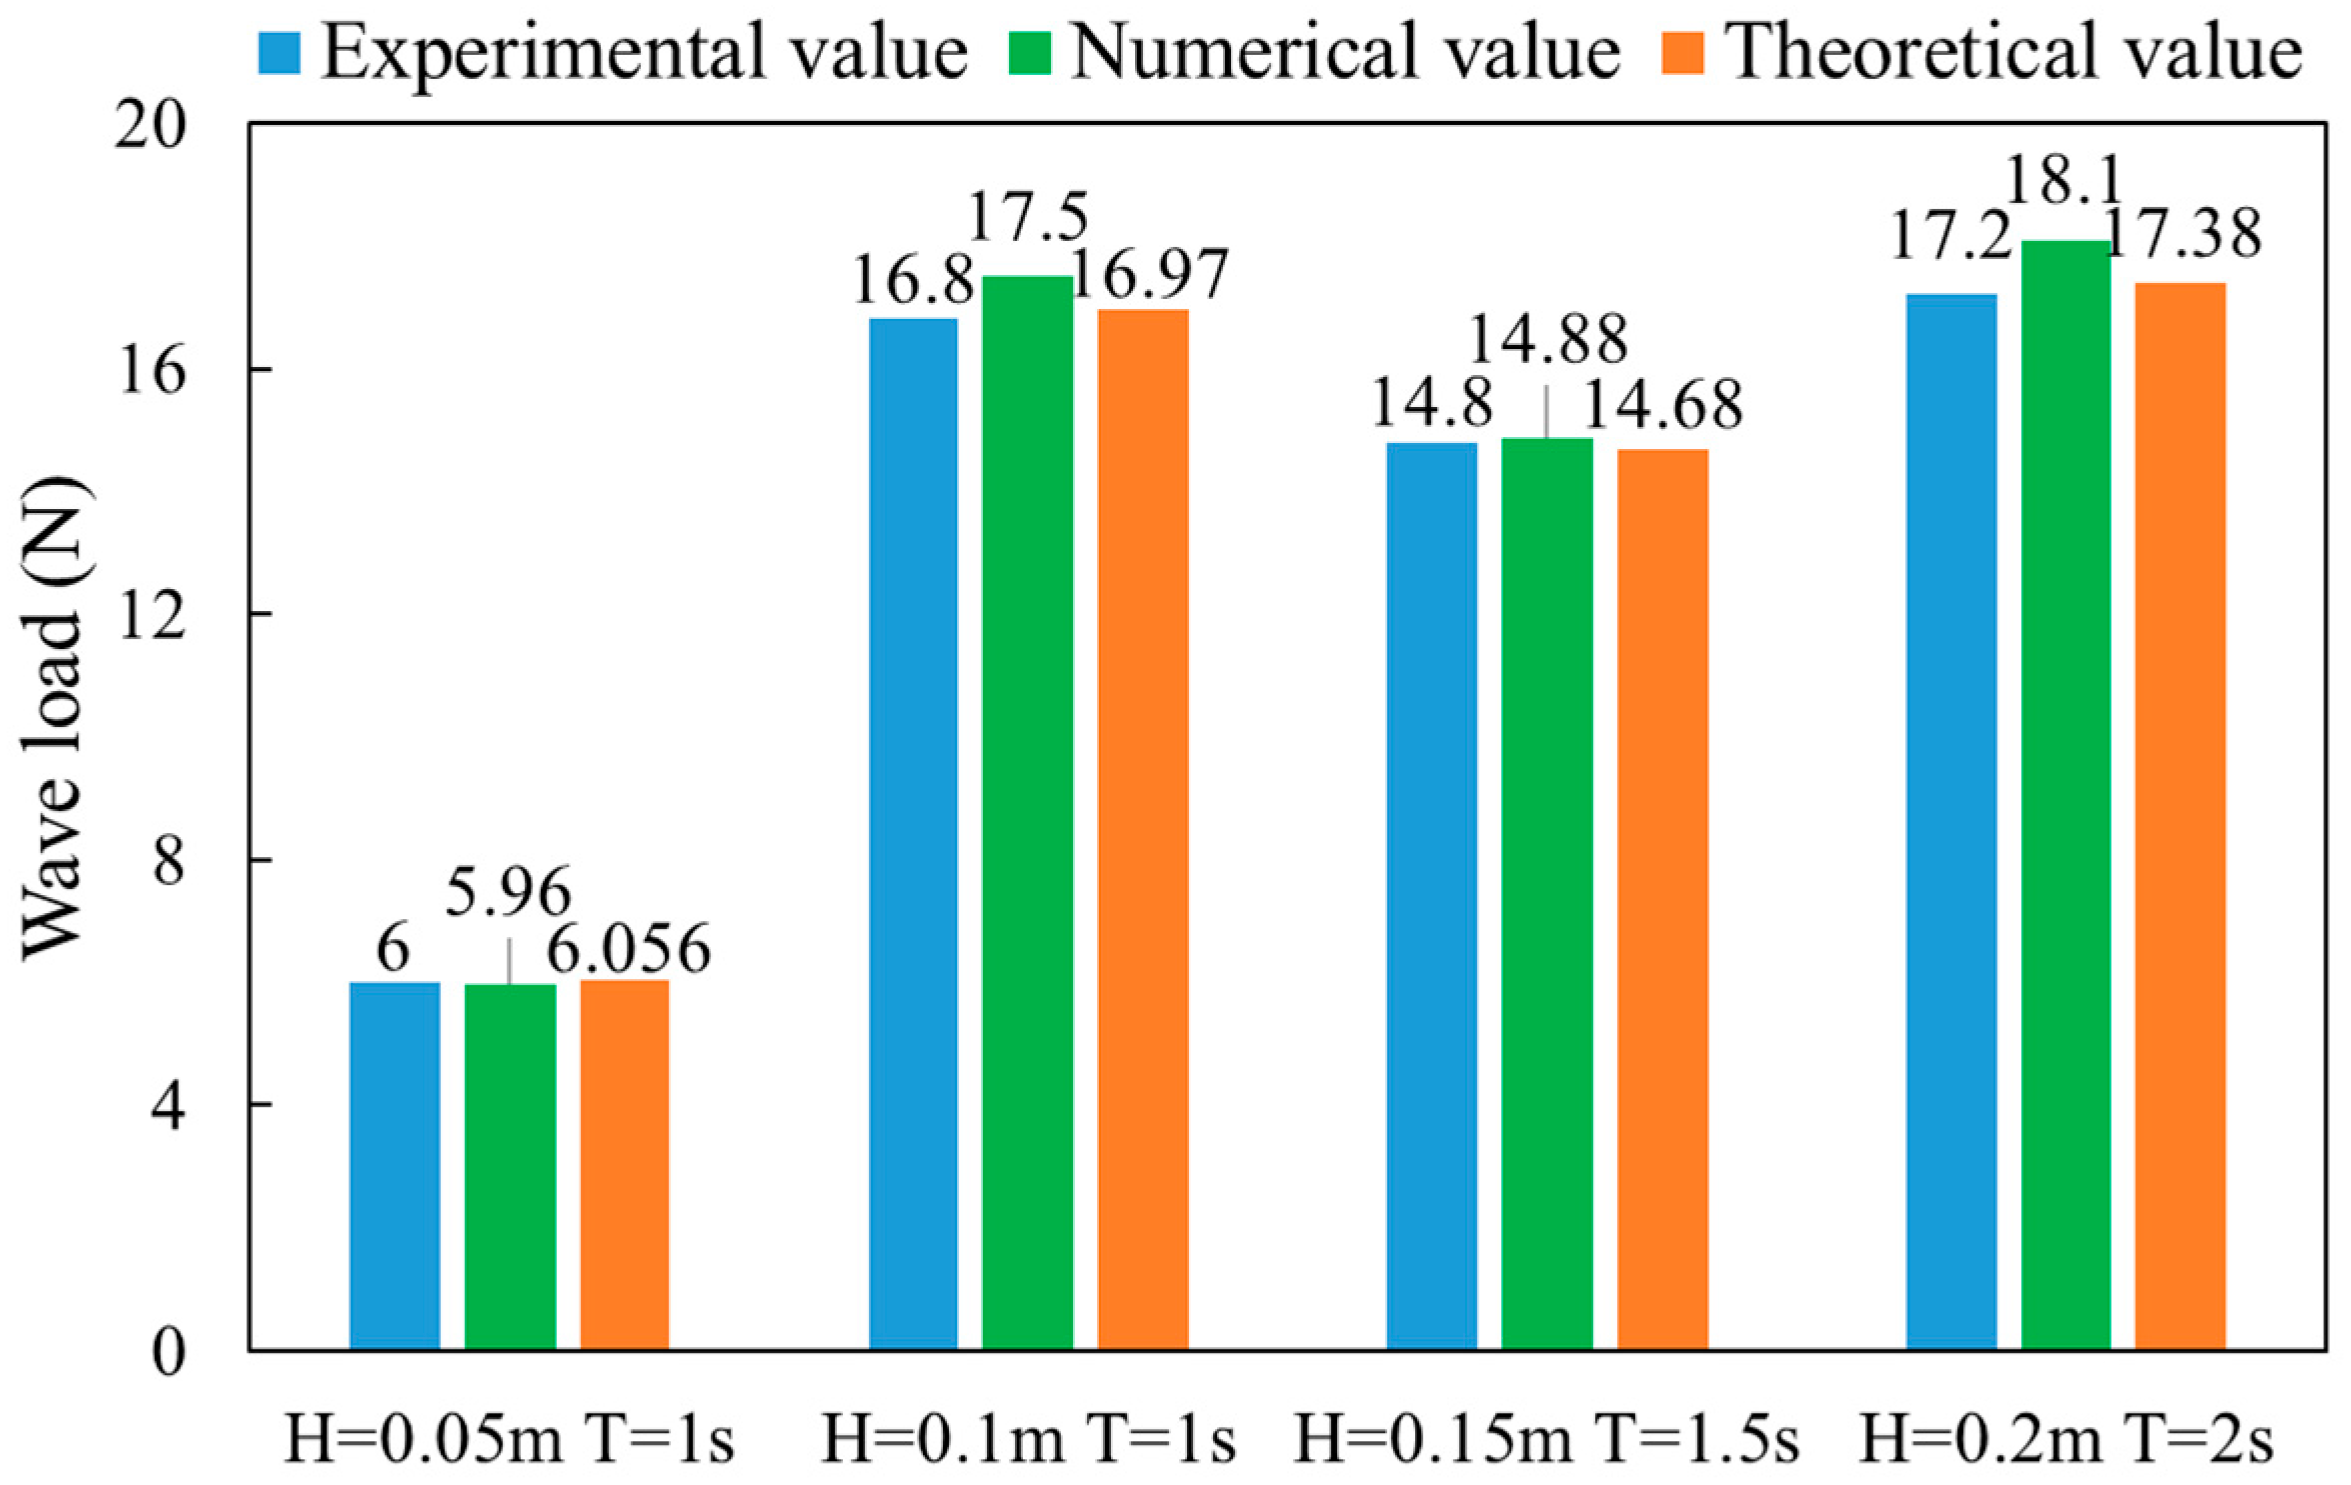
It can be found that the wave load on the truss leg varies periodically [15,20]. The period is consistent with the wave period. It reaches stability after eight wave periods. The numerical value after stabilization is 5.96 N on average. The experimental value under the same case is 6 N. Wave loads of each case are shown in Figure 7. The results indicate that the numerical and theoretical values are both close to the experimental value. The maximum error of the theoretical method is not more than 1.1%. Moreover, the time required for numerical simulation is significantly longer than that of theoretical calculation. Therefore, a theoretical calculation method was adopted in the subsequent studies.

3.2. Effect of the Components on the Total Force

The wave load of the truss leg is different from a single component because the truss leg has a complex structure with a total of forty-five components. Taking 0° inflow angle as an example, the relationship between the total force and the component force is analyzed. Due to the limitations of the experimental device, only the total force of the truss leg can be monitored in the experimental test. The previous section has proven the reliability of the theoretical calculation. Therefore, the theoretical calculation method can be used to calculate the component force.
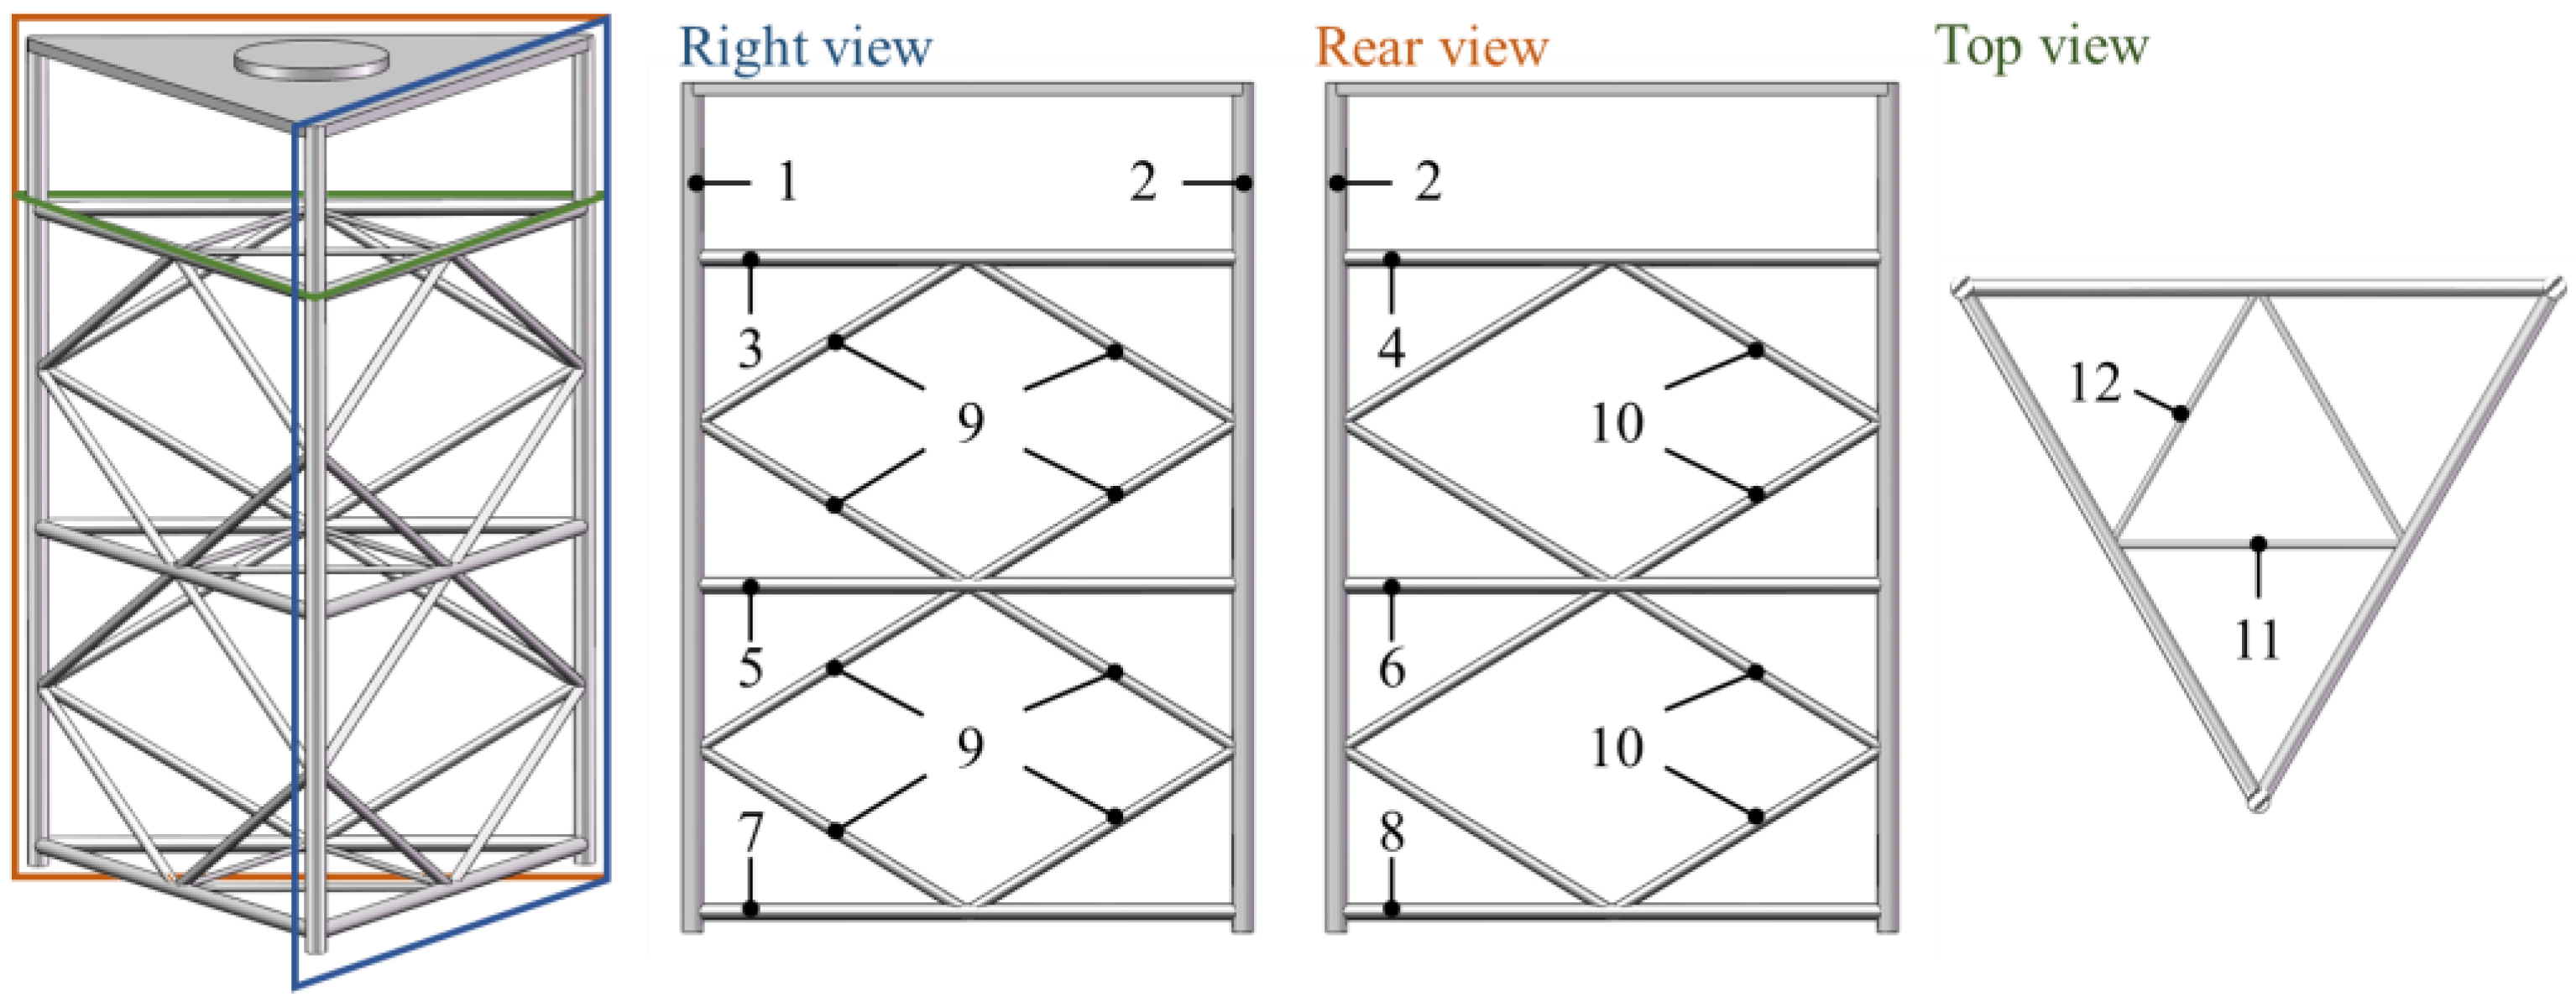
The truss leg is composed of four types of components. Considering the symmetrical distribution of some components in the direction of wave propagation, the components are numbered by type, as shown in Figure 8.
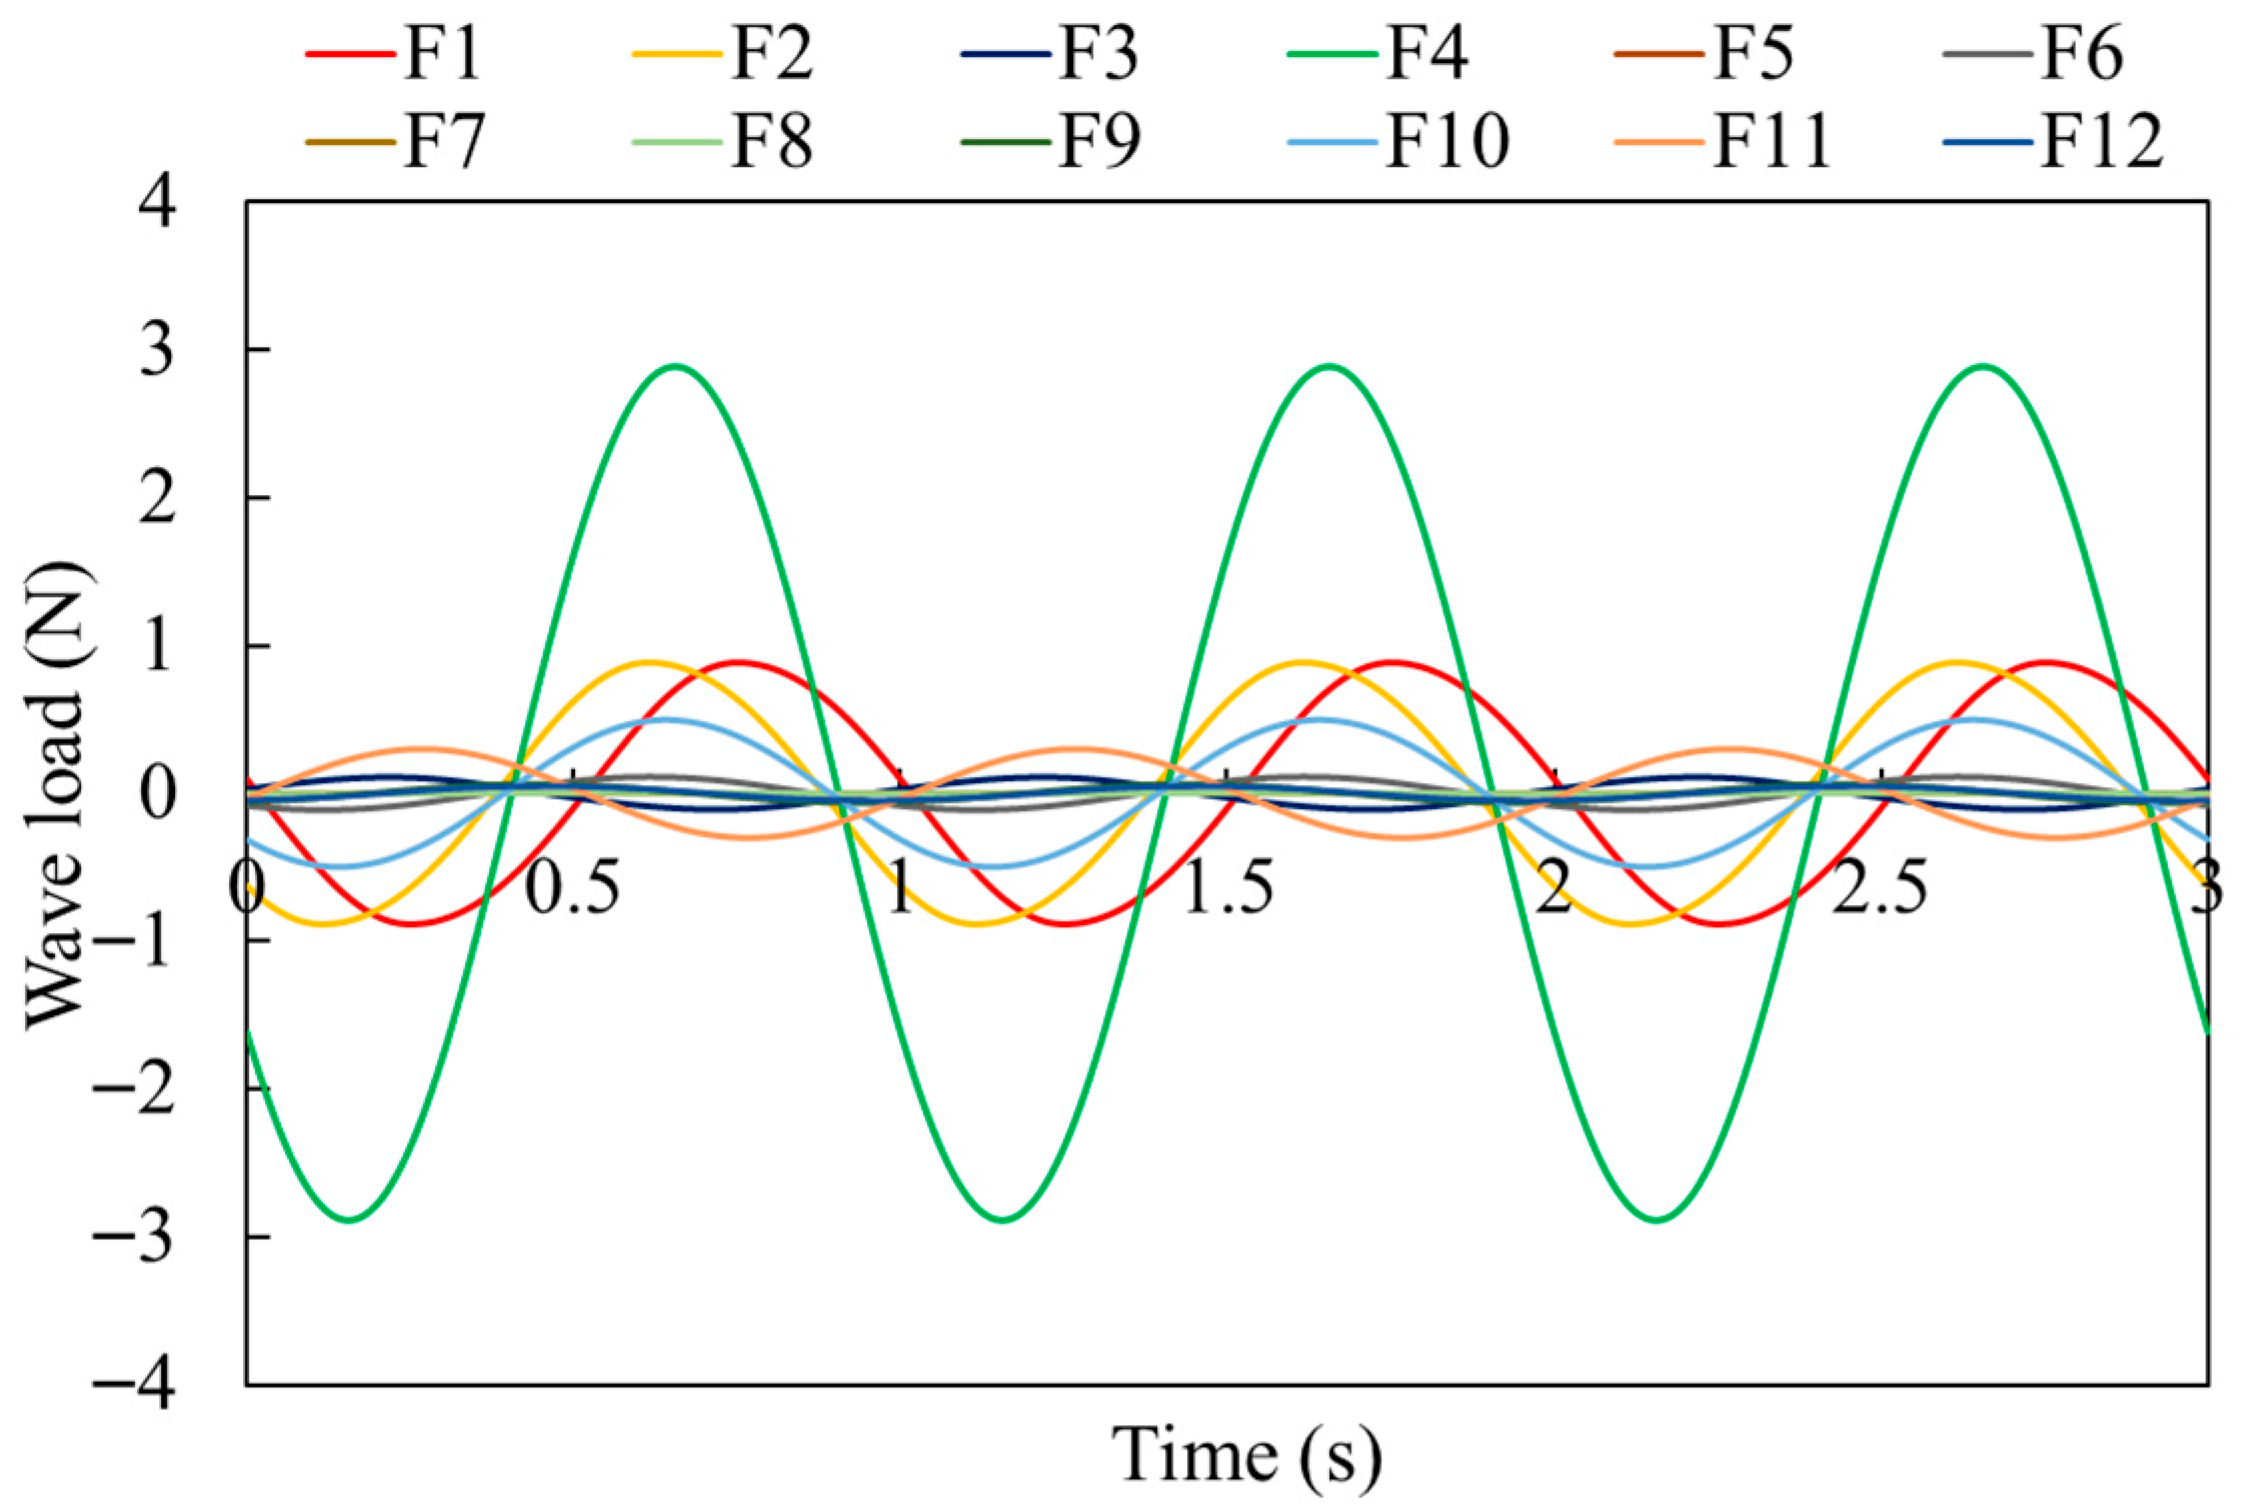
The wave load of each component in Case 1 is shown in Figure 9. The results indicate that there are significant differences between the component forces. It is well known that water particle velocity and acceleration decay with increasing depth. Furthermore, phase differences may exist among the units of the components. The specific calculation method for the phase difference between component units is as follows:
Δ ϕ = 360 o × X L
where X represents the distance along the direction of wave propagation for the component.
For instance, no phase difference is observed between the units of cross braces 4, 6, and 8. However, the cross brace 4 is situated closer to the free surface than braces 6 and 8, resulting in significantly larger wave loads on brace 4. In contrast, the component forces on braces 6 and 8 are considerably smaller, measuring only 0.1117 N and 0.00464 N, respectively. Although both cross braces 3 and 4 are located near the free surface, cross brace 3 exhibits phase differences. Consequently, the force on brace 3 is only 0.1092 N. Similarly, component forces 1 and 2 are equal in magnitude but differ in phase. Inclined brace 10, which consists of four inclined braces without phase differences, experiences a force slightly smaller than that of chord 1 due to its smaller projected area. Notably, inner cross brace 11, despite its relatively small size, sustains a force larger than some of the larger components. Nevertheless, the contributions of these minor components to the total force remain negligible.
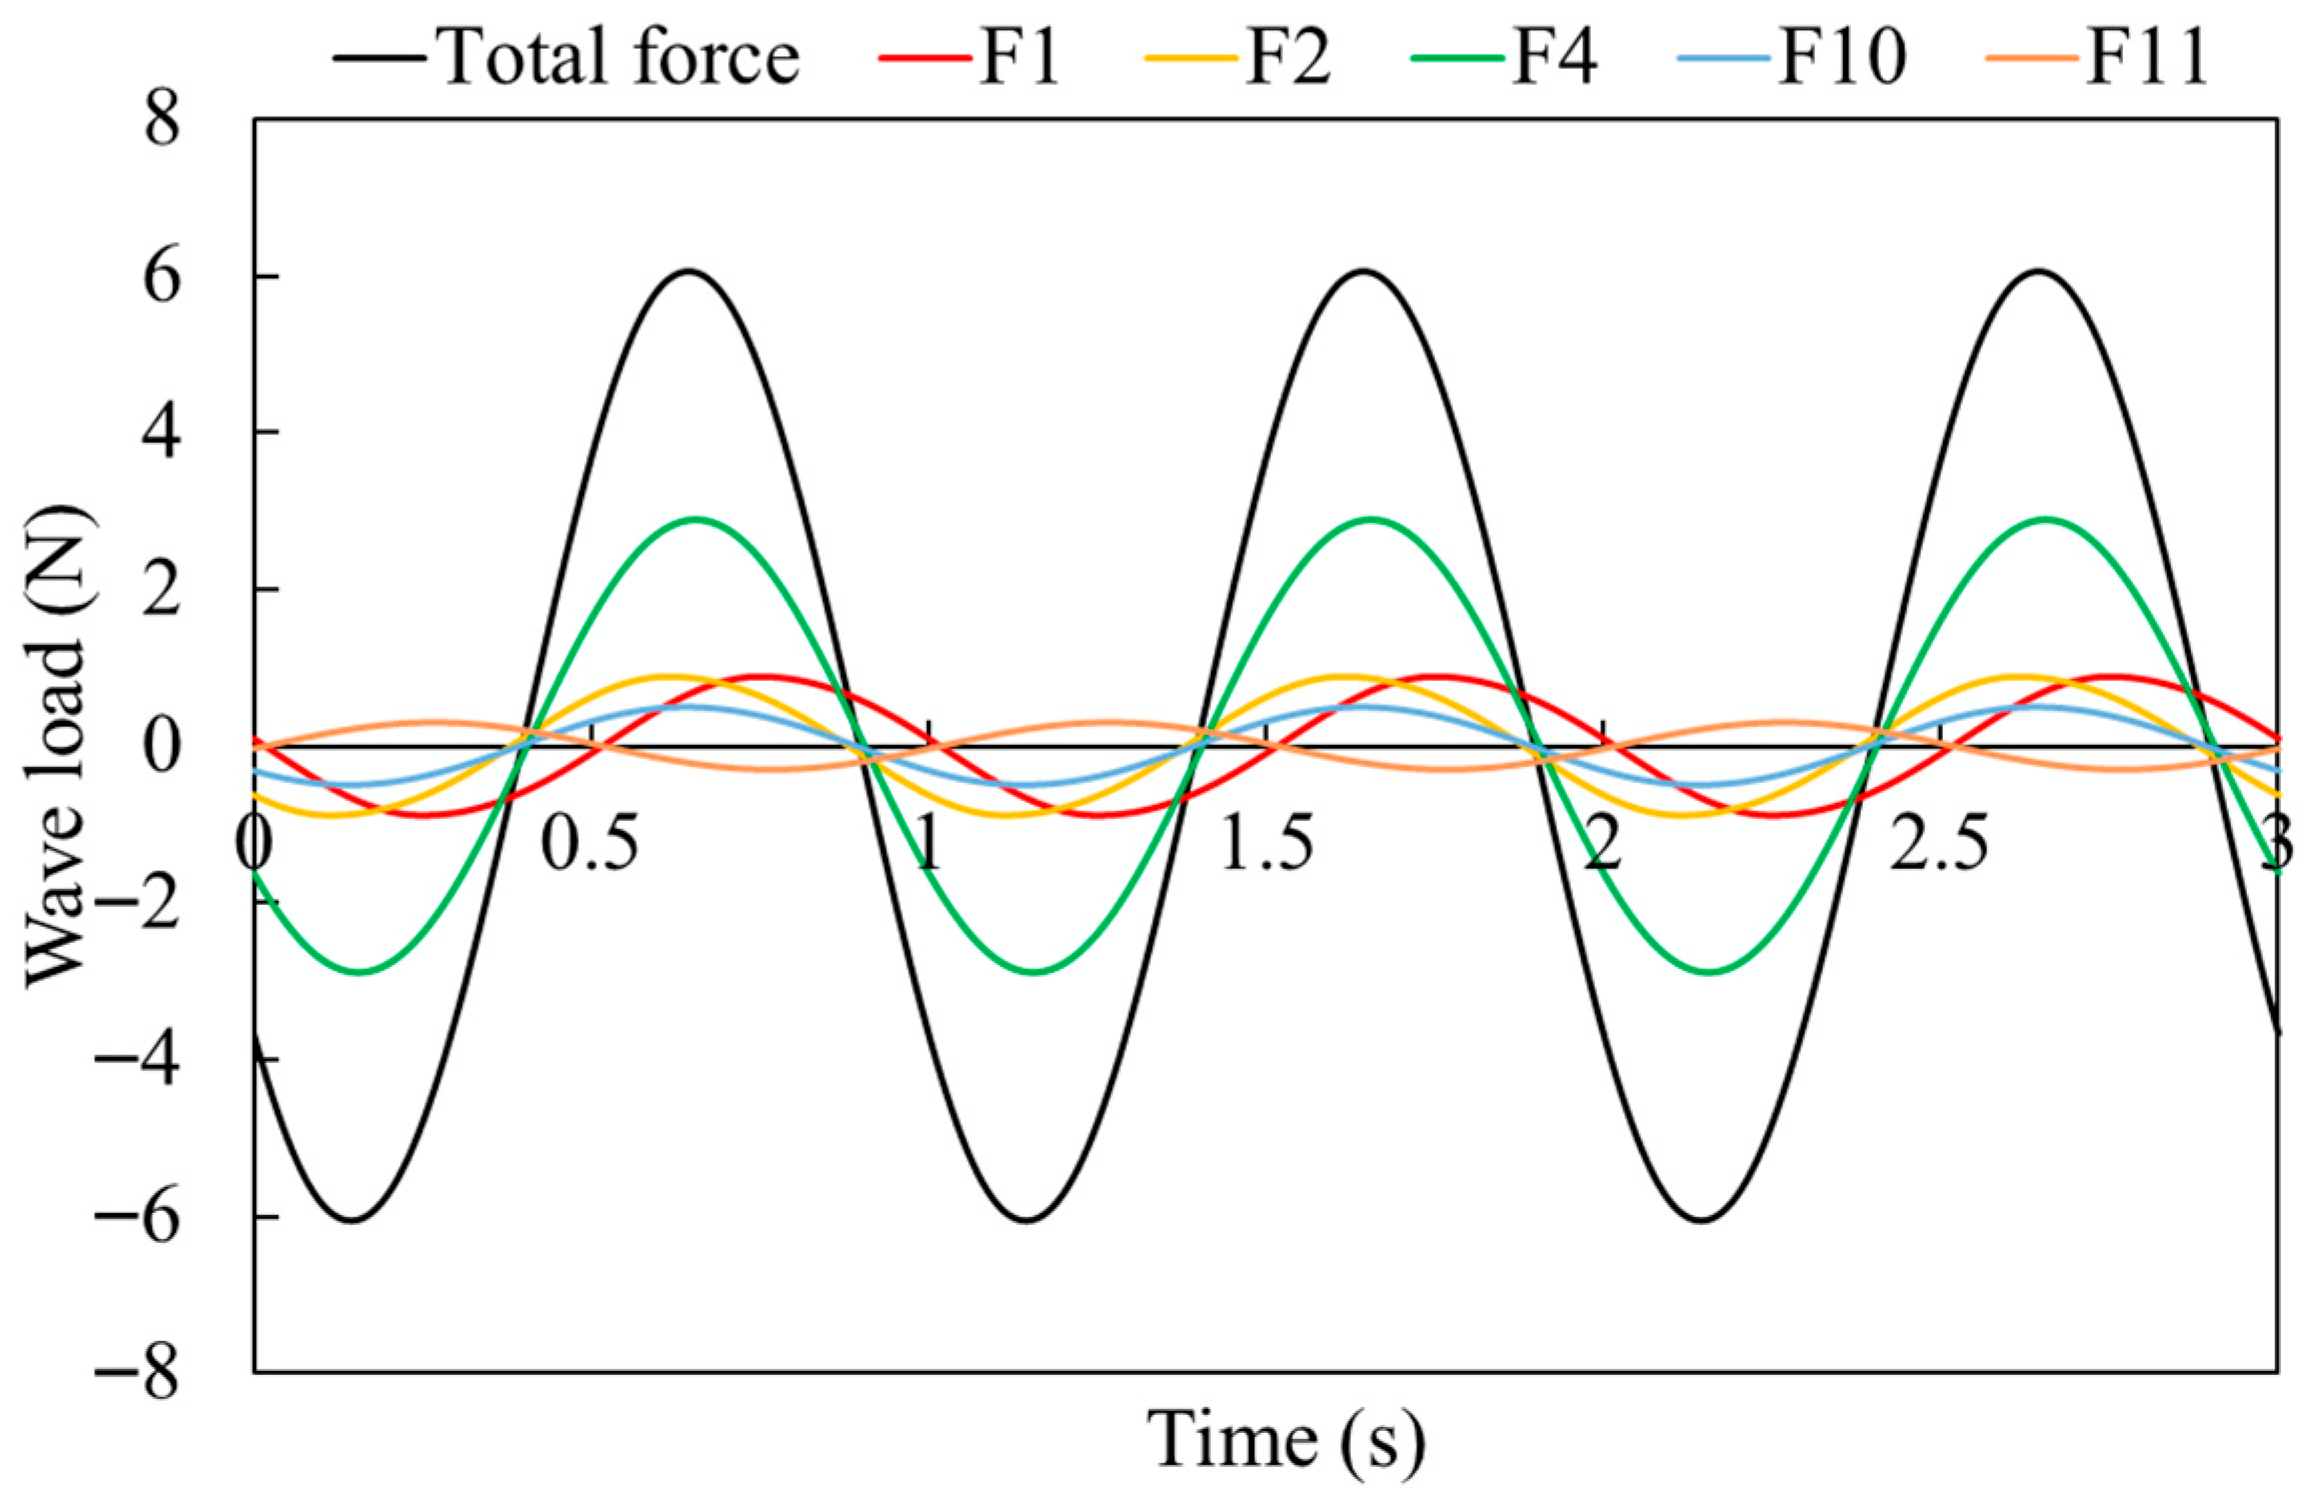
The relationship between the total force and the major component forces under Case 1 is illustrated in Figure 10. The total force is obtained through the linear superposition of all component forces in the time domain, rather than by the arithmetic summation of their peak values. Since the major component forces are nearly in-phase, the total force peak occurs when the peaks of these component forces are temporally aligned.
Wavelength is a primary factor governing phase differences among component forces. Since wavelength is directly related to wave period, variations in wave period alter the distribution of component forces. The wave loads on each component under Case 3 are presented in Figure 11. The wavelength in Case 3 differs significantly from that in Case 1. This variation in wavelength alters the phase among the peaks of the component forces. Specifically, the phase difference between component forces 1 and 2 increases markedly, approaching 180°, which exerts a negative effect on the total force. Additionally, the change in wavelength modifies the phase differences among the units within components. As a result, component forces 3, 6, and 9 increase significantly, exceeding the magnitude of component force 11.
The relationship between the total force and the major component forces under Case 3 is illustrated in Figure 12. The primary distinction between Case 1 and Case 2 lies in the wave height. Although the phase differences remain similar to those in Case 1, the peak values of the component forces increase in Case 2 due to the larger wave height. Consequently, the total force increases significantly. In contrast, although Case 3 also features a larger wave height than Case 1, the considerably larger phase differences between the peaks of the component forces lead to negative effects among components. This results in a smaller total force in Case 3 compared to Case 2.

3.3. Effect of the Inflow Angle on the Total Force

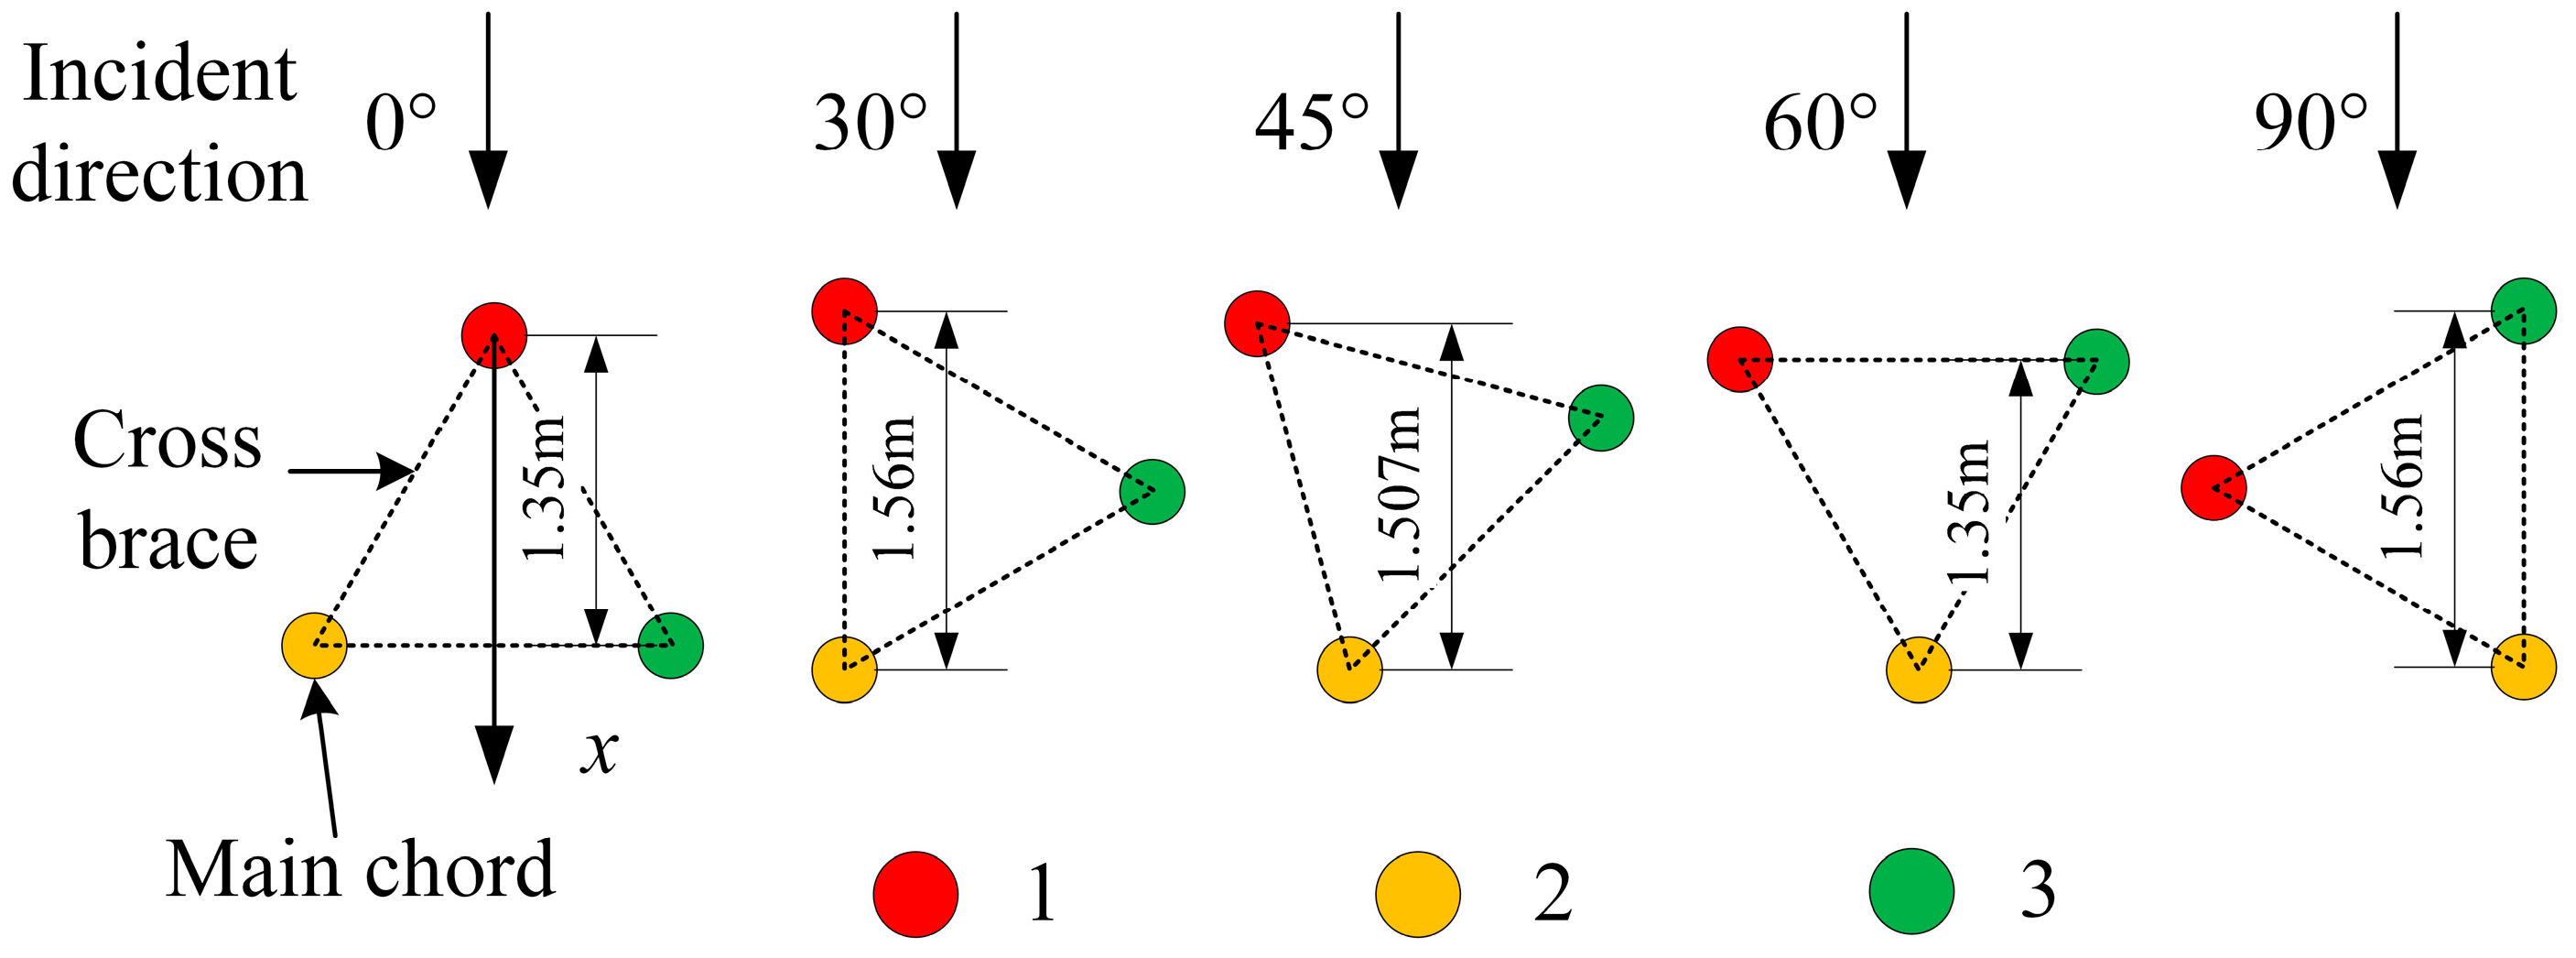
Variations in the inflow angle alter the relative positions of the components. As the main chords contribute predominantly to the total force, they are numbered as an example for analysis. The pile spacing along the direction of incidence and the inflow angle are shown in Figure 13 [15].
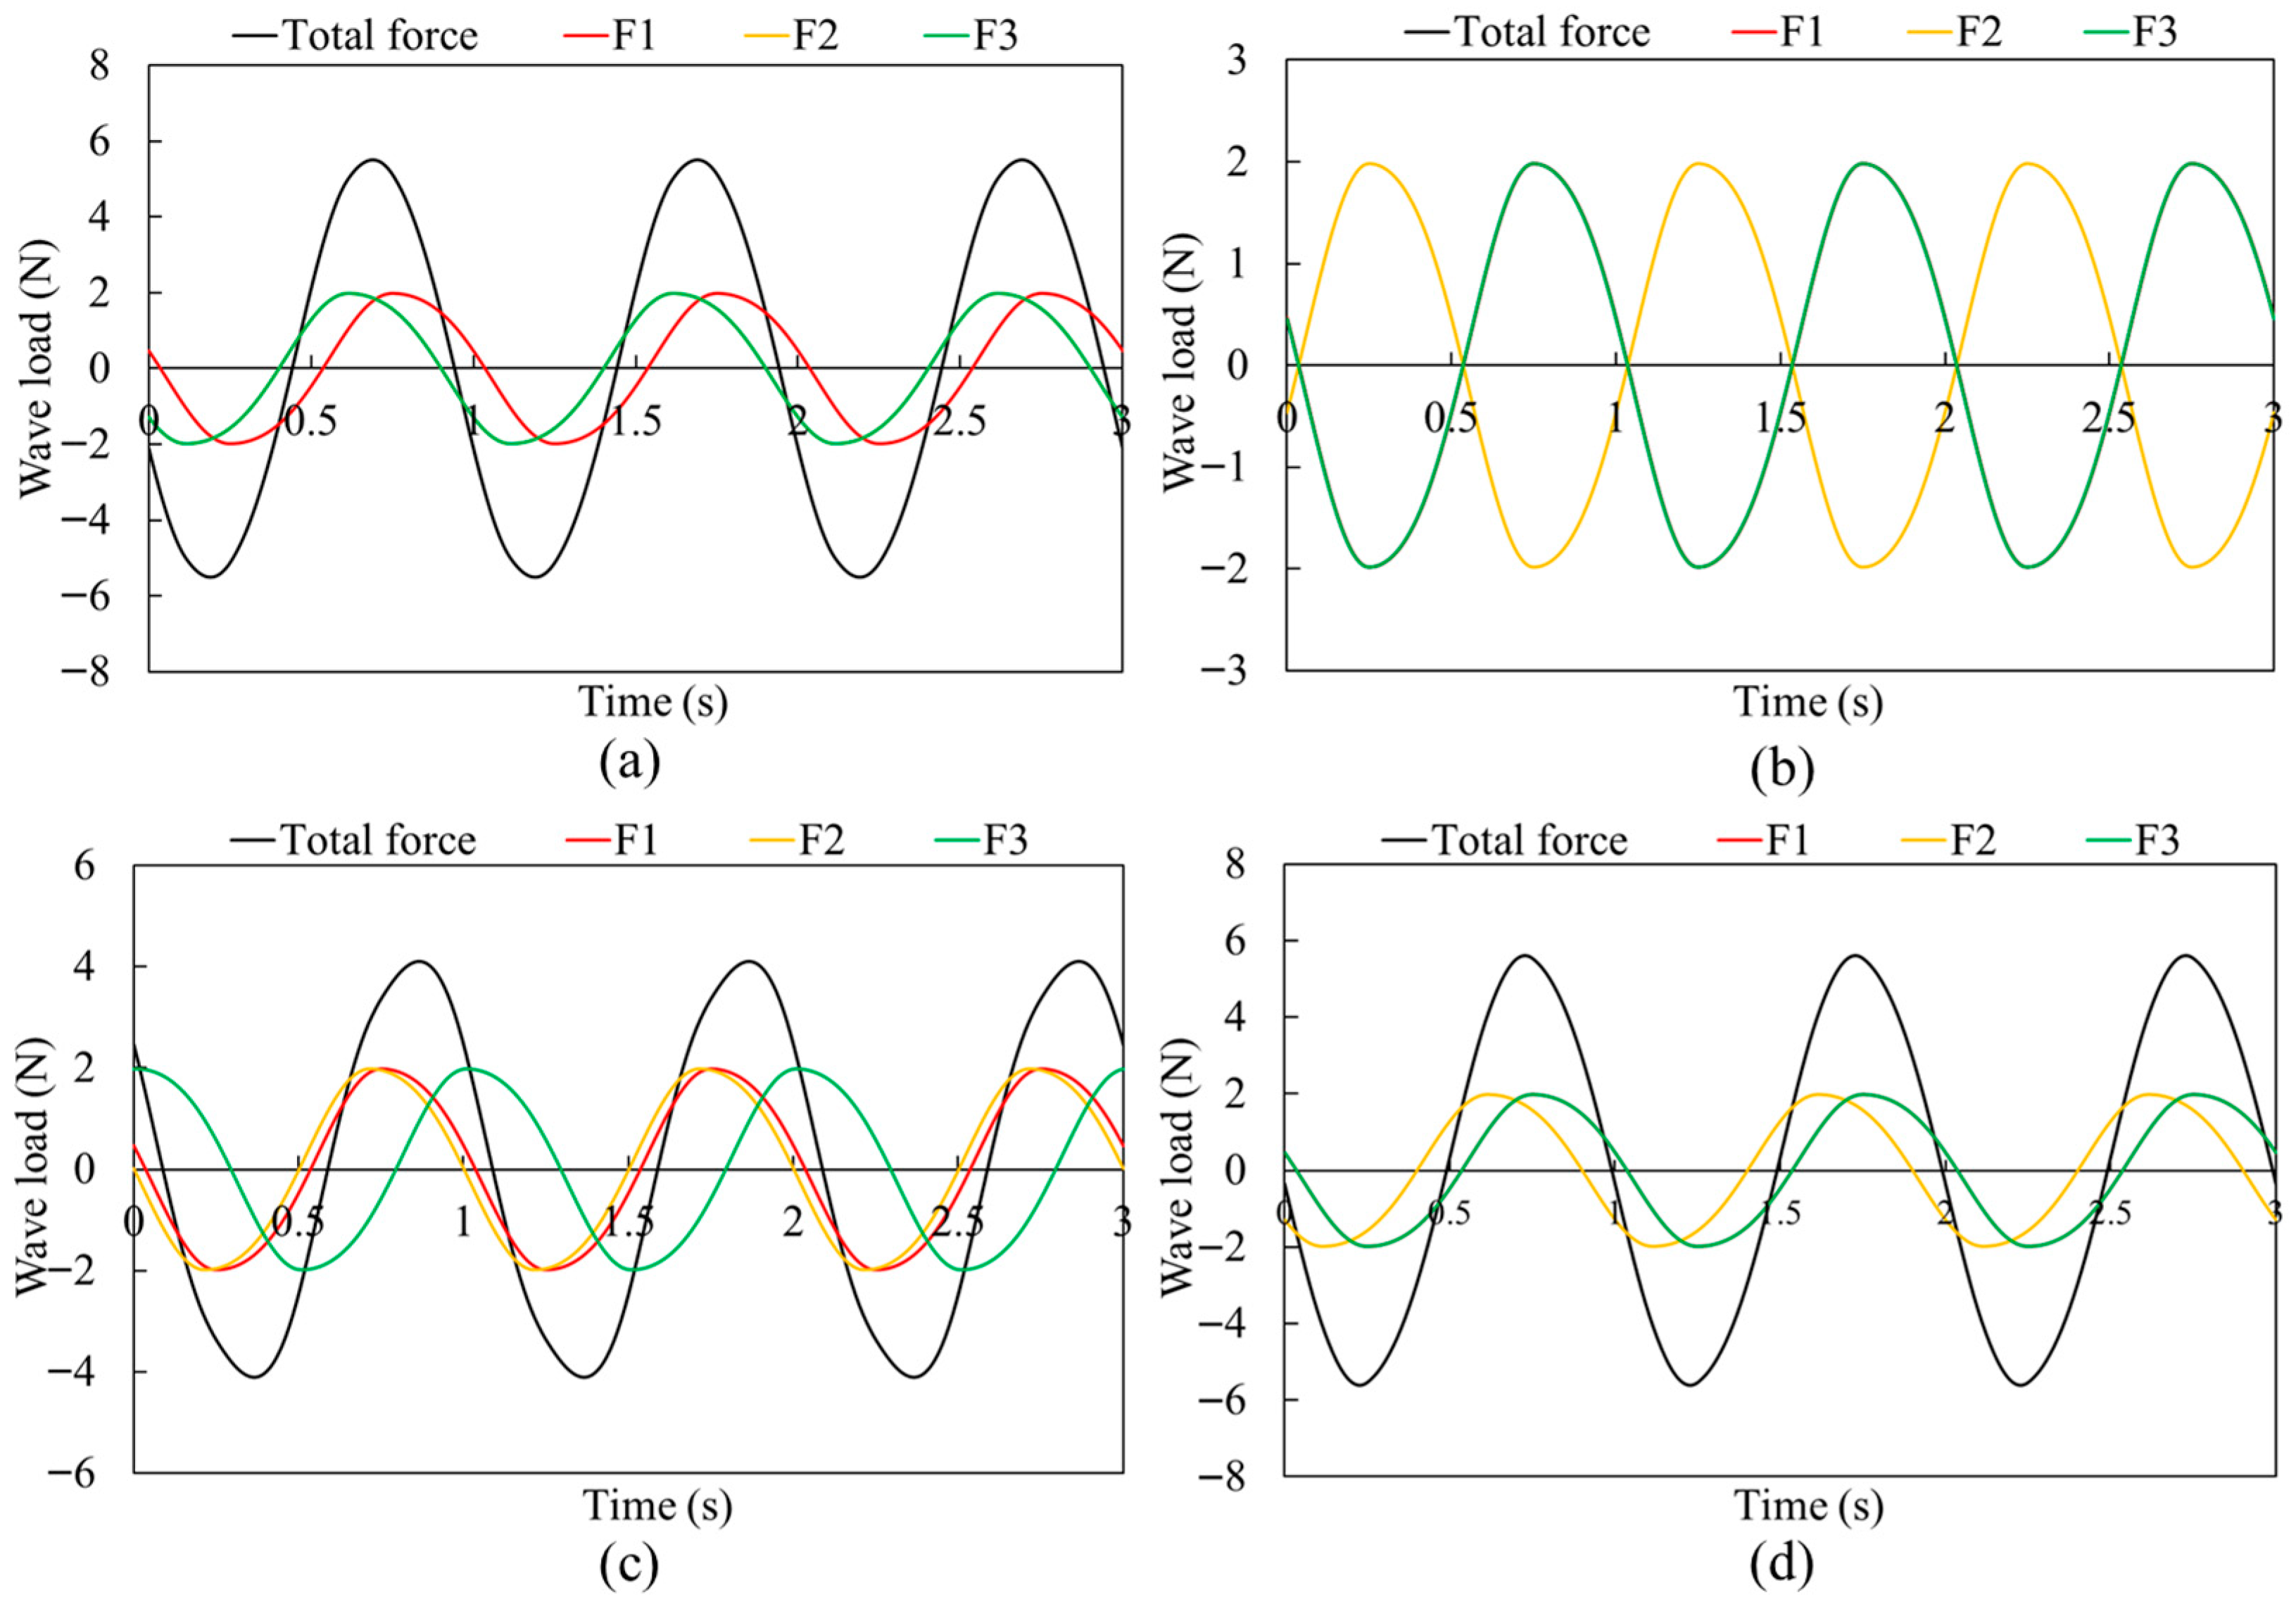
The relative configuration of components at 0° and 60° inflow angles is essentially identical, indicating a periodic variation with a 60° cycle. This finding is consistent with the component force coefficient method for truss legs reported by Xie et al. [15]. The total and component forces under different inflow angles in Case 2 are presented in Figure 14. In Case 2, the wavelength measures 1.618 m, which is slightly larger than the maximum pile spacing. The greatest phase difference occurs at a 30° inflow angle, reaching nearly 180°. The results indicate a negative correlation between the total force and the phase difference among component forces.
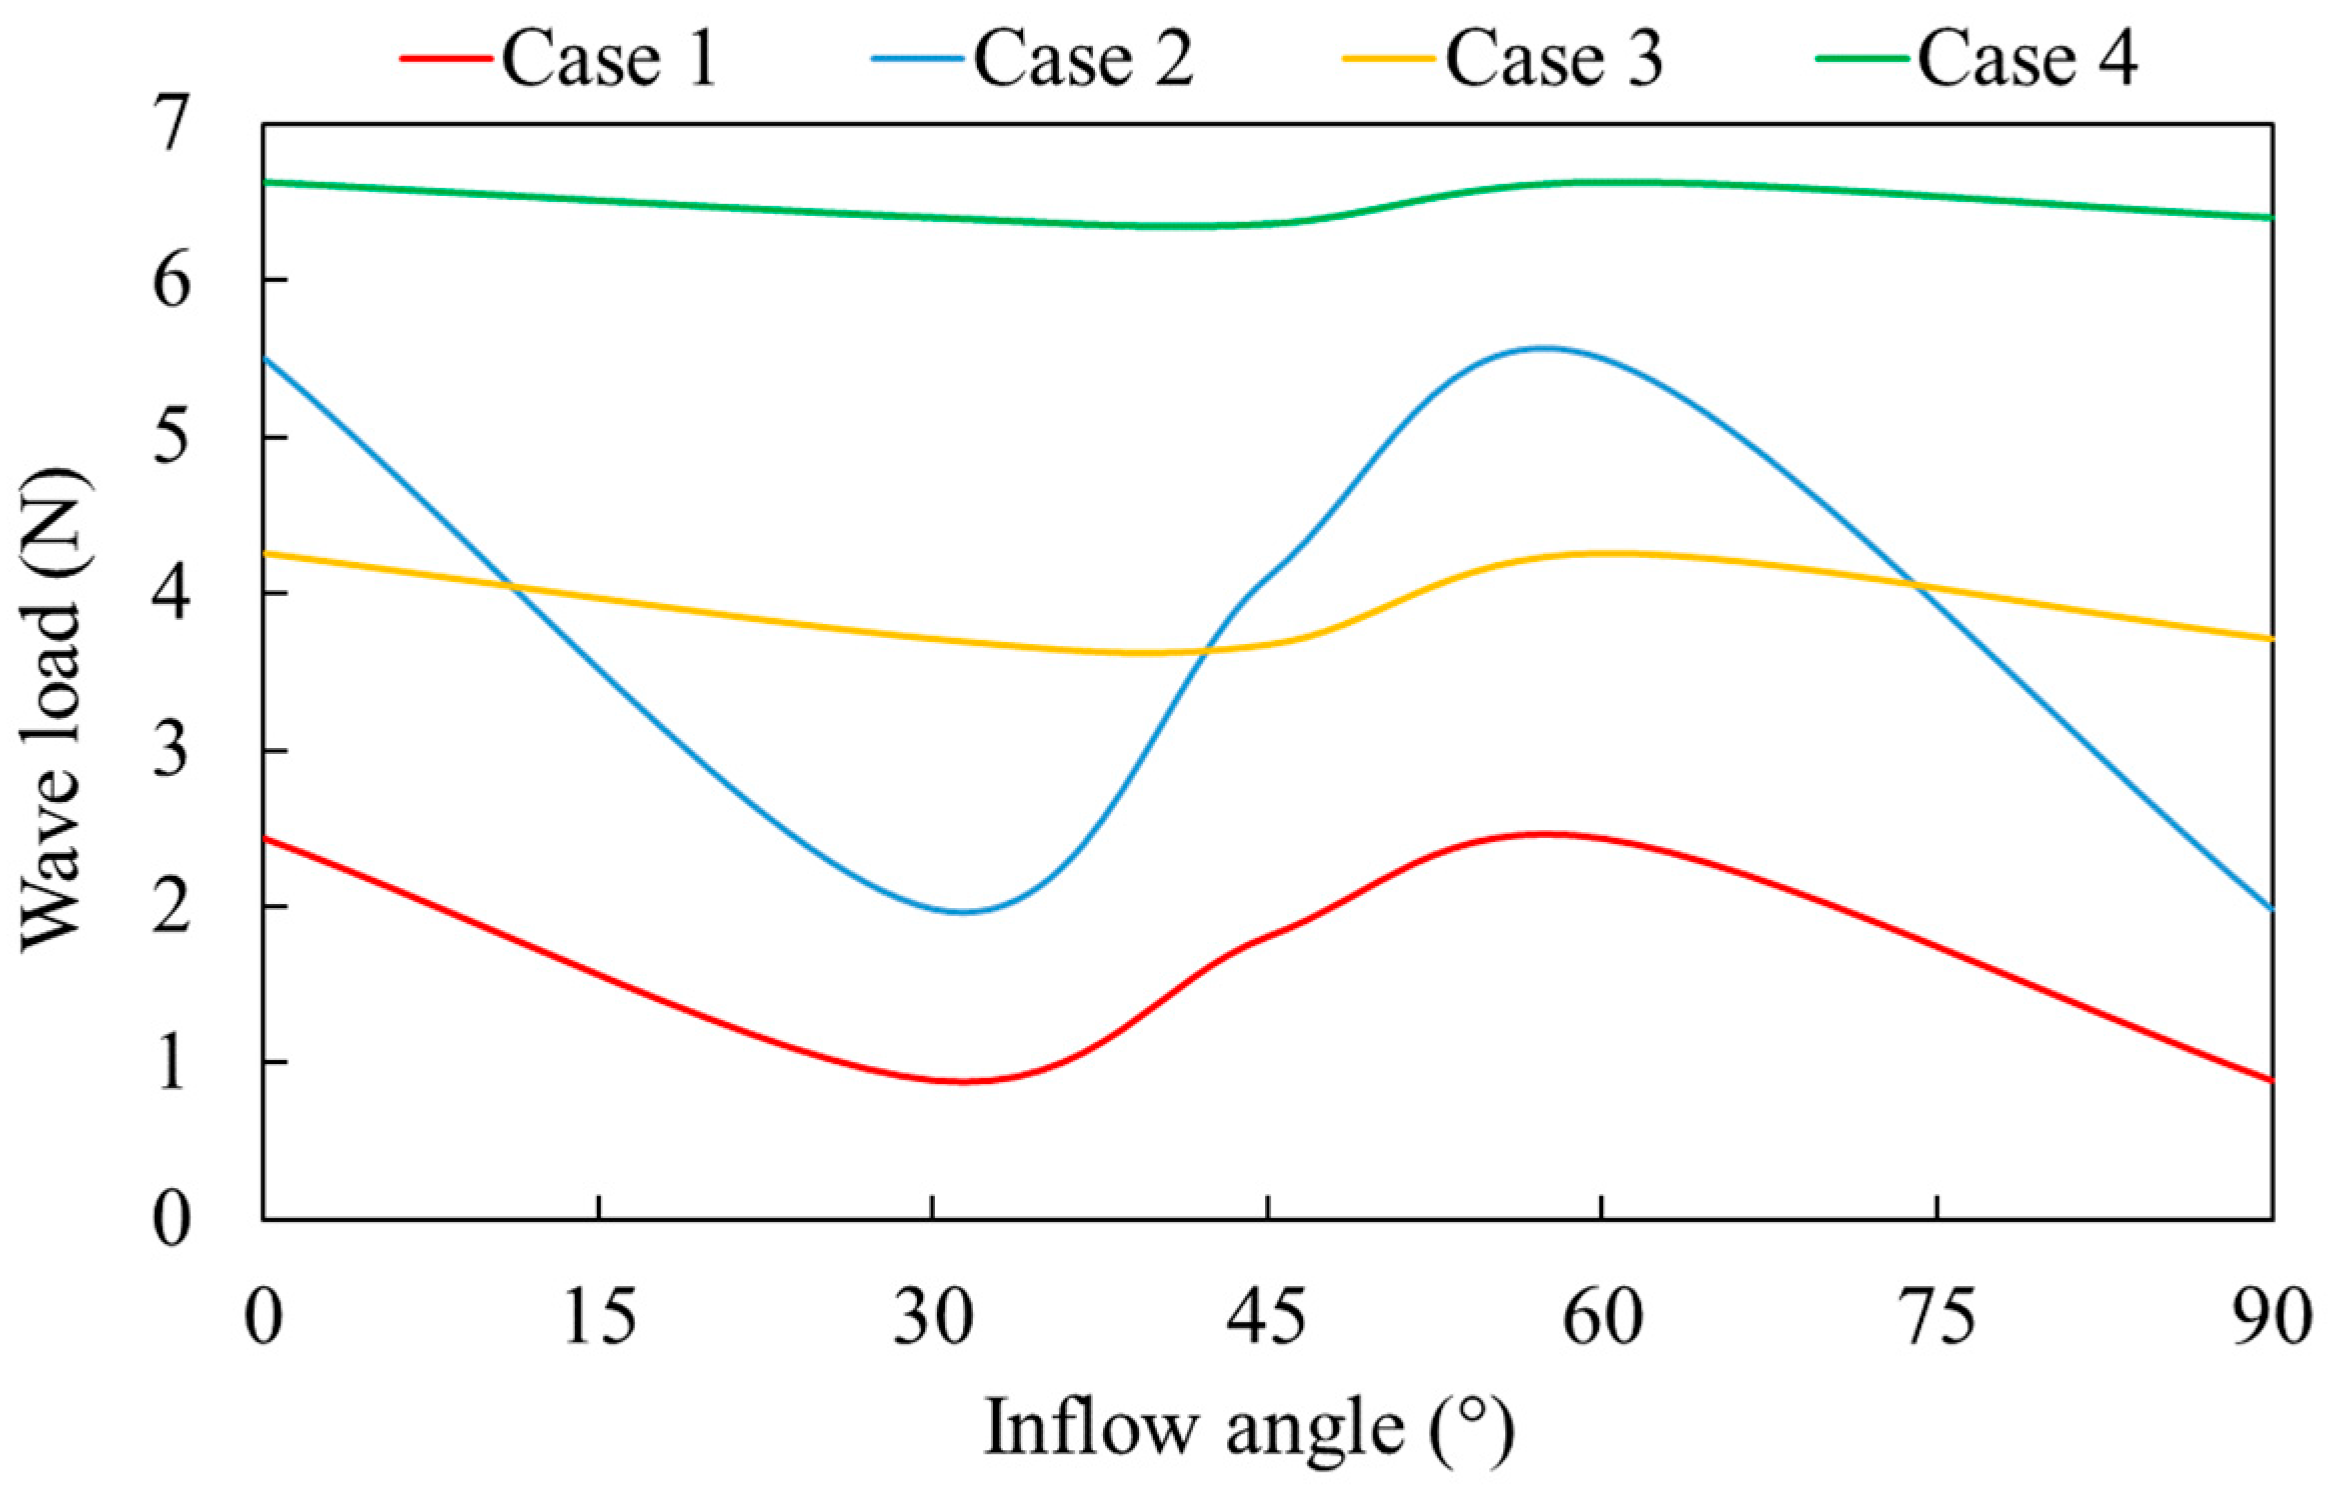
Furthermore, wavelength influences the phase between the peak values of the component forces. As the wavelength varies, so does the total force under different inflow angles, as illustrated in Figure 15. Although the wavelength in Case 2 is slightly larger than in Case 1, the phase differences among components remain similar. However, due to the larger wave height in Case 2, the component force peaks are greater, leading to a larger total force compared to Case 1. While Case 3 has a larger wave height than Case 2, its wavelength is approximately twice the maximum pile spacing. This results in a consistently large phase difference (around 180°). Consequently, the total force is nearly equivalent to that of a single component force and is sometimes even smaller than in Case 2. In Case 4, both wave height and wavelength are larger than those of Case 3, with the wavelength being significantly larger than the pile spacing. The maximum phase difference is 102°, resulting in a relatively minor negative effect, and yielding a total force larger than in Case 3. In summary, when the wavelength is sufficiently large relative to the pile spacing, the influence of inflow angle on the total force becomes negligible.

4. Conclusions

Jack-up offshore platforms, supported by truss legs, are integral to the development of marine energy resources, including oil, gas, and offshore wind. This study combined experiments, numerical simulations, and theoretical analyses to investigate wave loads on truss legs. The main conclusions are summarized as follows:
(1)
Significant differences exist among the component forces. Two key factors affect these forces: locations and phase differences. Components near the free surface experience significantly larger forces. Additionally, phase differences between component units lead to variations in force magnitude, with in-phase components exhibiting higher forces. The phase relationship between the peak forces of components also considerably influences the total force. The maximum total force is negatively correlated with the phase difference between the peaks of the major component forces.
(2)
The influence of inflow angle on total force is periodic with a 60° cycle. The effect is most pronounced when the wavelength is comparable to the pile spacing. For much longer wavelengths, the inflow angle has a negligible impact.
The proposed framework is primarily applicable to truss legs with slender components (D/λ ≤ 0.2) operating under regular waves in medium-to-deep water (h/λ > 0.3). This framework fundamentally establishes a theoretical basis for the structural optimization of Jack-up offshore platform support systems, thereby ensuring the safety and efficiency of energy extraction operations.
In the future, research can extend the analysis to irregular wave conditions to better represent real marine environments. Additionally, investigating fluid–structure interaction effects will enhance practical applicability.

Author Contributions

Conceptualization, H.Y. and Y.X.; methodology, X.L.; software, J.Z.; validation, D.-L.C., J.H., and G.L.; formal analysis, H.Y.; investigation, J.H.; data curation, H.Y. and J.H.; writing—original draft preparation, H.Y.; writing—review and editing, D.-L.C.; visualization, H.Y.; supervision, D.-L.C. and C.-L.Z.; project administration, Y.X.; funding acquisition, Y.X. All authors have read and agreed to the published version of the manuscript.

Funding

This research was funded by the National Natural Science Foundation of China, grant number 52471352; the Taishan Scholars Program of Shandong Province, grant number tstp20231215; and the Postdoctoral Fellowship Program of CPSF, grant number GZC20252061.

Data Availability Statement

The original contributions presented in this study are included in the article. Further inquiries can be directed to the corresponding author.

Acknowledgments

We appreciate the Department of Mechanical and Electrical Engineering, Ocean University of China (Qingdao), for its supportive academic environment and the necessary research facilities.

Conflicts of Interest

The authors declare no conflicts of interest.

References

  1. Morison, J.R.; Johnson, J.W.; Schaaf, S.A. The force exerted by surface waves on piles. J. Pet. Technol. 1950, 2, 149–154. [Google Scholar] [CrossRef]
  2. Keulegan, G.H.; Carpenter, L.H. Forces on cylinders and plates in an oscillating fluid. JRNBS 1958, 60, 423–440. [Google Scholar] [CrossRef]
  3. Chakrabarti, S.K.; Wolbert, A.L.; Tam, W.A. Wave forces on vertical circular cylinder. J. Waterw. Harb. Coast. Eng. Div. 1976, 102, 203–221. [Google Scholar] [CrossRef]
  4. Sarpkaya, T. Force on a circular cylinder in viscous oscillatory flow at low keulegan—Carpenter numbers. J. Fluid Mech. 1986, 165, 61–71. [Google Scholar] [CrossRef]
  5. Raed, K.; Soares, C. Variability effect of the drag and inertia coefficients on the morison wave force acting on a fixed vertical cylinder in irregular waves. Ocean Eng. 2018, 159, 66–75. [Google Scholar] [CrossRef]
  6. Liu, G.; Li, H.; Qiu, Z.; Leng, D.; Li, Z.; Li, Z.; Li, W. A mini review of recent progress on vortex-induced vibrations of marine risers. Ocean Eng. 2020, 195, 106704. [Google Scholar] [CrossRef]
  7. Sundar, V.; Vengatesan, V.; Anandkumar, G.; Schlenkhoff, A. Hydrodynamic coefficients for inclined cylinders. Ocean Eng. 1998, 25, 277–294. [Google Scholar] [CrossRef]
  8. Chakrabarti, S.K. Wave forces on vertical array of tubes. Proc. Civ. Eng. Ocean 1979, 1, 241–259. [Google Scholar]
  9. Bonakdar, L.; Oumeraci, H. Pile group effect on the wave loading of a slender pile: A small-scale model study. Ocean Eng. 2015, 108, 449–461. [Google Scholar] [CrossRef]
  10. Bonakdar, L.; Oumeraci, H.; Etemad-Shahidi, A. Wave load formulae for prediction of wave-induced forces on a slender pile within pile groups. Coast. Eng. 2015, 102, 49–68. [Google Scholar] [CrossRef]
  11. Liu, S.; Ong, M.C.; Obhrai, C.; Seng, S. Computational fluid dynamics simulations of regular and irregular waves past a horizontal semi-submerged cylinder. J. Offshore Mech. Arct. Eng. 2018, 140, 031801. [Google Scholar] [CrossRef]
  12. Deng, X.; Liu, S.; Ong, M.C.; Ji, C. Numerical simulations of free-surface waves past two vertically aligned horizontal circular cylinders. Ocean Eng. 2019, 172, 550–561. [Google Scholar] [CrossRef]
  13. Koterayama, W.; Matsumoto, N. Experimental study of hydrodynamic forces and wave forces exerted on a truss structure. Ocean Eng. 1982, 9, 221–234. [Google Scholar] [CrossRef]
  14. Tian, X.; Liu, Y.; Liu, G.; Xie, Y.; Wang, S. Experimental study on influencing factors of hydrodynamic coefficient for jack-up platform. Ocean Eng. 2019, 193, 106588. [Google Scholar] [CrossRef]
  15. Xie, Y.; Huang, J.; Li, X.; Tian, X.; Liu, G.; Leng, D. Experimental study on hydrodynamic characteristics of three truss-type legs of jack-up offshore platform. Ocean Eng. 2021, 234, 109305. [Google Scholar] [CrossRef]
  16. Ye, H.; Yu, D.; Ye, J.; Yang, Z. Numerical analysis of dynamics of jack-up offshore platform and its seabed foundation under ocean wave. Appl. Sci. 2022, 12, 3299. [Google Scholar] [CrossRef]
  17. Gao, J.; Shang, Y.; Ding, L.; Feng, X. Simulation of overall performance of jack up platforms under multiple working conditions. In Methods and Applications for Modeling and Simulation of Complex Systems; Springer: Singapore, 2024; Volume 2170, pp. 3–13. [Google Scholar]
  18. Finnegan, W.; Goggins, J. Numerical simulation of linear water waves and wave–structure interaction. Ocean Eng. 2012, 43, 23–31. [Google Scholar] [CrossRef]
  19. Prasad, D.D.; Ahmed, M.R.; Lee, Y.H.; Sharma, R.N. Validation of a piston type wave-maker using numerical wave tank. Ocean Eng. 2017, 131, 57–67. [Google Scholar] [CrossRef]
  20. Tian, X.; Wang, Q.; Liu, G.; Deng, W.; Gao, Z. Numerical and experimental studies on a three-dimensional numerical wave tank. IEEE Access 2018, 6, 6585–6593. [Google Scholar] [CrossRef]
  21. Qiao, D.; Feng, C.; Yan, J.; Liang, H.; Ning, D.; Li, B. Numerical simulation and experimental analysis of wave interaction with a porous plate. Ocean Eng. 2020, 218, 108106. [Google Scholar] [CrossRef]
  22. Oliveira, D.; Lopes de Almeida, J.P.P.G.; Santiago, A.; Rigueiro, C. Development of a cfd-based numerical wave tank of a novel multipurpose wave energy converter. Renew. Energy 2022, 199, 226–245. [Google Scholar] [CrossRef]
  23. De Vita, F.; Di Mascio, A.; Onorato, M. A navier–stokes numerical wave tank with a pressure-based relaxation zone method. Ocean Eng. 2022, 266, 113207. [Google Scholar] [CrossRef]
  24. Yu, X.; Shao, Y.; Fuhrman, D.R.; Zhang, Y. A viscous numerical wave tank based on immersed-boundary generalized harmonic polynomial cell (ib-ghpc) method: Accuracy, validation and application. Coast. Eng. 2023, 180, 104273. [Google Scholar] [CrossRef]
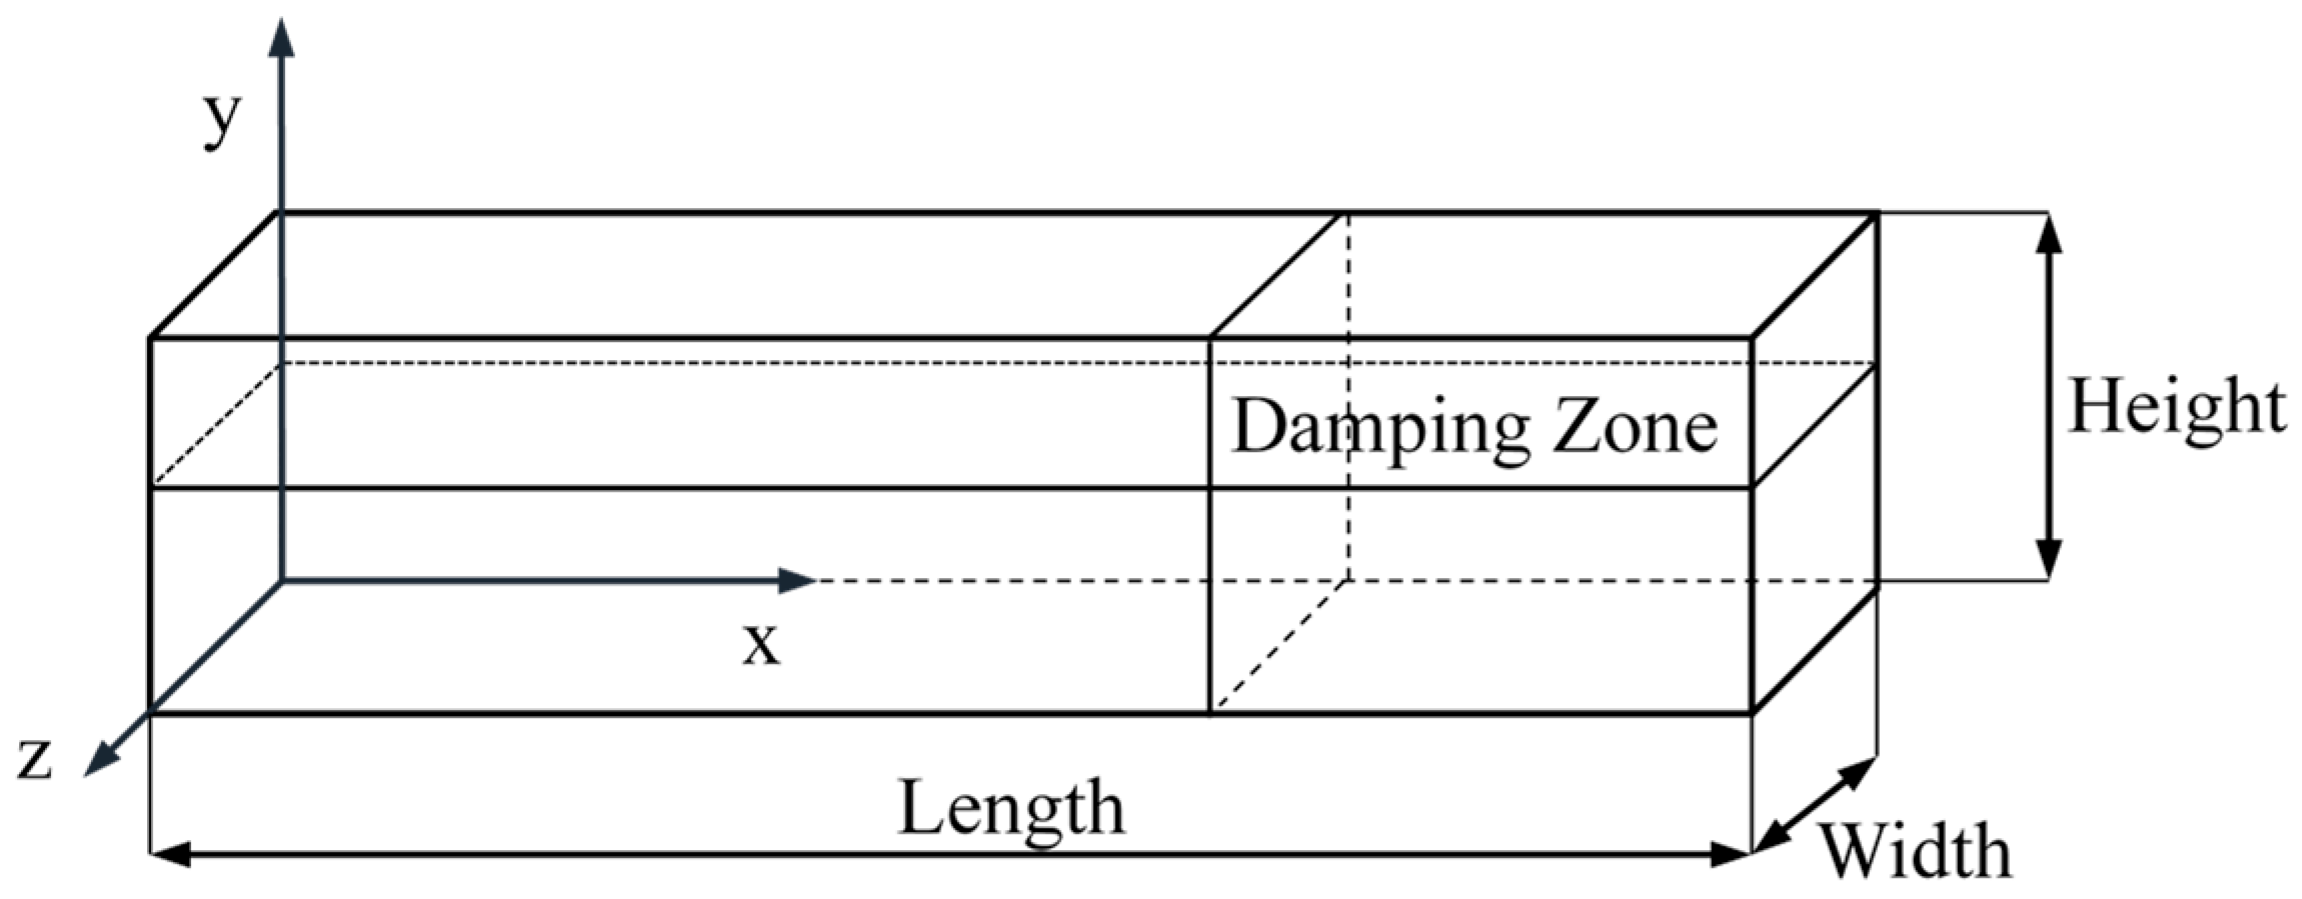
Figure 1. Schematic diagram of three-dimensional NWT.
Energies 18 05032 g001
Figure 2. Diagram of the truss leg at 0° inflow angle. (a) Experimental tank; (b) numerical tank.
Energies 18 05032 g002
Figure 3. Experimental model.
Energies 18 05032 g003
Figure 4. Schematic view of the NWT with the truss leg.
Energies 18 05032 g004
Figure 5. Validation of numerical simulation.
Energies 18 05032 g005
Figure 6. The simulated wave load of the truss leg in Case 1.
Energies 18 05032 g006
Figure 7. Wave loads on the truss leg under different wave conditions.
Energies 18 05032 g007
Figure 8. The number of each component. Where the main chord includes No. 1 and No. 2, the cross brace includes No. 3 to 8, the inclined brace includes No. 9 and No. 10, and the inner cross brace includes No. 11 and No. 12.
Energies 18 05032 g008
Figure 9. The component force in Case 1.
Energies 18 05032 g009
Figure 10. The total force and the major component forces in Case 1.
Energies 18 05032 g010
Figure 11. The component force in Case 3.
Energies 18 05032 g011
Figure 12. The total force and the major component forces in Case 3.
Energies 18 05032 g012
Figure 13. The number of the main chord and the inflow angle.
Energies 18 05032 g013
Figure 14. The total force and component forces at different inflow angles in Case 2. (a) 0° inflow angle, (b) 30° inflow angle, (c) 45° inflow angle, and (d) 60° inflow angle.
Energies 18 05032 g014
Figure 15. The total force at different inflow angles.
Energies 18 05032 g015
Table 1. Mesh characteristics.
Mesh Type1234
Lx20406080
Hy5101520
Δx (m)0.080.040.0270.02
Δy (m)0.020.010.00670.005
Δxy4444
Table 2. Simulated wave height.
Mesh Type1234
Wave height (m)0.095320.097860.098630.09889
Relative tolerance4.68%2.14%1.37%1.11%
Table 3. Dimensions of each component of the experimental model.
DimensionMain ChordCross BraceInclined BraceInner Cross Brace
Diameter (m)0.0510.0380.0270.016
Length (m)2.11.560.880.78
Table 4. Test parameters.
ParametersValues
SymbolCase 1Case 2Case 3Case 4
Wave height (m)0.050.10.150.2
Wave period (s)111.52
Inflow angle (°)0, 30, 45, 60, and 90
Disclaimer/Publisher’s Note: The statements, opinions and data contained in all publications are solely those of the individual author(s) and contributor(s) and not of MDPI and/or the editor(s). MDPI and/or the editor(s) disclaim responsibility for any injury to people or property resulting from any ideas, methods, instructions or products referred to in the content.