Article

Optimizing the Thermodynamic Performance of the Fuel/Lubricating Oil Heat Exchanger for an Aeroengine

1
School of Aerospace Engineering and Applied Mechanics, Tongji University, Shanghai 200092, China
2
Department of Mechanical System Research, AECC Hunan Aviation Powerplant Research Institute, Zhuzhou 412002, China
3
Wuhuan Engineering Co., Ltd., Wuhan 430223, China
*
Author to whom correspondence should be addressed.
Energies 2025, 18(18), 4955; https://doi.org/10.3390/en18184955
Submission received: 22 May 2025 / Revised: 21 June 2025 / Accepted: 23 June 2025 / Published: 18 September 2025
(This article belongs to the Special Issue Advanced Thermal Management Technologies and Heat Transfer)

Abstract

HTRI xchanger Suite 6.0 software was employed to analyze the thermodynamic performance and thermal resistance distribution of the fuel/lubricating oil heat exchanger A for an aeroengine. Calculated results demonstrated good agreement with experimental results for both heat transfer and flow resistance characteristics. The thermal resistance analysis revealed that the tube-side contribution dominated, accounting for 84.6% of the total resistance. The whole aeroengine test revealed that insufficient tube-side velocity resulted in prolonged fuel filling time, subsequently delaying fuel ignition and affecting aeroengine starting. To address these issues while maintaining lubricating oil cooling requirements, a structural optimization incorporating twisted tape inserts was proposed. It was calculated by HTRI software that when the twist ratio and the thickness of twisted tape inserts was 4 and 0.5 mm, respectively, the optimized fuel/lubricating oil heat exchanger B demonstrated remarkable performance improvements, with an 82.6% reduction in total thermal resistance, a 213% increase in overall heat transfer coefficient, and an 18.0% reduction in total mass. A subsequent whole aeroengine test at the performance evaluation point confirmed that heat exchanger B successfully met all technical requirements of total mass, flow resistance, heat transfer rate, and aeroengine starting, simultaneously. The demonstrated methodology presents significant potential for broader aerospace thermal management applications, such as performance prediction of enhanced heat exchangers, multi-objective optimization of thermal systems, and integrated thermal management solutions.

1. Introduction

The lubricating oil system serves as the “circulatory system” of an aeroengine, performing the critical functions of lubrication and cooling for engine friction pairs, including bearings, seals, and gear transmissions. As a key component of this system, the fuel/lubricating oil heat exchanger facilitates thermal energy transfer between high-temperature lubricating oil and low-temperature fuel. This heat exchanger performs two essential roles: cooling the lubricating oil that circulates through engine components and recovering waste heat from friction to preheat the fuel. The heat exchanger’s thermal performance directly determines its heat load tolerance across the operating range. To ensure reliable aeroengine operation in a complex environment, studying its thermodynamic performance is crucial. A well-designed fuel/lubricating oil heat exchanger must align with thermodynamic characteristic curves to accommodate all possible engine operating conditions in flight, ensuring rapid and efficient heat removal from the lubricating oil.
Currently, three primary methods are employed for thermodynamic performance analysis of heat exchangers, namely, the experimental method [1,2], calculation method [3], and numerical simulation method [4,5]. The experimental method involves performance tests to determine key parameters such as heat transfer rate, flow resistance, and overall heat transfer coefficient under various operating conditions. While highly reliable for engineering applications, it is time-consuming, costly, and limited to specific test conditions. Thermodynamic characteristic curves are typically derived from extensive experimental data, yet each test setup has restricted applicability and cannot accommodate all heat exchangers’ configurations. The calculation method employs classical heat transfer equations, empirical correlations, and flow resistance formulas to evaluate performance based on structural parameters. The two most widely used approaches are the Logarithmic Mean Temperature Difference (LMTD) method and the Effectiveness-NTU (ε-NTU) method. These are commonly applied in heat exchanger design, performance checking, and analysis. However, since these correlations are derived from experimental data, they may not fully capture the thermodynamic behavior of all heat exchanger configurations. The numerical simulation method relies on computational fluid dynamics (CFD) software (e.g., Fluent, CFX) to solve the governing equations—continuity, momentum, and energy equations. Although this method provides detailed flow and thermal insights, simplifications in boundary conditions can introduce errors. Additionally, the process of model setup, data analysis, and validation is often computationally intensive and time-consuming.
These three methods have been widely applied in the study of lubricating oil cooling systems. Gu et al. [6] evaluated the shell-side heat transfer characteristics of a shell-and-tube fuel/lubricating oil heat exchanger using the Kern method, Bell–Delaware method, and dividable simulation method. Cai et al. [7] developed a novel arc-shaped plate-fin air-lubricating oil radiator and analyzed its fin performance through numerical simulations and experiments, reporting an average thermal resistance error of 13%. By investigating the heat transfer and flow characteristics of the lubricating oil side across different flowing passage structures and dimensions, they optimized the radiator design to meet practical operational demands. Zhang et al. [8] introduced an innovative airflow internal-surface air–oil heat exchanger and examined the influence of fin structures. Their findings revealed that fins with uniform thickness exhibited a 3.4% higher heat transfer capacity than those with a gradually varying thickness. Additionally, the total pressure ratio between the inlet and outlet was found to be below 0.0001, indicating minimal flow resistance.
Shell-and-tube heat exchangers are widely used due to their simple structure, low cost, large flow cross-section, and adaptability to diverse operating conditions. For this reason, they are commonly employed for heat transfer between fuel and lubricating oil in aeroengines. The tube-side heat transfer coefficient depends on the fluid flow state and can be calculated using established correlations such as the Dittus–Boelter or Sieder–Tate correlations, which offer a balance of simplicity and accuracy. At present, the Colburn–Donohue method [9], Kern method [10], Bell–Delaware method [11], and flow path analysis method [12] are commonly adopted to calculate the shell-side heat transfer performance of heat exchangers with segmental (bow) baffles. Colburn–Donohue first proposed a comprehensive design method for shell-and-tube type heat exchangers based on ideal tube row data. Kern improved the Colburn–Donohue method by incorporating a more comprehensive analysis of shell-side and tube-side fluid flow states, temperature distribution, heat transfer mechanisms, fouling resistance, and structural effects. However, while both the Colburn–Donohue and Kern methods are computationally simple, they inadequately account for bypass and leakage flows, leading to overly conservative estimates of heat transfer and flow resistance. Tinker [13] developed a complex flow model by analyzing shell-side fluid flow paths and categorizing them into several different flow paths, such as cross flow, leakage flow, bypass flow, and so on. The Bell–Delaware method further refined Tinker’s model by introducing correction coefficients to adjust the ideal convective heat transfer coefficient for each flow path’s influence. However, it did not fully account for interactions between flow paths. While this method improved accuracy and remained practical for manual calculations, its empirical coefficients and exponents were derived from regression analysis of experimental data, limiting its applicability in certain scenarios. Based on these established calculation methods, including the Tinker flow model and the Bell–Delaware method, Heat Transfer Research Inc. (HTRI) developed a widely adopted shell-side flow model and flow path analysis method, incorporating proprietary research. HTRI later introduced the HTRI xchanger Suite software, incorporating empirical formulas to calculate heat transfer and flow resistance. This software enables the design and performance verification of diverse heat exchangers such as air coolers, shell-and-tube type heat exchangers, and so on.
While HTRI software is widely used for industrial-scale heat exchanger design, its applicability to small-scale heat exchangers, particularly in aerospace applications, remains unexplored. In this paper, process data and structural parameters of a shell-and-tube fuel/lubricating oil heat exchanger from an aeroengine were input into HTRI xchanger Suite 6.0 software to calculate outlet temperatures and flow resistances near the performance evaluation point. The results were compared with experimental data to assess HTRI’s feasibility and accuracy. Further, an HTRI-based thermal resistance analysis was conducted to identify the decisive factors limiting heat transfer. Based on these findings and supported by the whole aeroengine test, an improved fuel/lubricating oil heat exchanger B incorporating twisted tape inserts was proposed. The key structural parameters (twist ratio and thickness of twisted tape inserts) were determined through HTRI-supported analysis. A series of experiments were then performed on the fuel/lubricating oil heat exchanger B. Outlet temperatures and flow resistances obtained from experiments were compared with HTRI predictions to further evaluate the software’s accuracy for small-scale fuel/lubricating oil heat exchangers. Finally, the optimization scheme was further validated through the performance evaluation and the whole aeroengine test.

2. Correlation Formulas

Heat transfer rate Q:
Q = m h c p h T 1 T 2 h = m c c p c T 2 T 1 c
Overall heat transfer coefficient K:
K = Q A Δ t m
Logarithmic mean temperature difference Δ t m :
Δ t m = Δ T 1 Δ T 2 l n ( Δ T 1 / Δ T 2 )
Heat transfer area A:
A = 2 π d o l
Total thermal resistance R:
R = 1 K = 1 α i A o A i + R s i A o A i + b λ A o A m + R s o + 1 α s
Reynolds number Re:
R e = ρ u d μ
Nusselt number Nu:
N u = α D λ
Resistance coefficient f:
f = 8 Δ P ρ u 2 d i l
Overall thermal performance evaluation criterion PEC:
P E C = ( N u N u o ) / ( f f o ) 1 3
Twist ratio y:
y = H / d i

3. Experimental Sections

The experimental system comprises two independent circuits: a lubricating oil circuit and a fuel circuit, as illustrated in Figure 1. Key system parameters, along with their corresponding measurement accuracies, are provided in Table S1. The system uses RP-3 aviation kerosene as the working fuel and Mobil Jet Oil II as the lubricating fluid. In the lubricating oil circuit, oil from the lubricating oil tank is preheated to the desired temperature and then pumped into the pipeline by a lubricating oil pump. The heated lubricating oil then enters the shell side of the fuel/lubricating oil heat exchanger. Meanwhile, in the fuel circuit, fuel from the fuel tank at ambient temperature is preheated to the required temperature and pumped into the pipeline by a fuel pump. Heat transfer occurs as the fuel flows countercurrent to the lubricating oil. Following heat exchange, the heated fuel returns to the fuel tank, while the cooled lubricating oil returns to the lubricating oil tank.
A complete experiment usually takes about 2 h. Firstly, the flow rate, inlet temperature, and inlet pressure of each section are precisely adjusted to meet experimental requirements. The system then reaches thermal equilibrium over a period of time, typically 15~45 min. After the system remains stable for 30 min, flow rate, temperature, and pressure data are recorded. Three repetitions were conducted for each experiment condition to ensure statistical reliability.
Under ground-state conditions of room temperature and atmospheric pressure, the performance evaluation points are as follows: lubricating oil (inlet temperature: 108 ± 1 °C, inlet pressure: 0.5 ± 0.05 MPa, and volumetric flowrate: 14.6 ± 0.5 L/min) and fuel (inlet temperature: 60 ± 1 °C, inlet pressure: 6.1 ± 0.05 MPa, and volumetric flowrate: 6.2 ± 0.2 L/min). For a fuel/lubricating oil heat exchanger in an aeroengine, five key technical requirements are established near the performance evaluation point, considering both lubricating oil cooling and fuel ignition safety. Namely, the heat transfer rate is no less than 4.8 kW; the flow resistance of lubricating oil is no more than 100 kPa; the flow resistance of fuel is no more than 50 kPa; the total volume of tube-side fuel is no more than 160 mL; and the overall mass of a fuel/lubricating oil heat exchanger is no more than 1.5 kg.

4. Results and Discussion

4.1. Calculation and Analysis for Original Structure

4.1.1. Model Building

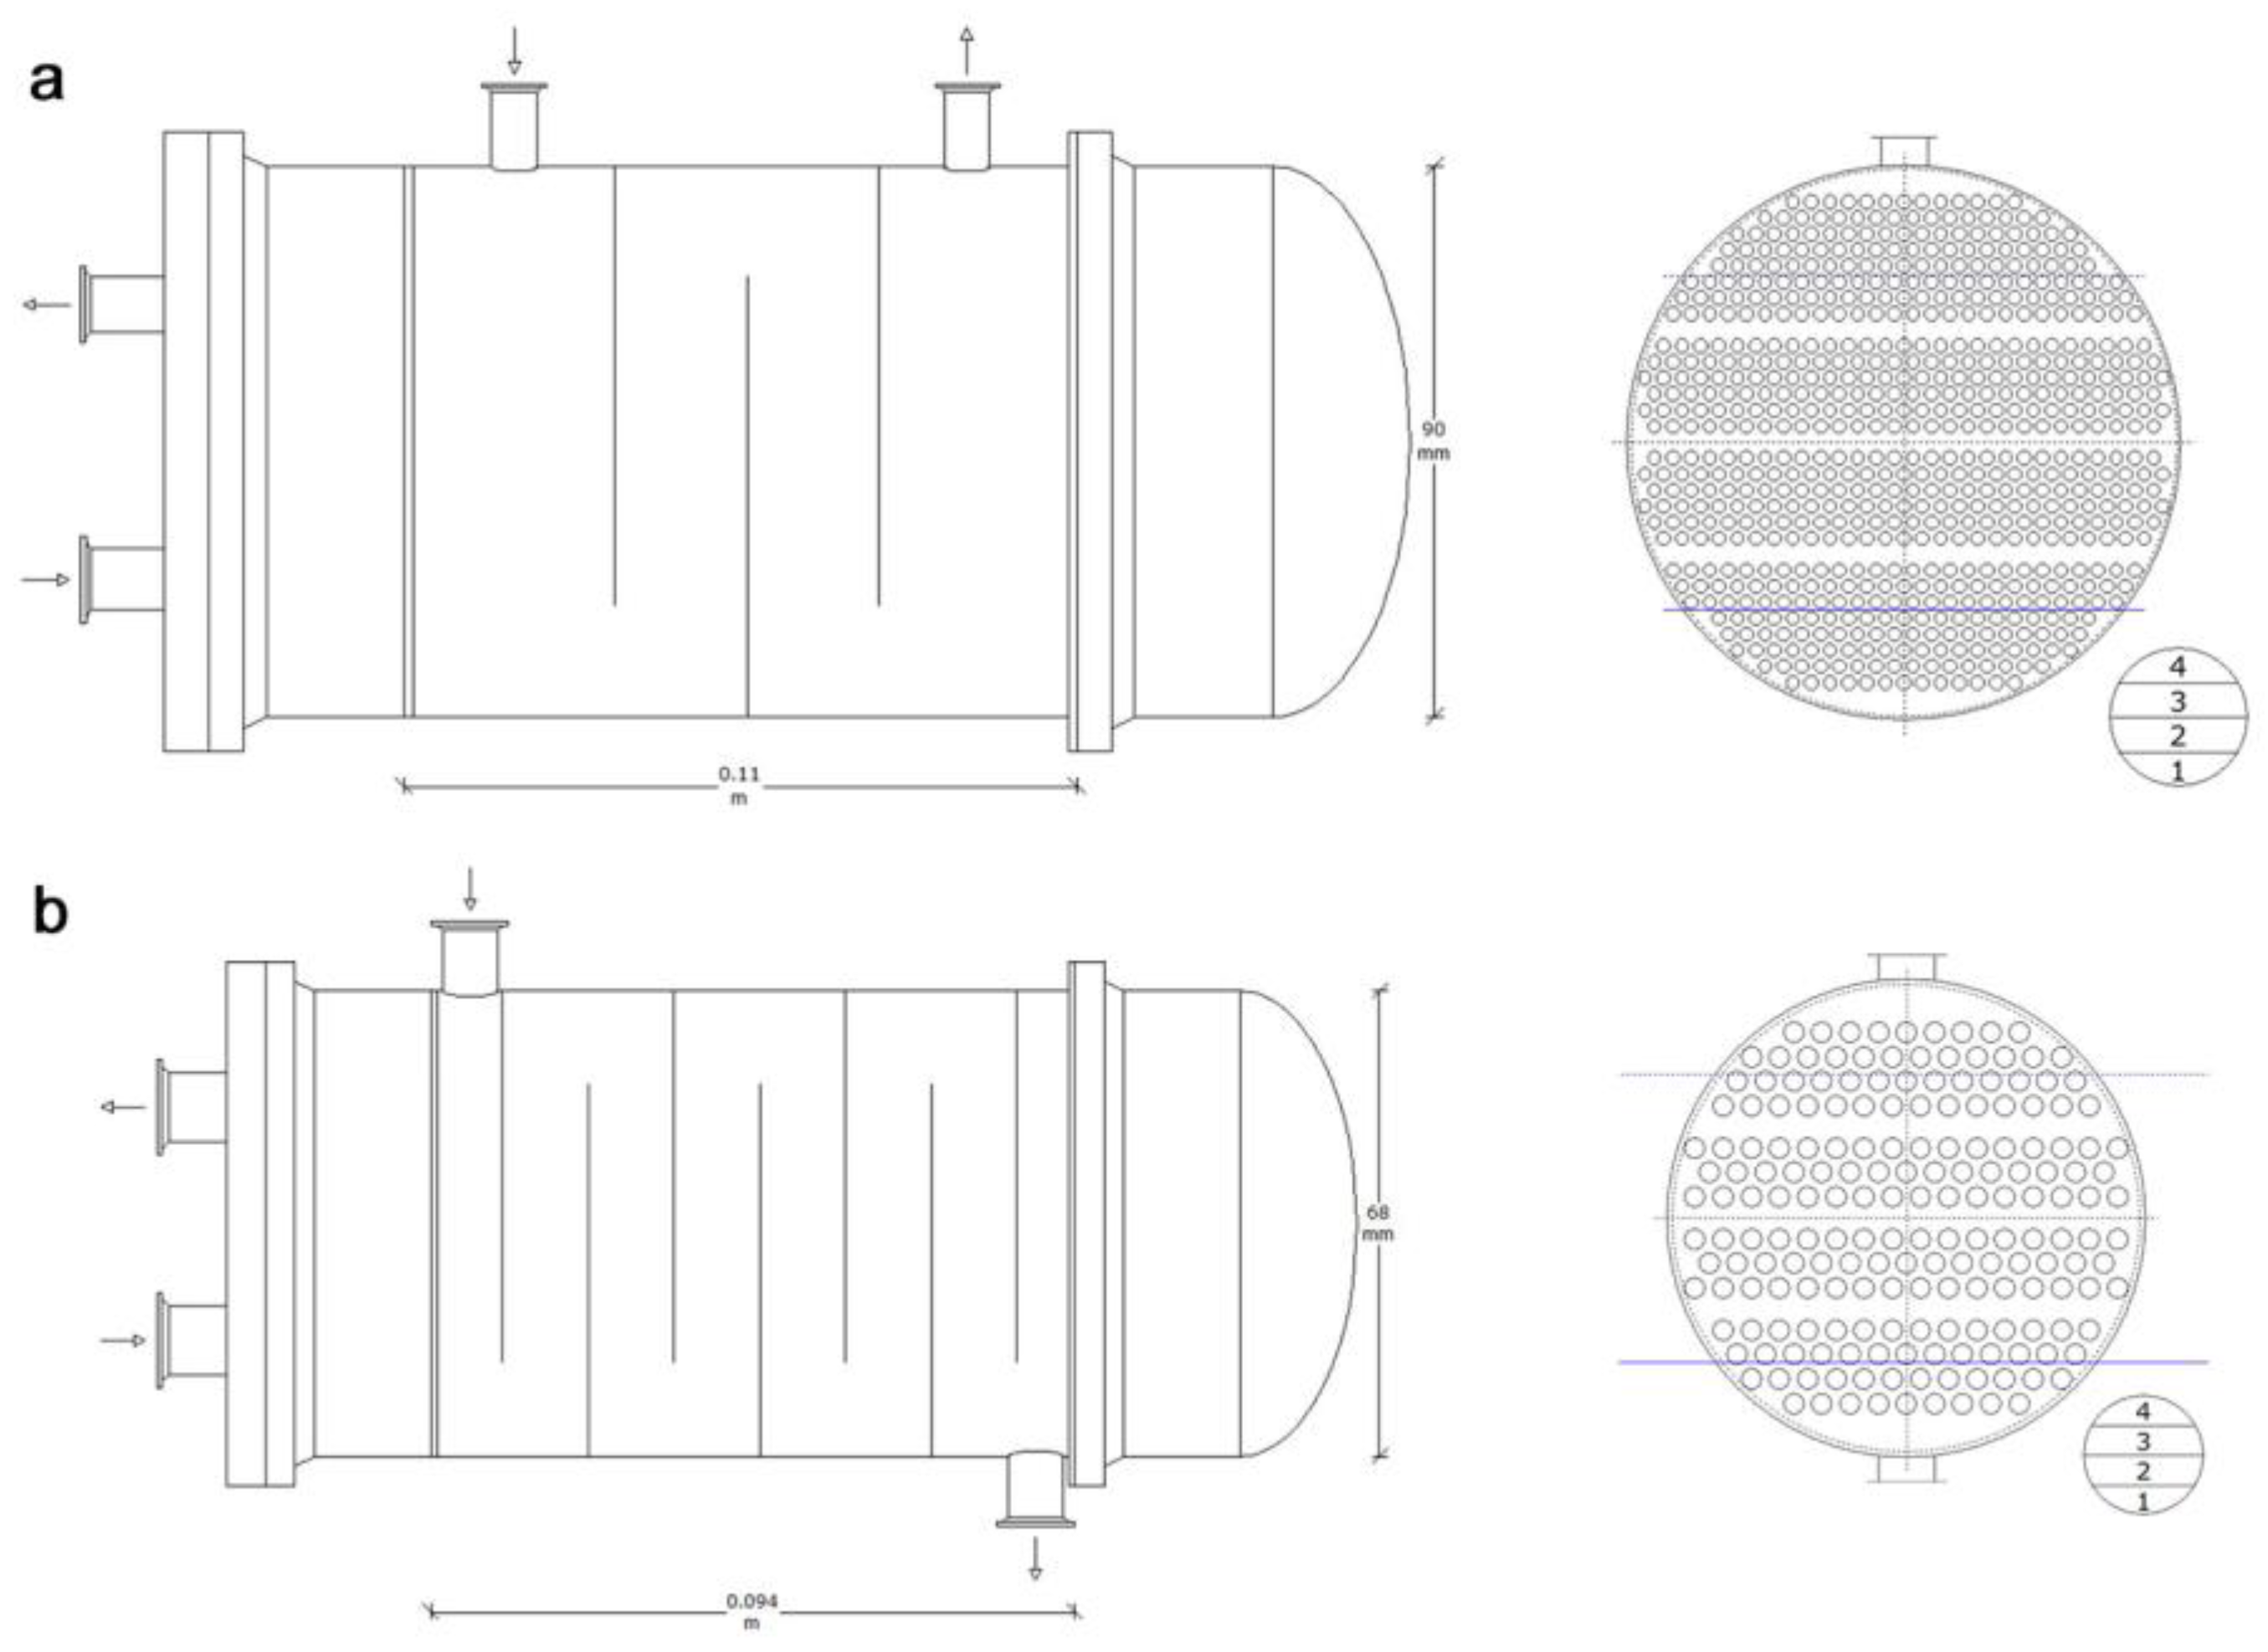
The fuel/lubricating oil heat exchanger A in an aeroengine was a shell-and-tube heat exchanger with single bow baffle plates. Its structural parameters are listed in Table 1. Based on these parameters, a corresponding computational model was developed using HTRI xchanger Suite 6.0 software, as illustrated in Figure 2a. As shown in the model, the fuel/lubricating oil heat exchanger A had a shell diameter of 90 mm, a tube length of 110 mm, and 662 tubes. The configuration consisted of four tube-side (fuel) passes and one shell-side (lubricating oil) pass, as shown in Figure 3a. The thermodynamic performance near the evaluation point was calculated using HTRI software, with the thermophysical properties of the fuel and lubricating oil provided in Table S2.

4.1.2. Comparison Between Experimental and Calculated Results

To evaluate the predictive accuracy of HTRI software for heat transfer and flow resistance in the fuel/lubricating oil heat exchanger A, an experiment on the performance evaluation point was conducted on a test bench. Key parameters such as inlet/outlet temperatures, pressures, and volumetric flow rates for both fuel and lubricating oil were measured. The experimental results for outlet temperatures, flow resistance, and Reynolds number (both tube-side and shell-side) were compared with HTRI simulations, as summarized in Table 2. The HTRI predictions demonstrated excellent agreement with the experimental data, confirming the reliability of the software for thermodynamic performance analysis of small fuel/lubricating oil heat exchangers. However, minor discrepancies were observed, primarily due to two factors of physical property estimation and model simplifications. In HTRI, thermophysical properties of fuel and lubricating oil were manually input at four reference temperatures, with intermediate values calculated through linear or quadratic interpolation. This approximation method inevitably introduced deviations from the actual temperature-dependent fluid properties. Additionally, the HTRI simulations assume idealized conditions, maximizing heat transfer rate based on given structural and operational parameters. Real-world effects such as environmental heat losses and simplified nozzle geometries (inlet/outlet) were neglected, contributing to the observed differences between simulated and experimental results.
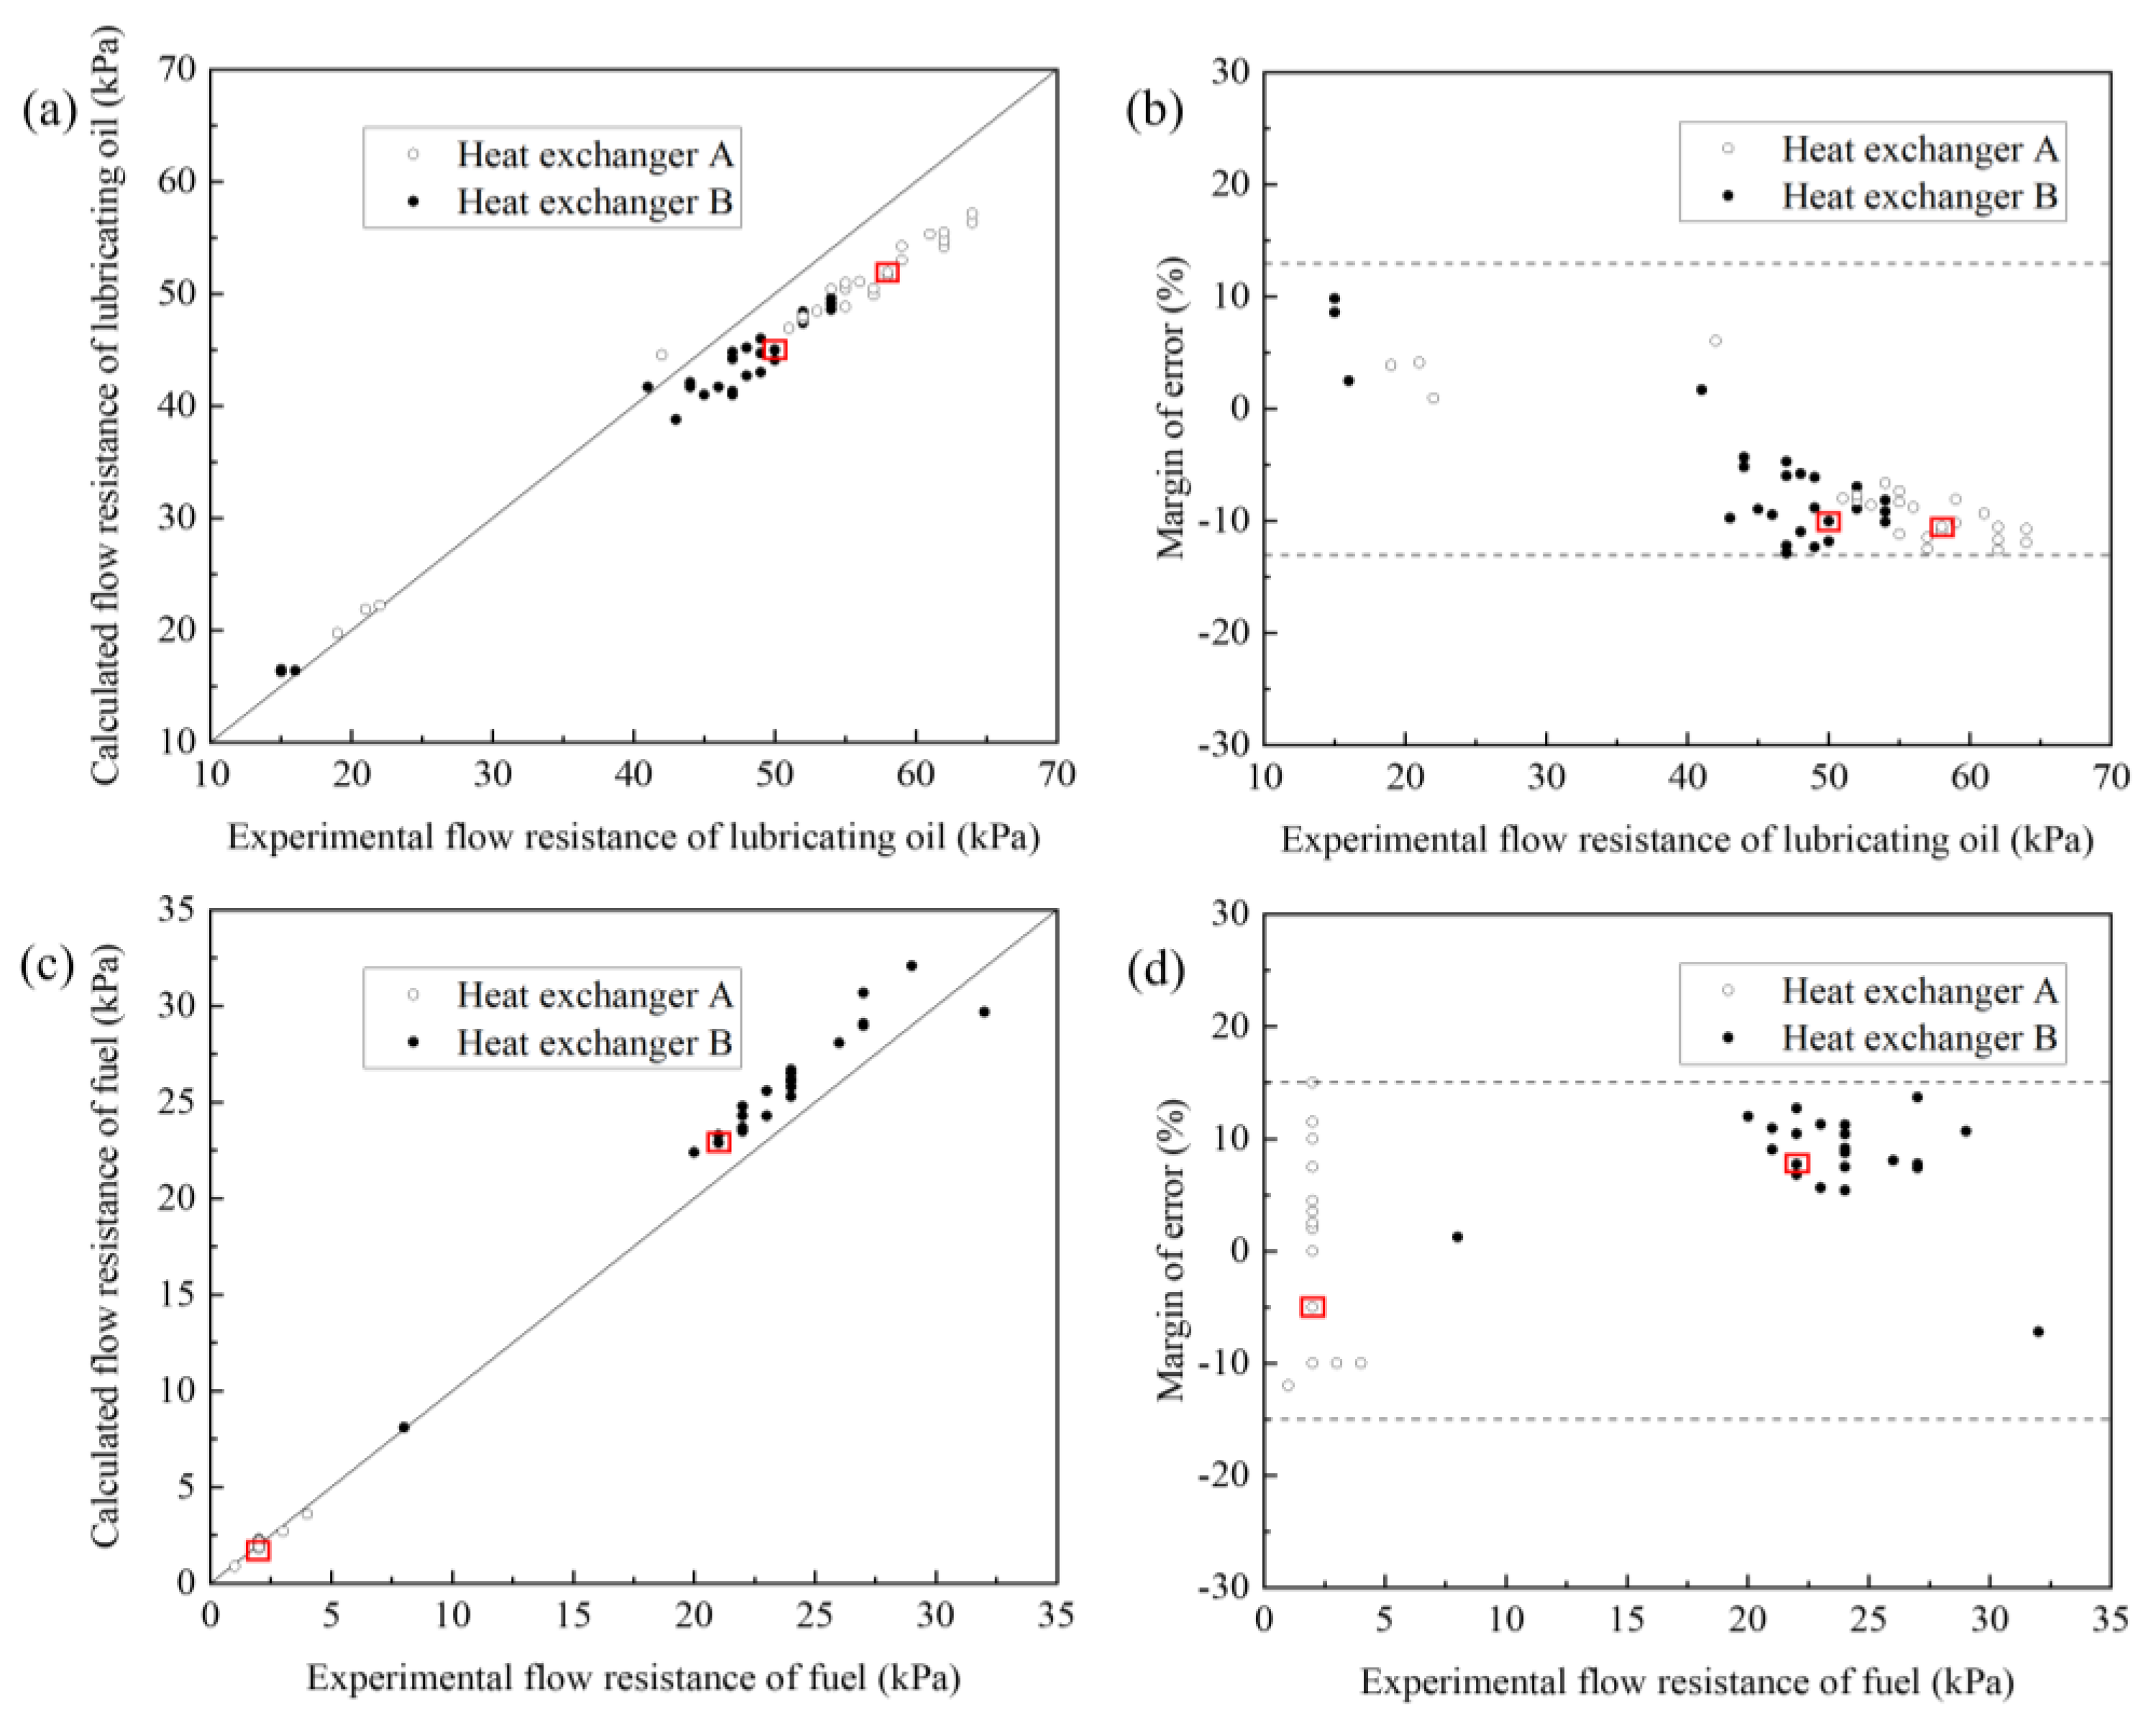
To further validate the accuracy of HTRI software in predicting heat transfer and flow resistance characteristics of a small shell-and-tube fuel/lubricating oil heat exchanger A, comprehensive experiments were conducted under various operating conditions. The comparative results between experimental data and HTRI simulations were presented in Figure 4 and Figure 5. The heat transfer performance revealed excellent agreement between calculated and experimental outlet temperatures for both lubricating oil and fuel, as shown in Figure 4a,c. The calculation errors for outlet temperatures remained within ±2% for both fluids (Figure 4b,d), confirming HTRI’s reliability in thermal performance prediction for this small heat exchanger design within acceptable engineering tolerances. The flow resistance evaluation indicated generally good correlation between calculated and experimental data for both lubricating oil and fuel, as shown in Figure 5a,c. Calculation errors remained within ±13% for lubricating oil flow resistance (Figure 5b) and ±15% for fuel flow resistance (Figure 5d). The slightly larger errors in fuel flow resistance are mainly caused by the small fuel flow resistances (between 1~4 kPa) and measurement accuracy limitations (1 kPa) of pressure sensors under experimental conditions. The discrepancies in lubricating oil flow resistance calculations likely stem from geometric modeling differences (actual end-face port configuration vs simulated shell-side connections in HTRI, as shown in Figure 2a and Figure 3a) and potential secondary flow effects not captured in the HTRI simulation. Despite these minor variations, all flow resistance predictions fell within acceptable engineering calculation margins, demonstrating HTRI’s capability to accurately simulate flow performance characteristics in small shell-and-tube fuel/lubricating oil heat exchangers.

4.1.3. Thermal Resistance and Velocity Analysis

Because the aviation fuel and lubricating oil in a new heat exchanger A were relatively clean, then the fouling thermal resistances of the tube side and shell side could be ignored. The heat transfer process primarily involves three thermal resistances, including shell-side convective thermal resistance, tube-side convective thermal resistance, and tube wall conductive thermal resistance. The conductive resistance through the aluminum alloy tube wall was negligible due to the extremely thin wall thickness (0.2 mm) and high thermal conductivity (160 W/(m·K)) of the material. Thermal resistance distribution analysis revealed the tube-side convection as the dominant limiting factor, accounting for 84.6% (0.002674 m2·K/W) of the total resistance (Table 3). This significant contribution highlighted the critical need for tube-side heat transfer enhancement to improve overall efficiency. Moreover, according to the relevant flow parameters in Table 3 and Reynolds number (Re) in Table 2, low tube-side velocity (0.25 m/s) led to laminar flow (Re = 588), resulting in poor convective heat transfer coefficient (501.4 W/(m2·K)) and resultant low overall heat transfer coefficient (316.5 W/(m2·K)). While heat exchanger A satisfied the specified flow resistance requirements (lubricating oil side: ≤100 kPa and fuel side: ≤50 kPa), it failed to meet the critical heat dissipation requirement of ≥4.8 kW. This performance shortcoming reveals two fundamental design limitations: insufficient structural compactness and suboptimal heat exchange efficiency.

4.1.4. Whole Aeroengine Test

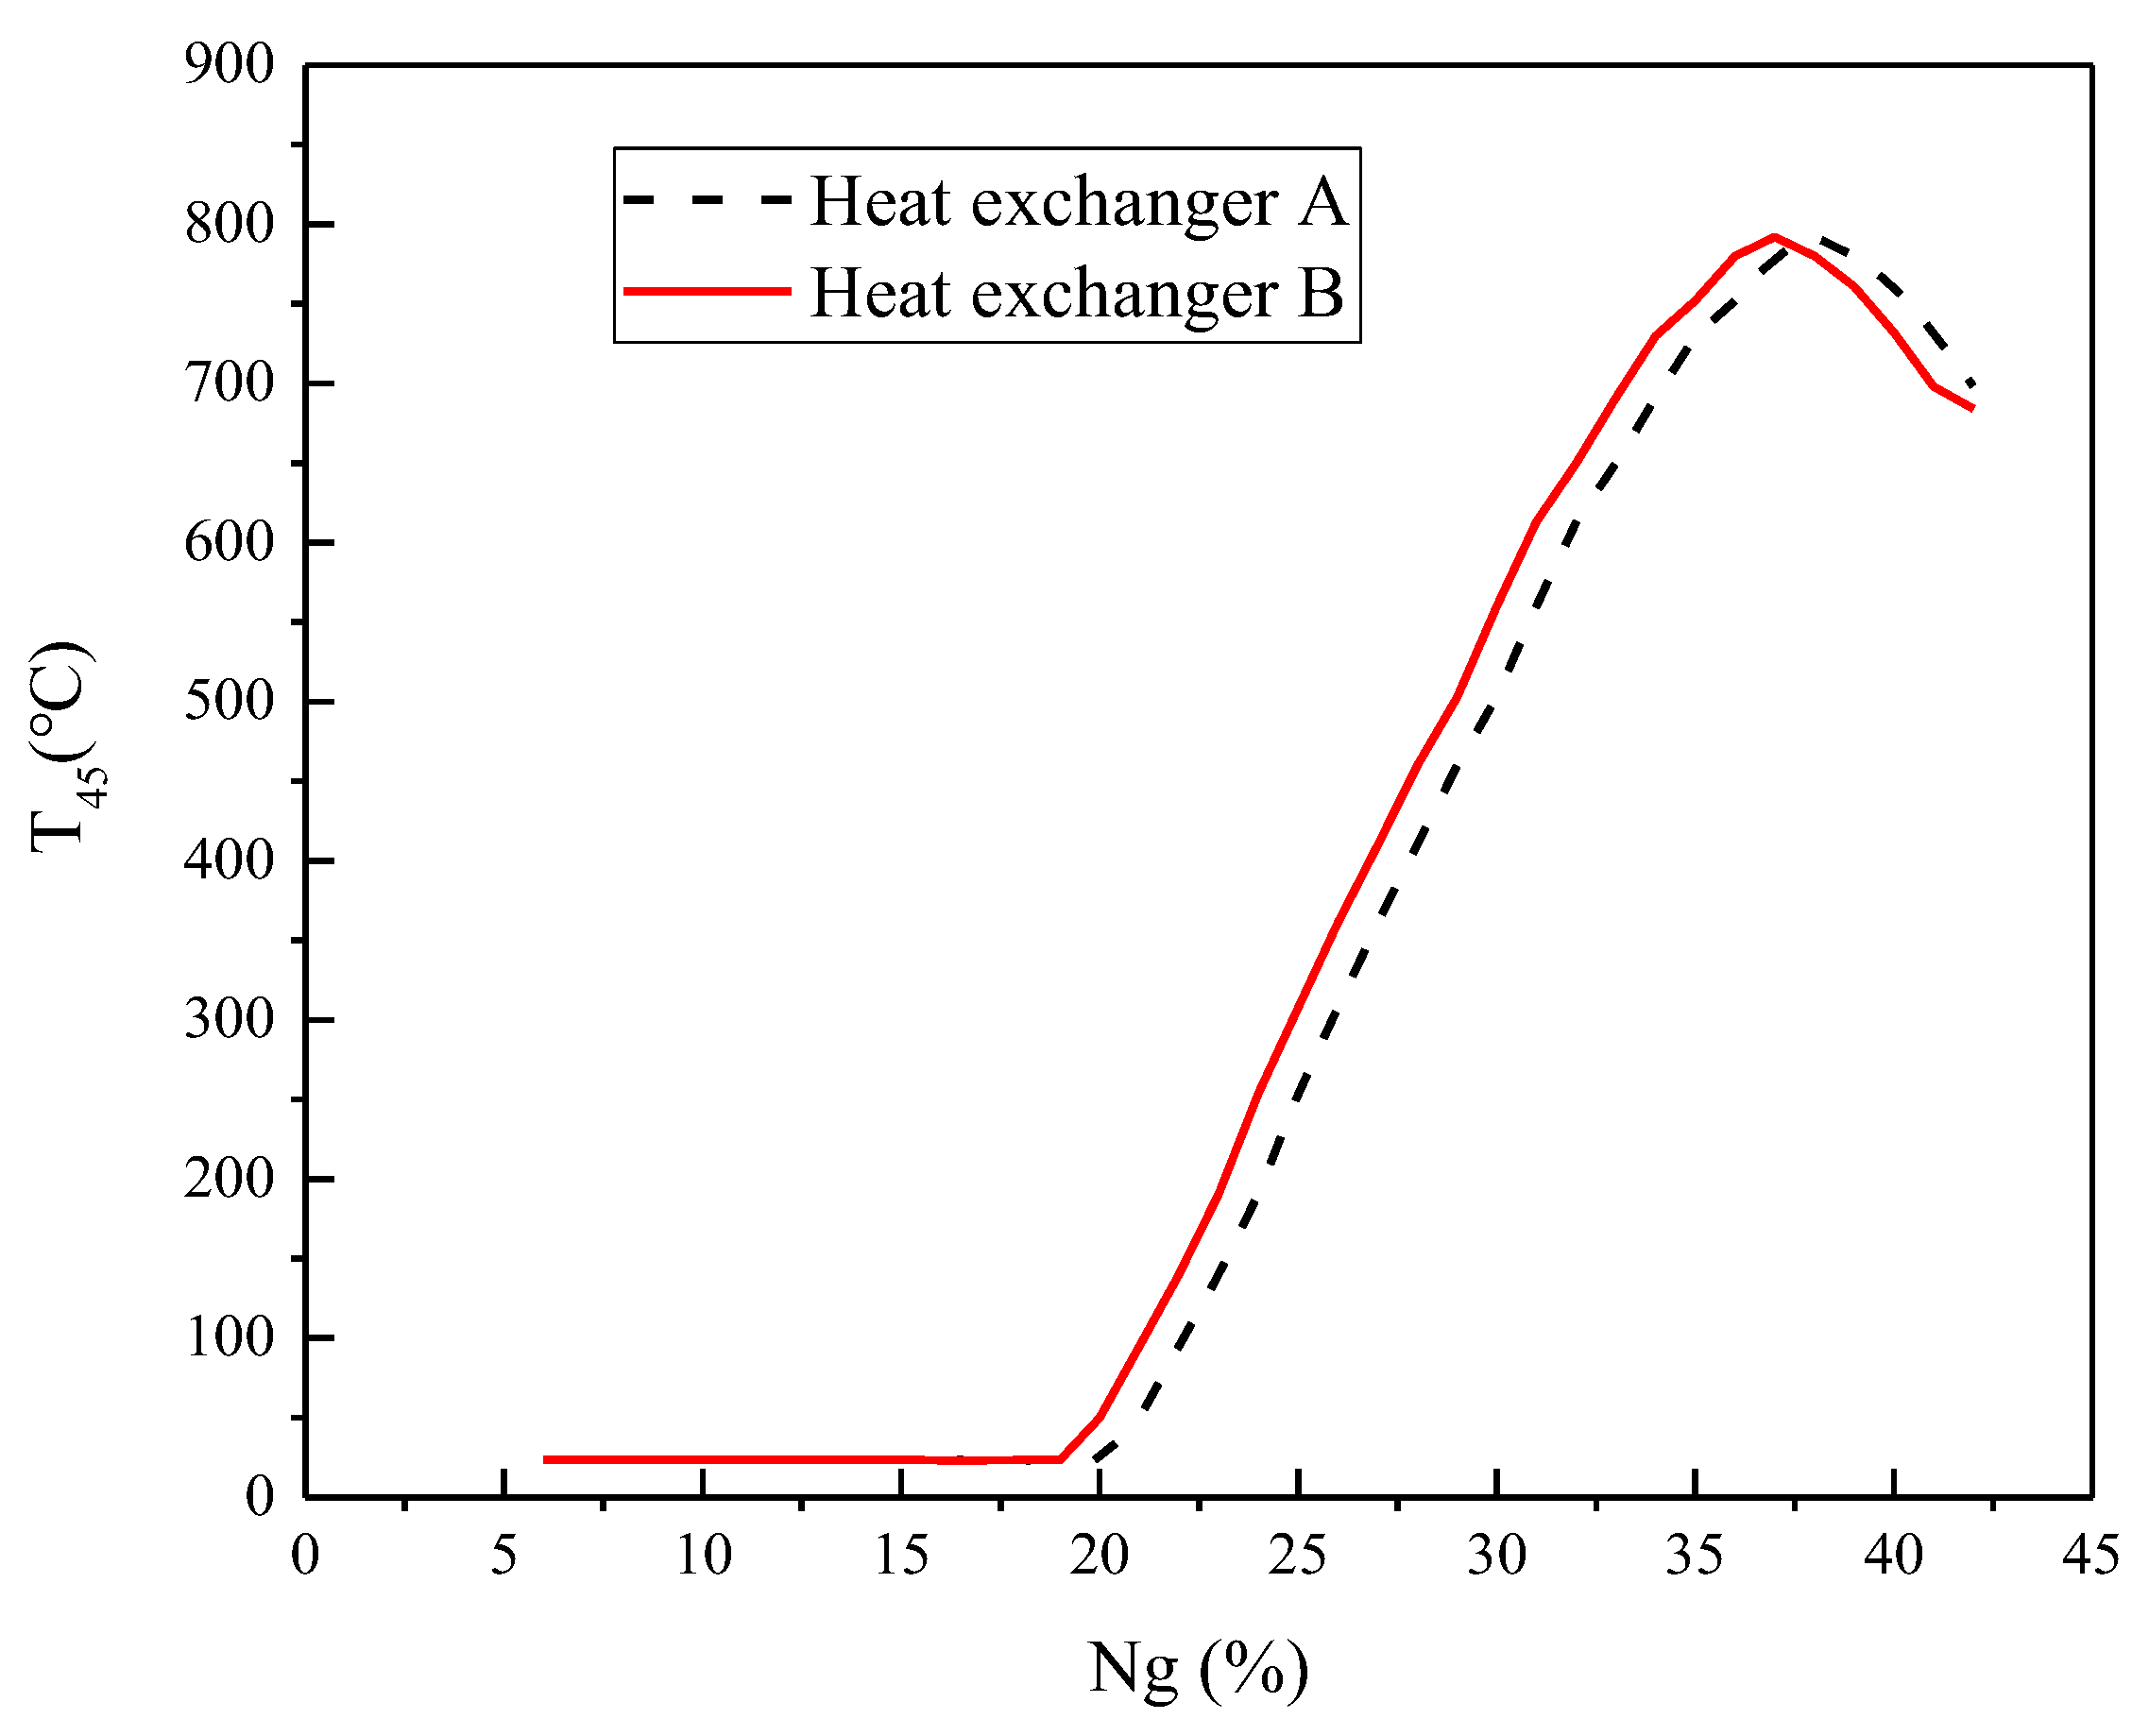
During performance debugging of an aeroengine equipped with the heat exchanger A, the low tube-side velocity (0.25 m/s) caused excessive fuel filling time. Experimental data revealed that after multiple failed start attempts, approximately 150 mL of fuel remained unfilled in the tube side of the fuel/lubricating oil heat exchanger A. As shown in Figure 6, fuel ignition only occurred when the gas generator speed (Ng) exceeded 20%, accompanied by a rise in turbine outlet temperature (T45). The ignition delay of the fuel eventually affected the start of the aeroengine.

4.2. Structural Analysis and Improvement

The primary goal of enhanced heat transfer is to maximize the heat transfer rate between the cold and hot fluids. This is achieved by optimizing three key parameters in the heat transfer process: the overall heat transfer coefficient K, the heat transfer area A, and the logarithmic mean temperature difference Δtm, as expressed by the heat transfer equation (Q = KAΔtm). Typically, counter-flow arrangements or multi-stage heat exchangers are commonly employed to maximize Δtm. However, since the inlet and outlet temperatures of the fluids are often constrained by process conditions, Δtm can only be adjusted within a limited range. K can be enhanced through fluid dynamics optimization and material selections. Fluid dynamics optimization, including using corrugated tubes [14,15], helical grooved tubes [16], tube inserts (twisted tapes [17,18], spiral coils [19,20], etc.), and fin structures [21,22], etc., could increase fluid velocity and turbulence, subsequently disrupting the thermal boundary layer and improving heat transfer. Moreover, using high-thermal-conductivity materials (e.g., aluminum) reduces wall thermal resistance, thereby increasing K. Simply enlarging heat exchanger dimensions is not an efficient approach to increase A. Instead, structural improvements are employed, such as adopting smaller-diameter tubes, fins (straight fins [23], serrated fins [24], etc.), porous structures [25], and microchannel configurations [26]. These modifications can enhance the heat transfer area per unit volume, making the heat exchanger more compact.
As discussed in Section 4.1.3, the tube-side thermal resistance accounted for 84.6% of the total thermal resistance in the fuel/lubricating oil heat exchanger A. This was primarily due to a thick laminar boundary layer (acting as an insulating barrier) and low fluid velocity (resulting in poor convective heat transfer). To address this, structural optimization of the heat exchanger, particularly the tube design, became necessary. To resolve the issues of low heat transfer efficiency in heat exchanger A and the fuel ignition delay observed during the whole aeroengine test, increasing the tube-side fuel velocity was identified as a critical improvement. Reducing the number of heat exchange tubes would decrease the flow area, thereby increasing fuel velocity. However, maintaining the existing tube length while reducing tube count would fail to meet the lubricating oil’s heat dissipation requirements. On one hand, the tube-side thermal resistance would remain excessively high due to insufficient turbulence, leading to an unsatisfactory overall heat transfer coefficient. On the other hand, fewer tubes would directly reduce the available heat transfer area, making it impossible to achieve the required heat transfer rate.
To resolve these challenges, the heat exchange tube structure must be optimized to enhance fuel-side turbulence, thereby improving the tube-side convective heat transfer coefficient while maintaining sufficient heat transfer capacity. Increasing fluid velocity and disturbance can enhance heat transfer, but also raise flow resistance. Additionally, overly complex heat exchanger structures may complicate cleaning and maintenance. Therefore, practical heat transfer enhancement methods must balance multiple factors, such as heat exchanger structure, flow resistance, ease of cleaning and maintenance, and so on. According to the above analysis, a viable solution is the use of tube inserts (e.g., twisted tapes, spring wires, wire meshes) or specialized tubes (e.g., inner fin tubes, ribbed tubes, transverse groove tubes). These modifications improve fluid disturbance, reduce boundary layer thickness, and enhance heat transfer efficiency without requiring major structural changes. Turbulence inserts are particularly advantageous because they maintain the original tube dimensions while improving performance, reducing the heat exchanger size, and increasing energy efficiency. Twisted tape inserts enhance heat transfer by promoting radial flow in tube-side fluids, improving flow and temperature field uniformity, and disrupting the boundary layer, thereby increasing the tube-side convective heat transfer coefficient [27,28]. Soltani et al. [28] experimentally investigated the effect of dimpled twisted tape inserts in the inner pipe of a double-pipe heat exchanger on the Nusselt number (Nu), friction factor (f), and thermal performance factor (η). The results revealed the dimpled louvered twisted tape achieved optimal performances with η = 1.24 at Re = 5300, outperforming plain tape. Hamza et al. [29] used numerical and experimental methods to study the thermal performance of an improved heat exchanger tube fitted with various vortex generator inserts. They demonstrated that a double V-cut twisted tape insert improved thermal performance by 3% (η = 1.37 vs. 1.33 for plain twisted tape) in heat exchanger tubes. Thus, in order to increase tube-side fluid turbulence and reduce tube-side thermal resistance, we chose to insert twisted tapes in the smooth circular tubes.

4.2.1. Model Building

Based on HTRI software, we designed fuel/lubricating oil heat exchanger B, with its key structural parameters summarized in Table 1. The design objectives included: reducing the number of heat exchange tubes to minimize fuel filling volume, incorporating internal twisted tapes to enhance heat transfer performance, slightly increasing the tube diameter to facilitate twisted tape insertion, and decreasing the shell diameter to maintain a compact structure. The corresponding calculation model for heat exchanger B, exported from HTRI software, was shown in Figure 2b. It could be clearly seen that the fuel/lubricating oil heat exchanger B had a shell diameter of 68 mm, a tube length of 110 mm, and a tube number of 186. Additionally, Figure 3b provides sectional views of the three-dimensional model, illustrating the internal structure.

4.2.2. Geometric Parameters of Twisted Tape Inserts

As shown in Figure S1, a twisted tape is a stainless-steel strip helically wound along its axis, with a width matching the inner diameter of the tube. The twist ratio y (y = H/di) is the most critical geometric parameter, governing the intensity of secondary flow within the tube. A smaller twist ratio corresponds to a higher flow distortion, resulting in greater flow resistance and a higher heat transfer coefficient. Twisted tape inserts are especially effective for enhancing heat transfer in viscous fluids at low Re, significantly improving the overall thermal performance evaluation criterion (PEC). However, in turbulent flow regimes, the heat transfer enhancement diminishes with increasing Re. Additionally, the flow resistance rises sharply, leading to a reduction in PEC. Man et al. [30] experimentally investigated the heat transfer and friction characteristics of dual-pipe heat exchangers equipped with different twisted tape inserts: clockwise twisted tape (CCCT), anticlockwise twisted tape (ACCT), and typical twisted tape (TT). Their results demonstrated that ACCT tapes provided superior heat transfer enhancement, achieving a maximum PEC of 1.42 when full-length ACCT inserts were used. Ramin Mashayekhi et al. [31] studied the effects of stationary and rotating twisted tape inserts on the heat transfer coefficient in a plain tube. Due to the formation of conical tornado-shaped structures in the flow pattern, the rotating twisted tapes exhibited greater potential to modify the average Nu by about 32.8~39.6% at Re = 250, compared to the stationary twisted tapes. The largest PEC of 1.21 was obtained at Re = 250, nanofluid volume concentration of 3% and the highest studied angular velocity.
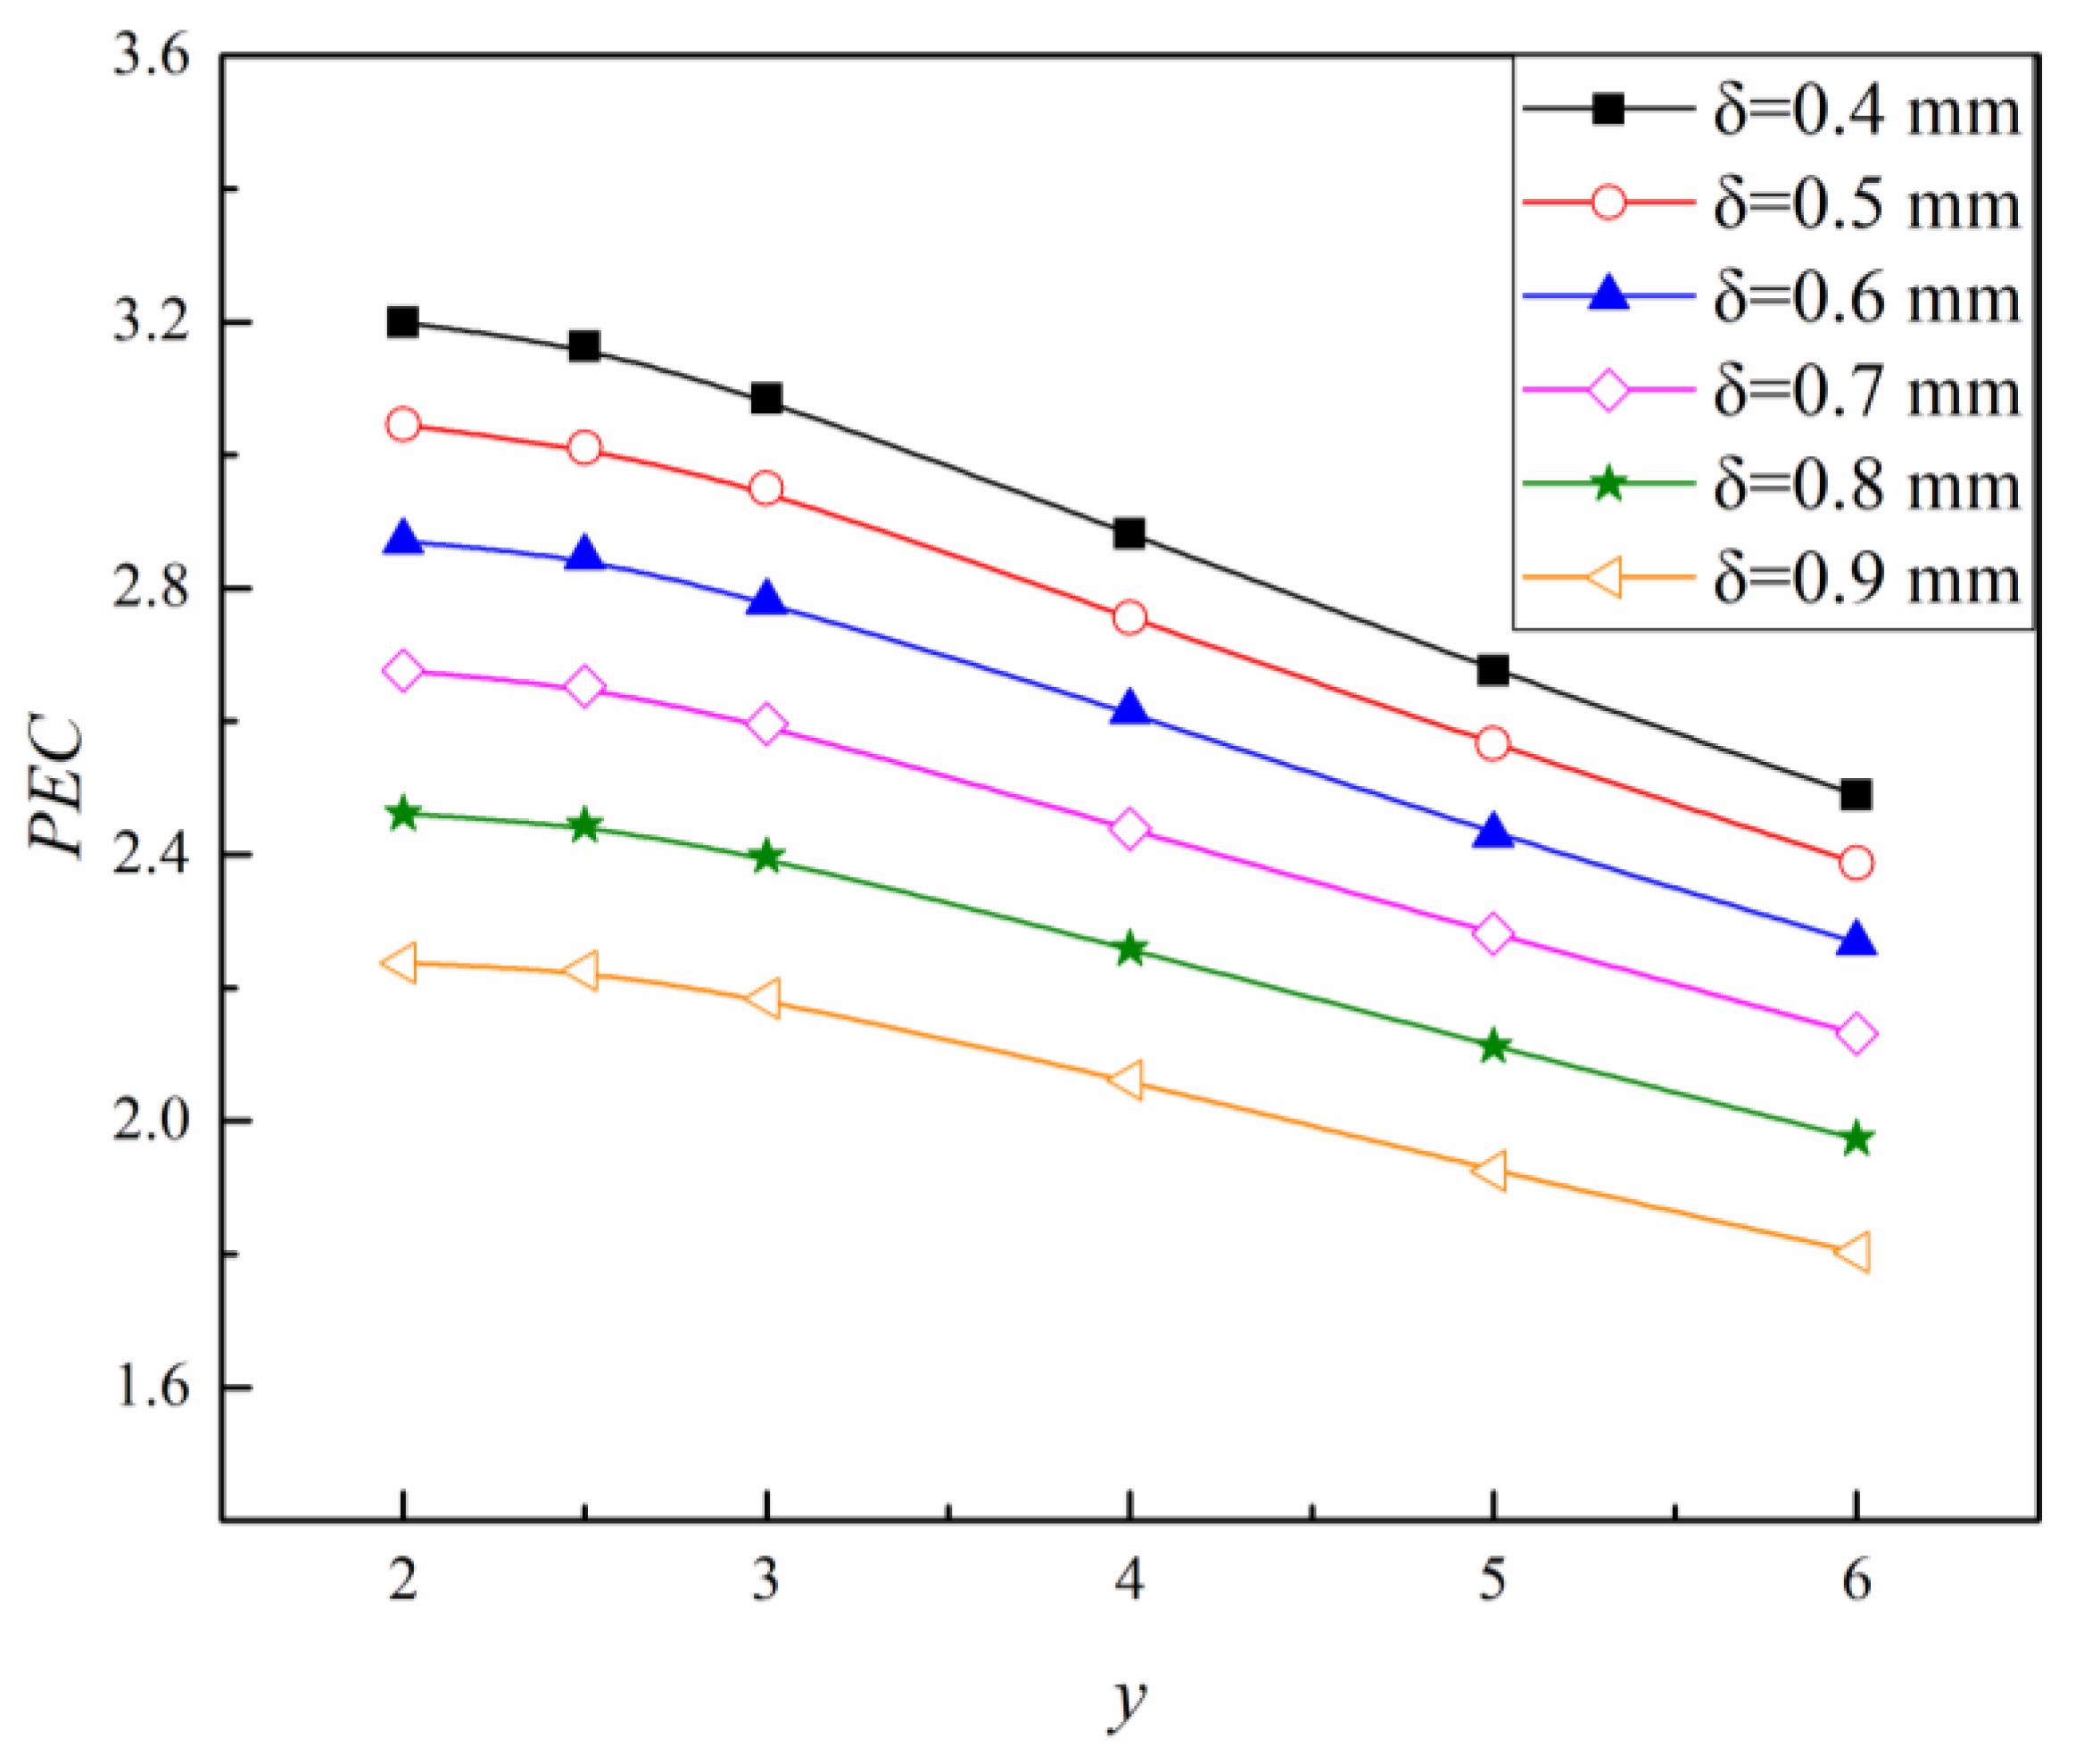
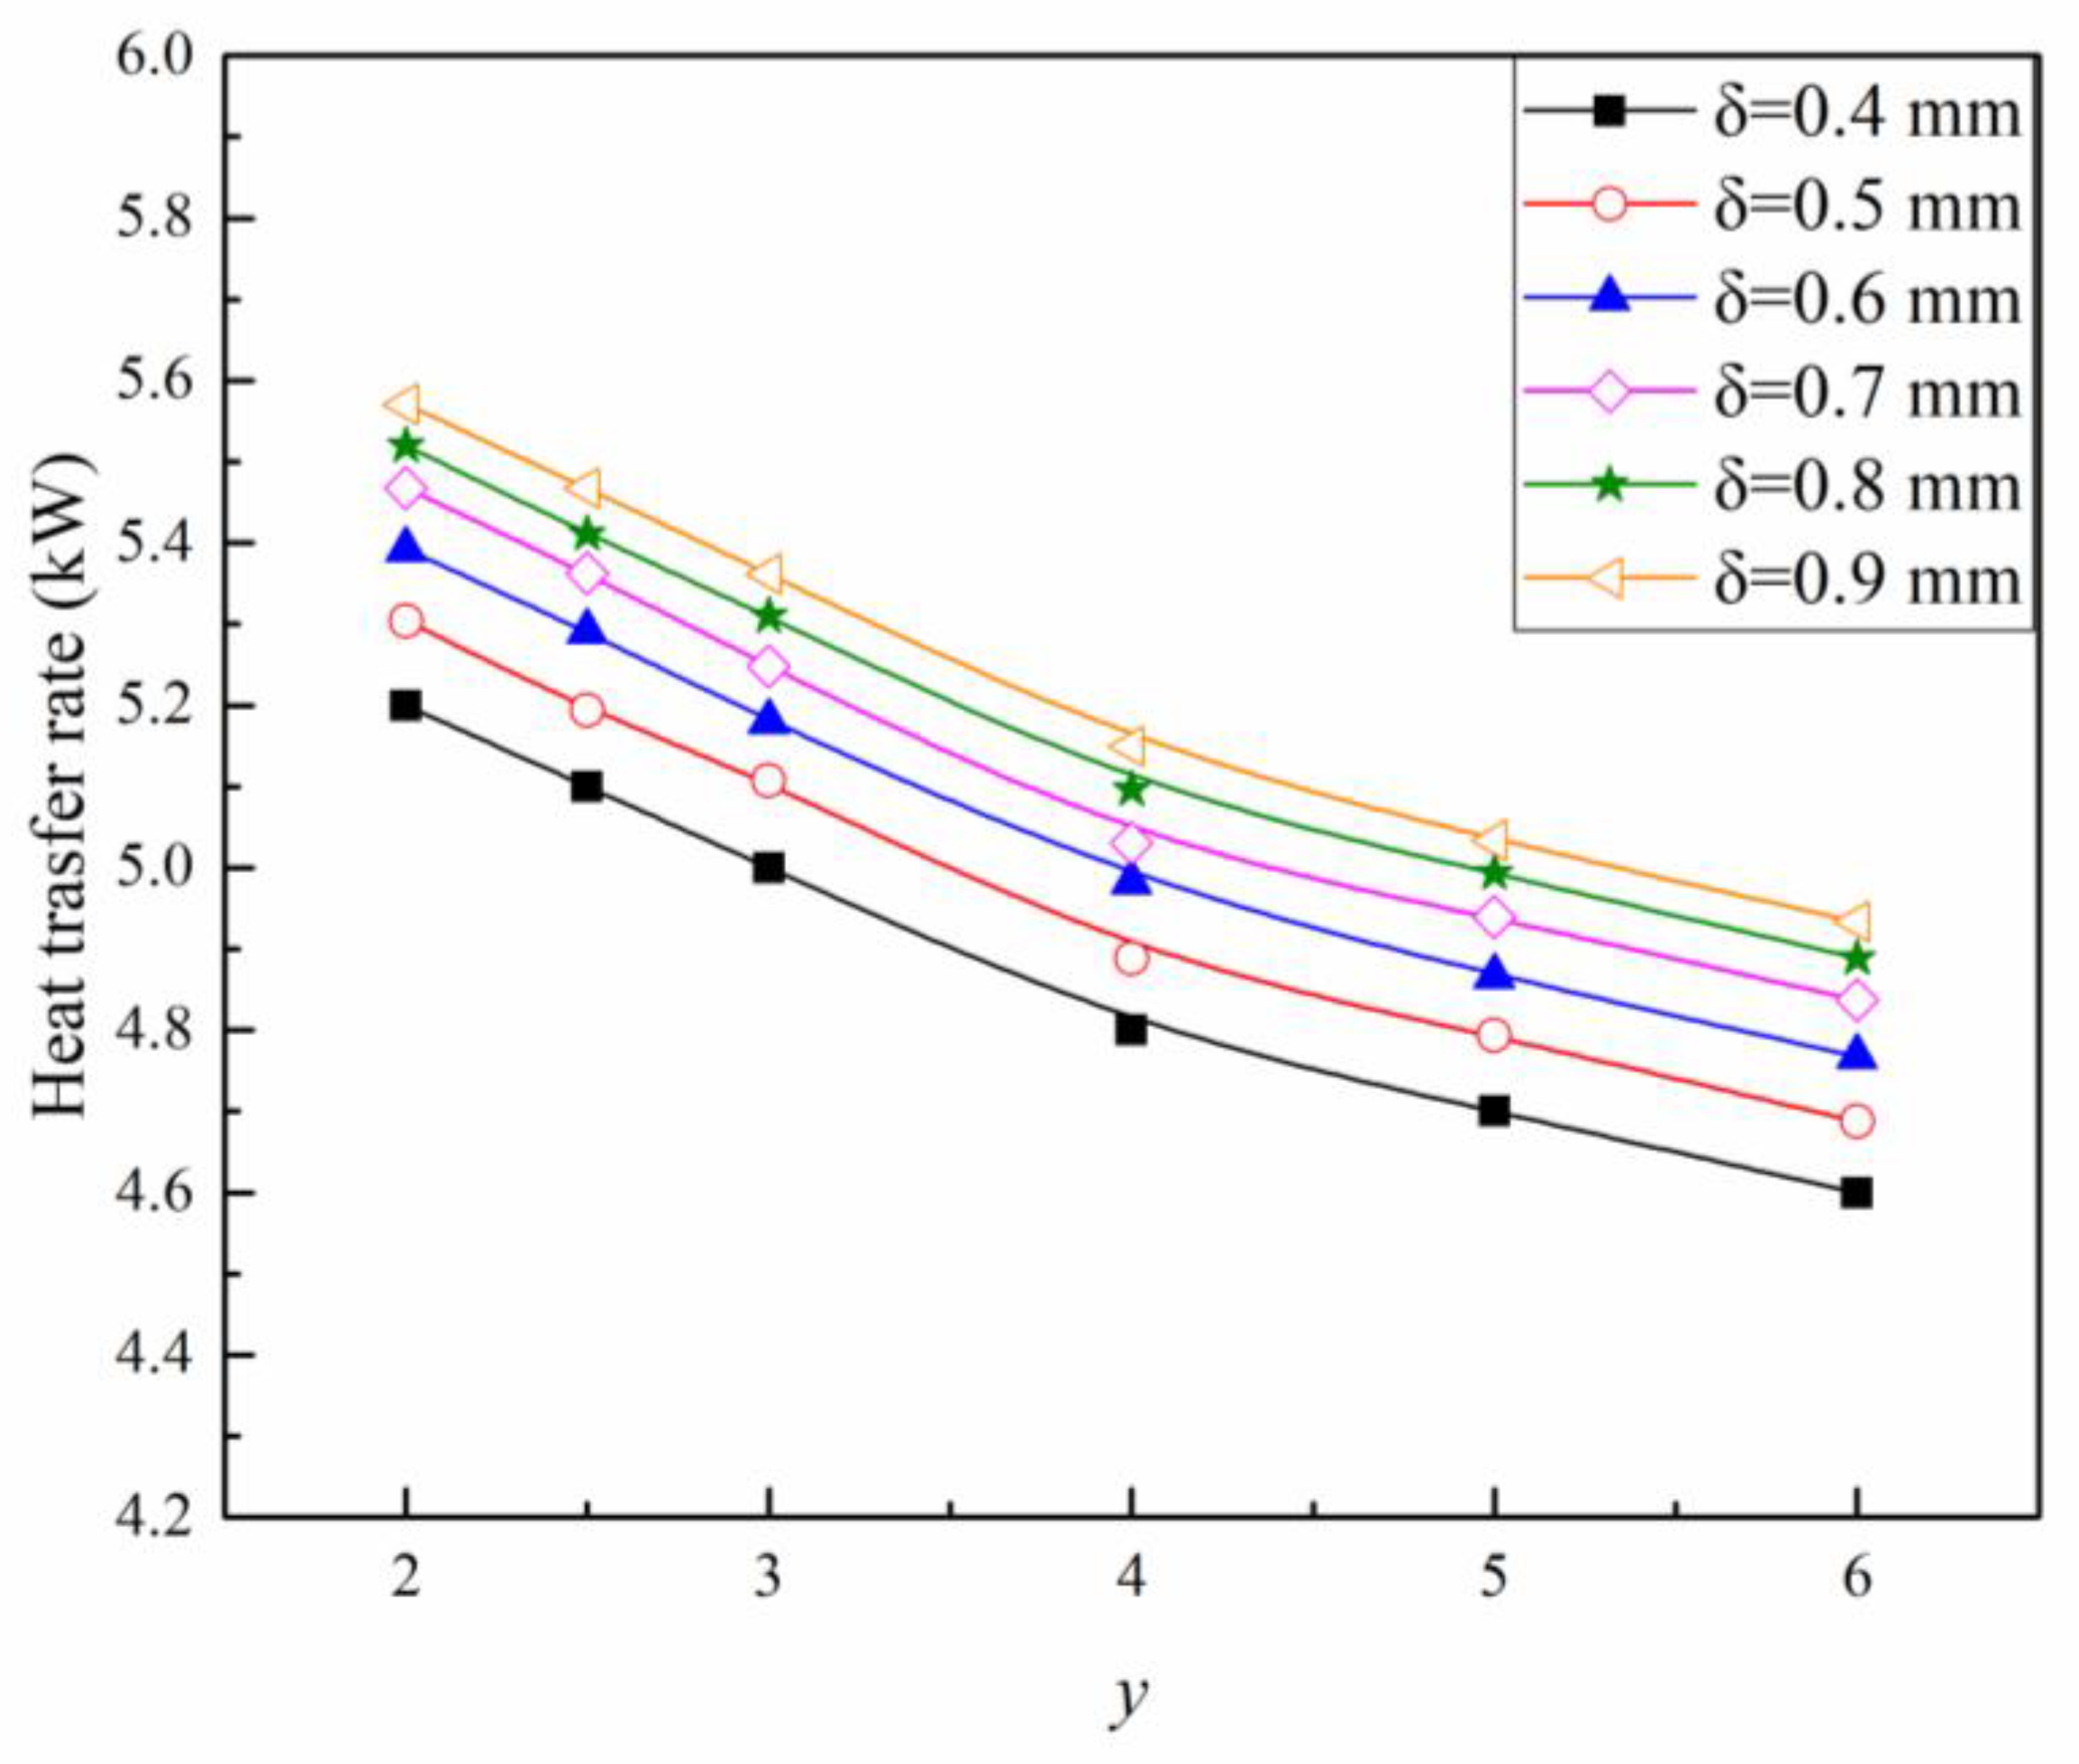
Since twist ratio y and thickness δ were critical geometric parameters of twisted tapes, HTRI software was employed to analyze their effects on tube-side heat transfer and flow characteristics. The effects of these parameters on the tube-side heat transfer coefficient, flow resistance, PEC, and heat transfer rate were systematically evaluated at the performance evaluation point, ensuring alignment with operational conditions. The final geometric parameters of the twisted tape inserts were determined by considering the fuel flow resistance limit and lubricating oil heat dissipation requirements.
1.
Influence of the Twist Ratio and Thickness on the Tube-Side Heat Transfer Coefficient
As shown in Figure 7, the tube-side convective heat transfer coefficient increased as the twist ratio decreased. This trend occurred because twisted tape inserts generate secondary flow and complex vortices within the tubes. A smaller twist ratio corresponds to a higher twist degree, producing a more coherent swirl flow with stronger intensity. This enhanced fluid vortex motion, increased turbulent intensity, and consequently improved convective heat transfer. Within the thickness δ range of 0.4~0.9 mm, the effect of twisted tape inserts on the tube-side heat transfer coefficient was only marginally influenced by thickness. However, HTRI calculations revealed that varying the thickness (at a fixed twist ratio) affected the Re of the tube-side fluid, indicating a change in the degree of fluid disturbance. The results demonstrated that thicker twisted tapes further improved the heat transfer performance of the tube-side fluid.
2.
Influence of the Twist Ratio and Thickness on the Tube-Side Flow Resistance
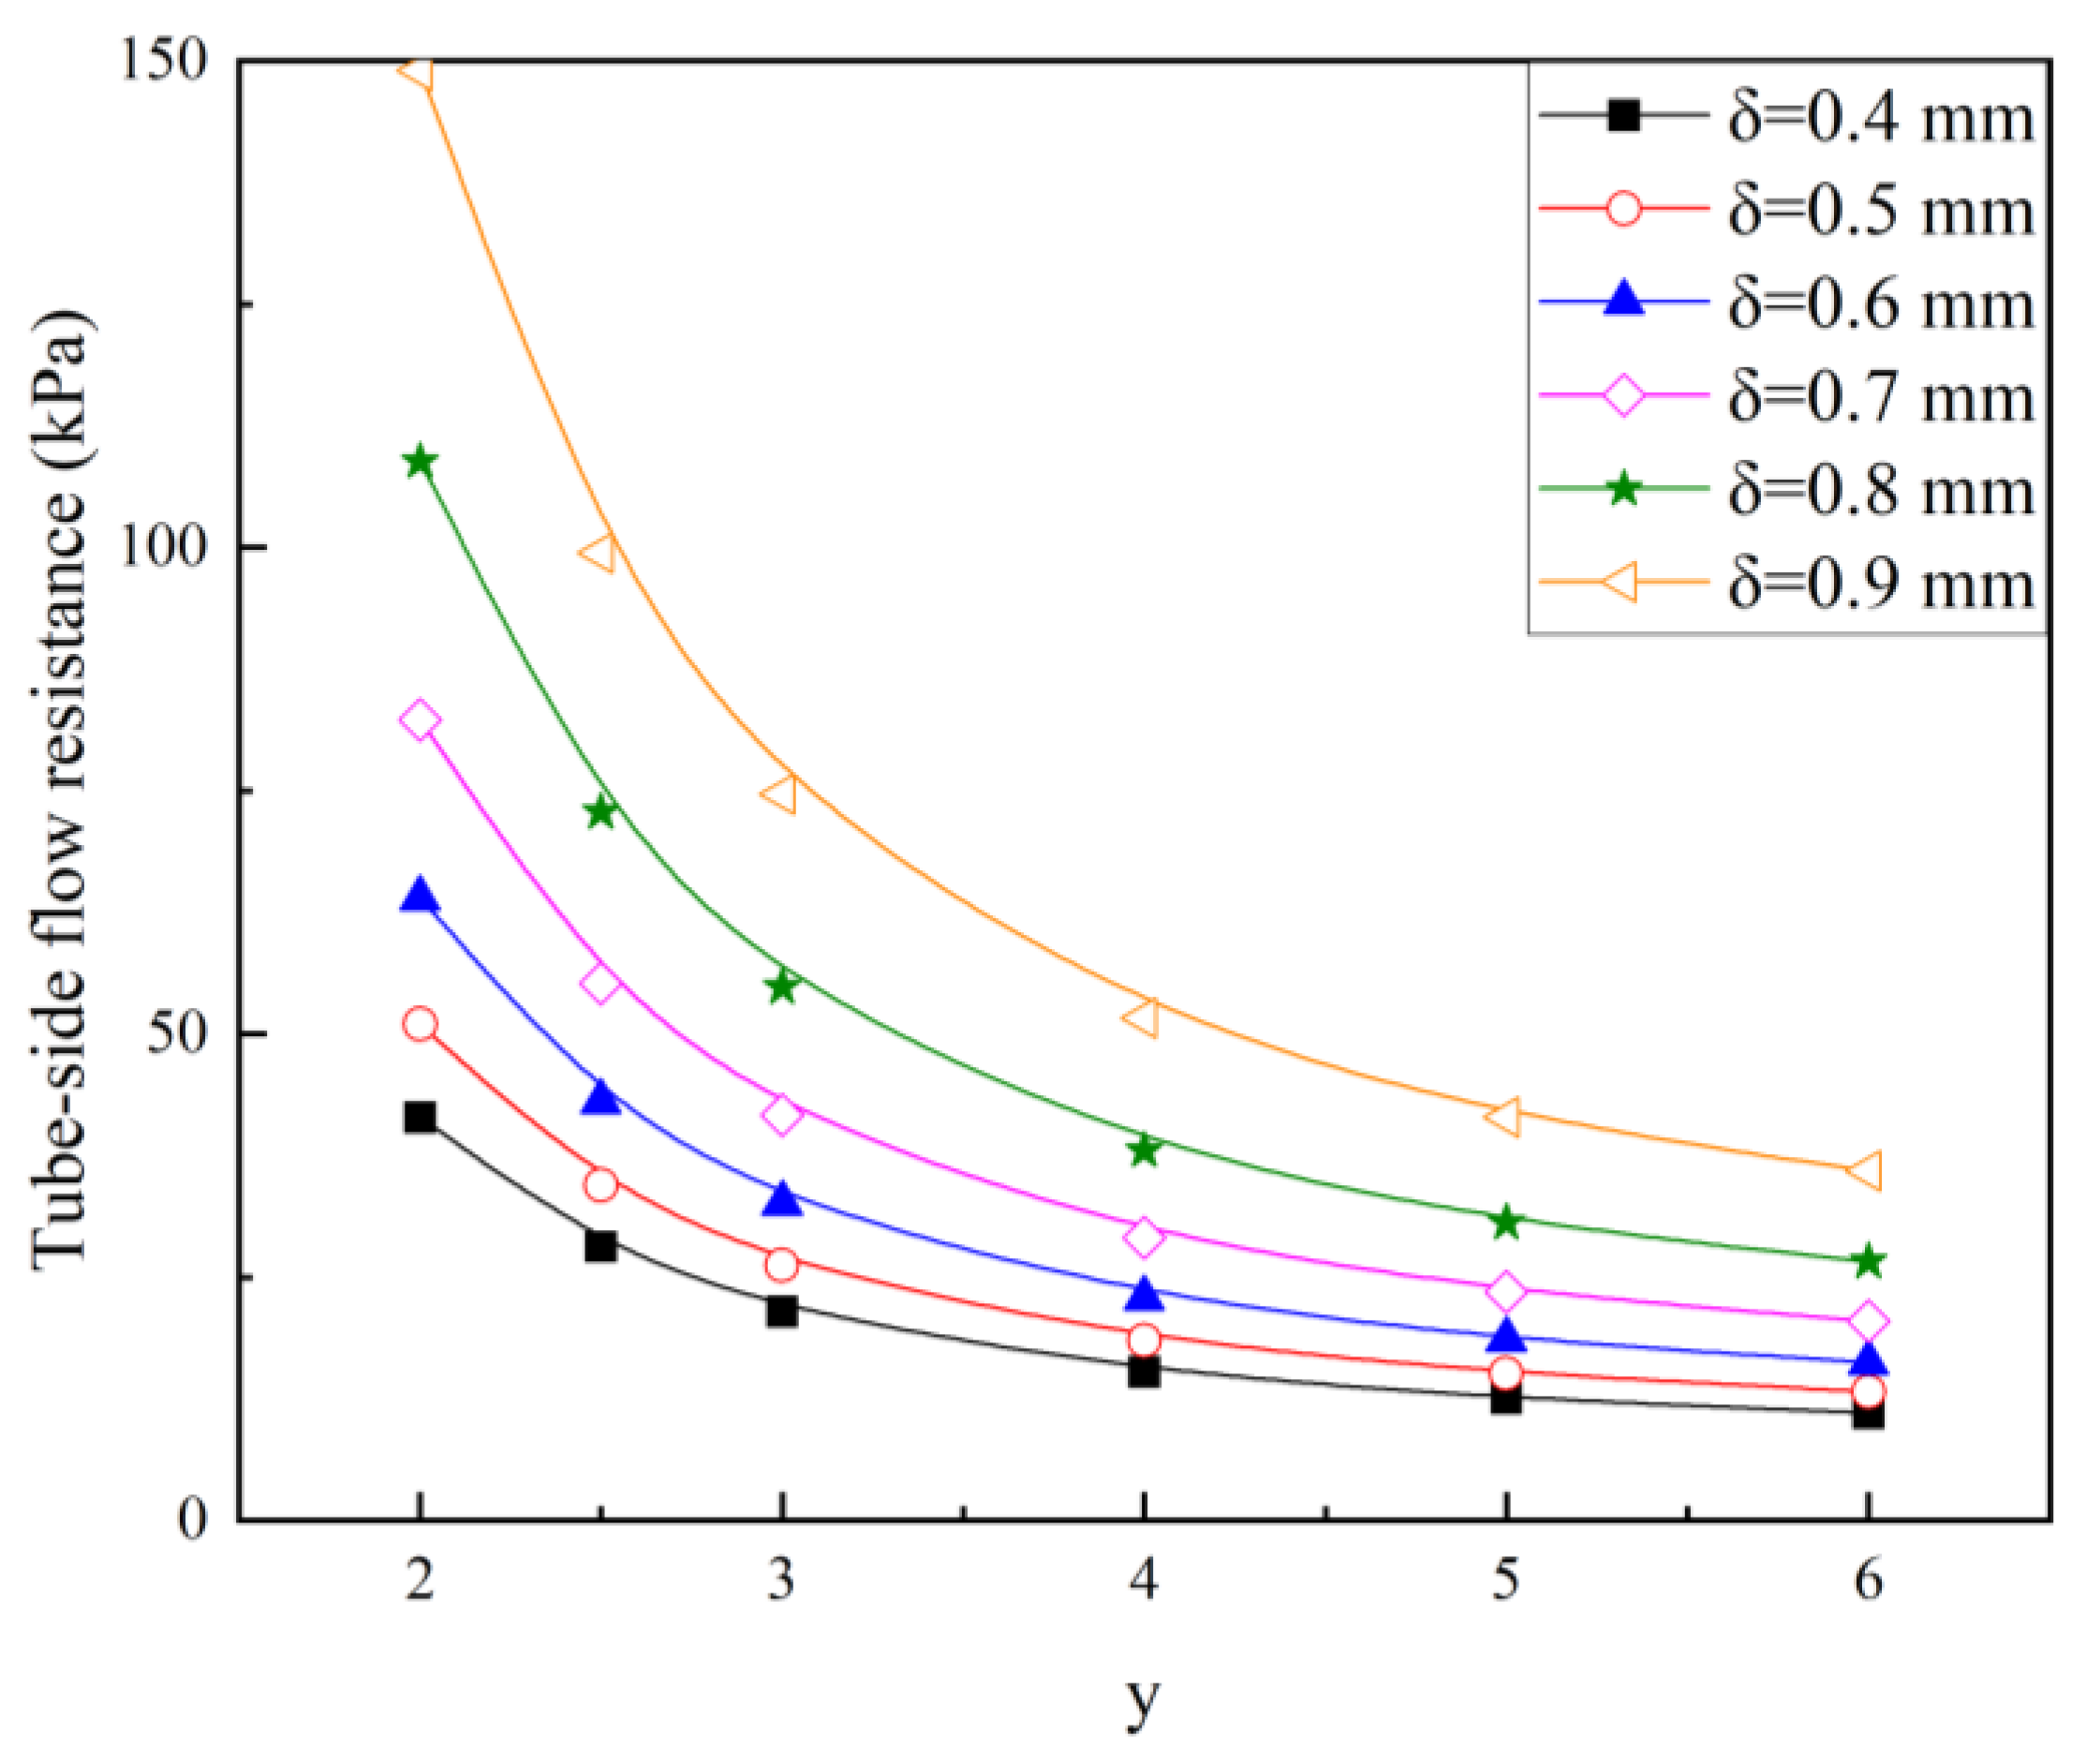
As shown in Figure 8, the flow resistance exhibited an inverse relationship with the twist ratio, decreasing as the ratio increases. Notably, the resistance increase was particularly pronounced when using thicker twisted tapes at lower twist ratios. This phenomenon occurred because twisted tapes introduced a larger contact surface and a reduction of fluid-free flow areas, which caused high-speed swirl flow [32]. Thinner twisted tapes were preferable to maintain the tube-side fuel flow resistance below the 50 kPa threshold. Our analysis indicated that the tape thickness δ should be constrained within the range of 0.5~0.9 mm. The upper limit (0.9 mm) ensured acceptable flow resistance, while the lower limit (0.5 mm) provided sufficient mechanical strength and manufacturing feasibility. Additionally, the twist ratio y should be maintained at ≥4 to satisfy both the fuel flow resistance and incorporate a safety margin for calculation uncertainties.
3.
Influence of the Twist Ratio and Thickness on the PEC
While heat transfer coefficient, pressure drop, and mean temperature difference serve as fundamental single-dimensional performance metrics, they cannot fully characterize a heat exchanger’s thermodynamic performance. To address this limitation, researchers have developed multi-criteria evaluation methods, such as working efficiency ( η = Q Δ P ), cold fluid temperature rise efficiency ( η = t c o t c i t h i t c i ), hot fluid temperature drop efficiency ( η = t h i t h o t h i t c i ), comprehensive efficiency index j − f factor ( j = S t P r 2 3 , f = 8 Δ P ρ u 2 d i l ) [33], and overall thermal performance evaluation criterion (PEC) [34,35], etc. The overall thermal performance evaluation criterion PEC, defined as PEC = (Nu/Nu0)/(f/f0)1/3 (where subscript “0” denotes plain tube conditions), serves as a comprehensive metric for evaluating enhanced heat transfer performance under the same heat transfer area and thermal transfer rate. This dimensionless parameter enables direct comparison of both hydrodynamic and thermal performance characteristics [34]. During the process of enhanced heat transfer, the relative increase in flow resistance typically exceeds the improvement in heat transfer coefficient. Therefore, PEC provides a more balanced assessment by quantifying the trade-off between heat transfer enhancement and flow resistance penalties [36], making it particularly valuable for performance optimization studies.
Figure 9 illustrates the variation of the PEC for twisted tapes with different geometric parameters. The PEC exhibited a consistent decreasing trend with increasing twist ratio. While thicker tapes marginally increased the tube-side convective heat transfer coefficient (or Nu), a disproportionate rise in flow resistance occurred. This trade-off resulted in an overall reduction in PEC. In all cases, the PEC exceeded 1, demonstrating consistent performance superiority over smooth tubes at the same heat transfer rate. Therefore, twisted tapes with a smaller twist ratio and greater thickness are preferable from a PEC perspective.
4.
Influence of the Twist Ratio and Thickness on the Heat Transfer Rate
As shown in Figure 10, the tube-side convective heat transfer coefficient decreased sharply with increasing twist ratio, leading to a corresponding decline in the heat transfer rate. The heat transfer rate exhibited an upward trend in all cases when either the thickness was increased or the twist ratio was reduced. However, since the thickness of the twisted tapes had a minimal impact on the tube-side convective heat transfer coefficient, its influence on the overall heat transfer rate was also negligible, according to the heat transfer equation. To meet the technical requirements for heat transfer rate, the twist ratio should not exceed 4. In summary, considering both the fuel flow resistance and heat transfer rate specifications, the twist ratio and thickness of twisted tape inserts were finally determined to be 4 and 0.5 mm, respectively.

4.2.3. Comparison Between Experimental and Calculated Results

Using the structural parameters of the fuel/lubricating oil heat exchanger B (Table 1) and the geometric parameters of the twisted tape inserts determined in Section 4.2.2, HTRI software was employed to calculate the thermodynamic performance of heat exchanger B at the performance evaluation point. As shown in Table 2, the calculated outlet temperature of the lubricating oil was 96.7 °C, closely matching the predicted value of the original heat exchanger A’s predicted value. Meanwhile, the fuel outlet temperature reached 90.0 °C, higher than that of the original design, confirming enhanced fuel-side heat transfer. However, the tube-side flow resistance increased significantly from 1.9 kPa to 18.5 kPa due to the insertion of twisted tapes. In a subsequent experiment, the performance evaluation point was conducted, and the measured outlet temperatures and flow resistances for both lubricating oil and fuel were compared with the HTRI-calculated results (Table 2). The close agreement between the calculated and experimental data validated the reliability and accuracy of the simulation model.
Similarly, a comprehensive series of experiments was conducted on the fuel/lubricating oil heat exchanger B under various operating conditions, with results presented in Figure 4 and Figure 5. The calculated results for both the tube-side fuel outlet temperature and shell-side lubricating oil outlet temperature showed excellent agreement with experimental data, with deviations within ±3%. Notably, under the same experimental conditions, heat exchanger B consistently achieved higher fuel outlet temperatures than heat exchanger A, demonstrating enhanced heat transfer efficiency and more efficient heat transfer between the lubricating oil and fuel in the modified structure. Moreover, the calculated flow resistance values for both the tube-side fuel and shell-side lubricating oil aligned well with experimental measurements, as illustrated in Figure 5. The calculation errors for flow resistance were within ±13% for lubricating oil and ±15% for fuel, respectively. However, compared to heat exchanger A, the fuel flow resistance in heat exchanger B increased significantly by a factor of several times, due to the intensified flow disturbances caused by the twisted tape inserts.

4.2.4. Thermal Resistance and Velocity Analysis

Further analysis of the thermal resistance and fluid velocity in the optimized fuel/lubricating oil heat exchanger B revealed significant performance improvements after structural optimization, as summarized in Table 3. The tube-side thermal resistance decreased sharply from 0.002674 to 0.000464 m2·K/W, reducing its contribution to the total thermal resistance from 84.6 to 50.3%. By targeting the tube-side resistance via twisted tape inserts, it achieved an 82.6% reduction in total thermal resistance, far exceeding typical enhancements from shell-side modifications. Meanwhile, according to the relevant flow parameters, the tube-side velocity increased from 0.25 to 0.53 m/s (Table 3), and the tube-side Re rose from 588 to 1637 (Table 2), indicating significantly stronger turbulence. Consequently, the tube-side convective heat transfer coefficient improved dramatically, from 501.4 to 2995.4 W/(m2·K). At the same time, shell-side velocity, crossflow velocity, and window velocity increased. The shell-side Re increased from 91 to 495 (Table 2), leading to a slight reduction in thermal resistance (from 0.000483 to 0.000457 m2·K/W). The combined enhancements resulted in a 3.1-fold increase in the overall heat transfer coefficient (from 316.5 to 990.9 W/(m2·K)) and a 11% increase in the heat transfer rate (from 4.40 to 4.89 kW), while a 64% reduction in heat transfer area (from 0.527 to 0.188 m2), demonstrating vastly improved heat transfer efficiency. This optimization approach, guided by thermal resistance analysis, proved far more effective than traditional trial-and-error methods. The quantified understanding of resistance dominance enabled targeted improvements that simultaneously enhanced thermal performance while reducing equipment size.

4.2.5. Performance Evaluation and Whole Aeroengine Test

As shown in Table 1, the optimized heat exchanger B achieved a final mass of 1.46 kg, representing an 18% reduction compared to the initial design A (1.78 kg), thereby meeting the technical requirement of mass. Experimental results on the performance evaluation point (Table 2) confirmed that the shell-side and tube-side flow resistances were 49 kPa and 17 kPa, respectively. Both values were well within the specified technical limits of 100 kPa (lubricating oil) and 50 kPa (fuel). Thermal performance evaluations (Table 3) demonstrated an enhanced heat transfer rate of 4.89 kW, exceeding the minimum requirement of 4.8 kW. Thus, these results confirmed that the optimization successfully achieved a balanced multi-objective improvement, simultaneously accomplishing heat transfer enhancement, mass reduction, and flow resistance control.
The optimized fuel/lubricating oil heat exchanger B was subsequently used for aeroengine performance debugging. As illustrated in Figure 6, successful fuel ignition occurred once the gas generator speed (Ng) exceeded 19%, with a corresponding rapid increase in gas turbine outlet temperature (T45). Aeroengine-starting compatibility resolved the fuel-filling delay issue (associated with tube-side velocity of 0.53 m/s) through physics-based optimization, directly improving ignition reliability (a critical requirement absent in generic heat exchanger models).

5. Conclusions

In this paper, HTRI software was used to calculate thermodynamic performances of the shell-and-tube type fuel/lubricating oil heat exchanger A of an aeroengine. Through a comprehensive comparison between calculated results and experimental data, the dominant factor limiting heat transfer was confirmed. Building upon these findings and incorporating insights from the whole aeroengine test, the improved fuel/lubricating oil heat exchanger B, incorporating twisted tape inserts, was proposed. The main conclusions were as follows:
(1)
The HTRI-calculated results for heat exchanger A demonstrated excellent agreement with experimental data, showing maximum deviations of ±2% for outlet temperatures and ±15% for flow resistances. The model quantitatively identified that 84.6% of total thermal resistance resided on the tube side (fuel flow), providing critical guidance for optimization. The whole aeroengine test indicated that slow tube-side fuel velocity (0.25 m/s) prolonged fuel filling time, adversely affecting fuel ignition and aeroengine starting.
(2)
Based on HTRI-calculated results, whole aeroengine test data, and the technical requirements, the fuel/lubricating oil heat exchanger B incorporating twisted tape inserts was proposed. The thickness and the twist ratio of twisted tapes were finally determined to be 0.5 mm and 4, respectively.
(3)
Experimental verification of heat exchanger B confirmed the calculation model’s accuracy, maintaining prediction errors within ±2% for temperatures and ±15% for flow resistances, well within acceptable engineering tolerances. The optimized design achieved remarkable performance improvements with 82.6% reduction in tube-side thermal resistance, 213% increase in overall heat transfer coefficient, and 18.0% reduction in total heat exchanger mass.
(4)
Finally, the integrated experimental-computational workflow confirmed that the improved fuel/lubricating oil heat exchanger B simultaneously addressed conflicting requirements of mass reduction, flow resistance control, and heat transfer rate enhancement at the same time. Moreover, the system-level test (whole aeroengine test) indicated that the structural optimization directly improved ignition reliability, confirming excellent aeroengine starting compatibility.
While the current study has successfully addressed the immediate performance limitations, several important aspects require further investigation to ensure robust operation throughout the aeroengine’s service life. Specifically, long-term effects of cyclic thermal stresses on twisted tapes (e.g., material deformation, fatigue cracking), along with a systematic parametric study covering the entire flight envelope (e.g., transient throttle changes and combined high-G/high-temperature operational extremes), and the scalability to higher-capacity systems remain further investigations. These investigations will be essential for transitioning the current design from laboratory validation to fielded operational systems, particularly for mission-critical aerospace applications where reliability and durability are paramount.

Supplementary Materials

The following supporting information can be downloaded at: https://www.mdpi.com/article/10.3390/en18184955/s1, Figure S1: Illustration of twisted tape inserts in a circular tube; Table S1: Main parameters of the experiment system; Table S2: Physical properties of fuel and lubricating oil.

Author Contributions

Conceptualization, G.L.; methodology, W.L. and G.Z.; software, S.A.; validation, G.L. and G.Z.; formal analysis, W.L. and H.J.; investigation, G.L.; data curation, G.L.; writing—original draft preparation, G.L.; writing—review and editing, G.L. and H.S.; supervision, H.J. and H.S. All authors have read and agreed to the published version of the manuscript.

Funding

This research received no external funding.

Data Availability Statement

The data presented in this study are available on request to the authors and will not be made public due to privacy concerns.

Conflicts of Interest

Author Shuai An was employed by the company Wuhuan Engineering Co., Ltd. The remaining authors declare that the research was conducted in the absence of any commercial or financial relationships that could be construed as a potential conflict of interest.

Glossary

Nomenclature
Aheat transfer area, namely, outer wall area (m2)
Aiinner wall area (m2)
Amlog mean heat transfer area of inner wall and outer wall (m2)
Aoouter wall area (m2)
btube wall thickness (m)
cpheat capacity (J/(kg·K))
ditube inner diameter (m)
dotube outer diameter (m)
Dhydrodynamic diameter of the tube (m)
Hpitch of twisted tape inserts (mm)
ltube length (m)
Koverall heat transfer coefficient (W/(m2·K))
Qheat transfer rate (W)
Rsitube-side fouling resistance (m2·K/W)
Rsoshell-side fouling resistance (m2·K/W)
ytwist ratio
Greek symbols
αtube-side heat transfer coefficient (J/(m2·K))
αitube-side heat transfer coefficient (J/(m2·K))
αsshell-side heat transfer coefficient (J/(m2·K))
δthickness of twisted tape inserts (mm)
Δ P flow resistance (kPa)
Δtm logarithmic mean temperature difference (K)
Δ T 1 maximum end temperature difference (K)
Δ T 2 minimum end temperature difference (K)
λcoefficient of thermal conductivity (W/(m·K))
μ viscosity (mPa·s)
ρ density (kg/m3)

References

  1. Che, M.; Elbel, S. Experimental study of local air-side heat transfer coefficient on real-scale heat exchanger fins by employing an absorption-based mass transfer method. Appl. Therm. Eng. 2021, 189, 116718. [Google Scholar] [CrossRef]
  2. Wang, S.; Wen, J.; Li, Y. An experimental investigation of heat transfer enhancement for a shell-and-tube heat exchanger. Appl. Therm. Eng. 2009, 29, 2433–2438. [Google Scholar] [CrossRef]
  3. Raei, B.; Shahraki, F.; Jamialahmadi, M.; Peyghambarzadeh, S. Different methods to calculate heat transfer coefficient in a double-tube heat exchanger: A comparative study. Exp. Heat Transf. 2018, 31, 32–46. [Google Scholar] [CrossRef]
  4. Samadifar, M.; Toghraie, D. Numerical simulation of heat transfer enhancement in a plate-fin heat exchanger using a new type of vortex generators. Appl. Therm. Eng. 2018, 133, 671–681. [Google Scholar] [CrossRef]
  5. Li, L.; Du, X.; Yang, L.; Xu, Y.; Yang, Y. Numerical simulation on flow and heat transfer of fin structure in air-cooled heat exchanger. Appl. Therm. Eng. 2013, 59, 77–86. [Google Scholar] [CrossRef]
  6. Gu, J. Calculating method and experimental verification of heat transfer characteristics for tube and shell type fuel and oil heat exchanger. Aeroengine 2013, 39, 65–69. [Google Scholar]
  7. Cai, H.; Weng, Z.; Liao, Y.; Gu, K.; Wang, J. Research on an arc air-lubricating oil radiator equipped in internal surface of air intake for the aero engine. J. Therm. Sci. 2020, 29, 687–696. [Google Scholar] [CrossRef]
  8. Zhang, H.; Wang, Y.; Pang, L.; Xu, Z. Research on the fin performance of air-oil heat exchanger for aircraft engine. In Proceedings of the International Conference on Man-Machine-Environment System Engineering, Singapore, 23–25 October 2021; Springer: Berlin/Heidelberg, Germany, 2022; pp. 419–426. [Google Scholar]
  9. Donohue, D.A. Heat transfer and pressure drop in heat exchangers. Ind. Eng. Chem. 1949, 41, 2499–2511. [Google Scholar] [CrossRef]
  10. Kern, D.Q. Process Heat Transfer; Tata McGraw-Hill Education: New York, NY, USA, 1997. [Google Scholar]
  11. Bell, K.J. Final Report of the Cooperative Research Program on Shell and Tube Heat Exchangers; University of Delaware, Engineering Experimental Station: Newark, DE, USA, 1963. [Google Scholar]
  12. Palen, J.; Taborek, J. Solution of shell side flow pressure drop and heat transfer by stream analysis method. Chem. Eng. Prog. Symp. Ser. 1969, 65, 53–63. [Google Scholar]
  13. Tinker, T. Shell side characteristics of shell and tube heat exchangers. Gen. Discuss. Heat Transf. 1951, 80, 89–116. [Google Scholar]
  14. Hu, Q.; Qu, X.; Peng, W.; Wang, J. Experimental and numerical investigation of turbulent heat transfer enhancement of an intermediate heat exchanger using corrugated tubes. J. Heat Mass Transf. 2022, 185, 122385. [Google Scholar] [CrossRef]
  15. Kirkar, S.M.; Gönül, A.; Celen, A.; Dalkilic, A.S. Multi-objective optimization of single-phase flow heat transfer characteristics in corrugated tubes. Int. J. Therm. Sci. 2023, 186, 108119. [Google Scholar] [CrossRef]
  16. Wu, J.; Lu, S.; Wang, C.; Li, J. Numerical study on heat transfer characteristics of helically coiled grooved elliptical tube heat exchanger. Int. J. Heat Fluid Flow 2024, 110, 109622. [Google Scholar] [CrossRef]
  17. Al-Obaidi, A.R. The influence of different twisted tape inserts configurations on thermo-hydraulic performance and enhancement of heat transfer in the 3D circular tube. Korean J. Chem. Eng. 2023, 40, 770–790. [Google Scholar] [CrossRef]
  18. Liaw, K.L.; Kurnia, J.C.; Sasmito, A.P. Enhancing supercritical carbon dioxide heat transfer in helical tube heat exchangers with twisted tape inserts: A computational investigation. Int. J. Heat Mass Transf. 2024, 227, 125598. [Google Scholar] [CrossRef]
  19. Chompookham, T.; Chingtuaythong, W.; Chokphoemphun, S. Influence of a novel serrated wire coil insert on thermal characteristics and air flow behavior in a tubular heat exchanger. Int. J. Therm. Sci. 2022, 171, 107184. [Google Scholar] [CrossRef]
  20. García, A.; Herrero-Martin, R.; Pérez-García, J.; Solano, J. Validation of a new methodological approach for the selection of wire-coil inserts in thermal equipment. Appl. Therm. Eng. 2023, 218, 119273. [Google Scholar] [CrossRef]
  21. Rashid, F.L.; Dhaidan, N.S.; Mahdi, A.J.; Azziz, H.N.; Parveen, R.; Togun, H.; Homod, R.Z. Heat transfer enhancement of phase change materials using letters-shaped fins: A review. Int. Commun. Heat Mass Transf. 2024, 159, 108096. [Google Scholar] [CrossRef]
  22. Khudhur, D.S.; Al-Zuhairy, R.C.; Kassim, M.S. Thermal analysis of heat transfer with different fin geometry through straight plate-fin heat sinks. Int. J. Therm. Sci. 2022, 174, 107443. [Google Scholar] [CrossRef]
  23. Boujelbene, M.; Mohammed, H.I.; Sultan, H.S.; Eisapour, M.; Chen, Z.; Mahdi, J.M.; Cairns, A.; Talebizadehsardari, P. A comparative study of twisted and straight fins in enhancing the melting and solidifying rates of PCM in horizontal double-tube heat exchangers. Int. Commun. Heat Mass Transf. 2024, 151, 107224. [Google Scholar] [CrossRef]
  24. Xu, P.; Wen, J.; Wang, S.; Chen, Q.; Li, Y. Numerical simulation on flow and heat transfer performances of serrated and wavy fins in plate-fin heat exchanger for hydrogen liquefaction. Int. J. Hydrogen Energy 2023, 48, 20680–20693. [Google Scholar] [CrossRef]
  25. Cheng, Z.; Xu, R.; Jiang, P. Morphology, flow and heat transfer in triply periodic minimal surface based porous structures. Int. J. Heat Mass Transf. 2021, 170, 120902. [Google Scholar] [CrossRef]
  26. Du, L.; Hu, W. An overview of heat transfer enhancement methods in microchannel heat sinks. Chem. Eng. Sci. 2023, 280, 119081. [Google Scholar] [CrossRef]
  27. Dagdevir, T.; Ozceyhan, V. An experimental study on heat transfer enhancement and flow characteristics of a tube with plain, perforated and dimpled twisted tape inserts. Int. J. Therm. Sci. 2021, 159, 106564. [Google Scholar] [CrossRef]
  28. Soltani, M.M.; Gorji-Bandpy, M.; Vaisi, A.; Moosavi, R. Heat transfer augmentation in a double-pipe heat exchanger with dimpled twisted tape inserts: An experimental study. Heat Mass Transf. 2022, 58, 1591–1606. [Google Scholar] [CrossRef]
  29. Hamza, N.F.A.; Aljabair, S. Evaluation of thermal performance factor by hybrid nanofluid and twisted tape inserts in heat exchanger. Heliyon 2022, 8, e11950. [Google Scholar] [CrossRef] [PubMed]
  30. Man, C.; Lv, X.; Hu, J.; Sun, P.; Tang, Y. Experimental study on effect of heat transfer enhancement for single-phase forced convective flow with twisted tape inserts. Int. J. Heat Mass Transf. 2017, 106, 877–883. [Google Scholar] [CrossRef]
  31. Mashayekhi, R.; Arasteh, H.; Talebizadehsardari, P.; Kumar, A.; Hangi, M.; Rahbari, A. Heat Transfer Enhancement of nanofluid flow in a tube equipped with rotating twisted tape inserts: A two-phase approach. Heat Transf. Eng. 2022, 43, 608–622. [Google Scholar] [CrossRef]
  32. Esmaeilzadeh, E.; Almohammadi, H.; Nokhosteen, A.; Motezaker, A.; Omrani, A. Study on heat transfer and friction factor characteristics of γ-Al2O3/water through circular tube with twisted tape inserts with different thicknesses. Int. J. Therm. Sci. 2014, 82, 72–83. [Google Scholar] [CrossRef]
  33. Zeng, M.; Tang, L.; Lin, M.; Wang, Q. Optimization of heat exchangers with vortex-generator fin by Taguchi method. Appl. Therm. Eng. 2010, 30, 1775–1783. [Google Scholar] [CrossRef]
  34. Siavashi, M.; Bahrami, H.R.T.; Aminian, E. Optimization of heat transfer enhancement and pumping power of a heat exchanger tube using nanofluid with gradient and multi-layered porous foams. Appl. Therm. Eng. 2018, 138, 465–474. [Google Scholar] [CrossRef]
  35. Setareh, M.; Saffar, M.; Abdullah, A. Experimental and numerical study on heat transfer enhancement using ultrasonic vibration in a double-pipe heat exchanger. Appl. Therm. Eng. 2019, 159, 113867. [Google Scholar] [CrossRef]
  36. Ghalambaz, M.; Arasteh, H.; Mashayekhi, R.; Keshmiri, A.; Talebizadehsardari, P.; Yaïci, W. Investigation of overlapped twisted tapes inserted in a double-pipe heat exchanger using two-phase nanofluid. Nanomaterials 2020, 10, 1656. [Google Scholar] [CrossRef] [PubMed]
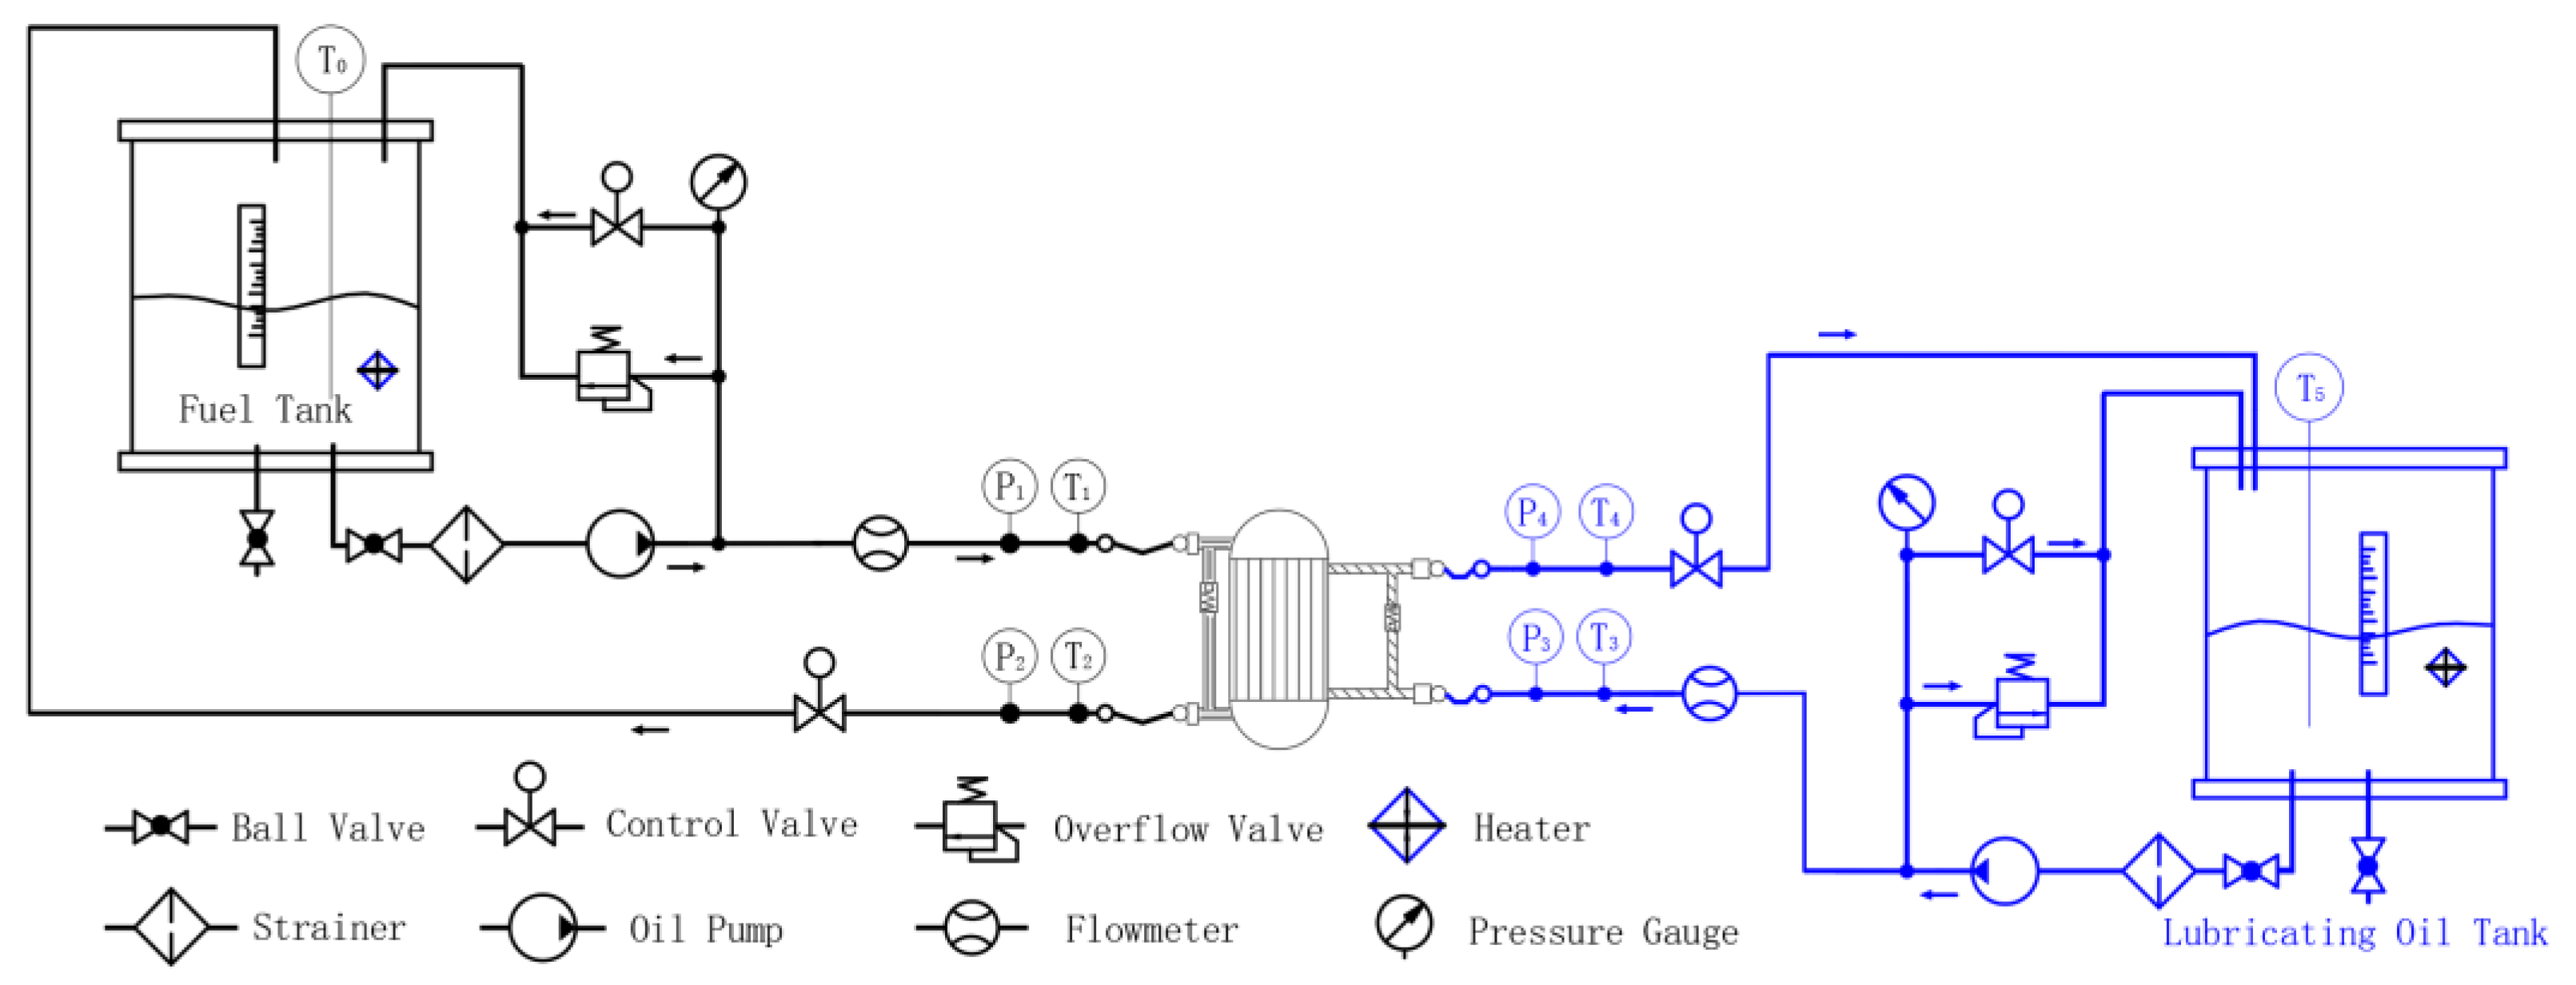
Figure 1. Schematic diagram of the experiment system.
Energies 18 04955 g001
Figure 2. Calculation model diagrams of the fuel/lubricating oil heat exchangers A (a) and B (b), exported from HTRI software.
Energies 18 04955 g002
Figure 3. Sectional views of the three-dimensional diagrams about the fuel/lubricating oil heat exchangers A (a) and B (b).
Energies 18 04955 g003
Figure 4. Outlet temperatures comparison of heat exchangers A and B: (a) Calculated vs. experimental results for lubricating oil; (b) Calculation error margins for lubricating oil; (c) Calculated vs. experimental results for fuel; (d) Calculation error margins for fuel. The red box represents the performance evaluation point.
Energies 18 04955 g004
Figure 5. Flow resistances comparison of heat exchangers A and B: (a) Calculated vs. experimental results for lubricating oil; (b) Calculation error margins for lubricating oil; (c) Calculated vs. experimental results for fuel; (d) Calculation error margins for fuel. The red box represents the performance evaluation point.
Energies 18 04955 g005
Figure 6. Fuel ignition performance diagram in an aeroengine loaded with the fuel/lubricating oil heat exchangers A and B.
Energies 18 04955 g006
Figure 7. Variation of tube-side heat transfer coefficient with twist ratio y and thickness δ.
Energies 18 04955 g007
Figure 8. Variation of tube-side flow resistance with twist ratio y and thickness δ.
Energies 18 04955 g008
Figure 9. Variation of PEC with twist ratio y and thickness δ.
Energies 18 04955 g009
Figure 10. Variation of heat transfer rate with twist ratio y and thickness δ.
Energies 18 04955 g010
Table 1. Structural parameters of the fuel/lubricating oil heat exchangers A and B.
Parameters (Unit)Heat Exchanger AHeat Exchanger B
Tube numbers662186
Tube size (mm)2.36 × 0.33 × 0.35
Tube length (mm)110110
Tube type and materialplain tubes, aluminum alloy 3A21plain tubes with twisted tape inserts, aluminum alloy 3A21
Tube pitch (mm)34
Tube layout angle (°)3030
Tube passes44
Shell passes11
Shell inner diameter (mm)9068
Baffle spacing (mm)21.521.5
Baffle cut (%)2020
Baffle numbers37
Weight (kg)1.781.46
Table 2. Comparison between experimental and calculated results on outlet temperature, flow resistance, and Reynolds number of lubricating oil and fuel on the performance evaluation point.
Performance
Parameters
Heat Exchanger AHeat Exchanger B
Experimental ResultsCalculated ResultsErrorExperimental ResultsCalculated ResultsError
Outlet temperature of lubricating oil96.5 °C97.7 °C1.2%97.2 °C96.7 °C−0.5%
Outlet temperature of fuel86.8 °C87.4 °C0.7%89.2 °C90.0 °C0.9%
Flow resistance of lubricating oil58 kPa52.3 kPa−10%49 kPa46.0 kPa−6.1%
Flow resistance of fuel2 kPa1.9 kPa−5%17 kPa18.5 kPa8.8%
Reynolds number of lubricating oil51158815.1%1428163714.6%
Reynolds number of fuel9591−4.3%4624957.1%
Table 3. Calculation results of relevant heat transfer and flow parameters.
Parameters (Unit)Heat Exchanger AHeat Exchanger B
Heat transfer rate (kW)4.404.89
Heat transfer area (m2)0.5270.188
Shell-side heat transfer coefficient (W/(m2·K))2070.42186.2
Tube-side heat transfer coefficient (W/(m2·K))501.42995.4
Overall heat transfer coefficient (W/(m2·K))316.5990.9
Shell-side thermal resistance (m2·K/W)0.0004830.000457
Tube-side thermal resistance (m2·K/W)0.0026740.000464
Tube wall thermal resistance (m2·K/W)0.0000020.000002
Shell-side velocity (m/s)0.710.85
Tube-side velocity (m/s)0.250.53
Crossflow velocity (m/s)0.750.84
Window velocity (m/s)0.440.63
Disclaimer/Publisher’s Note: The statements, opinions and data contained in all publications are solely those of the individual author(s) and contributor(s) and not of MDPI and/or the editor(s). MDPI and/or the editor(s) disclaim responsibility for any injury to people or property resulting from any ideas, methods, instructions or products referred to in the content.