1. Introduction
According to the Paris Agreement signed by 175 countries in 2016, Turkey has declared a net-zero emission target for 2053 within the scope of reducing carbon emissions and creating a sustainable transportation system [
1]. It is a known fact that vehicles using conventional fuel types (gasoline, diesel, and auto gas) cause carbon emissions globally. For example, according to the US Environmental Protection Agency (EPA), a typical passenger car using gasoline as a fuel emits approximately 4.6 metric tons of CO
2 to the environment annually [
2]. According to the Turkish Statistical Institute, as of January 2024, the number of cars using conventional fuels that emit harmful emissions exceeded 15 million [
3]. As an important part of the mission to reduce harmful emissions, infrastructure efforts are underway to promote the use of electric vehicles across the country. In recent years, there has been a noticeable increase in the number of charging stations, according to the Turkish Energy Market Regulatory Authority (EPDK). According to EPDK’s charging projections, the total electricity consumption from electric vehicles is projected to be between 1.69 TWh and 3.56 TWh in 2030 [
4]. This shows the roadmap of Turkey’s 2053 zero-emission target in terms of vehicle use by fuel type. Factors such as consumer habits, expectations in battery technology, and incentive policies that fall short of Turkey’s emission targets compared to Europe may make users who demand all-electricity hesitant to choose full electric cars or hybrid models. Consumers’ intention to adopt electric vehicles in Turkey is shaped by several factors, including willingness to pay, socio-economic background, and environmental awareness.
Studies show that early adopters of electric vehicles tend to have higher incomes, be environmentally conscious, and are more likely to prioritize innovative solutions to transportation needs [
5]. Hybrid vehicles, which can be defined as a transitional version of electric vehicles, have electric motors along with internal combustion engines powered by gasoline or diesel engines. Hybrid models, which usually use the electric motor at low speeds or at stops, indirectly contribute to the reduction of emissions by reducing fuel consumption harmful to the environment. “Hybrid electric vehicles are now more efficient and capable of covering long distances on electricity alone due to innovative batteries and induction vehicle technology advancements. Such innovative solutions have reduced fuel use while resulting in less CO
2 being emitted. Hybrid electric vehicles’ efficiency has also increased due to advances in power devices and regenerative braking systems” [
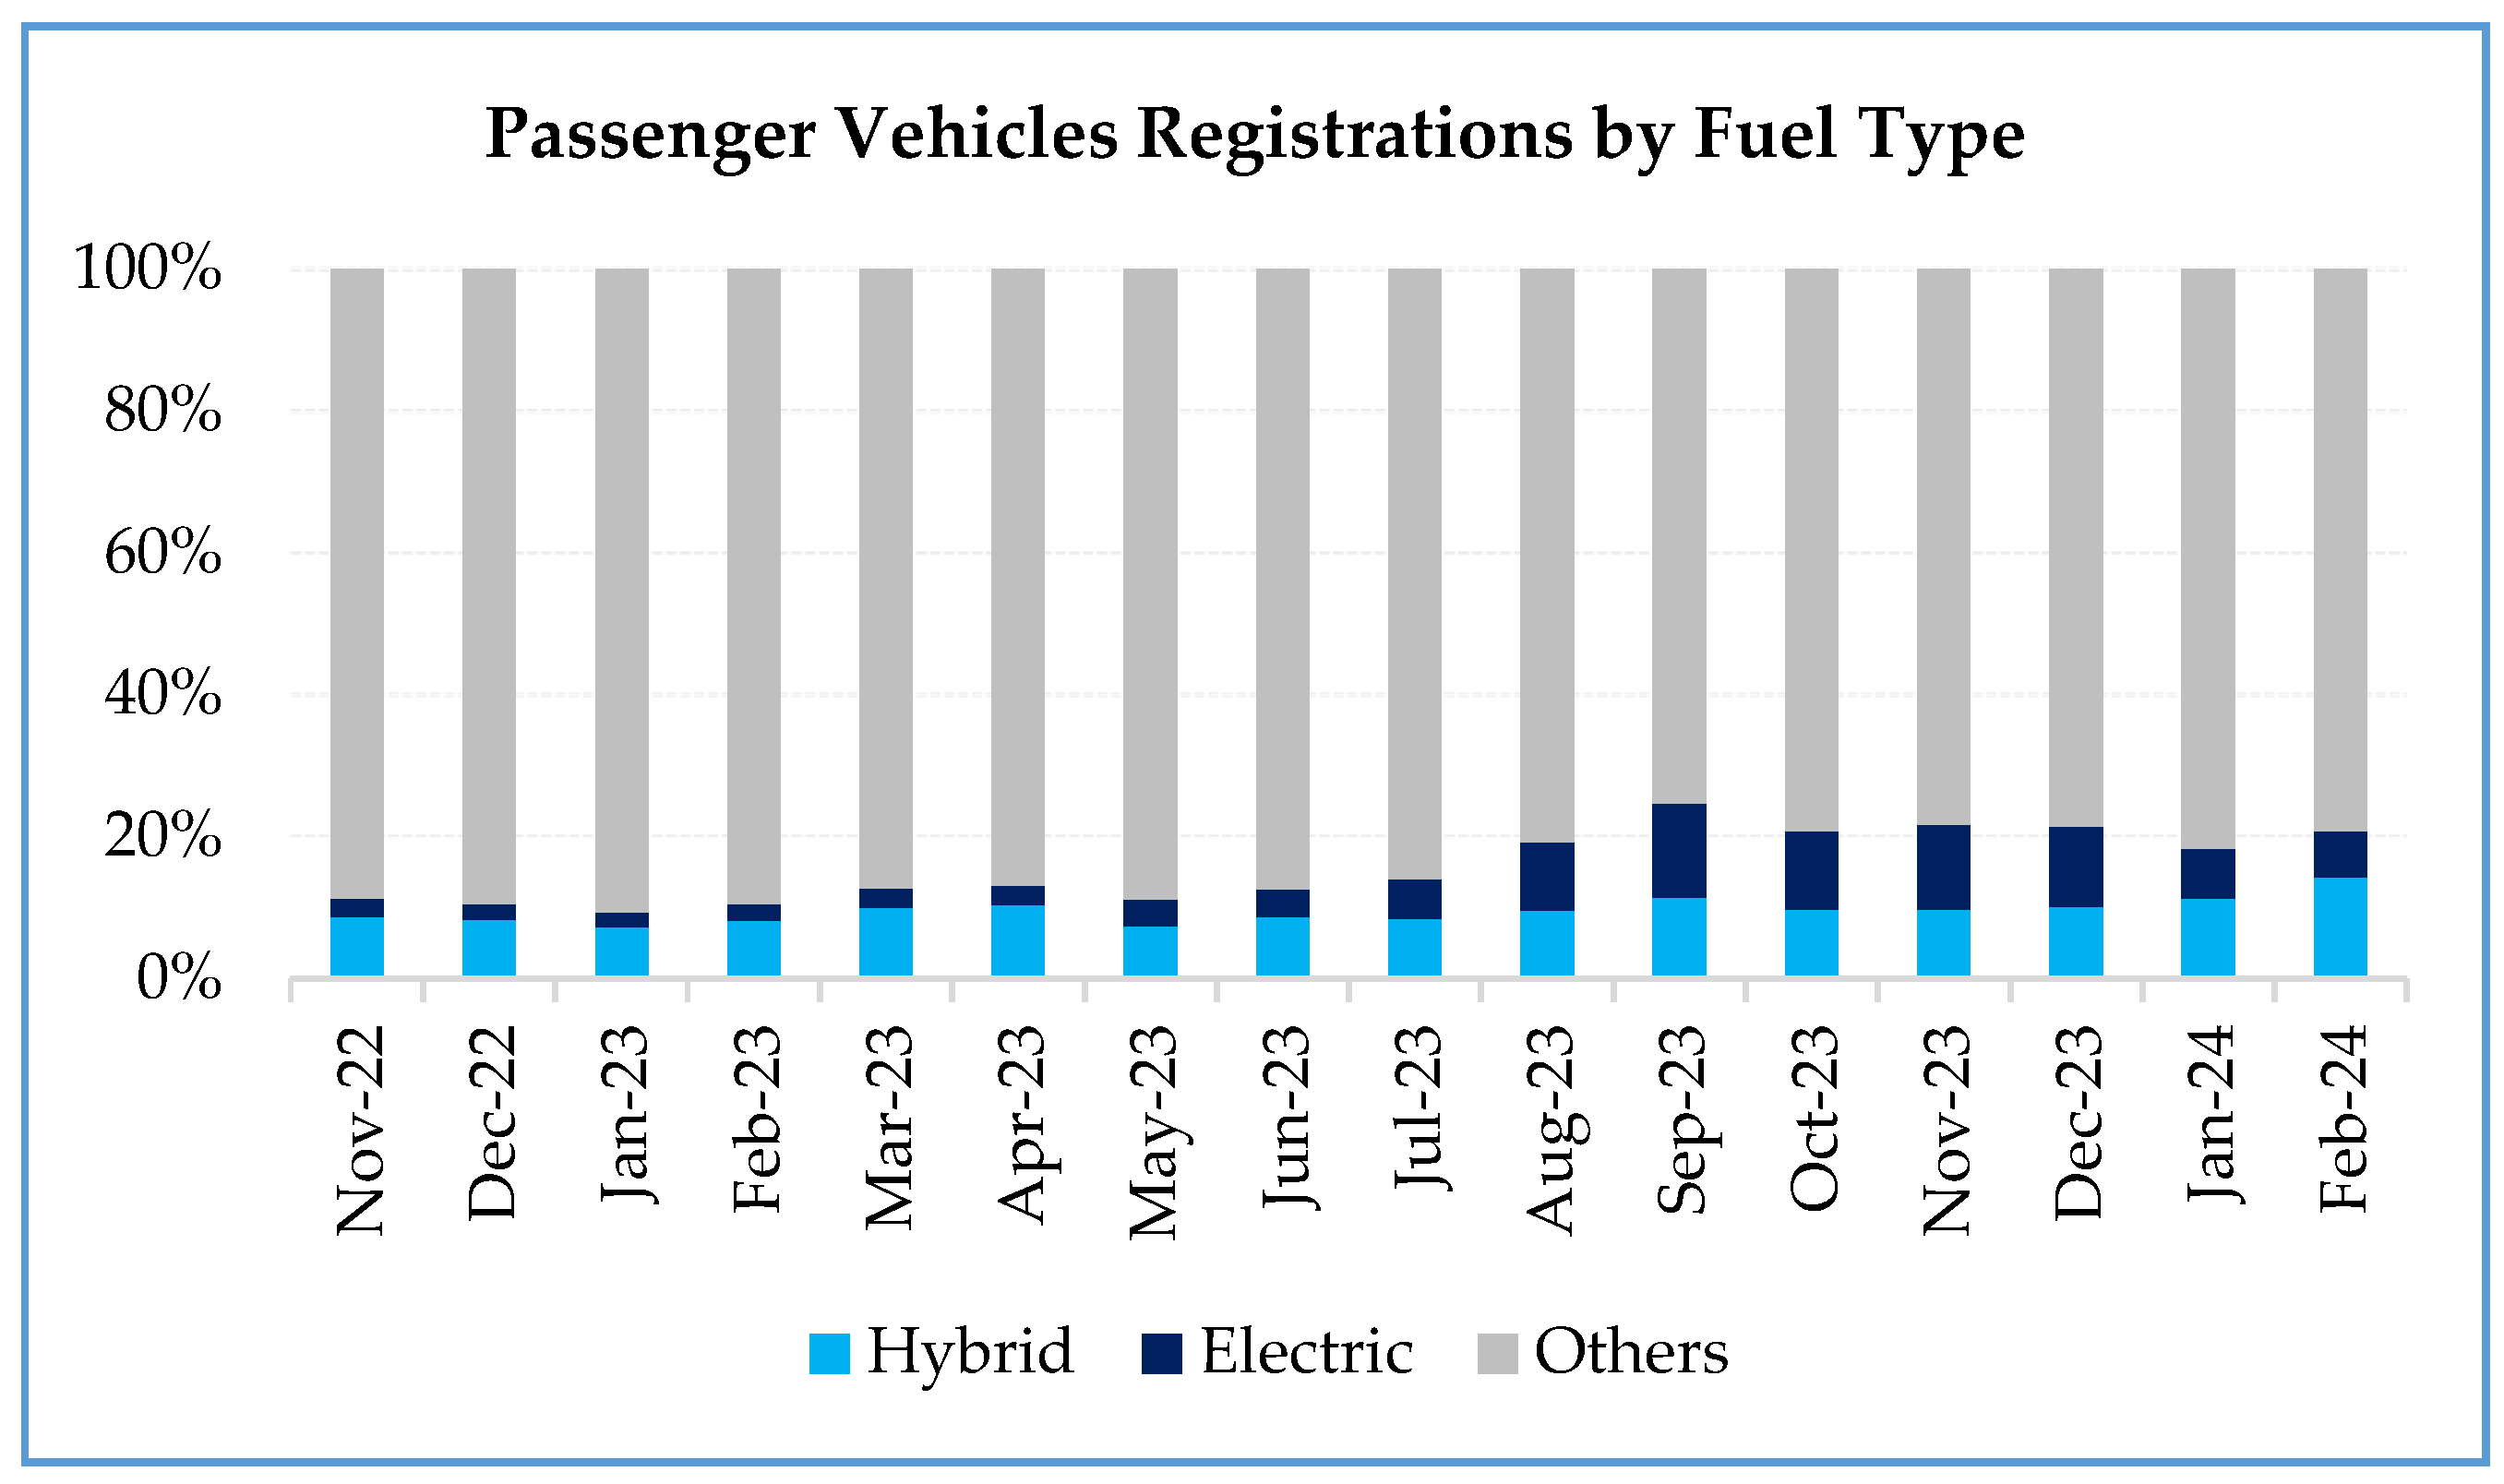
6]. It is also possible to classify hybrid vehicle models within themselves. For example, some hybrid vehicle models provide electricity with the energy from the internal combustion engine, while others demand electricity from charging stations. However, these classifications are not included in this study. In parallel with the recent increase in the number of fully electric cars in Turkey, the popularity of hybrid vehicles continues. In
Figure 1, the number of vehicles registered per 100 passenger cars in Turkey in recent years, categorized by fuel type, is shown [
7].
The first notable increases in the number of electric vehicles in Turkey occurred in 2019. In 2023, electric vehicle ownership gained momentum as the demand for electricity increased compared to previous periods.
Figure 2 shows the number of EVs registered in traffic by month [
8]. According to the sales in previous months, a record number of 20,752 electric vehicles were registered in January 2024 [
3]. As a result of this recently increasing demand,
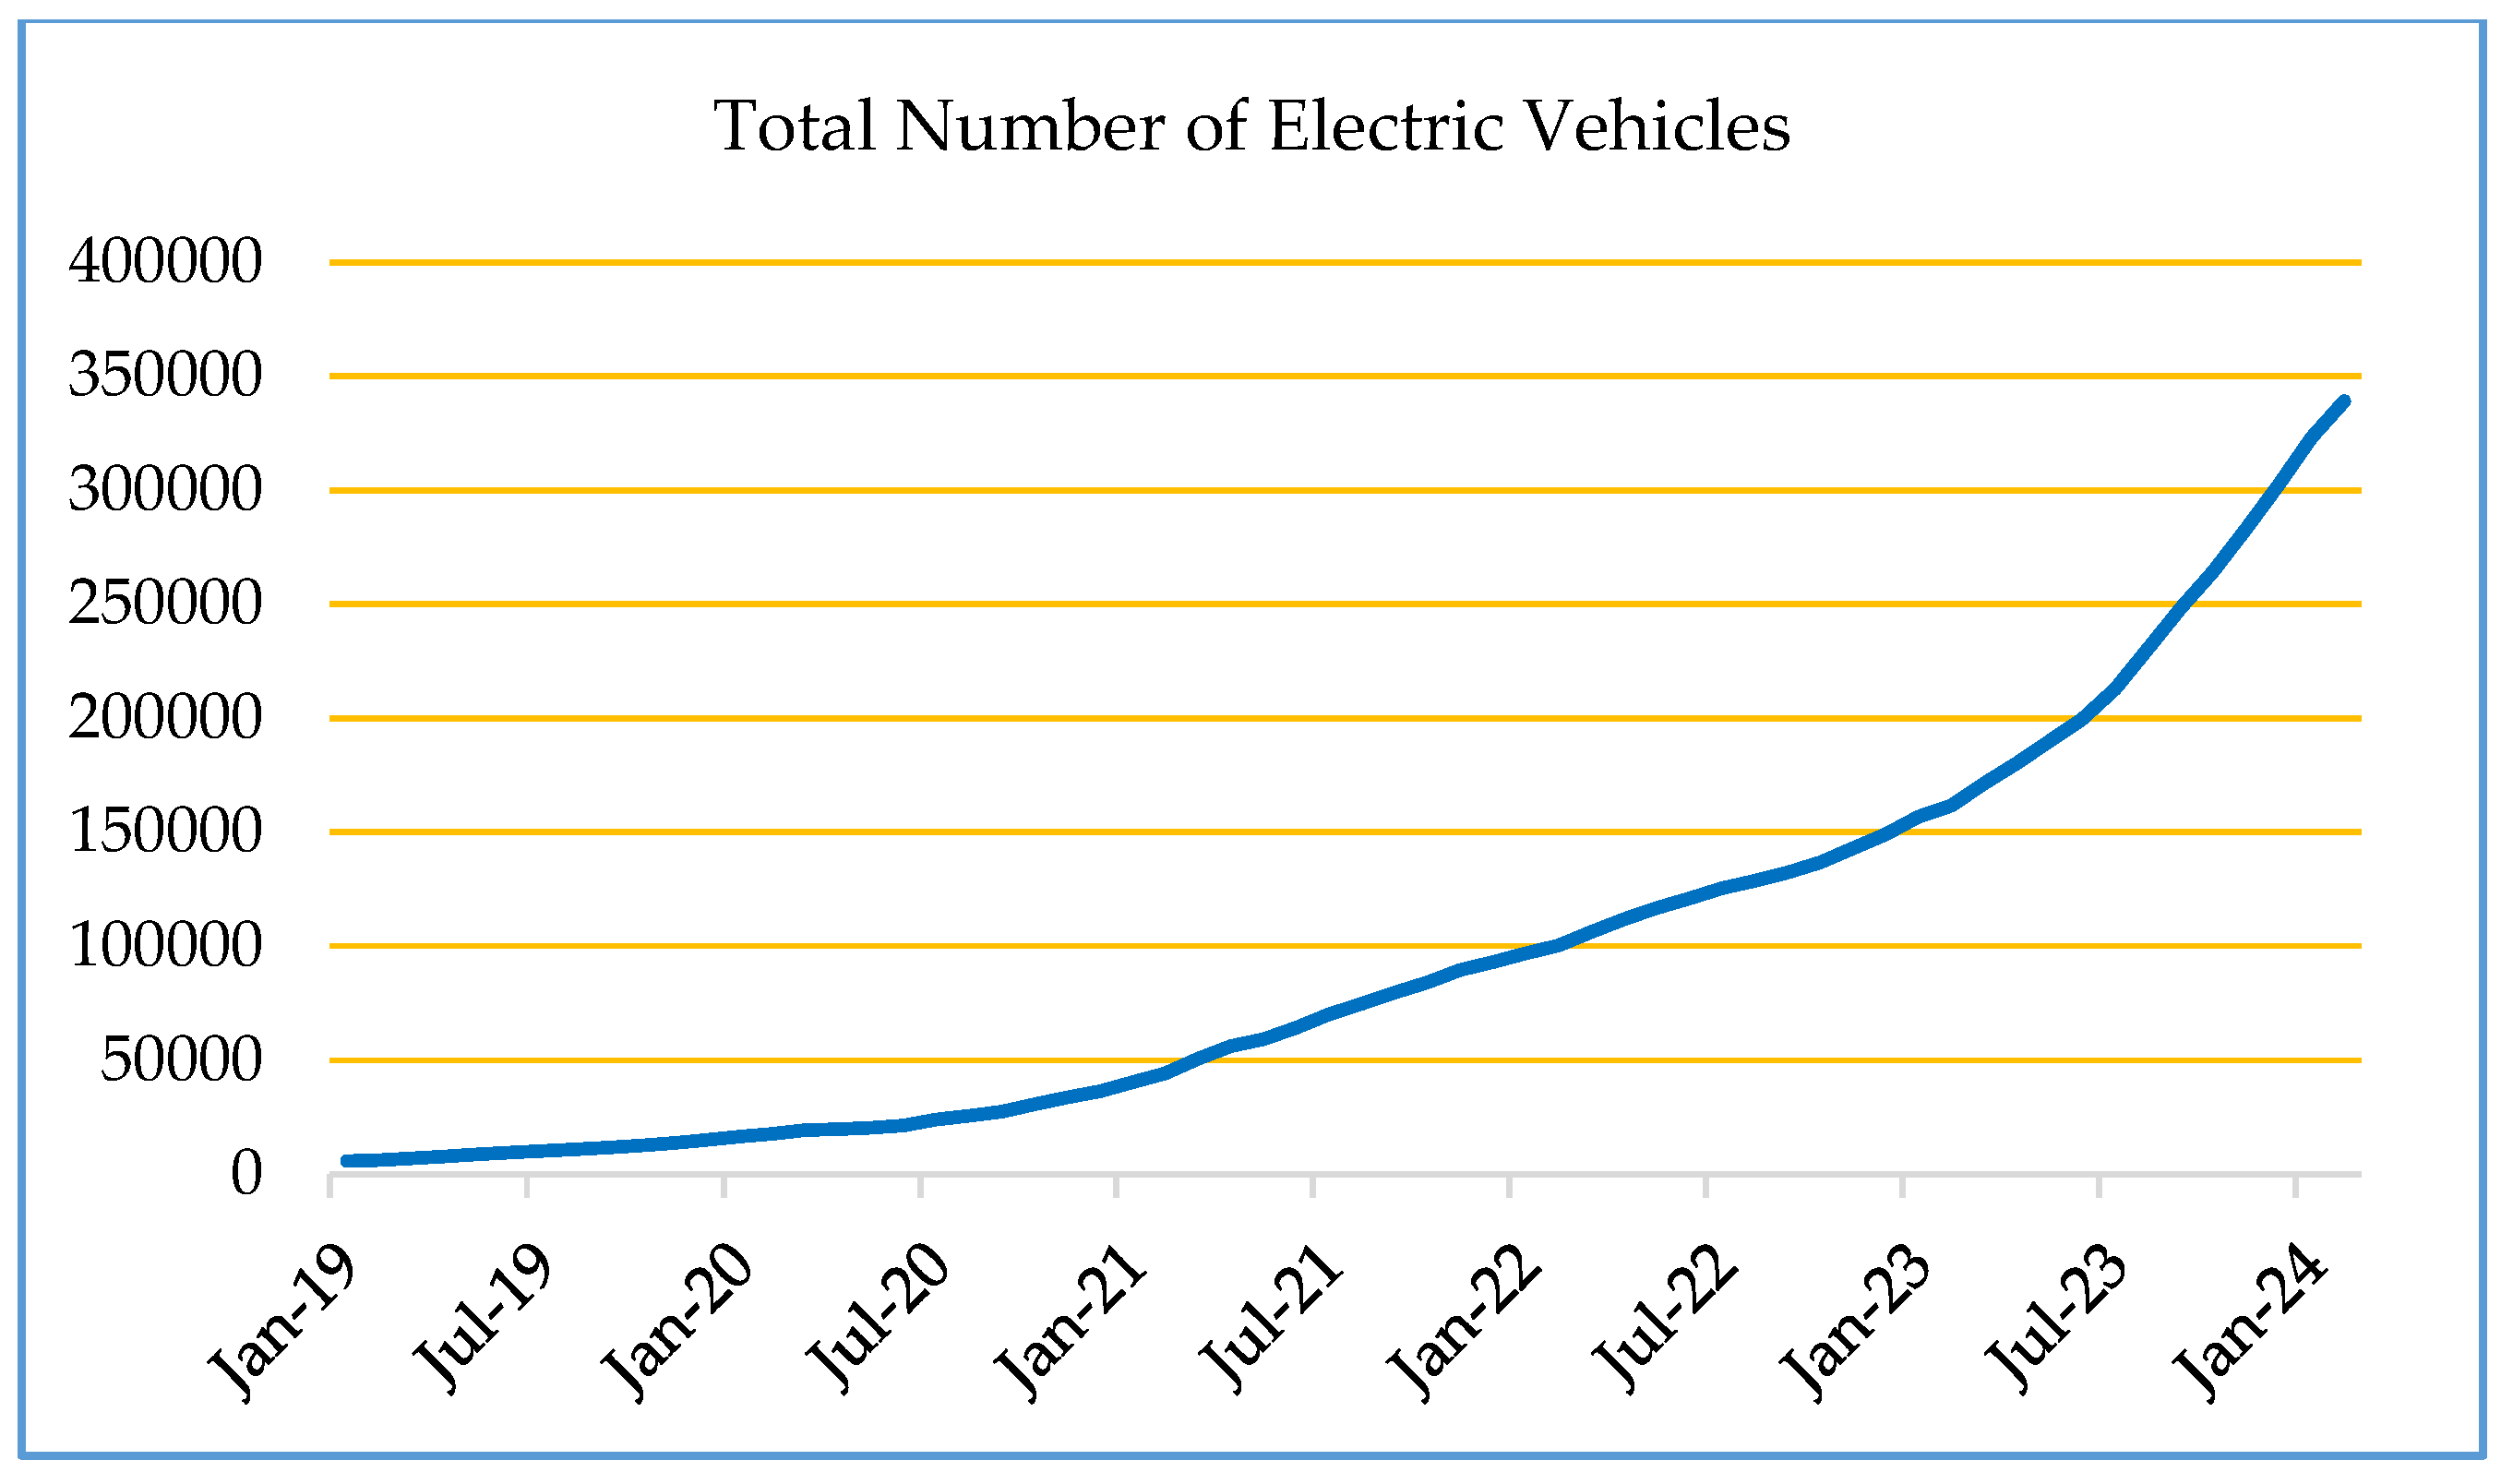
Figure 3 shows the total electric vehicle trend [
8]. As of February 2024, a total of 339,157 electric vehicles are on the road in Turkey [
3]. The data in the graphs have been obtained by summing the number of electric and hybrid vehicles from the country’s statistical agency.
1.1. Car Sales in Recent Years
When a vehicle is “registered”, it means that it can officially drive on the road, and this process results in a vehicle receiving a license plate. Therefore, when a consumer buys a car and sets off on the road, it means that the vehicle has been registered. Therefore, although vehicle registrations and vehicle sales have different semantic definitions, they are numerically equivalent.
Figure 4 shows the number of passenger cars registered for Turkey in monthly time periods between January 2013 and February 2024 [
8]. This also represents the monthly incremental increases in the number of passenger cars. Based on 10 years of records, it is possible to say that there is no clear trend in new car sales on a monthly basis. However, it is observed that there are seasonal trends in certain time periods depending on different conditions.
1.2. Effects on Automobile Sales in Turkey Between 2018–2023
Between 2018 and 2023, the world and the Turkish economy experienced events that had a direct or indirect impact on the automobile market. In Turkey, the rapid rise in exchange rates in 2018 led to a crisis. According to Şanlı, the first steps of the crisis, which started with the rapid rise in exchange rates, continued to develop in the form of capital outflows, low growth, high inflation and budget deficit, high interest rates and foreign debt, policy uncertainty and elections, migration crisis, and crisis-like disagreements with Western allies. In 2018, following the general elections, Turkey entered an unnamed currency crisis [
10]. Batırlık and others stated that exchange rates are one of the most important factors affecting car sales. While the decrease in exchange rates affects the demand for imported automobiles and spare parts positively, the increase affects the sector negatively [
11]. As well as the impact of the currency crisis on the car market, Kaya, P. H., stated that the automotive industry experienced the sharpest decline in production in 2020 due to the impact of the COVID-19 pandemic and the accompanying chip crisis, with total production decreasing by approximately 15.4% compared to 2019. Upon analyzing the annual sales data, she noted that automotive sales, which had shown an upward trend from 2011 to 2017, began to decline starting in 2018. Kaya also mentioned that 2020 marked the lowest levels in both production and sales in the global automotive industry, and despite a slight recovery in 2021, the levels prior to the COVID-19 period were not reached [
12]. In addition to these, citizens’ preference for second-hand vehicles and the failure to realize the expected possible tax cuts can be shown as separate reasons for the decline in car sales in Turkey. Therefore, sales/registration data for 2018–2023 can be expressed as an indicator of abnormal conditions.
1.3. Literature Research
Acceleration in the number of electric vehicles concerns many institutions and organizations. For this reason, a number of studies have been conducted in Turkey to predict the future of electric vehicles. The study by Yaseen Y. forecasts the growth of electric vehicle (EV) ownership in Turkey and concludes that 94% of all vehicles in Turkey could be replaced by electric vehicles by 2057. The model predicts that electric vehicle ownership will continue to grow exponentially until 2042, after which the growth will be slower and more stable [
13]. Another study by Alatawneh and Ghunaim estimates BEV (battery electric vehicle) ownership rates in Turkey by year and predicts that BEV ownership in Turkey will reach a saturation point in 2095 [
14]. Additionally, according to the results of the survey conducted by Şen and others preferences for electric vehicles, which measures the intention of 466 vehicle owners across Turkey to switch to electric vehicles by 2030, the removal of the special consumption tax (ÖTV) increases the likelihood of consumers switching to electric vehicles by up to 19.6%. In the baseline scenario, if the government does not intervene in electric vehicles in Turkey, it is projected that the market share of electric vehicles will only reach 0.1% by 2030, and the potential electric vehicle users will only reach 1.0% [
15]. In addition to these studies, the report titled “Electric Vehicle and Charging Infrastructure Projection” by the country’s Energy Market Regulatory Authority, dated April 2024, states that by 2030, the number of fully electric vehicles in Turkey is projected to reach 776,362 in the low scenario, 1,321,932 in the medium scenario, and 1,679,600 in the high scenario [
4].
In our study, we project the number of electric vehicles for 2030 in monthly time intervals, unlike the existing literature. We apply a customized preprocessing technique to the electric vehicle data, taking into account factors that have adversely affected the automobile market in Turkey since 2018. Another distinguishing aspect of our work is the incorporation of seasonality into the model, with the expectation that the electric vehicle trend will converge with the seasonal patterns typically observed in vehicles with traditional fuel. Furthermore, with the assumption that hybrid vehicles will remain popular, positioning their users as potential candidates for fully electric models and possibly drawing power from the grid based on vehicle type, we have not categorized electric and hybrid vehicles separately. In all these aspects, our forecasts until 2030 not only provide a broad perspective on the future of electric vehicles in Turkey but also offer specific insights for the short and near term.
For instance, SARIMA has been successfully applied in comparable time series forecasting tasks such as energy demand in Brazil [
16] new energy vehicle sales in China [
17], and public transportation demand in Egypt [
18], all of which involve clear seasonal structures and relatively limited historical data.
2. Preprocessing the Dataset on the Number of Electric-Hybrid Vehicles in Turkey with SARIMA Model
Significant increases in the number of electric and hybrid vehicles in Turkey started in 2019. This period corresponds to the period of negative conditions detailed in the introduction of the study under the subheading “Effects on automobile sales in Turkey between 2018–2023”. Therefore, in the 2018–2023 period, the number of electric vehicles would normally be expected to be higher than today’s total number. Any time series regression using the current number of EVs dataset to model the number of EVs in Turkey towards 2030 is likely to generate misleading forecasts even if it provides statistically reliable forecasts. As a result, organizing the electric vehicle registration data between 2018 and 2023, which can be considered as an abnormal period, will provide healthier results for the simulation we will create towards 2030.
2.1. Data Source
In
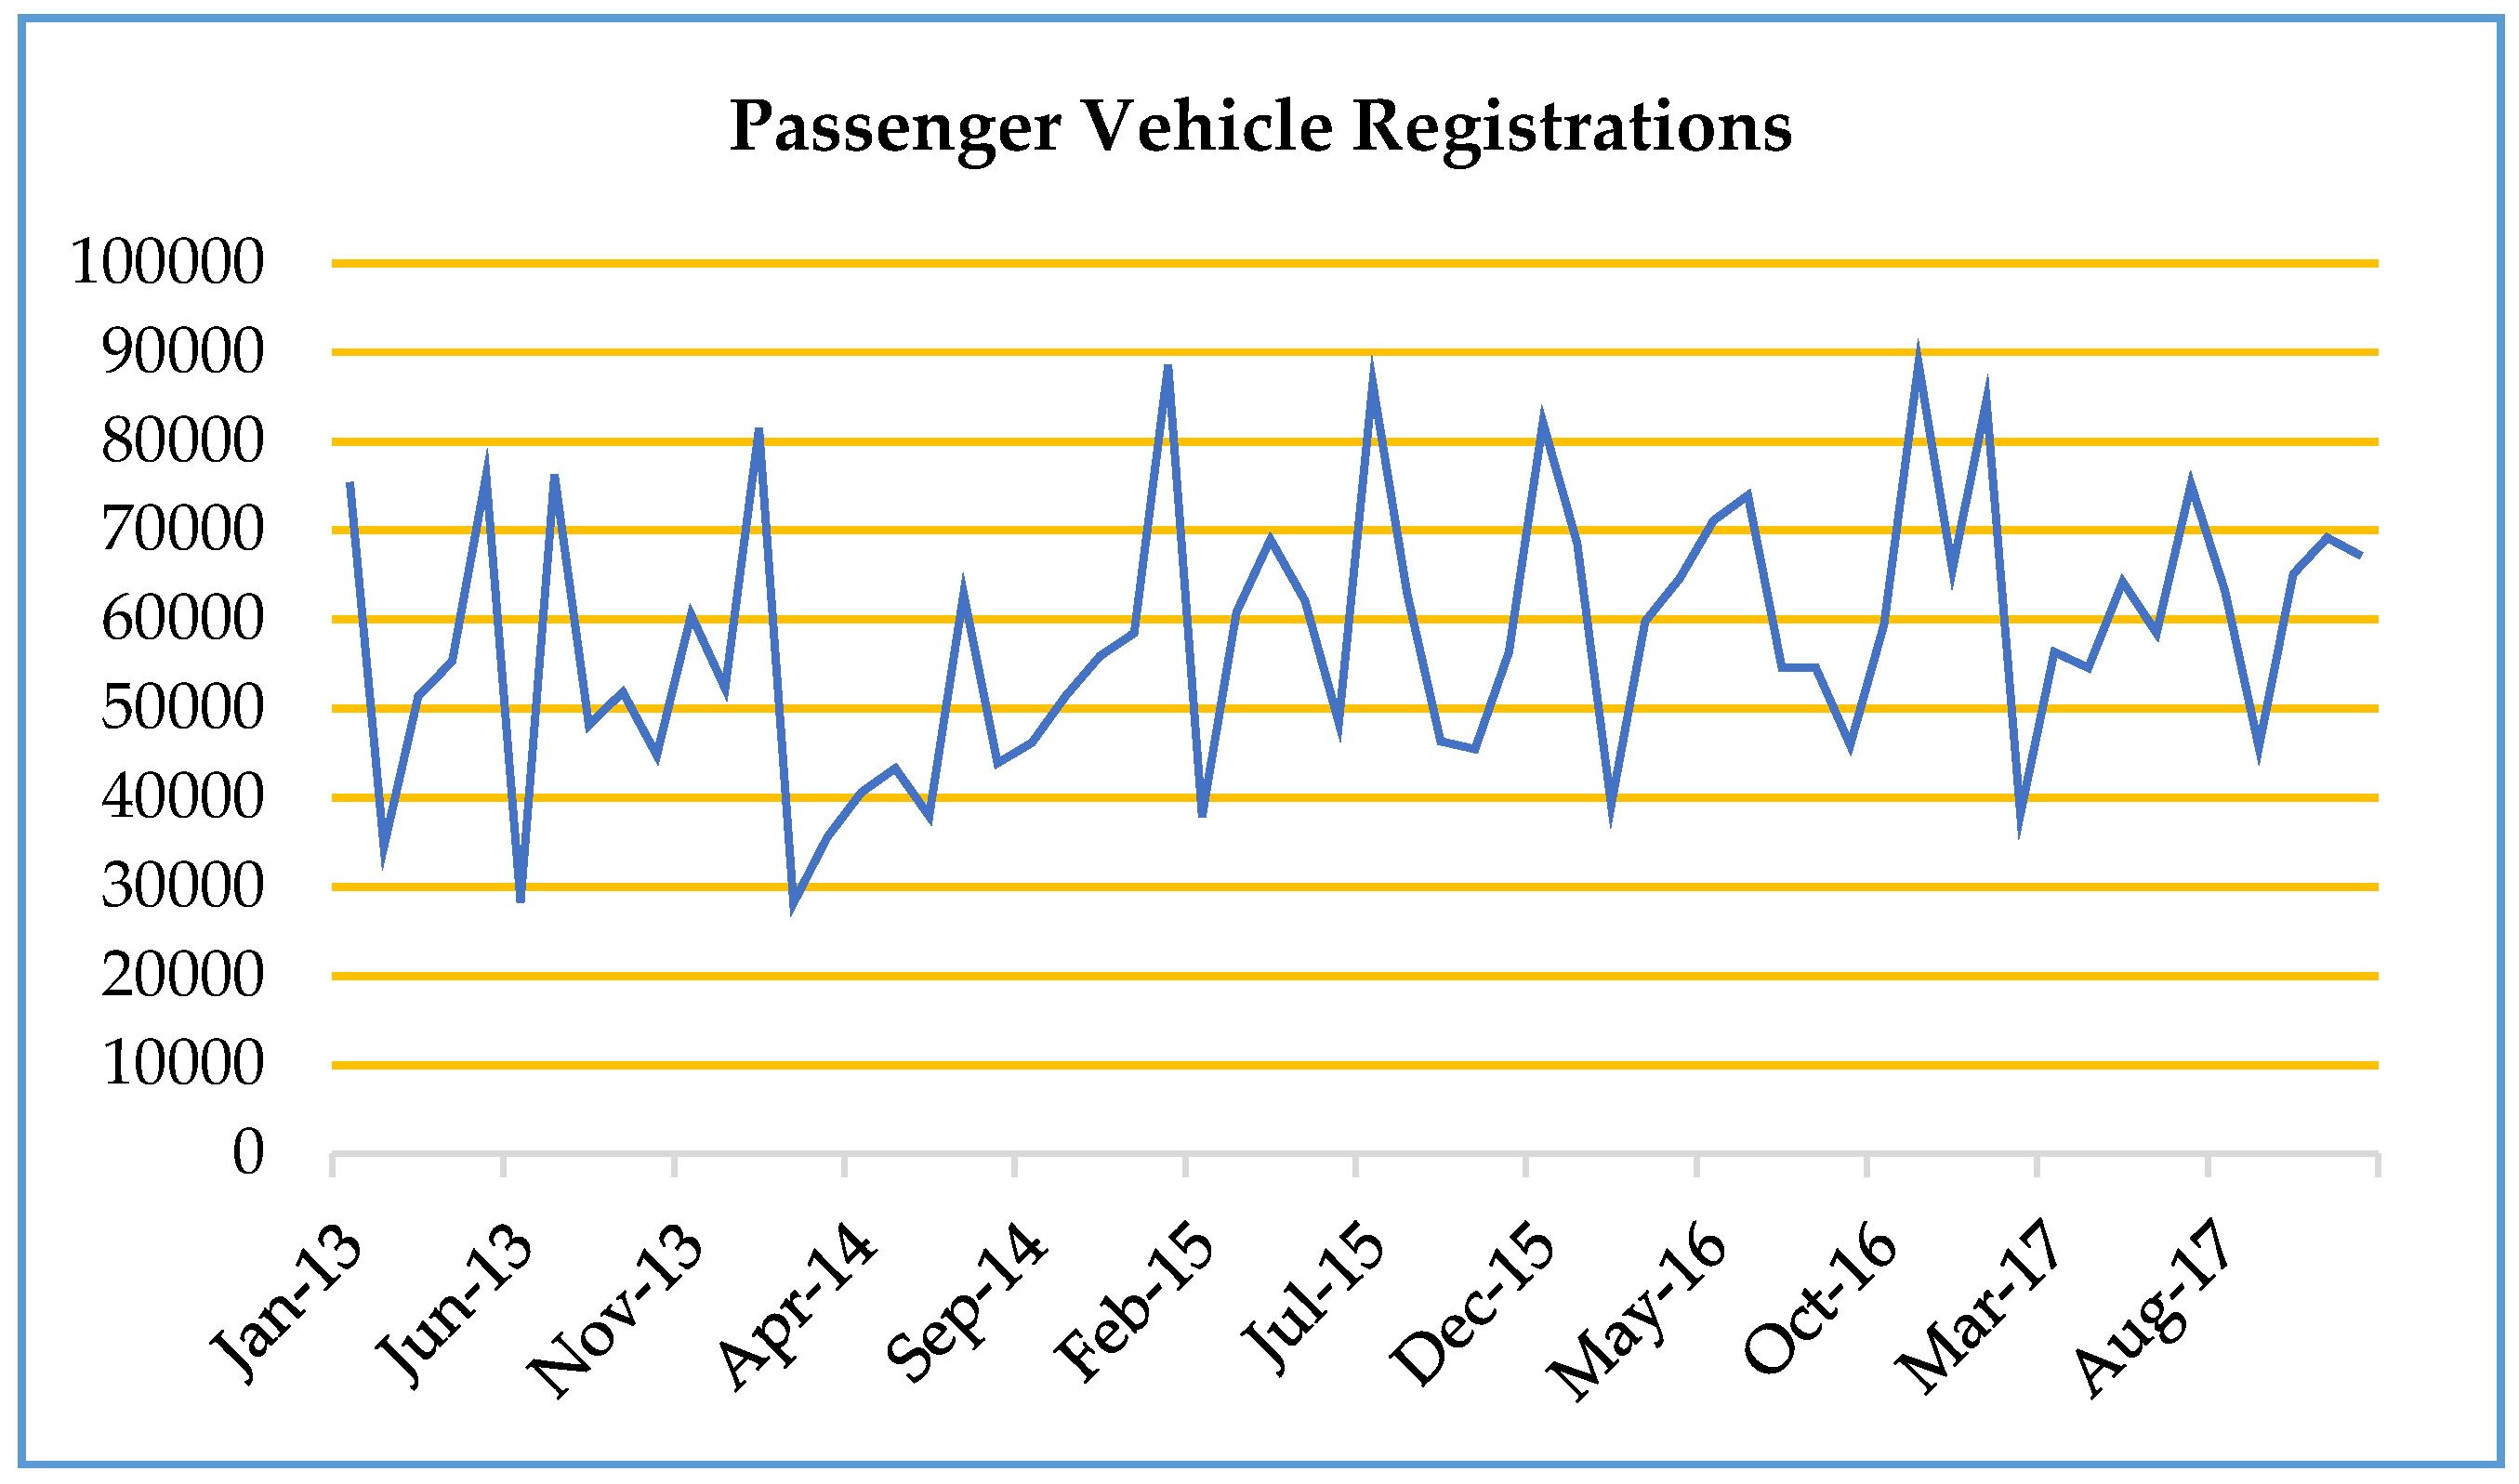
Figure 5, the number of passenger cars registered from 2018 to 2024 with the 5-year monthly vehicle registrations dataset shown between 2013 and 2017 in Turkey is modeled with the SARIMA time series model, which is a Box Jenkins method, and the monthly passenger car registrations are forecasted retrospectively (for the period 2018–2023). An analysis of the monthly passenger vehicle growth in
Figure 5 shows that the series has a stochastic structure. It is possible to say that there is a (seasonal) similarity between the same months of different years in the pattern formed by the dataset. For instance, in Turkey, regardless of the year, vehicle registrations in January and February are generally higher than the monthly average of that year, while this number is lower than the average in February. Seasonal conditions, sales strategies of brands and seasonal price changes may be among the reasons for this. It would be an appropriate approach to evaluate the forecasts for 2018 and beyond within the framework of the SARIMA time series model.
2.2. SARIMA Time Series Model and Basic Principles
The ARIMA (Autoregressive Integrated Moving Average) model, which is a Box-Jenkins method, is the non-stationary version of the ARMA time series model used for stationary series, which consists of AR(p), which examines the relationship between the current value at a time step and its past values, and MA(q), which is formed by the errors of the current value from previous time steps. The term ARIMA model is used for series in which a differencing (integration)-I(d) parameter is used to make a non-stationary series stationary. The SARIMA time series model is a model in which seasonal patterns are included in the ARIMA time series. Here, seasonal pattern means that the behavior of the time series repeats every certain period. The ARIMA model can be expressed in ARIMA (p, d, q) notation and the SARIMA model can be expressed in ARIMA (p, d, q) (P, D, Q) [s] or SARIMA (p, d, q) (P, D, Q)s notation. The general formula of the SARIMA model is shown in Equation (1) [
19]. In this study, R Studio, (v.4.5.1) software and related packages were used for time series analyses [
20].
A detailed explanation of each component in Equation (1) is provided below for clarity.
: Seasonally autoregressive polynomial (includes seasonally autoregressive parameters).
: Autoregressive polynomial (includes autoregressive parameters).
: Back shift operator (for example, Byt = yt − 1Byt = yt − 1).
D: Degree of seasonal differences.
d: Degree of differences (to remove the trend component).
: Observed time series data.
: Seasonal moving average polynomial (includes seasonal moving average parameters).
: Moving average polynomial (includes moving average parameters).
: White noise error term.
2.3. Forecasting 2018–2023 Passenger Car Registrations with SARIMA Model
In order to determine the model parameters for the stochastic dataset, the series should be tested for stationarity to determine whether there is a trend in the increase in passenger cars. When the ADF stationarity test is applied in the R studio programming language to measure the stationarity of the series, the Dickey–Fuller test statistic result is −4.1334 [
21]. The negative value indicates that the series is stationary, but it does not provide evidence that the series is stationary. When testing against the null hypothesis of stationarity of the series in the R studio program, the
p-statistic value, which measures how infrequently an observed test statistic does not occur, is less than 0.01 [
21]. When the alpha level is set at 5%, the
p-value is much lower than the alpha level. Therefore, although the Dickey–Fuller test statistic indicates that the passenger car increase trend is stationary in the 2013–2017 period, the hypothesis is rejected (since the
p-value < 0.01) and it is concluded that the series is non-stationary. Therefore, in the 5-year period between 2013 and 2017, assuming that there are no global and economic reasons that have a negative impact on automobile sales (automobile market dynamics are under normal conditions), it is possible to say that zero-car sales in Turkey have increased every year, albeit at low rates. As a result, the time series in
Figure 5, which shows the monthly passenger car registrations/increase between 2013 and 2017, should be made stationary by assigning an I (integration parameter) parameter. As a result, it would be a correct approach to model the dataset with an ARIMA time series and compare it with the 2018–2023 data, where we have actual passenger car registrations.
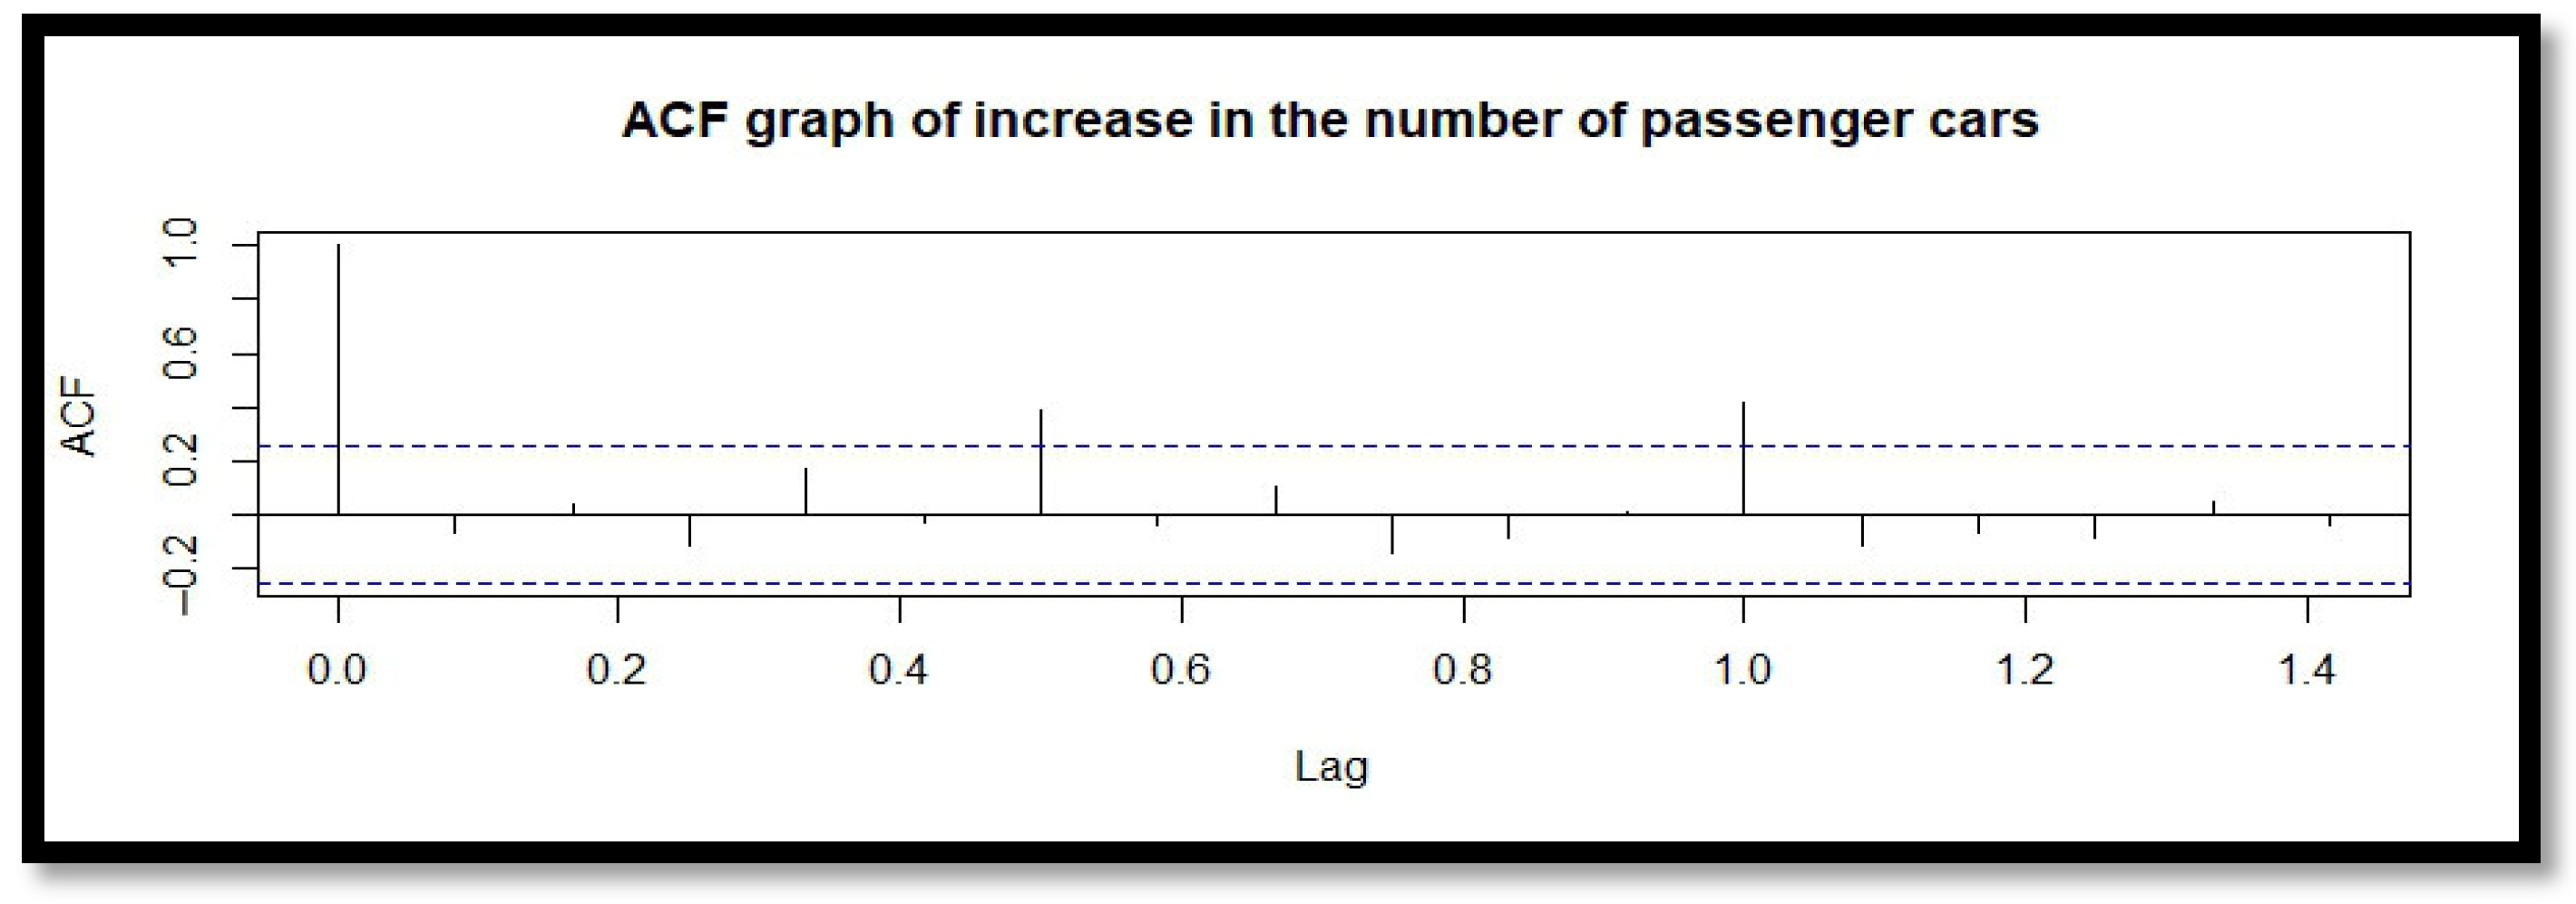
In
Figure 6, the ACF graph showing the autocorrelation coefficients of the time series at different lags in R studio software is examined [
22]. For statistical interpretation, lag 6 and lag 12 being outside the confidence interval are statistically significant. This indicates that the value in a given month is highly correlated with the values 6 or 12 months earlier. These lags are a strong sign of seasonality in the time series. Moreover, the fact that the bars in these lags, except for significant autocorrelations, converge to 0 is a detail indicating that the series is close to stationary. Therefore, we can conclude that automobile sales hover around an average within 6-month or 12-month periods (stationary), but when 6-month or 12-month seasons are evaluated as a whole in this 5-year period, we can interpret that the series contains a trend with partial figures between them.
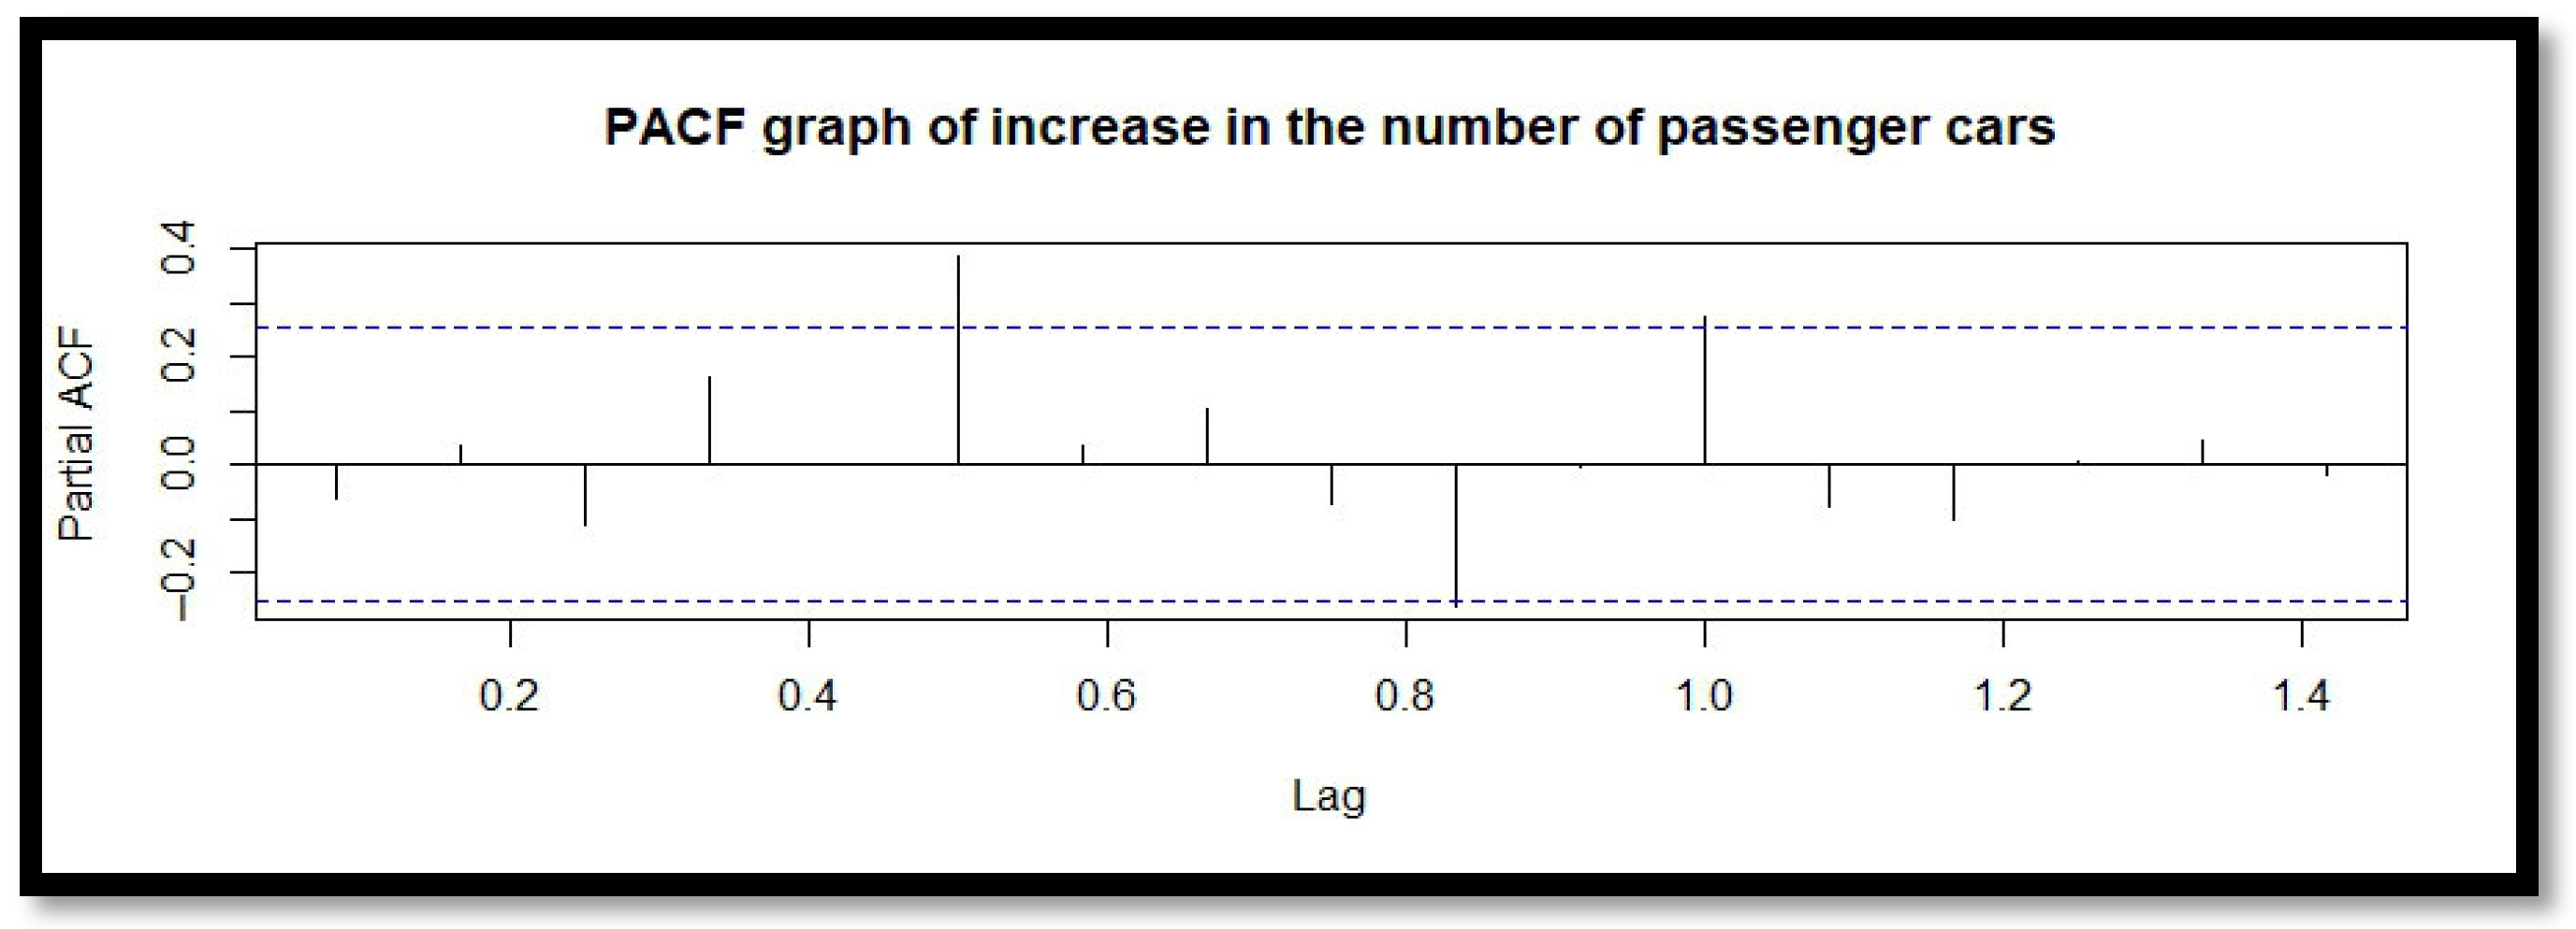
Figure 7 shows the partial autocorrelation plot of the dataset to determine the MA(q) parameter in R studio software [
22]. Here, unlike the ACF plot, the first bar represents lag 1. It is statistically significant that lag 6 and lag 12 exceed 0.2. Therefore, we can say that the dataset contains seasonality in 6 and 12 month periods.
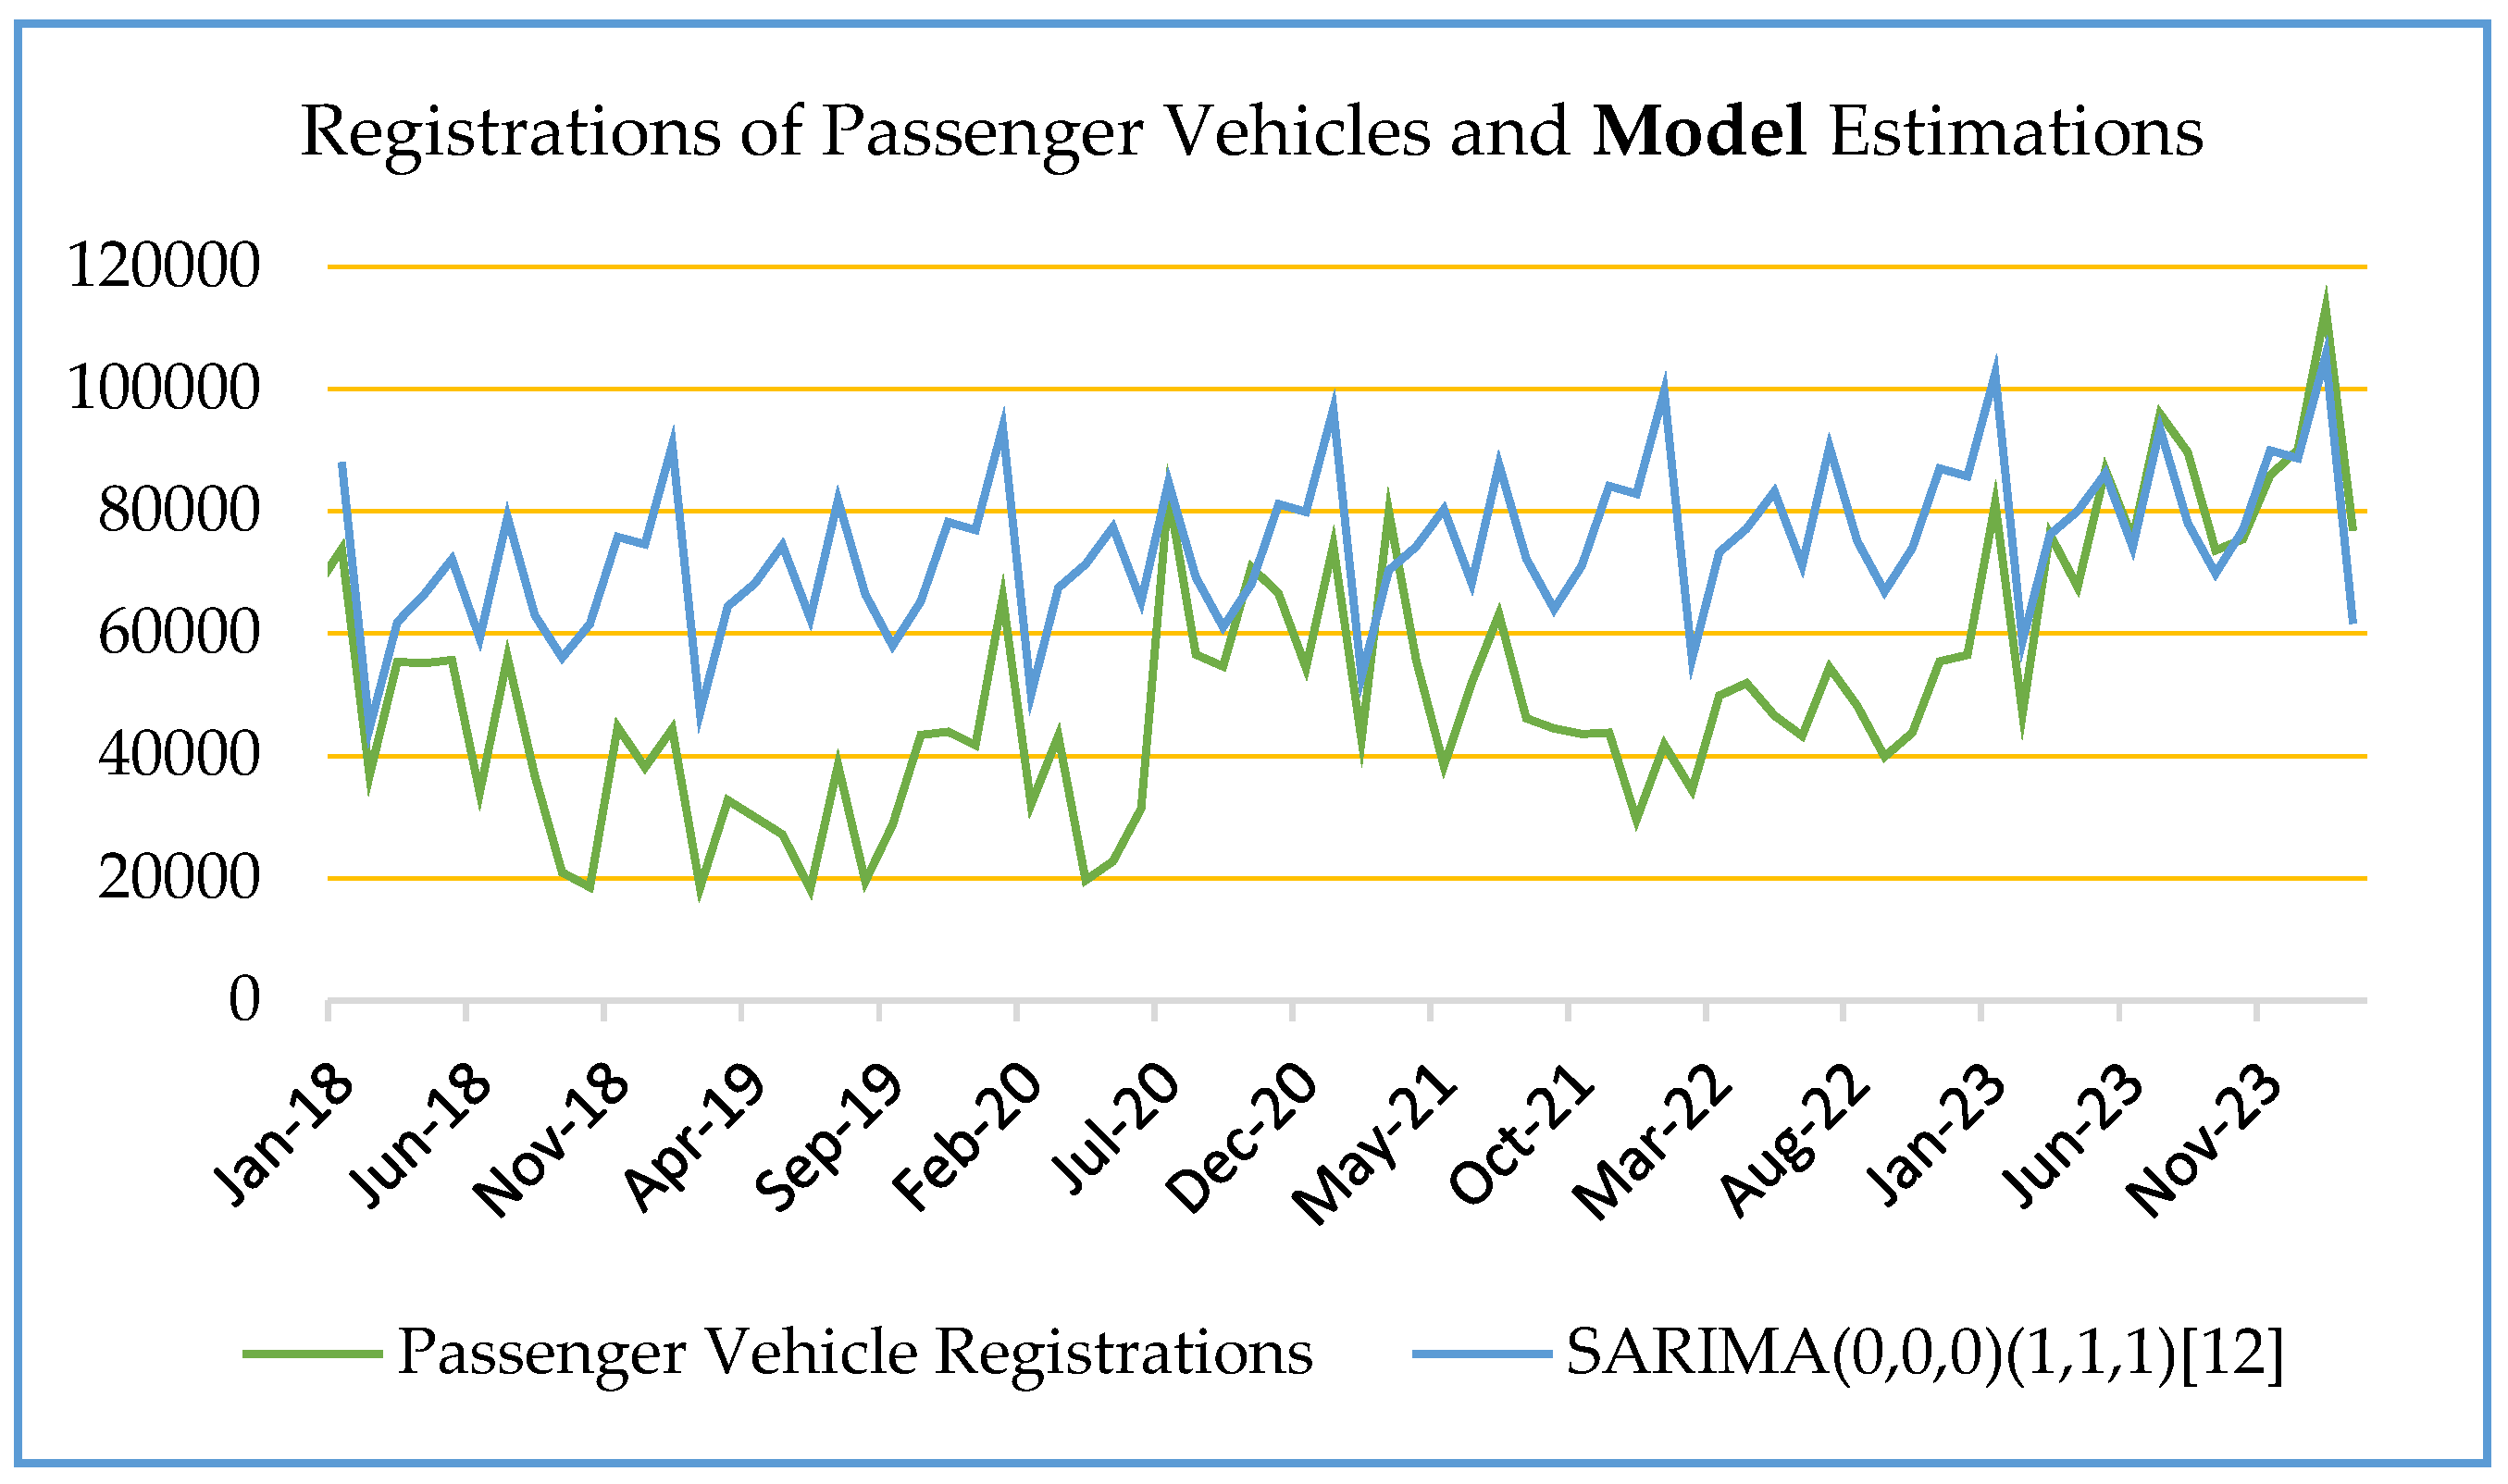
A statistical analysis of the 5-year passenger car registrations on a monthly basis between 2013 and 2017 shows that there is a partial trend in sales in the long run and that the series contains 6 and 12-month seasonality. As a result, with the dataset between 2013 and 2017, the pattern of monthly passenger car growth forecasts from 2018 to the present is shown in
Figure 8 when the approach is built with the SARIMA (0, 0, 0) (1, 1, 1) [12] model [
23,
24].
The SARIMA (0, 0, 0) (1, 1, 1) [12] model is successful in capturing the seasonal components and the trend. The drift coefficient in the model is determined as 243.6230, which indicates that monthly passenger vehicle registrations increase by 243.6230 units on average. The RMSE value of 9346.494 and the MAPE value of 11.53% indicate that the model’s predictions contain a certain margin of error [
23]. However, considering the monthly passenger car increases, we can say that these error rates are acceptable and in line with the nature of the dataset. In
Figure 8, when model forecast values and actual values are compared, we can see the seasonal success of the model when we move the solid line closer to the dashed line. It is also possible to read the impact of negative conditions between 2018 and 2023 from the areas between the patterns. In 2023, the closeness of the model forecast values to the actual values is significant. As of 2023, it is possible to say that the problems affecting zero-car sales in the previous 5-year period have decreased significantly. For example, chip supply problems have largely disappeared, and the pandemic process has ended. Regulatory policies have been implemented in the Turkish economy, and severe exchange rate fluctuations have been prevented. This is another result that shows that the model, which has a margin of error of 11.53% in its forecasts, is successful. After the first quarter of 2023, the similarity between actual passenger car registrations and the model forecast values signals a normalization in the automobile market as of 2023. Therefore, we can interpret that automobile sales return to their 2017 norms in 2024 and beyond.
Table 1 shows model forecast values and actual values.
2.4. Dataset First Preprocessing: 2019–2022 Electric and Hybrid Vehicle Growth
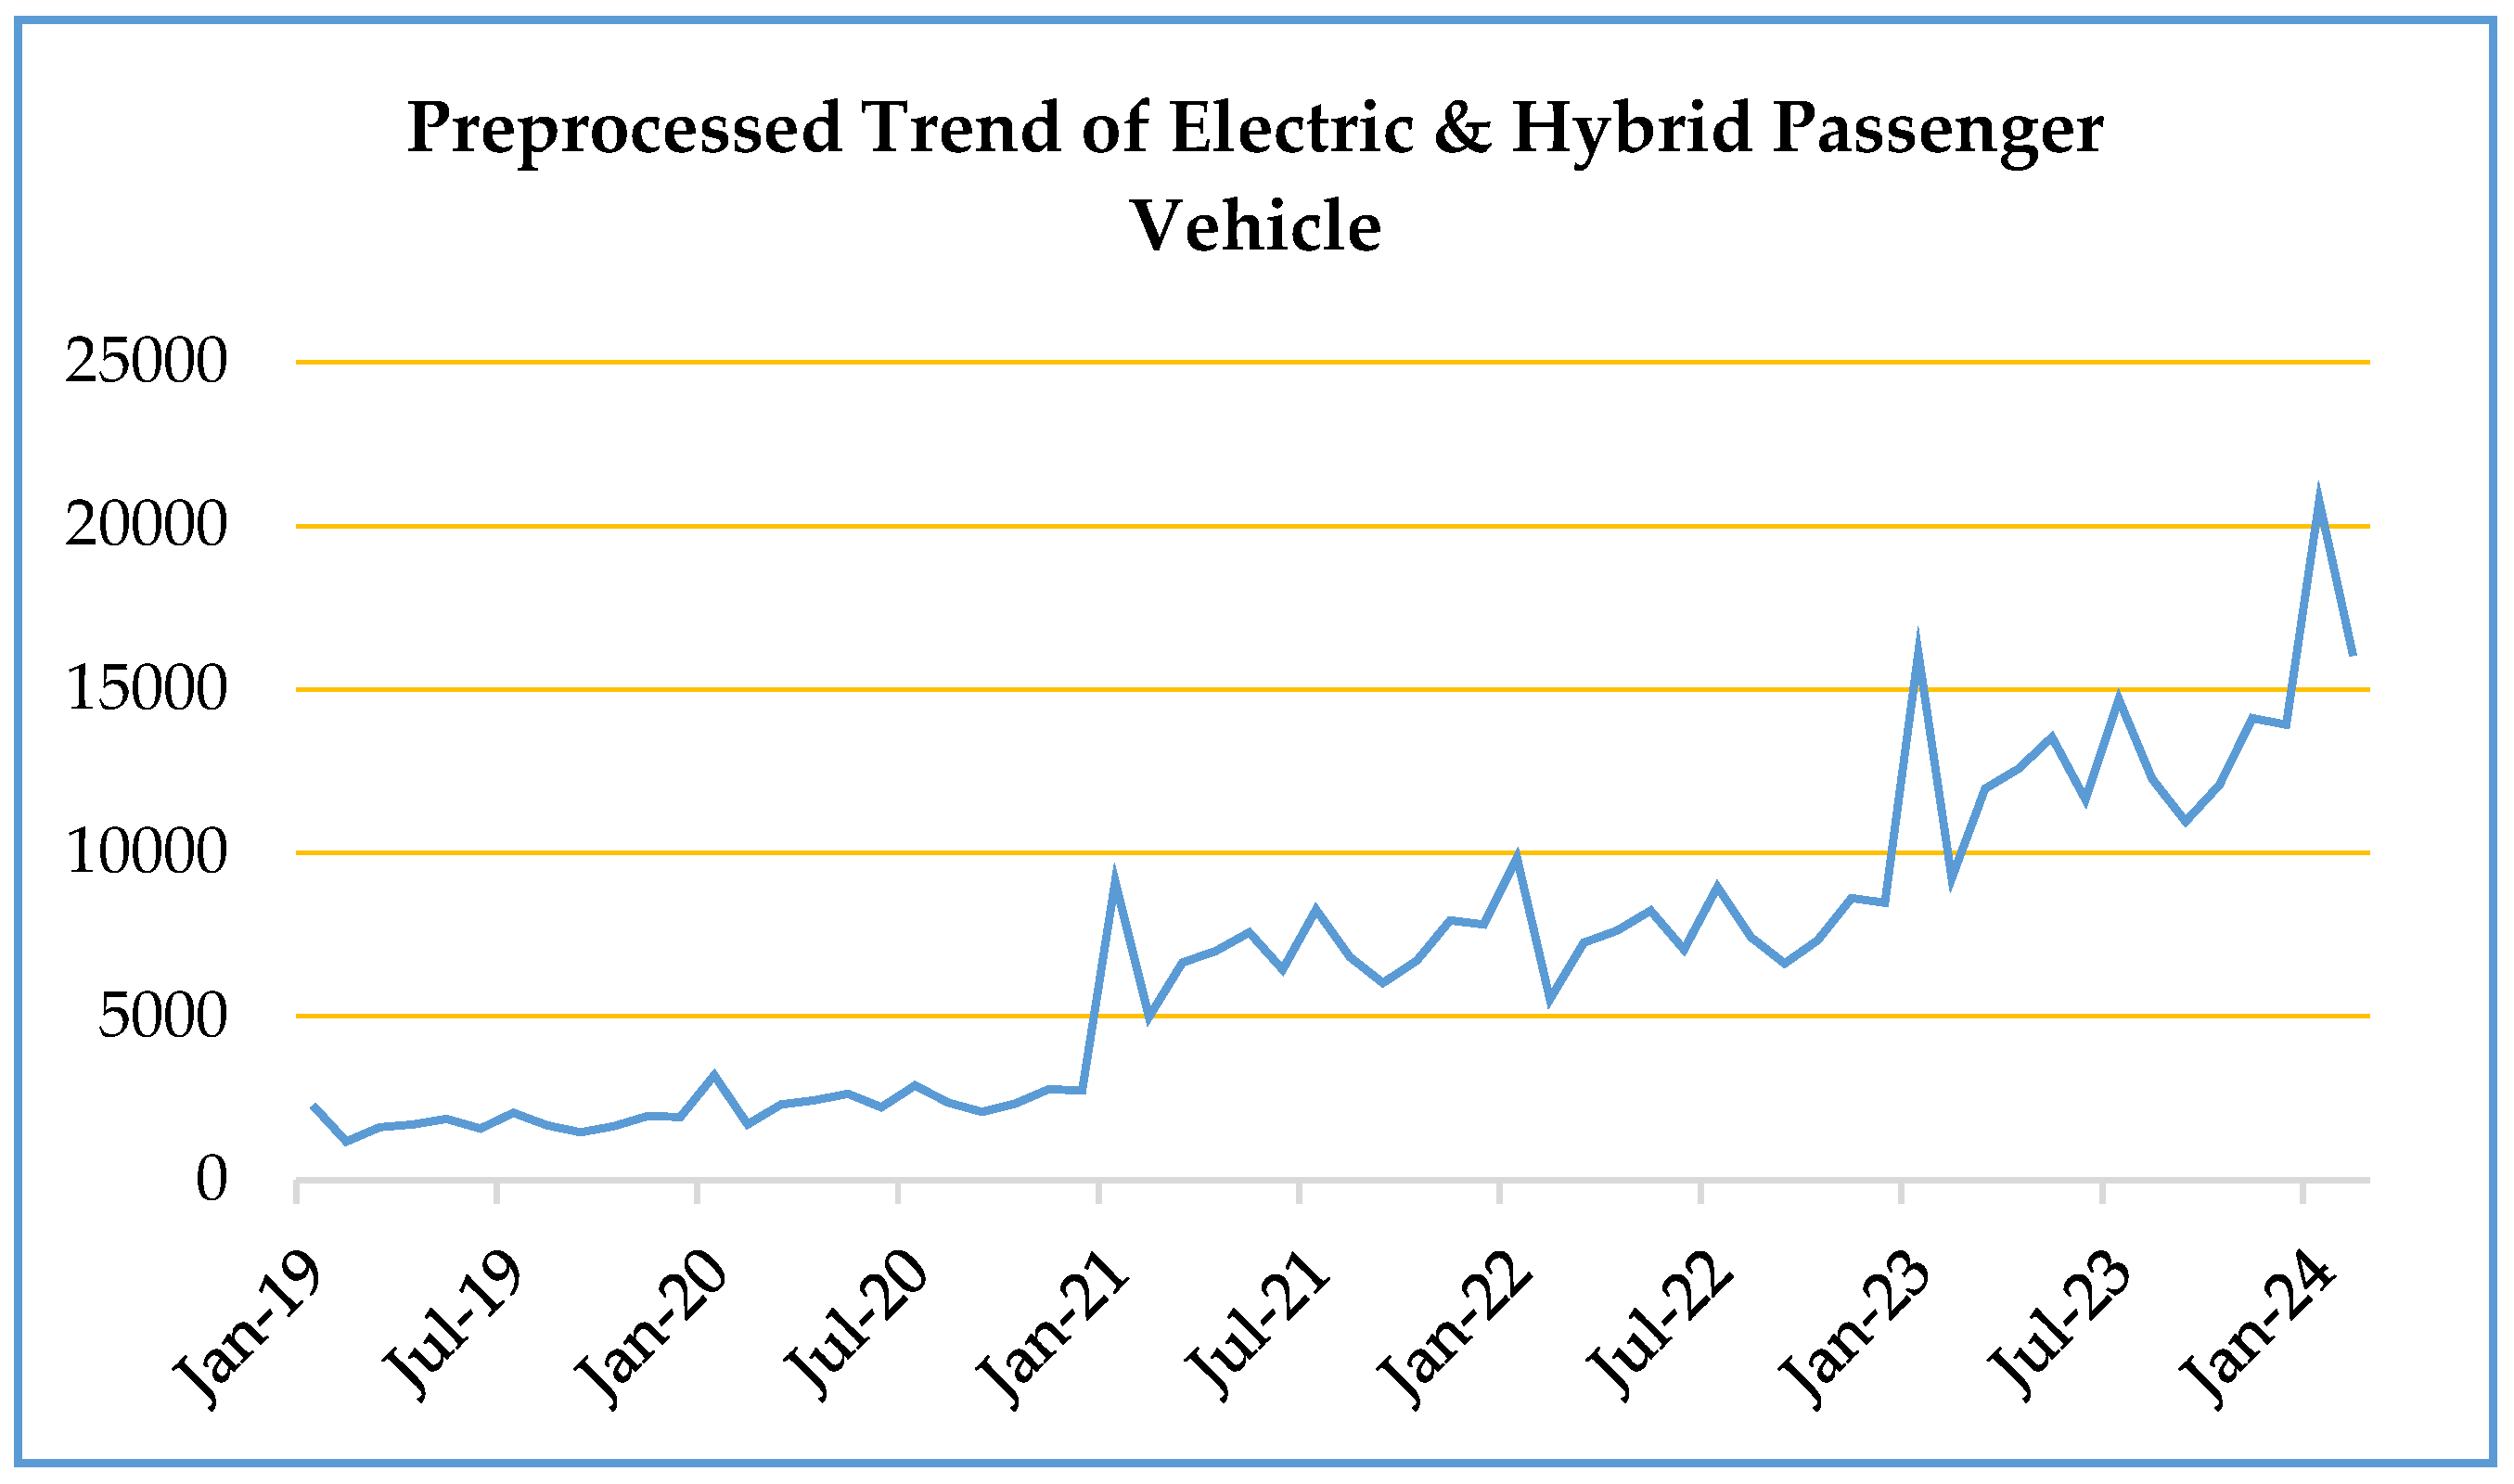
The number of electric and hybrid passenger cars is adjusted using the data in
Table 1. Since 2023 is considered the start year of normalization in the study, the actual increase in the number of electric vehicles is used for this year. As a data adjustment technique, the coefficient series obtained by dividing the series in the Seasonal ARIMA model results by the actual passenger vehicle series in each month is multiplied by the electric vehicle series in the available time periods through a customized method shown in Equation (2). Thus, the number of electric vehicles is relatively free of negative effects between 2019 and 2022.
: First preprocessed dataset series,
: Electric vehicle series,
: Passenger Car Model Series,
: Passenger Car Reel Registrations.
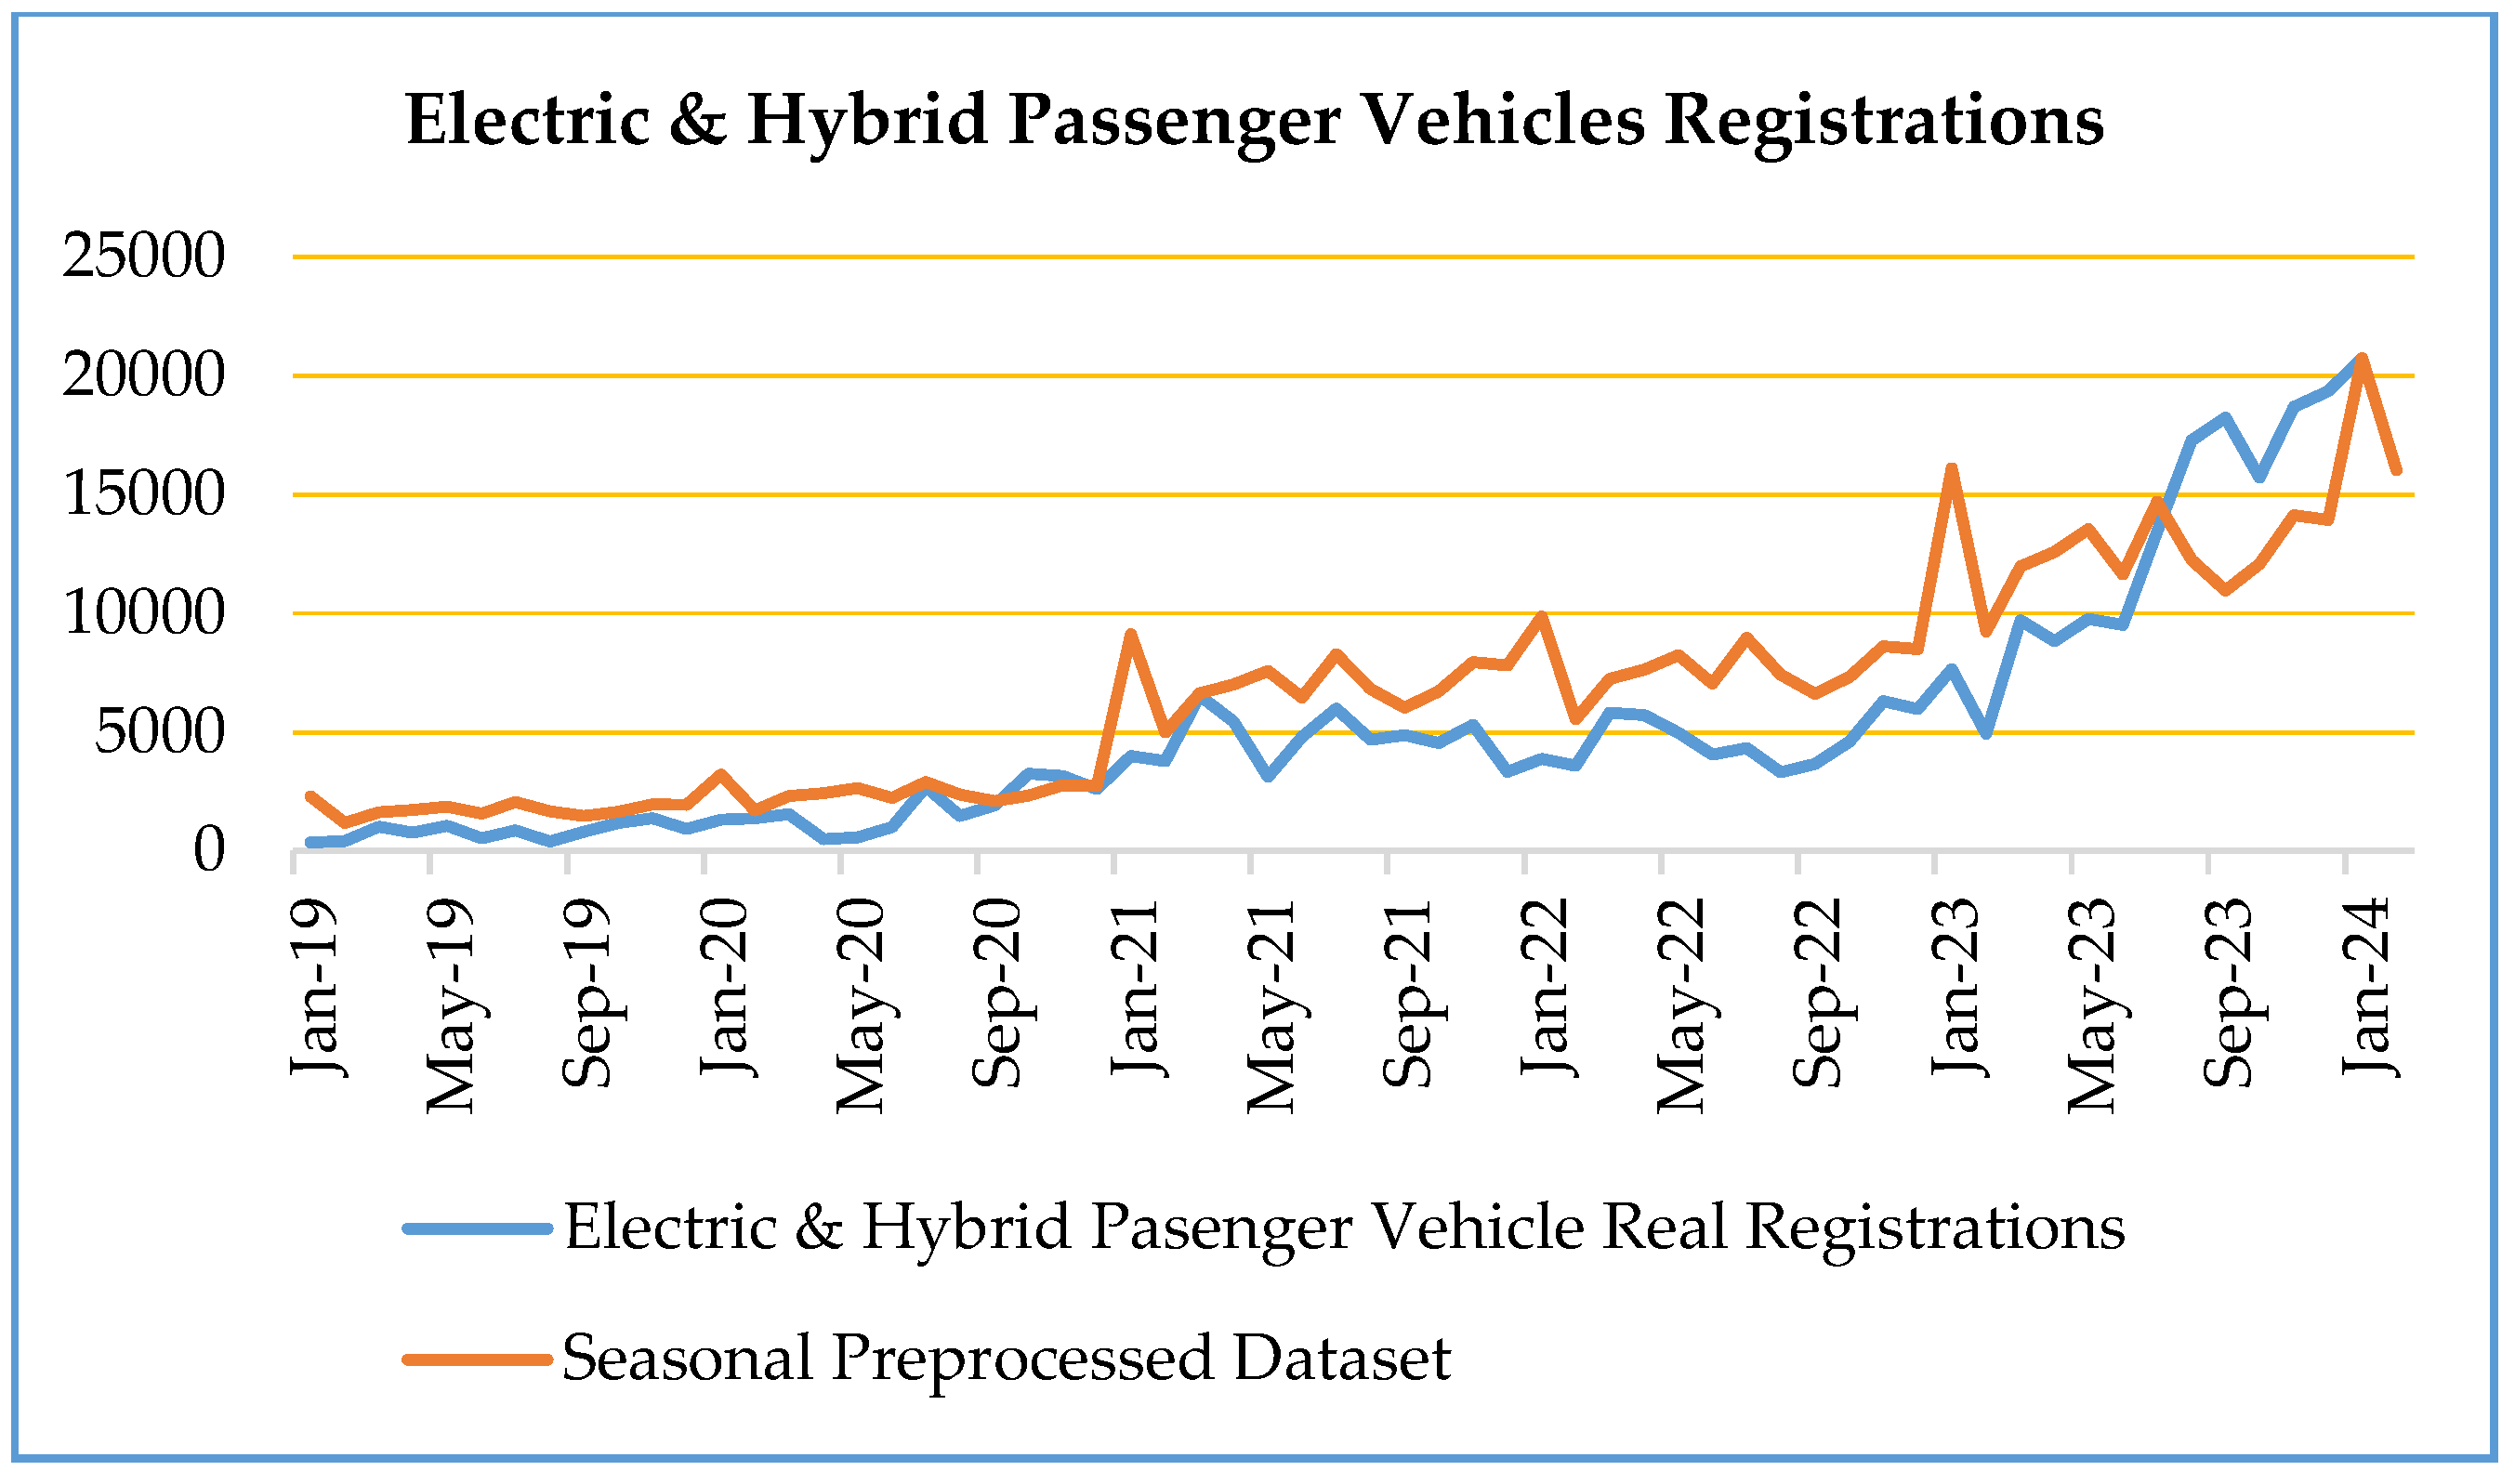
Figure 9 shows the number of actual and regulated EV registrations in 2019–2022. The negative effects in this period may also have resulted from policymakers not providing enough incentives for electrification. For these reasons, it is possible to say that the number of regulated EVs is lower than it should be. Nevertheless, preprocessing the current number of electric vehicles by removing the negative effect with coefficients will provide more accurate predictions for the future.
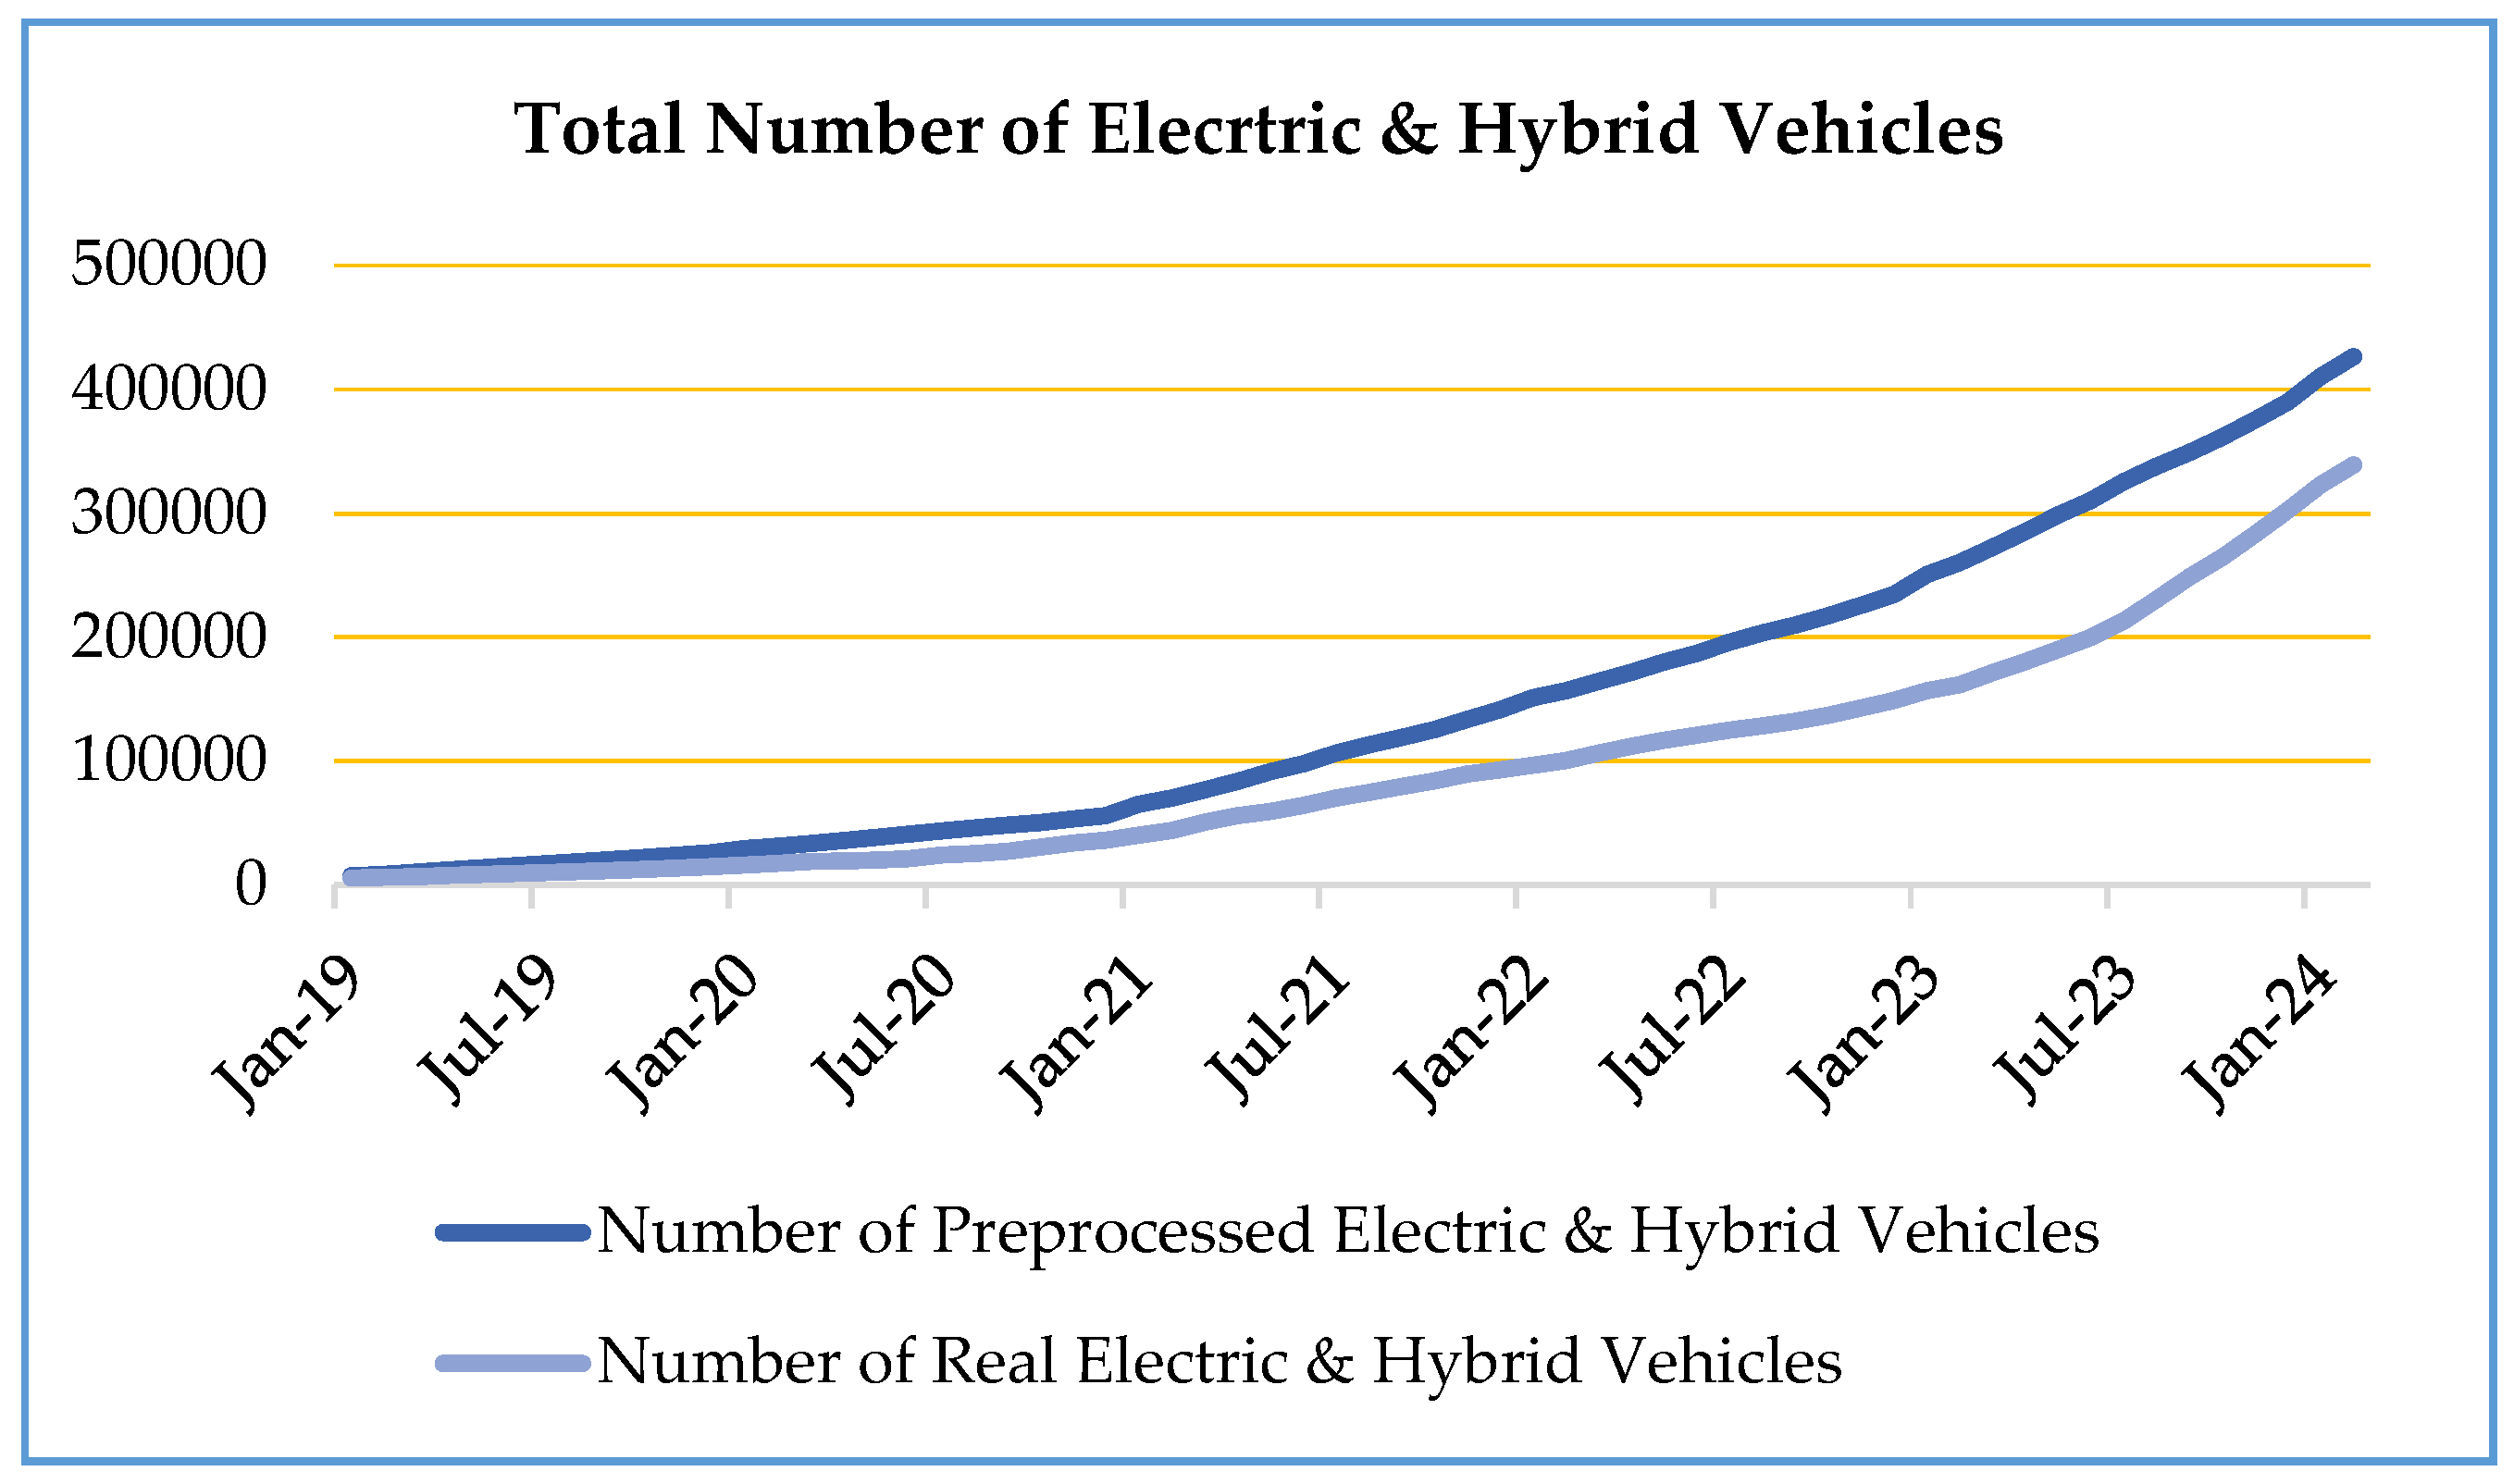
When comparing the total adjusted dataset of electric-hybrid vehicle numbers with the actual figure in
Figure 10 as of January 2024, the difference is 87,314 electric and hybrid vehicles. If the negative conditions mentioned in previous sections of this study had not occurred, we could say that the potential number of vehicles drawing electricity from charging stations might have reached a minimum of 426,471. Although the gap seems small, the result obtained from the adjusted data is approximately 26% higher than the actual number of electric-hybrid vehicles. This percentage difference will positively influence the forecasts for 2030.
Table 2 presents a comparison of the actual number of electric vehicles registered in traffic for the years 2019, 2020, 2021, and 2022, along with the adjusted number of electric vehicles using the SARIMA model.
2.5. Second Preprocessing: Forecast of Seasonal Trends and Increase in Electric and Hybrid Vehicles
In Turkey, the demand for electric and hybrid vehicles has gained momentum over time compared to previous periods. As a result, the 12-month seasonality observed in the increase in passenger vehicles has not yet created a specific seasonal pattern in the electric-hybrid vehicle trend. However, by referencing the 12-month seasonal behavior of passenger vehicle increases, we can forecast that the recent trend in electric vehicles will eventually adapt to the unique dynamics of car sales and exhibit seasonal behavior.
Without changing the total number of preprocessed electric vehicles per year, the number of passenger cars modeled with SARIMA is used and a series of coefficients are assigned to the months in the year to which it belongs in Equation (3). These coefficients are multiplied by the total number of first preprocessed electric vehicles (Equation (2)) in the same year in Equation (4), and seasonality is added to the adjusted electric vehicle increases dataset with a second adjustment in Equation (5).
: First preprocessed dataset series,
: Seasonal preprocessed dataset series,
: Month coefficient series,
: Electric vehicle series,
: Passenger Car Model Series,
: Passenger Car Registrations
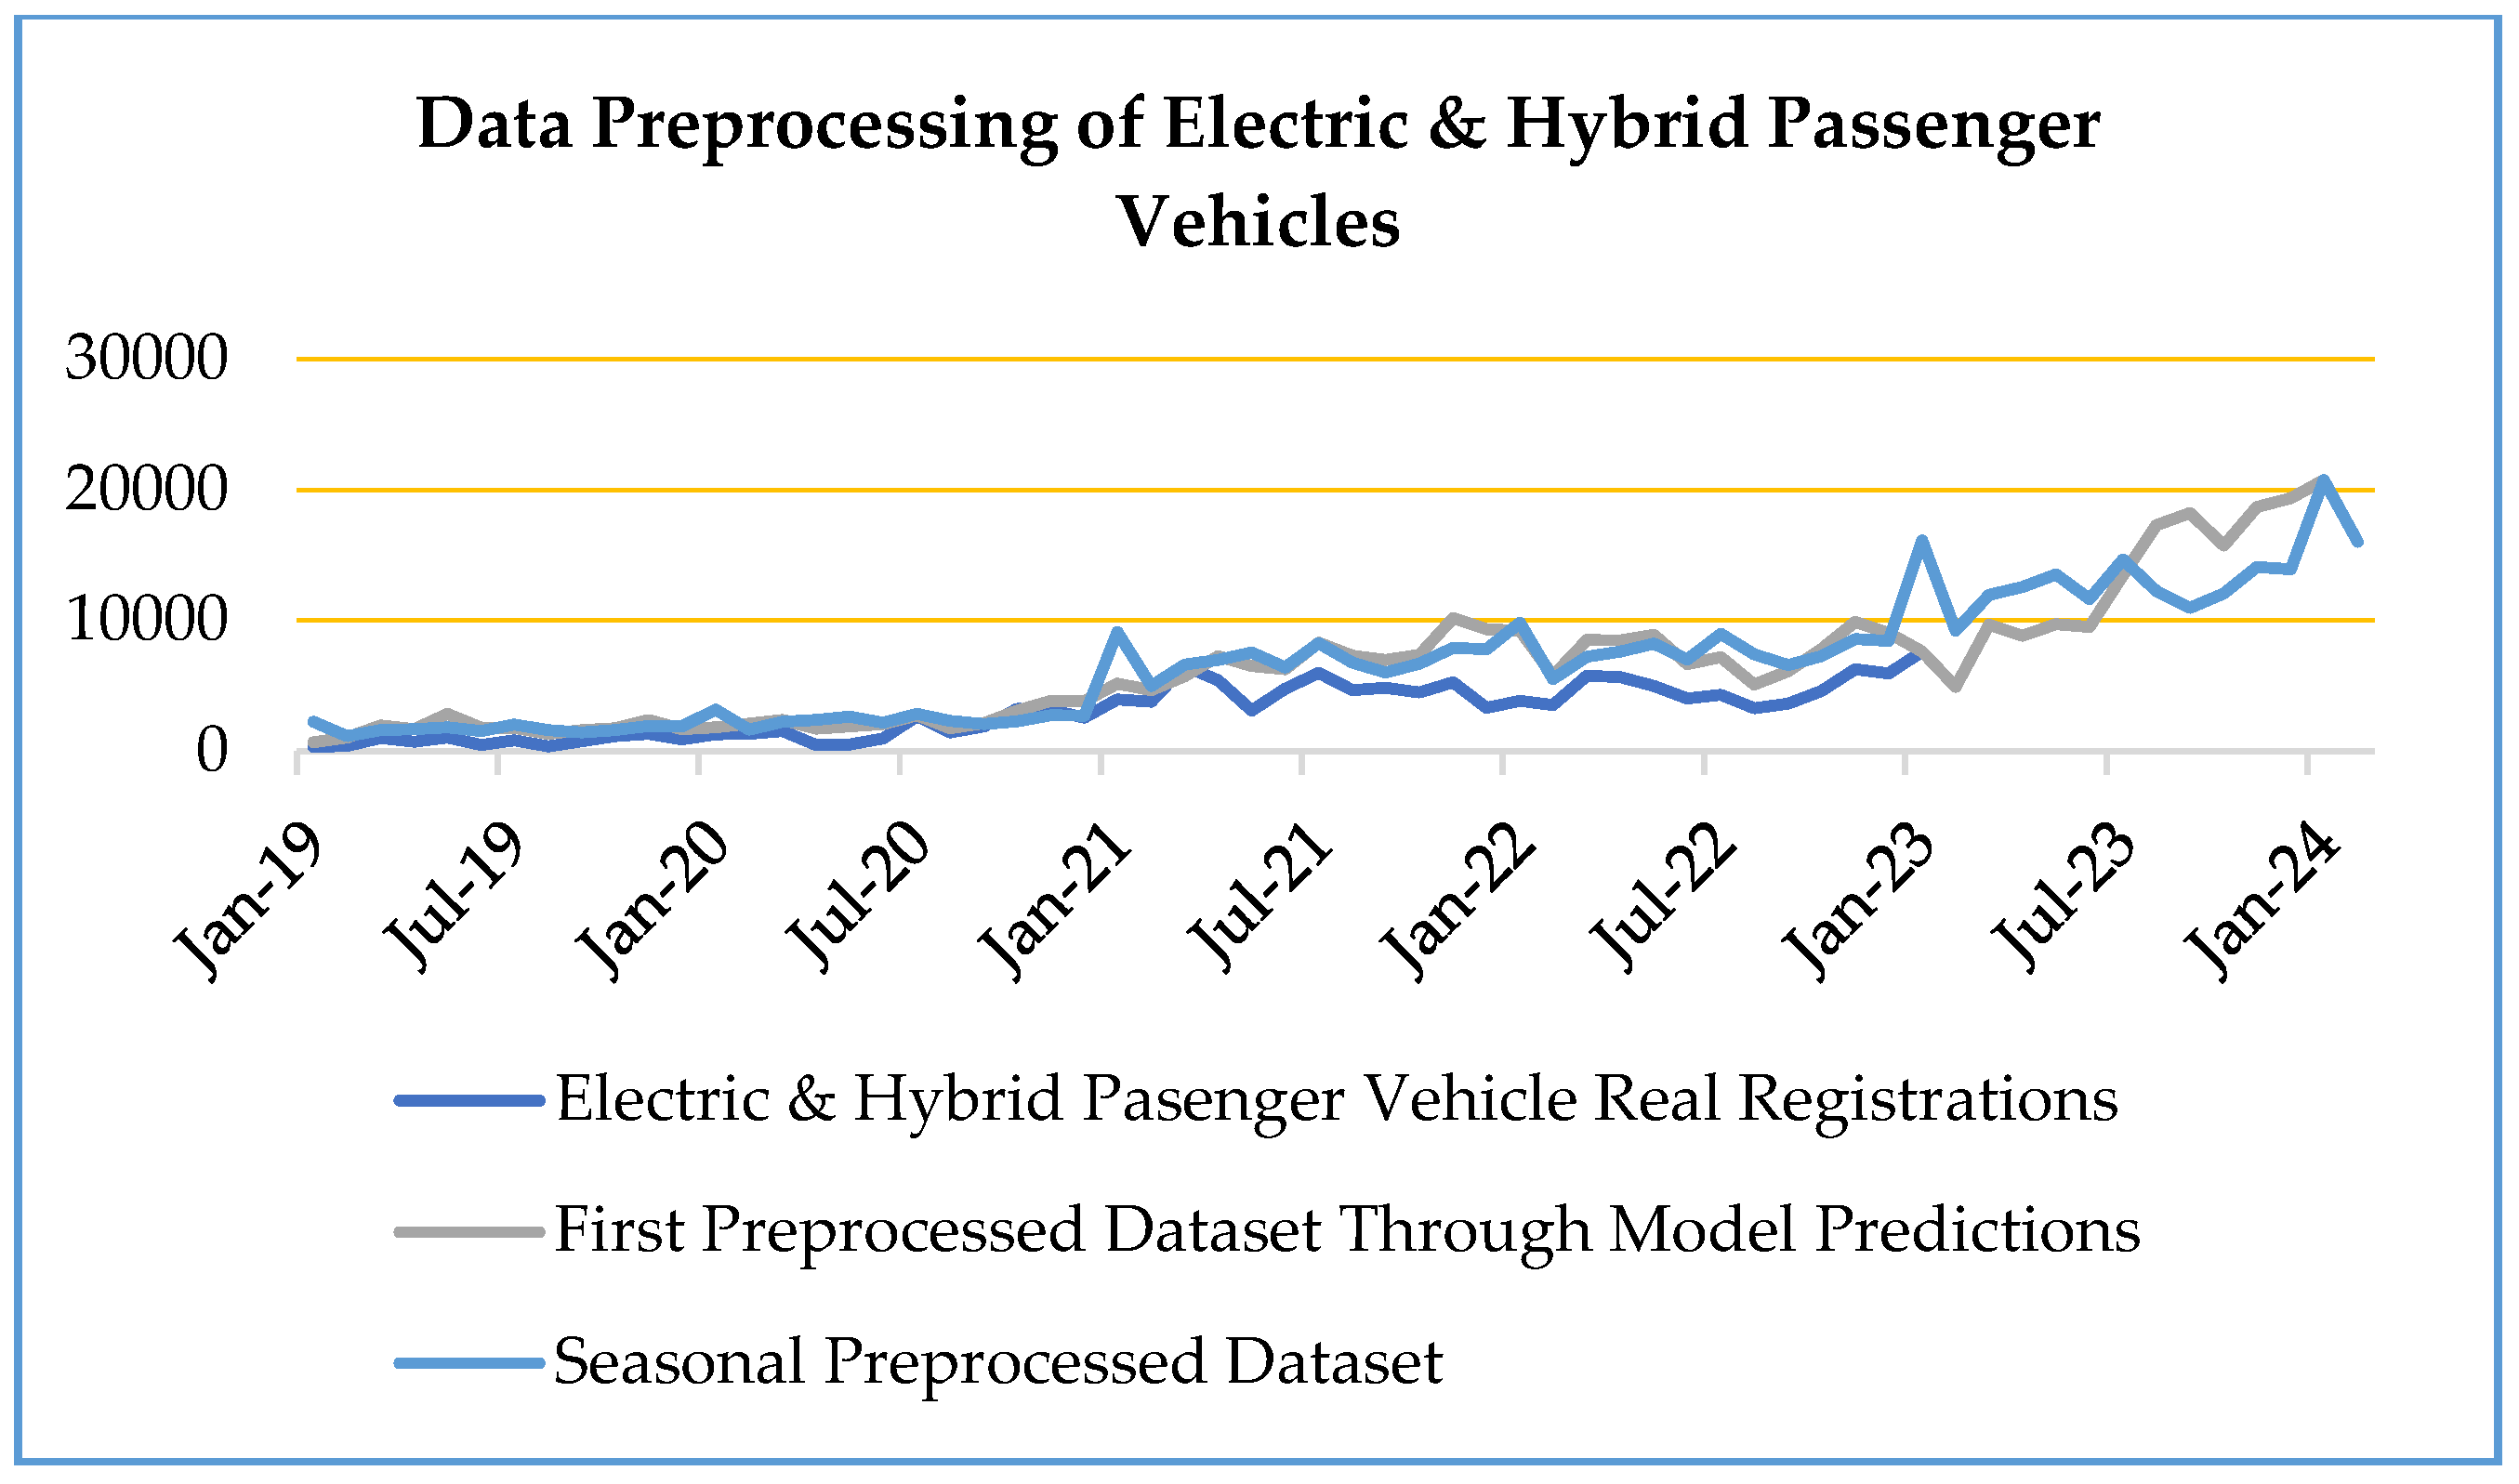
As a result of the data preprocessing applications,
Figure 11 shows the monthly increase in existing electric vehicles and the seasonal preprocessed increase in electric vehicles for the period between 2019 and 2023. Additionally,
Table 3 presents the previously mentioned data along with the coefficients assigned to the months.
3. SARIMA Modeling and Projected Number of Electric and Hybrid Vehicles Towards 2030
Accurately forecasting the future of electric and hybrid passenger vehicles in Turkey is crucial for providing policymakers with reliable insights. These forecasts will allow us to estimate the potential load that electric vehicles may place on urban electrical grids. Therefore, the projections we create are important for taking early precautions and contributing to infrastructure planning. The SARIMA model is particularly suitable for time series data that exhibit both trend and seasonality. Considering the monthly nature of EV registration data in Turkey and the presence of clear seasonal patterns, SARIMA offers a robust and interpretable forecasting approach. Moreover, the relatively short length of the available dataset makes traditional statistical models more appropriate than data-hungry machine learning alternatives. The SARIMA model is particularly suitable for time series data that exhibit both trend and seasonality. Considering the monthly nature of EV registration data in Turkey and the presence of clear seasonal patterns, SARIMA offers a robust and interpretable forecasting approach.
Alternative models such as Prophet and LSTM were also tested during the model selection phase. However, SARIMA demonstrated superior forecasting accuracy given the dataset’s strong seasonality and limited length and was therefore chosen as the final model.
3.1. Data Source
The number of charging stations in Turkey, their distribution across regions, the development of battery technologies, consumers’ habits with traditional fuel vehicles, and incentives from policymakers directly affect the increase in electric vehicles. This study aims to model the monthly increase in the number of electric vehicles to forecast the trend and project the scenario for 2030. The monthly increase data from 2019 to 2023 may not be sufficient to create a reliable time series model because the momentum of electric vehicles is variable, which broadens the predictability range. Therefore, to make predictions towards 2030, the preprocessed increase in the number of electric vehicles described in the second section of the paper is used as the data source. In
Figure 12, the dataset obtained as a result of data preprocessing, which we will use for forecasting, is presented. This preprocessing will help establish a more accurate model. However, potential incentives and events, such as a new model release by TOGG, could affect electric vehicle sales and disrupt the seasonal pattern. Therefore, it is important to note that the SARIMA model, which will be used a second time to forecast the increase in electric and hybrid vehicles towards 2030, is established within certain limitations.
3.2. Application of the SARIMA Model to Adjusted Increases in Electric and Hybrid Vehicle Numbers
The first correction added seasonality to the dataset of the actual increase in electric and hybrid passenger vehicles after strengthening the data. This seasonality was applied based on the pattern observed in passenger vehicle increases, as discussed in
Section 2 of the study. Therefore, when applying the SARIMA model to the adjusted dataset in R Studio, the seasonal parameter sss in the SARIMA (p, d, q) (P, D, Q) [s] notation was again chosen as 12.
Figure 13 shows the actual and adjusted monthly increase figures. It can be observed that the actual dataset has a variance that changes over time; however, after preprocessing, the effect of variable variance was reduced, making it suitable for series modeling.
To apply the SARIMA model, the series containing a trend must be made stationary. Therefore, the integration parameter values (d and D) in the non-seasonal (p, d, q) and seasonal (P, D, Q) components of the notation were chosen as 1 by taking first differences in the series. When examining the autocorrelations of the preprocessed series, since both non-seasonal and seasonal components are statistically related to their previous lags, the parameters p and P were chosen as 1. If preprocessing had not been applied to the dataset, the parameter p could have been 1, and P could have been 0, as the actual sales value of electric and hybrid vehicles in any given month showed correlation with the previous month’s sales value in many time waves. However, in the adjusted series, due to the increasing momentum of electric vehicles over time and the absence of seasonality, there would be no relationship between the value in any month and the value 12 months earlier, which would result in P being 0.
To determine the moving average (MA(q) and MA(Q)) parameters in the SARIMA model, after achieving stationarity in the adjusted series, no statistical significance was seen in the partial autocorrelations, so the values for q and Q were chosen as 0.
In conclusion, if the increases in the number of electric and hybrid vehicles had been modeled without correction, only an AR (1) model could have been established, or different time series models could have been tested. Due to the high variance, the dataset series would still need to be adjusted even in the AR (1) model. Therefore, adjusting the monthly increase in electric and hybrid vehicles is essential for better forecasts. In summary, using the adjusted data to establish the SARIMA (1, 1, 0) (1, 1, 0) [12] model will provide significant insights for the transition to electric vehicles, including charging infrastructure and operational planning.
3.3. Model Forecast Results and Analysis of Electric-Hybrid Vehicle Numbers in Turkey Towards 2030
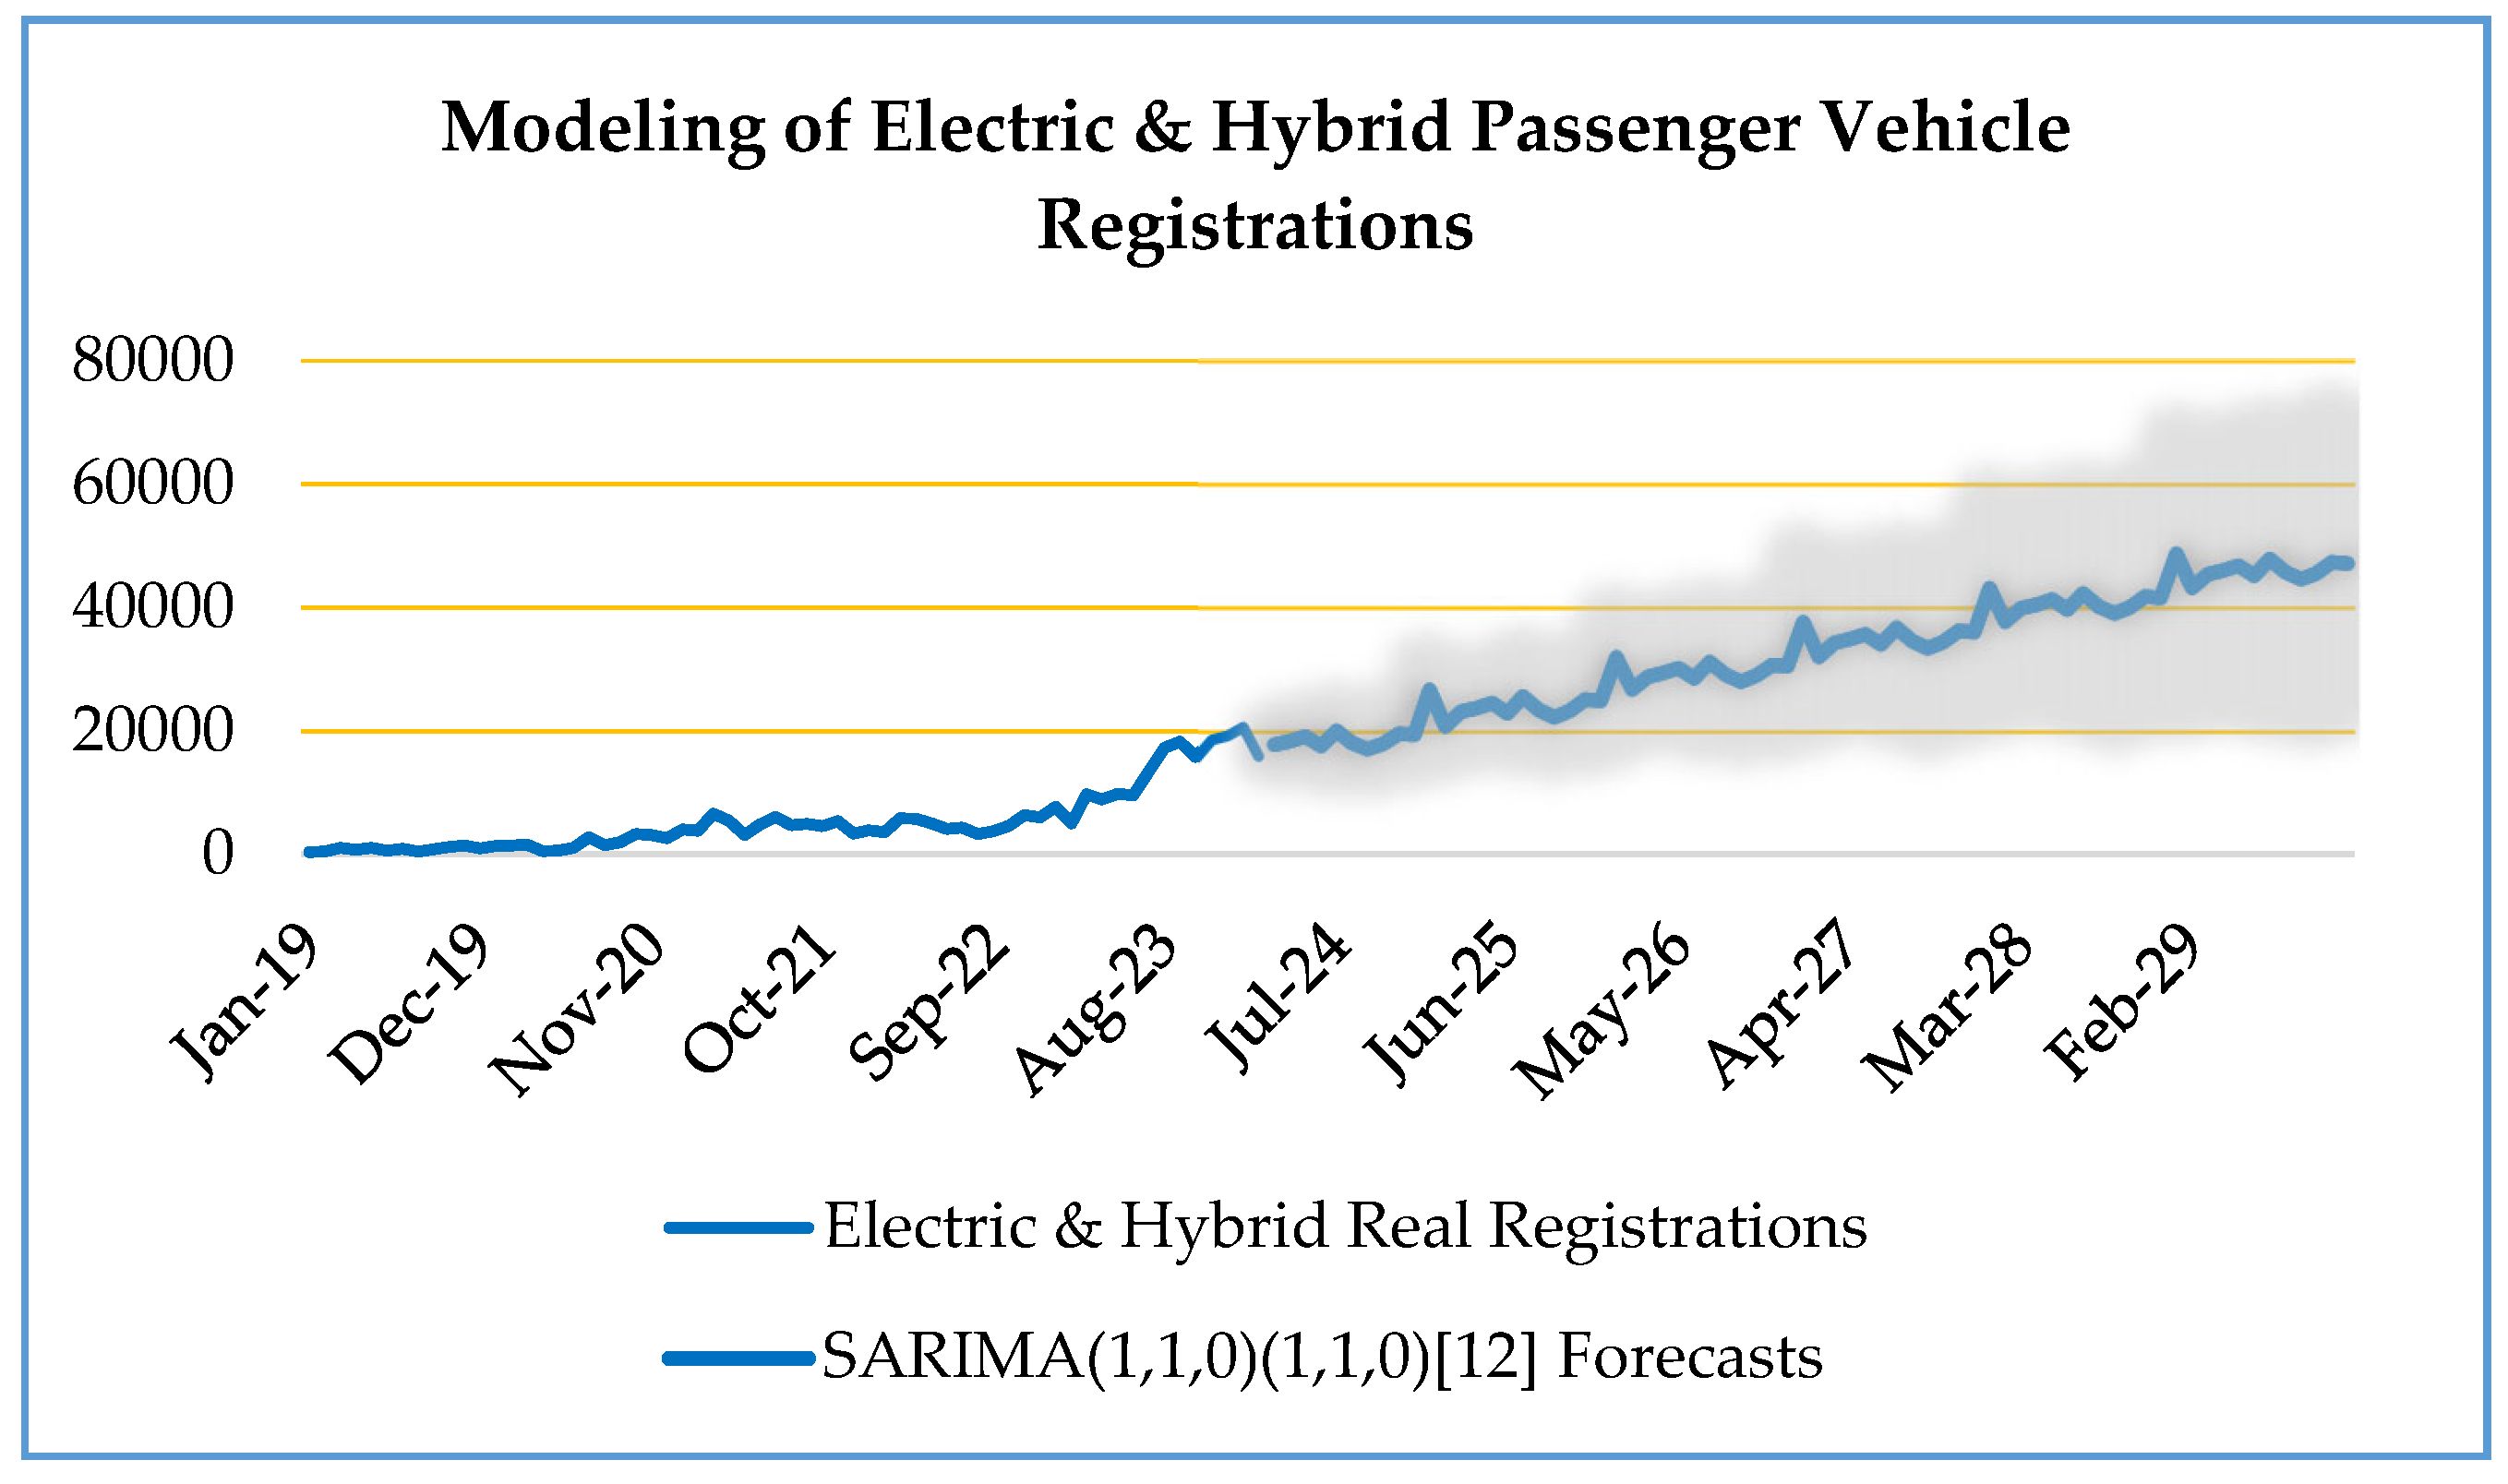
The forecast results for the increase in electric and hybrid vehicles towards 2030 using the SARIMA (1, 1, 0) (1, 1, 0) [12] model are shown in
Figure 14, including the lower and upper bounds of the 80% confidence interval. The coefficients of the model created using R Studio were determined as ar1 = −0.3769 and sar1 = −0.5695 [
23]. These values indicate a negative effect from the past data of the time series. The standard errors of the coefficients are 0.1349 and 0.1089, respectively, indicating that the coefficients are reliable. The model’s performance on the training set was measured with an MAE (mean absolute error) of 543.7 and an MAPE (mean absolute percentage error) of 6.48. These measurements suggest that the predictions for the increase in electric and hybrid vehicles could be off by approximately 543.7 units, with an error margin of about 6.48%.
According to the model’s forecast results, by 2030, the monthly sales of electric vehicles in Turkey are expected to exceed an average of 50,000, with a low scenario of 25,000 and a high scenario of 70,000.
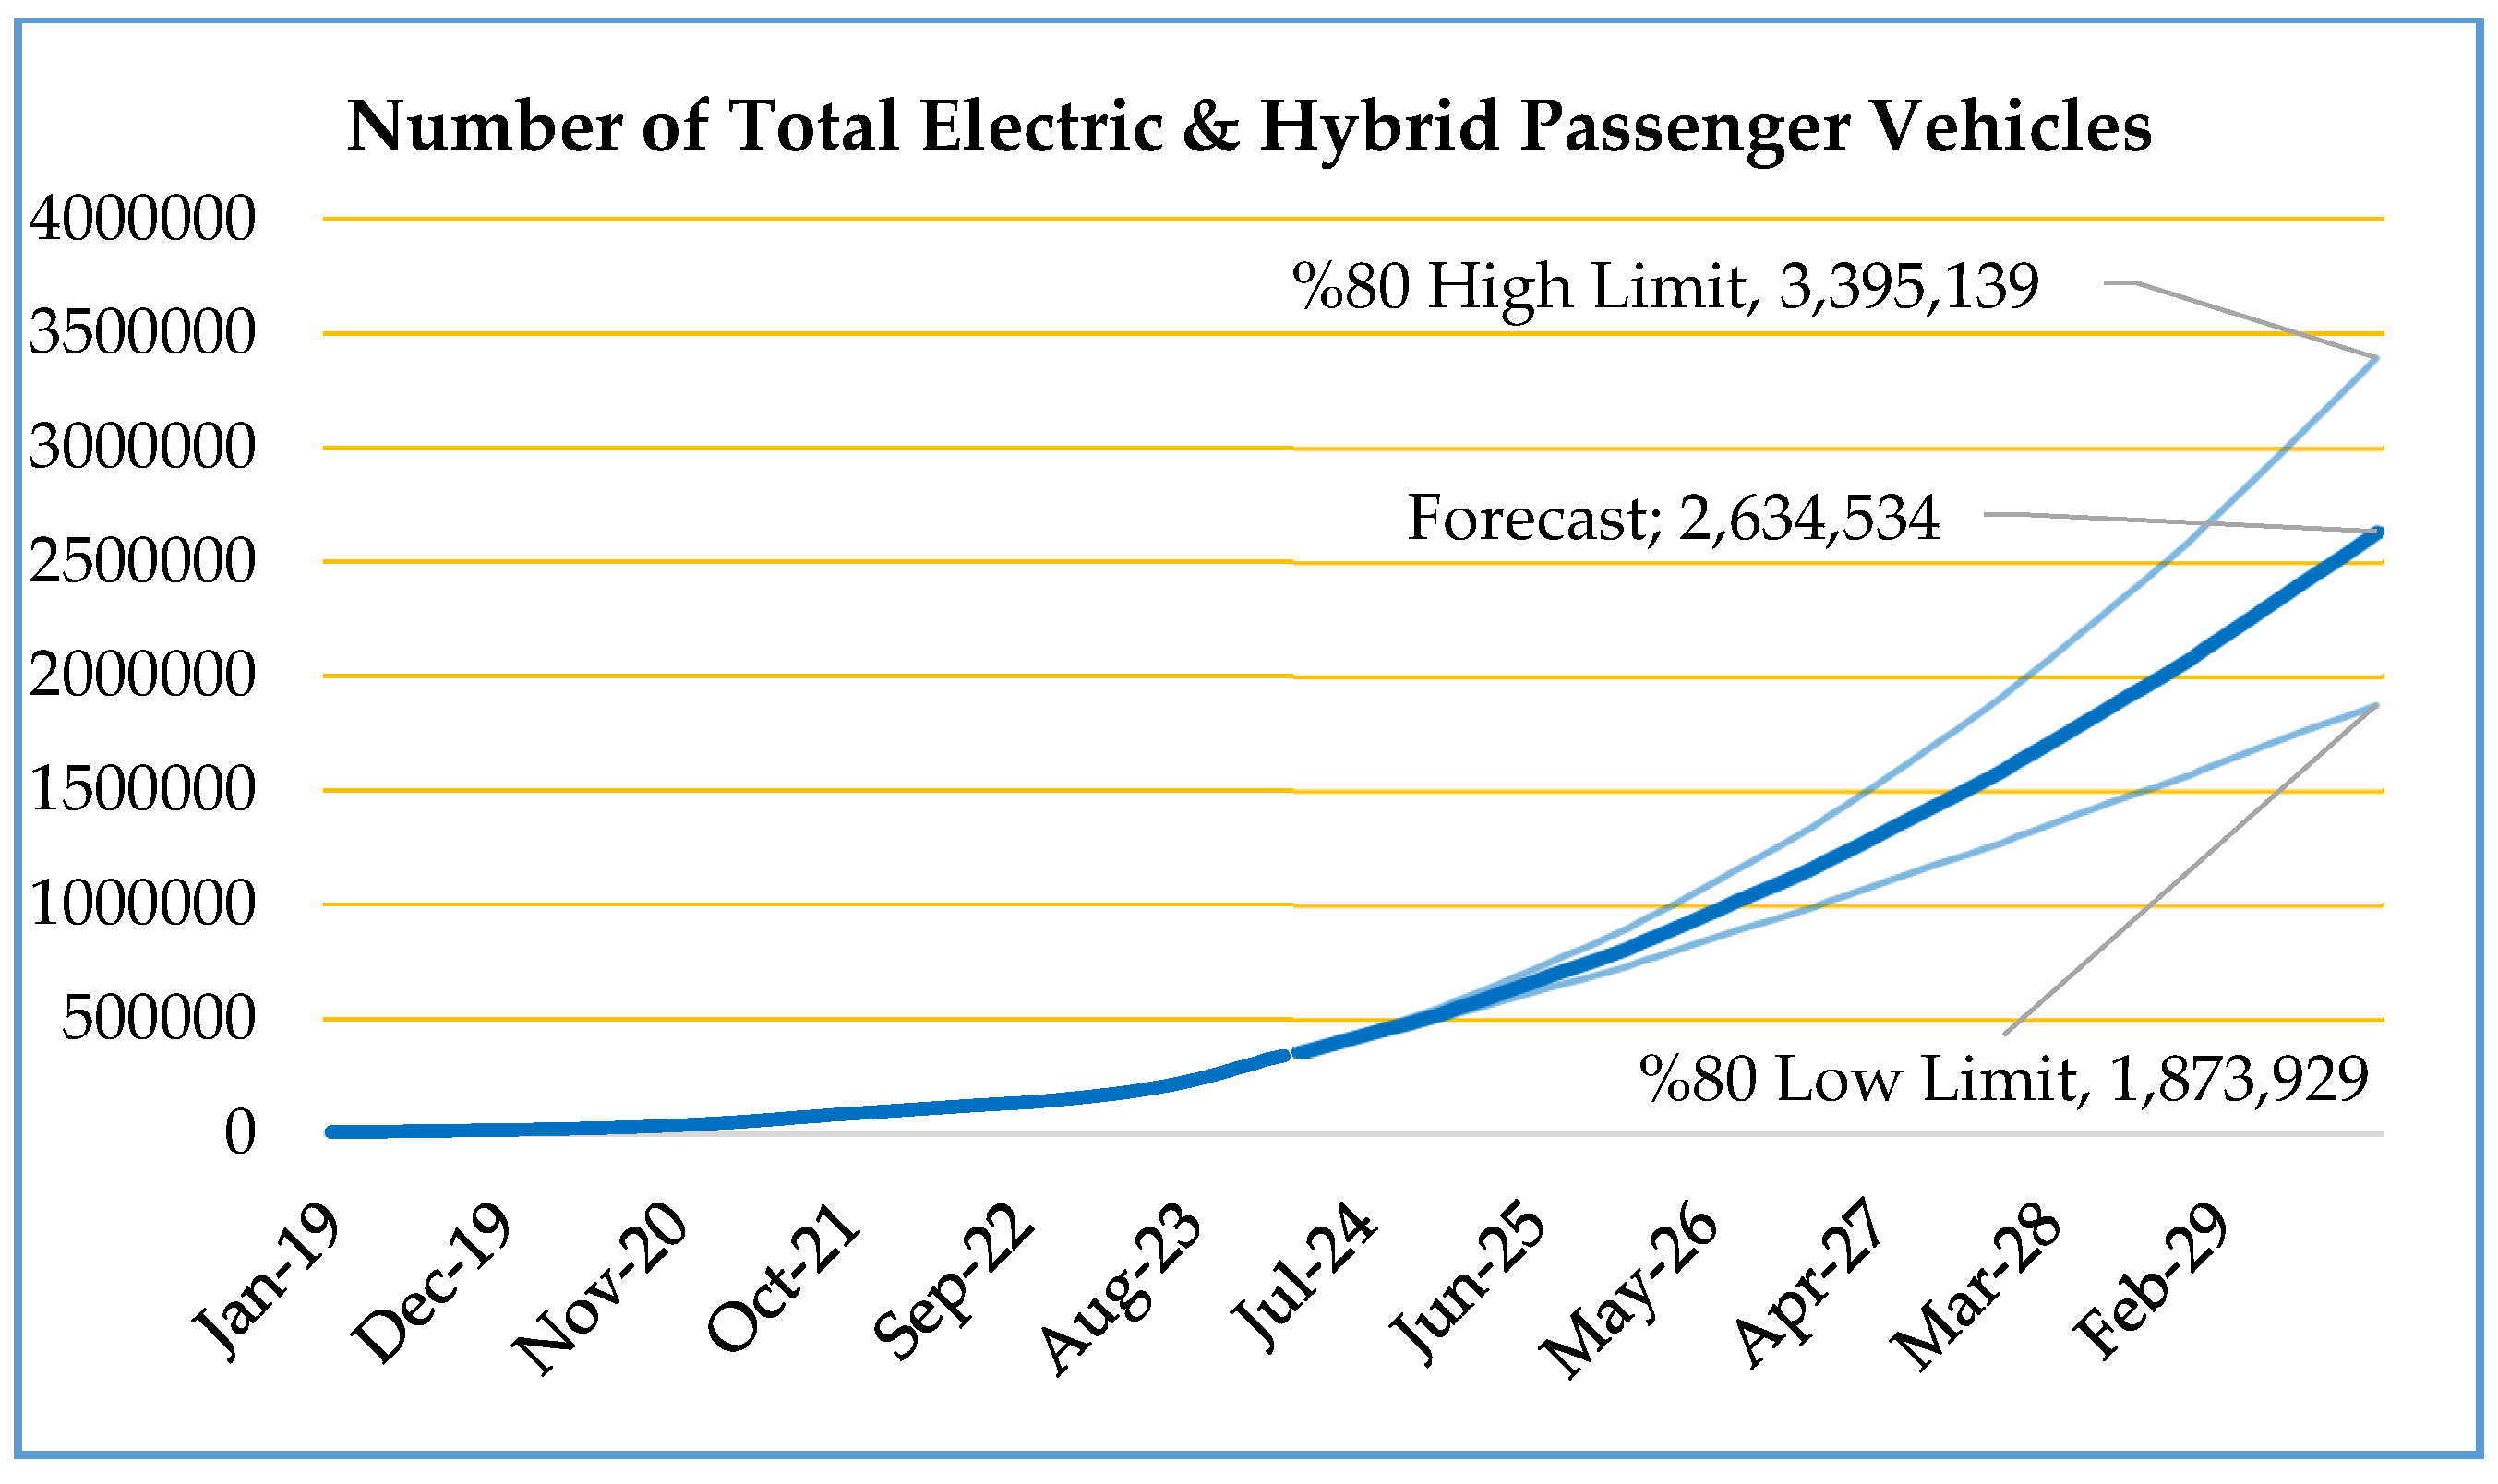
Figure 15 shows that the total number of electric vehicles in traffic, as obtained by aggregating the increase forecasts, is expected to exceed 1.9 million in the low scenario, 3.4 million in the high scenario, and 2.6 million in the medium scenario by the beginning of 2030.
Table 4 presents the monthly forecasts for the total number of electric vehicles towards 2030. According to these results, under normal market conditions, it is anticipated that the total number of electric and hybrid vehicles will exceed 1 million by the first half of 2026, and the trend will accelerate. Future periods should consider that potential contributions and impacts from policymakers, market dynamics, battery technologies, the country’s charging infrastructure, consumer demands, and other factors could directly influence the trend observed in the model forecast results. For instance, according to the study conducted by Ö. Gönül, A. C. Duman, and Ö. Güler, the non-homogeneous spread of EV charging infrastructure is one of the reasons why the use of EVs has not become widespread in Turkey. The EV charging station (EVCS) network is mainly located in the most populated cities, such as Istanbul, Ankara, and Izmir. Most of these stations are concentrated in the western part of Turkey, while provinces with lower GDP per capita in the east do not have any EVCS [
25]. In this case, the increase in infrastructure investments in the eastern region of the country may accelerate the number of electric vehicles.
4. Conclusions and Discussion
This study aimed to predict the potential trend and forecast the number of electric vehicles in Turkey until the beginning of 2030 by applying the SARIMA time series methodology to an adjusted dataset. According to the analysis of monthly registration data for electric and hybrid vehicles, it is forecasted that by the end of 2029, the number of electric vehicles in Turkey will reach an average of approximately 2.6 million, with a lower limit of 1.9 million and an upper limit of 3.4 million, with 80% confidence. The findings support planning for electric vehicles by policymakers and stakeholders in the automotive sector in Turkey and are considered an important step toward achieving the country’s environmental sustainability goals. Additionally, the monthly forecasts for the number of electric vehicles over the next 6 years serve as a strategic guide for organizations responsible for implementing charging infrastructure projects in their short-term planning.
However, there are some limitations to this study. The data used in the analysis represents the total number of fully electric and hybrid vehicles. The adjustments made to the electric vehicle dataset were customized using techniques based on the patterns observed in traditional fuel vehicles. The effects of events negatively impacting the automotive market in recent years have been relatively removed with corrections to the dataset. However, as of 2022, the recovery or renewed increase in car sales may be due to the gap created in the market by the negative conditions observed since 2018. Also, since a univariate time series method was applied and adjustments were made to the dataset, global-regional events and consumer behaviors that could negatively affect electric vehicle sales were not considered, which limits the generalizability of the results. In light of these limitations, future research should use more comprehensive datasets for modeling. Although this study provides important insights into the future of electric vehicles, it should be noted that the results need to be reassessed under dynamic conditions.
In this study, due to limitations in the available data sources, battery electric vehicles (BEVs) and plug-in hybrid electric vehicles (PHEVs) were evaluated collectively rather than separately. Considering the differences in charging behavior between these two vehicle types, distinguishing them in future studies—particularly those focusing on charging infrastructure planning—may provide more precise projections.
The sharp increase in projected EV adoption after 2026 is contingent upon enabling factors such as continued policy support, expansion of charging infrastructure, advances in battery technologies, and broader model availability in the domestic market.
