Article

Power System Modeling and Simulation for Distributed Generation Integration: Honduras Power System as a Case Study

by
Jhonny Ismael Ramos-Gómez
1,
Angel Molina-García
1,* and
Jonathan Muñoz-Tabora
2
1
Department of Electrical Engineering, Universidad Politécnica de Cartagena, 30202 Cartagena, Spain
2
Electric Engineering Department, National Autonomous University of Honduras, Tegucigalpa 04001, Honduras
*
Author to whom correspondence should be addressed.
Energies 2025, 18(17), 4777; https://doi.org/10.3390/en18174777
Submission received: 31 July 2025 / Revised: 1 September 2025 / Accepted: 5 September 2025 / Published: 8 September 2025

Abstract

This paper presents a case study of the Honduran electricity system and evaluates the technical impact of integrating distributed generation through modeling and simulation using Pandapower, (version 3.1.0) an open-source Python tool. A multi-criteria methodology was applied to select connection nodes considering the voltage sensitivity (∆V/MW), loss factor, available thermal capacity (headroom), and hosting capacity. The analysis focused on voltage stability, power losses, and line loading under various distributed generation scenarios. This methodology prioritized buses with critical voltages and significant loads. The case study model included official data from the Honduran National Dispatch Center. The simulations included a redispatch scheme for conventional generators to maintain power balance in all scenarios (20–100% distributed generation profiles), using GEN (controllable output) and SGEN (fixed output) components. The results show that with 50% distributed generation relative to local demand, voltages at critical buses improved by up to 0.14 p.u. Total active losses decreased by 9%, and reactive losses decreased by 44%. Additionally, indirect improvements were observed in non-intervened buses, as well as load relief in lines and transformers. These results confirm that strategic distributed generation injections combined with redispatch can improve supply quality and operational efficiency in weak and radial network topologies. The proposed methodology is scalable and able to be replicated in other power systems, providing technical input for energy planning and renewable energy integration in developing countries.

1. Introduction

Over the last decade, the deployment of renewable energies has experienced unprecedented growth worldwide, marking a structural transformation of the global energy system. The “Renewables 2025 Global Status Report” reveals that an estimated 4.2 TW of renewable energy will be installed by early 2025, with an additional 741 GW of capacity added in 2024. This growth is primarily driven by solar photovoltaics (602 GW), followed by wind (117 GW) [1,2]. This growth represents an annual increase of 18%, though it is insufficient to achieve the goal of tripling renewable energy capacity by 2030. China has led the deployment, accounting for 60% of new installations [3]. According to the International Energy Agency [4]), renewable capacity is expected to expand by approximately 5500 GW between 2023 and 2030, with an average annual growth rate of 13%. This growth will be driven mainly by solar photovoltaic and wind technologies, which are expected to account for 95% of new additions. Projections indicate that by the end of this decade, global electricity generation from renewable sources could surpass 17,000 terawatt-hours (TWh), representing a nearly 90% increase compared with 2023 levels [5]. This production would suffice to meet the combined energy demands of China and the United States by 2030 [6]. In Honduras, the installed electricity generation capacity reached approximately 3159 megawatts (MW), which is distributed across 107 power plants. Of this capacity, 65% comes from renewable sources, such as hydroelectric, solar, wind, biomass, and geothermal. The remaining 35% comes from fossil fuel-based thermal generators [7]. According to 2023 data, clean energy sources accounted for over 60% of total electricity production. Hydroelectric power contributed about 1/3, while solar and biomass contributed about 10% each. Wind contributed 6%, and geothermal contributed approximately 3% [8]. In 2023, renewable generation reached 7210 GWh, slightly exceeding the previous year’s level of approximately 7200 GWh but remaining well below the global average of 47,460 GWh. The 2022–2031 Indicative Generation Expansion Plan states that Honduras aims to add between 1700 and 2600 MW of new electricity generation capacity by 2030. Different projected scenarios contemplate the significant incorporation of renewable sources within this range: up to 262.5 MW in hydroelectric power plants, 240 MW in solar power, 160 MW in wind power, and 15 MW in geothermal power. Thermal projects would be used as needed to supplement these sources [7,8,9,10].
Technically, Honduras faces substantial barriers to integrating distributed renewable generation into its electricity grid. Its transmission and distribution infrastructure has physical and operational limitations; many lines were not designed to manage bidirectional flows or receive energy injections from multiple decentralized points. This increases the risk of grid congestion, overvoltage, and frequency variations, particularly in rural areas or areas with low installed capacity. Therefore, it is essential to study the national electricity grid in Honduras in depth and determine optimal points for distributed generation injection. This will improve the stability of the transmission system. This need is especially relevant given the growing importance of intermittent renewable sources. Analyzing the behavior of the system in different renewable penetration scenarios is necessary to evaluate the effects on voltage profiles, line loads, and overall operational safety. A previous literature review identified various methodological approaches combining classical and advanced techniques as a means of addressing these challenges. The most widely used tools are load flow analysis and voltage stability studies, which are commonly applied to evaluate the grid’s operational status. A case study using the New England 39-bus test system with different levels of distributed generation (DG) penetration demonstrated that DG penetration percentages must be proportional to avoid reducing system inertia [11]. Studies have also shown that the location of distributed generation units directly impacts the stability of the electrical system. Notably, when DG units are located on busbars where high voltage drops occur, there is an improvement in the voltage profile, as well as a significant decrease in active and reactive power losses [12]. Similarly, Iweh et al. [13] analyzed the impact of DG on power systems and proposed solutions to mitigate problems such as voltage fluctuations, protection coordination, and reactive power control. Ahmed et al. [14] developed a universal droop control combined with sliding mode control. This solution allowed for better voltage regulation in the face of external disturbances and system uncertainties. The method also improved load balancing among DG units, which is essential for the stable and efficient operation of DC microgrids. In [15], a detailed dynamic model of electrical distribution systems with a high penetration of renewable energy sources (RESs) was presented. The study focused on the impact of the variable and intermittent nature of RESs, such as solar and wind energy, on the dynamic stability of power systems and their response under disturbances. The model considered inverters, converters, and control mechanisms to adequately represent dynamic behavior. The simulation results demonstrated that integrating renewables significantly impacts stability conditions and that accurate modeling is essential for designing effective control strategies. It is also important to note that weak networks with a high R/X ratio are particularly prone to over-voltages when DG is integrated without adequate planning [16]. Other authors used the load flow method, based on the Newton–Raphson algorithm, to determine the optimal location of DG and evaluate the operating status of the network, especially in terms of voltage stability and load capacity [17,18]. From a power electronics perspective, a significant challenge in integrating three-phase grid-connected converters is stability loss due to PLL-based synchronization. To address this issue, the proposed impedance controller reshapes the q-axis impedance by converting the PLL-induced negative impedance into positive resistance at low frequencies without requiring hardware modifications [19].
In power systems with a high presence of power electronics, the issue of negative impedance continues to be a concern. A study on direct-current (DC) microgrids incorporating constant power loads (CPLs) reveals that these loads exhibit particularly critical dynamic behavior in the face of transient disturbances due to their unstable nature [20]. Without adequate damping mechanisms in place, these loads tend to amplify oscillations and even cause voltage collapses. In response, the authors proposed various stabilization strategies, including the incorporation of passive filters and energy storage systems. Notably, they also suggested advanced control techniques, such as proportional–derivative (PD) controllers and boundary controllers. Experimental tests validated the effectiveness of such solutions, providing key tools for designing and operating robust, efficient, and secure microgrids, particularly in environments with high DG penetration [21]. These methods were complemented by more sophisticated artificial intelligence-based models, such as artificial neural networks, fuzzy logic, and genetic algorithms. These models have proven effective in determining the optimal location of distributed generation units, estimating their capacity, and simulating their behavior under dynamic and uncertain conditions [22,23,24].
Recent studies conducted by the authors noted that the sustained growth of variable renewable energy (VRE) sources posed significant challenges for generation expansion planning due to their intermittent nature and the need to ensure operational flexibility in electrical systems. In this way, Muñoz Tabora et al. [25] developed a planning strategy based on multi-objective stochastic optimization to maximize VRE penetration while minimizing investment costs in flexible technologies, system operating costs, and emissions taxes. The proposed model incorporated uncertainties in renewable generation, electricity demand, and hydroelectric availability by using probability density functions and representative scenarios. The results demonstrated a direct correlation between increased installed renewable capacity and the necessity of greater investment in backup technologies, including energy storage. Similarly, Tiwari et al. [26] proposed three deep neural network (DNN) models, MLP, CNN, and RBFNet, for solving load flow analysis under unbalanced three-phase distribution network conditions. These models allowed for the prediction of voltage and current magnitudes, phase angles, and power losses with remarkable accuracy and low error rates, even under variable conditions such as the integration of electric vehicles (EVs) and distributed renewable energy sources (DERs). Palaniyappan et al. [27] addressed uncertainty in distribution systems’ power demand by proposing a hybrid scheme combining deep learning and incentive-based demand response. The model used a B-LSTM (bidirectional long short-term memory) neural network to accurately predict short-term electricity consumption. This fact enabled proactive management of flexible loads during peak hours. Additionally, the key role of energy storage systems (ESSs), such as batteries and flywheels, in buffering variations and contributing to frequency and voltage regulation was recognized, mainly in weak or non-interconnected networks [28,29,30,31].
Although considerable progress has been made in scientific literature analyzing the technical impacts of DG, a significant gap remains in the practical application of this knowledge to specific contexts in developing countries. In Central America, electrical systems face common challenges, including weak transmission and distribution networks that are mostly radial with limited redundancy and high levels of technical losses. A recent regional analysis points out that the electrical sector has not been studied sufficiently from a comprehensive perspective. This analysis highlights the structural weakness of these systems and the urgent need for solutions, such as microgrids or storage, as resilience strategies [32]. While several studies have examined the optimal location and impact of DG on voltage stability and losses, most of them have been conducted in test systems or contexts with greater operational robustness. This fact underscores a research gap: these methodologies must be adapted to weak networks in developing countries, where infrastructure and data limitations pose an additional challenge. With this aim, this paper stands out by providing an applied evaluation of DG in a real network, the Honduran power system, which faces stability challenges due to high renewable penetration. Previous contributions have offered valuable, primarily theoretical insights. Kahlid et al. [33] reviewed smart grid technologies and highlighted gaps in standardization and digitalization; Marinescu et al. [34] developed optimization and control models for ancillary services; and Safaei et al. [35] focused on scenario-based modeling of distributed renewables [36]. However, these approaches were not evaluated under real and current grid operational conditions. To overcome this drawback, this paper used real data and applied a multi-criteria methodology to select DG injection points, assessing voltage stability, losses, and transformer capacity under different scenarios. This practical application bridges the gap between conceptual modeling and real-world needs, providing insights for developing countries with weak, radial networks. Subsequently, a relevant contribution of this work is based on a real network—the Honduran power system—which, due to the significant penetration of renewable energy sources, faces challenges related to frequency and voltage stability due to intermittency and high renewable integration. By assessing a current power system, this study enables the verification of the impacts of DG on the Honduran grid. With this aim, a case study of the Honduran grid was then conducted by the authors through modeling and simulating part of the national transmission system with DG integration. This study also addressed technical and operational challenges associated with renewables, including voltage stability, power flow management, and impacts on overall performance. A computational model using Pandapower was developed, integrating modules for power system analysis and a multi-criteria approach for selecting optimal injection points. DG scenarios were evaluated and included in the results, considering voltage profiles, transformer capacity, and system losses with redispatch strategies. The results offer clear evidence of how DG can enhance stability and efficiency while aligning with literature and adapting methods to the unique context of a weak and radial power system.

2. Problem Formulation and Description

This study used official data from the National Dispatch Center of Honduras (CND), including Excel files with characteristics of buses, lines, transformers, loads, and generating units, as well as a general single-line diagram of the interconnected system [37]. The complete electrical system is composed as follows:
  • Generation: One hundred and fourteen buses in service with 2033.79 MW and forty-two buses out of service with 8.00 MW, for a total of one hundred and fifty-six buses.
  • Lines: One hundred and thirty-eight lines in service and three out of service.
  • Two-winding transformers: One hundred and eighty-four units in service and ten units out of service.
  • Three-winding transformers: Forty-nine units in service; zero units out of service.
  • Load: Eighty-seven buses in service with 2005 MW, and fifteen out of service with 161 MW.
Honduras’s electrical system has a predominantly radial structure. Consequently, it is more prone to failures [38]. A preliminary analysis reveals partial mesh connections in certain areas along the central axis of the country. This semi-radial configuration combines unidirectional main routes with local backup loops, providing greater operational flexibility in strategic areas, while maintaining structural vulnerabilities in remote sectors. These characteristics must be carefully considered when evaluating DG integration, as they directly influence the propagation of disturbances, voltage control, and the redistribution of flows in the event of contingencies. For this case study, part of the national network was selected, as shown and described in Figure 1.
  • Generation: Nineteen buses with 425 MW of active power and 182.69 MVAR of reactive power.
  • Lines: Sixteen active lines.
  • Two-winding transformers: Twenty-eight units in service.
  • Three-winding transformers: Seven units in service.
  • Load: Eleven buses with 204.94 MW of active power and 50.39 MVAR of reactive power demand.

3. Methodology

3.1. Simulation Tools

The Pandapower software was selected for modeling and simulating the Honduran electrical system. It is an open-source library developed in Python for analyzing electrical power systems. Pandapower is widely recognized for its ability to automate complex workflows and perform load flow calculations, short-circuit analysis, state estimation, topological analysis, and power optimization, with a clear and flexible data structure [39,40,41,42]. Pandapower is open-source software licensed under the BSD (Berkeley Software Distribution) license (version 3.1.0), which guarantees transparency, reproducibility, and flexibility for academic and research use without commercial restrictions. Pandapower stands out for its ease of use, automation capabilities, cross-platform compatibility, and versatility, which surpass those of many commercial tools and other free alternatives [43]. Additionally, Pandapower employs an element-based modeling approach that enables the definition of electrical components, such as lines, transformers, loads, and generators, based on their nameplate parameters. This facilitates model validation using real data [44]. Due to its modular, flexible, and extensible nature, Pandapower is particularly useful for the Honduran power grid case study. It is necessary to work with real power grids, perform progressive zone-by-zone simulations, inject distributed generation under intelligent criteria, and automate analysis. It was especially ideal for this study, since load flows were analyzed accordingly.
The model and electrical system case study were developed using various libraries from the Python (version 3.11) ecosystem, as shown below:
  • Pandas: Used for manipulating and analyzing tabular data, especially for loading, filtering, and transforming information from Excel spreadsheets. Its DataFrame structure facilitates the efficient handling of large volumes of electrical data [45].
  • Os: Verifies the existence of the input Excel file and performs basic checks of the working environment [46].
  • Pandapower: The main library for modeling, simulating, and analyzing electrical networks. It enables the creation of network elements (buses, lines, transformers, loads, and generators), the execution of load flows, the analysis of voltage and loss profiles, and the evaluation of distributed generation injection scenarios [44,47].
  • Matplotlib.pyplot (v3.5.3): Used for displaying results. It is mainly used to generate bar and line graphs representing voltage profiles and line loads, among others [48].
  • NumPy: Provides low-level mathematical tools and vectorized operations that optimize the calculations required for comparative analyses [49].
  • Pandapower. topology: Provides useful functions for the network topological analysis, such as island detection, connected components, and routes among buses [41].
In Pandapower, the load flow is based on solving the nodal power balance using the Newton–Raphson method. For each k-bus, the estimated active and reactive power values are expressed as follows:
P k = | V k | l = 1 n | V l | ( G k l cos θ k l + B k l cos θ k l )
Q k = V k l = 1 n V l G k l sin θ k l B k l sin θ k l   ,
where | V k | are the voltage magnitudes in buses k, l; G k l and B k l correspond to the nodal admittance of the system; and θ k l = θ k θ l is the angular difference.

3.2. Proposed Methodology

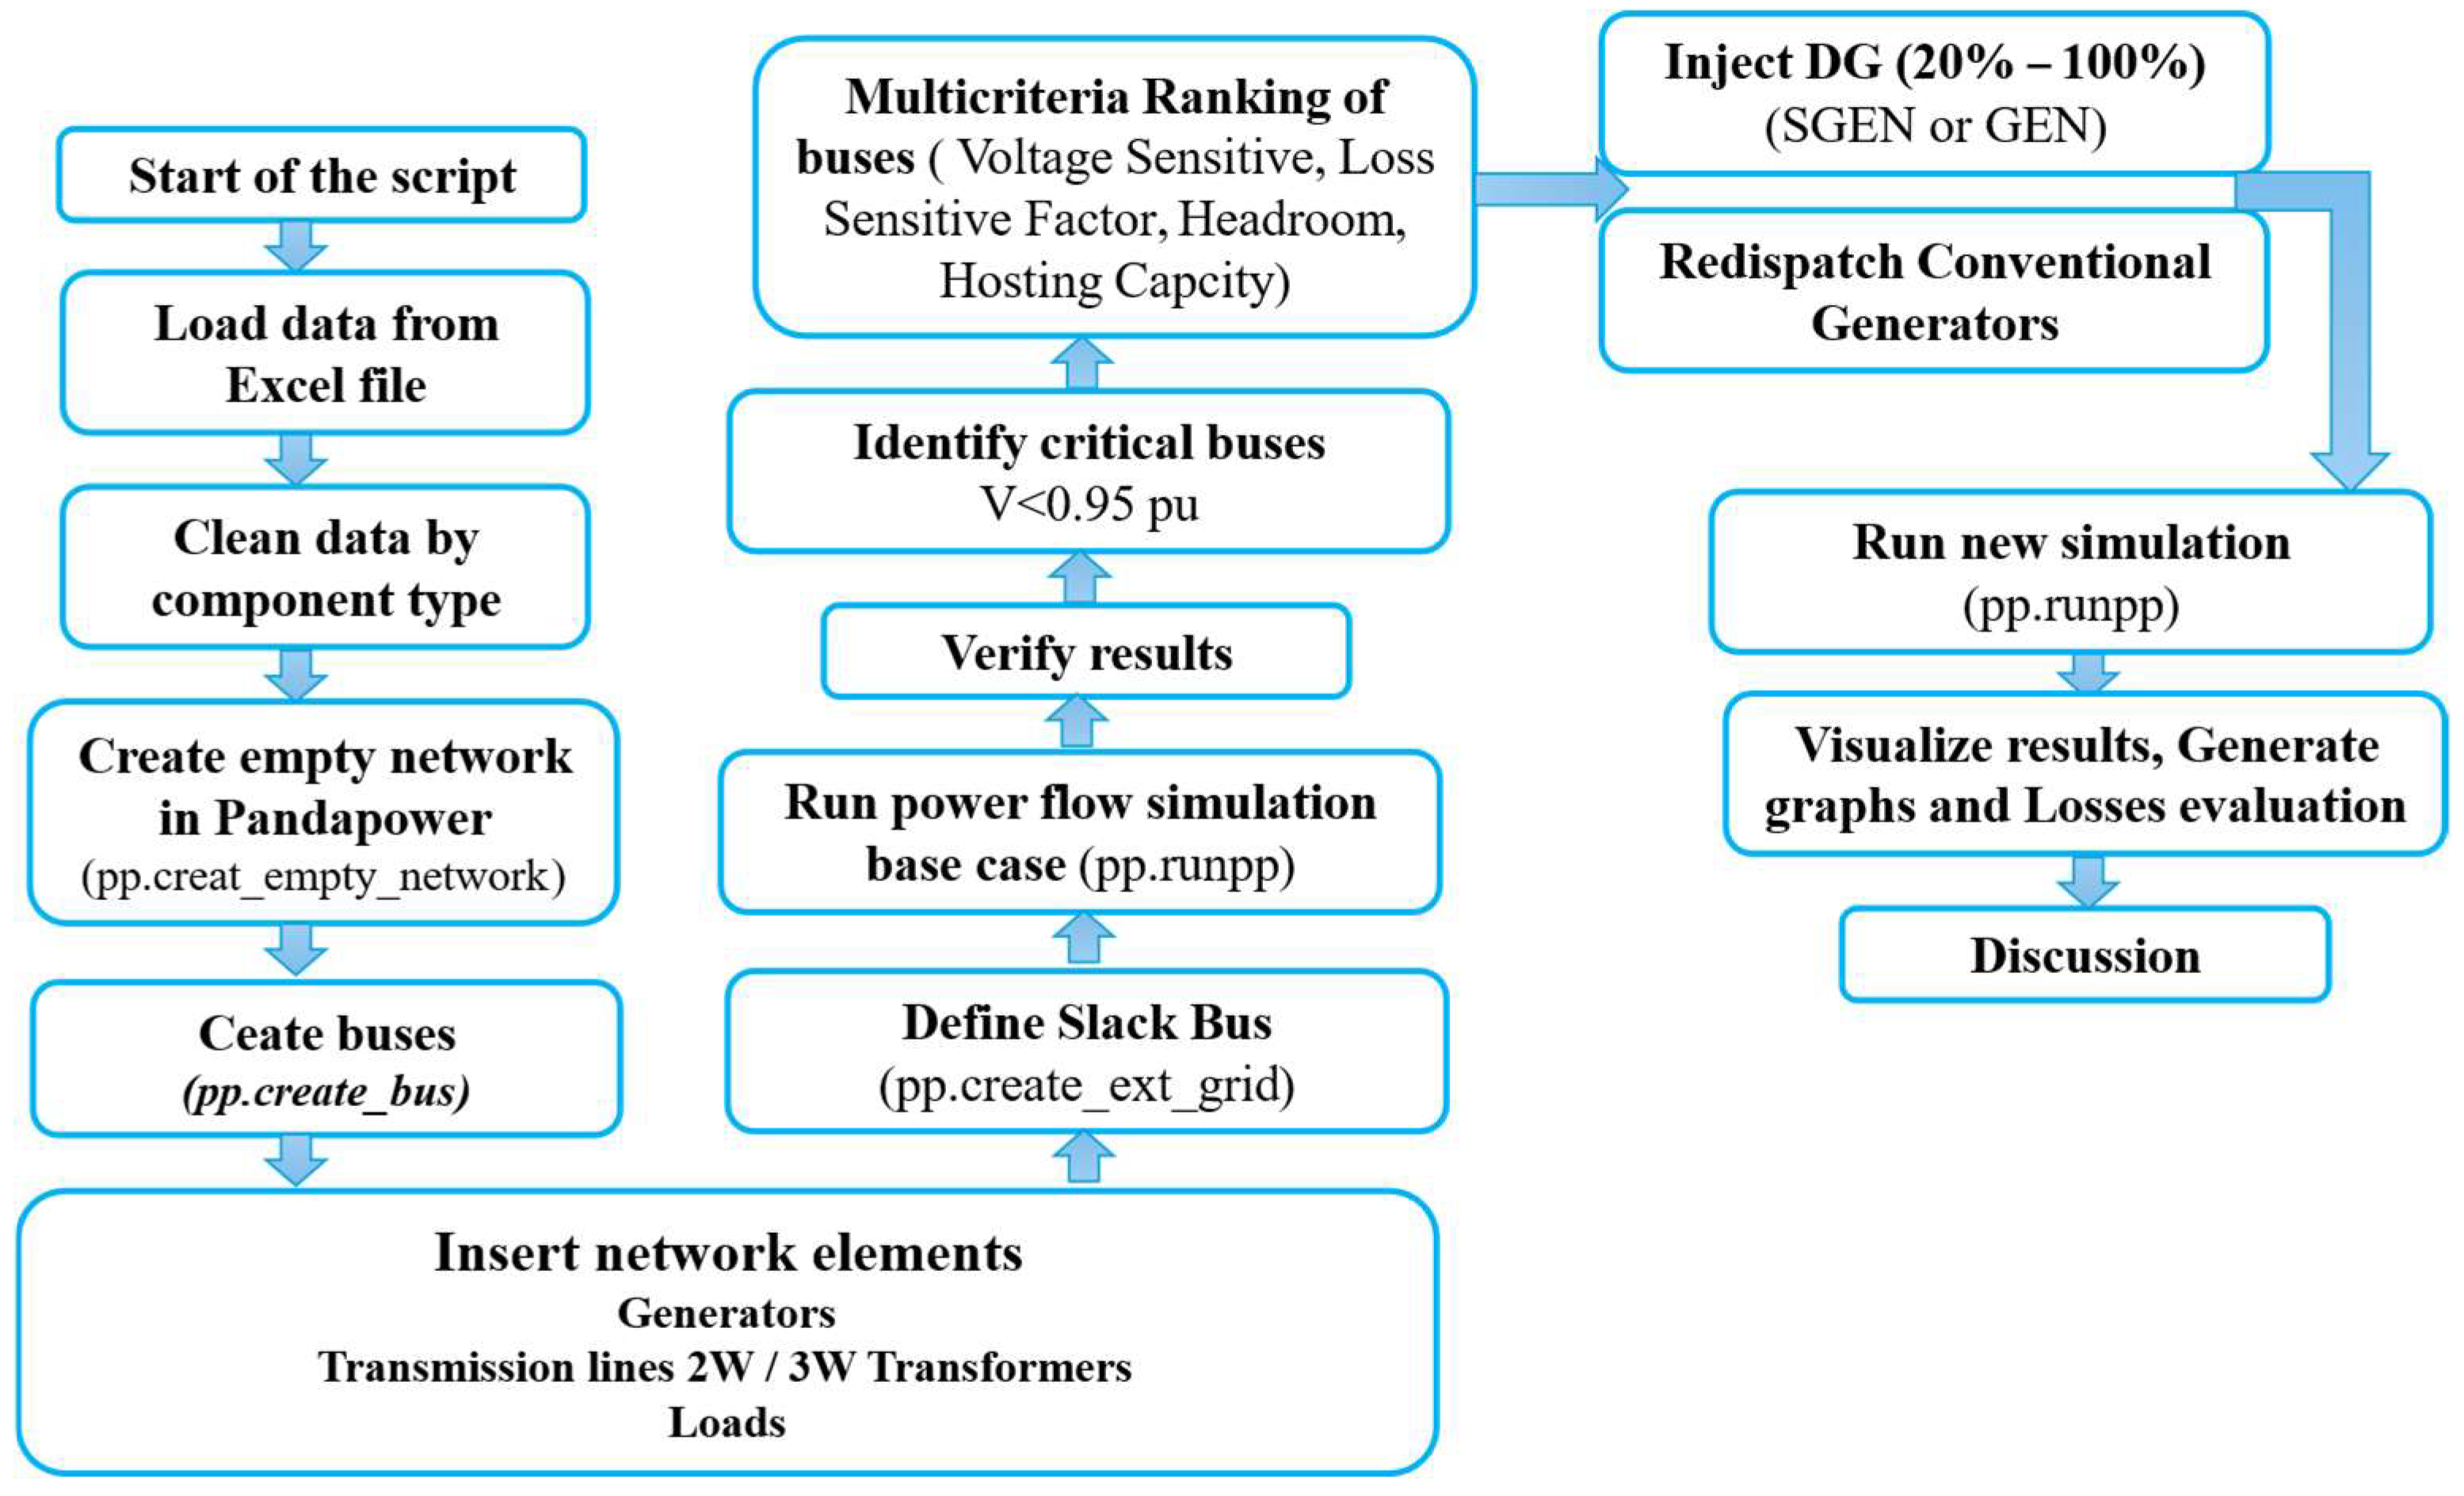
Figure 2 schematically depicts the global procedure used for network modeling. It also shows the methodological framework proposed in this study to evaluate the integration of DG into the Honduran electricity system as a real case study. The process is structured into several consecutive stages that are described as follows.

3.2.1. Data Collection and Cleaning

For network modeling, the data provided by the National Dispatch Center (CND) were first verified to ensure the technical consistency of information related to network elements such as busbars, lines, transformers, and loads. This was carried out to create the network by zones in a progressive manner [50].

3.2.2. Network Modeling in Pandapower

A detailed electrical system model was provided by using open-source Python tools. This model incorporated buses, lines, transformers, generators, and loads. It was defined using a slack bus as a reference.

3.2.3. Simulation of Base Case

An initial power flow was performed to identify critical buses with voltages below 0.95 p.u. and significant load. These buses would be candidates for receiving distributed generation.

3.2.4. Bus Selection Using Multi-Criteria Analysis

Voltage sensitivity (∆V/MW), loss factor (LSF), thermal capacity (headroom), and hosting capacity indicators were applied. These criteria were normalized and weighed to obtain a ranking of optimal buses for DG integration.

3.2.5. DG Injection Scenarios

Different DG penetration scenarios were considered, equivalent to 20–100% of the local load using the GEN (controlled) and SGEN (fixed output) elements of Pandapower.

3.2.6. Application of Redispatch

In each scenario, the dispatch of conventional generators was adjusted to compensate for DG injection in order to maintain power balance and evaluate the net technical effects.

3.2.7. Evaluation of Results

Voltage profiles, active and reactive losses, and loads on lines and transformers were analyzed before and after DG injection. Additionally, energy balances were calculated, and scenarios with and without redispatch were compared.

3.2.8. Validation and Discussion

Finally, the results were interpreted based on the literature and operational stability criteria. The 50% injection scenario was highlighted as the most representative. This measure optimizes the voltage profile, reduces stress on existing equipment, and improves the system’s overall performance, particularly in environments with limited infrastructure or growing demand [51,52].

4. Simulation Results and Discussion

This section provides a concise and precise description of the experimental results, their discussion, and the experimental conclusions that can be drawn based on the different power systems scenarios.

4.1. Base Scenario: No Distributed Generation

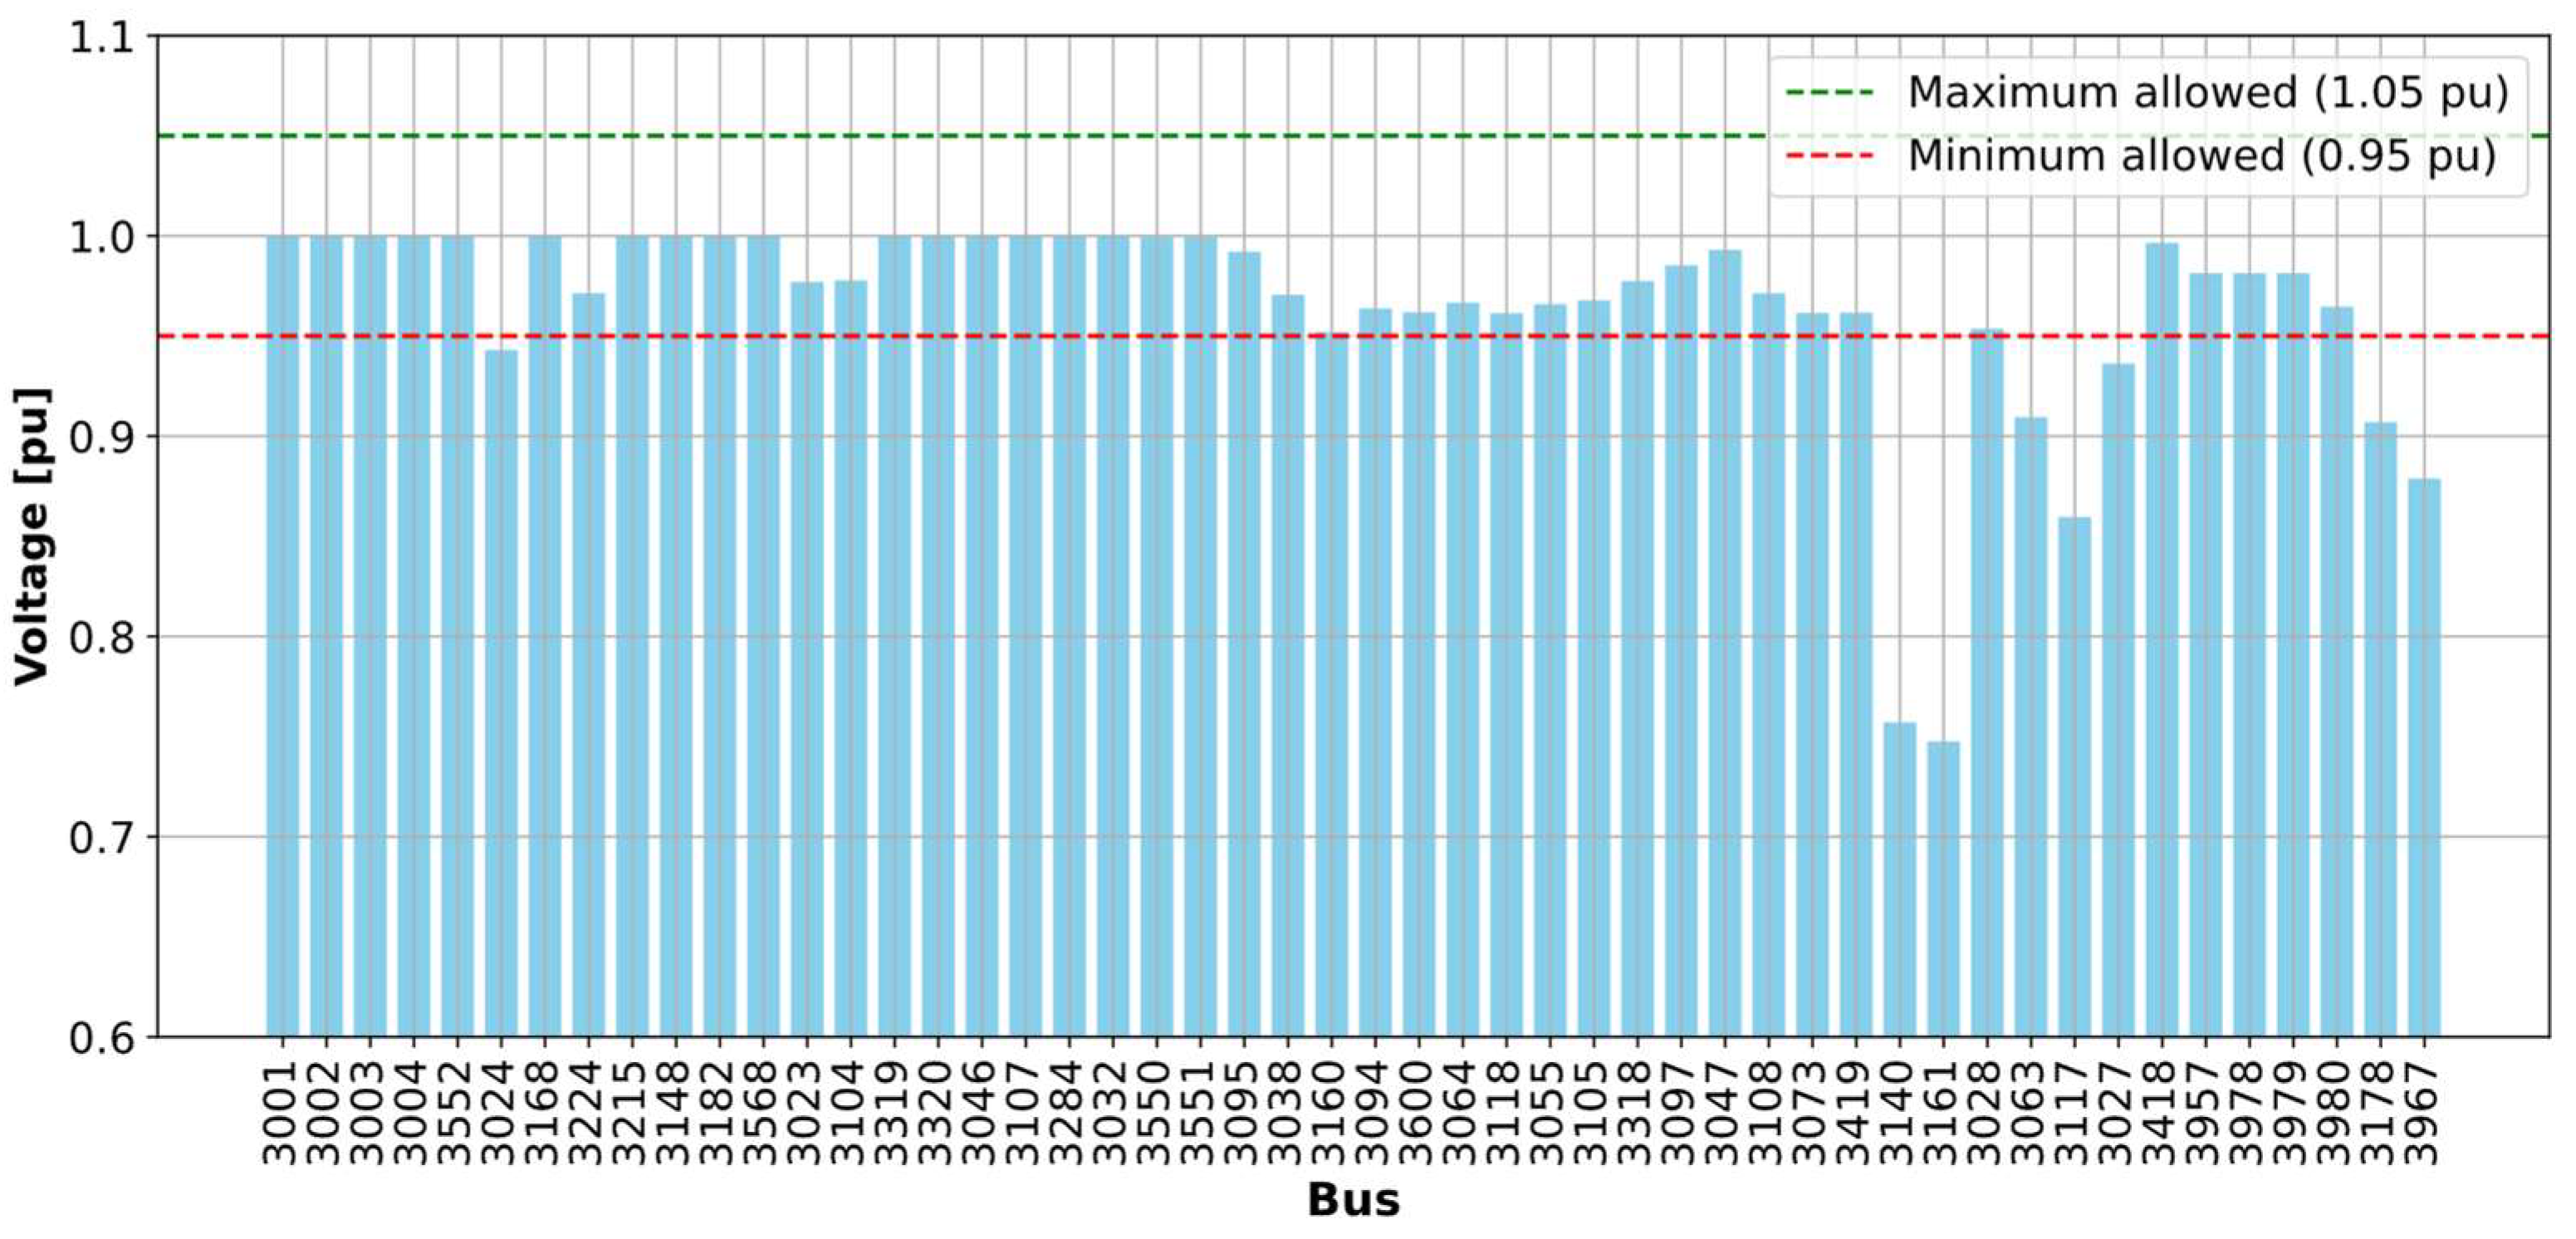
Figure 3 shows the per unit (p.u.) voltage levels obtained for each bus in the modeled network without distributed generation. Additionally, the reference lines corresponding to the minimum (0.95 p.u.) and maximum (1.05 p.u.) limits allowed by safe operating criteria are indicated. Although IEC 60038 permits a tolerance of up to ±10% (0.90–1.10 p.u.) under certain conditions, the 0.95–1.05 p.u. range is typically preferred to prevent undervoltage or overvoltage issues. The ANSI C84.1 standard supports this criterion by defining this band (Range A) as the normal operating range in electrical systems [53]. The IEEE 1547-2018 standard establishes that distributed energy resources must remain in operation within the wider range of 0.88–1.10 p.u. However, under normal operating conditions, it is recommended to maintain the voltage close to the nominal value. This fact makes the range of 0.95–1.05 p.u. an accepted technical practice in modern power systems [54]. The graph includes both load and generation buses, allowing for the visualization of the system’s overall behavior in its base state. Most buses operate within the acceptable voltage range, indicating adequate performance for much of the network. However, some buses have voltage levels below the minimum allowed value, making them critical. These conditions can affect supply quality and compromise system stability. Therefore, these buses are candidates for distributed generation injection analysis to strengthen the voltage profile and improve the local operation of the electrical system.
Figure 4 shows only the generation buses, with their voltage profiles per unit (p.u.), most of which have conventional generation. As in the previous figure, the minimum (0.95 p.u.) and maximum (1.05 p.u.) voltage reference lines are included. These lines are established as acceptable operating limits and indicate that all are generating correctly.
Figure 5 illustrates the percentage load on the main transmission lines of the modeled system. The graph illustrates the utilization level of each line relative to its nominal capacity, expressed as a percentage. A reference line at 80% has been incorporated, which is considered the safe technical limit for the continuous operation of the conductors in accordance with the best practices of electrical system planning and operation. This threshold was adopted as a warning criterion since variations in the system, such as increased demand, contingencies, or disconnection of a parallel line, could quickly lead to critical overloads. The results show that most lines operate within this safe range, indicating adequate load distribution in the power system. However, one line (3105–3318) was identified as exceeding the 80% load threshold, placing it in a state of operational risk. Various simulations were performed to analyze their operating conditions in response to variations in generation at bus 3319, corresponding to the Ensenada substation, which is directly connected to this line, as can be seen in Figure 1. When the generation was reduced from 30 MW to 22.5 MW (a 25% decrease), it was observed that the line load decreased and stabilized just below the 80% threshold. Conversely, when the generation at that bus increased, the line returned to operating at or above the limit, confirming the branch’s sensitivity to local variations in active power.
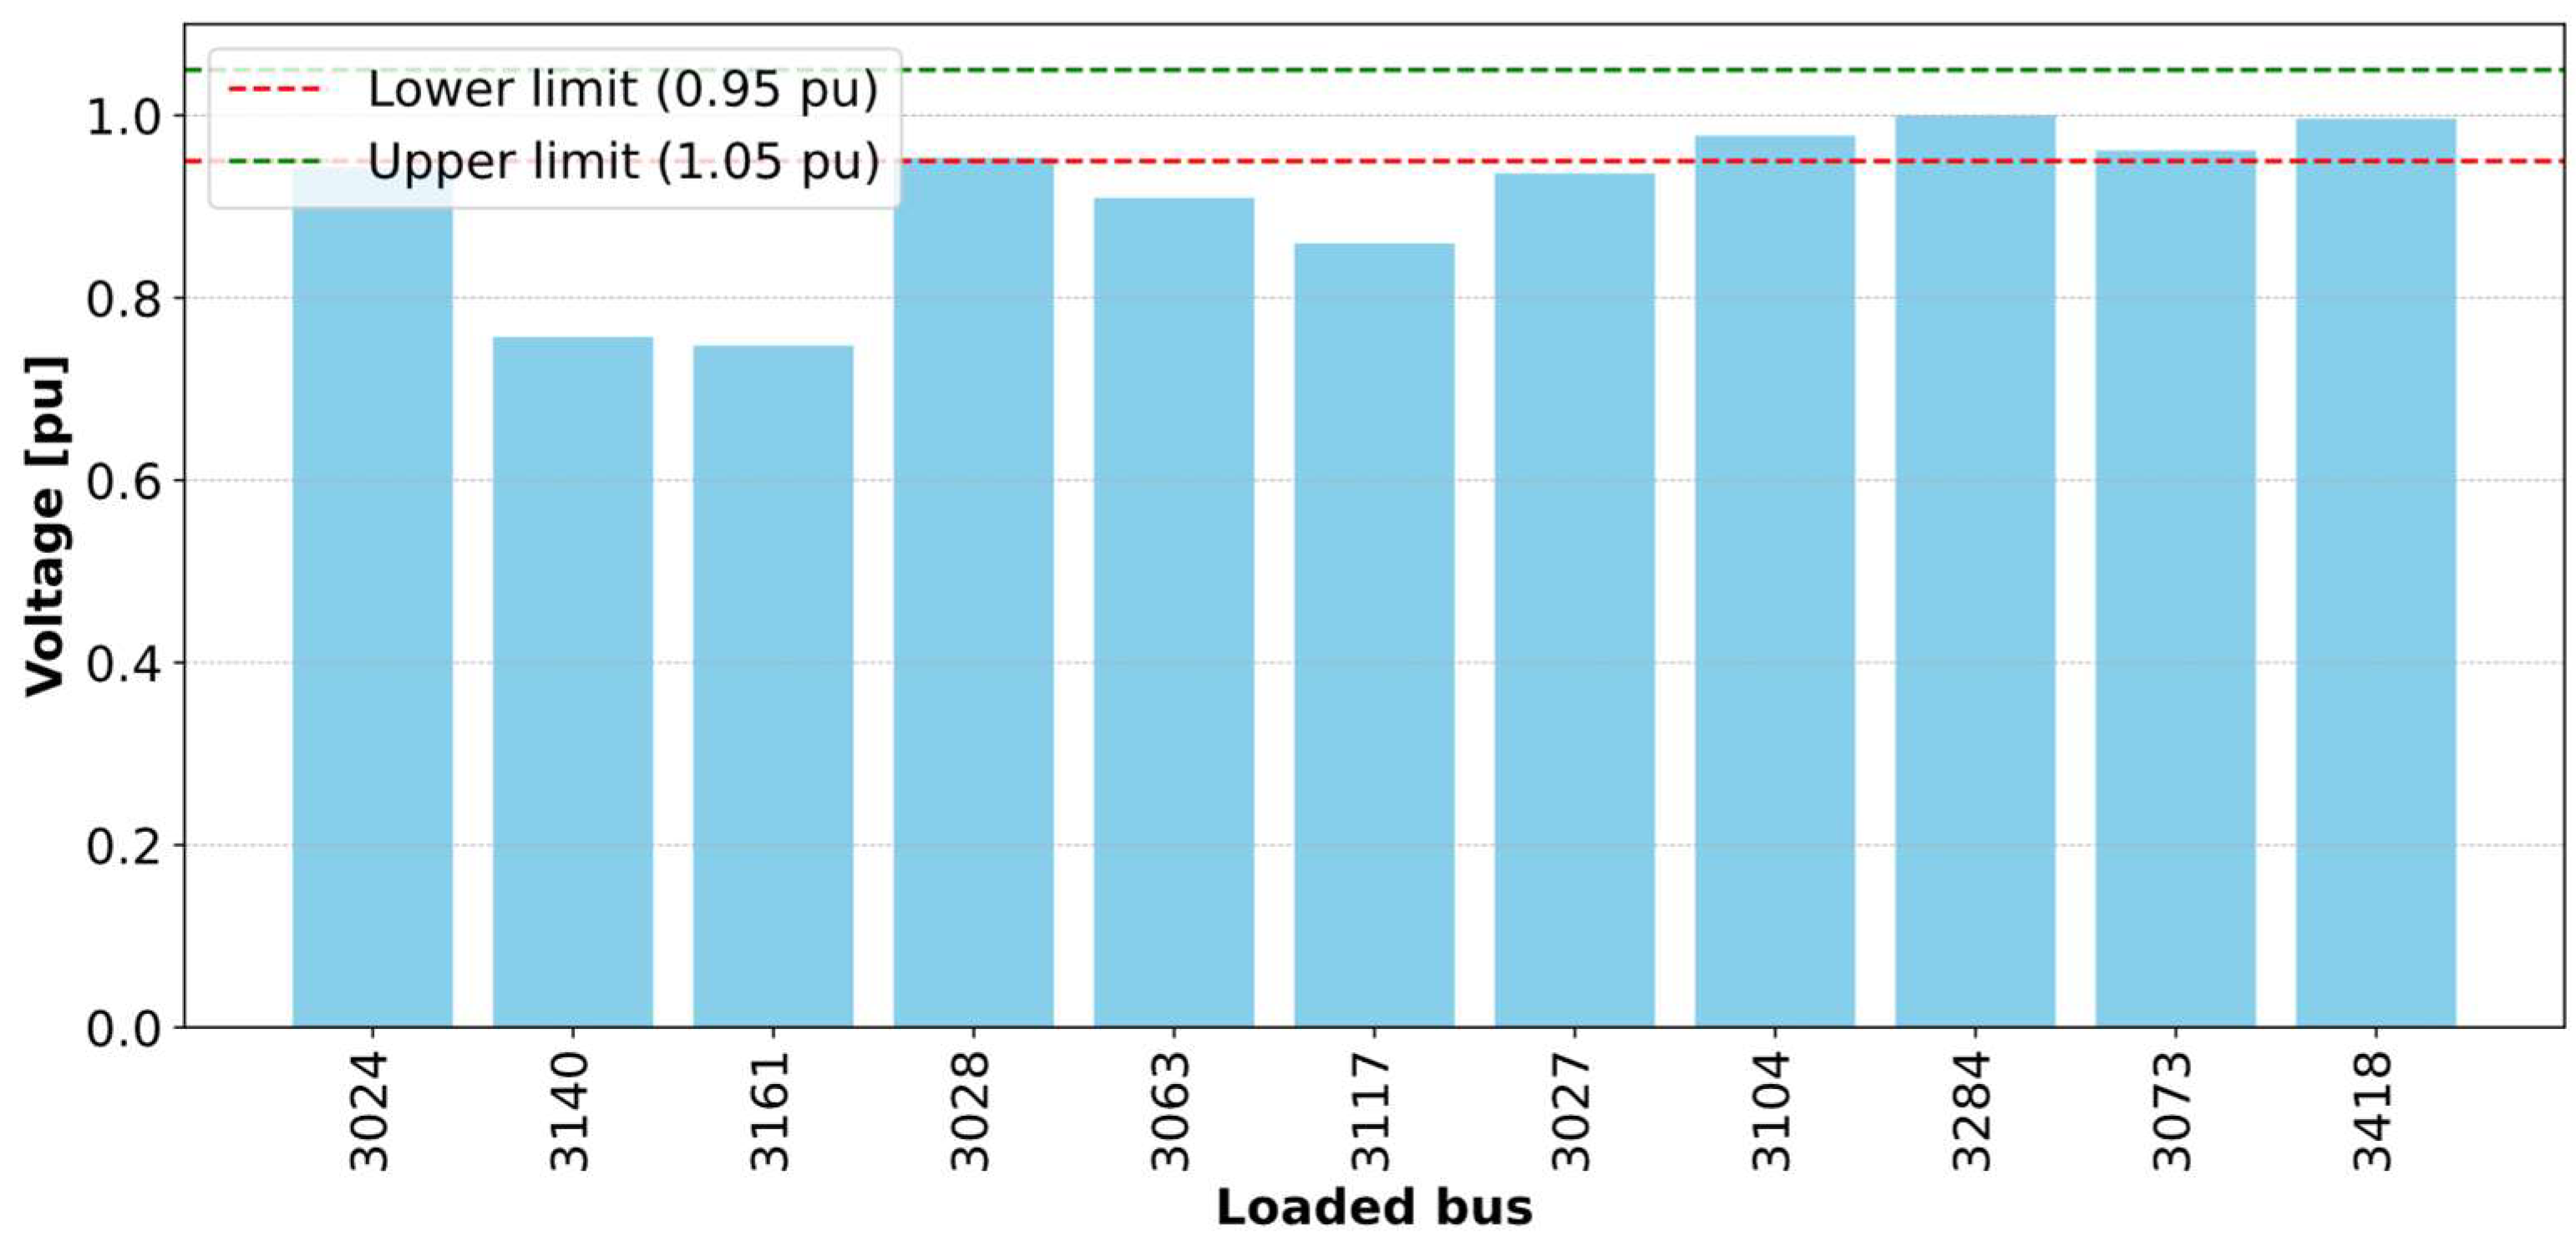
Figure 6 illustrates the spatial distribution of buses connected to loads within the modeled power system. Some of these buses host local DG, while others function exclusively as demand nodes. The graph overlays standard voltage tolerance bands—typically ranging from 0.95 to 1.05 p.u.—enabling a straightforward visual identification of buses that operate outside acceptable voltage limits. The voltage profile reveals significant voltage drops across several zones, highlighting buses under critical operating conditions that may compromise grid reliability. Specifically, buses 3140 and 3161 in the return zone, and 3117, 3063, and 3027 along the Atlantic coast, consistently show voltage levels below the lower limit of 0.95 p.u. These under-voltages are primarily attributed to high local demand, extended distances from the slack bus, and limited reactive power support or local generation. Notably, these regions coincide with areas characterized by weak grid structures and sparse reinforcement, making them particularly vulnerable to instability under load variations or network contingencies. During the load flow analysis, it was necessary to adjust the active and reactive loads at certain critical buses to achieve convergence, reinforcing their classification as sensitive nodes within the system. Their behavior under stress conditions suggests a high susceptibility to cascading failures if left unmitigated. These findings underscore the strategic value of implementing corrective actions in these areas. Reactive power compensation (e.g., capacitor banks or STATCOMs), the targeted integration of DG (such as photovoltaic systems with voltage support capability), or localized grid reinforcement could substantially improve voltage profiles and system resilience. Furthermore, the systemic impact of improving conditions at these nodes could extend to adjacent regions, providing broader network benefits. This analysis demonstrates that even modest DG deployments, if optimally located, can produce measurable improvements in voltage stability and reduce stress on overloaded lines. Additionally, these results have practical implications for grid planning in developing countries, where limited resources necessitate focused, data-driven interventions to improve operational performance and support future renewable energy integration.
Table 1 presents the distribution of power across the system and serves as a key reference for understanding the voltage drops observed at buses located far from the slack (or reference) bus in the base case scenario. While the overall system has adequate active and reactive power generation to satisfy demand, the spatial distribution of reactive power plays a crucial role in voltage regulation. Note that reactive power does not perform real work but is essential for maintaining the electric field that enables the transmission of active power. However, as reactive power is transported over long distances, it is subject to higher impedance and losses, which lead to voltage drops, particularly in weak or extended networks. This phenomenon explains the under-voltage conditions observed at remote buses, even in systems with sufficient overall generation capacity. Table 1 also shows losses in two-winding transformers, which have a value of 81.30 MVAR. This is a high percentage. Although transformers do not consume reactive power like traditional inductive loads, they introduce reactive losses due to their internal impedance and leakage reactance, also called short-circuit impedance [55]. The line losses are −17.21 MVAR, indicating a net injection of capacitive reactive power into the power system. In Pandapower, negative ql_mvar values indicate that certain elements, such as long lines with a capacitive effect, contribute to the grid and improve the voltage profile in nearby areas, despite not consuming reactive power. However, this is insufficient to improve the voltage profiles of the critical busbars in the case study.

4.2. Base Scenario: With Distributed Generation

To determine the appropriate buses for distributed generation injection, we begin with the analysis from the previous literature review. The author of [56] specifies that if some of the voltages of the loaded buses are lower than the lower limit, then the reactive power capacity of the transmission lines for the specified voltage limits cannot meet the reactive demand. Therefore, the voltages can be improved by installing VAR generators in some of the loaded busbars to inject positive VAR into any of the loaded busbars. For this simulated case study, Pandapower elements such as GEN and SGEN were used, which are described below. Furthermore, identifying low voltages was not the only criterion for selecting candidate buses. Four metrics were evaluated for each bus: (i) voltage sensitivity per MW injected (dV/MW), which quantifies the effectiveness of DG in correcting voltage profiles, where positive values indicate that DG is effective in raising voltage [57]; (ii) the loss sensitivity factor (LSF), which estimates the change in active losses of the system per MW injected, where negative values indicate a reduction in losses [57,58]; (iii) local thermal headroom, which is the margin available in elements adjacent to the bus, such as lines and transformers connected to the bus [59]; and (iv) hosting capacity, which is the maximum power that can be injected without violating voltage limits. For this case study, values ranged from 0.95 to 1.05 p.u., which could overload lines and transformers [59]. Finally, the metrics were normalized and aggregated using a weighted prioritization index. The Top-N was then selected for the injection scenarios (20–100%). This procedure allowed the location of the DG to be justified based on technical factors, such as voltage improvement, energy efficiency (loss reduction), and operational safety (thermal margins and network limits). Likewise, a slightly leading (capacitive) power factor (PF) was used to sustain voltage at low buses. Typically, inverters support volt-var control. Table 2 shows the results obtained when the criteria were applied to all busbars to determine which ones were optimal for receiving DG injection. The multi-criteria ranking shows that busbars 3117 and 3161 have the highest scores and are the most favorable for DG injections, as they combine positive voltage sensitivity, loss reduction (LSF < 0), and suitable accommodation capacity. Busbar 3063 has an intermediate score, primarily because of its minimal impact on the voltage profile despite its high thermal clearance. The score values for bars 3140 and 3027 are lower. However, they were included in the injection scenarios to contrast with the performance of DG in less favorable locations and analyze the practical effects on voltage and losses. Table 3 shows the bars selected based on sensitivity criteria, along with their respective active and reactive power loads and base voltage prior to DG injection.
After identifying the buses with low voltage profiles (i.e., those operating below 0.95 p.u.) as priority candidates for DG injection, a customized script was developed in Pandapower to automate and manage the integration of DG units at these critical nodes. The selection of the renewable technology assigned to each bus was based on data extracted from an Excel database that included the main components of the modeled network, namely, generators, transmission lines, transformers, and loads. PV technology was selected as the primary generation source, given the country’s favorable solar irradiance and widespread geographic suitability. To accurately simulate the impact of DG within the load flow analysis, two specific Pandapower elements were used to represent different types of generators with distinct operational characteristics.

4.2.1. GEM: Voltage-Regulating Generator

  • A voltage-regulating generator can regulate the voltage at the buses to which it is connected.
  • It controls its reactive power injection (Q) to maintain a target voltage value (p.u.).
  • It is used in load flow analysis as a controlled source of active and reactive power.
  • In real applications, this behavior corresponds to that of synchronous generators, such as those used in large-scale hydroelectric, thermal, or wind power plants, as well as advanced reactive compensation devices, such as STATCOMs (static synchronous compensators) and photovoltaic inverters with advanced voltage control functions.
In this case study, this element was addressed in bars with voltages lower than 0.92 p.u. This allowed the machine to adjust inductively (Q > 0) or capacitively (Q < 0) as necessary to maintain the voltage profile.

4.2.2. SGEM: Static Generator

A static generator is modeled as a generator that injects fixed active and reactive power as an independent power source without feedback. Under real operating conditions, it is like conventional PV inverters without voltage control, small wind systems, and connected batteries with fixed power control. The DG connected as an SGEN was modeled with a leading power factor of 0.98, resulting in negative (capacitive) reactive power, calculated as Q = −P tan(arcsin(0.98)). This fact reflected the volt-var support contribution of distributed inverters to the voltage profile. This element represents units with fixed active and reactive power injection, which is typical of PV systems without voltage control. It was used for buses with acceptable voltage (Vm ≥ 0.92 p.u.).
The DG impact injection into critical buses was evaluated across a range of scenarios, from 20% to 100% of local demand. This analysis aimed to understand voltage profile behavior and ensure that bus voltages remained within the safe operating range of 0.95 to 1.05 p.u. Similarly, when DG is injected, the net demand covered by conventional generators decreases. This requires an adjustment in their active power dispatch to prevent overgeneration. This process is called redispatch [60,61]. The redispatch process was modeled based on the classic formula as an incremental/decremental adjustment with respect to the base dispatch proposed in [61], with the following simplified expression:
P i n e w = P i b a s e α i P D G   ,
where P i n e w is the sum of power after injecting DG; P D G is the sum of active power added by DG (MW); P i b a s e is the active power that conventional unit i was generating before adding DG (its reference value); and α i is the participation factor ( > 0   y α 1 = 1 ) .
To compensate for the addition of DG, the number of conventional generators is decreased by an amount equal to ΔP_(DG), maintaining the power balance. Conventional generators can be dispatched in P within the limits of [ P i , m i n ,   P i , m a x ] , and the Q limits are respected based on the Pandapower function enforce_q_lims = True. Similarly, though redispatch reduces the power of conventional generators by the same amount as the added DG, the resulting flows modify the network losses. Slack compensates for these residual losses to satisfy the exact balance [62,63]:
P s l a c k = P l o s s   P l o s s =   P l o s s ,
where P s l a c k is the P losses compensated by slack; P l o s s is the P losses after DG injection; and P l o s s   is the P losses before DG injection.
The relationship between P_slack and P_loss is such that when P_loss decreases, P_slack decreases its injection. Conversely, when P_loss increases, P_slack increases its injection. As the modeled power system has several conventional generators, according to [64], each generator contributes in proportion to what it is already generating. Indeed, it is the typical policy of automatic generation control (AGC), whereby the generator carrying the most load cuts back the most (or increases the most). The factors α i are constructed from weights ω i 0 and normalized. To determine the contribution, the script was modeled based on the following criteria in sequential order:
  • Proportional to base dispatch (the main criterion): Those who generate more cut back more. This is the typical AGC distribution, modeled according to the following.
    Let ω i = P i b a s e .
    α i = P i b a s e j P j b a s e
  • Fallback proportional to maximum capacity: When distribution proportional to base dispatch is not applicable, a neutral criterion is adopted that uses the generators’ nominal capacity as a weighting factor. In these cases, the algorithm uses an alternative allocation scheme proportional to the maximum available power.
    Let ω i = P i m a x .
    α i = P i m a x j P j m a x
  • Equal shares: This is used to distribute the total adjustment equally among all eligible generators, regardless of their operating point or size. To do this, α i = 1 is used.
  • Space to reduce (downward redispatch): The “enforce_limits_and_redistribute” routine imposes limits and corrects any imbalance in the total by redistributing iteratively. If there is still “surplus” power, meaning more reduction is needed, it is distributed only among units with a reduction margin, using weights as shown,
    Let ω i = P i b a s e P i m i n .
    α i = P i b a s e P i m i n j ( P j b a s e P j m i n )
  • Upward headroom (upward redispatch): If there is a power shortage, it is necessary to increase generation. The following expression is then used when it is necessary to increase generation, and it is desired that those with more actual margin toward maximum power participate more.
    Let ω i = P i m a x P i b a s e .
    α i = P i m a x P i b a s e j P j m a x P j b a s e
Similarly, power flow tests were conducted without applying the redispatch scheme to establish a reference scenario. This would enable the results to be compared later with those from the redispatch case. This allowed us to objectively identify improvements in voltage profiles, losses, and line load capacity and evaluate the effectiveness of the implemented strategy. For each DG injection sweep scenario (20–100% of local demand), the sensitivity of the grid to moderate reactive support was evaluated by imposing a leading power factor of 0.98 on the three highest-power distributed generators in the scenario in order to represent a realistic and moderate condition of reactive support [18,19]. Operationally, this adjustment was implemented by calculating the target reactive capacity using the expression Q = −Ptan(arcs(0.98)), applying a setpoint of Q < 0 (capacitive injection) in the SGEN type units, while in the gen type units, the limits [ Q m a x ,   Q m i n ] were adjusted to allow for this margin, and the load flow was solved with active Q constraints. The choice of PF = 0.98 is not arbitrary but rather reflects a realistic operational compromise: remaining very close to unity, which ensures that most of the power supplied is active, but introducing a margin of capacitive injection enough to contribute to voltage stability. A strictly unitary PF (1.0) was not selected, as in that case, the injected reactive power would be zero, and the effect of this support would not be observed, nor were lower values such as 0.95 or 0.90 chosen, which could generate overcompensation that is not representative of normal grid operation. In this sense, the leading PF of 0.98 allows for a controlled and realistic sensitivity analysis, aligned with the operating ranges recommended by international grid codes (generally between 0.95 inductive and 0.95 capacitive), and facilitates comparison of the system’s performance against the condition with unitary PF. It should be noted that although conventional generators already inject reactive power within their limits, PF control in DG was introduced as an additional sensitivity scenario, with the purpose of analyzing how much distributed renewable generation can influence the voltage profile and losses when operating with a PF other than one, thus justifying the potential benefit of using DG as localized voltage support.
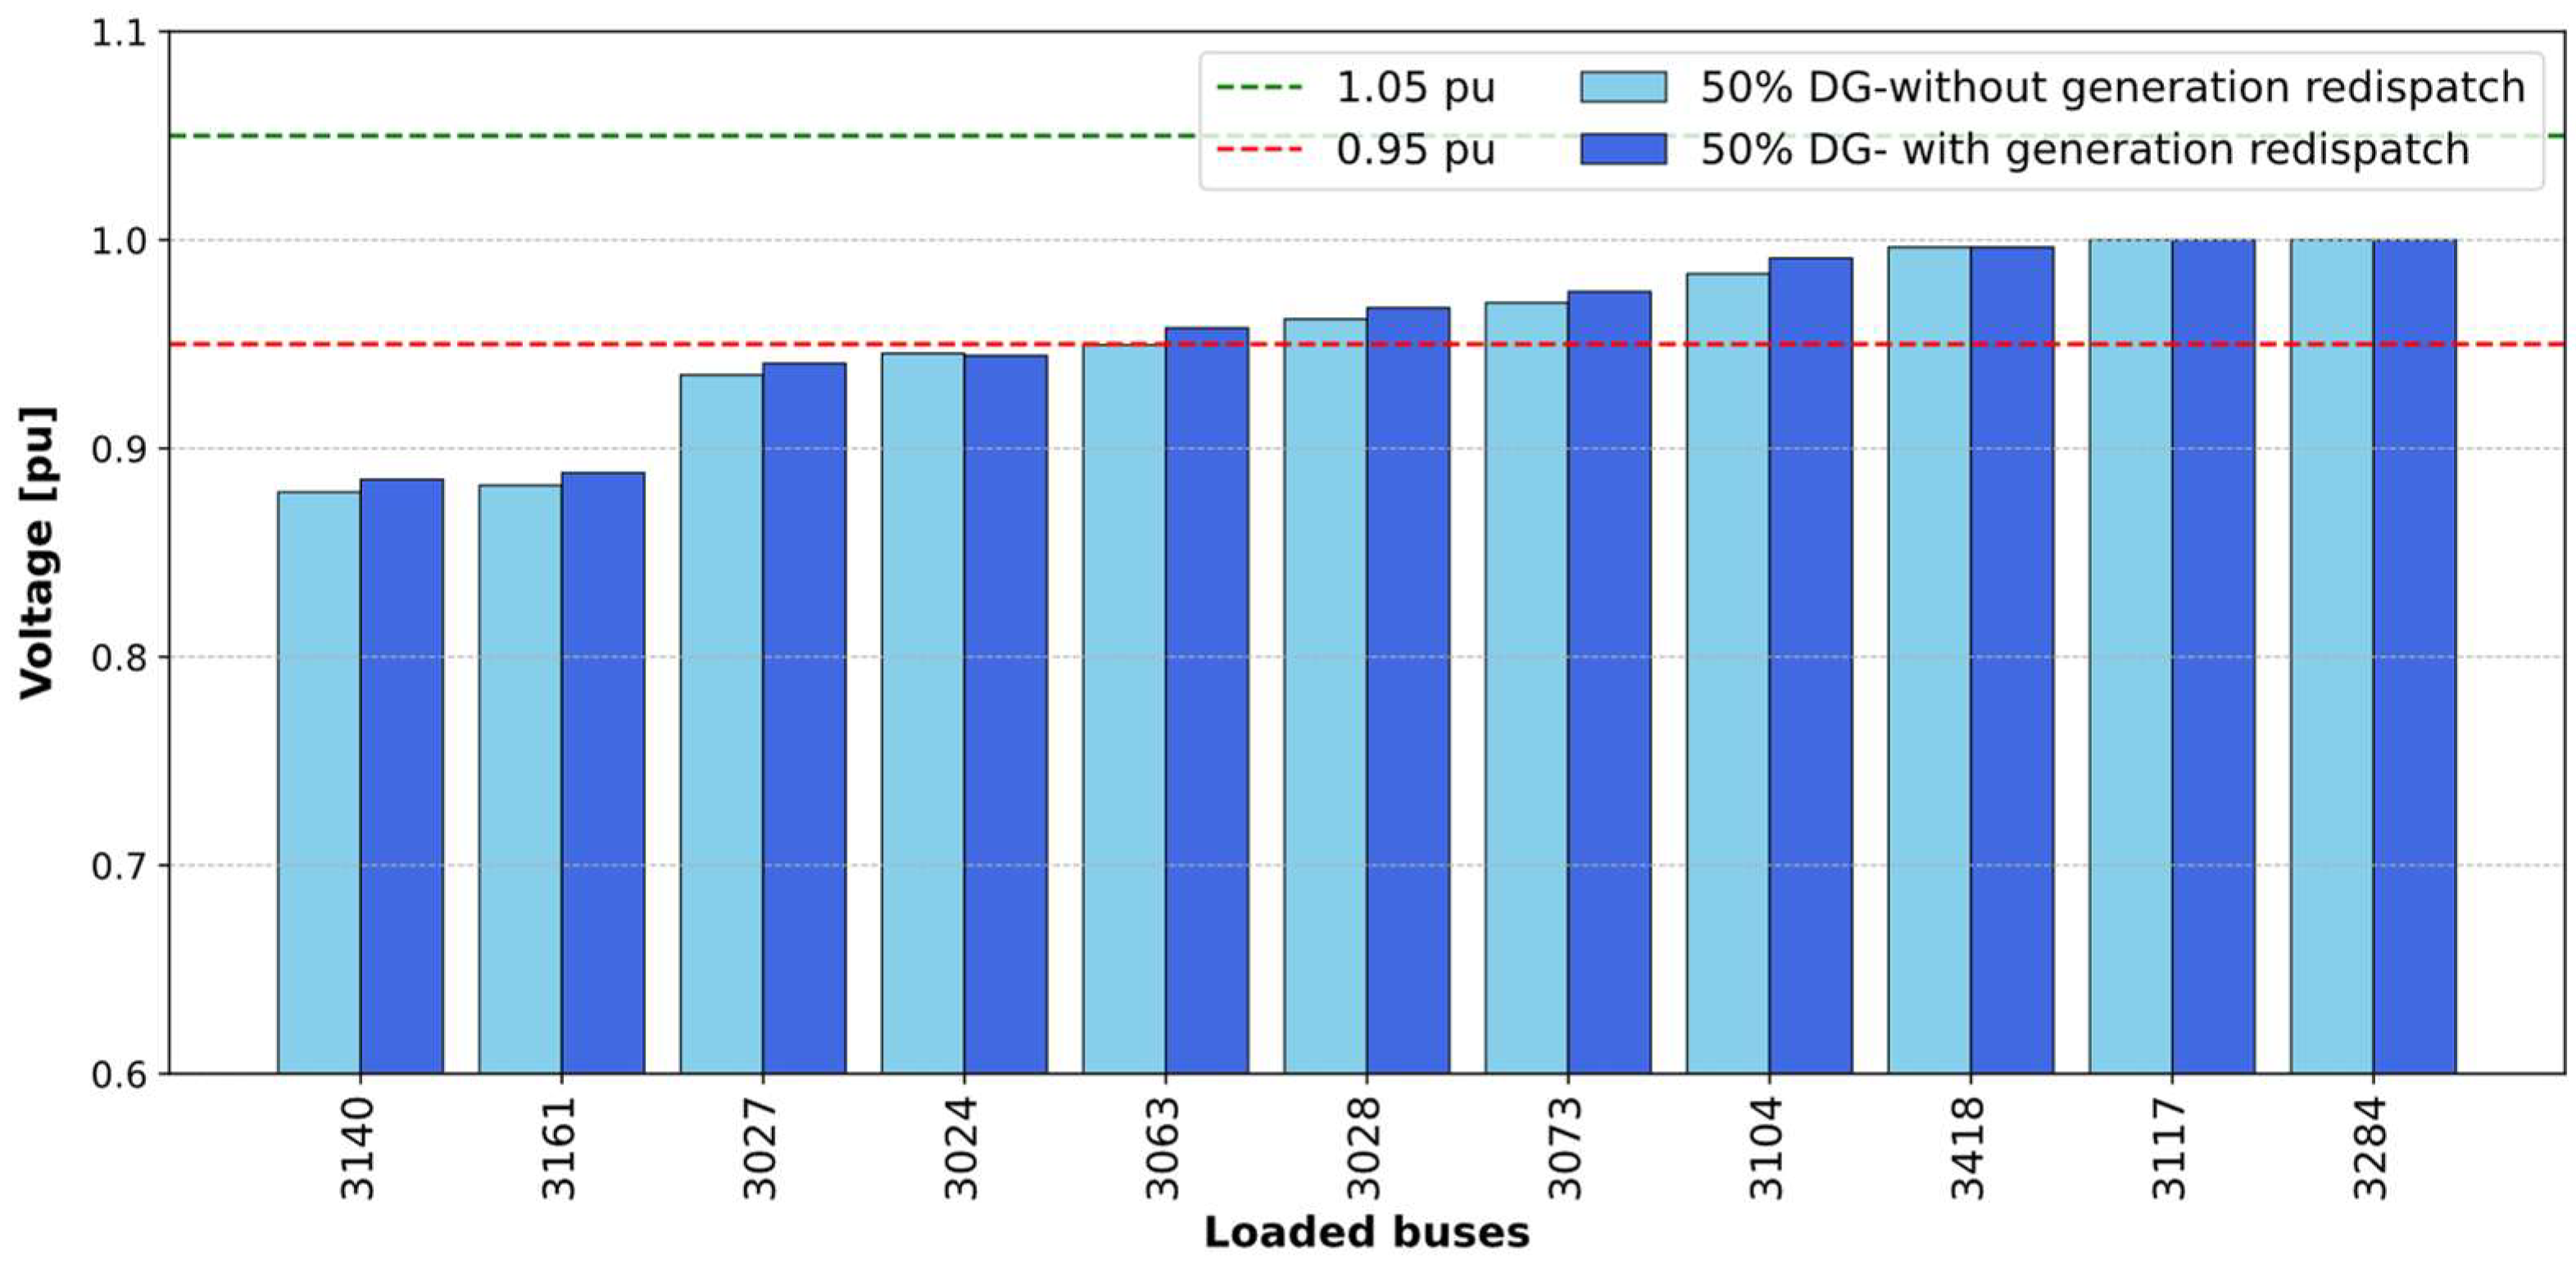
Based on the results of sensitivity, voltage, and loss analyses, an injection level equivalent to 50% of the local load on the candidate busbars was selected. This percentage was chosen because it is the point at which DG can improve voltage profiles and reduce losses without exceeding the defined operating limits (0.95–1.05 p.u.). This ensures consistency with the calculated hosting capacity values and prevents overloads in the network elements. Table 4 shows the results of the distributed generation injection sweep (20–100% of local demand), applying redispatch at each percentage. The purpose was to analyze voltage variations in critical buses as DG penetration increased. As can be seen, buses with lower voltages in the base case (0%) experienced progressive improvement as injection increased, approaching the recommended operating range (0.95–1.05 p.u.). Table 5 shows the new voltage values for the bars and the amount of generation injected. As shown, the SEG element was used for most of the low-voltage bars, while only one bar used the SGEM because its voltage was slightly higher. Figure 7 shows the voltage profiles of the critical buses (3161, 3140, 3117, 3063, and 3027) under various percentages of DG injections with redispatch. It shows the progressive recovery of voltages in the initially depressed buses (3161 and 3140), the rapid stabilization of bus 3117 around 1.0 p.u., and the marginal variations in buses 3063 and 3027. Figure 8 shows the voltage levels in loaded buses, but with DG injection with and without redispatch, where a significant improvement in voltage stability can be observed, thanks to the localized action of these generators.

4.3. Comparison of Scenarios

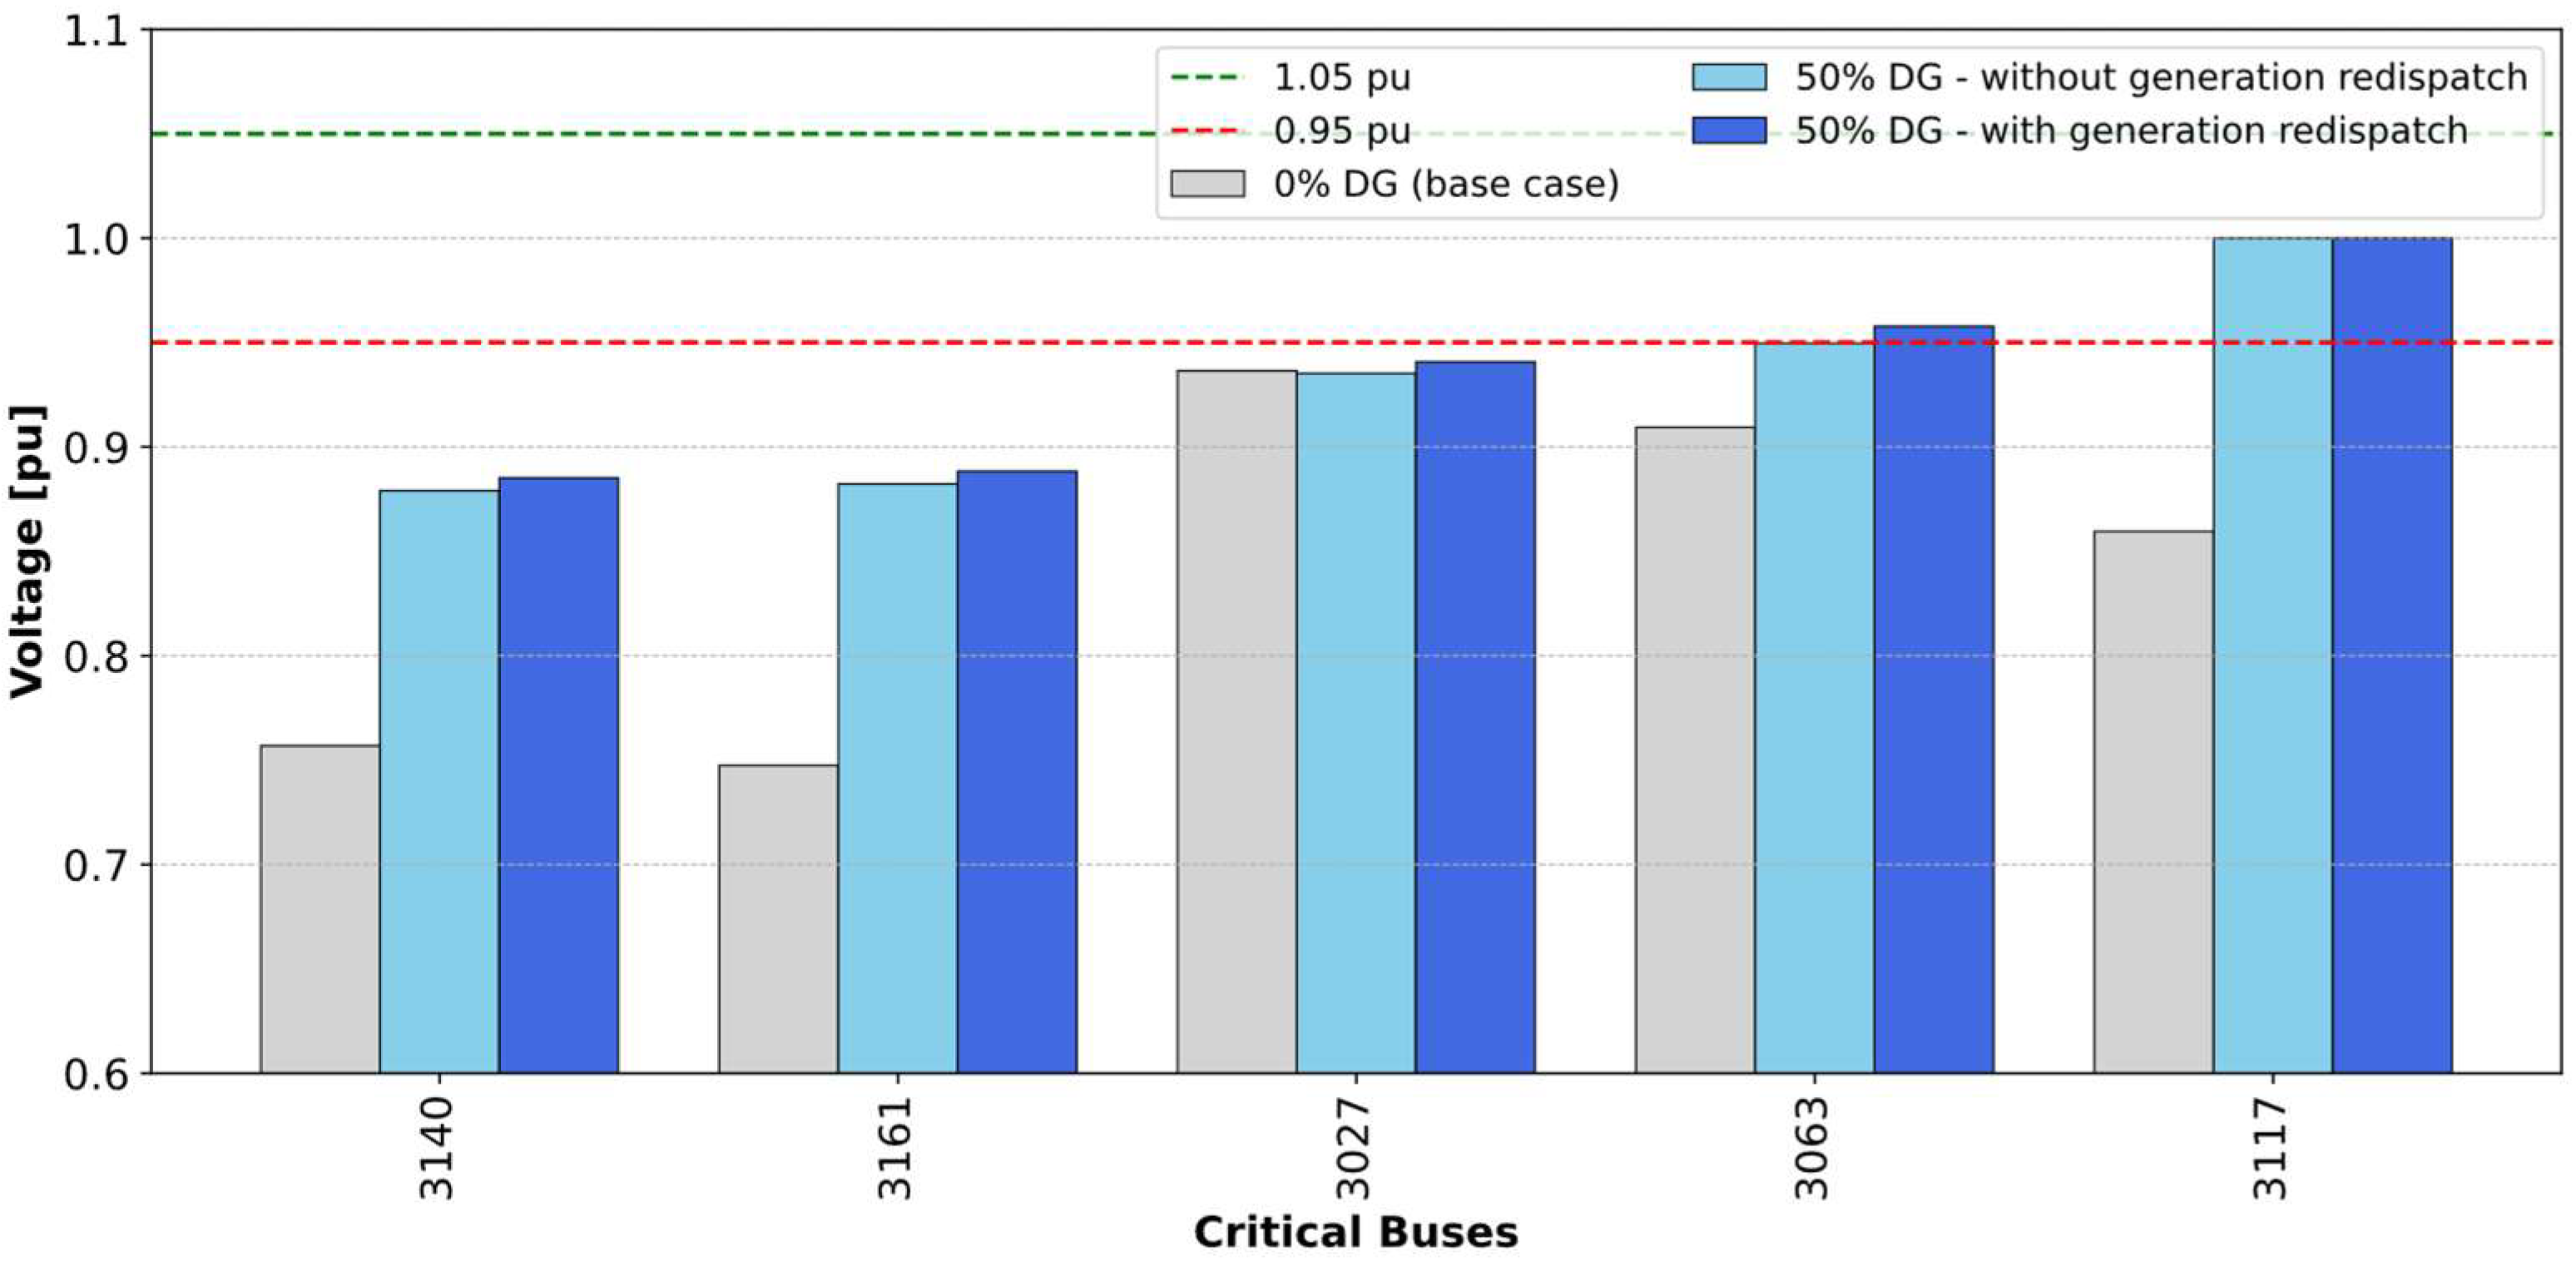
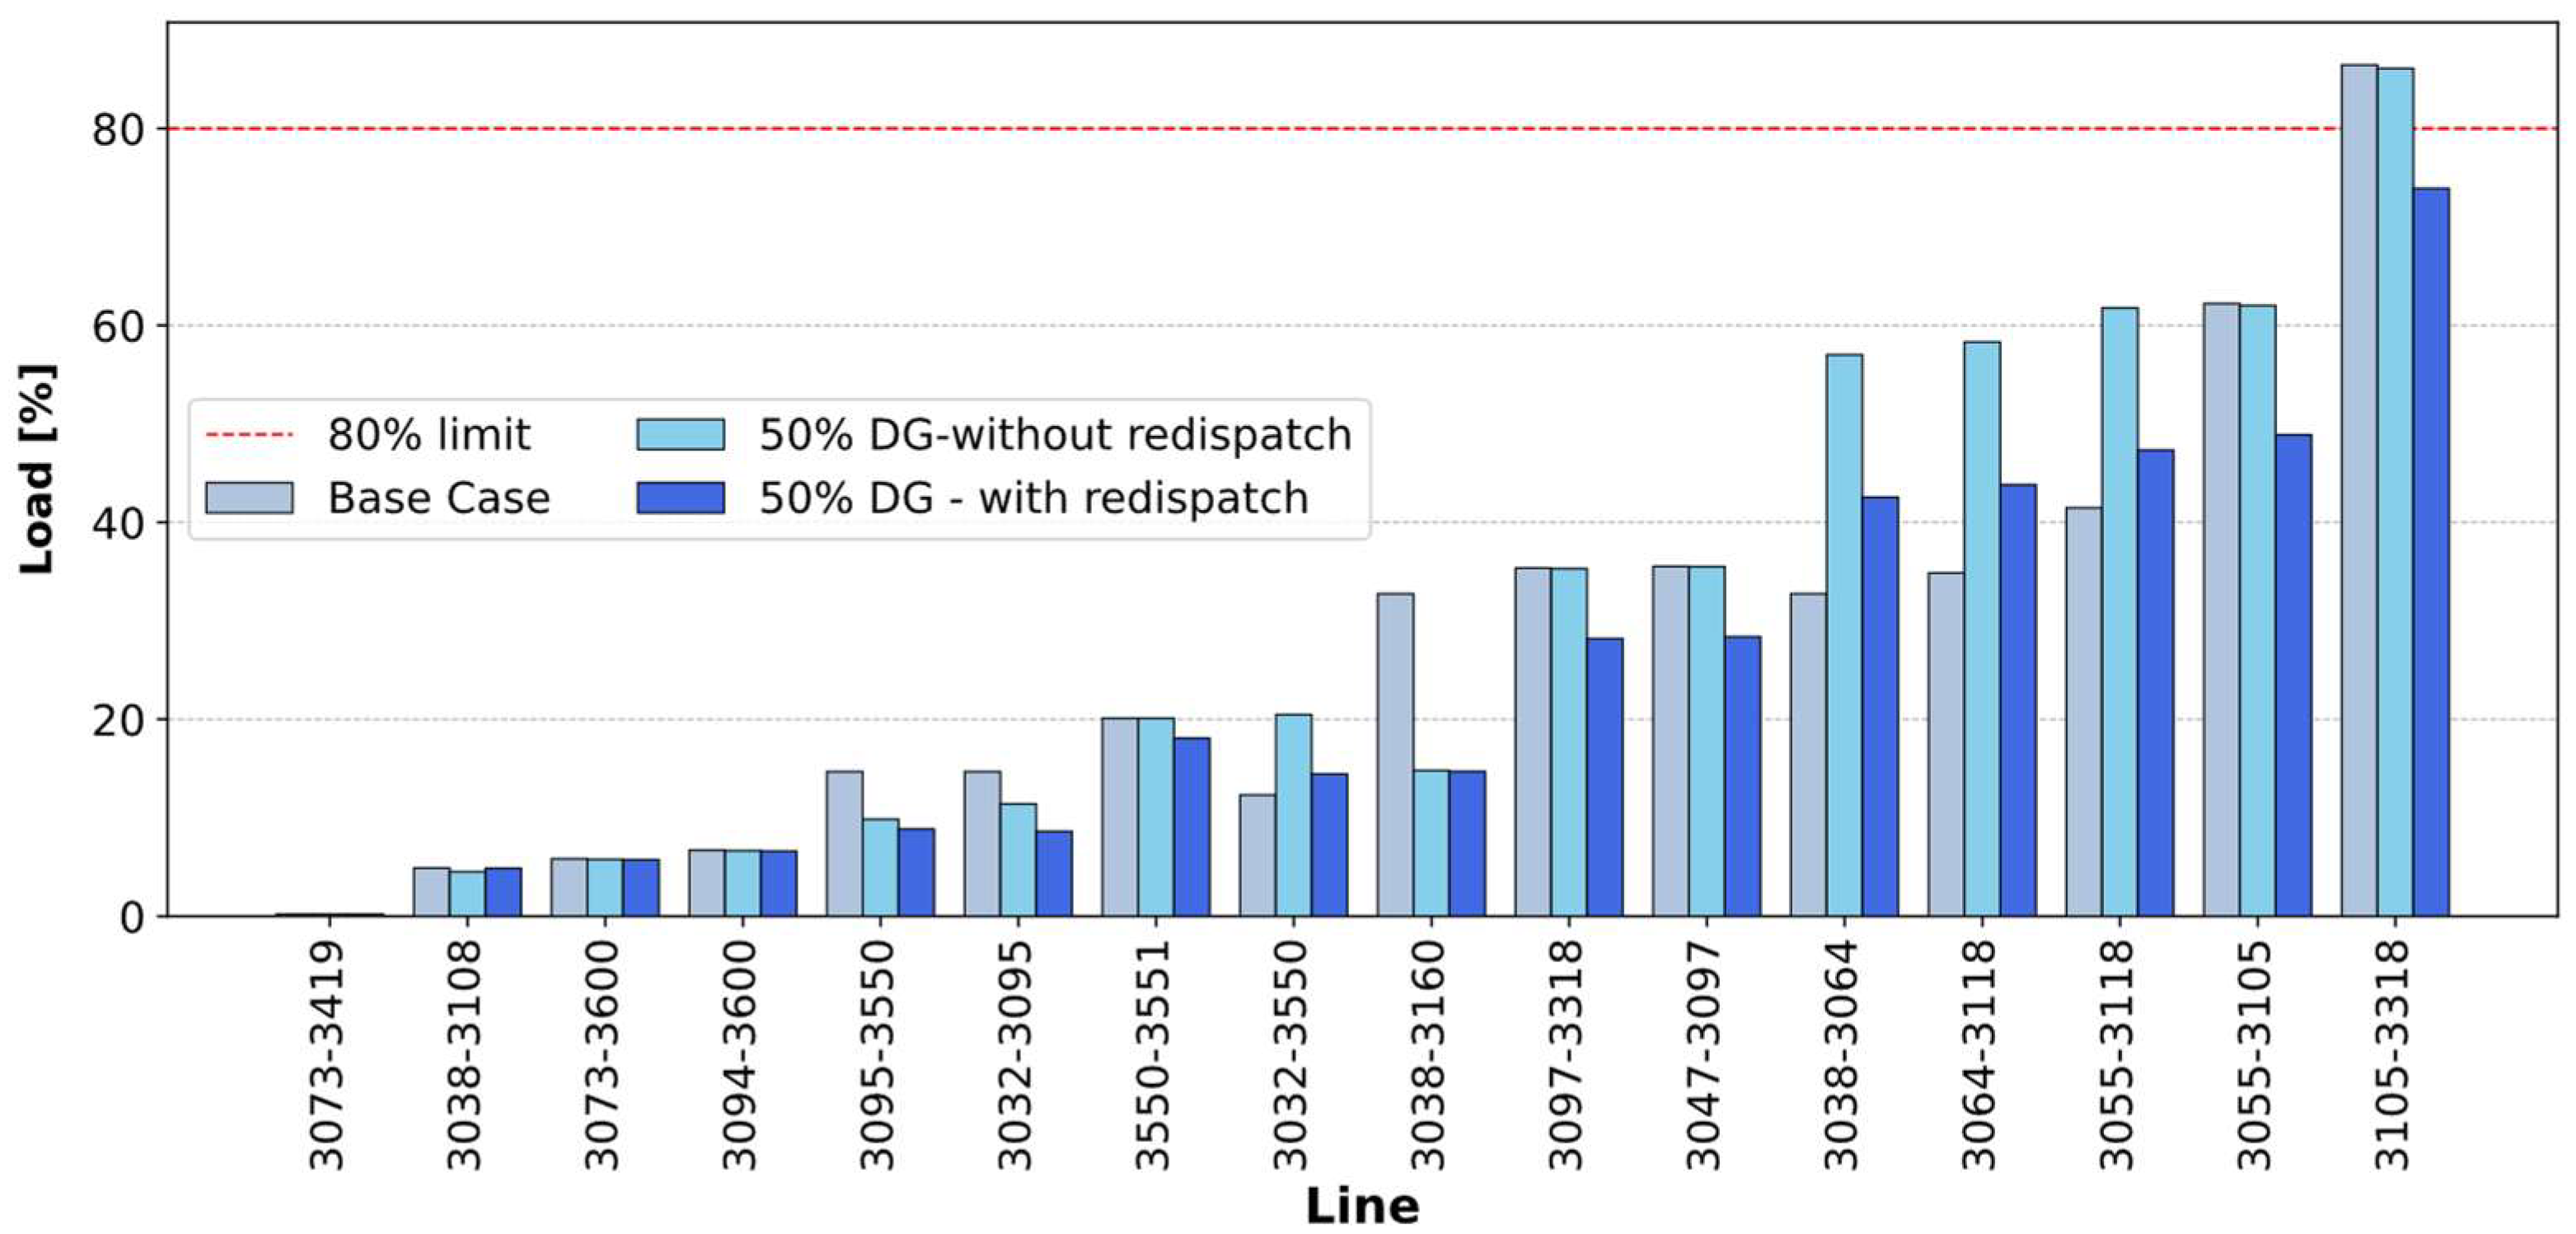
Figure 9 shows a comparison of the voltage levels before and after the injection of DG in the selected buses with critical voltage profiles. A significant improvement in voltage is observed in all cases, most notably in buses such as 3161 and 3140, which were initially below the lower limit of 0.90 p.u. Localized DG injection caused these buses to enter the most acceptable operating range, with bus 3117 practically reaching the nominal voltage. Figure 10 shows the load level on transmission lines after distributed generation was integrated. As can be seen, there were significant variations. On some lines, the load increased due to the additional flow generated by localized injection. On others, the load significantly decreased. This redistribution of power reflects DG’s impact on grid operation. As previously mentioned, the line connecting busbars 3105 and 3318 was overloaded due to the generation connected to busbar 3319. However, strategically injecting DG and applying redispatch reduced the flow through this line, allowing us to operate within an appropriate limit.

4.4. Result and Analysis

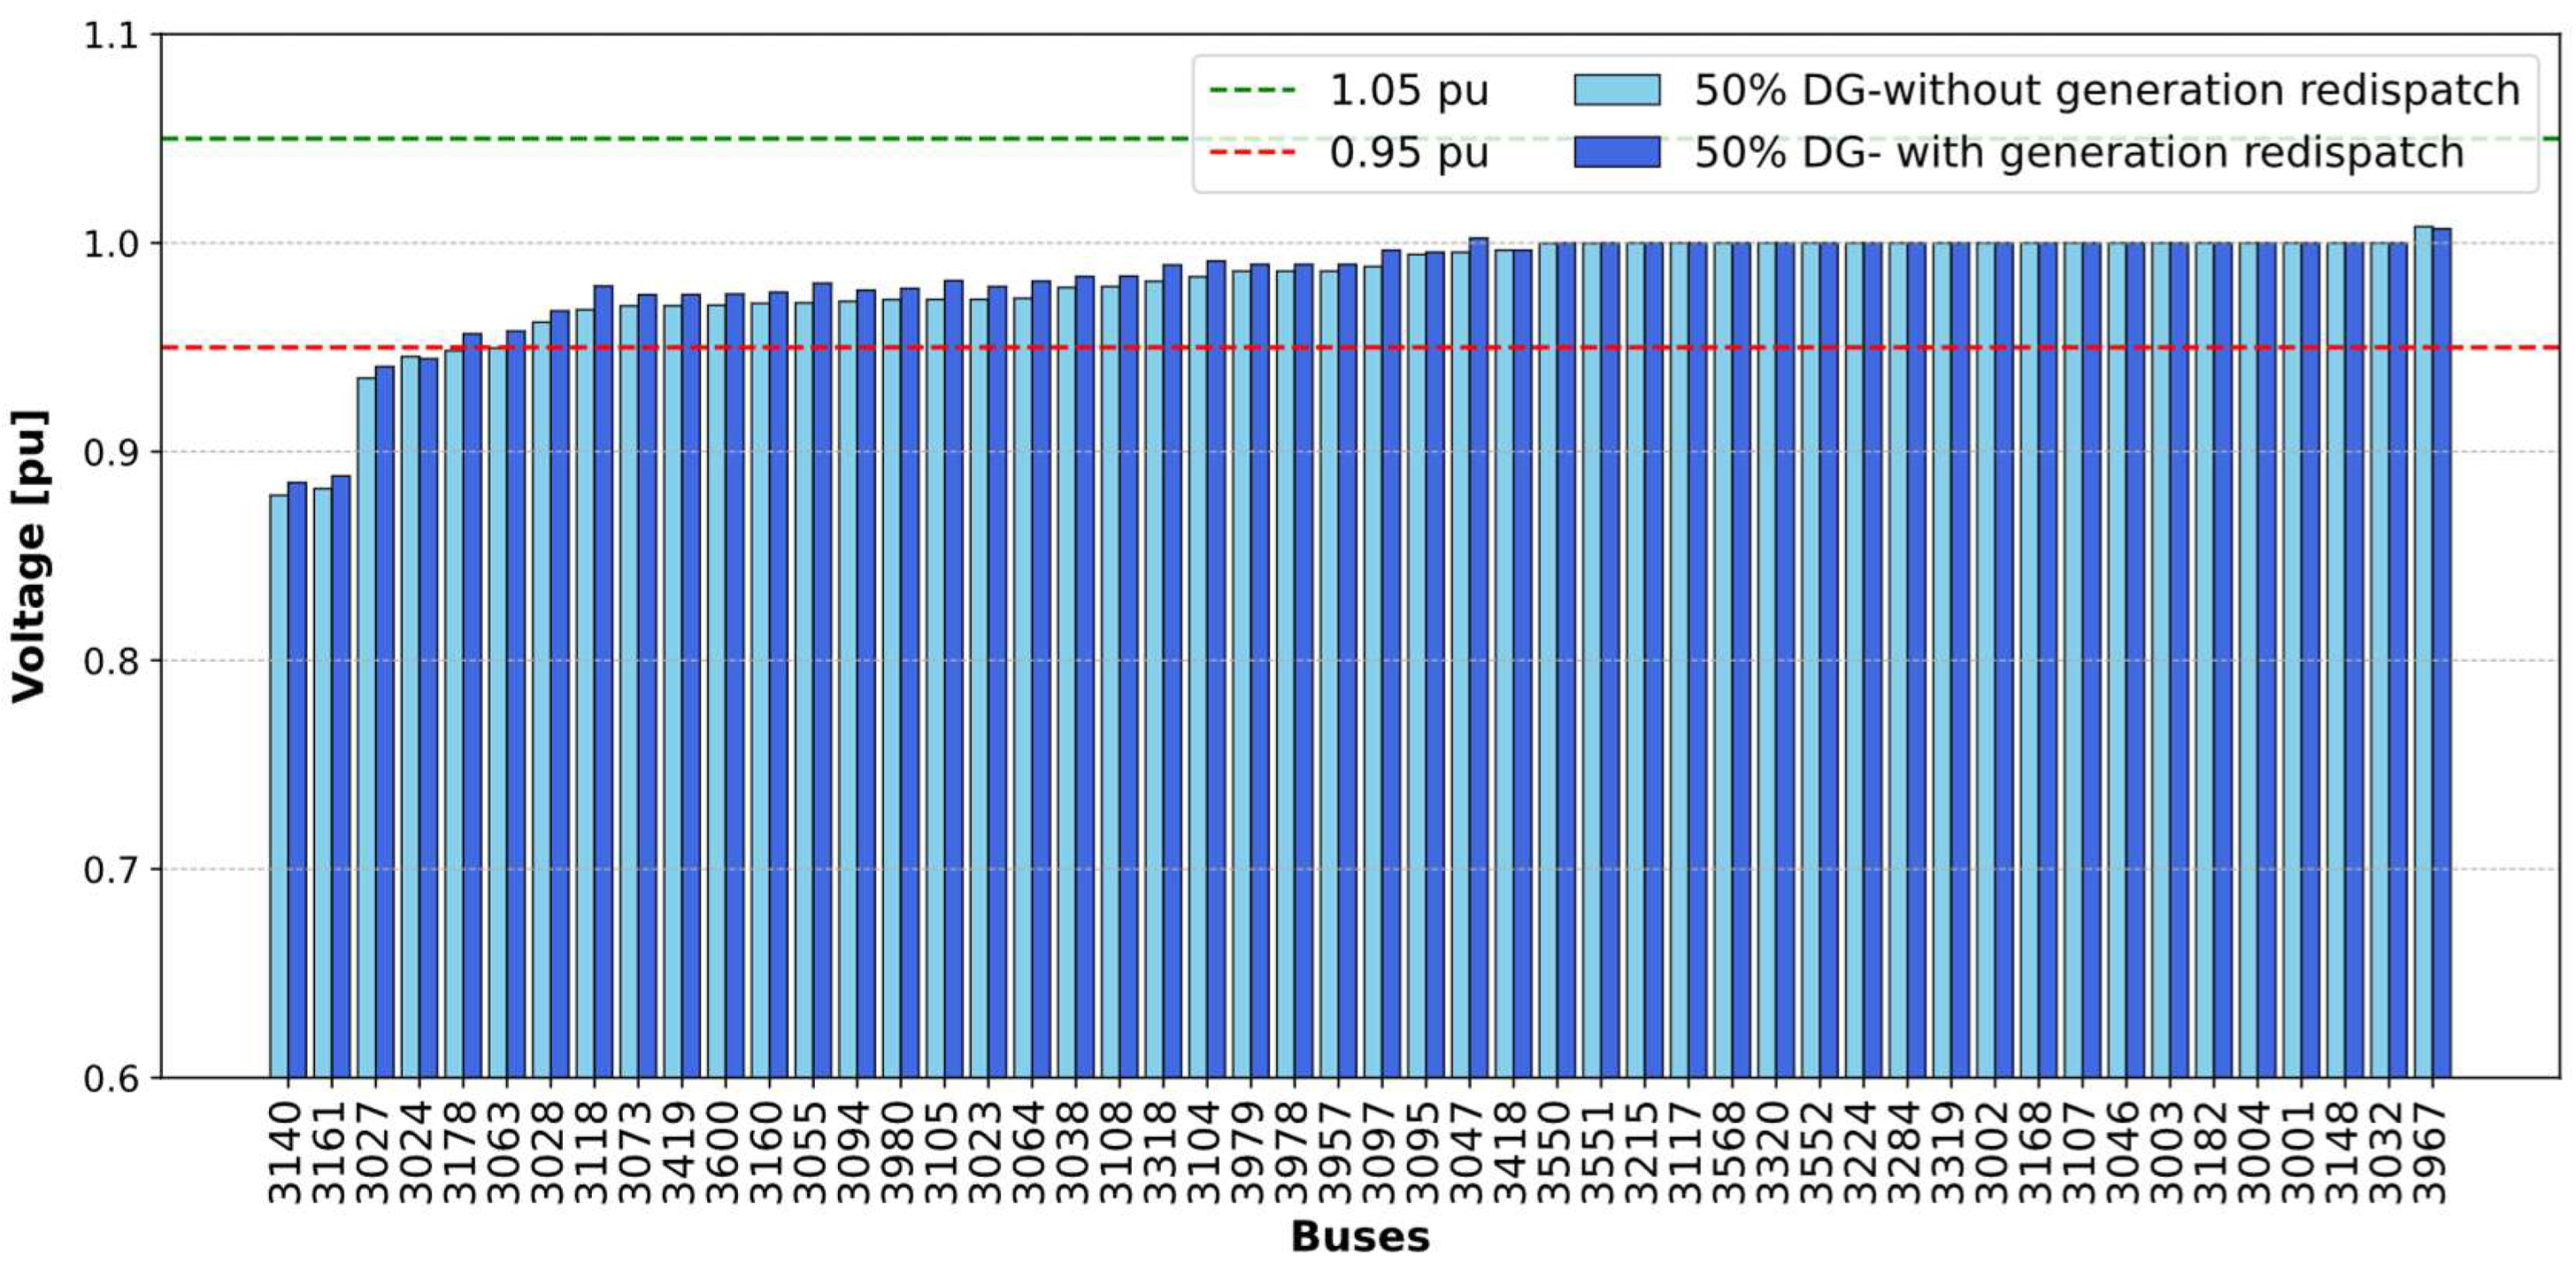
Figure 11 shows all the voltage profiles. Table 6 summarizes such busbars that showed indirect improvements, including those that received localized DG injections. As can be seen, and in addition to correcting voltage levels in critical busbars, DG indirectly improved other busbars in the system through the redistribution of power flows and the reactive support provided by connected units. While these improvements were smaller in magnitude, they demonstrated the positive impact that DG can have beyond the points of direct injection, extending its influence to neighboring areas of the grid. This behavior aligns with findings reported in specialized literature and reinforces the potential of DG as an effective voltage support resource in predominantly radial grids with limited meshing capacity. DG not only mitigates voltage drops in remote lines and enhances supply quality at critical nodes, but, when integrated with conventional generation redispatch, also plays a pivotal role in achieving more stable voltage profiles, reducing both active and reactive power losses, and maintaining power flows within secure operating limits.
In this context, distributed generation is the optimal strategy for strengthening the local voltage profile, reducing the need for power to flow from remote areas, and, consequently, improving the system’s operational efficiency under stability constraints. Furthermore, decentralizing generation helps to relieve the load on main lines and reduce dependence on oversized transmission infrastructure, promoting the rational use of grid assets. These findings confirm that the planned integration of DG, in conjunction with redispatch mechanisms, corrects localized problems and strengthens the electrical system’s overall resilience to load variations and renewable energy penetration.
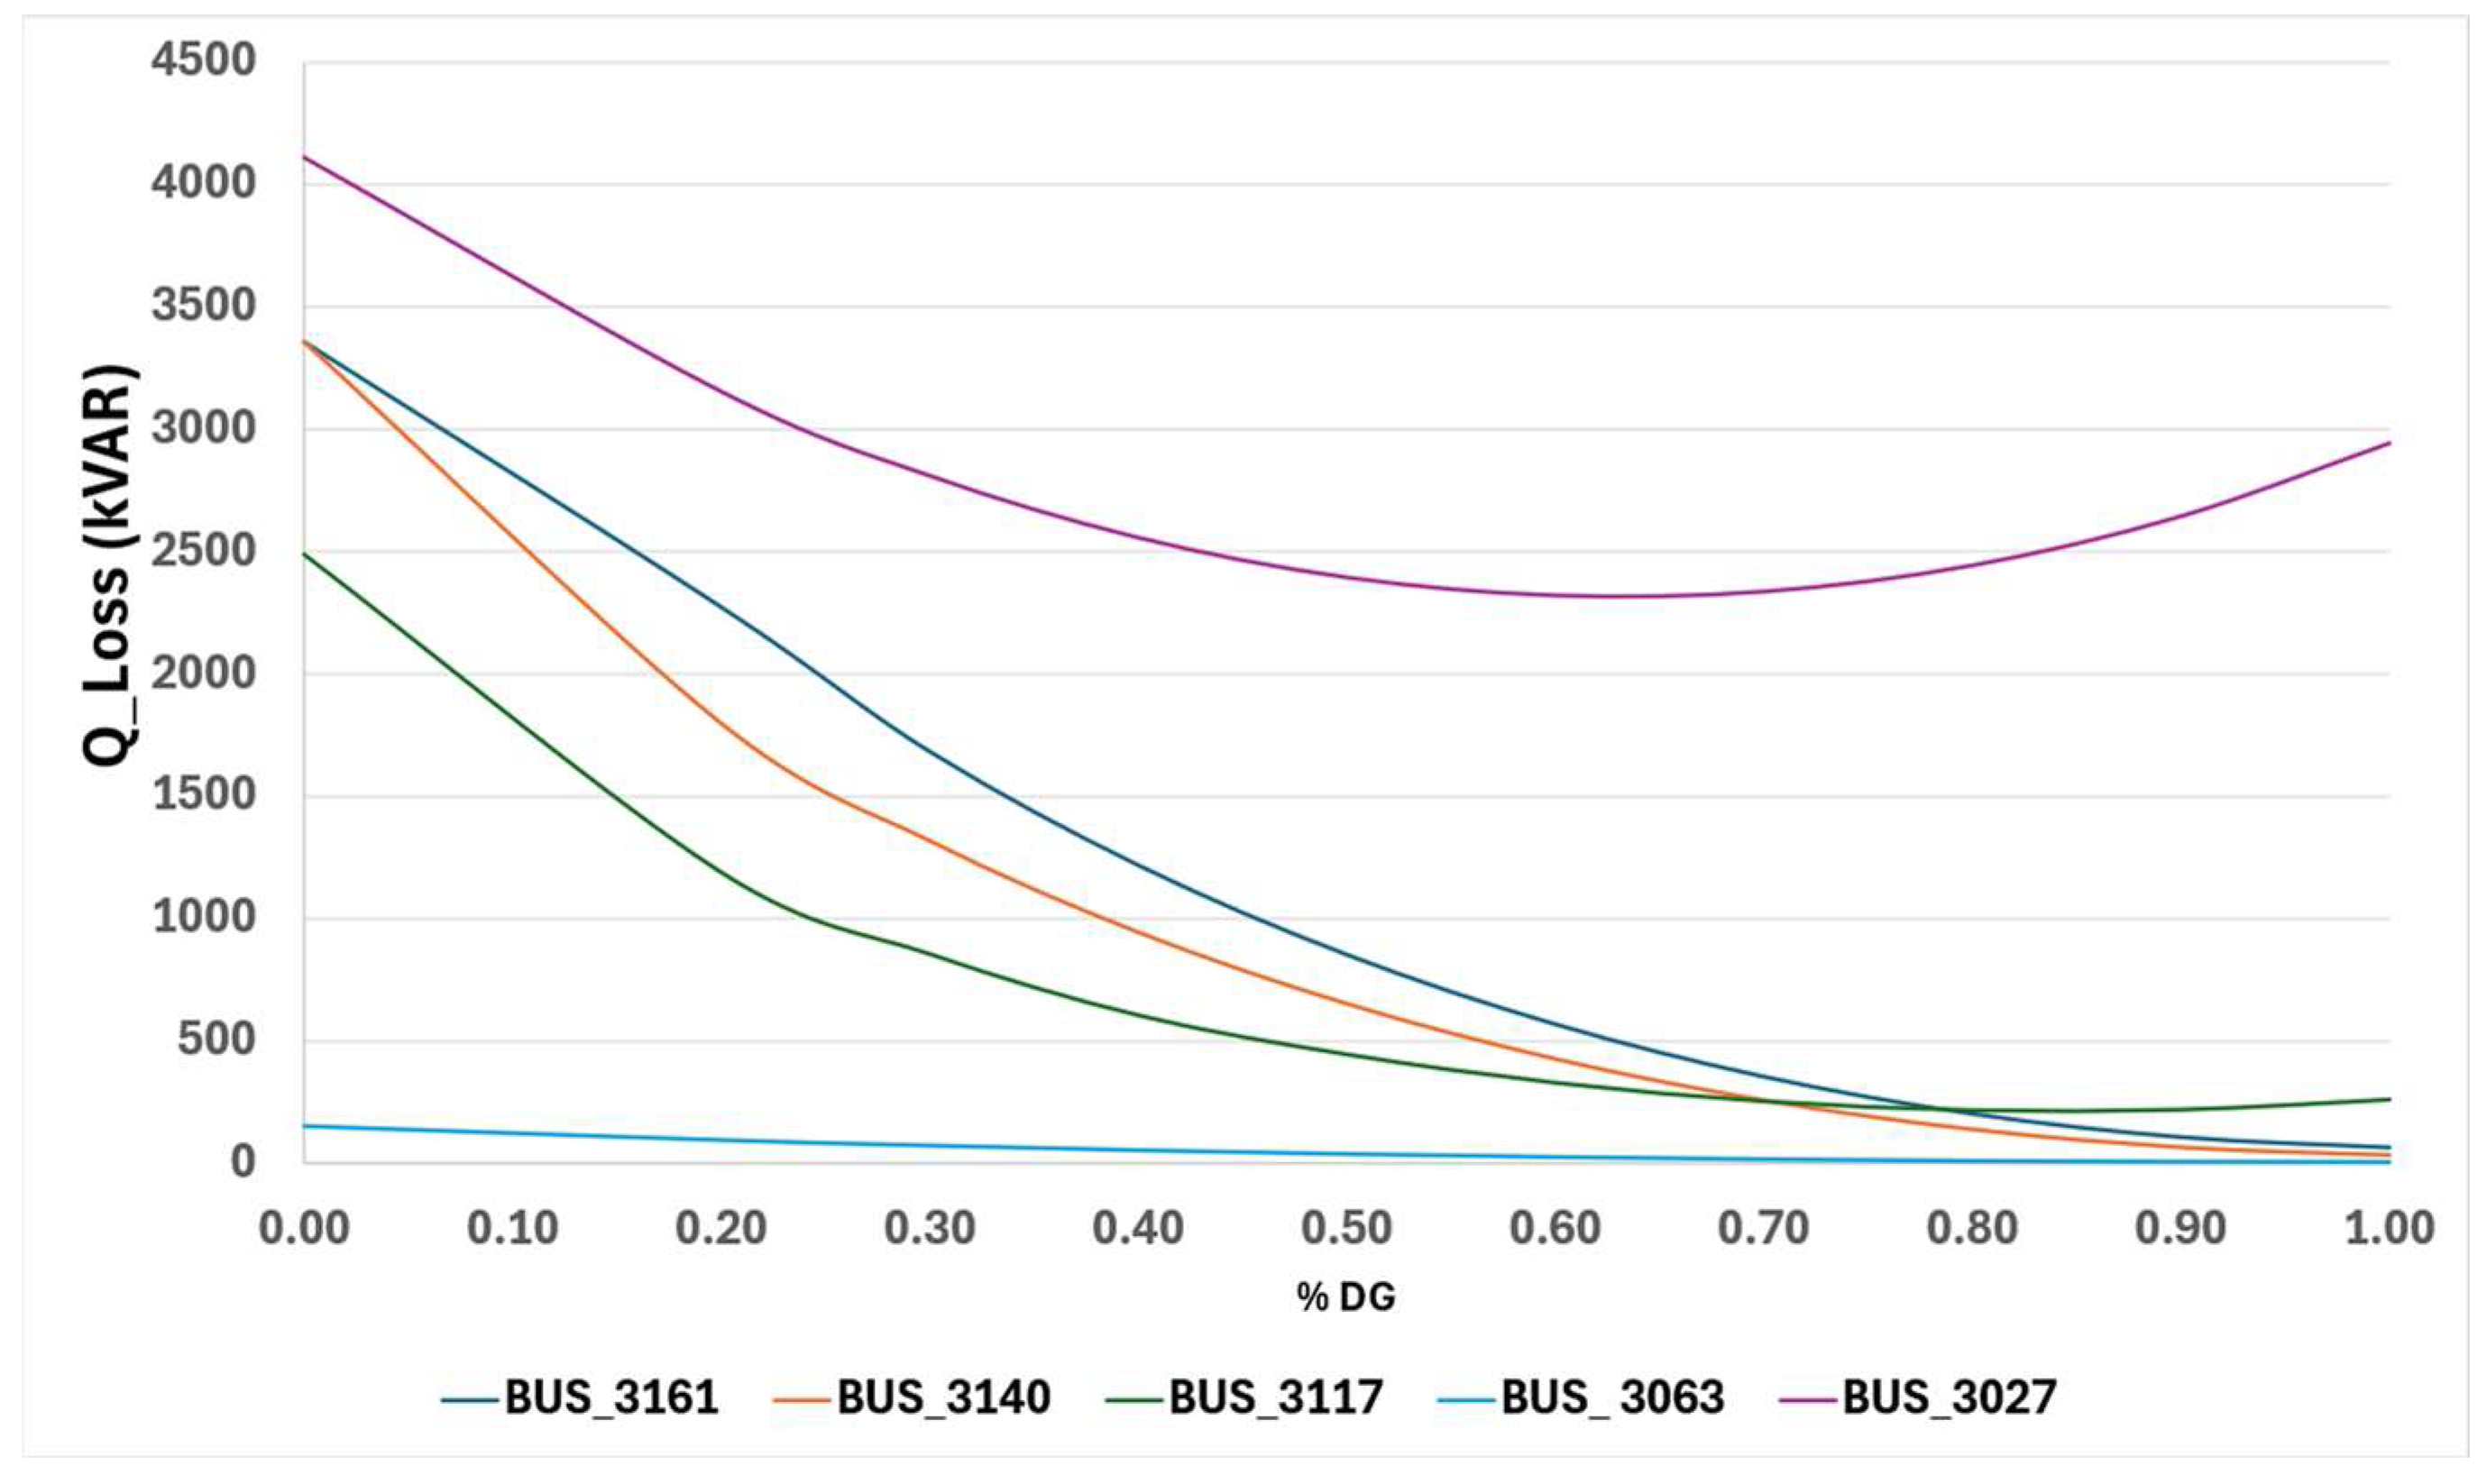
Figure 12a,b illustrate the active losses in the critical buses selected for DG injection at various penetration levels. As discussed in the literature [65], the variation in losses with respect to DG follows a quadratic curve. There is an initial phase of significant reduction, followed by a minimum point (PL_(min)). Beyond this point, an additional increase in DG causes an increase in losses. Buses 3161 and 3140 exhibited an almost monotonic decrease in active losses to values close to zero at 100% DG penetration, providing an efficient use of local generation. Buses 3117 and 3063 initially had higher losses, which decreased rapidly with DG penetration, reaching nearly zero levels at 60%. However, bus 3027 exhibited a distinct behavior: losses decreased to a minimum at approximately 50–60% loading but rose again as loading approached 100%. This observation is consistent with previous studies reporting that excessive local DG injection can induce reverse power flows and lead to increased losses. The same trend can be observed for reactive losses in Figure 13, a marked decrease in the most critical buses (3161, 3140, and 3117). Losses in bus 3027 showed an intermediate optimum point, followed by an increase at high penetration levels. These results reinforce the conclusion that an optimal penetration level of 50–60% achieves maximum loss reduction, validating the assertion in [65] that DG must be carefully sized to avoid counterproductive effects on the grid.
Table 7 shows the total system losses under the base scenario and with the injection of 50% DG with redispatch applied. Active losses in lines increase slightly from −17.21 MVAr to −18.10 MVAr, addressing an increase in the transmission network’s net capacitive contribution. This effect favors voltage support in conditions of high DG penetration. Concurrently, losses in transformers and the total system decreased, reflecting the fact that local generation reduces power flows through the most heavily loaded elements. These results align with the specific literature. In fact, Salimon et al. [65] concluded that DG penetration has an optimal operating point (PL_(min)), where overall losses are minimized. In this case, 50% DG injection was identified as the most appropriate level. It significantly reduces active losses and positively affects the voltage profile without exceeding the grid technical limits.

4.5. Limitation of Model for Future Studies

The developed model has certain limitations that are discussed as follows. Indeed, the simulation was based on a static representation of the power system, under steady-state load conditions and without considering any dynamic phenomena, such as rapid voltage fluctuations or potential variability and oscillations in renewable generation. Furthermore, while the data originate from official sources intended for academic use, discrepancies or outdated information may affect the analysis’s accuracy. Regarding the feasibility of future improvements, note that the proposed dynamic studies and probabilistic simulations require more information and robust computational resources. This objective represents a challenge in Honduras, where detailed, up-to-date data are certainly limited. Similarly, overcoming economic and technical constraints inherent to a predominantly radial power system with low redundancy is necessary for the practical implementation of advanced mechanisms such as voltage/VAR control or large-scale storage integration.
For future improvement, it is proposed that dynamic stability studies be incorporated in the event of transients, as well as probabilistic simulations that consider the variability of renewable generation and demand. Additionally, it would be advisable to apply the optimization algorithms studied in the literature review to the location and sizing of DG, considering electrical, economic, and geographical factors. Integrating storage systems and advanced control mechanisms (e.g., VVC—Volt/VAR control) could further positively impact the national electricity system.

5. Conclusions

The main objective of this case study was to verify the benefits of localized, distributed generation for improving voltage stability in the Honduran electrical system. Through network modeling and load flow simulation under critical conditions, busbars with voltage levels below 0.95 p.u. and significant loads were identified. Applying multi-criteria analysis and conventional generation redispatch together allowed us to select the appropriate candidate buses for distributed generation (DG) injection. The regulated incorporation of distributed generation, mainly based on photovoltaic technology, substantially improved local voltage profiles and indirectly improved those of the interconnected buses. Additionally, a 9% reduction in active losses and a 44% reduction in reactive losses were observed across the entire system. These results confirm that strategically integrating distributed generation improves both the quality of supply and the operational efficiency of the grid.
Beyond Honduras, this methodology, which is based on open-source tools and multi-criteria analysis, can be replicated in other Central American electrical systems with similar characteristics, such as weak, predominantly radial networks. Depending on the data availability, network topology, and operational practices in each country, its application may require adaptations, but the general framework is transferable. The findings are valuable for decision-makers because they provide technical evidence that can support policies for integrating renewables, guide investment planning in areas with low resilience, and prioritize infrastructure reinforcements that maximize technical benefits while minimizing costs. Thus, this study contributes to both the academic field and the regional energy transition agenda by offering a solid framework for transitioning to more sustainable and resilient networks.

Author Contributions

Conceptualization, A.M.-G., J.M.-T. and J.I.R.-G.; methodology, A.M.-G., J.M.-T. and J.I.R.-G.; software, J.I.R.-G. validation, J.M.-T. and J.I.R.-G.; formal analysis, A.M.-G., J.M.-T. and J.I.R.-G.; investigation, A.M.-G., J.M.-T. and J.I.R.-G.; resources, A.M.-G.; data curation, J.I.R.-G.; writing—original draft preparation, J.I.R.-G. and J.M.-T.; writing—review and editing, A.M.-G., J.M.-T. and J.I.R.-G.; visualization, J.I.R.-G. and J.M.-T.; supervision, J.M.-T. and A.M.-G.; project administration, A.M.-G.; funding acquisition, A.M.-G. All authors have read and agreed to the published version of the manuscript.

Funding

This research received no external funding.

Acknowledgments

The authors would like to express their gratitude to the Red Iberoamericana de Investigación en Energía y Sostenibilidad Energética (RIBIERSE) for their institutional support during the development of this research. Special thanks are also extended to the Centro Nacional de Despacho (CND) of Honduras for providing access to technical data and network information, which were essential for the case study and simulations conducted in this work.

Conflicts of Interest

The authors declare no conflict of interest.

References

  1. RENRenewables Global Status Report. Available online: https://www.ren21.net/reports/global-status-report/ (accessed on 27 June 2025).
  2. Viaintermedia.com. IRENA Reports Record-Breaking Annual Growth in Renewable Power Capacity, Renewable Energy Magazine, at the Heart of Clean Energy Journalism. Available online: https://www.renewableenergymagazine.com/panorama/irena-reports-recordbreaking-annual-growth-in-renewable-20250328 (accessed on 27 June 2025).
  3. Hassan, Q.; Algburi, S.; Sameen, A.Z.; Al-Musawi, T.J.; Al-Jiboory, A.K.; Salman, H.M.; Ali, B.M.; Jaszczur, M. A comprehensive review of international renewable energy growth. Energy Built Environ. 2024. [Google Scholar] [CrossRef]
  4. Global overview—Renewables 2024—Analysis, IEA. Available online: https://www.iea.org/reports/renewables-2024/global-overview (accessed on 27 June 2025).
  5. Tabora, J.M.; Júnior, U.C.P.; Rodrigues, C.E.M.; Bezerra, U.H.; Tostes, M.E.d.L.; de Albuquerque, B.S.; de Matos, E.O.; Nascimento, A.A.D. Hybrid System Assessment in On-Grid and Off-Grid Conditions: A Technical and Economical Approach. Energies 2021, 14, 5284. [Google Scholar] [CrossRef]
  6. Renewables—Energy System, IEA. Available online: https://www.iea.org/energy-system/renewables (accessed on 27 June 2025).
  7. Renewables Readiness Assessment: Honduras. Available online: https://sen.hn/wp-content/uploads/2024/09/IRENA_RRA_Honduras_2023_ES.pdf (accessed on 27 June 2025).
  8. Honduras Presentation—Accelerating Renewables in the Regional Market—23 May. IRENA. Available online: https://www.irena.org/-/media/Files/IRENA/Agency/Presentations/Regional-focus/2018/May/CD-MER-presentation---Accelerating-renewables-in-the-regional-market---23-May.pdf (accessed on 27 June 2025).
  9. Honduras Wind Electricity Capacity—Data, Chart. TheGlobalEconomy.com. Available online: https://www.theglobaleconomy.com/Honduras/wind_electricity_capacity/ (accessed on 27 June 2025).
  10. «SIE». Available online: https://siehonduras.olade.org/default.aspx (accessed on 4 September 2025).
  11. Reza, M.; Slootweg, J.; Schavernaker, P.; van der Sluis, L. Investigating impacts of distributed generation on transmission system stability. In Proceedings of the 2003 IEEE Bologna Power Tech. Conference Proceedings, Bologna, Italy, 23–26 June 2003; pp. 389–395. [Google Scholar] [CrossRef]
  12. Ahmadi, B.; Ceylan, O.; Ozdemir, A. Optimal allocation of multi-type distributed generators for minimization of power losses in distribution systems. In Proceedings of the 2019 20th International Conference on Intelligent System Application to Power Systems (ISAP), New Delhi, India, 10–14 December 2019; pp. 1–6. [Google Scholar] [CrossRef]
  13. Iweh, C.D.; Gyamfi, S.; Tanyi, E.; Effah-Donyina, E. Distributed Generation and Renewable Energy Integration into the Grid: Prerequisites, Push Factors, Practical Options, Issues and Merits. Energies 2021, 14, 5375. [Google Scholar] [CrossRef]
  14. Ahmed, K.; Hussain, I.; Seyedmahmoudian, M.; Stojcevski, A.; Mekhilef, S. Voltage Stability and Power Sharing Control of Distributed Generation Units in DC Microgrids. Energies 2023, 16, 7038. [Google Scholar] [CrossRef]
  15. Madjovski, D.; Dumancic, I.; Tranchita, C. Dynamic Modeling of Distribution Power Systems with Renewable Generation for Stability Analysis. Energies 2024, 17, 5178. [Google Scholar] [CrossRef]
  16. Kabir, S.; Krause, O.; Bansal, R.; Ravishanker, J. Dynamic voltage stability analysis of sub-transmission networks with large-scale photovoltaic systems. In Proceedings of the 2014 IEEE PES General Meeting | Conference & Exposition, National Harbor, MD, USA, 27–31 July 2014; pp. 1–5. [Google Scholar] [CrossRef]
  17. Furukakoi, M.; Senjyu, T.; Funabashi, T. Voltage stability improvement of power system using a shunt capacitor. Renew. Energy Power Qual. J. 2016, 339–344. [Google Scholar] [CrossRef]
  18. Lammert, G.; Premm, D.; Ospina, L.D.P.; Boemer, J.C.; Braun, M.; van Cutsem, T. Control of Photovoltaic Systems for En-hanced Short-Term Voltage Stability and Recovery. IEEE Trans. Energy Convers. 2019, 34, 243–254. [Google Scholar] [CrossRef]
  19. Fang, J.; Li, X.; Li, H.; Tang, Y. Stability Improvement for Three-Phase Grid-Connected Converters Through Impedance Reshaping in Quadrature-Axis. IEEE Trans. Power Electron. 2017, 33, 8365–8375. [Google Scholar] [CrossRef]
  20. Nazifa, S.; Islam, R.; Kabir, A.; Hasan, M. Analysis of the Impact of PV Penetration in Distribution Network: A Case Study in IEEE 14 Bus System. In Proceedings of the 2021 International Conference on Automation, Control and Mechatronics for Industry 4.0 (ACMI), Rajshahi, Bangladesh, 8–9 July 2021; pp. 1–6. [Google Scholar] [CrossRef]
  21. Kwasinski, A.; Onwuchekwa, C.N. Dynamic Behavior and Stabilization of DC Microgrids with Instantaneous Constant-Power Loads. IEEE Trans. Power Electron. 2010, 26, 822–834. [Google Scholar] [CrossRef]
  22. Olamaei, J.; Niknam, T.; Gharehpetian, G. Application of particle swarm optimization for distribution feeder reconfiguration considering distributed generators. Appl. Math. Comput. 2008, 201, 575–586. [Google Scholar] [CrossRef]
  23. AlRashidi, M.; AlHajri, M. Optimal planning of multiple distributed generation sources in distribution networks: A new approach. Energy Convers. Manag. 2011, 52, 3301–3308. [Google Scholar] [CrossRef]
  24. Hizarci, H.; Demirel, O.; Turkay, B.E. Distribution network reconfiguration using time-varying acceleration coefficient assisted binary particle swarm optimization. Eng. Sci. Technol. Int. J. 2022, 35, 101230. [Google Scholar] [CrossRef]
  25. Tabora, J.M.; Velasquez, Y.G.; Rivera, D.A.; Quijano, D.A.; Melgar-Dominguez, O.D. A Multiobjective Strategy for Generation Expansion Planning to Enable Increased Penetration of Variable Renewable Energy Sources. IEEE Access 2024, 12, 187665–187675. [Google Scholar] [CrossRef]
  26. Tiwari, D.; Zideh, M.J.; Talreja, V.; Verma, V.; Solanki, S.K.; Solanki, J. Power Flow Analysis Using Deep Neural Networks in Three-Phase Unbalanced Smart Distribution Grids. IEEE Access 2024, 12, 29959–29970. [Google Scholar] [CrossRef]
  27. Palaniyappan, B.; T, V.; Chandrasekaran, G. Solving electric power distribution uncertainty using deep learning and incentive-based demand response. Util. Policy 2023, 82, 101579. [Google Scholar] [CrossRef]
  28. Lopes, J.C.; Sousa, T.; Benedito, R.d.S.; Trigoso, F.B.M.; Medina, D.O.G. Application of Battery Energy Storage System in Photovoltaic Power Plants Connected to the Distribution Grid. In Proceedings of the 2019 IEEE PES Innovative Smart Grid Technologies Conference-Latin America (ISGT Latin America), Gramado, Brazil, 15–18 September 2019; pp. 1–6. [Google Scholar] [CrossRef]
  29. Wang, Z.; Li, X.; Li, G.; Zhou, M.; Lo, K.L. Energy storage control for the Photovoltaic generation system in a micro-grid. In Proceedings of the 2010 5th International Conference on Critical Infrastructure (CRIS), Beijing, China, 20–22 September 2010; pp. 1–5. [Google Scholar] [CrossRef]
  30. Sarasua, J.I.; Martínez-Lucas, G.; García-Pereira, H.; Navarro-Soriano, G.; Molina-García, Á.; Fernández-Guillamón, A. Hybrid frequency control strategies based on hydro-power, wind, and energy storage systems: Application to 100% renewable scenarios. IET Renew. Power Gener. 2022, 16, 1107–1120. [Google Scholar] [CrossRef]
  31. Charlangsut, N.; Rugthaicharoencheep, N. Enhancing Voltage and Power Stability in Distribution System with Photovoltaic from the Benefits of Battery Energy Storage. Energies 2025, 18, 577. [Google Scholar] [CrossRef]
  32. Gómez-Ramírez, G.A.; Meza, C.; Mora-Jiménez, G.; Morales, J.R.R.; García-Santander, L. The Central American Power System: Achievements, Challenges, and Opportunities for a Green Transition. Energies 2023, 16, 4328. [Google Scholar] [CrossRef]
  33. Khalid, M. Smart grids and renewable energy systems: Perspectives and grid integration challenges. Energy Strat. Rev. 2024, 51, 101299. [Google Scholar] [CrossRef]
  34. Marinescu, B.; Gomis-Bellmunt, O.; Dorfler, F.; Schulte, H.; Sigrist, L. Dynamic Virtual Power Plant: A New Concept for Grid Integration of Renewable Energy Sources. IEEE Access 2022, 10, 104980–104995. [Google Scholar] [CrossRef]
  35. Pirooz, A.A.S.; Sanjari, M.J.; Kim, Y.-J.; Moore, S.; Turner, R.; Weaver, W.W.; Srinivasan, D.; Guerrero, J.M.; Shahidehpour, M. Adaptation of High Spatio-Temporal Resolution Weather/Load Forecast in Real-World Distributed Energy-System Operation. Energies 2023, 16, 3477. [Google Scholar] [CrossRef]
  36. Khalil, M.; Sheikh, S.A. Advancing Green Energy Integration in Power Systems for Enhanced Sustainability: A Review. IEEE Access 2024, 12, 151669–151692. [Google Scholar] [CrossRef]
  37. Centro Nacional de Despacho—Un Objetivo, una Pasión Servirte con Energía. Available online: https://cnd.enee.hn/ (accessed on 27 June 2025).
  38. Paye, J.C.H.; Vieira, J.P.A.; Tabora, J.M.; Leão, A.P.; Cordeiro, M.A.M.; Junior, G.C.; de Morais, A.P.; Farias, P.E. High Impedance Fault Models for Overhead Distribution Networks: A Review and Comparison with MV Lab Experiments. Energies 2024, 17, 1125. [Google Scholar] [CrossRef]
  39. Bolgaryn, R.; Banerjee, G.; Meinecke, S.; Maschke, H.; Marten, F.; Richter, M.; Liu, Z.; Lytaev, P.; Alfakhouri, B.; Kisse, J.; et al. Open Source Simulation Software pandapower and pandapipes: Recent Developments. In Proceedings of the 2023 Open Source Modelling and Simulation of Energy Systems (OSMSES), Aachen, Germany, 27–29 March 2023; pp. 1–8. [Google Scholar] [CrossRef]
  40. Bolgaryn, R.; Prade, E.; Banerjee, G.; Drauz-Mauel, S.; Lohmeier, D.; Lytaev, P.; Marten, F.; Meinecke, S.; Vogt, M.; Xiang, Y.; et al. Further developments in pandapower and pandapipes. In Proceedings of the 2024 Open Source Modelling and Simulation of Energy Systems (OSMSES), Vienna, Austria, 3–4 September 2024; pp. 1–8. [Google Scholar] [CrossRef]
  41. Bolgaryn, R.; Banerjee, G.; Cronbach, D.; Drauz, S.; Liu, Z.; Majidi, M.; Maschke, H.; Wang, Z.; Thurner, L. Recent Developments in Open Source Simulation Software pandapower and pandapipes. In Proceedings of the 2022 Open Source Modelling and Simulation of Energy Systems (OSMSES), Aachen, Germany, 4–5 April 2022; pp. 1–7. [Google Scholar] [CrossRef]
  42. Junior, L.C.d.S.; Tabora, J.M.; Reis, J.; Andrade, V.; Carvalho, C.; Manito, A.; Tostes, M.; Matos, E.; Bezerra, U. Demand-Side Management Optimization Using Genetic Algorithms: A Case Study. Energies 2024, 17, 1463. [Google Scholar] [CrossRef]
  43. Huang, M.; Chen, R.; Zhong, H. Research on an Automatic Conversion Method of Power Flow Input Data from PSD-BPA to Pandapower. In Proceedings of the 2020 IEEE 4th Information Technology, Networking, Electronic and Automation Control Conference (ITNEC), Chongqing, China, 12–14 June 2020; pp. 494–498. [Google Scholar] [CrossRef]
  44. Thurner, L.; Scheidler, A.; Schafer, F.; Menke, J.-H.; Dollichon, J.; Meier, F.; Meinecke, S.; Braun, M. Pandapower—An Open-Source Python Tool for Convenient Modeling, Analysis, and Optimization of Electric Power Systems. IEEE Trans. Power Syst. 2018, 33, 6510–6521. [Google Scholar] [CrossRef]
  45. McKinney, W. Data structures for statistical computing in python. In Proceedings of the 9th Python in Science Conference, Austin, TX, USA, 28 June–3 July 2010; Volume 445, pp. 51–56. [Google Scholar]
  46. Miscellaneous Operating System Interfaces, Python Documentation. Available online: https://docs.python.org/3/library/os.html (accessed on 27 June 2025).
  47. Dugan, R.C.; McDermott, T.E. An open source platform for collaborating on smart grid research. In Proceedings of the 2011 IEEE Power and Energy Society General Meeting, Detroit, MI, USA, 24–29 July 2011; IEEE: New York, NJ, USA; pp. 1–7. [Google Scholar] [CrossRef]
  48. Hunter, J.D. Matplotlib: A 2D graphics environment. Comput. Sci. Eng. 2007, 9, 90–95. [Google Scholar] [CrossRef]
  49. Harris, C.R.; Millman, K.J.; van der Walt, S.J.; Gommers, R.; Virtanen, P.; Cournapeau, D.; Wieser, E.; Taylor, J.; Berg, S.; Smith, N.J.; et al. Array programming with NumPy. Nature 2020, 585, 357–362. [Google Scholar] [CrossRef]
  50. Andrade, V.B.; Paixão, U.C., Jr.; Moreira, C.E.; Soares, T.M.; Tabora, J.M.; Tostes, M.E.d.L.; Bezerra, U.H.; Albuquerque, B.S.; Gouveia, L.D.S. Modelagem de um sistema de distribuição real desbalanceado e análise do impacto da geração distribuída utilizando o software OpenDSS. Simpósio Bras. Sist. Elétricos 2020, 1. [Google Scholar] [CrossRef]
  51. Gupta, M.; Abhyankar, A.R. Examining Impact of Distribution System Characteristics on Transmission Security Assessment of Future Power Systems. IEEE Access 2022, 10, 16388–16399. [Google Scholar] [CrossRef]
  52. Khani, D.; Yazdankhah, A.S.; Kojabadi, H.M. Impacts of distributed generations on power system transient and voltage stability. Int. J. Electr. Power Energy Syst. 2012, 43, 488–500. [Google Scholar] [CrossRef]
  53. Narang, D.; Mahmud, R.; Ingram, M.; Hoke, A. An Overview of Issues Related to IEEE Std 1547-2018 Requirements Regarding Voltage and Reactive Power Control; NREL/TP-5D00-77156; National Renewable Energy Laboratory: Golden, CO, USA, 2021. [Google Scholar]
  54. ExpControl, OpenDSS Documentation. Available online: https://opendss.epri.com/ExpControl.html (accessed on 27 June 2025).
  55. Mahbub, M. Power System Analysis by John Grainger. Available online: https://www.academia.edu/41974390/Power_System_Analysis_by_John_Grainger (accessed on 30 June 2025).
  56. Nagrath, I.J.; Kothari, D.P.; Desai, R.C. Modern Power System Analysis. IEEE Trans. Syst. Man. Cybern. 1982, 12, 96. [Google Scholar] [CrossRef]
  57. Kayal, P.; Chanda, S.; Chanda, C.K. An analytical approach for allocation and sizing of distributed generations in radial distribution network. Int. Trans. Electr. Energy Syst. 2017, 27, e2322. [Google Scholar] [CrossRef]
  58. Elkholy, A. Optimal Planning of Multiple PV-DG in Radial Distribution Systems Using Loss Sensitivity Analysis and Genetic Algorithm. J. Power Energy Eng. 2025, 13, 1–22. [Google Scholar] [CrossRef]
  59. Umoh, V.; Davidson, I.; Adebiyi, A.; Ekpe, U. Methods and Tools for PV and EV Hosting Capacity Determination in Low Voltage Distribution Networks—A Review. Energies 2023, 16, 3609. [Google Scholar] [CrossRef]
  60. Ela, E.; Milligan, M.; Bloom, A.; Botterud, A.; Townsend, A.; Levin, T. Evolution of Wholesale Electricity Market Design with Increasing Levels of Renewable Generation; NREL/TP-5D00-61765; National Renewable Energy Laboratory: Golden, CO, USA, 2014. [Google Scholar] [CrossRef]
  61. Pisciella, P.; Vespucci, M.T.; Viganò, G.; Rossi, M.; Moneta, D. Optimal Power Flow Analysis in Power Dispatch for Distribution Networks. In NAO 2017. Springer Proceedings in Mathematics & Statistics; Numerical Analysis and Optimization; Al-Baali, M., Grandinetti, L., Purnama, A., Eds.; Springer: Cham, Switzerland, 2018; Volume 235. [Google Scholar] [CrossRef]
  62. AC Power Flow. Available online: https://matpower.app/manual/matpower/ACPowerFlow.html (accessed on 27 June 2025).
  63. Red Externa—Documentación de Pandapower 3.1.3. Available online: https://pandapower.readthedocs.io/en/latest/elements/ext_grid.html (accessed on 27 June 2025).
  64. Control de Área. Available online: https://www.powerworld.com/WebHelp/Content/MainDocumentation_HTML/Area_Control.htm (accessed on 27 June 2025).
  65. Salimon, S.A.; Adepoju, G.A.; Adebayo, I.G.; Howlader, H.O.R.; Ayanlade, S.O.; Adewuyi, O.B. Impact of Distributed Generators Penetration Level on the Power Loss and Voltage Profile of Radial Distribution Networks. Energies 2023, 16, 1943. [Google Scholar] [CrossRef]
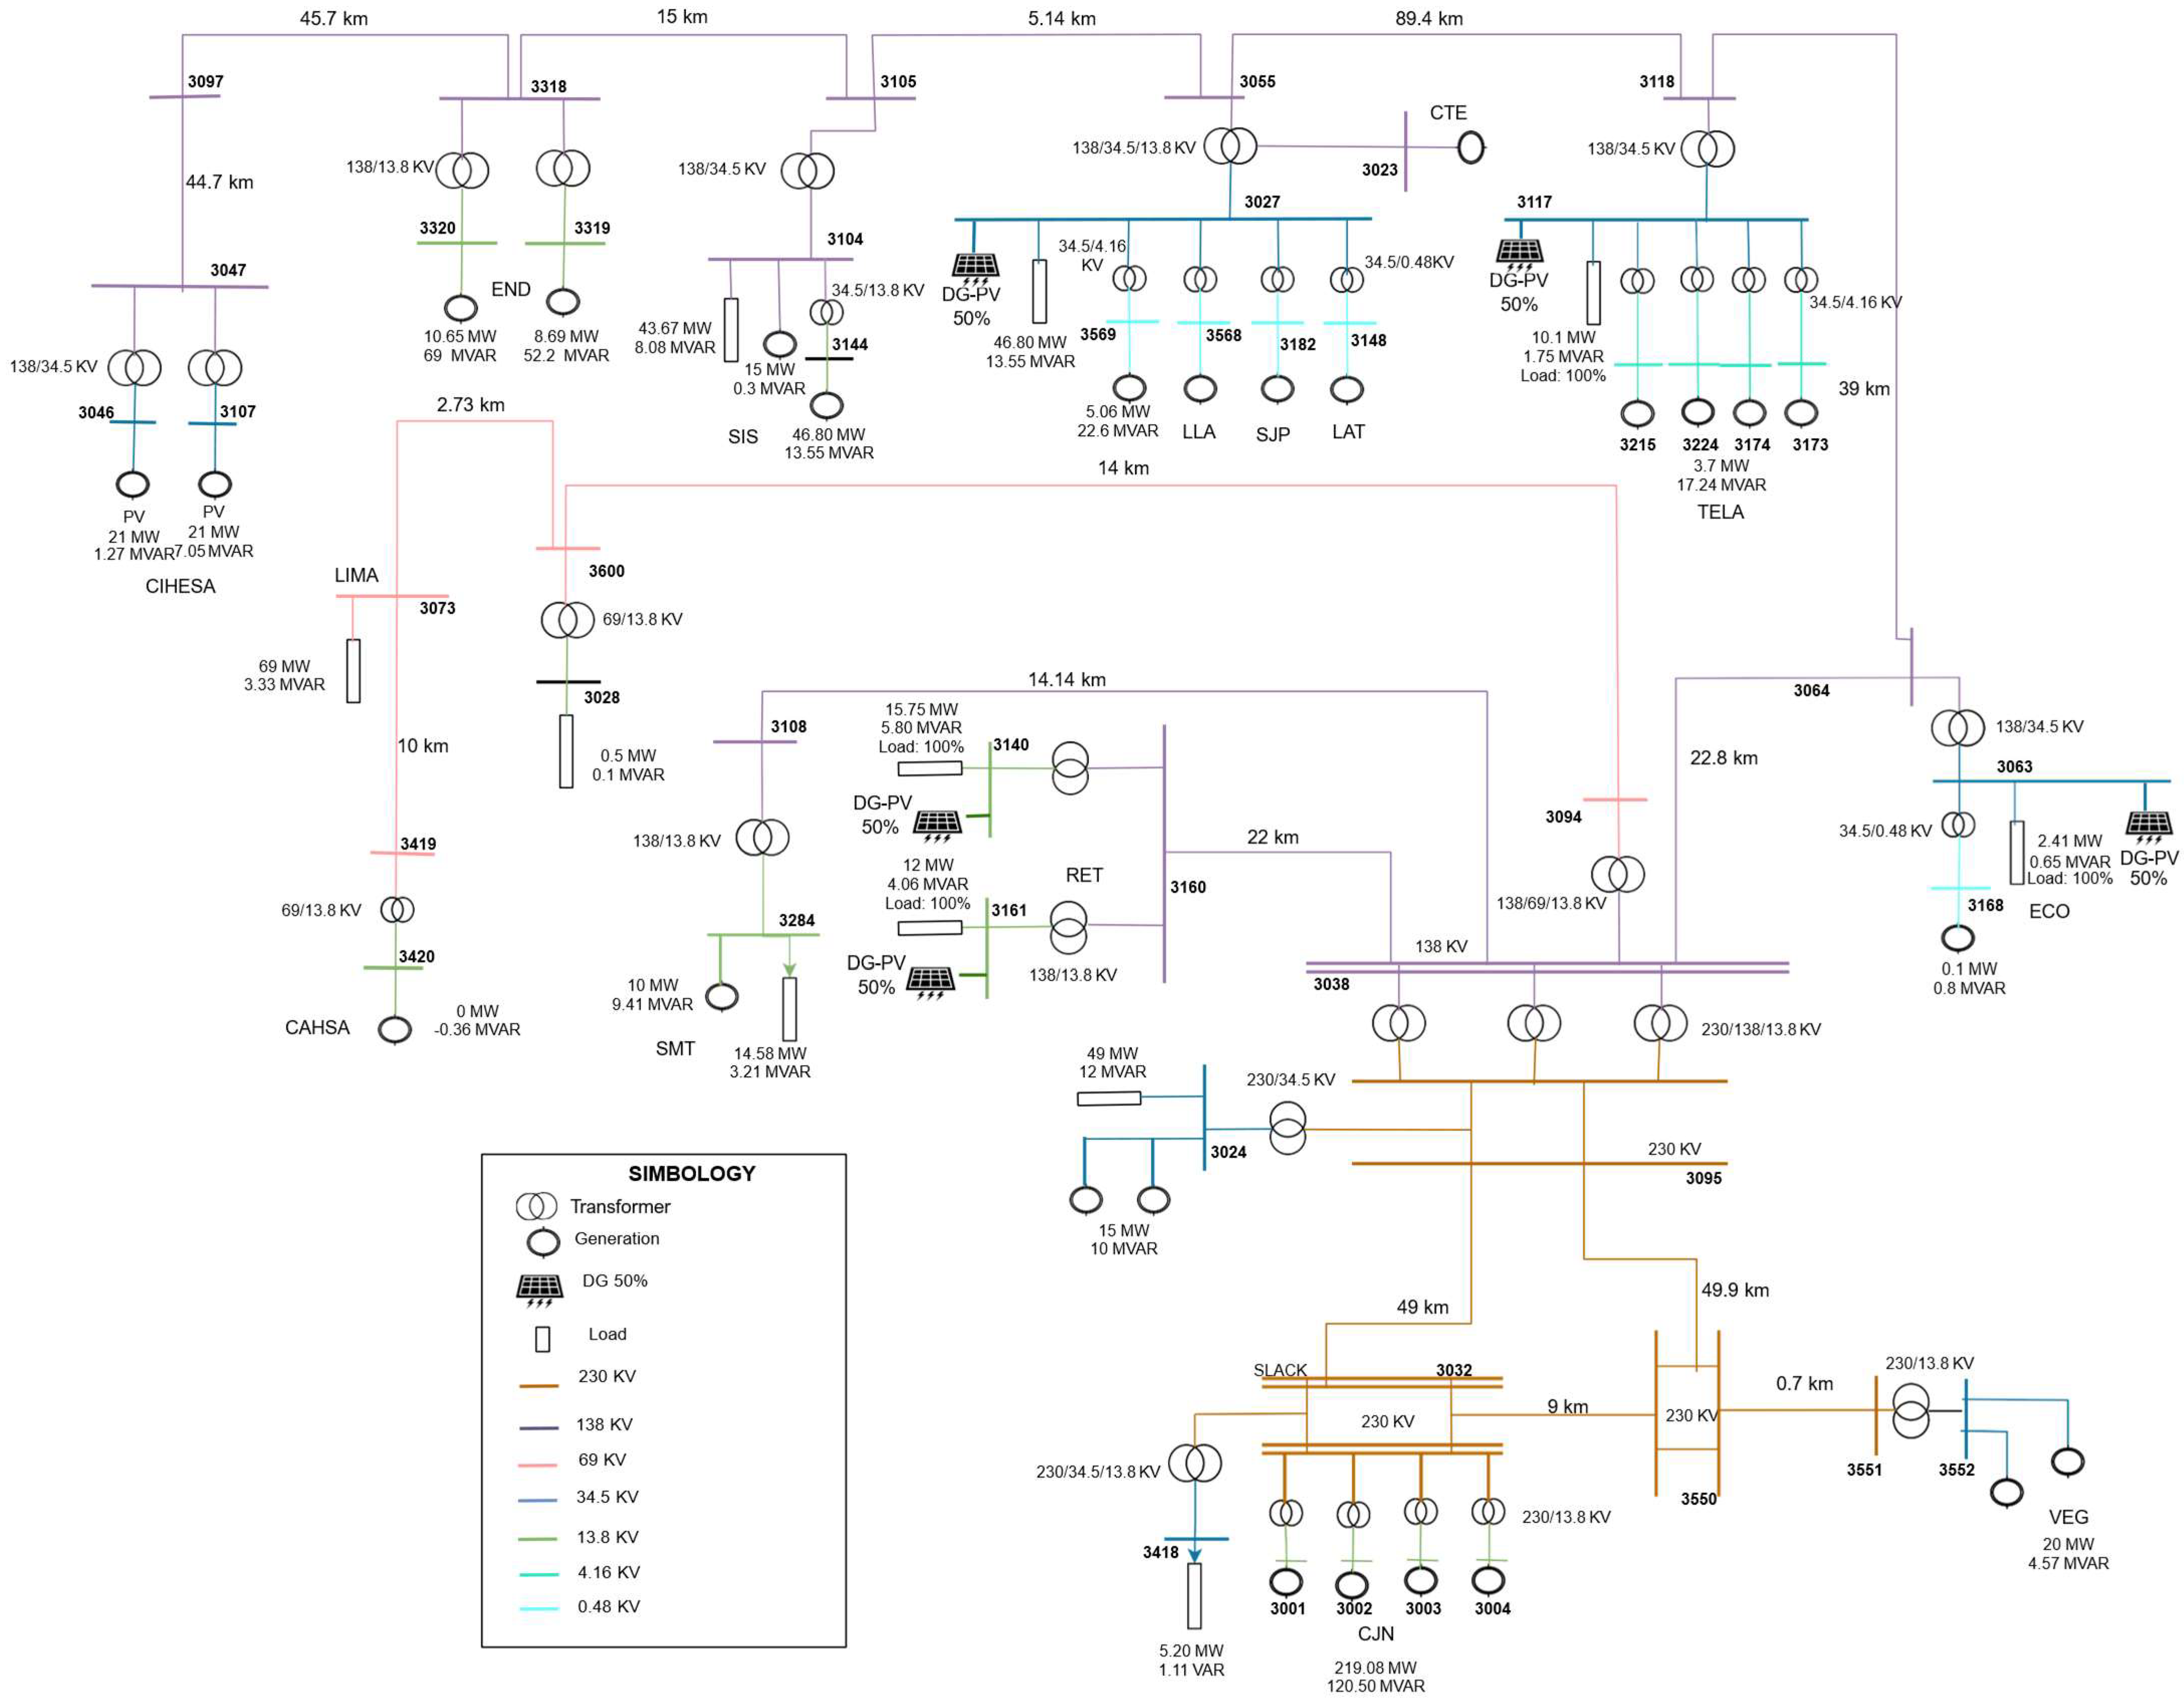
Figure 1. Single-line diagram of the modeled Honduran power grid.
Energies 18 04777 g001
Figure 2. Workflow for modeling and simulation of the Honduran power system based on Pandapower.
Energies 18 04777 g002
Figure 3. Voltage profiles of all buses before DG injection.
Energies 18 04777 g003
Figure 4. Voltage profiles of generation buses (base case).
Energies 18 04777 g004
Figure 5. Line loading percentages before DG injection.
Energies 18 04777 g005
Figure 6. Voltage profiles at load buses before DG integration.
Energies 18 04777 g006
Figure 7. Voltage profiles of selected buses under different DG penetration levels.
Energies 18 04777 g007
Figure 8. Voltage profiles of load buses after DG integration.
Energies 18 04777 g008
Figure 9. Voltage comparison at critical buses before and after DG injection.
Energies 18 04777 g009
Figure 10. Comparison of line loading levels before and after DG injection.
Energies 18 04777 g010
Figure 11. Voltage levels at all buses after DG integration.
Energies 18 04777 g011
Figure 12. Active power losses in selected buses under different DG penetration levels: (a) For buses 3161 and 3140 and (b) For buses 3063, 3117 and 3027.
Energies 18 04777 g012
Figure 13. Reactive power losses in selected buses under different DG penetration levels.
Energies 18 04777 g013
Table 1. Power balance in the simulated base system.
ComponentActive Power (MW)Reactive Power (MVAR)
Total generation425.65182.69
Line losses4.44−17.21
2-winding transformer losses0.0081.30
3-winding transformer losses0.53 11.44
Total losses4.9875.52
Net delivered power420.67107.17
Demand202.9250.39
Table 2. Multi-criteria evaluation of candidate buses for DG integration.
BusVbase_p.u.dV_per_MWLSFHeadroom_%Hosting_cap_MWScore
31170.8595474390.053911943−0.03037778966.647112256.760.778314451
31610.7474374220.02254533−0.03155121432.174659713.860.49270371
30630.9094390210.0106604180.00033006895.219069342.850.466494992
31400.7568632370.01538126−0.0297219611.282432753.520.390005769
30270.9364482980.000896390.06607889232.232475215.080.1518708
Table 3. Buses selected for DG injection.
BusesVoltage (kV)Voltage (p.u.)Active Load (MW)Reactive Load (MVAR)
316113.80.747557124.0774
314013.80.75697515.755.8072
311734.50.85960910.571.7537
306334.50.9095102.410.6536
302734.50.93629746.8013.5518
Table 4. Voltage (p.u.) by percentage of generation.
Bus0%20%30%40%50%60%70%80%90%100%
31610.74740.82850.85060.87120.88830.90280.91520.92570.93450.9419
31400.757680.8270.850.86910.88510.89870.91040.92040.92880.9358
31170.85940.95830.98070.9989111111
30630.90940.93450.94330.9510.95770.96370.9690.97370.97780.9813
30270.93640.9420.94220.94180.94070.9390.93660.93370.93010.9259
Table 5. Selected buses for DG injection and voltage and power characteristics.
BusVoltage (kV)Voltage (p.u.)
Before
Active Power (MW)Reactive Power (MVAR)Voltage (p.u.)
After
3161-GEN13.80.7475573.861.210.8883
3140-GEN13.80.7569753.521.590.8851
3117-GEN34.50.8596096.730.581.00
3063-GEN34.50.9095102.850.320.9577
3027-SGEN34.50.93629715.07−4.750.9407
Table 6. Improvements in voltage profiles at selected buses after DG injection.
BusV (kV)V (p.u.) BeforeV (p.u.) AfterImprovementBusV (kV)V (p.u.) BeforeV (p.u.) AfterImprovement
314013.80.7570.8850.12830641380.9670.9820.015
316113.80.7470.8880.14130381380.9710.9840.013
302734.50.9360.9410.00431081380.9710.9840.013
302435.190.9430.9450.00233181380.9780.9890.012
317813.80.9070.9560.050310434.50.9790.9910.012
306334.50.9090.9580.048397913.80.9810.9900.008
302813.80.9540.9670.014397813.80.9810.9900.008
31181380.9610.9790.018395713.80.9810.9900.008
3073690.9620.9750.01430971380.9860.9960.011
3419690.9620.9750.01430952300.9920.9960.003
3600690.9620.9760.01430471380.9931.0020.009
31601380.9520.9760.024341834.50.9970.9970.000
30551380.9660.9810.01435502300.9991.0000.001
3094690.9640.9770.01435512300.9991.0000.001
398013.80.9650.9780.014311734.50.8601.0000.140
31051380.9680.9820.01432244.7250.9711.0000.029
302313.80.9770.9790.002396713.80.8791.0070.128
Table 7. Power balance in the simulated system without DG and with DG.
ComponentActive Power (MW) BeforeReactive Power (MVAR)
Before
Active Power (MW)
After
Reactive Power (MVAR)
After
Total generation425.65182.69425.65163.86
Line losses4.44−17.214.37−18.10
2-winding transformer losses0.0081.300.0057.18
3-winding transformer losses0.5311.440.142.09
Total losses4.9875.524.5241.77
Net delivered power420.67107.17421.14122.69
Demand202.9250.39202.9250.39
Disclaimer/Publisher’s Note: The statements, opinions and data contained in all publications are solely those of the individual author(s) and contributor(s) and not of MDPI and/or the editor(s). MDPI and/or the editor(s) disclaim responsibility for any injury to people or property resulting from any ideas, methods, instructions or products referred to in the content.