Article

Microscopic Transport During Carbon Dioxide Injection in Crude Oil from Jimsar Oilfield Using Microfluidics

1
Research Institute of Exploration and Development, Xinjiang Oilfield Company, Petrochina, Karamay 834000, China
2
Xinjiang Key Laboratory of Shale Oil Exploration and Development, Karamay 834000, China
3
School of Chemical Engineering, East China University of Science and Technology, Shanghai 200237, China
*
Authors to whom correspondence should be addressed.
Energies 2025, 18(17), 4774; https://doi.org/10.3390/en18174774
Submission received: 26 June 2025 / Revised: 26 July 2025 / Accepted: 31 July 2025 / Published: 8 September 2025
(This article belongs to the Section H1: Petroleum Engineering)

Abstract

During the process of oil extraction, the urgent need for unconventional oil resources is driven by escalating global demand and the progressive depletion of conventional reserves. Shale oil represents a critical unconventional resource, with recovery efficiency being fundamentally constrained by the multiscale heterogeneity of shale reservoirs characterized by intricate networks of microscale fractures and nanoscale pores. To unravel pore structure impacts on microscopic transport phenomena, this study employed microfluidic chips replicating authentic shale pore architectures with pore depths as small as 200 nm to conduct immiscible flooding, constant volume depletion, and huff-n-puff experiments under representative reservoir conditions, with experiments reaching a maximum pressure of 40 MPa. The results show that large-pore and fine-throat structures create dual flow restrictions: the abrupt change in pore throat size amplifies the local flow resistance relative to the homogeneous structure, leading to a 78.09% decline in displacement velocity, while Jamin effect-induced capillary resistance reduces recovery efficiency, and even prevents some crude oil in the pore from being driven out. Slug flow occurred in the experiment, with calculated capillary numbers (Ca) of 0.0015 and 0.0026. This slug flow impedes microscopic transport efficiency, and lower Ca values yield more distinct liquid slugs. CO2 exhibited effective extraction capabilities for light crude oil components, enriching residual heavy components that impeded subsequent extraction. When contact time was tripled under experimental conditions, this ultimately led to a 25.6% reduction in recovery rate. This investigation offers valuable insights into microscopic transport mechanisms within shale oil systems and provides practical guidance for optimizing shale reservoir development strategies.

1. Introduction

Petroleum, acting as the blood of the global economy, sustains operations across multiple sectors including transportation, industrial production, daily life, and national security, serving as an indispensable fundamental energy source that ensures stable global economic growth and meets the escalating demands of society [1]. However, with sustained global economic expansion and rapid development of emerging economies, the continuous increase in energy demand has rendered conventional petroleum resources increasingly inadequate, heightening the urgency for developing unconventional petroleum resources [2,3].
As a crucial component of unconventional petroleum reserves, shale oil possesses technically recoverable global reserves potentially reaching 4.69 × 10¹⁰ tons, representing 20–50% of total global petroleum reserves and demonstrating substantial application prospects and extraction potential [4,5,6,7,8,9]. Compared to conventional reservoirs, shale oil formations exhibit extremely low porosity and permeability, strong heterogeneity, and abundant micro- and nanoscale pore structures [10,11,12,13,14]. Furthermore, spatial confinement induces strong solid/liquid interactions between shale oil and pore walls, while altered interactions and flow patterns lead to significant deviations in fluid physical properties compared to macroscopic conditions [15,16,17,18]. To enhance oil recovery, CO2 injected into reservoirs attains a supercritical state, exhibiting high diffusivity and extractive capacity that enable penetration into micro/nanopores and reduce crude oil viscosity, thereby improving flow mobility [19].
However, long-term CO2 injection and extraction may cause progressive dissolution of carbonate and clay minerals, induce pore coarsening and fracture propagation, and drive wettability alteration. While enhancing short-term gas recovery, these processes potentially exacerbate long-term storage instability and leakage risks [20]. More critically, the leakage of CO2 in reservoirs directly causes groundwater contamination, inducing groundwater acidification, and thereby compromising potable water safety. While supercritical CO2 (scCO2)/water reactions initially enhance porosity via mineral dissolution, the induced chemical/mechanical effect amplifies stress sensitivity, resulting in long-term permeability reduction and hindered fluid flow under reservoir conditions [21].
Microscopic transport phenomena in shale reservoirs have been extensively investigated through theoretical analyses [22,23,24], experimental approaches [25,26,27], and simulation methodologies [28,29,30]. Lang et al. [31] employed NMR to analyze recovery efficiency in a CO2 flooding experiment under varying pressure and temperature conditions. The results show that increased pressure enhances crude oil solubility in CO2 and consequently improves recovery rates, while temperature elevation initially boosts then diminishes recovery efficiency. Wang et al. [32] conducted CO2 miscible flooding core experiments to identify main enhanced oil recovery mechanisms. The results show that the oil saturation of the core in the miscible flooding test is significantly reduced, the swept volume is increased, the oil in low-permeability reservoirs can be displaced more effectively, and the residual oil in low-permeability cores is distributed more uniformly. Jiménez-Martínez et al. [33] simulated three-phase reservoir conditions using microfluidic systems, finding that localized flow channeling limits scCO2/oil contact efficiency, though mobile brine presence enhances scCO2/oil mixing. Cao et al. [34] employed molecular dynamics simulations to study liquid hydrocarbon adsorption in shale matrices, revealing that the adsorption capacity of shale reservoirs for hydrocarbons is an important factor affecting mobility, but shale oil contains more highly adsorbed oil fractions, making it less mobile and difficult to produce.
Microfluidics is a technology that consolidates complex laboratory operations into microchips, enabling precise fluid manipulation within microchannels through pressure and flow rate regulation [35]. Microfluidics utilizes its microchannels’ high surface-to-volume ratio to enable experiments with minimal sample consumption and exceptional controllability, while accelerating transport processes through enhanced mass and heat transfer at the microscale [36,37,38]. Microfluidics provides distinct in situ real-time visualization capabilities, enabling direct observation and recording of microscale dynamic phenomena within the chip during experiments, which is typically unattainable with conventional macroscopic systems [39,40]. Microfluidic technology, with its advantages in precise pore network reconstruction and in situ visualization, provides an ideal platform for studying the mechanisms of CO2 flooding and sequestration in low-permeability heavy oil reservoirs. For instance, Li et al. [41] demonstrated through high-pressure microfluidic experiments that key mechanisms govern fluid migration pathways and carbon sequestration efficiency. Although prior research has contributed to microfluidic understanding, it mainly concentrated on micron-scale channels with high homogeneity, using simple oil and low experimental pressures.
In contrast, the channel structure of our microfluidic chip is designed based on authentic reservoir architecture, exhibiting significant heterogeneity, and incorporates representative pores with a depth of 200 nm. Furthermore, complex crude oil compositions are driven under pressures as high as 40 MPa, thereby better simulating reservoir conditions. However, this study focuses on the qualitative investigation of microscopic transport phenomena. The employed simplified 2.5D pore network struggles to fully replicate the complex 3D interactions within actual reservoir pores. Additionally, CO2/oil/rock geochemical reactions, which critically influence interfacial properties and wettability, were excluded. Although these inherent limitations may affect the direct applicability of our findings to real reservoirs, the research provides valuable insights into the fundamental mechanisms underlying microscopic transport phenomena, facilitating further in-depth exploration of microscopic multiphase flow mechanisms.
In microfluidic experiments, fluctuating pressures enhance flow through pressure cycles, while they may induce the risk of extending microfractures, altering pore structural integrity. Therefore, parameter optimization is essential to reduce fouling and maximize recovery efficiency. Beyond laboratory conditions, subsurface biotic processes introduce additional complexities. Microbial activity in shale reservoirs may alter the content and morphology of clay minerals, thereby enhancing scCO2 sweep efficiency at the pore scale; however, this activity simultaneously reduces reservoir permeability and porosity by occluding microfractures, consequently impacting the effectiveness of CO2-enhanced oil recovery (CO2-EOR) methods [42]. These technical challenges require targeted solutions. To mitigate capillary entrapment and mass flow issues identified in microscale experiments, employing surfactants to reduce interfacial tension and optimizing injection parameters are both effective strategies. Specifically, surfactants work by significantly reducing interfacial tension, thereby decreasing capillary forces and mobilizing trapped oil; optimization of injection parameters enhances the driving force to overcome capillary resistance and improves fluid flow. The selection of the appropriate methods must be based on specific reservoir characteristics, fluid properties, and economic feasibility. The economic factors of microfluidic-guided CO2-EOR mainly include oil prices, CO2 injection volume, and capture investment. Its precise control of flow provides superior profitability and emission cuts under carbon tax policies.
The current understanding of microscale transport phenomena during CO2 injection in shale oil within nanoscale pores under actual high-pressure reservoir conditions remains limited, as conventional core flooding experiments cannot characterize flow and mass transfer characteristics in microscopic pore structures. In this study, multiscale experimental simulations of microscopic transport phenomena during CO2 injection in shale oil were conducted using microfluidic technology under maximum experimental pressures of 40 MPa, with chip pore depths reaching down to 200 nm. The microscopic flow and mass transfer processes during the experiments were directly visualized through microscopic observation devices, while analysis of captured experimental image data elucidated the flow characteristics of crude oil under reservoir conditions following CO2 injection. This research provides critical insights into CO2-enhanced oil recovery (CO2-EOR) mechanisms and evaluates oil recovery performance across different extraction methods under reservoir conditions, establishing valuable references for subsequent investigations.

2. Experimental Part

2.1. Chip Design and Preparation

The internal pore structures of the chips were designed based on actual core structures, incorporating manual modifications. First, the cores were sliced and CT-scanned to obtain renderings and grayscale images. These two images are both the original images we obtained. In the rendering image, the blue part represents the pores, while the other colors represent different rock compositions. These grayscale images were then processed in ImageJ 1.54f software by applying a grayscale value threshold to obtain the pore structures. Finally, the pore structure images were converted into vector graphics for CAD integration, where manual refinement was performed to eliminate flow dead zones and moderately enhance interconnectivity. Figure 1 illustrates this step-by-step design methodology through representative stage images from an experimental chip.
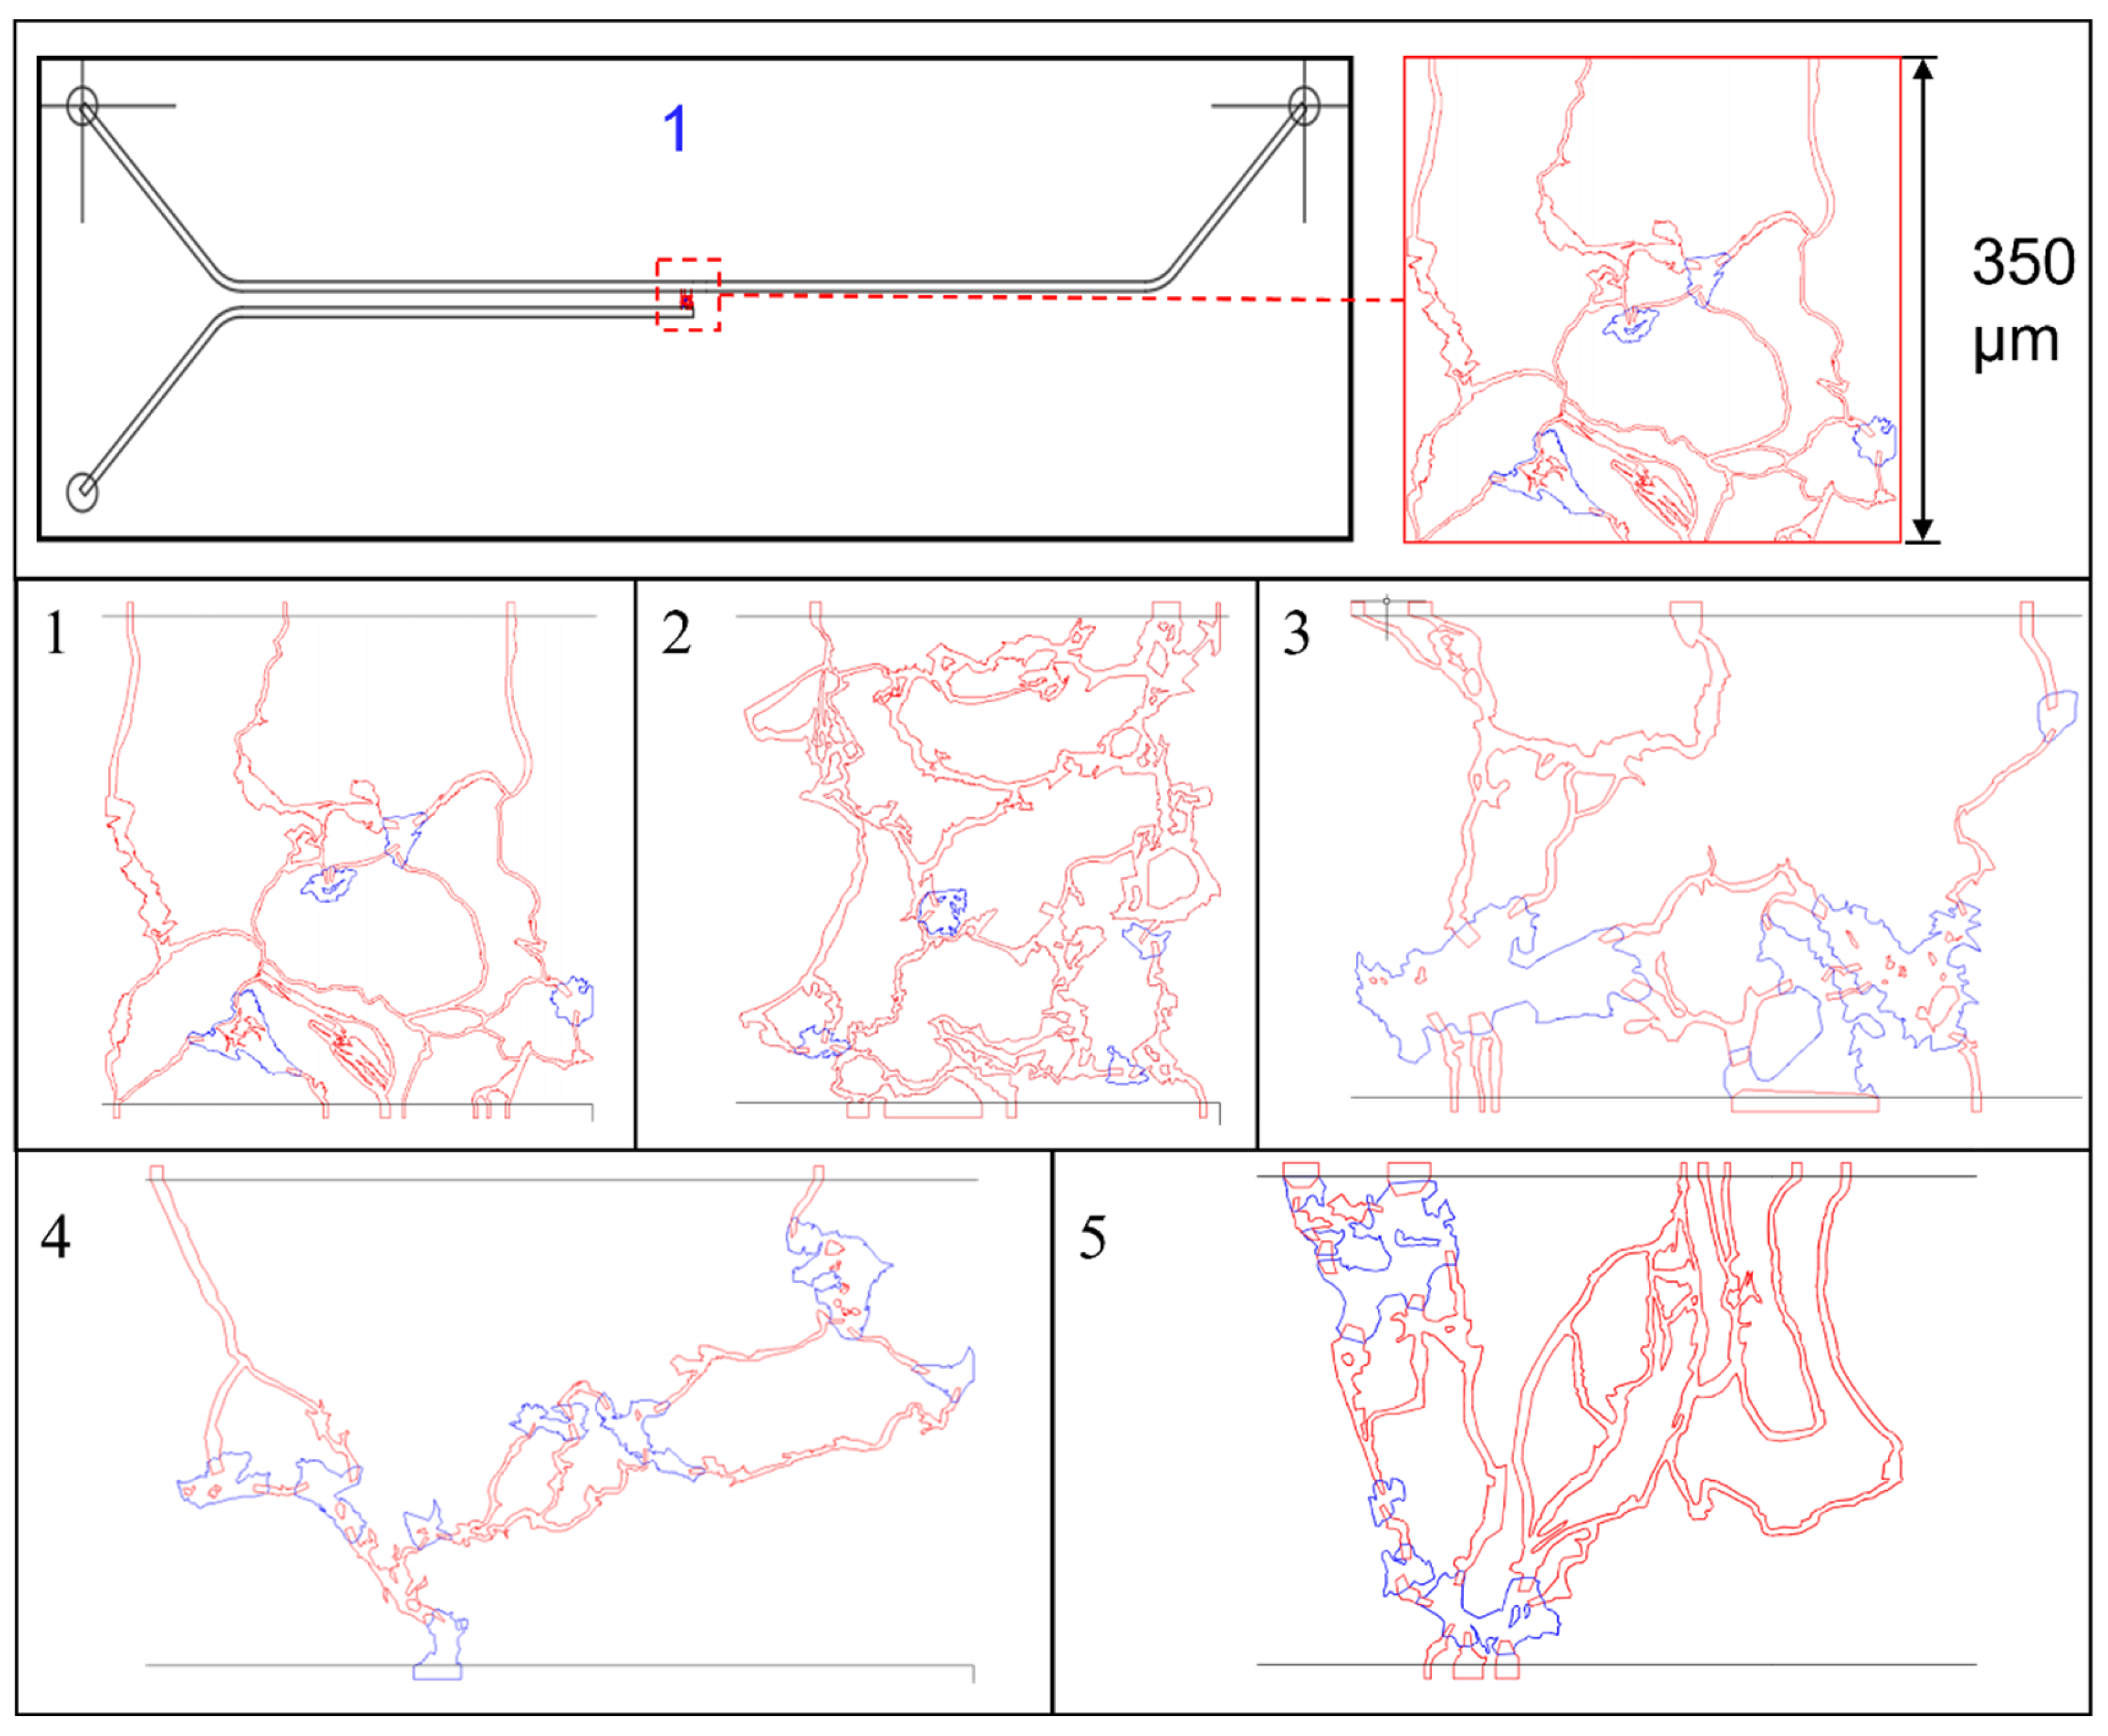
The complete chip design was formed by combining the pore structure design with auxiliary flow channels. As shown in Figure 2, which presents one of the experimental chips, the design specifications include the following: auxiliary channels measuring 200 μm in width and 100 μm in depth; red narrow throats with a minimum width of 2 μm and a depth of 200 nm; and blue large pores reaching a maximum width of 30 μm and a depth of 4 μm. A transitional overlay measuring 10 μm in length and 200 nm in depth connects the throat and pore sections.
The selection of 200 nm and 4 μm depths in this study is justified, as small pores and mesopores constitute the most widely distributed pore scales in the Jimsar shale reservoir. The 200 nm depth serves as a median scale that effectively represents the observed small-pore and mesopore structures in the actual reservoir, while the 4 μm depth corresponds to the median of the throat radius [43]. This combined-depth design enables more accurate simulation of pore structural characteristics in reservoir simulations.
The microfluidic chip was manufactured through photolithography and deep reactive ion etching (DRIE) processes on silicon wafers to etch the pore structure, and then the silicon chip and the glass were combined by anodic bonding encapsulation technology and further cut to make the physical object used in the experiments.

2.2. Experimental Materials and Equipment

The crude oil used in the experiments was shale oil taken from Jimsar in the Junggar Basin of Xinjiang, and SARA tests were carried out on the crude oil, which showed that the content of resin was 14.744% and the content of asphaltene was 12.938%.
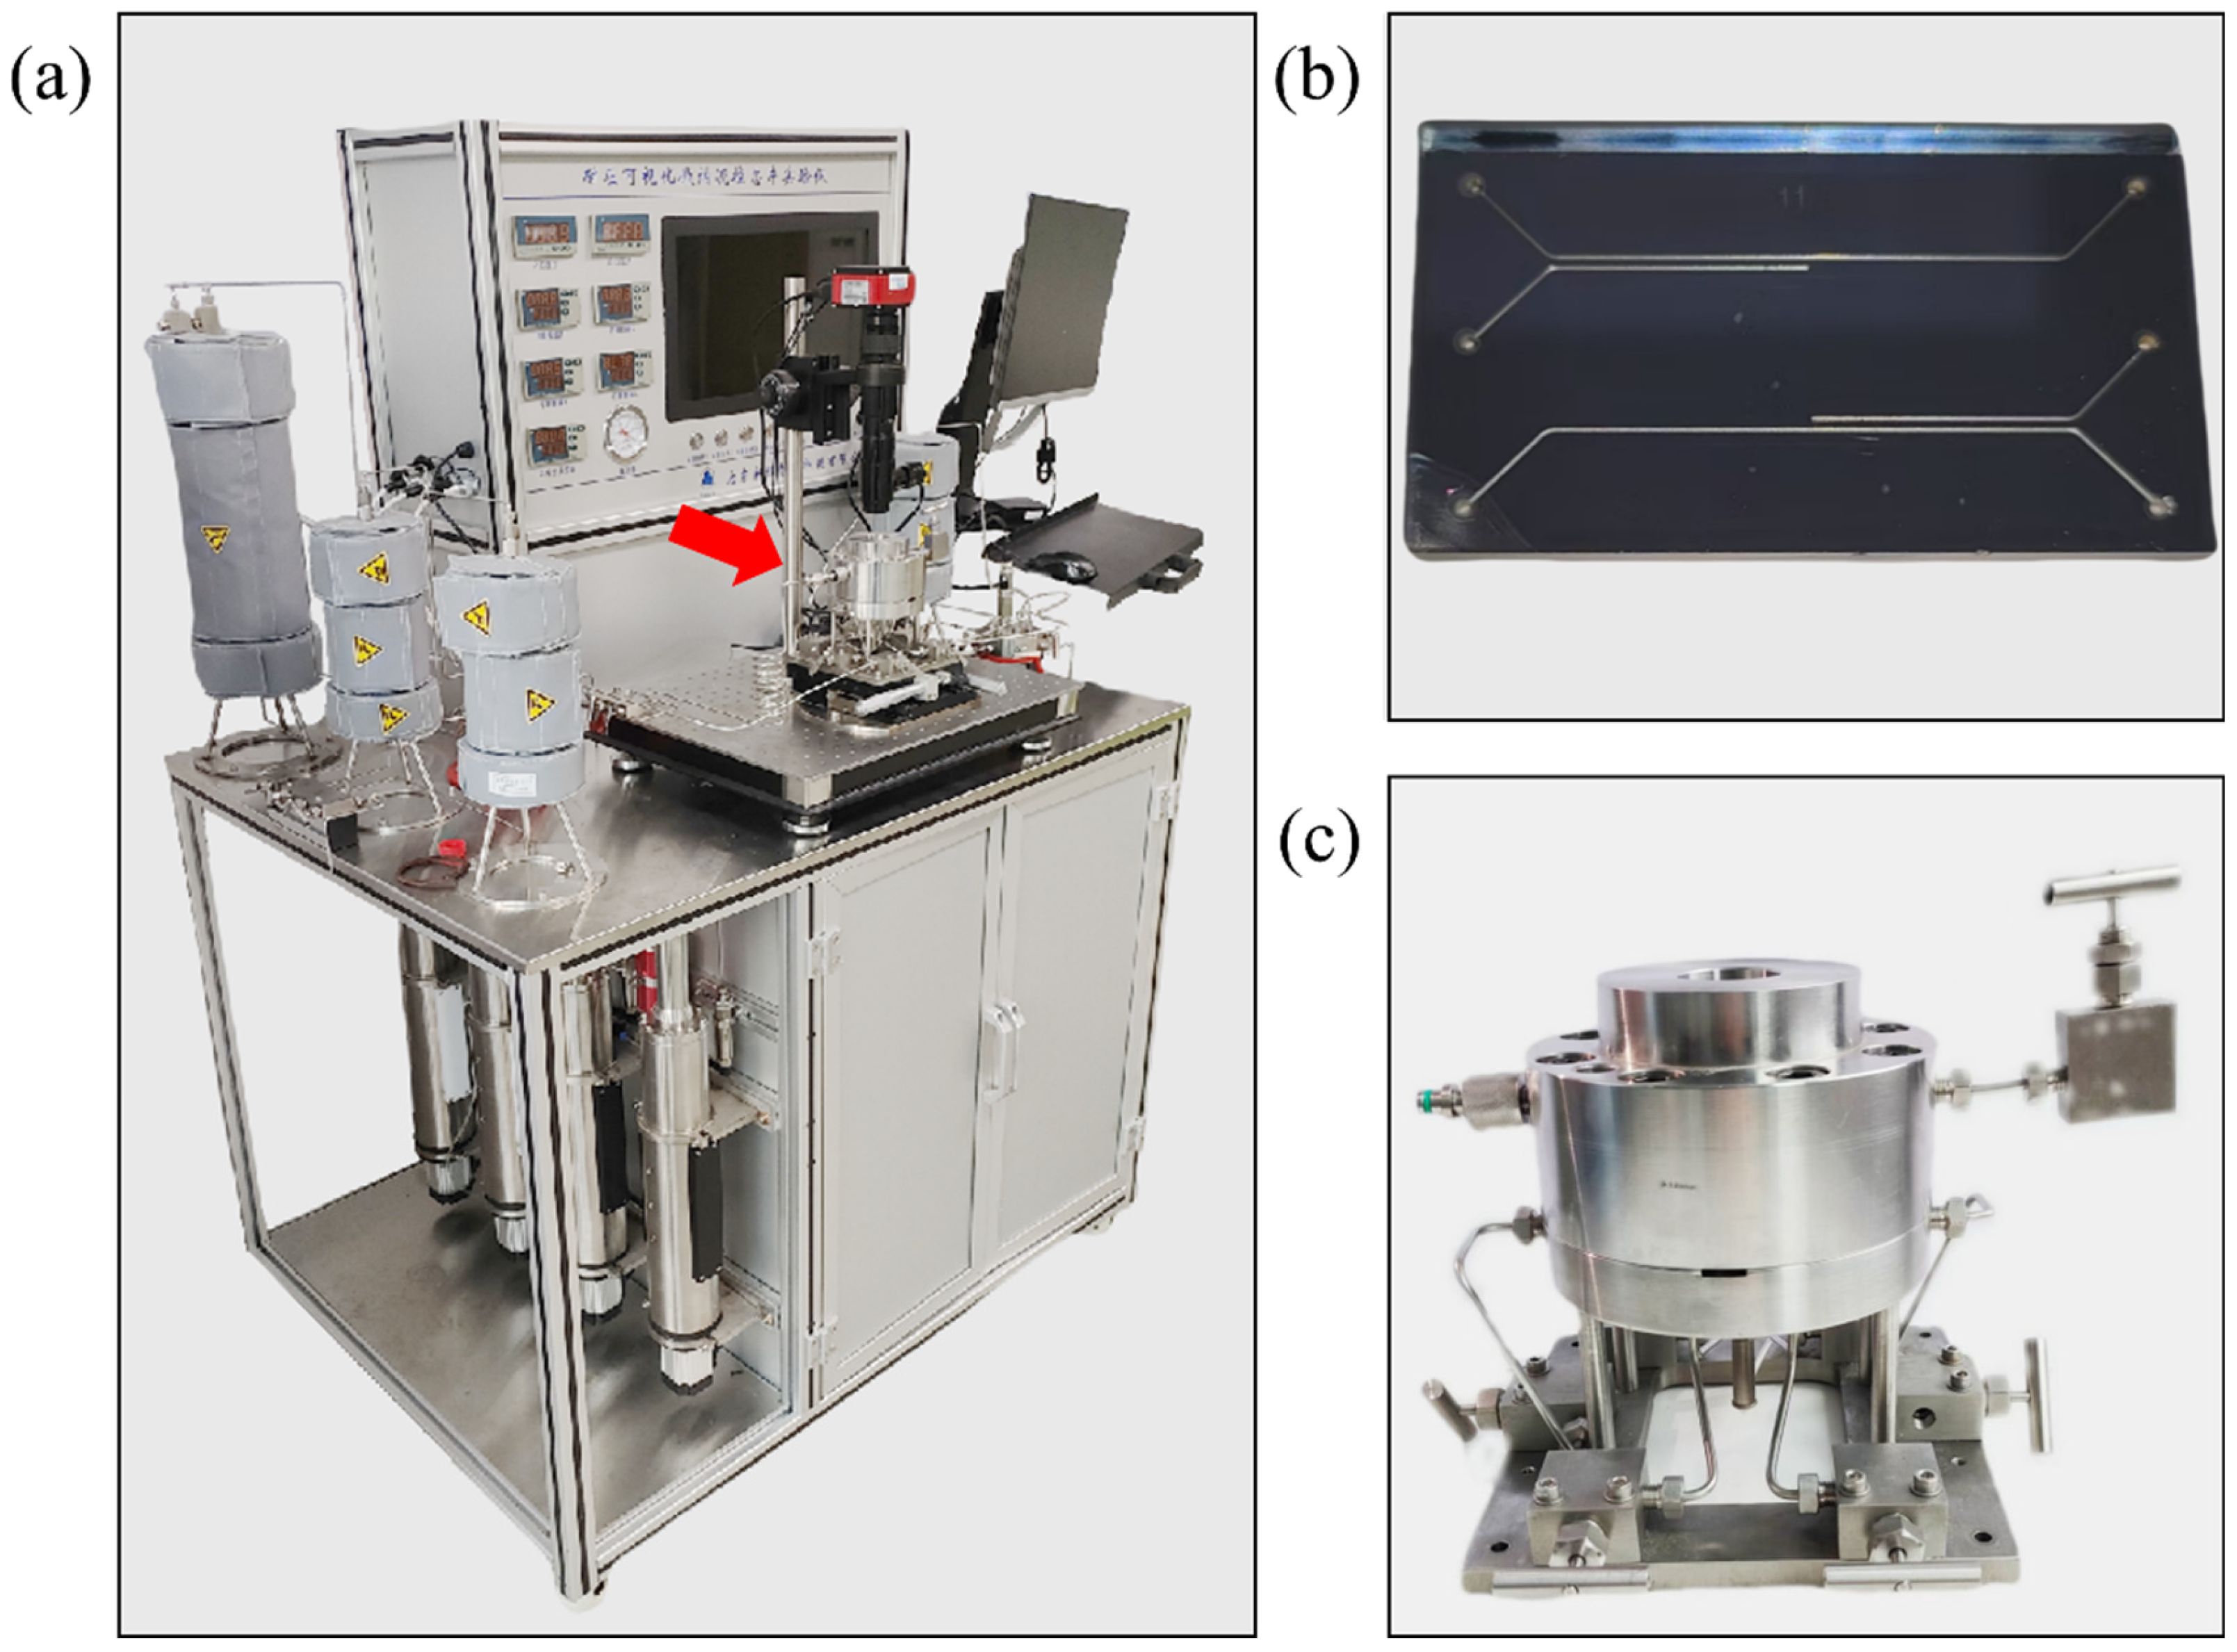
The experimental system constitutes an integrated in situ visualization platform centered on a microfluidic chip (Figure 3), comprising three primary components: a chip fixation device, syringe pump, and microscopic imaging system. The fixation device securely anchors the microfluidic chip while enabling controlled confining pressure through hydraulic water injection around the chip periphery, and integrates a sapphire observation window for real-time visualization of internal chip phenomena under high-pressure conditions. The microscopic imaging system combines a color microscope (AO-HK830RT, Aosvi, Shenzhen, China) with a computer and uses a 7–8× objective lens to capture image data at 30 frames per second for subsequent analysis. The system employs software to adjust operational parameters, temperature is maintained using a heating jacket, and pressure is monitored through sensors during experiments.

2.3. Experimental Program and Procedures

Our research conducted three different experiments: CO2 immiscible flooding at 20 MPa, constant volume depletion at 40 MPa, and huff-n-puff at 40 MPa. Detailed experimental parameters, including experimental content, serial numbers, and employed microfluidic chips, are summarized in Table 1.
In the experiments, elevated temperature significantly weakens or even eliminates interfacial tension and capillary resistance, and promotes miscibility by reducing the minimum miscibility pressure, allowing CO2 to penetrate nanopores more easily and efficiently displace trapped crude oil. Concurrently, the reduced viscosity of both CO2 and crude oil diminishes flow resistance, expanding microscopic sweep efficiency. Furthermore, enhanced CO2 solubility and diffusion rates at higher temperatures induce oil swelling and viscosity reduction, accelerating mass transfer and oil displacement within the pores, ultimately leading to a substantial increase in microscopic oil displacement efficiency. Taking into account both temperature effects and reservoir conditions, we set the experimental temperature at 85 °C.
The experimental flowchart is shown in Figure 4. The experimental procedure initiated with microfluidic chip encapsulation in the fixation device, followed by gas tightness verification and vacuum treatment. Subsequently, both the fixation device and tail-pressure crude oil storage tank were heated to 85 °C using a heating jacket. With the crude oil injection valve open and the CO2 injection valve closed, the system was pressurized to the target reservoir pressure while maintaining the confining pressure consistently 2 MPa above the injection pressure using the pressure tracking mode. After completing these fundamental procedures, the following specific steps for oil production were carried out in the three sets of experiments:
In the CO2 immiscible flooding experiments, the pressure differential between CO2 and crude oil was adjusted to 0.2–0.3 MPa to prevent rapid fluid flow, thereby ensuring clear visual observation throughout each experiment. In the huff-n-puff experiments, the CO2 injection valve was opened for a 3 min soaking period to allow CO2 dissolution into crude oil. The system was then rapidly depressurized to atmospheric pressure, during which expanding CO2 displaced crude oil. In the constant volume depletion experiments where no CO2 was injected, crude oil pressurized to reservoir conditions was connected to a bottomhole maintained at 6 MPa to enable production.

3. Results and Discussion

3.1. CO2 Immiscible Flooding Experiments

Heterogeneity is a critical characteristic of natural reservoirs, significantly influencing crude oil flow behavior and recovery efficiency. The microfluidic chip designed for CO2 immiscible flooding replicates the heterogeneous structure of actual core samples. This inherent heterogeneity induces flow resistance variations among pore channels during experiments, resulting in preferential channeling through dominant flow paths. Consequently, capillary trapping occurs in non-dominant channels where residual oil forms liquid plugs at pore throats, impeding displacement processes, as can be seen from Figure 5a.
The significant flow resistance contrast between dominant and non-dominant channels results in a critical phenomenon: When displacing fluids in non-dominant channels connected via T-junctions, the process effectively re-injects crude oil into dominant channels at low rates. This induces slug flow that substantially reduces displacement efficiency. In microfluidic systems, capillary number (Ca) affects slug flow formation: pronounced slug flow occurs at Ca < 0.01, while reduced Ca values correlate with elongated liquid slugs [44,45]. The calculated capillary number (Ca) was 0.0015 in Experiment 1 and 0.0026 in Experiment 2, using Equation (1):
Ca = u μ γ
where Ca is the capillary number, characterizing the relative magnitude between the viscous force and the interfacial tension; u is the flow rate, calculated from the displacement distance between the phase interfaces during the time period; μ is viscosity, obtained by referencing the relevant literature; and γ is interfacial tension, determined through the parachor method [46] based on crude oil physical parameters.
Figure 5b,c exhibit experimentally observed slug flow patterns, with the liquid column in Figure 5b being longer than in Figure 5c. The correlation between this flow behavior and the calculated Ca value is consistent with the correlation between slug flow and Ca established in previous studies. Low Ca values indicate that capillary forces significantly dominate over viscous forces, governing the flow behavior at the pore scale. This dominance impedes the effective penetration of the CO2-displacing phase into crude oil-filled micro-pore throats and hinders the stripping of oil films adhering to pore walls. Concurrently, CO2 tends to preferentially flow along paths of least resistance, bypassing numerous oil-containing small-pore throats and corner regions. These behaviors cause significant impairment of microscopic transport efficiency.
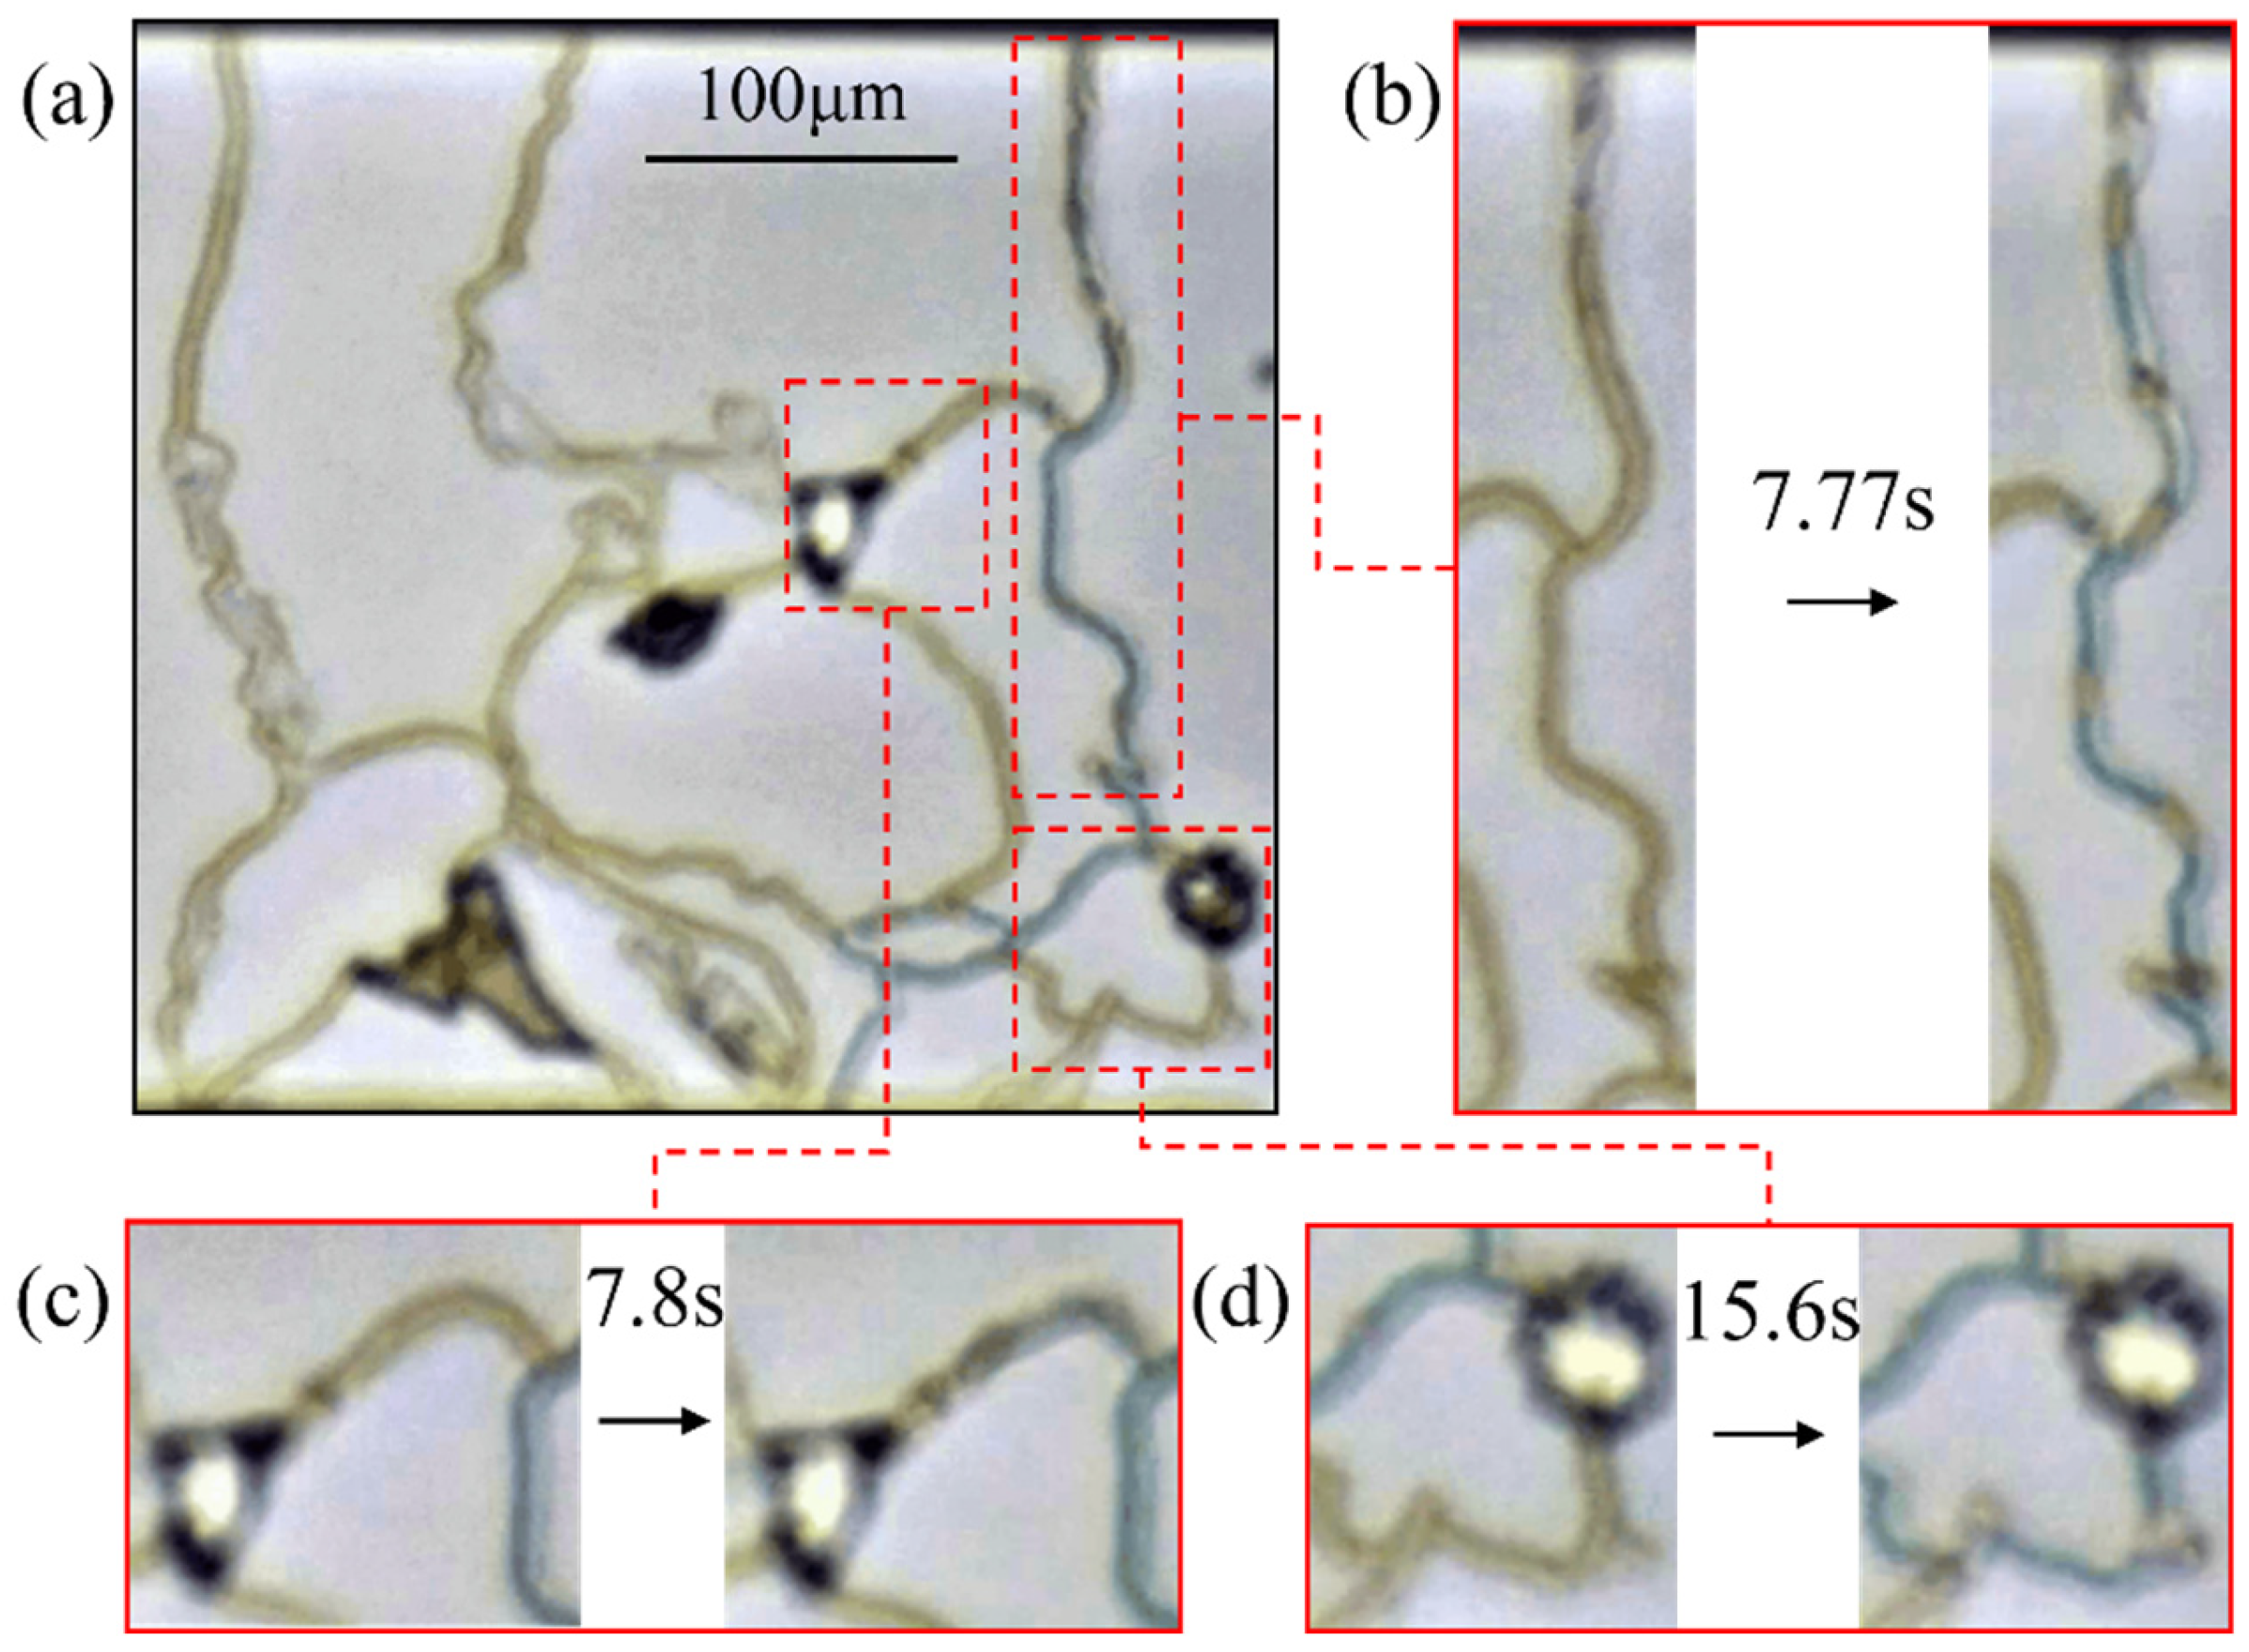
Pore structure significantly impacts flow resistance and velocity during displacement. In homogeneous structures, the flow state is relatively stable, with resistance primarily arising from viscous shear forces between the fluid and the pore walls. However, in large-pore fine-throat structures, abrupt changes in pore radius between large pores and fine throats introduce additional flow resistance, consequently reducing flow velocity. Additionally, the tortuosity of the pore structure also affects flow velocity. Large-pore fine-throat structures exhibit higher tortuosity, resulting in greater flow resistance. This conclusion is validated by Experiment 1; as shown in Figure 6, flow velocities reached 35.78 μm/s in homogeneous pore throat scale structure, compared to 4.92 μm/s (pre-breakthrough) and 7.84 μm/s (post-breakthrough) in large-pore and fine-throat structures.
Additionally, when CO2 flows through pore throat constrictions between large pores and fine throats, the Jamin effect, caused by trapped bubbles or droplets generating capillary pressure differences in narrow pore throats, introduces additional capillary resistance, thereby reducing displacement efficiency. As shown in Figure 7, abrupt diameter changes induce bubble deformation, subjecting CO2 to capillary resistance opposing flow direction. This significantly impedes displacement, at times rendering it unattainable. In Experiment 3, capillary resistance induced by the Jamin effect prevented CO2 from invading the H-shaped pore structure (featuring large pores on both sides of a fine throat) on the right side of the chip. This resulted in oil phase entrapment within the pores, forming dead zones, where local effective permeability approached near-zero levels. The flow time required to mobilize trapped oil substantially exceeded the experimental duration, ultimately diminishing local recovery efficiency. Without significantly increasing the displacement pressure gradient or altering interfacial properties, the trapped oil phase cannot be effectively displaced.
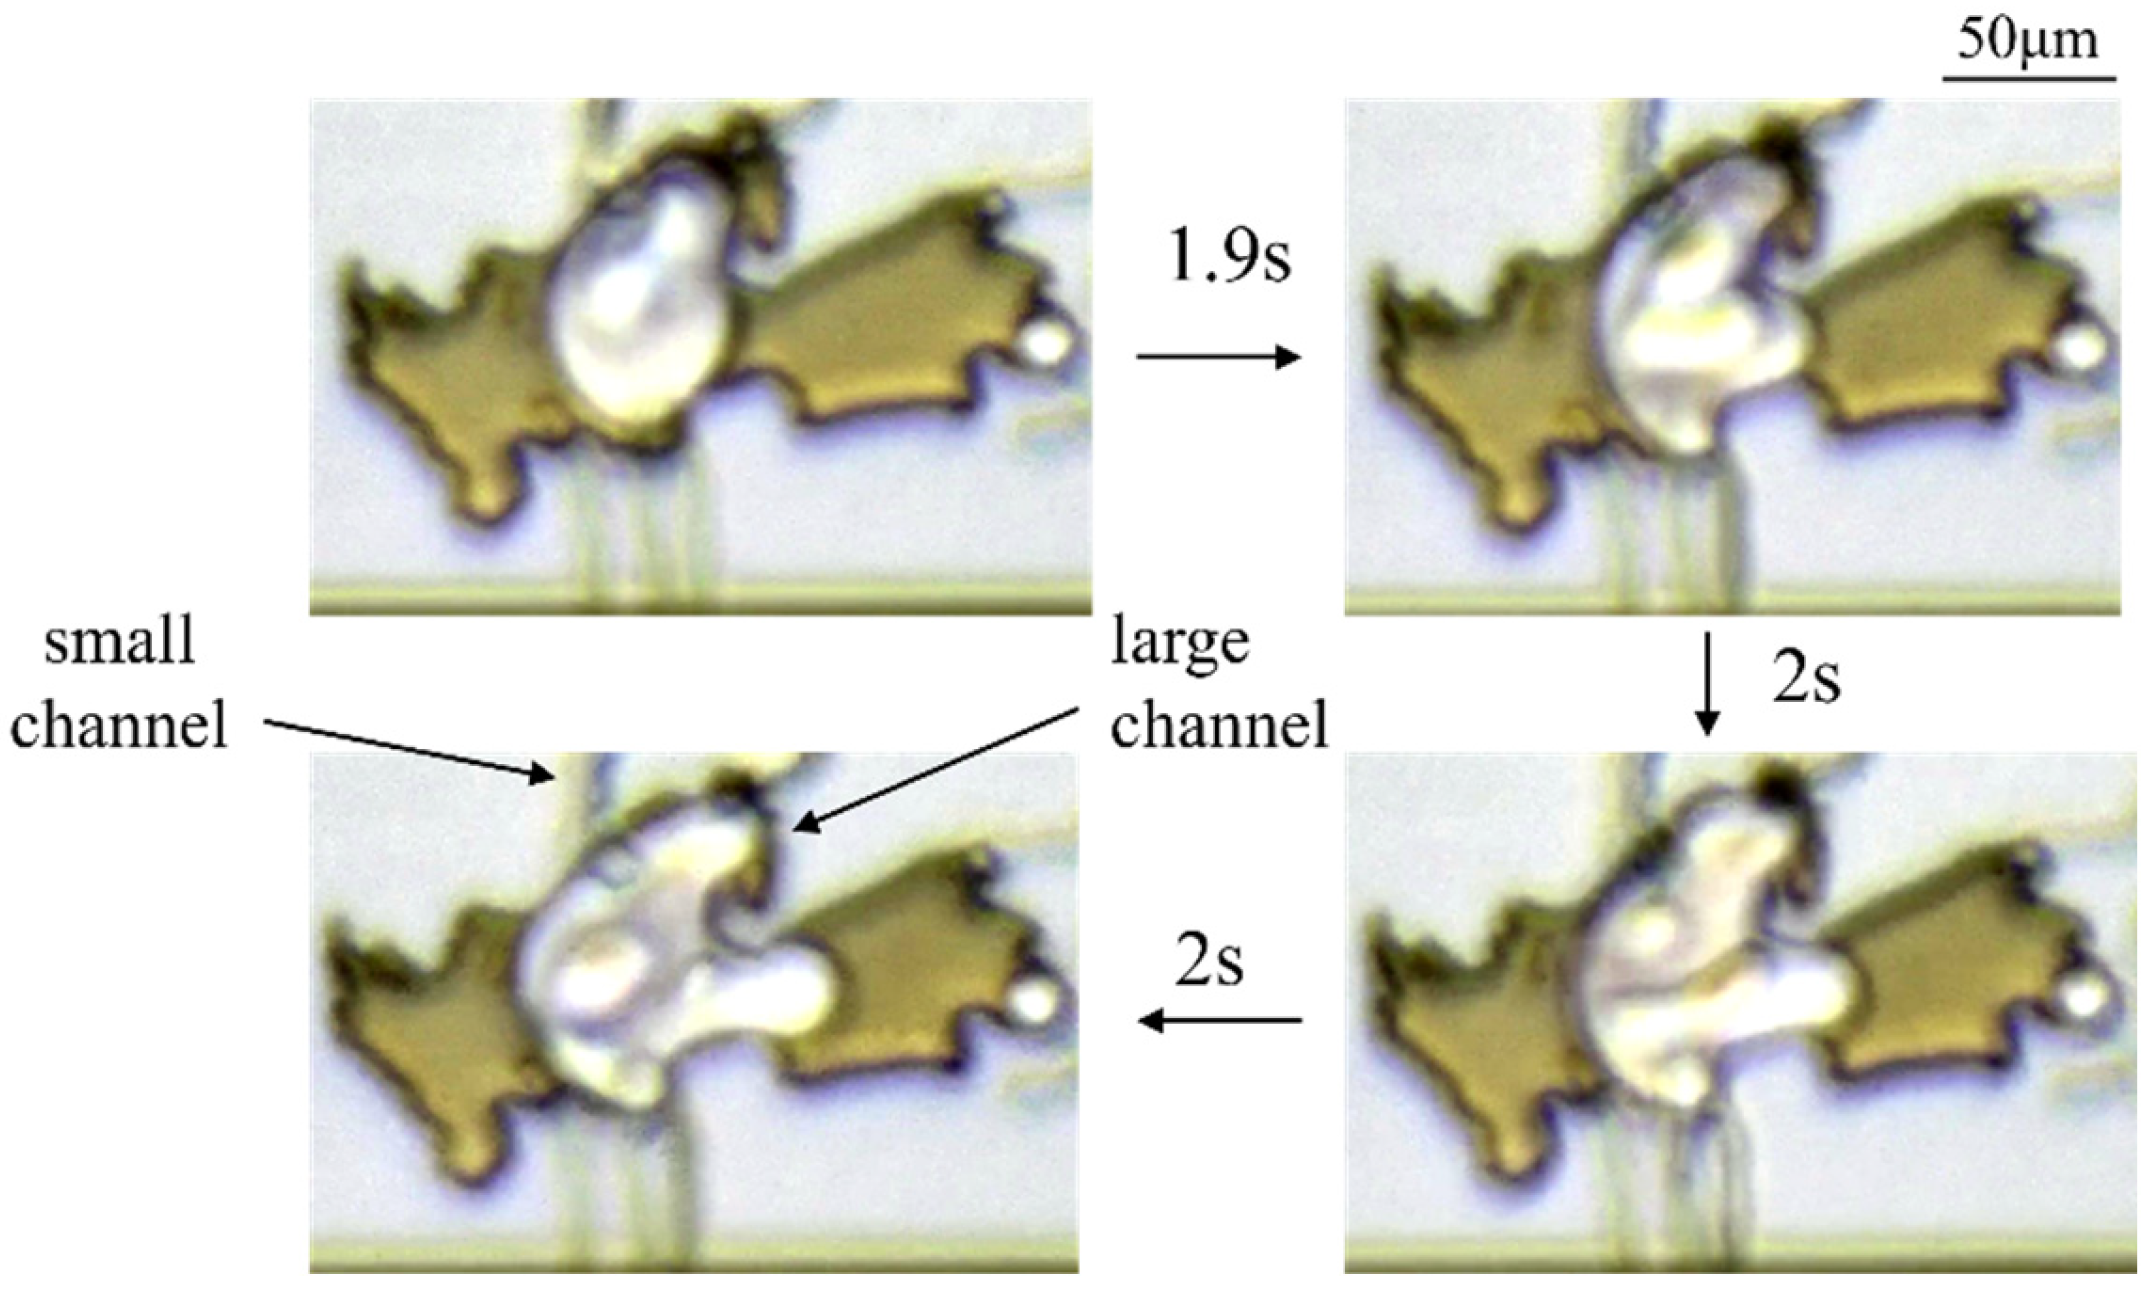
Significant depth and width variations between large pores and fine throats create substantial flow velocity differences when CO2 transitions from fine throats to large pores and contacts phase interfaces. Under conditions of 20 MPa and 85 °C, the density difference between CO2 at 0.56 g/mL and crude oil at 0.89 g/mL combines with flow velocity disparities to trigger interfacial instabilities through Kelvin–Helmholtz and Rayleigh–Taylor instability mechanisms. The phenomenon in the experiment is shown in Figure 8. Kelvin–Helmholtz instabilities amplify initial interfacial perturbations through high-velocity carbon dioxide shearing against low-speed oil. Insufficient viscous damping promotes interfacial curling instability, substantially reducing displacement efficiency. Although generated vortices may enhance local mixing and mobilize residual oil films under optimized conditions including low interfacial tension, moderate viscosity ratio, and controlled flow rate, destabilization effects dominate in pure CO2 flooding systems. Their limited positive contributions are difficult to utilize, typically resulting in reduced ultimate recovery.
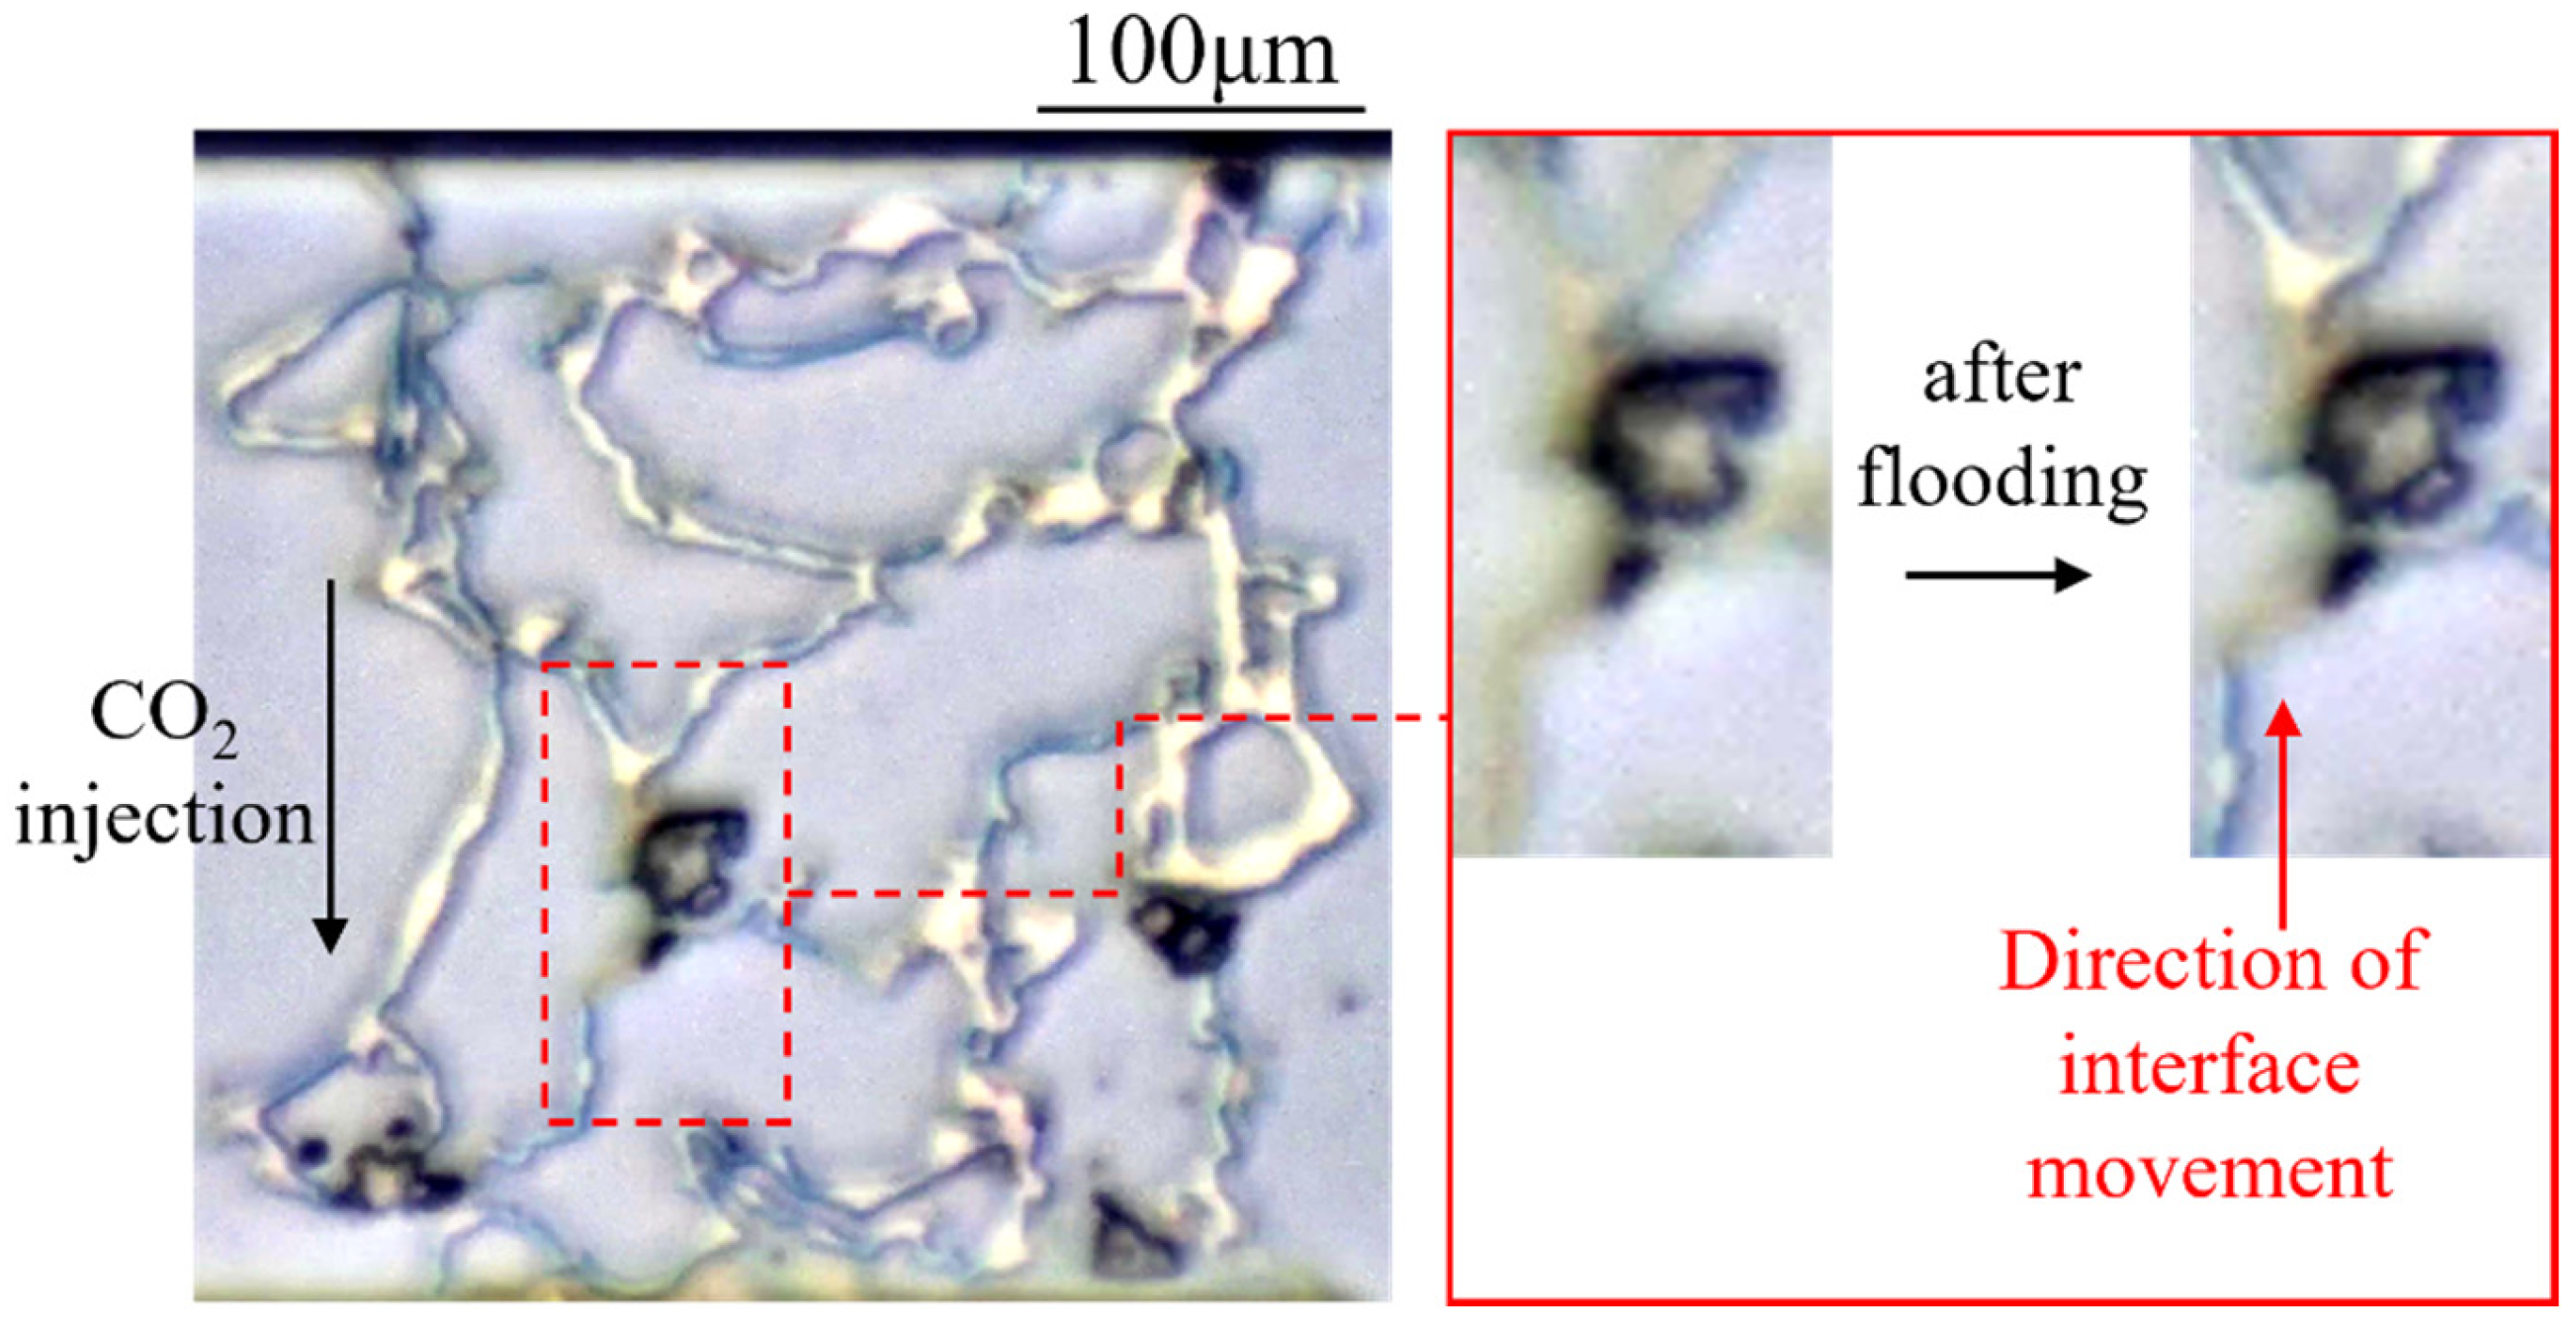
CO2 exhibits exceptional extraction abilities. In Experiment 2, microscopy revealed reversed phase interface movement relative to the primary gas injection direction. This crude oil section was produced through CO2 extraction rather than displaced from pore structures. The light components of the crude oil were extracted into the CO2, inducing interface movement, while heavy components concentrated in residual oil. This compositional shift resulted in visible darkening of post-extraction residues and increased production resistance due to heavy component enrichment. Figure 9 shows the interface dynamics during the extraction process.
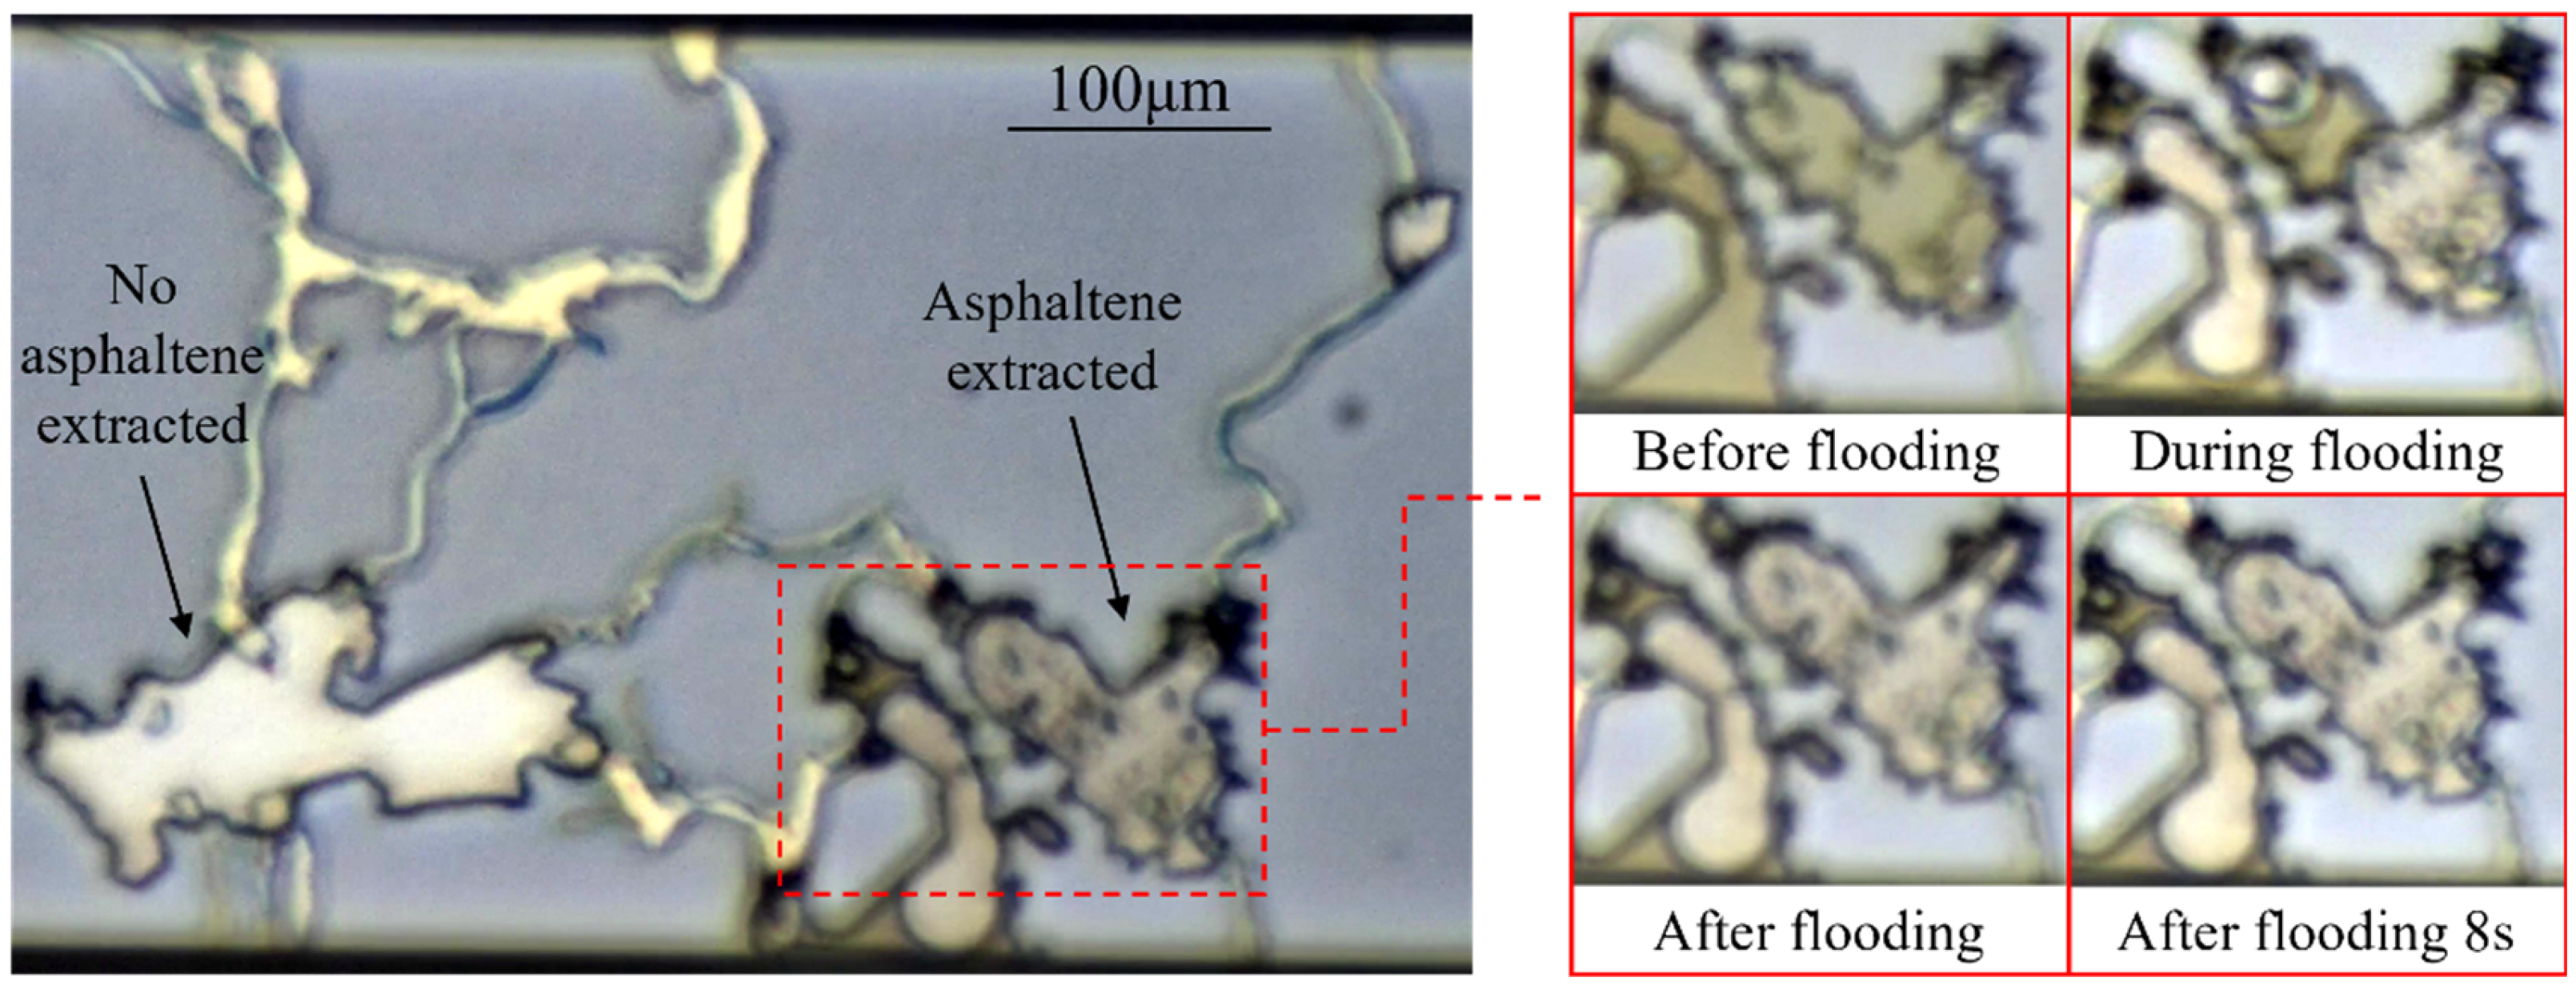
SARA analysis confirmed high resin and asphaltene content exceeding 27% in the test crude oil. During Experiment 3, the heterogeneity of the chip extended CO2/crude oil contact time on the right side to threefold that of the left side, resulting in a 25.6% reduction in macroscopic recovery efficiency. This impairment stems directly from the excellent extraction performance of CO2. Increasing the contact time between CO2 and crude oil allows CO2 to more fully extract the light components from the crude oil. This leads to an increased concentration of heavy components in the residual oil, elevating crude oil viscosity and thereby severely impeding the displacement process. Simultaneously, extraction of light components reduces the stability of the crude oil composition, causing black asphaltene to precipitate and progressively aggregate. Figure 10 demonstrates both the differential recovery outcomes between the left and right sides of the chip and the asphaltene precipitation process. The darkening of residual oil provides direct evidence for extraction of light components by CO2. Our microfluidic approach used in the experiments focuses on in situ real-time visualization and does not enable quantitative measurement of asphaltene content. However, Lamia Goual et al. [47] have proposed a feasible microfluidic-based measurement method.
The permeability of the chips used in the experiment is an important factor that affects the recovery. These values were calculated using Equations (2) and (3) and are presented in Table 2:
φ = V pore V total × 100 %
K = φ r 2 8 τ 2
where φ is the chip porosity, Vpore is the volume of the pore structure, Vtotal is the volume of the cuboid that just holds the pore structure, K is the permeability, r is the average pore size, and τ is the tortuosity.
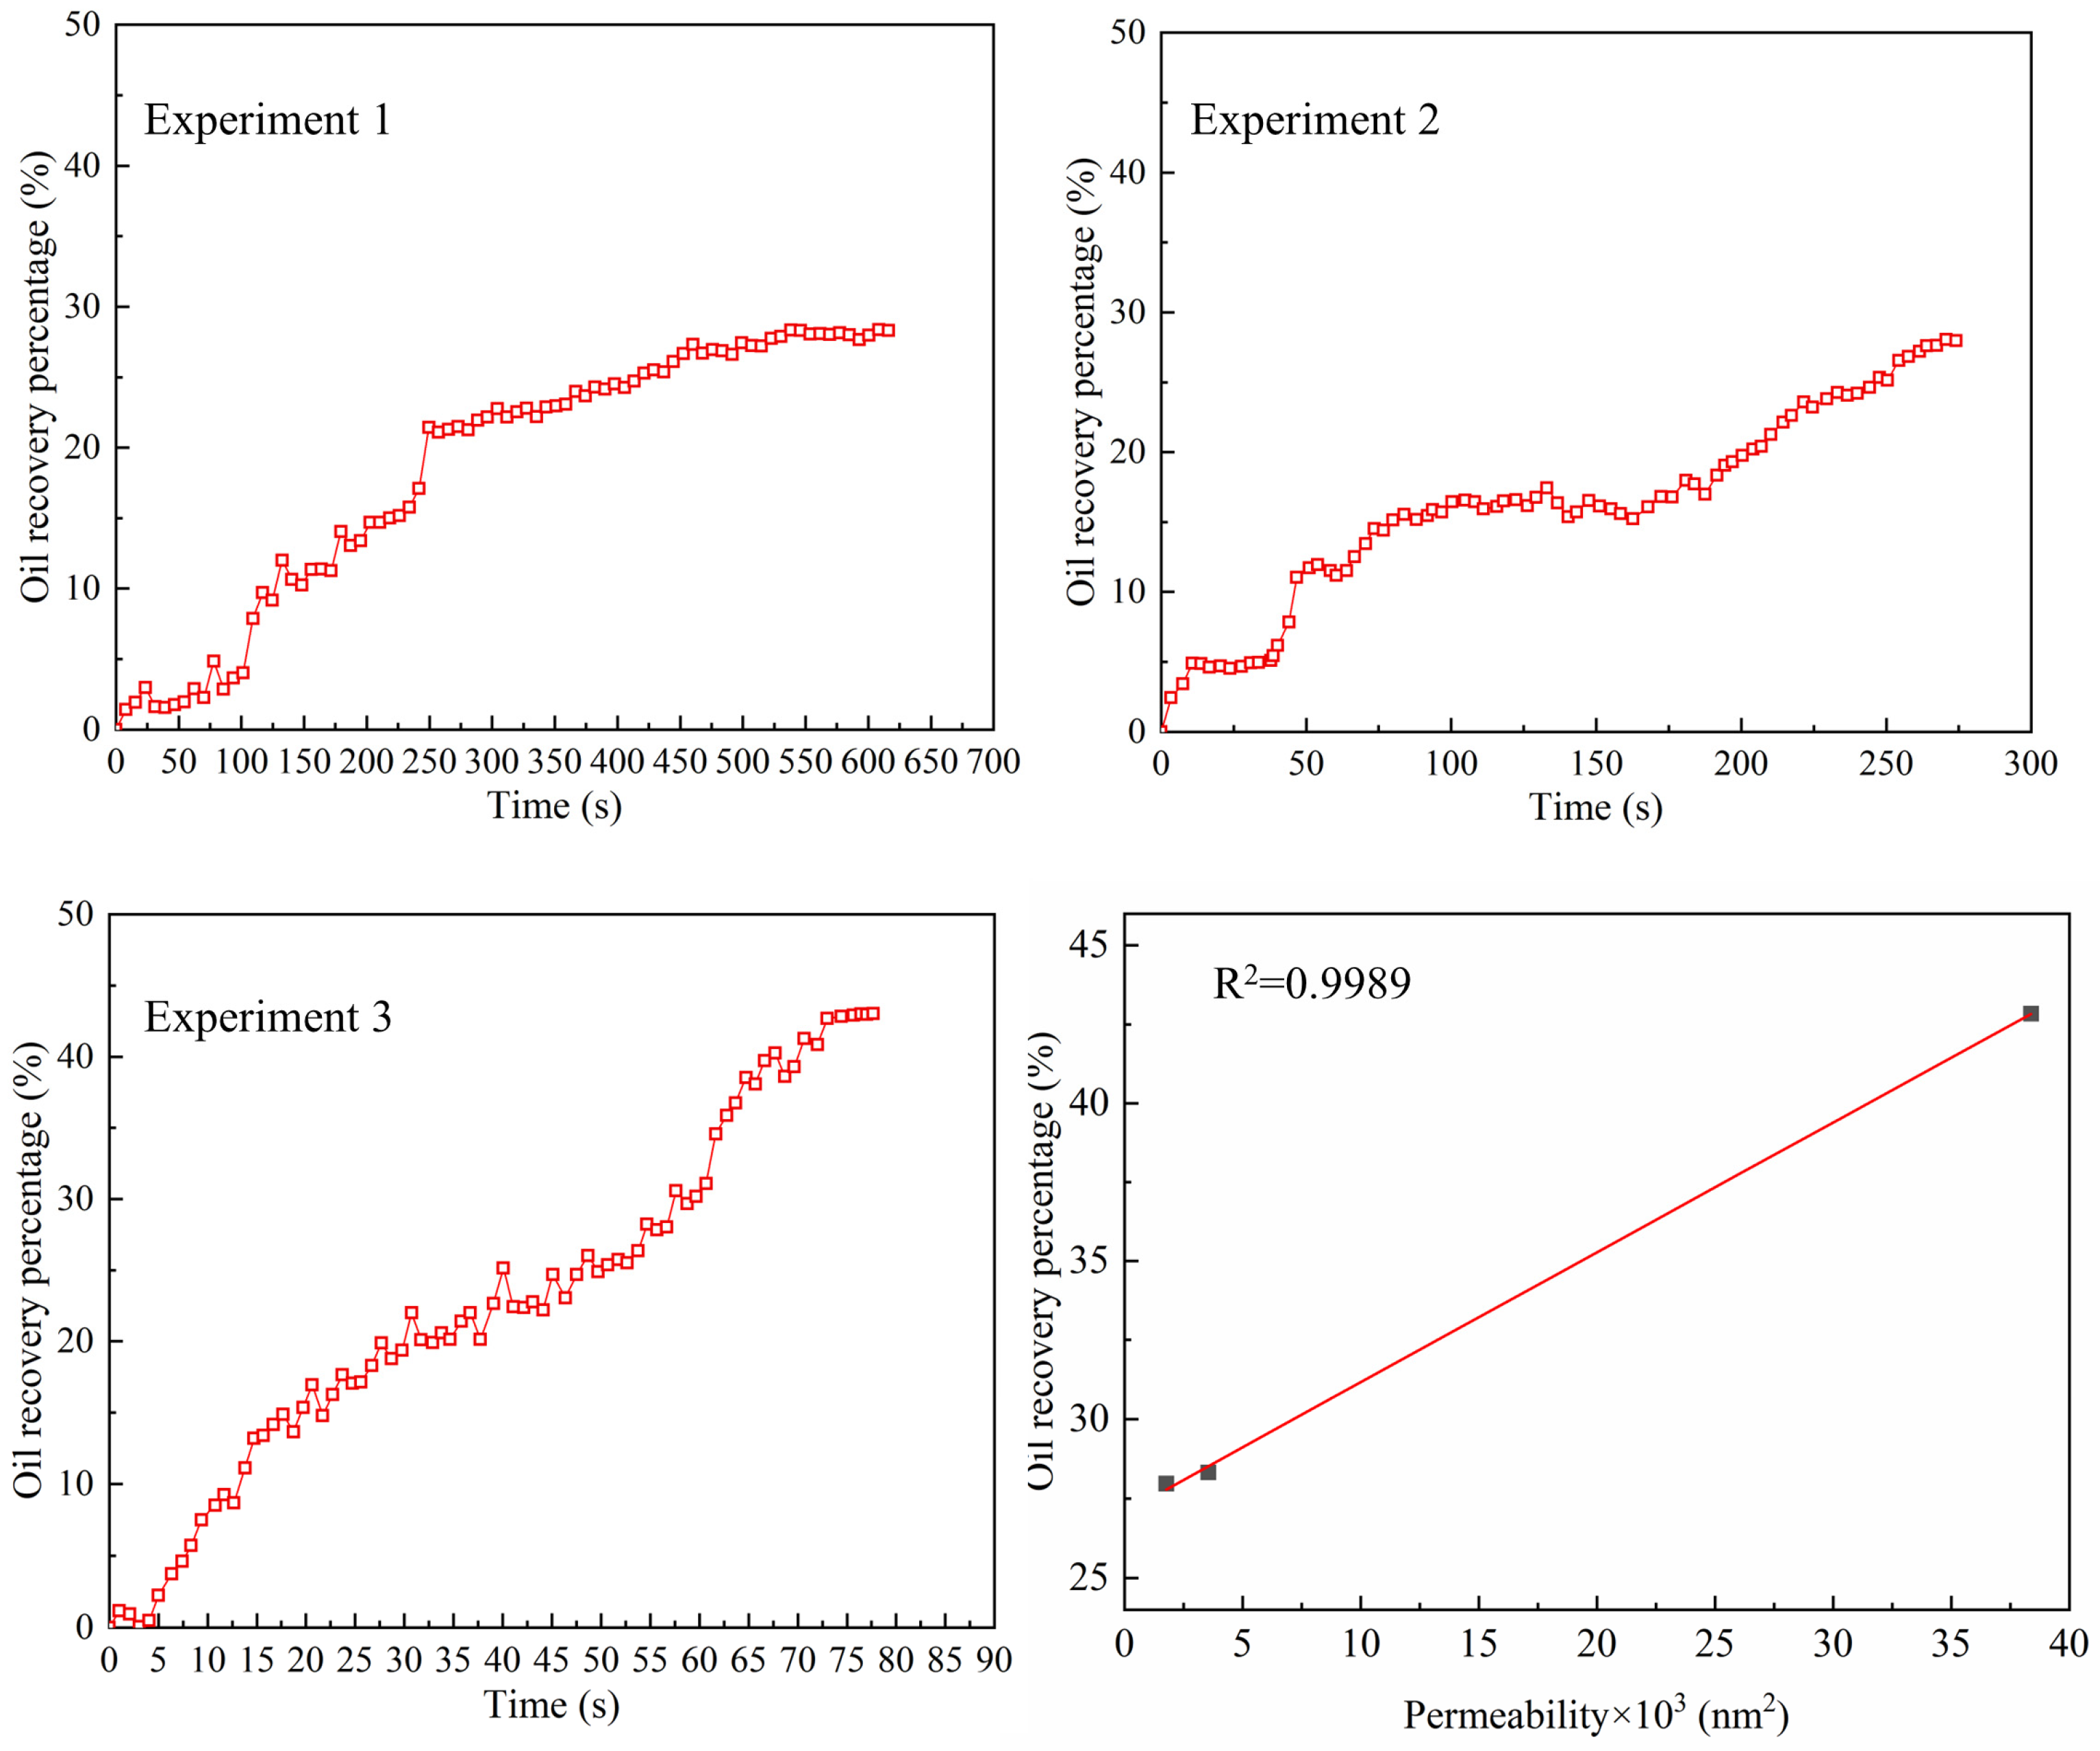
We compared the permeability of the chips used in the three groups of CO2 immiscible flooding experiments, which revealed that the chip in Experiment 3 had significantly higher permeability than the other two. This difference was due to the chip in Experiment 3 having more large-pore structures and a larger experimental pore volume. As shown in Figure 11, a comparison of the recovery rates across the three experiments with the permeability of their respective chips shows that recovery rate and permeability are positively correlated, and that increasing permeability is beneficial for increasing recovery rate.

3.2. Constant Volume Depletion Experiments

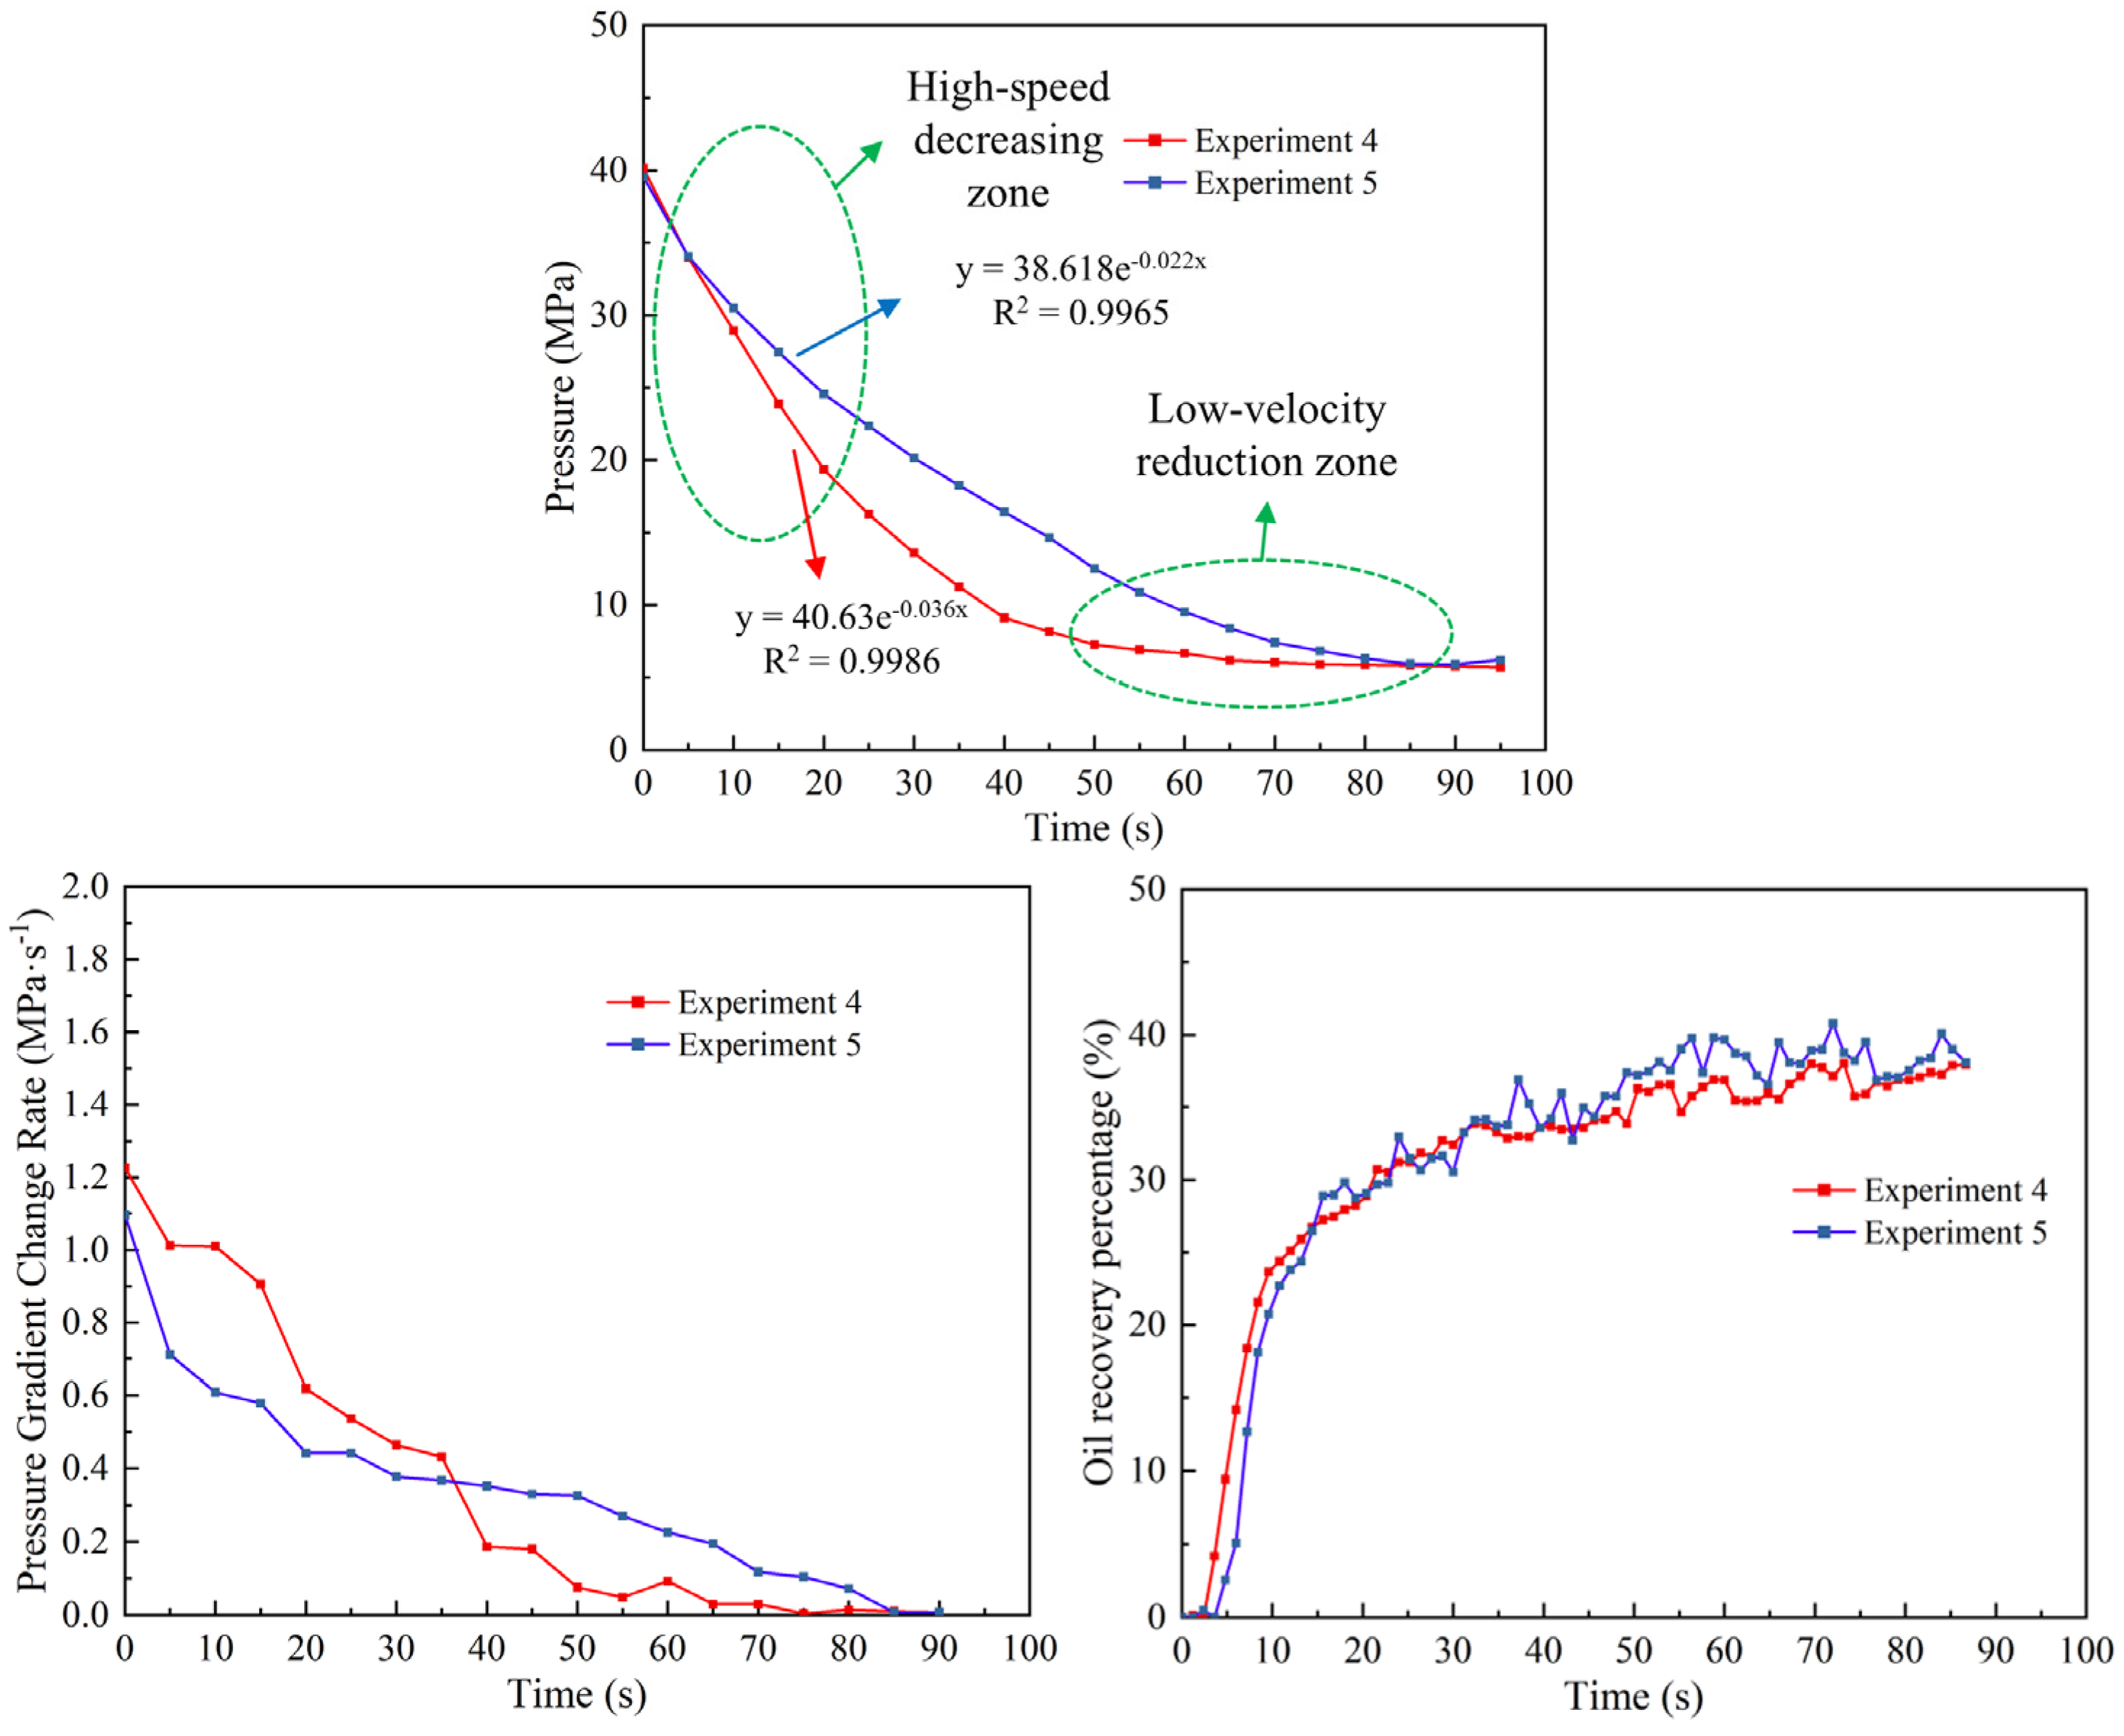
Constant volume depletion (CVD) involves pressurizing crude oil followed by rapid depressurization to exploit its elastic potential energy for oil recovery; no CO2 is injected throughout the process. Specifically, as shown in Figure 12, the pressure change during depletion comprises two distinct stages: a high-speed stage where pressure declines exponentially, and a low-speed stage where pressure decreases linearly at a slower rate. The pressure gradient change rate decreases over time during the depletion process.
The instantaneous recovery rate increases logarithmically with production time. Based on the pressure and recovery rate change curves, the recovery process is divided into two stages: an initial stage from the formation pressure down to 30 MPa and a later stage from 30 MPa down to the bottomhole pressure. In the initial stage, the substantial pressure differential between the two ends results in higher instantaneous oil production, leading to a more rapid rise in the recovery rate. As production time increases, the pressure differential diminishes and the rise in recovery rate gradually slows down. Throughout the depletion process, more oil is produced during the early depletion stage, constituting over 60% of the total oil recovery (detailed data can be found in Table 3). This is primarily due to the significant elastic energy released from the formation for oil displacement during the early stage of constant volume depletion, causing oil production to increase rapidly.

3.3. CO2 Huff-n-Puff Experiments

Bubble nucleation is a typical phenomenon in huff-n-puff. This phenomenon is primarily caused by the rapid pressure drop during the production phase, which triggers the release of a significant amount of CO2 that was dissolved into the crude oil during the high-pressure soaking phase. As pressure continues to decline, the released CO2 expands further, displacing crude oil from the pore structure and thereby enhancing oil recovery. Figure 13 shows the process of bubble nucleation.
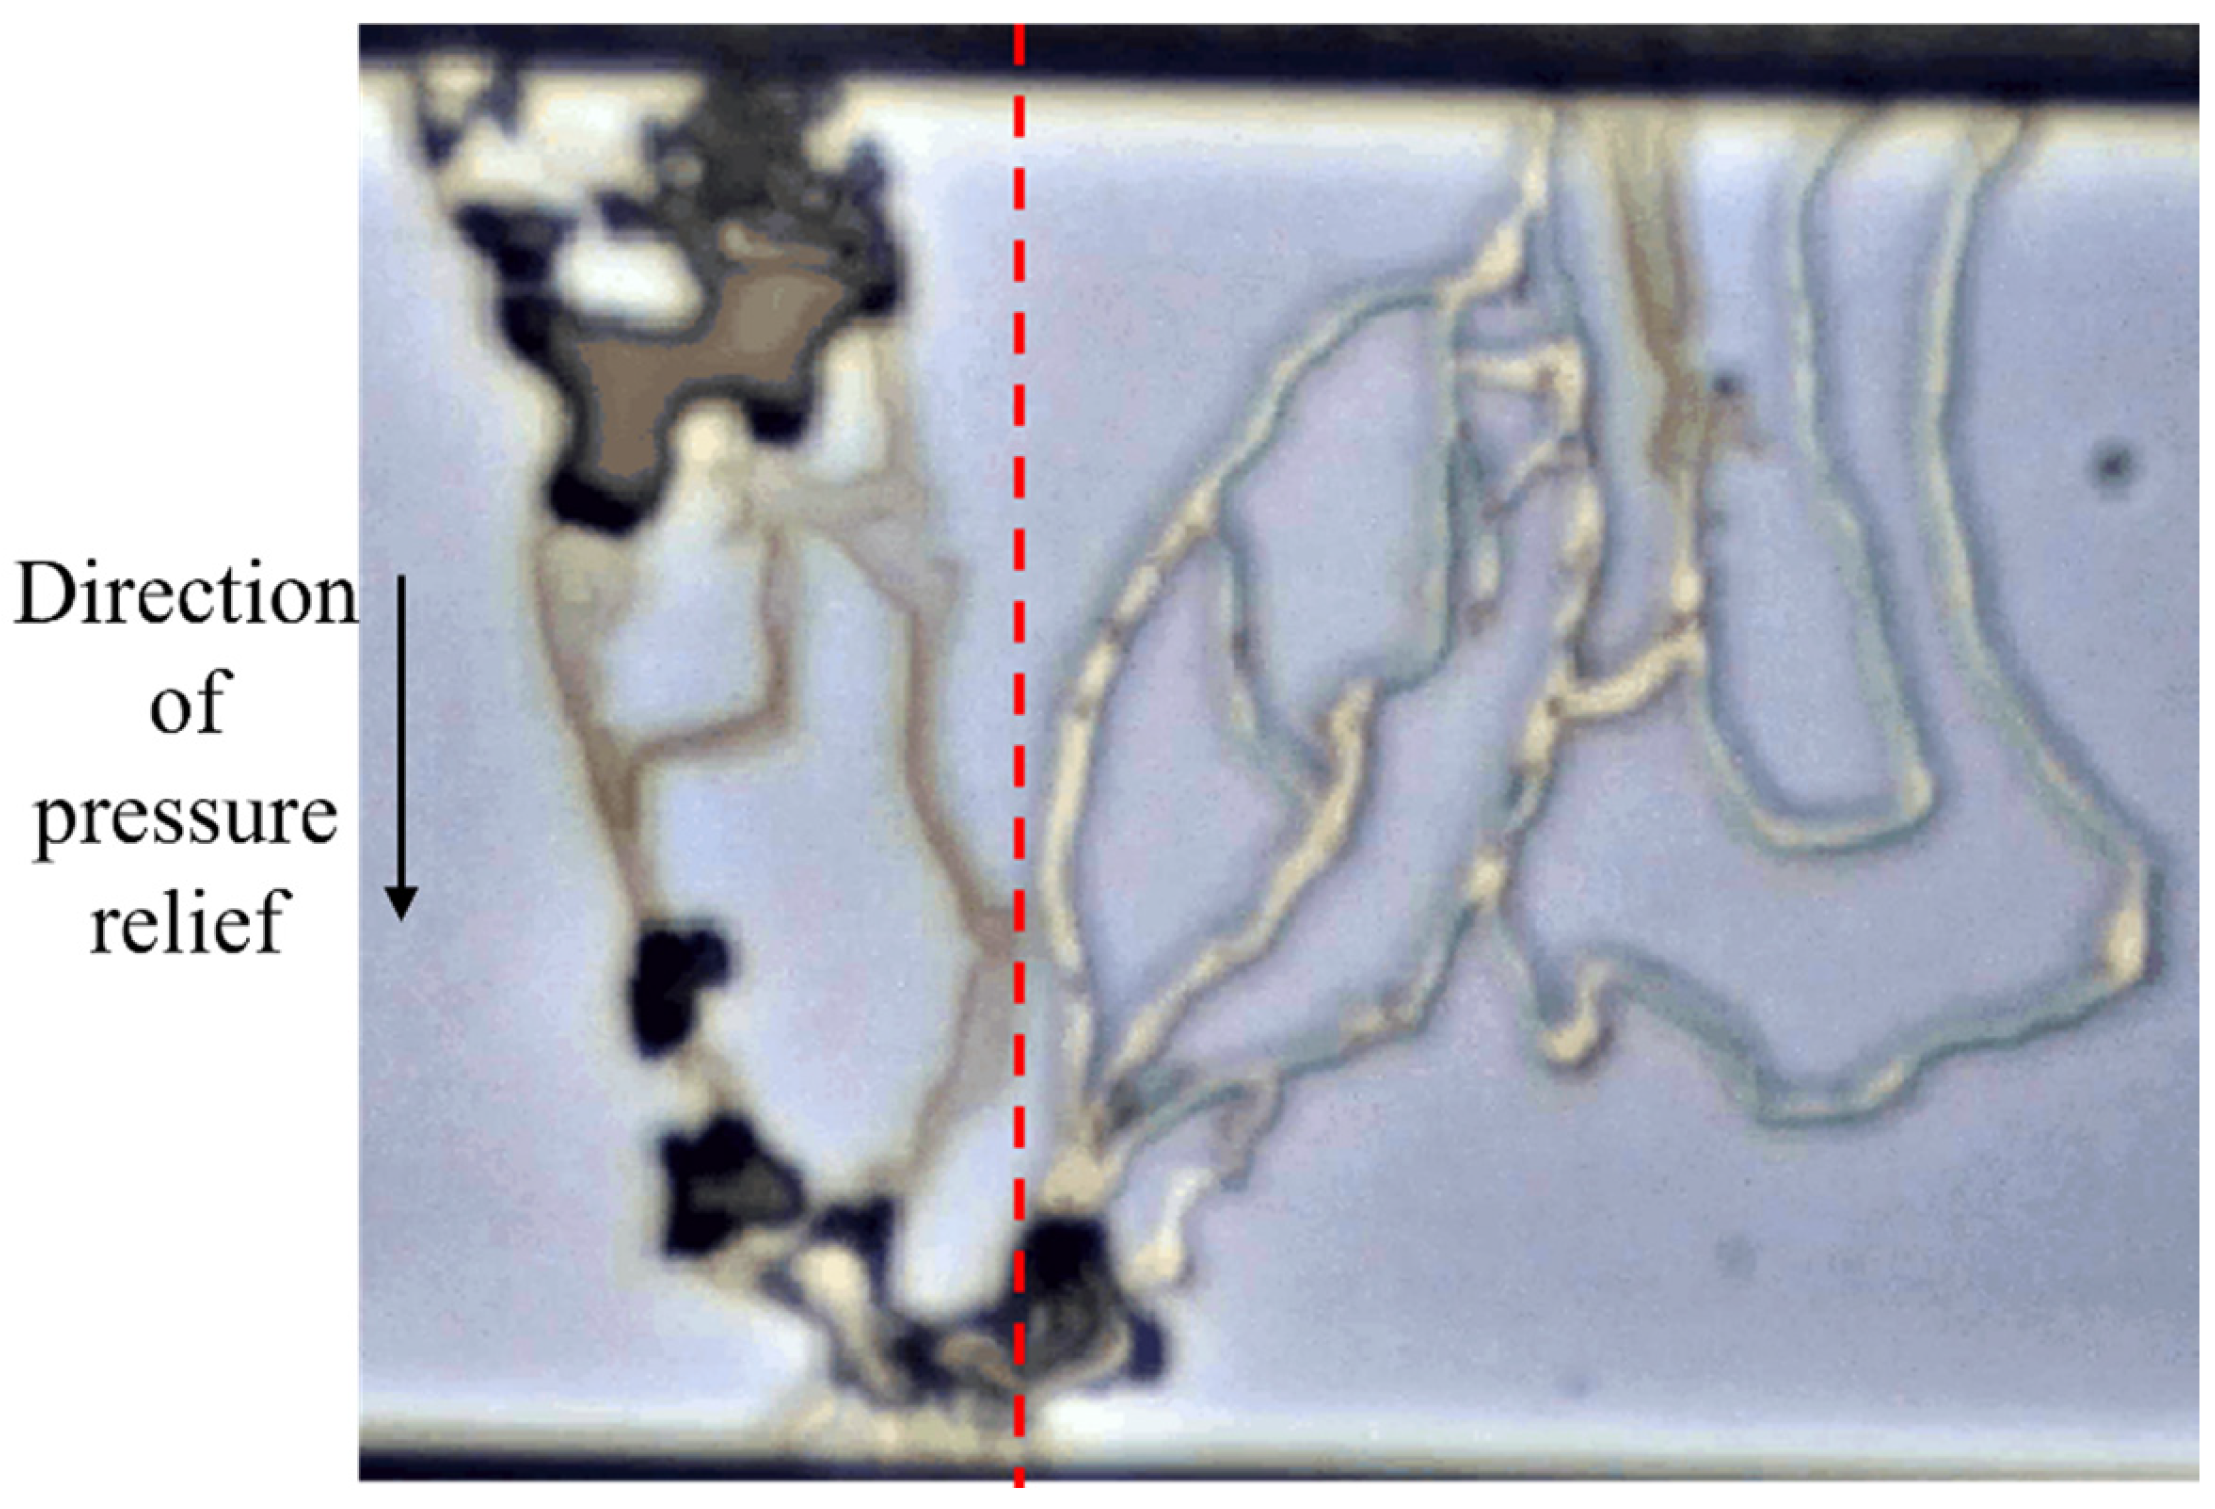
The pore structure also significantly influenced crude oil recovery in the huff-n-puff experiment, leading to significant variations in recovery efficiency and distribution of crude oil across different areas of the chip. When bubbles passed through throat constrictions at junctions between large pores and fine throats, they encountered additional capillary resistance due to the Jamin effect, significantly impeding their transport. As shown in Figure 14, this effect was particularly evident in Experiment 7, which featured more pore throat structures on the left side of the chip than on the right; consequently, the production startup rate and oil recovery rate on the left side were significantly slower than those on the right during the experiment.
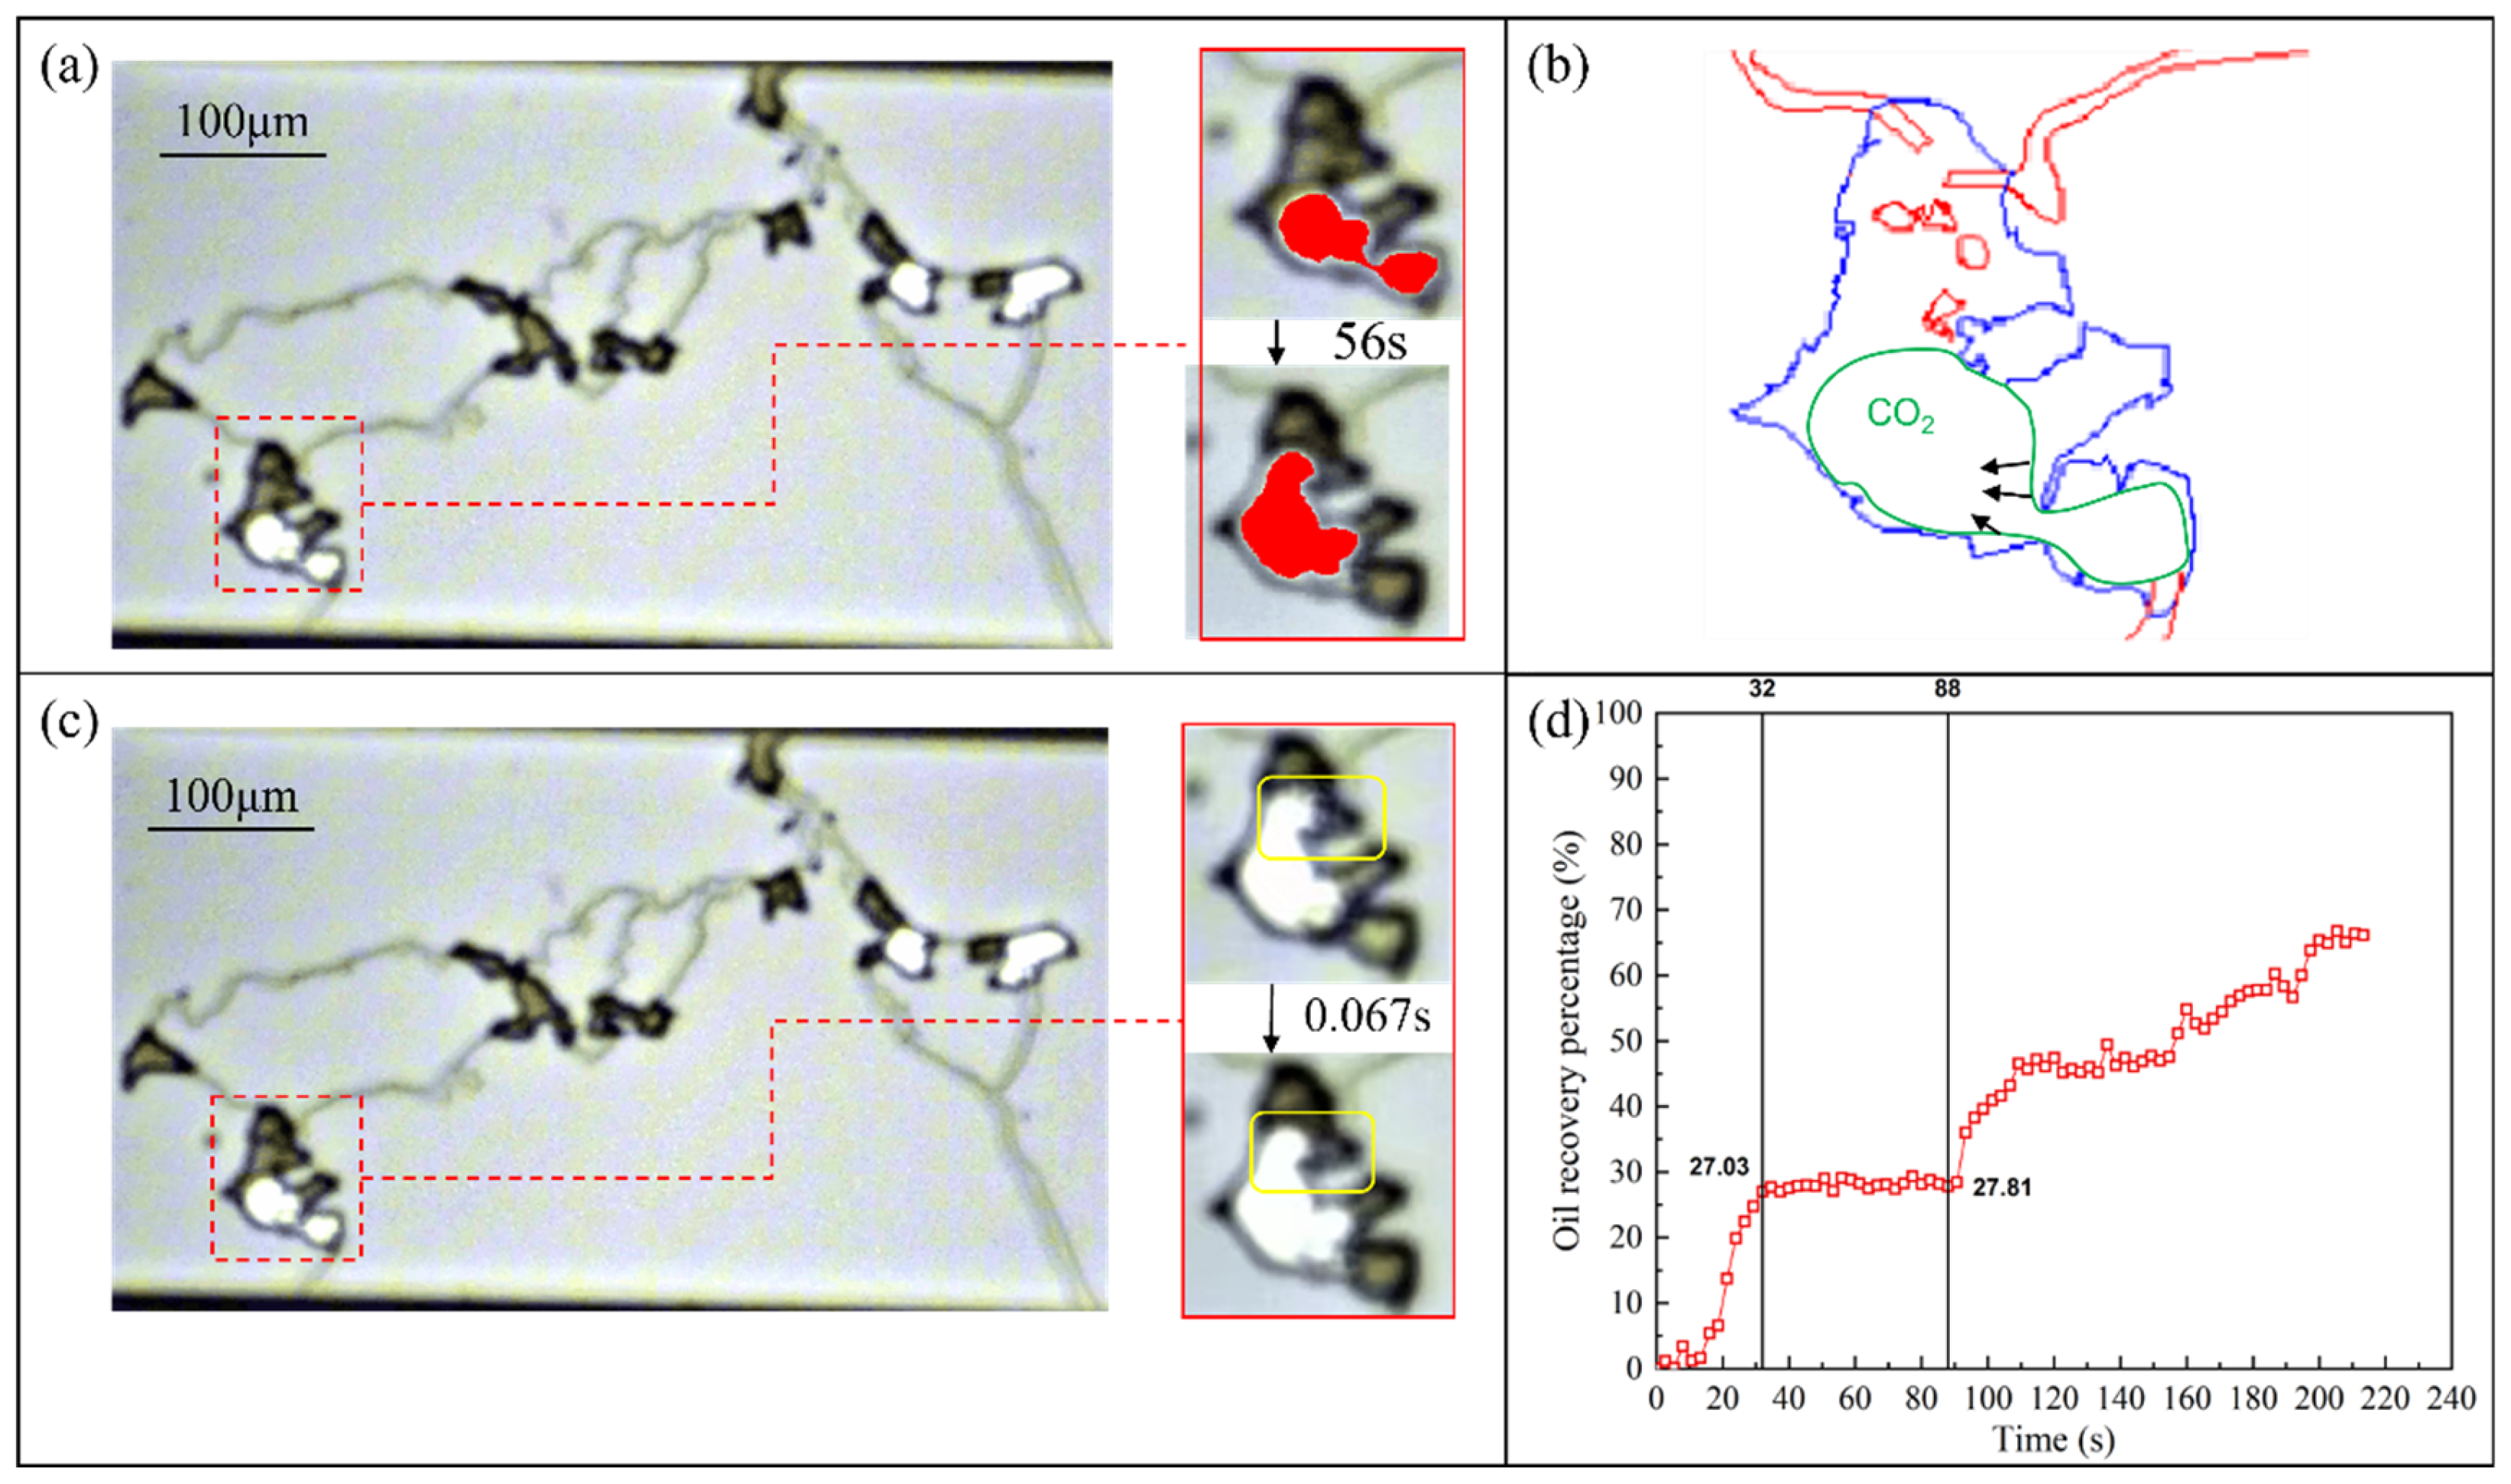
In Experiment 6, the Jamin effect significantly hindered the crude oil recovery process. The recovery process comprised three distinct stages, as Figure 15d shows: expansion stage (0–32 s), equilibrium stage (32–88 s), and final stage (88 s until the end).
In the expansion stage (0–32 s), the recovery rate increased rapidly, bubble nucleation occurred, and the interface between desorbed CO2 and crude oil formed and expanded rapidly. However, resistance due to the Jamin effect prevented breakthrough of the pore throat structure. During the equilibrium stage (32–88 s), the recovery rate remained nearly constant. In this stage, CO2 was almost completely desorbed, the interface ceased expanding, and the CO2 volume remained relatively stable. As shown in Figure 15a,b, due to the isotropy of interfacial tension, CO2 aggregation and transport tended to form spherical interfaces.
During the final stage (88 s until the end of the experiment), further pressure reduction caused significant short-term fluctuations in the interface, while bubble volume remained relatively stable. Subsequently, CO2 rapidly broke through the pore throat structures, which is shown in Figure 15c. This occurred because CO2 underwent continuous desorption and decreasing pressure triggered bubble bursting, inducing violent interfacial fluctuations that overcame shrinkage resistance.
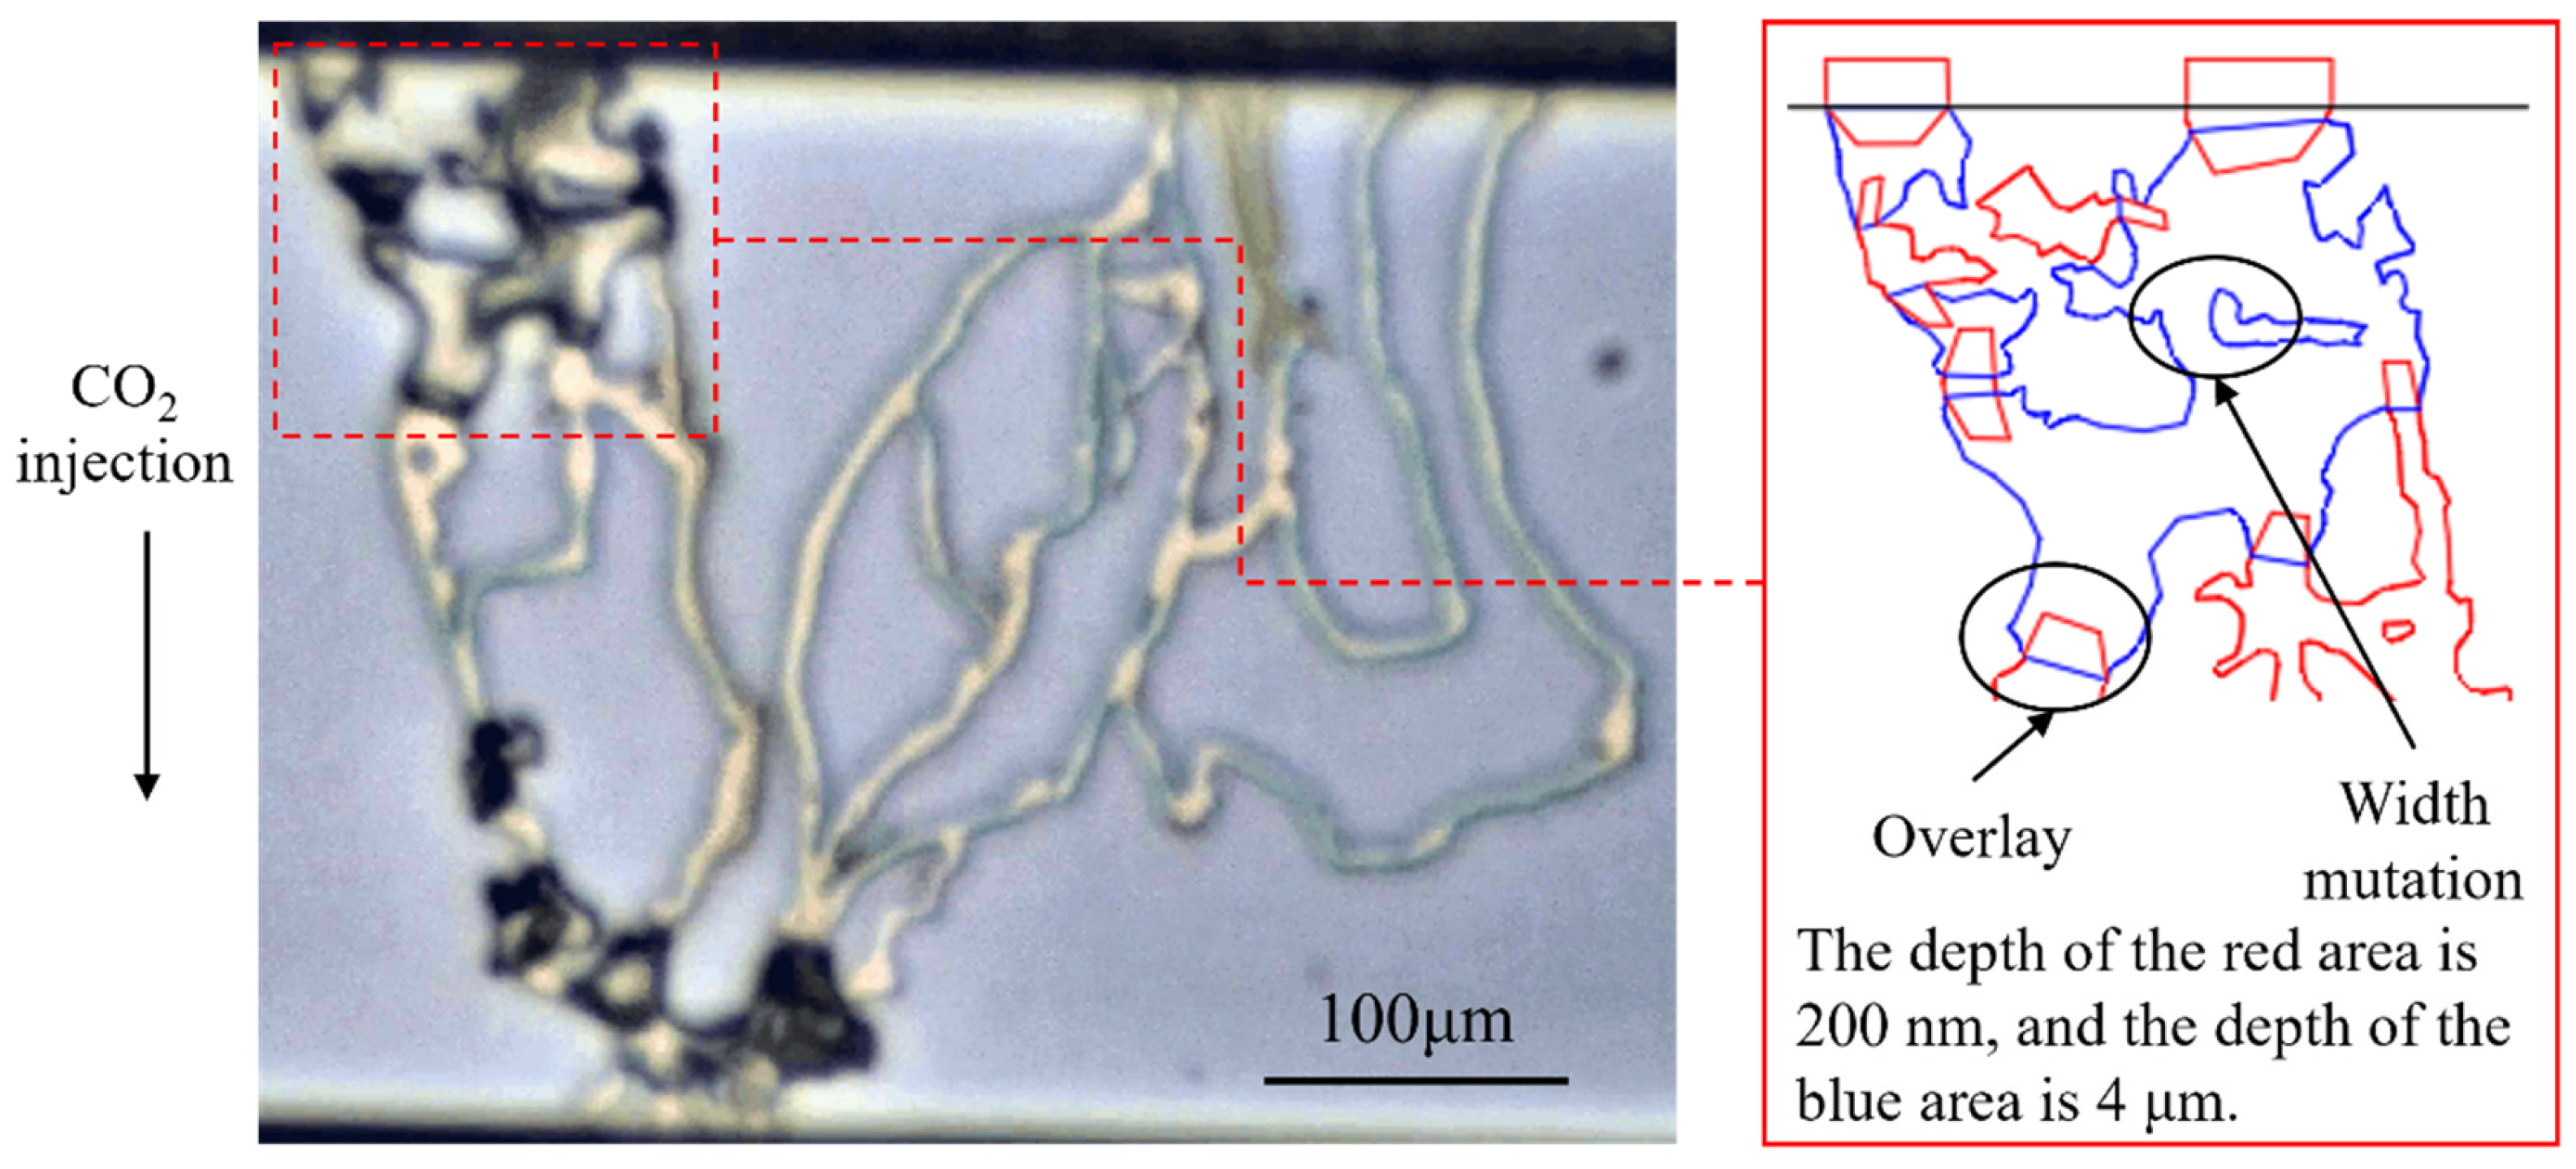
As shown in Figure 16, the crude oil residual rate exhibited distinct spatial characteristics across pore structures at the end of recovery. Calculations showed a residual rate of 30.31% in large pores, while fine throats retained only 6.22%. Higher residual rates occurred at large pore and fine throat overlap structures and abrupt width transition zones within large pores due to capillary trapping. Additionally, residual oil decreased progressively closer to the CO2 injection point.
Comparison of the three huff-n-puff experiments revealed that differences in inlet and outlet cross-sections and huff-n-puff forms caused significant variations in recovery efficiency. The chip data and experimental results for these variations are presented in Table 4. Varied cross-sectional areas influenced both the amount of CO2 dissolution during the soaking process and the production rate during the pressure reduction process. Comparative analysis demonstrates that Experiment 7 achieved superior recovery over Experiment 6 despite lower permeability, attributable to fundamental differences in huff-n-puff forms: Experiments 6 and 8 utilized single-well huff-n-puff, whereas Experiment 7 employed dual-well huff-n-puff. This operational divergence creates distinct outcomes: in single-well huff-n-puff where CO2 injection and production share the same wellbore, leading to crude oil near the wellbore dissolving more CO2; conversely, in the dual-well huff-n-puff, CO2 enters from one side and flows out from the other side, causing more dissolved CO2 in the crude oil at the bottom of the well during the puff stage, significantly enhancing oil displacement during CO2 desorption expansion from crude oil in deep reservoirs. Although dual-well huff-n-puff can significantly improve recovery, the production cost of dual-well huff-n-puff will be significantly higher in practical applications.
In Table 5, we compare the chip characteristics and recovery results between CO2 immiscible flooding experiments (Experiments 1–3) and CO2 huff-n-puff experiments (Experiments 6–8). The results show that huff-n-puff achieves significantly higher ultimate recovery, even when compared to Experiment 3—which utilized the chip with the highest permeability. This enhanced performance stems not only from experimental pressure differences but, more importantly, from the mechanistic advantages of huff-n-puff. During the experimental process, CO2 dissolution effectively reduces oil viscosity, thereby reducing resistance caused by the Jamin effect. Concurrently, CO2 desorption and expansion during the puff stage substantially improve sweep volume.

4. Conclusions

In this paper, we focus on the microtransport phenomena in the recovery process of the Jimsar shale reservoir using microfluidic technology under maximum experimental pressures of 40 MPa, with chip pore depths of 200 nm. The results of our study are as follows:
(1)
Pore structure significantly affects crude oil recovery. When fluid flows through large-pore and fine-throat structures, abrupt changes in pore throats increase local resistance, impeding fluid flow. Conversely, homogeneously distributed pore throat structures enhance connectivity and promote fluid flow; experiments showed flow rates in such structures were more than four times higher than those in large-pore and fine-throat configurations. When bubbles pass through constrictions with sudden depth/width reductions, the Jamin effect generates capillary resistance opposing flow direction, reduces bubble velocity, and may prevent entry into these zones, forming dead zones.
(2)
In CO2 immiscible flooding experiments, differential flow resistance causes the majority of the crude oil to be displaced through dominant channels, establishing preferential flow pathways. Simultaneously, non-dominant channels exhibit capillary trapping phenomena that result in liquid plugging. In the experiments, the slug flow phenomenon was observed, which impedes fluid transport and reduces displacement efficiency. The capillary number (Ca) at slug flow occurrence points was determined through calculation, simultaneously revealing that lower Ca values correspond to more pronounced liquid slugs.
(3)
CO2 exhibits superior extraction capability, enabling extraction of light components from crude oil while partially recovering crude oil resistant to displacement through the extraction mechanism. Extended contact time of CO2 and crude oil intensifies extraction effects, concurrently increasing heavy component content in residual oil. This elevates crude oil viscosity and reduces its deformability, heightening resistance to displacement and thereby reducing macroscopic recovery rates. In the experiments, structural heterogeneity caused a threefold longer contact duration on the chip’s right versus left side, resulting in a 25.6% decrease in macroscopic recovery rate.
(4)
In the huff-n-puff experiment, rapid pressure reduction triggers desorption of CO2, generating bubbles that grow and expand to displace crude oil from pore spaces. The recovery efficiency correlates with huff-n-puff modes and inlet/outlet cross-sectional areas. In our experiments, it was observed that desorbed bubbles tend to assume spherical configurations due to interfacial tension within pore structures. Subsequent pressure declines cause these bubbles to break through constricted pore throats.
(5)
Compared with CO2 immiscible flooding which directly displaces oil from pore structures using CO2, the huff-n-puff process significantly enhances fluid mobility by intensifying interactions of CO2 and crude oil during the soaking period while achieving viscosity reduction through CO2 dissolution. Simultaneously, trapped oil zones occur more frequently in CO2 immiscible flooding than in huff-n-puff experiments, resulting in a lower recovery rate.
In this study, microfluidic technology is employed to reveal microscopic mass transfer phenomena during crude oil recovery, providing actionable strategies for shale oil development. Key operational insights include suppressing slug flow in immiscible flooding through Ca value via controlled gas injection, preventing asphaltene precipitation by minimizing static contact through regulated CO2 exposure or pulsed injection, and selecting optimal displacement methods based on reservoir heterogeneity and economic factors—collectively enhancing recovery efficiency and cost-effectiveness in field operations.

Author Contributions

Methodology, N.X.; Software, Y.Z.; Formal analysis, Y.Z. and Z.J.; Investigation, H.G.; Data curation, H.G. and J.W.; Writing—original draft, H.G. and J.W.; Writing—review and editing, B.B.; Supervision, B.B.; Funding acquisition, B.B. All authors have read and agreed to the published version of the manuscript.

Funding

This work was financially supported by the National Natural Science Foundation of China (No. 22278128).

Data Availability Statement

The original contributions presented in this study are included in the article, further inquiries can be directed to the corresponding author.

Conflicts of Interest

Authors Huiying Guo, Yuankai Zhang, Ning Xu, Zhaowen Jiang are employed by the Xinjiang Oilfield Company, Petrochina. The remaining authors declare that the research was conducted in the absence of any commercial or financial relationships that could be construed as a potential conflict of interest.

References

  1. Zhao, W.; Hu, S.; Hou, L.; Yang, T.; Li, X.; Guo, B.; Yang, Z. Types and Resource Potential of Continental Shale Oil in China and Its Boundary with Tight Oil. Pet. Explor. Dev. 2020, 47, 1–11. [Google Scholar] [CrossRef]
  2. Zhao, H.; Ning, Z.; Wang, Q.; Zhang, R.; Zhao, T.; Niu, T.; Zeng, Y. Petrophysical Characterization of Tight Oil Reservoirs Using Pressure-Controlled Porosimetry Combined with Rate-Controlled Porosimetry. Fuel 2015, 154, 233–242. [Google Scholar] [CrossRef]
  3. Ye, D.; Liu, G.; Wang, F.; Gao, F.; Yang, T.; Zhu, J. Fractal Hydrological-Thermal–Mechanical Analysis of Unconventional Reservoir: A Fracture-Matrix Structure Model for Gas Extraction. Int. J. Heat Mass Transf. 2023, 202, 123670. [Google Scholar] [CrossRef]
  4. Xu, Y.; Lun, Z.; Pan, Z.; Wang, H.; Zhou, X.; Zhao, C.; Zhang, D. Occurrence Space and State of Shale Oil: A Review. J. Pet. Sci. Eng. 2022, 211, 110183. [Google Scholar] [CrossRef]
  5. Salygin, V.; Guliev, I.; Chernysheva, N.; Sokolova, E.; Toropova, N.; Egorova, L. Global shale revolution: Successes, challenges, and prospects. Sustainability 2019, 11, 1627. [Google Scholar] [CrossRef]
  6. Chauhan, A.; Salehi, F.; Jalalifar, S.; Clark, S. Two-phase modelling of the effects of pore-throat geometry on enhanced oil recovery. Appl. Nanosci. 2021, 13, 453–464. [Google Scholar] [CrossRef]
  7. Jia, B.; Su, J. Advancements and Environmental Implications in Oil Shale Exploration and Processing. Appl. Sci. 2023, 13, 7657. [Google Scholar] [CrossRef]
  8. Sharma, S.; Agrawal, V.; Akondi, R. Role of biogeochemistry in efficient shale oil and gas production. Fuel 2020, 259, 116247. [Google Scholar] [CrossRef]
  9. Taheri-Shakib, J.; Kantzas, A. A comprehensive review of microwave application on the oil shale: Prospects for shale oil production. Fuel 2021, 305, 121132. [Google Scholar] [CrossRef]
  10. Cai, J.; Tian, Z.; Zhou, S.; Xiong, Y.; Sun, C.; Zeng, J. Controlling Factor Analysis of Microstructural Property and Storage Capacity of Deep Longmaxi Formation Shale in Sichuan Basin. Energy Fuels 2021, 35, 20092–20102. [Google Scholar] [CrossRef]
  11. He, W.; Liu, B.; Sun, M.; Wang, L.; Zhang, J.; Yasin, Q.; Tian, S.; Gao, S.; Ukaomah, C.F. Pore Types, Genesis, and Evolution Model of Lacustrine Oil-Prone Shale: A Case Study of the Cretaceous Qingshankou Formation, Songliao Basin, NE China. Sci. Rep. 2022, 12, 17210. [Google Scholar] [CrossRef]
  12. Lee, T.; Bocquet, L.; Coasne, B. Activated desorption at heterogeneous interfaces and long-time kinetics of hydrocarbon recovery from nanoporous media. Nat. Commun. 2016, 7, 11890. [Google Scholar] [CrossRef] [PubMed]
  13. Yang, J.; Hatcherian, J.; Hackley, P.C.; Pomerantz, A.E. Nanoscale geochemical and geomechanical characterization of organic matter in shale. Nat. Commun. 2017, 8, 2179. [Google Scholar] [CrossRef]
  14. Chen, L.; Jiang, Z.; Jiang, S.; Liu, K.; Yang, W.; Tan, J.; Gao, F. Nanopore Structure and Fractal Characteristics of Lacustrine Shale: Implications for Shale Gas Storage and Production Potential. Nanomaterials 2019, 9, 390. [Google Scholar] [CrossRef]
  15. Kim, C.; Devegowda, D. Molecular Dynamics Study of Fluid-Fluid and Solid-Fluid Interactions in Mixed-Wet Shale Pores. Fuel 2022, 319, 123587. [Google Scholar] [CrossRef]
  16. Zhang, L.; Zhang, T.; Zhao, Y.; Hu, H.; Wen, S.; Wu, J.; Cao, C.; Wang, Y.; Fan, Y. A Review of Interaction Mechanisms and Microscopic Simulation Methods for CO2-Water-Rock System. Pet. Explor. Dev. 2024, 51, 223–238. [Google Scholar] [CrossRef]
  17. Sobecki, N.; Nieto-Draghi, C.; Di Lella, A.; Ding, D.Y. Phase behavior of hydrocarbons in nano-pores. Fluid Phase Equilibr. 2019, 497, 104–121. [Google Scholar] [CrossRef]
  18. Song, Y.; Song, Z.; Zhang, Z.; Chang, X.; Wang, D.; Hui, G. Phase Behavior of CO2-CH4-Water Mixtures in Shale Nanopores Considering Fluid Adsorption and Capillary Pressure. Ind. Eng. Chem. Res. 2022, 61, 5652–5660. [Google Scholar] [CrossRef]
  19. Qiao, L.; Tan, J.; Li, L.; Ju, Y.; Andreas, B.; David, A.W.; Pathegama, G.R.; Richard, M.; Shu, B.; Hu, C.; et al. The role of supercritical carbon dioxide for recovery of shale gas and sequestration in gas shale reservoirs. Energy Environ. Sci. 2021, 14, 4203–4227. [Google Scholar] [CrossRef]
  20. Lu, Y.; Gong, T.; Tang, J.; Cheng, Q.; Zhang, C.; Zhao, G.; Liu, B. Evolution of Shale Wetting Properties Under Long-Term CO2/Brine/Shale Interaction: Implications for CO2 Storage in Shale Reservoirs. Gas Sci. Eng. 2024, 126, 205334. [Google Scholar] [CrossRef]
  21. Yang, K.; Zhou, J.; Xian, X.; Zhou, L.; Zhang, C.; Tian, S.; Lu, Z.; Zhang, F. Chemical-Mechanical Coupling Effects on the Permeability of Shale Subjected to Supercritical CO2-Water Exposure. Energy 2022, 248, 123591. [Google Scholar] [CrossRef]
  22. Dang, W.; Nie, H.; Zhang, J.; Tang, X.; Jiang, S.; Wei, X.; Liu, Y.; Wang, F.; Li, P.; Chen, Z. Pore-Scale Mechanisms and Characterization of Light Oil Storage in Shale Nanopores: New Method and Insights. Geosci. Front. 2022, 13, 101424. [Google Scholar] [CrossRef]
  23. Zhao, G.; Yao, Y.; Adenutsi, C.D.; Feng, X.; Wang, L.; Wu, W. Transport Behavior of Oil in Mixed Wettability Shale Nanopores. ACS Omega 2020, 5, 31831–31844. [Google Scholar] [CrossRef] [PubMed]
  24. Miqueu, C.; Grégoire, D. Estimation of pore pressure and phase transitions of water confined in nanopores with non-local density functional theory. Mol. Phys. 2020, 118, e1742935. [Google Scholar] [CrossRef]
  25. Sang, Q.; Zhang, S.; Li, Y.; Dong, M.; Bryant, S. Determination of Organic and Inorganic Hydrocarbon Saturations and Effective Porosities in Shale Using Vacuum-Imbibition Method. Int. J. Coal Geol. 2018, 200, 123–134. [Google Scholar] [CrossRef]
  26. Xia, Y.; Tian, Z.; Xu, S.; Wei, W.; Cai, J. Effects of Microstructural and Petrophysical Properties on Spontaneous Imbibition in Tight Sandstone Reservoirs. J. Nat. Gas Sci. Eng. 2021, 96, 104225. [Google Scholar] [CrossRef]
  27. Liu, J.; Sheng, J.J.; Wang, X.; Ge, H.; Yao, E. Experimental study of wettability alteration and spontaneous imbibition in chinese shale oil reservoirs using anionic and nonionic surfactants. J. Petrol. Sci. Eng. 2019, 175, 624–633. [Google Scholar] [CrossRef]
  28. Bakhshian, S.; Hosseini, S.A.; Shokri, N. Pore-Scale Characteristics of Multiphase Flow in Heterogeneous Porous Media Using the Lattice Boltzmann Method. Sci. Rep. 2019, 9, 3377. [Google Scholar] [CrossRef]
  29. Chen, L.; Zhang, L.; Kang, Q.; Viswanathan, H.S.; Yao, J.; Tao, W. Nanoscale Simulation of Shale Transport Properties Using the Lattice Boltzmann Method: Permeability and Diffusivity. Sci. Rep. 2015, 5, 8089. [Google Scholar] [CrossRef]
  30. Zhang, T.; Javadpour, F.; Li, J.; Zhao, Y.; Zhang, L.; Li, X. Pore-scale perspective of gas/water two-phase flow in shale. SPE J. 2021, 26, 828–846. [Google Scholar] [CrossRef]
  31. Lang, D.; Lun, Z.; Lyu, C.; Wang, H.; Zhao, Q.; Sheng, H. Nuclear Magnetic Resonance Experimental Study of CO2 Injection to Enhance Shale Oil Recovery. Pet. Explor. Dev. 2021, 48, 702–712. [Google Scholar] [CrossRef]
  32. Wang, T.; Wang, L.; Meng, X.; Chen, Y.; Song, W.; Yuan, C. Key Parameters and Dominant EOR Mechanism of CO2 Miscible Flooding Applied in Low-Permeability Oil Reservoirs. Geoenergy Sci. Eng. 2023, 225, 211724. [Google Scholar] [CrossRef]
  33. Jiménez-Martínez, J.; Porter, M.L.; Hyman, J.D.; Carey, J.W.; Viswanathan, H.S. Mixing in a Three-phase System: Enhanced Production of Oil-wet Reservoirs by CO2 Injection. Geophys. Res. Lett. 2016, 43, 196–205. [Google Scholar] [CrossRef]
  34. Cao, Z.; Jiang, H.; Zeng, J.; Saibi, H.; Lu, T.; Xie, X.; Zhang, Y.; Zhou, G.; Wu, K.; Guo, J. Nanoscale Liquid Hydrocarbon Adsorption on Clay Minerals: A Molecular Dynamics Simulation of Shale Oils. Chem. Eng. J. 2021, 420, 127578. [Google Scholar] [CrossRef]
  35. Stone, H.A.; Stroock, A.D.; Ajdari, A. Engineering Flows in Small Devices: Microfluidics Toward a Lab-on-a-Chip. Annu. Rev. Fluid Mech. 2004, 36, 381–411. [Google Scholar] [CrossRef]
  36. Guo, Y.; Shi, J.; Qiu, J.; Xu, Z.; Bao, B. Visualized investigation of transport and phase behaviors during CO2 huff-n-puff in nanomatrix-fracture tight formations. Fuel 2023, 354, 129344. [Google Scholar] [CrossRef]
  37. Jensen, K.F. Flow chemistry-Microreaction technology comes of age. Aiche J. 2017, 63, 858–869. [Google Scholar] [CrossRef]
  38. Qiu, J.; Tang, W.; Bao, B.; Zhao, S. Microfluidic-based in-situ determination for reaction kinetics of hydrogen peroxide decom-position. Chem. Eng. J. 2021, 424, 130486. [Google Scholar] [CrossRef]
  39. Squires, T.M.; Quake, S.R. Microfluidics: Fluid physics at the nanoliter scale. Rev. Mod. Phys. 2005, 77, 977–1026. [Google Scholar] [CrossRef]
  40. Yao, C.; Dong, Z.; Zhao, Y.; Chen, G. An online method to measure mass transfer of slug flow in a microchannel. Chem. Eng. Sci. 2014, 112, 15–24. [Google Scholar] [CrossRef]
  41. Li, L.; Zheng, J.; Shi, Y.; Su, Y.; Hao, Y.; Chen, Z. Mechanisms of Fluid Migration and CO2 Storage in Low Permeability Heavy Oil Reservoirs Using High-Pressure Microfluidic CO2 Flooding Experiment. Energy Fuels 2024, 38, 7997–8008. [Google Scholar] [CrossRef]
  42. Kolawole, O.; Ispas, I.; Kumar, M.; Weber, J.; Zhao, B.; Zanoni, G. How Can Biogeomechanical Alterations in Shales Impact Caprock Integrity and CO2 Storage? Fuel 2021, 291, 120149. [Google Scholar] [CrossRef]
  43. Liu, J.; Li, J.; Song, Z.; Shen, A. Flow Characteristics of Shale Oil and Its Geological Controls: A Case Study of the Lucaogou Formation in the Jimsar Sag, Junggar Basin. Pet. Sci. 2025, in press. [Google Scholar] [CrossRef]
  44. Geng, Y.; Ling, S.; Huang, J.; Xu, J. Multiphase Microfluidics: Fundamentals, Fabrication, and Functions. Small 2020, 16, 1906357. [Google Scholar] [CrossRef]
  45. Günther, A.; Jensen, K.F. Multiphase Microfluidics: From Flow Characteristics to Chemical and Materials Synthesis. Lab Chip 2006, 6, 1487–1503. [Google Scholar] [CrossRef]
  46. Weinaug, C.F.; Katz, D.L. Surface tensions of methane-propane mixtures. Ind. Eng. Chem. 1943, 35, 239–246. [Google Scholar] [CrossRef]
  47. Goual, L.; Sedghi, M.; Zeng, H.; Mostowfi, F.; McFarlane, R.; Mullins, O.C. On the Formation and Properties of Asphaltene Nanoaggregates and Clusters by DC-Conductivity and Centrifugation. Fuel 2011, 90, 2480–2490. [Google Scholar] [CrossRef]
Figure 1. Schematic diagram of pore structure design process: (a) rendering of CT-scanned core sample (the blue part represents the pores, while the other colors represent different rock compositions); (b) grayscale image of CT scan of core; (c) extracted pore structure image; (d) artificially designed image of the pore structure.
Energies 18 04774 g001
Figure 2. Multiscale structural design and pore structures in experimental microfluidic chip (the number in the upper-left corner represents the chip number corresponding to the pore structure, and the enlarged section on the right shows a magnified view of the red-boxed area in the chip overview).
Energies 18 04774 g002
Figure 3. Experimental setup configuration and component: (a) experimental equipment physical image (main component is indicated with arrows); (b) microfluidic chip; (c) chip fixation device.
Energies 18 04774 g003
Figure 4. Experiment flowchart.
Energies 18 04774 g004
Figure 5. Capillary trapping and slug flow in experiments: (a) capillary trapping in Experiment 1; (b) slug flow in Experiment 1; (c) slug flow in Experiment 2.
Energies 18 04774 g005
Figure 6. Flow in different pore structures: (a) full-field multiphase displacement visualization; (bd) zoomed-out views of regions marked in (a): (b) homogeneous pore structures at the pore scale; (c) pre-breakthrough flow in large-pore and fine-throat structures; (d) post-breakthrough flow in large-pore and fine-throat structures.
Energies 18 04774 g006
Figure 7. Mechanisms and visualization of the Jamin effect in pores: (a) experimental visualization of Jamin effect manifestation and regional pore architecture design; (b) theoretical model of bubble migration through constrictions under Jamin effect influence.
Energies 18 04774 g007
Figure 8. Interfacial fluctuations during the experiment.
Energies 18 04774 g008
Figure 9. Interfacial dynamics during extraction processes.
Energies 18 04774 g009
Figure 10. Asphaltene precipitation in crude oil systems.
Energies 18 04774 g010
Figure 11. Instantaneous recovery curve and recovery/permeability relationship curve.
Energies 18 04774 g011
Figure 12. Time-dependent variations in pressure, pressure drop, and instantaneous recovery.
Energies 18 04774 g012
Figure 13. Bubble nucleation dynamic process. (The red area is the desorbed CO2).
Energies 18 04774 g013
Figure 14. Bilateral recovery efficiency contrast in huff-n-puff processes (The red line in the figure divides the image into left and right sides, which allows for a more intuitive comparison).
Energies 18 04774 g014
Figure 15. Interfacial tension-driven multiphase dynamics: (a) CO2 migration; (b) interfacial tension mechanism schematic; (c) bubble rupture fluctuations; (d) recovery rate.
Energies 18 04774 g015
Figure 16. Spatial configuration of residual oil after huff-n-puff.
Energies 18 04774 g016
Table 1. Experimental conditions for microscopic transport in microfluidic chips.
Experimental ContentExperimental Conditions
Experiment NumberTemperature (°C)Pressure (MPa)Chip Number
Immiscible floodingExperiment 185201
Experiment 285202
Experiment 385203
Constant volume depletionExperiment 485403
Experiment 585405
Huff-n-puffExperiment 685404
Experiment 785405
Experiment 885405
Table 2. The chip characteristics and calculation results of Experiments 1–3.
Computed and Measured PARAMETERSExperiment 1Experiment 2Experiment 3
Recovery/%28.327.9742.84
Porosity/%10.5119.815.66
Permeability/nm23544.361761.2338,379.89
Table 3. The recovery results of constant volume depletion experiments.
Computed and Measured ParametersExperiment 4Experiment 5
Initial production proportion (%)70.4561.6
Ultimate recovery (%)37.9339.58
Experimental time (s)86.6797.73
Table 4. Chip parameters and experimental results of huff-n-puff.
Computed and Measured ParametersExperiment 6Experiment 7Experiment 8
Inlet cross-sections (μm2)2.2848.4888.488
Outlet cross-sections (μm2)2.28415.49628.488
Permeability (nm2)11,872.498609.268609.26
Recovery (%)66.3771.6550.57
Experimental time (s)2132.7729.2
Table 5. Chip parameters and recovery for CO2 immiscible flooding and huff-n-puff.
Computed and Measured ParametersCO2 Immiscible FloodingHuff-n-Puff
Experiment 1Experiment 2Experiment 3Experiment 6Experiment 7Experiment 8
Recovery (%)28.327.9742.8466.3771.6550.57
Permeability (nm2)3544.361761.2338,379.8911,872.498609.268609.26
Disclaimer/Publisher’s Note: The statements, opinions and data contained in all publications are solely those of the individual author(s) and contributor(s) and not of MDPI and/or the editor(s). MDPI and/or the editor(s) disclaim responsibility for any injury to people or property resulting from any ideas, methods, instructions or products referred to in the content.