Article

Optimisation of a Kind of Vertical Axis Darrieus Turbine—Davidson Hill Venturi Cross-Flow Turbines

1
School of Engineering, The University of Edinburgh, Edinburgh EH8 9YL, UK
2
DHV Turbines Ltd., Glasgow G2 4JR, UK
3
Institute for Energy Systems (IES), School of Engineering, The University of Edinburgh, Edinburgh EH8 9YL, UK
*
Author to whom correspondence should be addressed.
Energies 2025, 18(17), 4763; https://doi.org/10.3390/en18174763
Submission received: 18 June 2025 / Revised: 21 July 2025 / Accepted: 15 August 2025 / Published: 8 September 2025
(This article belongs to the Section A3: Wind, Wave and Tidal Energy)

Abstract

Vertical axis turbines (VATs) have grown in popularity over the past decade, owing to their lower cost of energy (CoE) when installed in remote offshore locations. The Davidson Hill Venturi system, as a kind of vertical axis tidal turbine technology, has been tested and proved to increase the power generation by the effect from the venturi structure. Based on the Computational Fluid Dynamic simulation (Ansys 2021R1) software, the present project develops a complete and improved 3D model to calculate the influence from different parameter adjustments on the turbine. The angle of the hydrofoil on the side panel was investigated in a previous study, while the new hydrofoil and different number of blades on the centre rotor can also affect the power generation of the tidal turbines. With this accurately created design, a sizing procedure is developed, and several 3D turbine models with a new hydrofoil or different number of blades are established. Both three-dimensional and two-dimensional section results are compared with the model with adjusting parameters. The 2D section view obtained from a static 3D model without a centre rotor is used to compare with the previous research, while the different number of blades is simulated by the dynamic 3D model without the hydrofoil. An analytical optimisation demonstrates that the new hydrofoil GOE-222 performed better than the material used in a previous study. The optimal number of blades between four blades and eight blades for use in the DHV turbine is also confirmed to be four.

1. Introduction

1.1. Tidal Energy

With fossil fuel reserves diminishing, the development of alternative energy sources is critical. Tidal steam energy has the potential to be a viable alternative, since it is both sustainable and reliable. The sun creates almost 99.99 percent of all energy, whereas the earth generates less than 0.01% [1]. Fossil fuels are a kind of pre-diluvian sun energy. All forms of energy, save geothermal and nuclear, are ultimately fuelled by the sun [2]. The earth emits heat, and proportionally, 80% is from radioactive decay and the remaining 20% is from planetary accretion [3].
Oceans cover more than 70% of the earth’s surface. As Figure 1 shown, ocean tides are generated by the earth’s gravitational interaction, with the moon generating 68 percent and the sun generating 32 percent. The moon’s impact is 2.6 times larger than that of the sun due to its closer proximity to the earth. When winds clash with the water’s surface, ocean waves are produced. Due to the earth’s slow deceleration rate of 12.19 s per year, it has lost 17% of its rotational energy [4]. Oceans are a great source of renewable energy because they store thermal (heat), kinetic (tides and waves), chemical (chemicals), and biological (bioenergy) energy (biomass). While tidal current and wave generators capture kinetic energy, osmotic and thermoelectric generators harvest salinity and temperature gradients [5].

1.2. Tidal Power

The potential for tidal energy production can be evaluated by examining an estuary on the seacoast [5]. If the water level at spring tide is R meters above the sea datum line, the energy potential is equal to
E = ρ g 0 R h A d h ,
where
  • ρ is sea water density ( k g / m 3 );
  • g is gravitational constant (9.81 m / s 2 ).
The energy collected in a contained area can be given by
E = 1 2 ρ g A R 2 .
Taking P   =   E / t , the average power (in k W ) can be obtained as
P = E t = 1 2 ρ g A R 2 t = 1025 × 9.81 × A × R 2 44700 = 225 A R 2 .
In this equation, the time used is regarded as 44,700 s, which is 6 h and 12.5 min. When a double cycle tidal station generates energy in both the forward and reverse directions of water flows, the power potential doubles to 450 A R 2   k W , more than double that of a single cycle station. If the tidal range is equal to the difference between the basin’s highest and lowest levels, then the work performed by falling water over h height is given by an average water discharge rate ( Q   =   A H / t ) via the turbine.
P = ρ Q h .
The capacity of tidal energy production rises with the tidal range and the absence of a barrage, dam, or dyke. A good storage location may be found along the seacoast in an estuary, stream, channel, rut, or runnel. Several important components of tidal power plants include a barrage used to create a basin or estuary, sluice gates used to fill or empty basins, and turbines used for converting the kinetic energy to mechanical energy and then transferring to electricity by a coupling generator. The crest and slopes of the dike are reinforced with rock filling to resist water waves. The sluices are equipped with both manual and automatic gates. Sluice gates may be constructed of steel to resist exposure to salt water [5].

1.3. Location

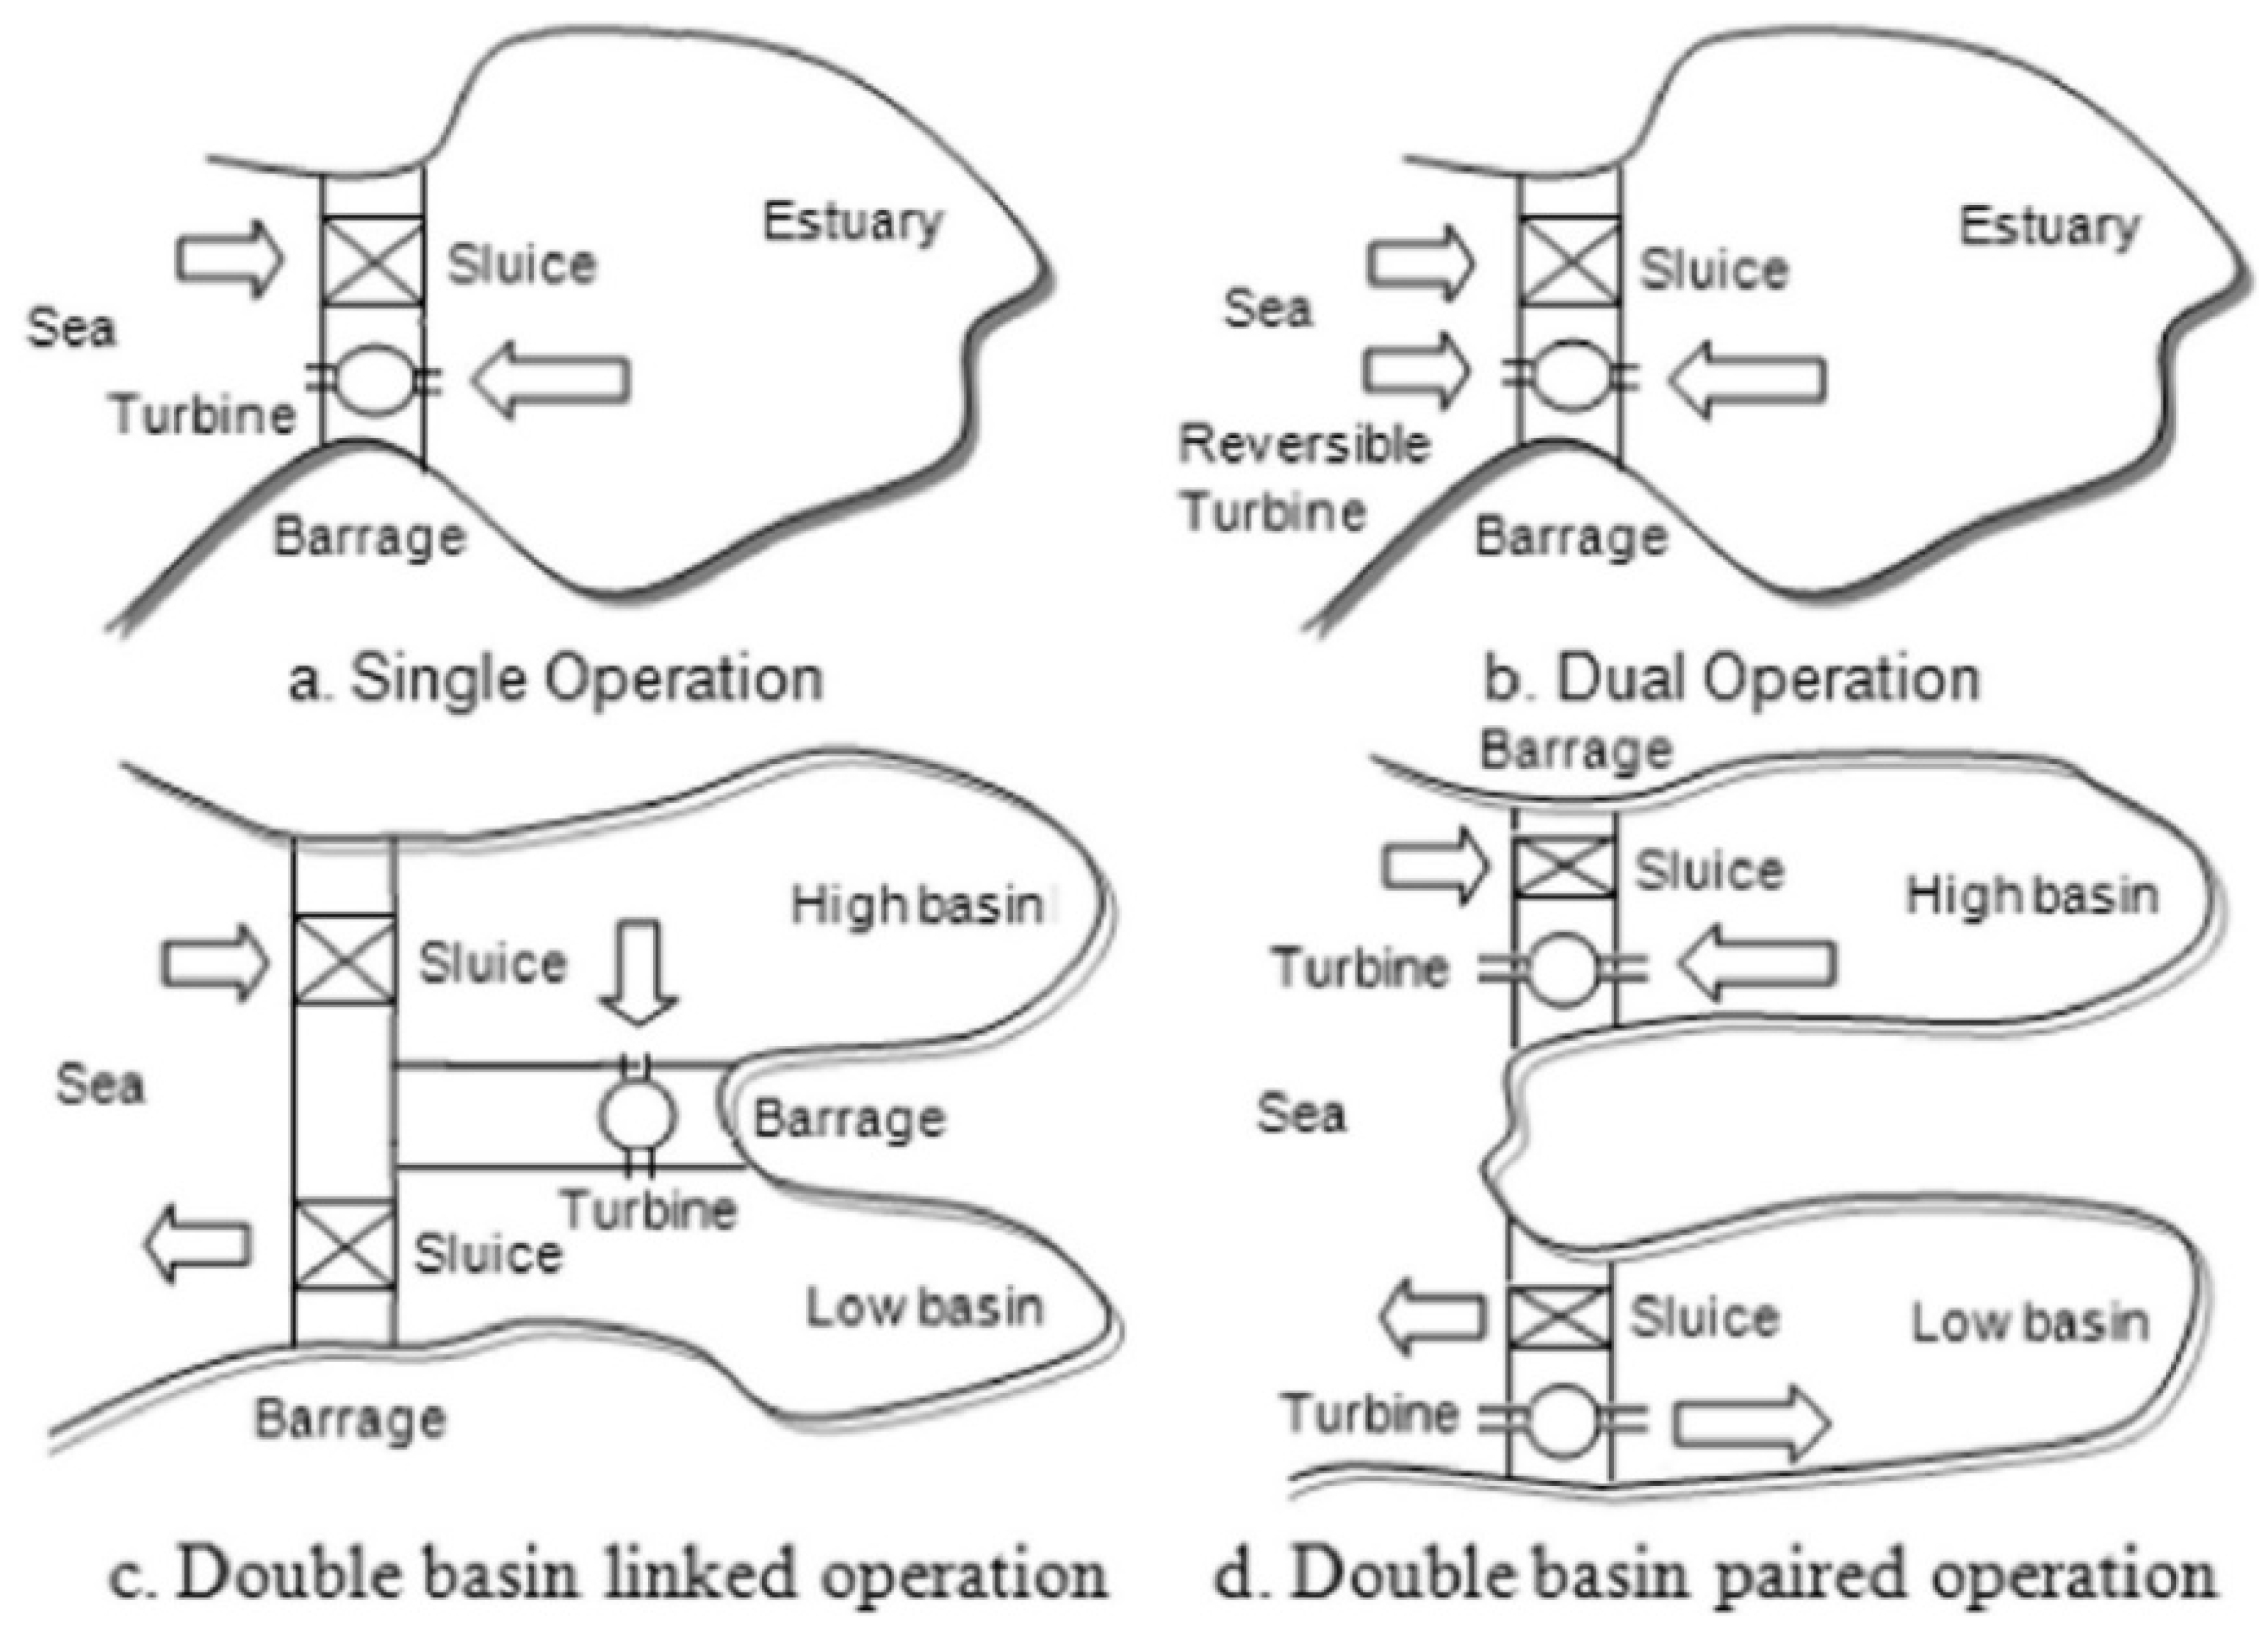
As with run-of-river and dam hydropower facilities, ocean tidal power stations are classified as tidal range or tidal current [5]. Tidal power plants may be categorised as single basin single operation, single basin double operation, double basin with linked basin operation, or double basin with paired basin operation, as shown in the Figure 2 below.
Throughout high tides, the single-operation sluice opens, but is kept closed during the emptying process. The tidal power turbine operates solely during the process of emptying. The duration of a single turbine run is 3.5 h. Through high tide, the reversible turbine and sluice operate simultaneously; however, the sluice stays closed during the emptying process. The output of a double-operation tidal plant is not double that of a single-operation turbine, but just 15% higher. A typical example of a dual-operating turbine is the 240 MW La Rance tidal power plant (France). The high-basin-connected barrage’s sluice opens at high tide for filling, while the low-basin sluice opens for emptying. The turbine is mounted on a Tied barrage system. When a barrage is double-paired, the top sluice opens during the filling phase and the lower sluice opens during the emptying process. The tidal power plants are well-suited for meeting demand in the range of base to peak loads.

1.4. Tidal Turbines

Tidal turbines are classified into two broad categories, depending on their flow direction: vertical axis (VAT) turbines and horizontal axis (HAT) turbines. As the Figure 3 shown, an HAT turbine has a rotor with a radial axis parallel to the water current. It converts the kinetic energy of water to mechanical energy through its drag or lift-type blades, which are normally perpendicular to the rotational axis. VAT turbines have a radial axis rotor that is perpendicular to the water current, and their blades, like HAT turbines, may be drag or lift-type blades. Given that the primary disadvantage of tidal turbines is their high construction and fabrication costs, utilising a low-cost Taguchi approach will help turbine developers minimise design costs [6,7].
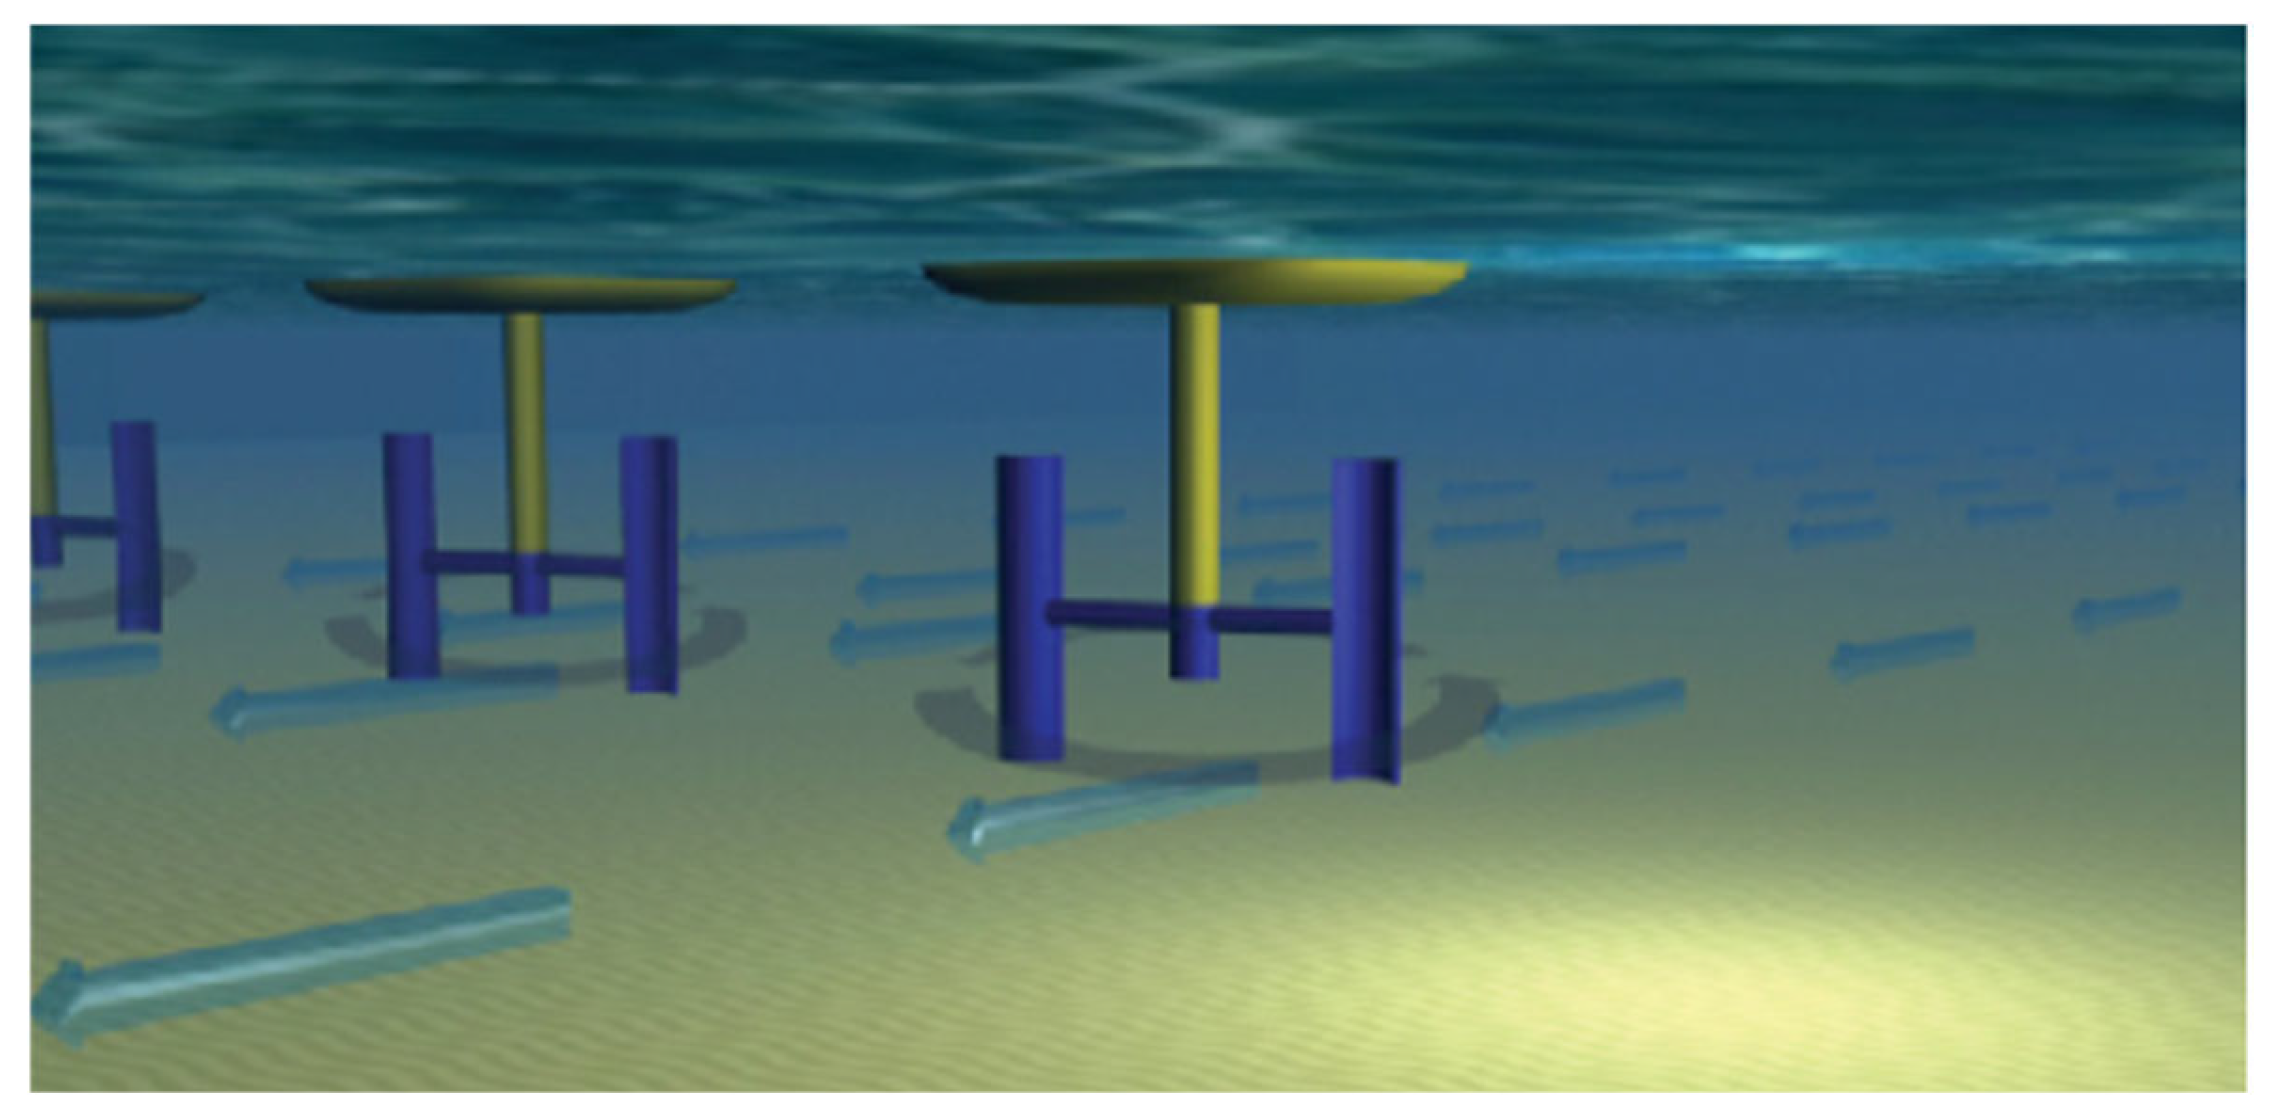
Nowadays, the majority of tidal turbine engineers use the horizontal axis tidal turbine (HATT) design, owing to its high performance (over 35%) [8] and relatively simple operating theory. Vertical axis tidal turbines (VATTs) as shown in Figure 4 are an enticing alternative to horizontal axis tidal turbines (HATTs), mostly due to their omnidirectional nature, which is useful in tidal energy generation where tidal flow varies roughly every six hours. In addition, the operation principle of the VATT design allows the power take-off to be elevated related to the water’s surface, simplifying turbine maintenance and lowering costs. Despite their benefits, vertical axis turbines have gained less recognition than their more visually appealing horizontal axis counterparts, most likely due to their weaker hydrodynamics and complicated fluid–structure interaction. Nonetheless, they have gained increased attention in recent decades due to their suitability for operation in shallow coastal waters, waterways, and canals, owing to their square (or rectangular) cross-sectional area, which maximises the use of usable water depth.

1.5. Davidson Hill Venturi System

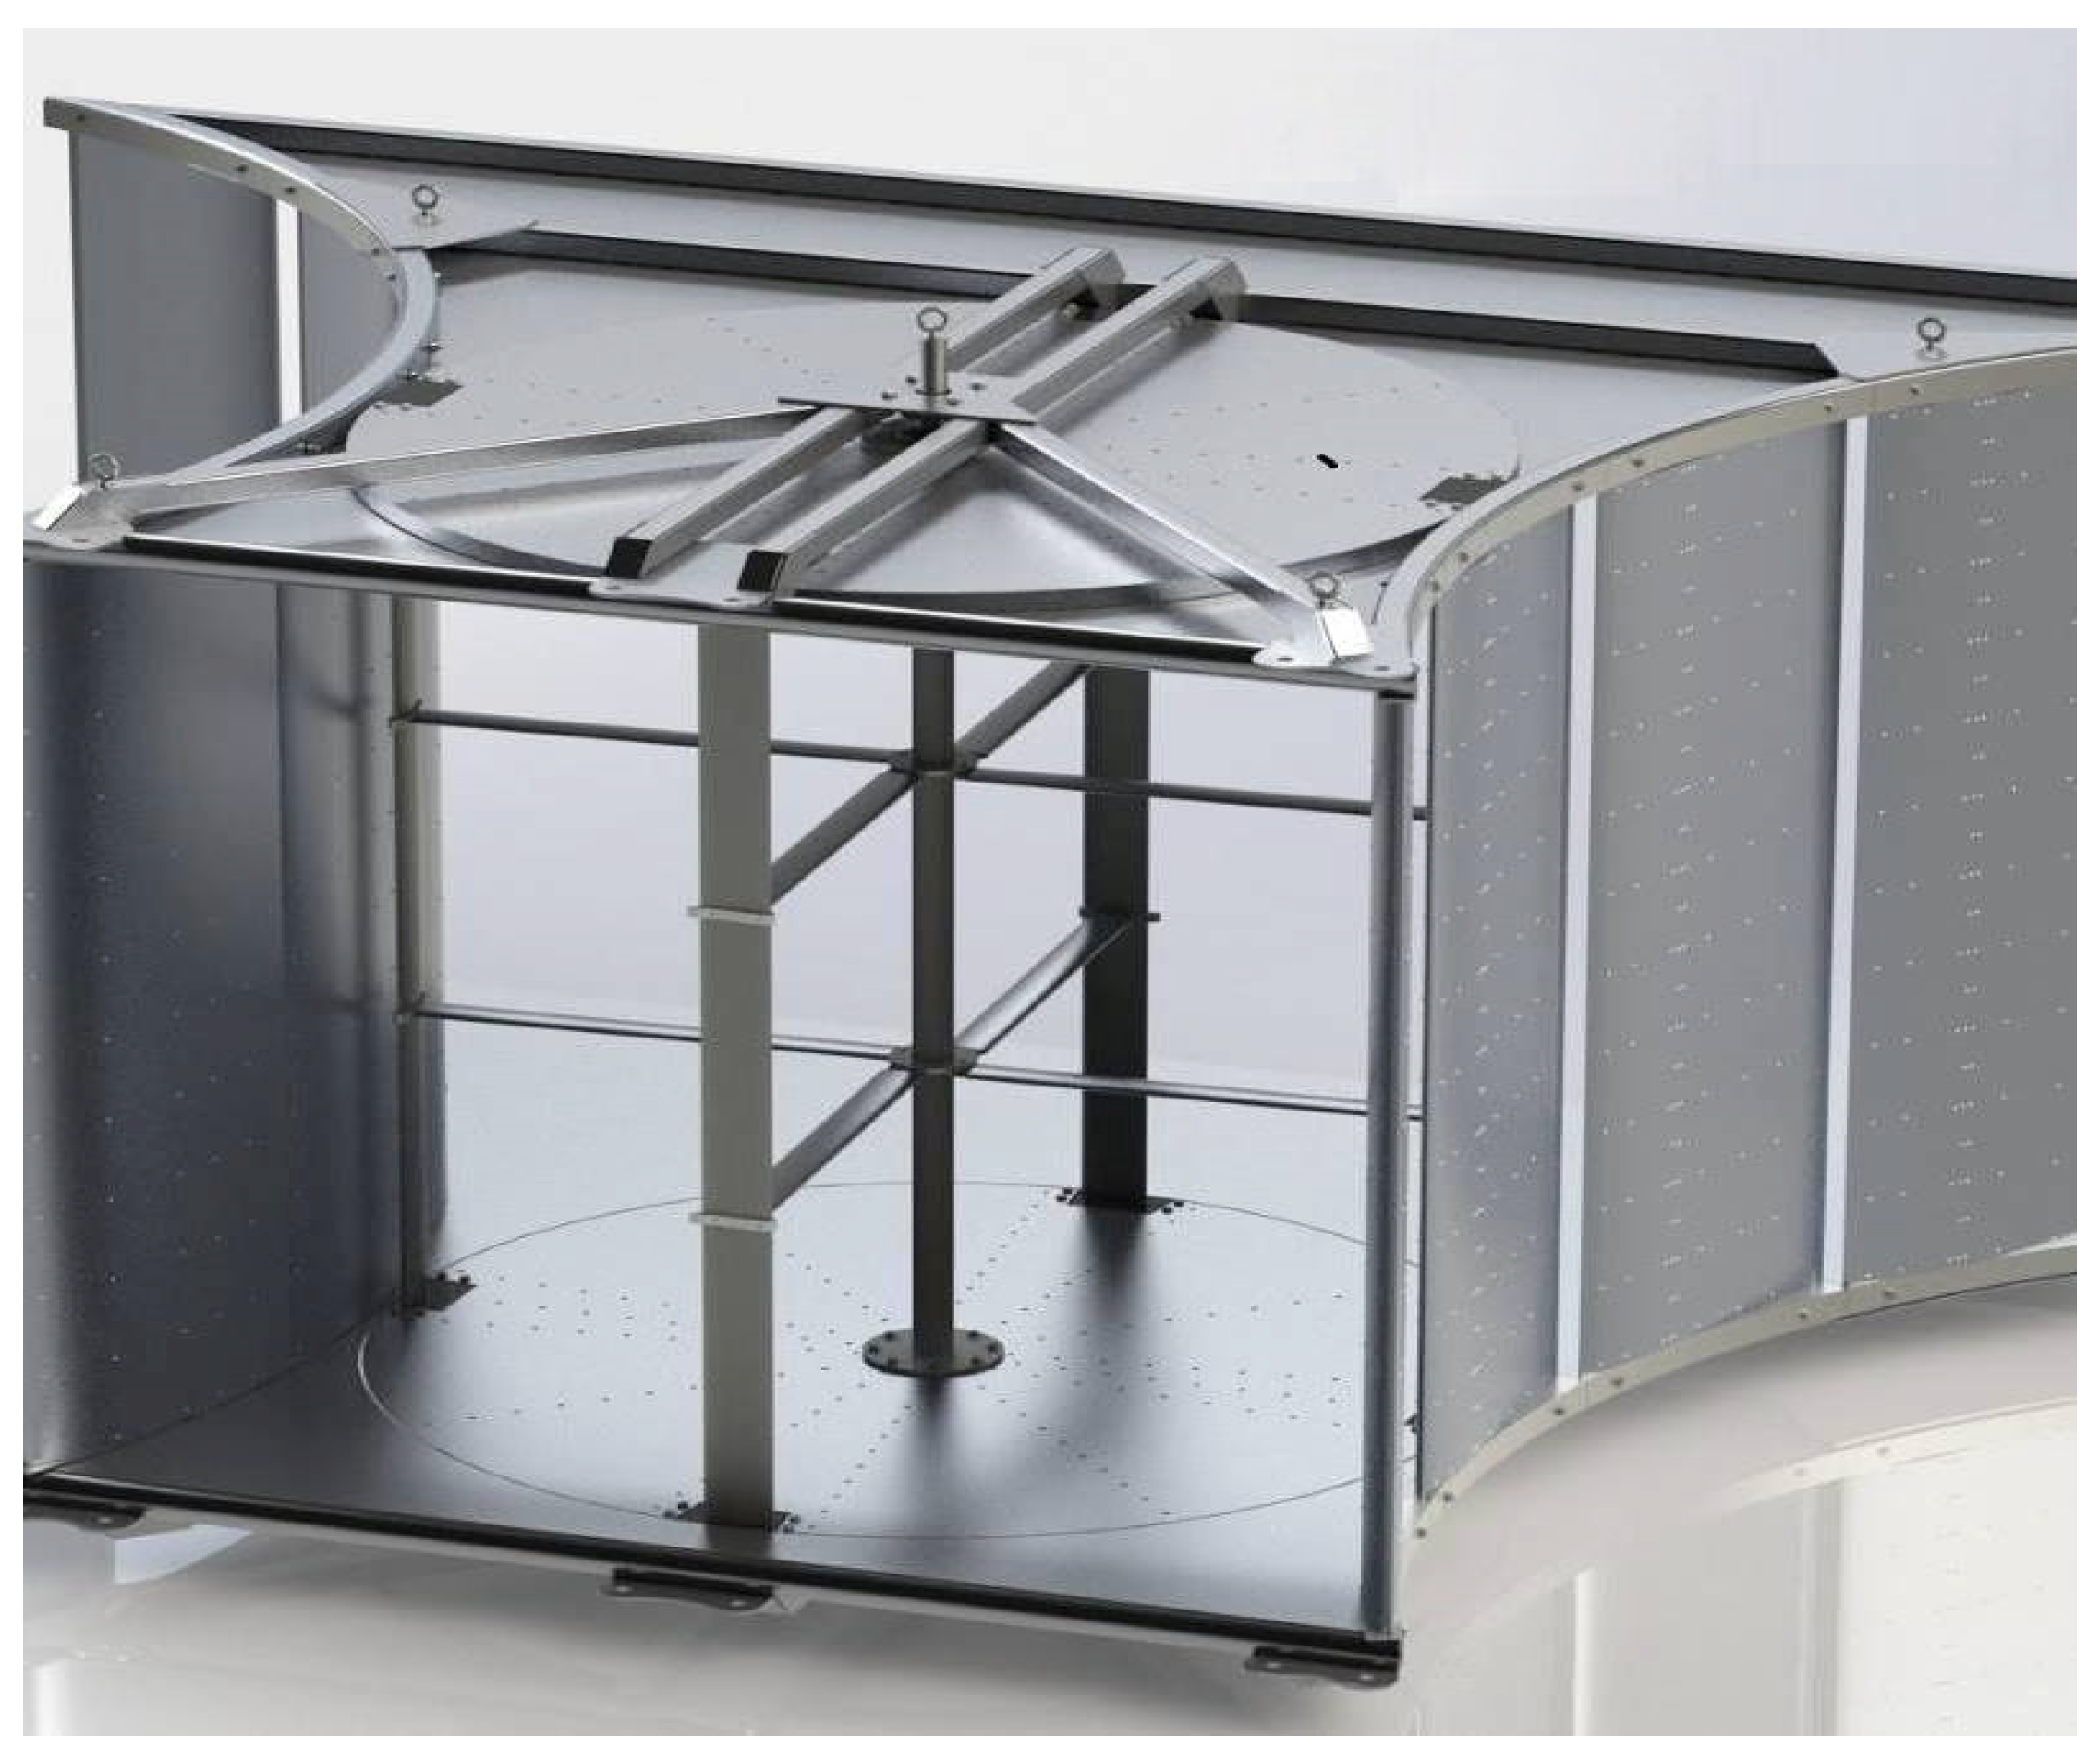
The Davidson Hill Venturi (DHV) system has a Darrieus turbine with a vertical axis within our patented venturi form, as Figure 5 illustrated below. The turbine design enables increased performance at low water speeds, having previously achieved augmentation factors of up to 3× (300 percent increase in potential power output). This is because the slated diffusers’ impact on the water flow concentrates the energy of the water onto the turbine blades. In tests conducted at speeds greater than 6 m/s, a 2.4× augmentation factor was obtained.
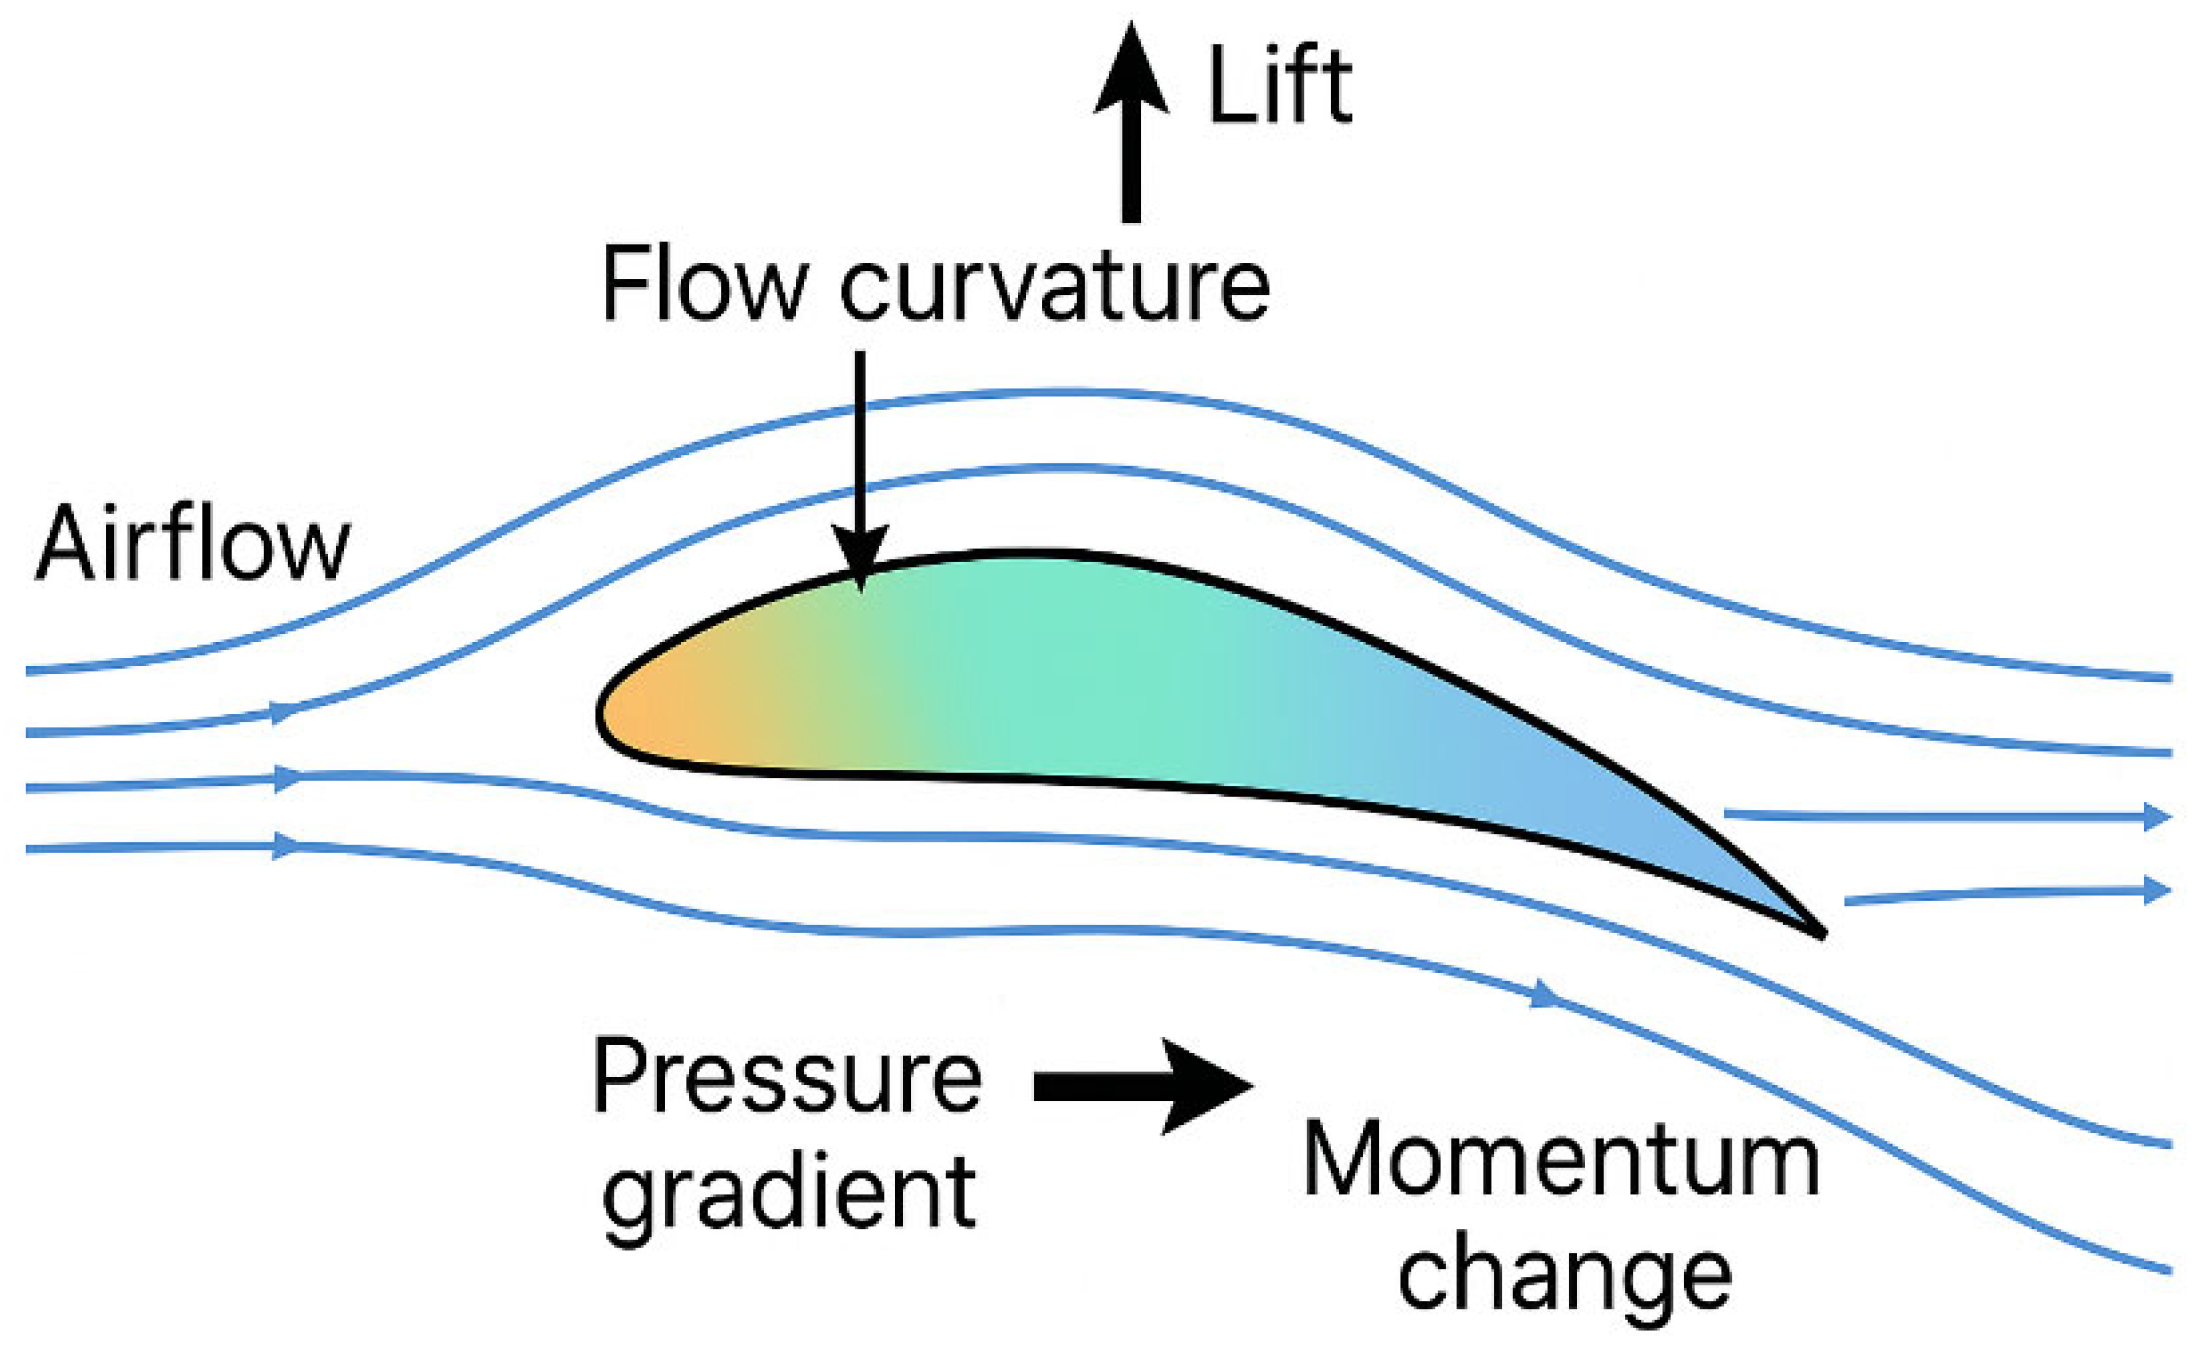
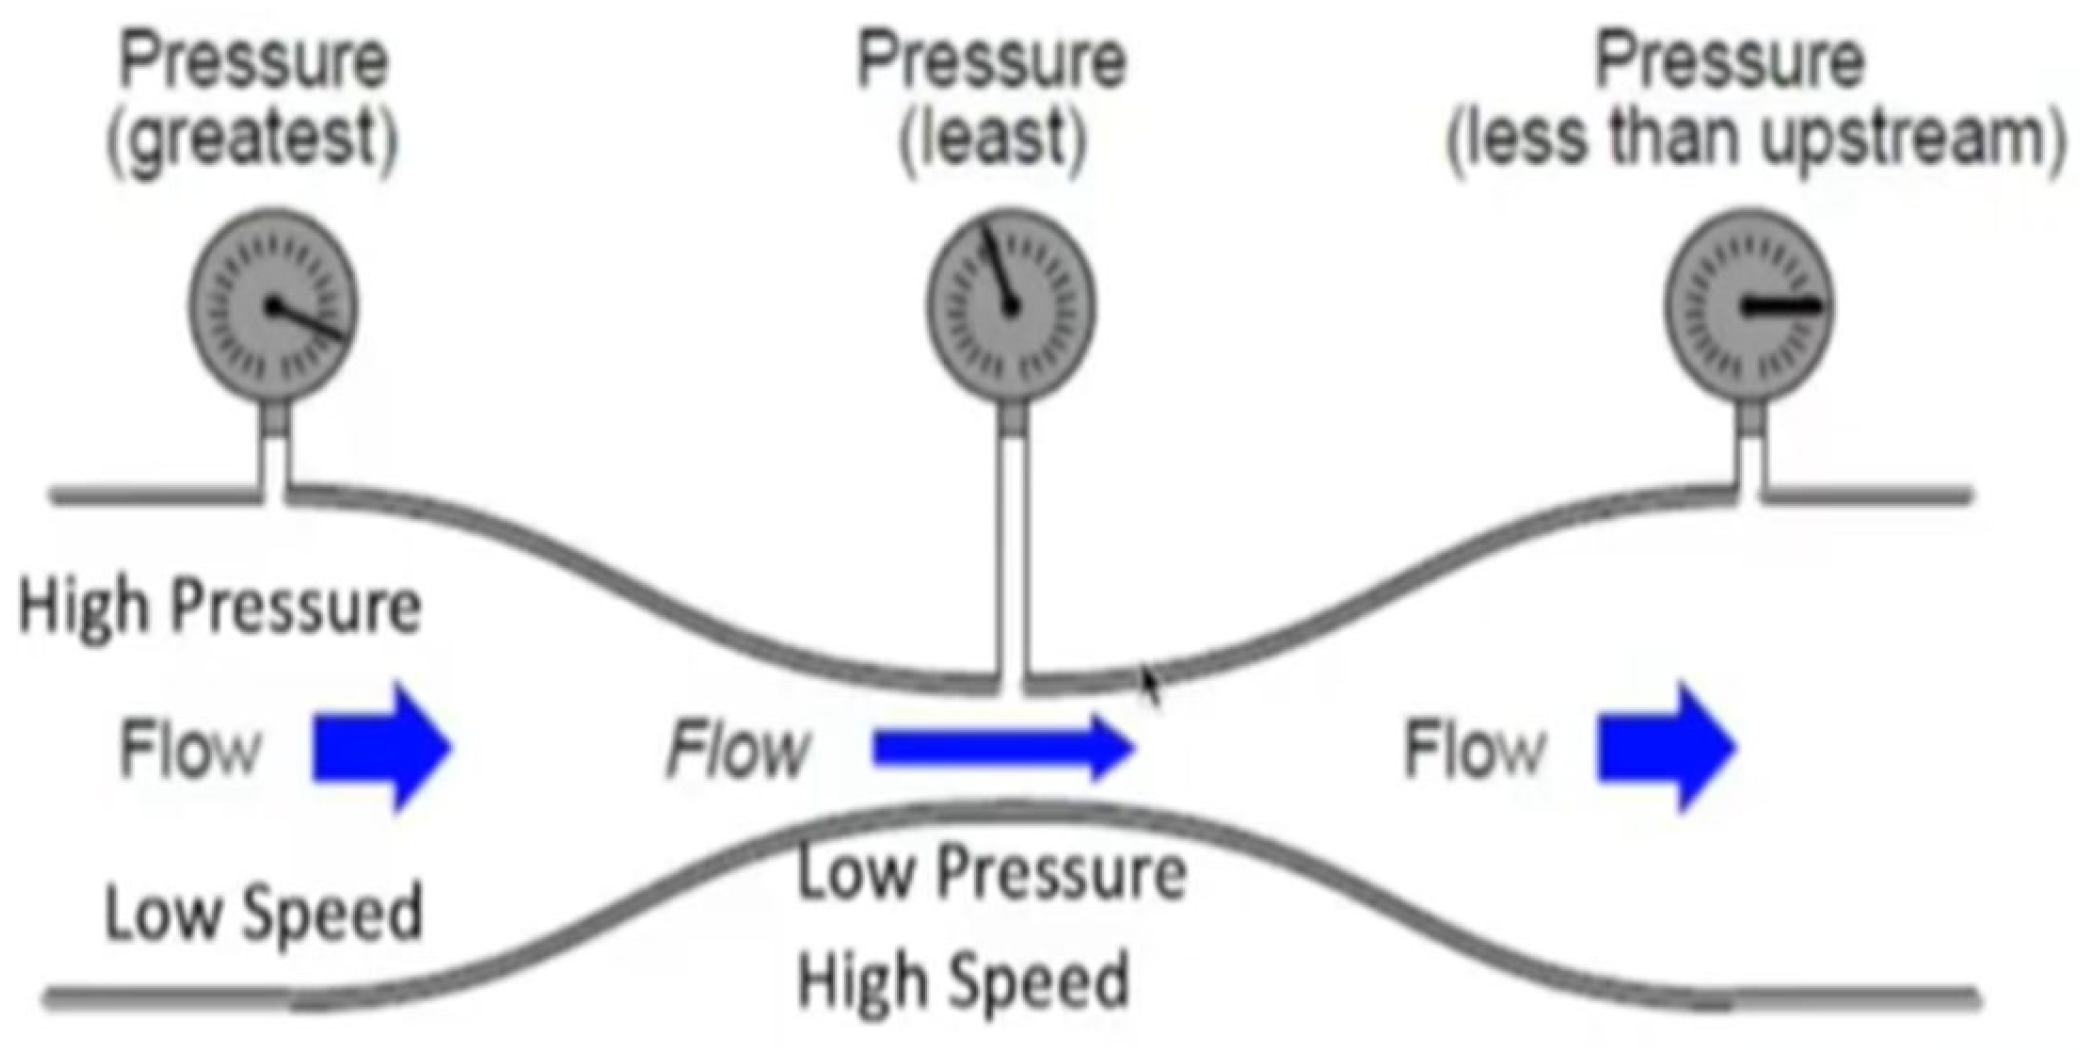
As Figure 6 and Figure 7 illustrate, the improvement from an asymmetric hydrofoil is mainly caused by the venturi effect. The venturi effect shows that the stream has lower pressure with higher velocity, which can be obtained from Bernoulli’s law.
In the DHV (Davidson Hill Venturi) tidal turbine system, asymmetric hydrofoils are not mounted on the rotor but are instead integrated into the enclosure side panels as part of the venturi-inspired flow guidance structure. These fixed hydrofoils serve three key functions.
First, they generate directional lift forces that act inward toward the turbine centerline. This lift effectively constricts the flow path, creating a controlled narrowing of the streamwise passage and inducing a venturi effect that locally accelerates the inflow.
Second, the cambered geometry of the hydrofoils bends the incoming flow and establishes a low-pressure zone along the inner surface of the enclosure. This pressure gradient further promotes mass flow convergence, drawing additional fluid into the turbine’s working region and enhancing momentum flux through the rotor plane.
Third, by maintaining smooth flow attachment and suppressing large-scale flow separation near the outlet, the hydrofoils reduce wake losses and backpressure, which contributes to increased energy extraction efficiency and stabilises the flow field around the rotor.
Burchell, J et al. [9] conducted a systematic experimental study comparing open-rotor configurations with two venturi-augmented designs: one employing solid walls and the other incorporating hydrofoil-shaped flow guides. Their findings demonstrate that the solid wall venturi design provided measurable improvements over the bare turbine, while the hydrofoil-based configuration further increased performance, achieving up to an 18.6% enhancement in peak power coefficient. This study also reported an increase in axial flow velocity at the rotor plane by a factor of 1.2–1.4 in venturi-assisted cases, underscoring the efficacy of passive flow control mechanisms in boosting turbine efficiency. These results provide quantitative validation for the aerodynamic benefits of properly designed shroud geometries, particularly when utilising hydrofoil surfaces to guide and concentrate the flow.
Overall, the integration of asymmetric hydrofoils into the enclosure design significantly improves the turbine’s ability to harvest energy under low incoming flow velocities, particularly in shallow or low-energy tidal environments.
The Davidson Hill Venturi system is perfect for rural populations who rely on diesel and live near water channels and wish to transition away from costly fossil fuels. Due to this efficiency boost compared with the turbine installed in other turbine structure, the DHV design enables the generation of electricity in locations that were previously economically unviable due to slower water flow velocities. The increased power output enables a smaller machine to generate the same amount of energy as a bigger conventional windmill [10].

1.6. Aim and Objective

The present research aimed to find the effect caused by different parameters of the hydrofoil and blade installation on the Davidson Hill Venturi system, which has not been investigated. The previous research studied the performance of different angles of hydrofoil for turbine efficiency. Except for the angle, a new product of the hydrofoil and different number of the blades on the center rotor are selected in this report to simulate the influence on the tidal turbine. The entire research was divided into several phases, as shown below:
  • Establish the tidal turbine model;
  • Adjust the parameters of hydrofoil and rotor blades;
  • Simulate the model by Computational Fluid Dynamics software;
  • Compare the simulation results and complete the analysis and discussion;
  • Conclude the optimal parameter to increase the performance of the DHV tidal turbine.

2. Literature Review

2.1. Effect to Tidal Energy

To address climate change, S-curve population growth, energy, and power problems, the exploration and harvesting of renewable energy supplies are needed. Ocean dynamism, like hydropower, wind, and solar energy, is an excellent source of energy. The tide is a cyclical rise and fall of water in the seas and oceans and occurs twice throughout a lunar day (24 h and 50 min). The ocean water level stays at its highest for 50 min at various times on various days, repeating the cycle every 19 years. Sea and ocean levels vary according to latitude and shoreline. The orbit of the moon around the earth enlarges the period between consecutive tides from 12 to 12 and a half hours. Every two weeks, on new and full moon days, the earth, moon, and sun coincide to produce the highest spring tides. On waxing and waning half-moon days, in the first and third quarters, the sun is at 90°, resulting in neap tides of the smallest height. Earlier estimates put the potential for tidal wave and thermal energy generated by gravity, wind, and sunlight at 22,000, 2000, and 87,600 TWh/y [11], respectively, while newer estimates put the potential for wave energy alone at 2985 GW [12]. Ocean temperature ranges from 24 to 28 °C on top to 4–6 °C at 1 km depths. The temperature differential may serve as the foundation for the ocean thermoelectric generator. Temperature variations of up to 20 °C are common between 30° S and 30° N latitudes [11,13]. The tidal potential is distributed evenly throughout the world; the OTEC potential is greatest in equatorial regions, and the wave energy potential is greatest in the tropics.

2.2. Turbine Structure

The different structures can deeply influence the power generation of the turbine. The advantages and relatively high efficiency values (25–35 percent) of VATTs have prompted many studies on their results. However, some disadvantages persist: most notably, the constantly changing angle of attack (AOA) on the blades, which exposes fixed-pitch blades to static stall and uneven loading. In addition, the VATTs even make it difficult to use the turbine self-start without sacrificing performance; for example, a five-bladed rotor would almost certainly self-start but is significantly less efficient than a twilight rotor. A design difficulty is that VATTs have a broad range of rotor parameters, including the blade shape, pitch and angle of twist, rotor solidity, shaft diameter, and number of blades, all of which are known to affect rotor performance, and blade roughness may have a major effect. As a result, the emergence of the ideal VATT continues to be elusive so far. Due to the intricate interplay of the aforementioned turbine parameters, the few experimental studies published in the literature cannot fully explain why some turbine design parameters perform better than others, which is complicated by the fact that various experiments were performed under varying conditions (e.g., different blade Reynolds numbers, channel blockage). Numerous computational experiments have shed light on the flow–turbine relationship, but these studies have mostly complemented established laboratory studies and have not examined the effect of different turbine parameters on VATT output in depth [14].

2.3. Darrieus Turbines

As the name implies, Darrieus turbines are primarily driven by lift force. Its driving force comes from the tangential components of lift and drag force produced by hydrofoil-shaped blades. Several papers, including Islam et al. [15,16] and Dai et al. [17], discuss the different aerodynamic models used for performance prediction and design of straight-vanned Darrieus-type wind turbines. The cascade model has the smoothest convergence of all performance prediction models, even when the solidity and tip speed ratio are large [15,18]. A hierarchical theoretical cascade model for Darrieus turbine power output is presented by Hirsch and Mandal [19]. Theoretical and coupled techniques of airfoil design for lift-driven vertical axis wind turbines are described in detail in Chen et al. [20,21]. Several alternative design techniques for Darrieus turbine blades were studied, including current developments in momentum, vortex, and cascade methods. The results were promising. According to Patel et al. [22], water turbines produce similar flow fields with wind turbines. Wind and water turbines can thus be studied comparatively for their effect on different aspects of turbine design.
Two NACA0012 straight-vanned Darrieus turbines were studied using numerical simulations by Joo S. et al. [23] to determine the effect of solidity (the proportion of the circle covered by the blades’ cords) and rotating speed on aerodynamic efficiency. Three-vanned Darrieus-type wind turbines were studied by Tummala et al. [24,25]. Hydrokinetic turbine performance was examined by Hwang et al. [26] using CFD analysis. When the parameters were optimised, the turbine’s performance improved by 70 percent. Darrieus turbines are well-known as wind generators, although their use as hydrokinetic generators is restricted [27,28]. Desperate to fill this knowledge gap, new research investigates the effect of solidity on Darrieus turbines with three and four symmetric and cambered blades to fill up the knowledge gap.
By means of numerical simulations, Mohamed et al. [29,30,31] investigated the effect of different blade types and pitch angles on the performance of the Darrieus wind turbine. The airfoil cross-sections LS (1)0413 and S-1046 have a greater coefficient of power at a zero pitch angle compared to NACA profiles. Wind turbine blade types are now the focus of most current research, which uses numerical modelling to investigate the effect of blade types on wind turbines. There is, however, a paucity of experimental data on the effects of different blade types on hydrokinetic applications. For this reason, a comparison is made between three- and four-vanned Darrieus turbines with symmetric and cambered profiles.
As a result of clustering horizontal axis wind turbines, performance decreases [32]. Darrieus wind turbines can be clustered together; however, the performance is not affected or even improved in certain cases, depending on how the array is configured [32,33]. To study the aerodynamic performance of wind turbine arrays with counter-rotating and co-rotating rotors, Giorgetti et al. [34] used CFD models. Over the course of the project, a 10 percent improvement in electricity production was achieved. In a computer simulation, Shaheen and Abdallah created a wind farm with three, nine, or twenty-seven Savonius turbines [35]. It was discovered that the power coefficient of a three-turbine Savonius cluster was 26 percent higher than that of a single turbine. A suitable site for a marine energy farm was discussed by Maslov et al. [36] Hydrodynamic performance of Darrieus turbines in a hydrofarm arrangement has not been experimentally tested, according to the references mentioned. Minimum streamwise and spanwise lengths for a Darrieus turbine-based hydrofarm are unknown.
In contrast to the open field turbine, the restricted flow channel produces a greater power coefficient than the open field turbine. A Savonius wind turbine’s power coefficient is impacted by wind tunnel blockage, according to Ross and Altman [37]. We interpret all of the results of this research in terms of the blocking effect.
Although the VATT architecture benefits from years of study into the optimisation of Darrieus-type vertical axis wind turbines, there are major variations in the approach flow speed and fluid properties of wind and water [14]. Similarly to research on horizontal axis tidal turbines, information transfer from wind to water is not easy. For example, although the majority of Darrieus-type wind turbines use symmetric NACA aerofoils and achieve reasonable efficiency, it has been demonstrated that asymmetric or cambered hydrofoils will outperform symmetric hydrofoils in some VATT designs [38]. The number of blades and rotor solidity are two of the primary design parameters for VATTs that have been extensively checked, while the spectrum of optimum values remains large [39,40]. The Gorlov turbine architecture [41] is an effort to address self-starting issues and irregular loading by using helical turbine blades, which raises the region swept by the rotor along its circumference. The disadvantage of this innovation is that power production decreases as the angle of twist increases. The option of blade form and lift-to-drag ratio is critical in the design of Darrieus-type turbines [42,43]. In general, the higher this ratio is for any lift-driven turbine, the better the turbine’s output. Some researchers examined the effect of surface roughness on the lift-to-drag ratio of an airfoil and concluded that smooth-surface blades generate more lift and less drag than rough-surface blades. However, caution should be exercised when interpreting the data, as these experiments did not account for the effect of rotation and/or flow curvature, respectively, and therefore did not analyse the airfoil blade’s action during stall. Given the results, this research aimed to study the optimal performance of the tidal turbines with different parameters under the rotational condition based on the nonpitching structure.
In order to improve the performance of vertical axis tidal turbine, it has been demonstrated that asymmetric or cambered hydrofoils will outperform symmetric hydrofoils in some VATT designs. The improvement from an asymmetric hydrofoil is mainly caused by the venturi effect. The venturi effect shows that the stream has lower pressure with higher velocity, which can be obtained from the law.

2.4. CFD Simulation

Recent studies have shown the use of high-fidelity models for conducting thorough hydrodynamic evaluations and evaluating wake generation (CFD) [44]. This approach has received broad use as computational methods have advanced and the availability of supercomputer equipment has increased. Recent years have seen an explosion in the popularity of CFD applications, including research on three-dimensional turbine analysis [45] and wake findings [46]. The study of the wake behind a turbine, particularly the near-wake, is essential to understand the interaction effects between flow and the turbine, which are required for a better understanding of the tidal turbine’s power extraction process. Numerous computational approaches have been proposed to investigate the near-wake, including the following: (a) Reynolds-averaged Navier–Stokes (RANS) models coupled to Multiple Reference Frame (MRF) or sliding mesh techniques [47]; (b) so-called “actuator models” [48]; and (c) hybrid models such as RANS equations coupled to B [49]. Both the MRF and sliding mesh methods attempt to properly represent the three-dimensional (3D) wake structure generated by the turbine rotor; furthermore, they capture the helical vortex produced by the blade tips. The drawback is that it requires a great deal of computing effort in contrast to other methods, since it requires a very thin grid across the turbine rotor to collect flow data. A less computationally expensive approach is the actuator disc models (ADMs), which replace the real geometry for the response forces generated by it. The researchers proposed and evaluated the method experimentally, demonstrating that the downstream results for the near-field wake within 7 m in diameter were not feasible [50]. Finally, the RANS-BEM method has been shown to be successful in forecasting the turbine’s output power and the flow characteristics of the turbine’s wake [51].
Maitre et al. [52] utilised a 2D RANS SST model to replicate the experimental findings of Roa et al. [53] and discovered that this method tended to overstate the experimental results, which they attributed to the model’s omission of 3D effects. McNaughton et al. [54] replicated the setup from [52] by adding the Low-Reynolds-number Effect (LRE) adjustment to the 2D RANS SST model. They obtained better findings by changing the turbulence model, but they were still unable to match the actual data. Howell et al. [55] conducted a similar study for a vertical axis wind turbine (VAWT) utilising 2D and 3D RANS models with the RNG turbulence model. The 2D RANS model’s inaccuracy was shown once again by a substantial overestimation of the power coefficient, while utilising the 3D model considerably decreased the overestimation, showing the significance of replicating the 3D character of the flow around vertical axis turbines. Marsh et al. [56] used 3D RANS to analyse the effect of various helicoidal designs on the performance of a VATT. The results offered insight into the effect of this geometric variation on the device’s performance.
One reason why RANS-based methods for flow–turbine interaction prediction are inaccurate is because flow–turbine interactions are controlled by large-scale turbulence. In principle, the LES technique is better-suited to simulating these interactions, owing to its proven superior accuracy in forecasting flows dominated by large-scale energetic vortices when compared to RANS. However, the computing requirements for LES are much greater than those for RANS, which limits the use of LES to the majority of academics and practitioners [57,58,59].

3. Methodology

3.1. Model Geometry

The main project was designed to include two groups of comparison. One of the groups, named group A, is used to investigate the performance influence from the new hydrofoil on the side panel of the venturi structure. The other one, named group B, is used to figure out the influence of the number of blades on centre rotor to the turbine performance. The basic turbine model is established based on the CAD draft profile provided by Mark Hill, the Managing Director of the DHV system. The new hydrofoil and the blades used in the two cases are designed based on the shape profile from the airfoil website and the 3D model profile on the GRABCAD COMMUNITY provided by Alireza Ahani, respectively.
Group A:
As the results from the previous research were obtained from the 2D model, the results with the new hydrofoil on the side panel is also obtained as the 2D chart to make the comparison. In order to ensure the precision of this study, the model in case A is designed as a 3D model at first. After running the simulation, the result is obtained from the section view from the horizontal surface with half the height of the turbine as the 2D chart.
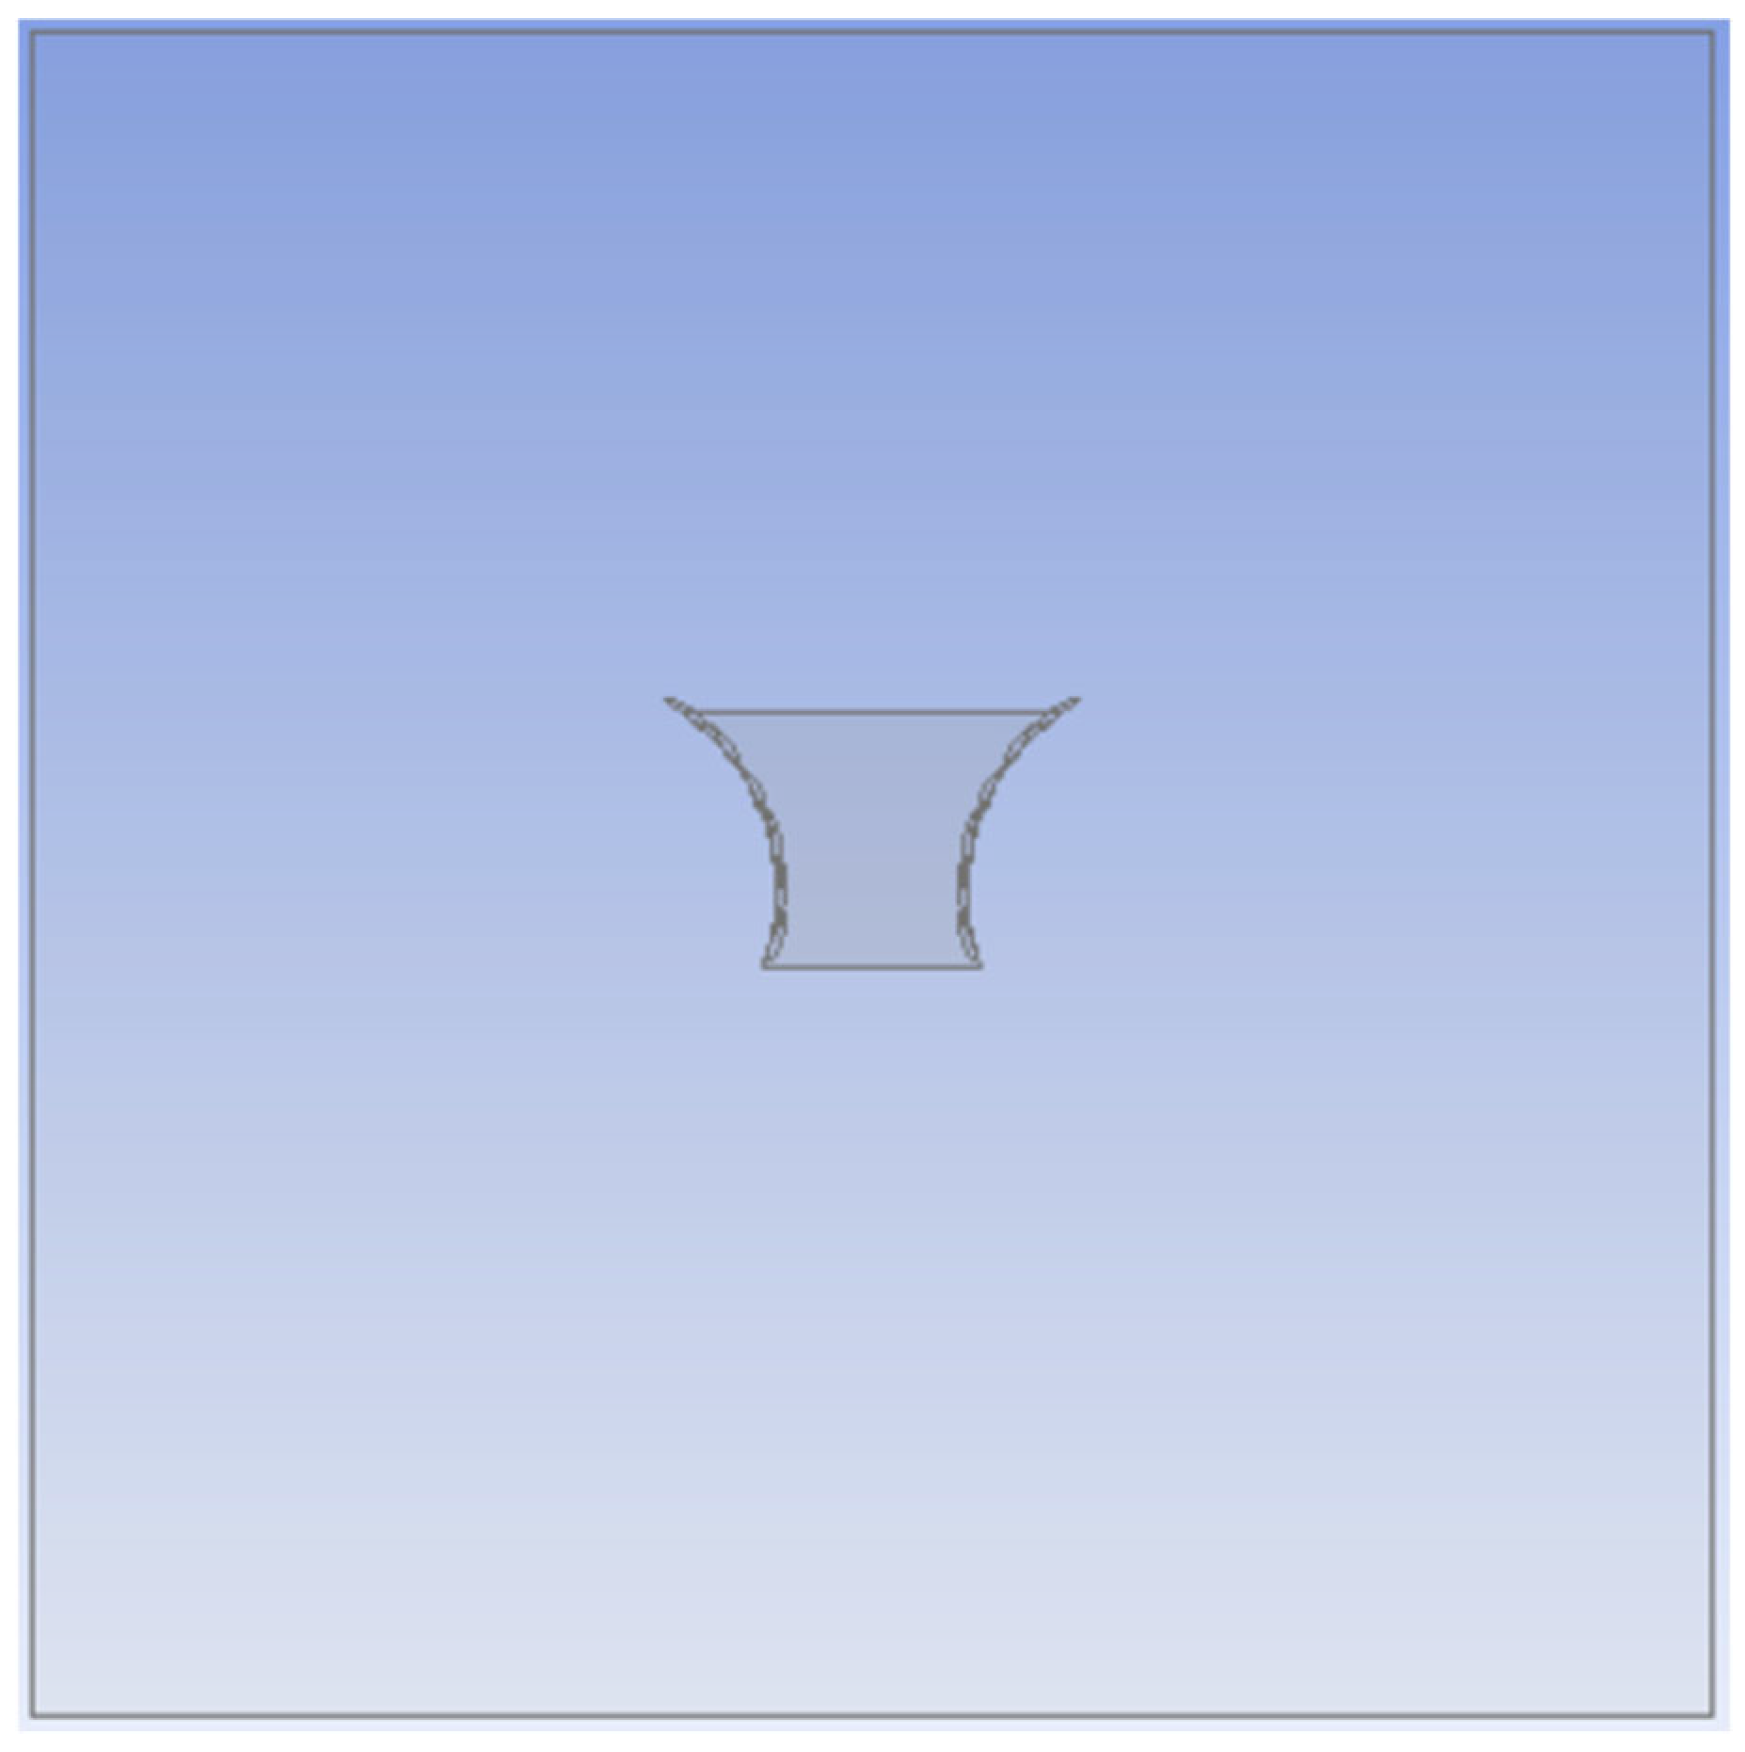
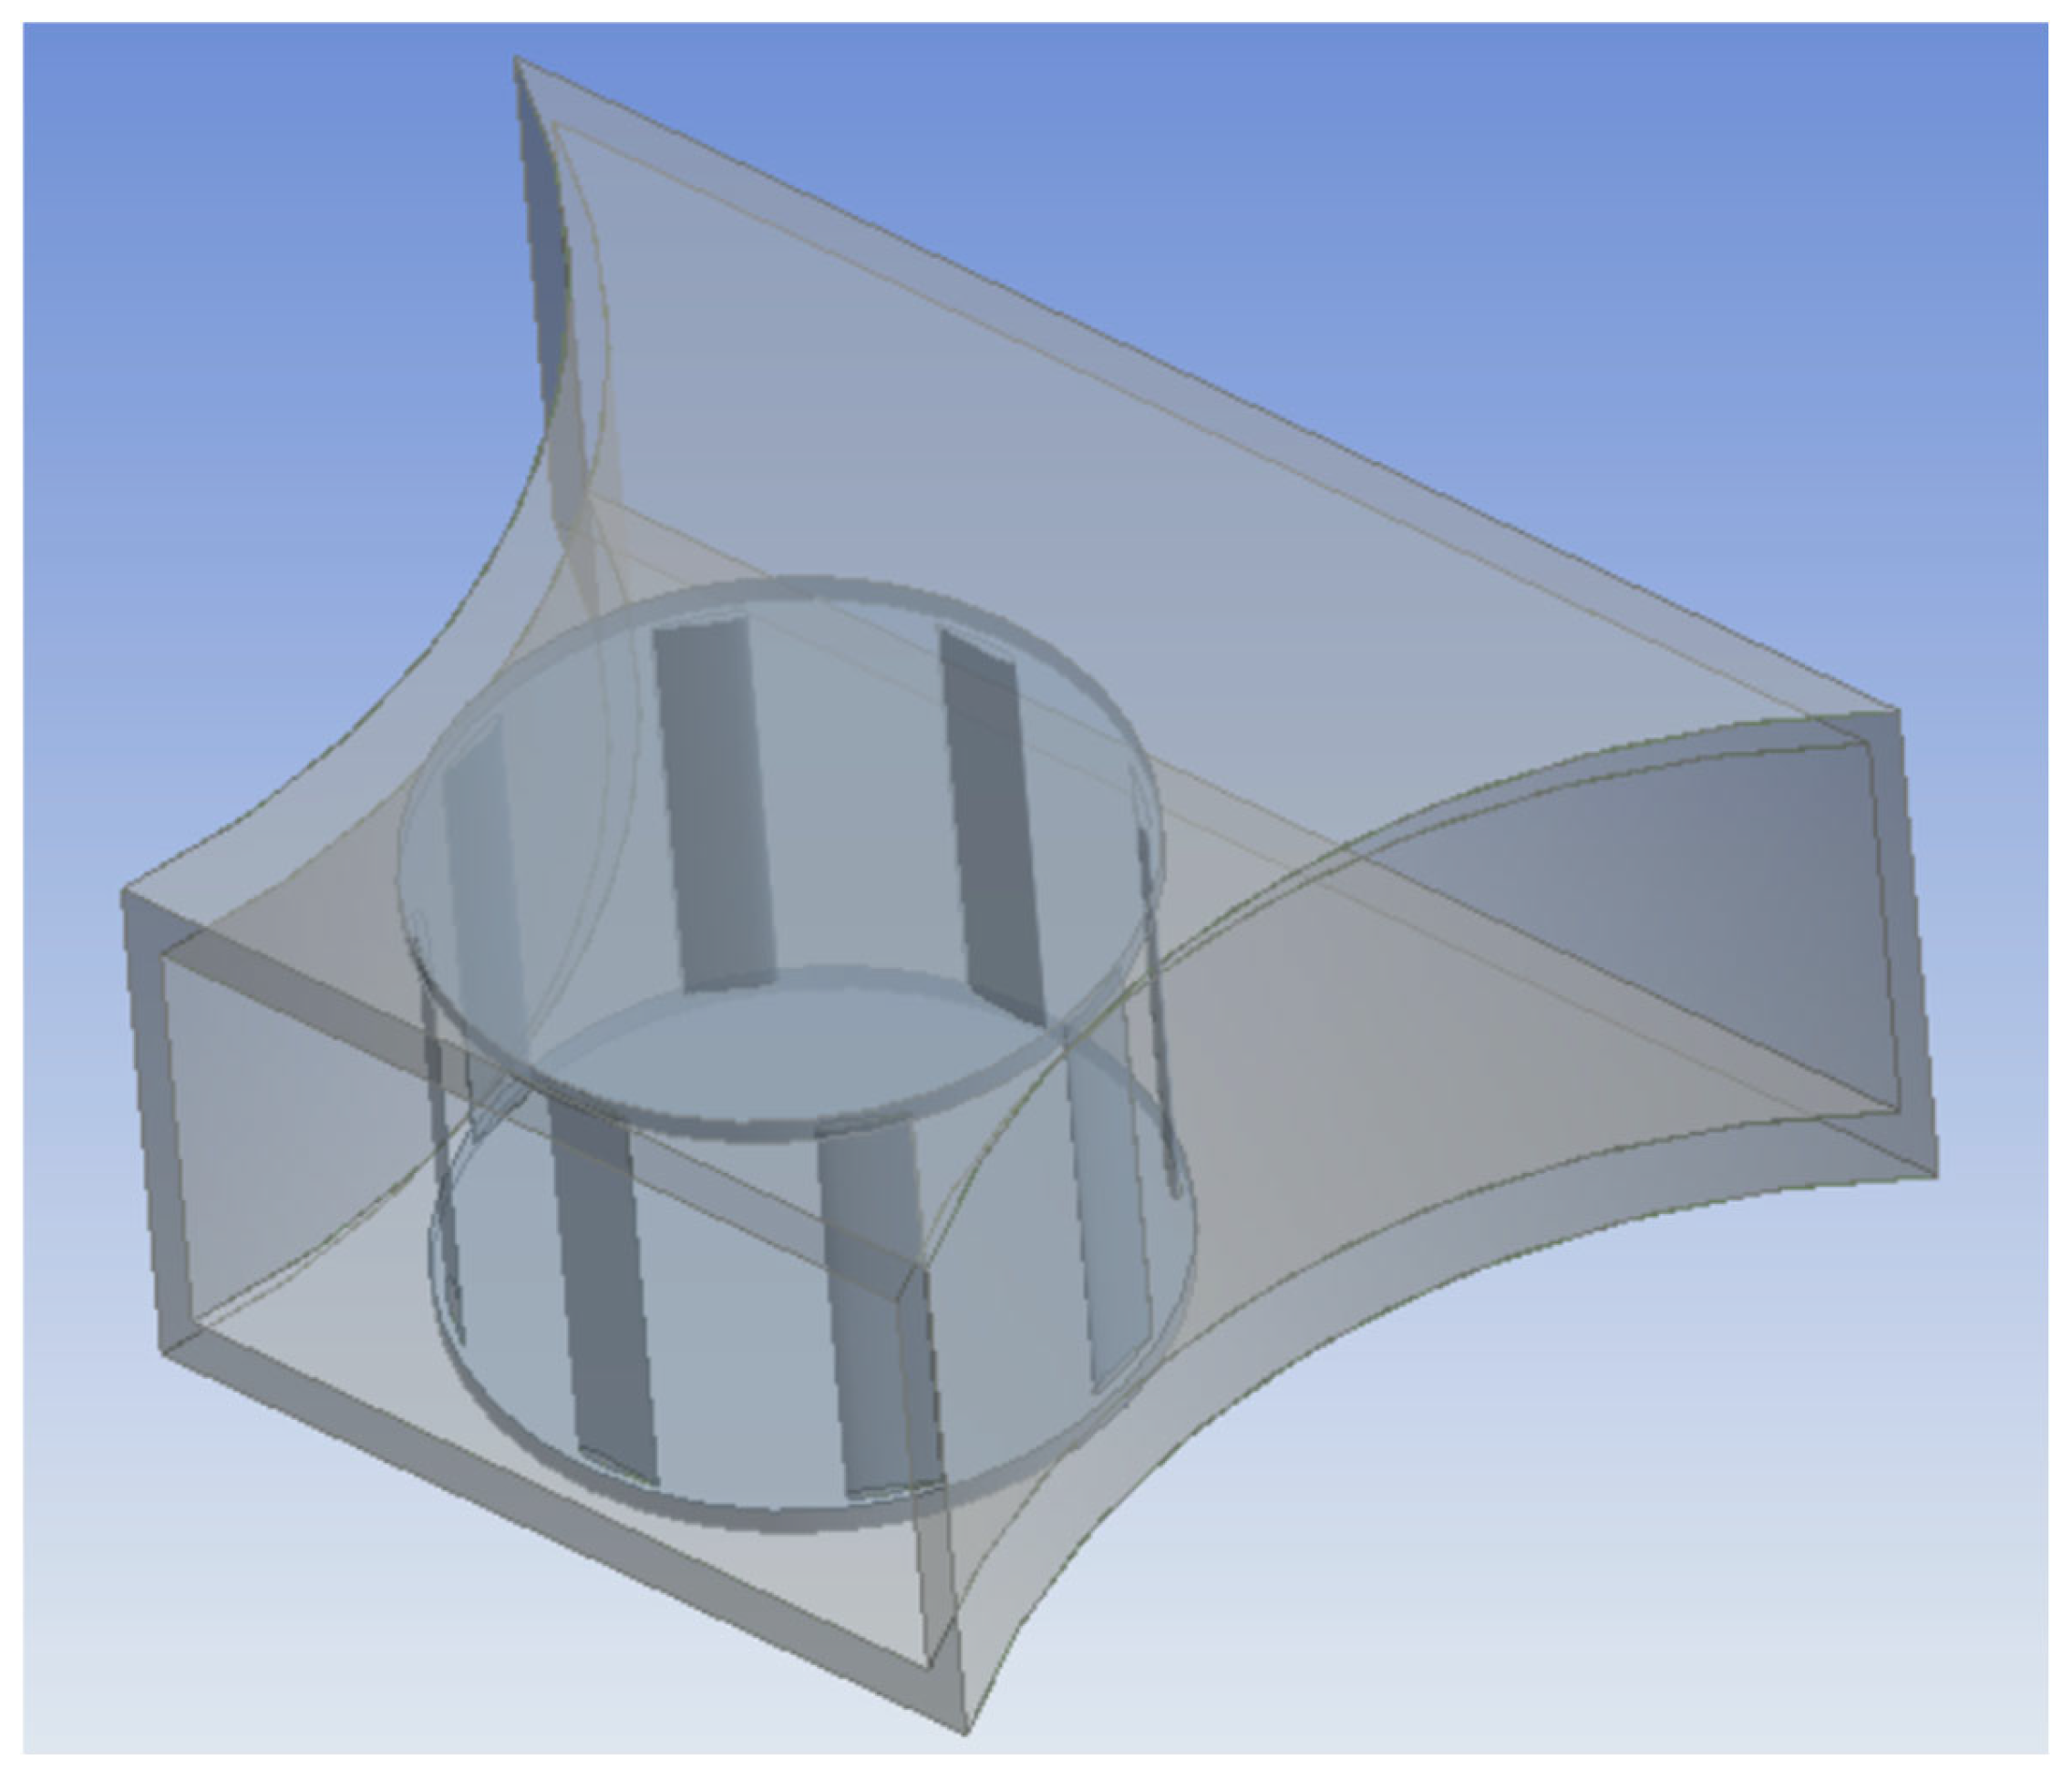
As Figure 8 shows, the venturi structure is approximated to the combination of a trapezoid structure with two arc side panels. As the venturi structure is designed to contain a centre rotor with 1 m in diameter, the least distance between two side panels is larger than 1 m. Based on the sketching view of the structure panel, the total length of the turbine structure is designed as 5 m, while the largest width at the outlet is also 5 m, and the hydrofoil is allocated two attached virtual arc curves with a radius of 1.3 m.
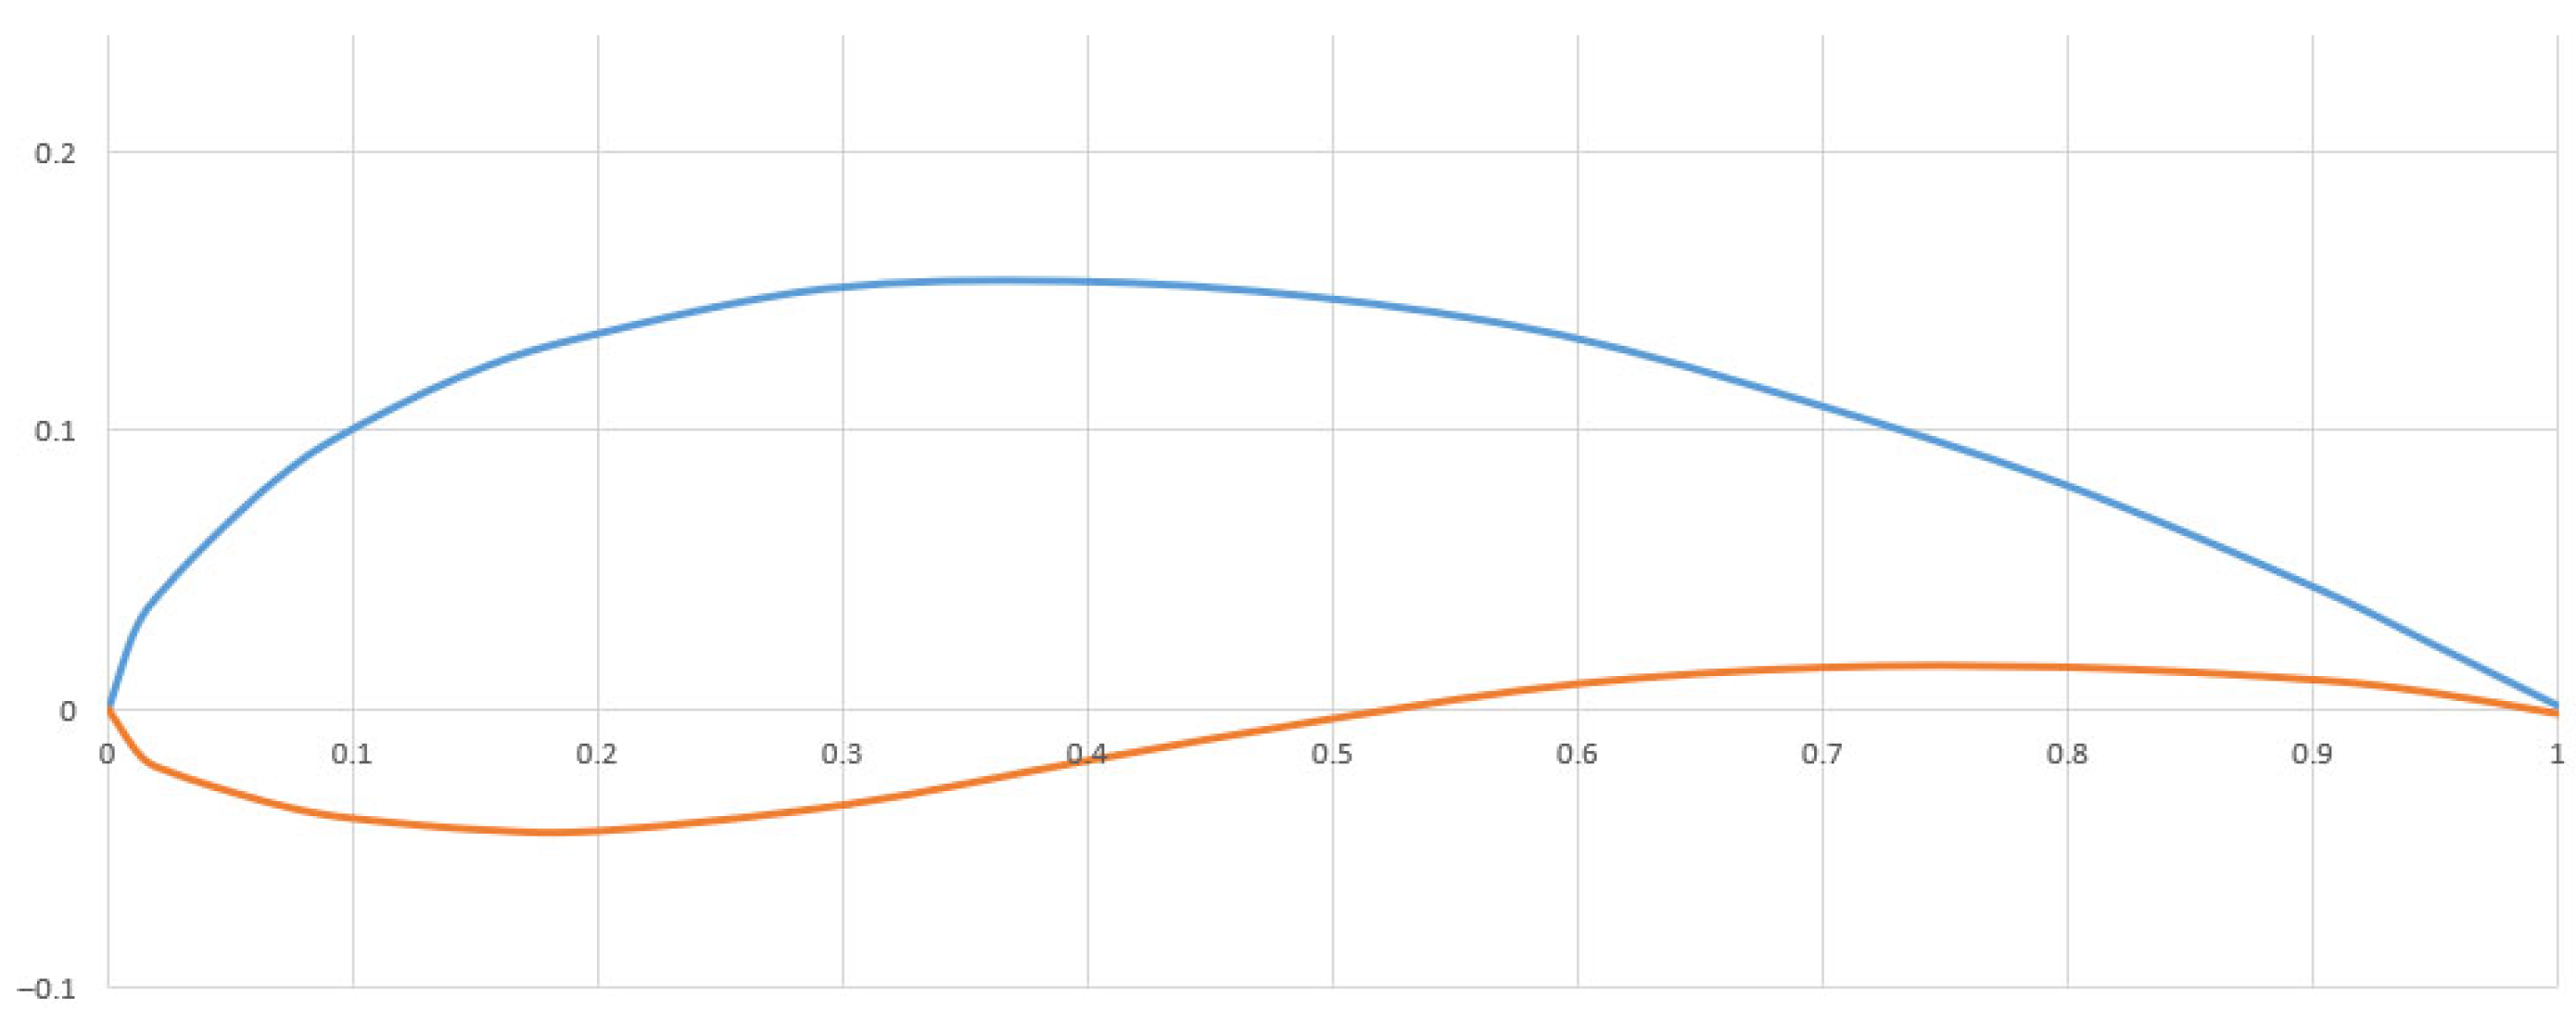
In this model, GOE-222 is selected as the new hydrofoil to induce the wave flow through the side panel of the turbine structure. According to the shape profile on the airfoil website as recorded in Table 1 and Figure 9, the data can be expressed as two curves between intervals from 0 to 1. The specific parameter of the hydrofoil is obtained from a previous study CAD document, where the maximum length of the structure is 316 mm. Based on the CAD document provided from DHV Turbines Ltd. (Glasgow, UK), six foils are allocated on each side panel to form a symmetrical structure.
The computational domain is designed as a rectangular cuboid, with a length and width set to ten times the turbine’s characteristic length. Although the simulation results are presented in a sectional (2D) view, the domain includes a vertical height equal to five times the turbine height to minimise the influence of potential backflow effects.
Group B:
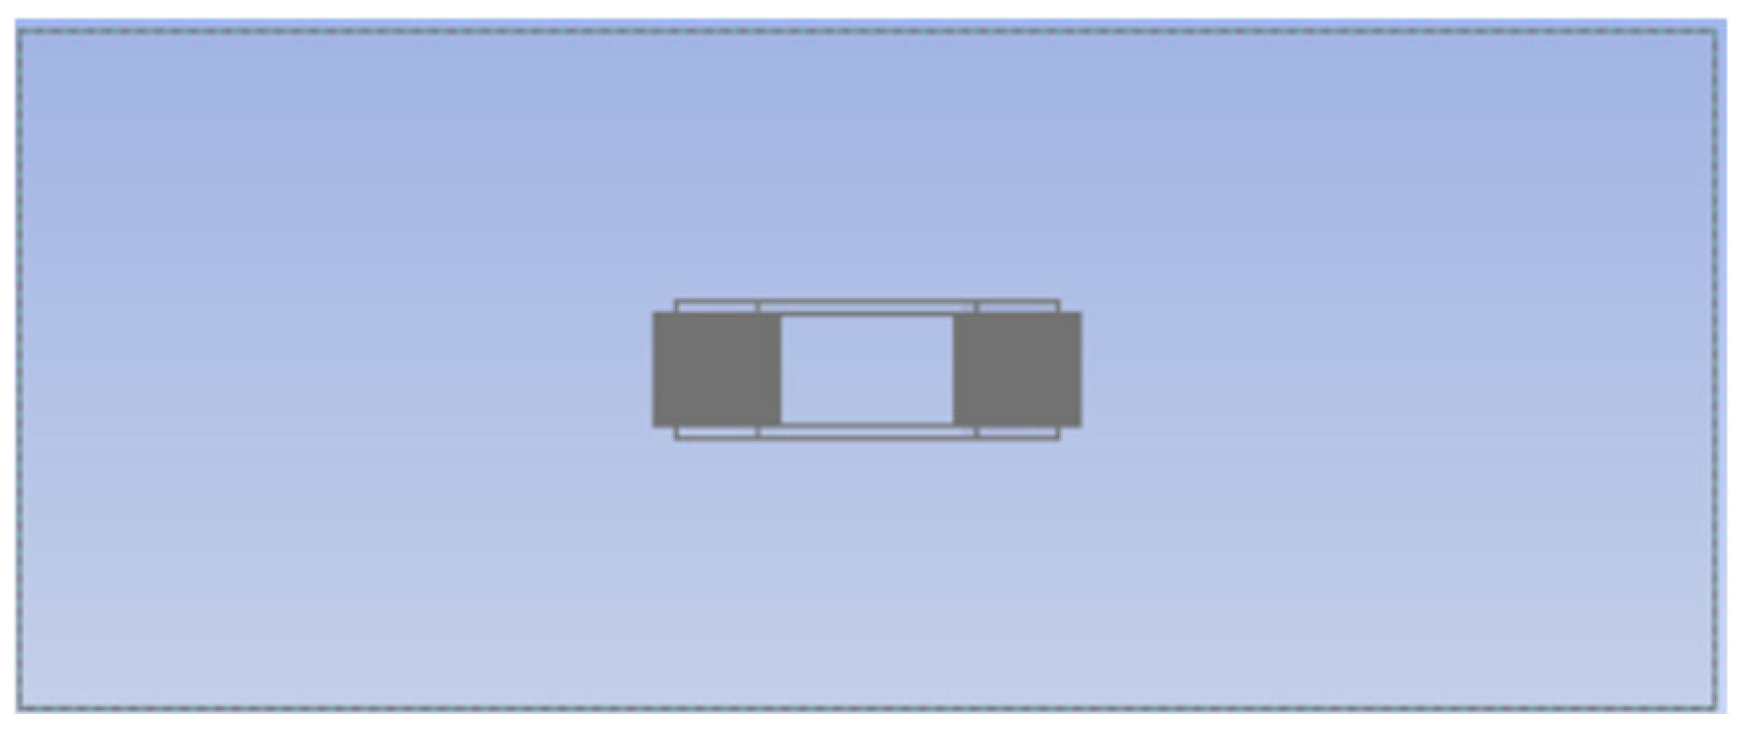
The cases in group B contain two different models, with four rotor blades and eight rotor blades, respectively. Figure 10 and Figure 11 below show the blades’ location under different number conditions on the rotor as several rigid body structures installed normally with the top and down surface of the turbine structure. In order to control the variable, the side panel of the venturi structure is designed to be a smooth and curved surface. The models in group B are established as the dynamic model, where the centre rotor is available to rotate to simulate the operation condition. Though the blades on the rotor also have a pitching ability, the model established in the simulation makes the blades fixed on the rotor, with a stable angle that is parallel with the tangential line of the rotor circle.
Two 3D models used in group B are shown in Figure 12 and Figure 13 below:
The blades in four-blade model formed a 90-degree angle between different blades.
As for the eight-blade model, the blades on the rotor have a 45-degree interval.
Based on the CAD file from DHV company, which illustrated in Figure 14, the centre rotor in the structure is designed as 1 m in diameter and 680 mm in height. The rotor blades used in the model are selected as NACA0020, with the largest length of 0.13 m.
Using the same design principle, the computational domain in group B is also formed as a rectangular cube, which has the parameter with the same ratio to the turbine size in group A.

3.2. Meshing Design

Group A:
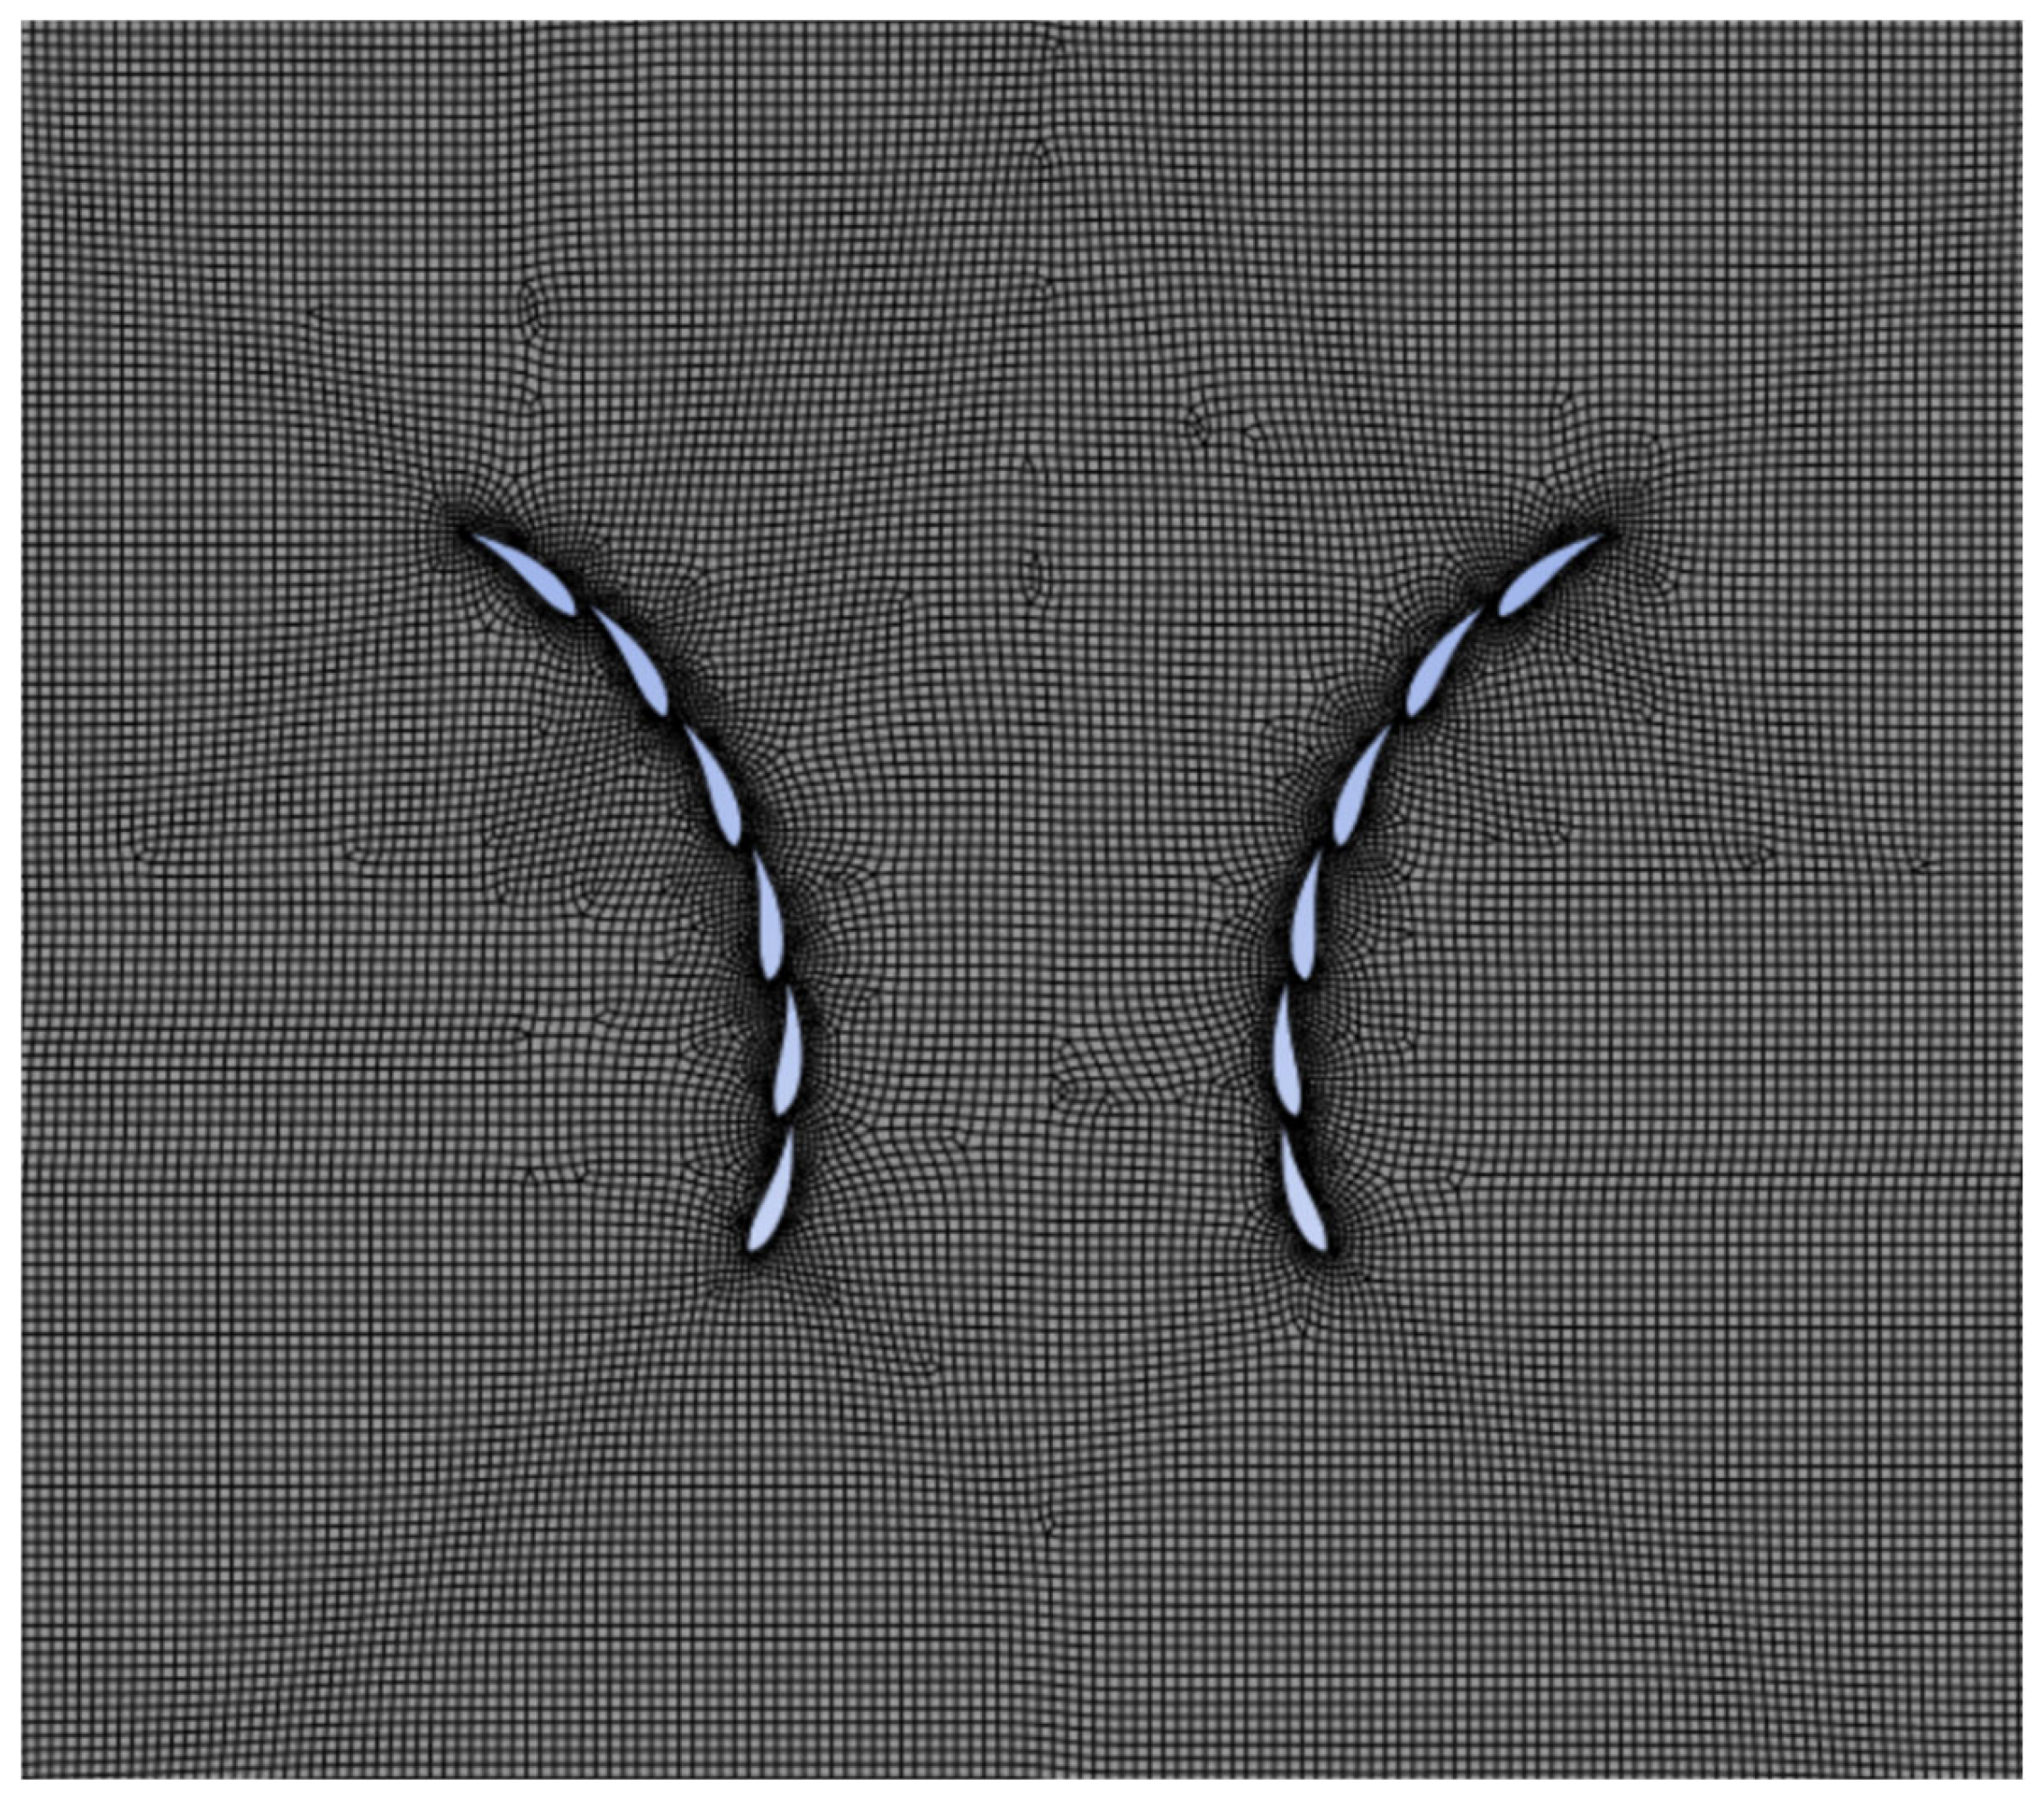
The model in group A adopts a static grid modelling method as shown in Figure 15. In order to save computing resources, the entire model is divided into several different parts with different element sizes.
In the computational domain outside the turbine, the mesh primarily consists of cells with a size of 0.03 m, while the cells extending from the hydrofoil surface are refined to 0.01 m. Due to varying detail requirements across different parts of the model, coarser meshes were applied in regions outside the hydrofoil to conserve computational resources. By comparing the velocity at a fixed location under different mesh sizes, a curve depicting the variation in velocity with mesh size was obtained, as shown in Figure 16. It was observed that when the mesh size is 0.03 m, the velocity variation compared with the case with the mesh size of 0.02 m is less than 0.5%, which is considered sufficiently accurate. As a result, the meshing size of the simulation was decided to be 0.03 m along the edges of the computational domain.
Since the accuracy of the hydrofoil shape data is mainly 10 mm, in order to accurately simulate the special arc of the hydrofoil, the grid extending from the surface of the hydrofoil to the outside is mainly 0.01 m in unit size. The boundary layers are not designed in this meshing grid because of the tiny dimension of the hydrofoil.
Group B:
The model in group B is used to simulate a dynamic central rotor which is different from group A. Therefore, the model in group B used a combination of dynamic grids and functions for simulation. The model is mainly divided into two parts; one is a static grid structure similar to that of group A, except for the extra specific meshing part added from the hydrofoil part of group A, and other parameters are the same as those used in group A. The other part is a dynamic grid surrounding the central rotor, with the rotor’s motion range as the boundary, which is represented as a ring-shaped grid structure in this study. The UDF function is used to specify the movement mode of the rotor blade during the design process.
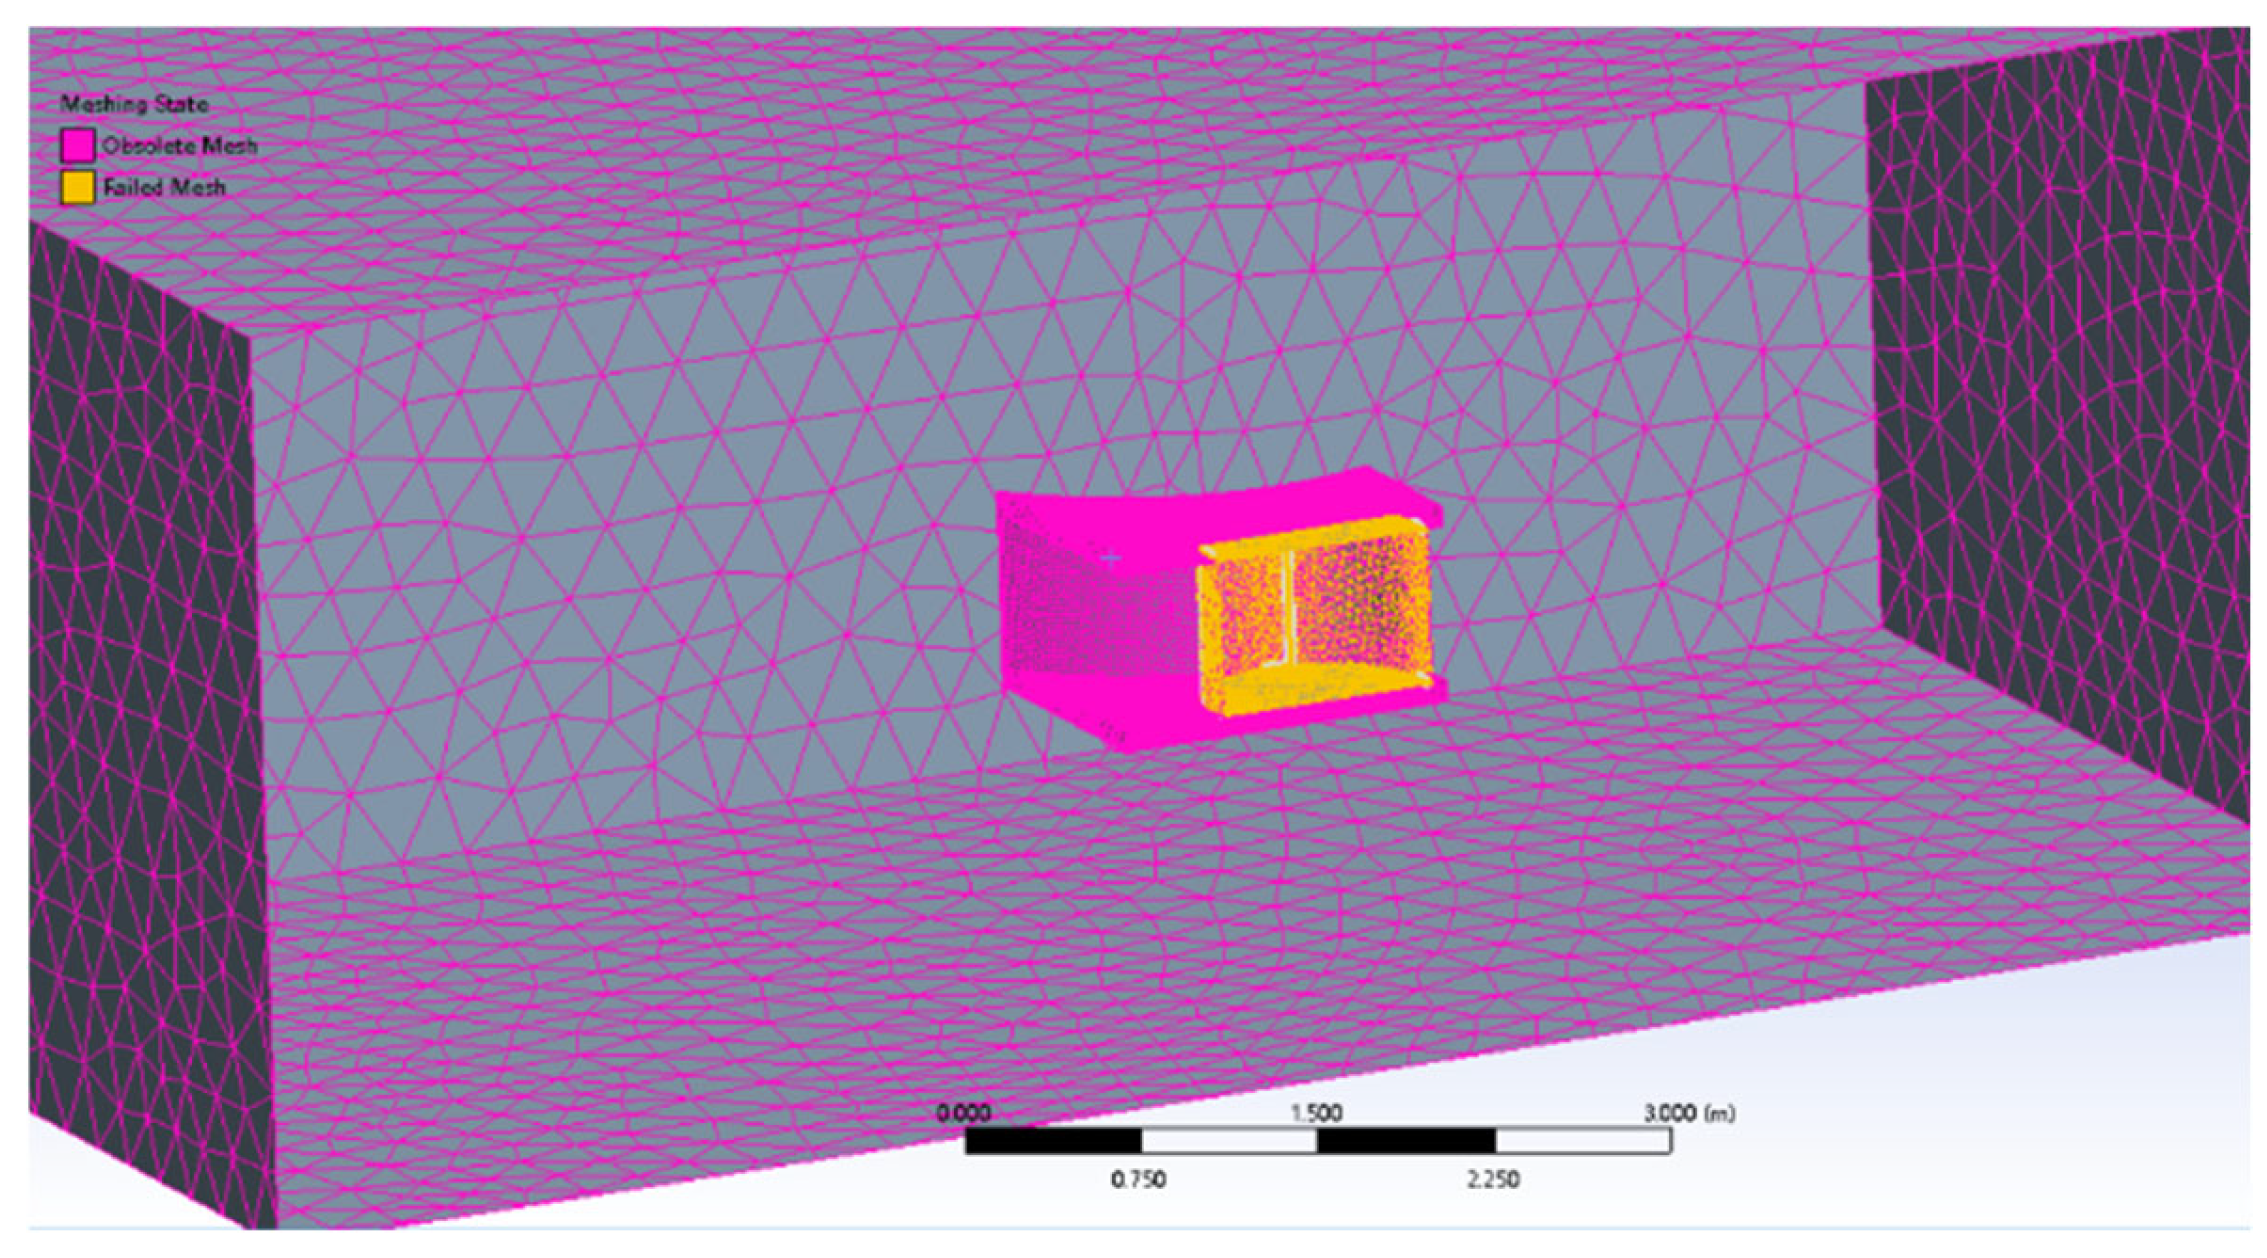
Based on the Figure 17 shown, the surrounding computational domain in the static grid structure is filled with a 0.3 m element, while the element size approaching the venturi structure is only 0.05 m. In order to improve the meshing quality around the rotor, when the grid approaches the centre rotor, the element size is reduced to 0.03 m and the interval attached with the blades is only 0.001 m. As preparation for the rotor dynamic grid simulation, the boundary layers are also considered in this meshing document. Five inflation layers are added with a 1.2 growth rate attached with interface between the rotor and stator grid.

3.3. Boundary Condition

The boundary condition in group A of the models is designed to simulate the turbine working condition, where it is assumed that the free stream has a velocity of 1 m/s, which is the same as the condition in the previous study, to make sure the variable is controlled. As for the boundary condition used in group B, the dynamic simulation based the operation condition under the high-power level, which is selected as 6 m/s, a normal velocity input from the inlet surface of the turbine; this is also the largest input velocity mentioned in the test in DHV website.
In group B, a dynamic mesh strategy is applied within ANSYS Fluent 2021R1 to simulate the interaction between the rotor and surrounding fluid. The interface between the rotating and stationary domains is defined as a smooth peripheral surface enclosing the rotor’s motion region. The rotor motion is governed using Fluent’s six-degrees-of-freedom (6DOF) function, in which a single-degree-of-freedom (1-DOF) rigid body rotation is enabled around the z-axis, while all other translational and rotational degrees are constrained. A moment of inertia of 8.6413 × 10⁶ kg·m2 is assigned to the rotor, allowing it to undergo passive rotation driven solely by the hydrodynamic torque exerted by the stream flow. The rotor blades are modelled as a rigid body, and the dynamic mesh automatically adapts to their motion during the transient simulation.
The turbulence model used in the research is based on the k-ω SST model to enhance the accuracy of flow predictions in the near-wall region. The k-ω SST model combines the accuracy of the k-ω model in the near-wall region with the robustness of the k-ε model in the free stream, providing reliable predictions for separated flows and complex boundary layer behaviour. The inlet surface assumed the wave flow was always normal to the inlet of the turbine because of the pitching function of the total turbine device.
During the simulation process, the residuals of continuity, velocity components, and both turbulence model parameters were strictly controlled to remain below 10−5, ensuring the convergence and numerical stability of the solution.

4. Results

Group A:
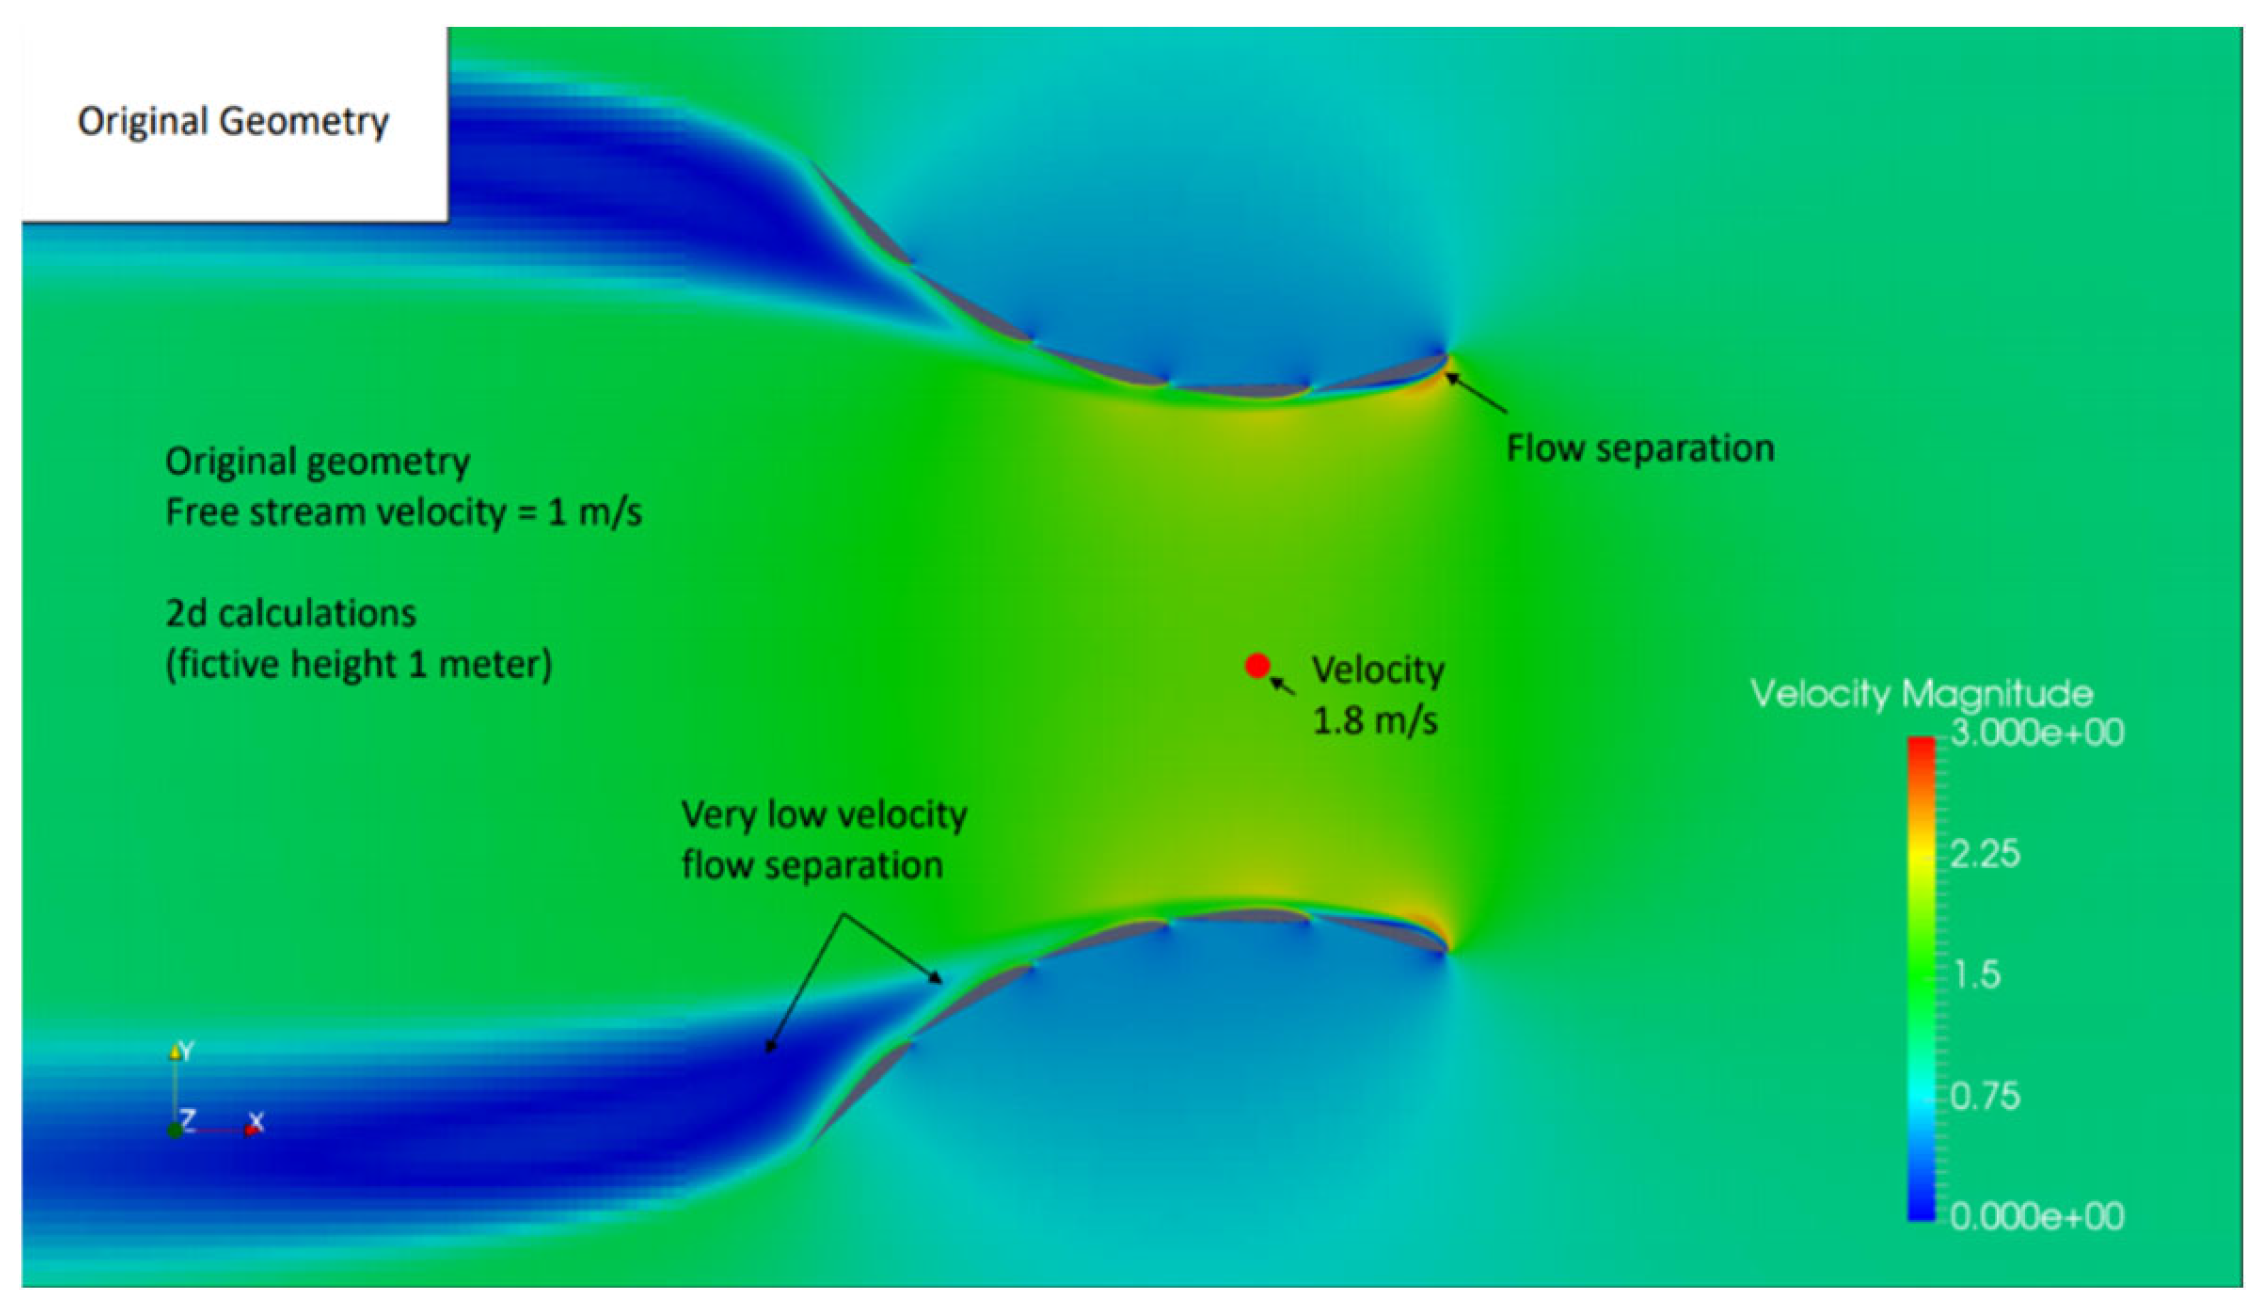
The result obtained from the 3D venturi structure with the hydrofoil on the side panel is measured from the centre point between two side panels and the data point in the previous study is shown in Figure 18.
Based on the results from the previous study [9], the steam flows with a velocity of 1 m/s as the input velocity, while the velocity at the centre point of the rotor is increased to 1.8 m/s by inducing the effect from the hydrofoil structure. As the figure above shows, the steam flows normally to the input surface of the turbine, and the fluid around the input area is induced by the hydrofoil to concentrate to the centre between two side panels to increase the efficiency of the rotor by raising up the catching mass flow of the liquid.
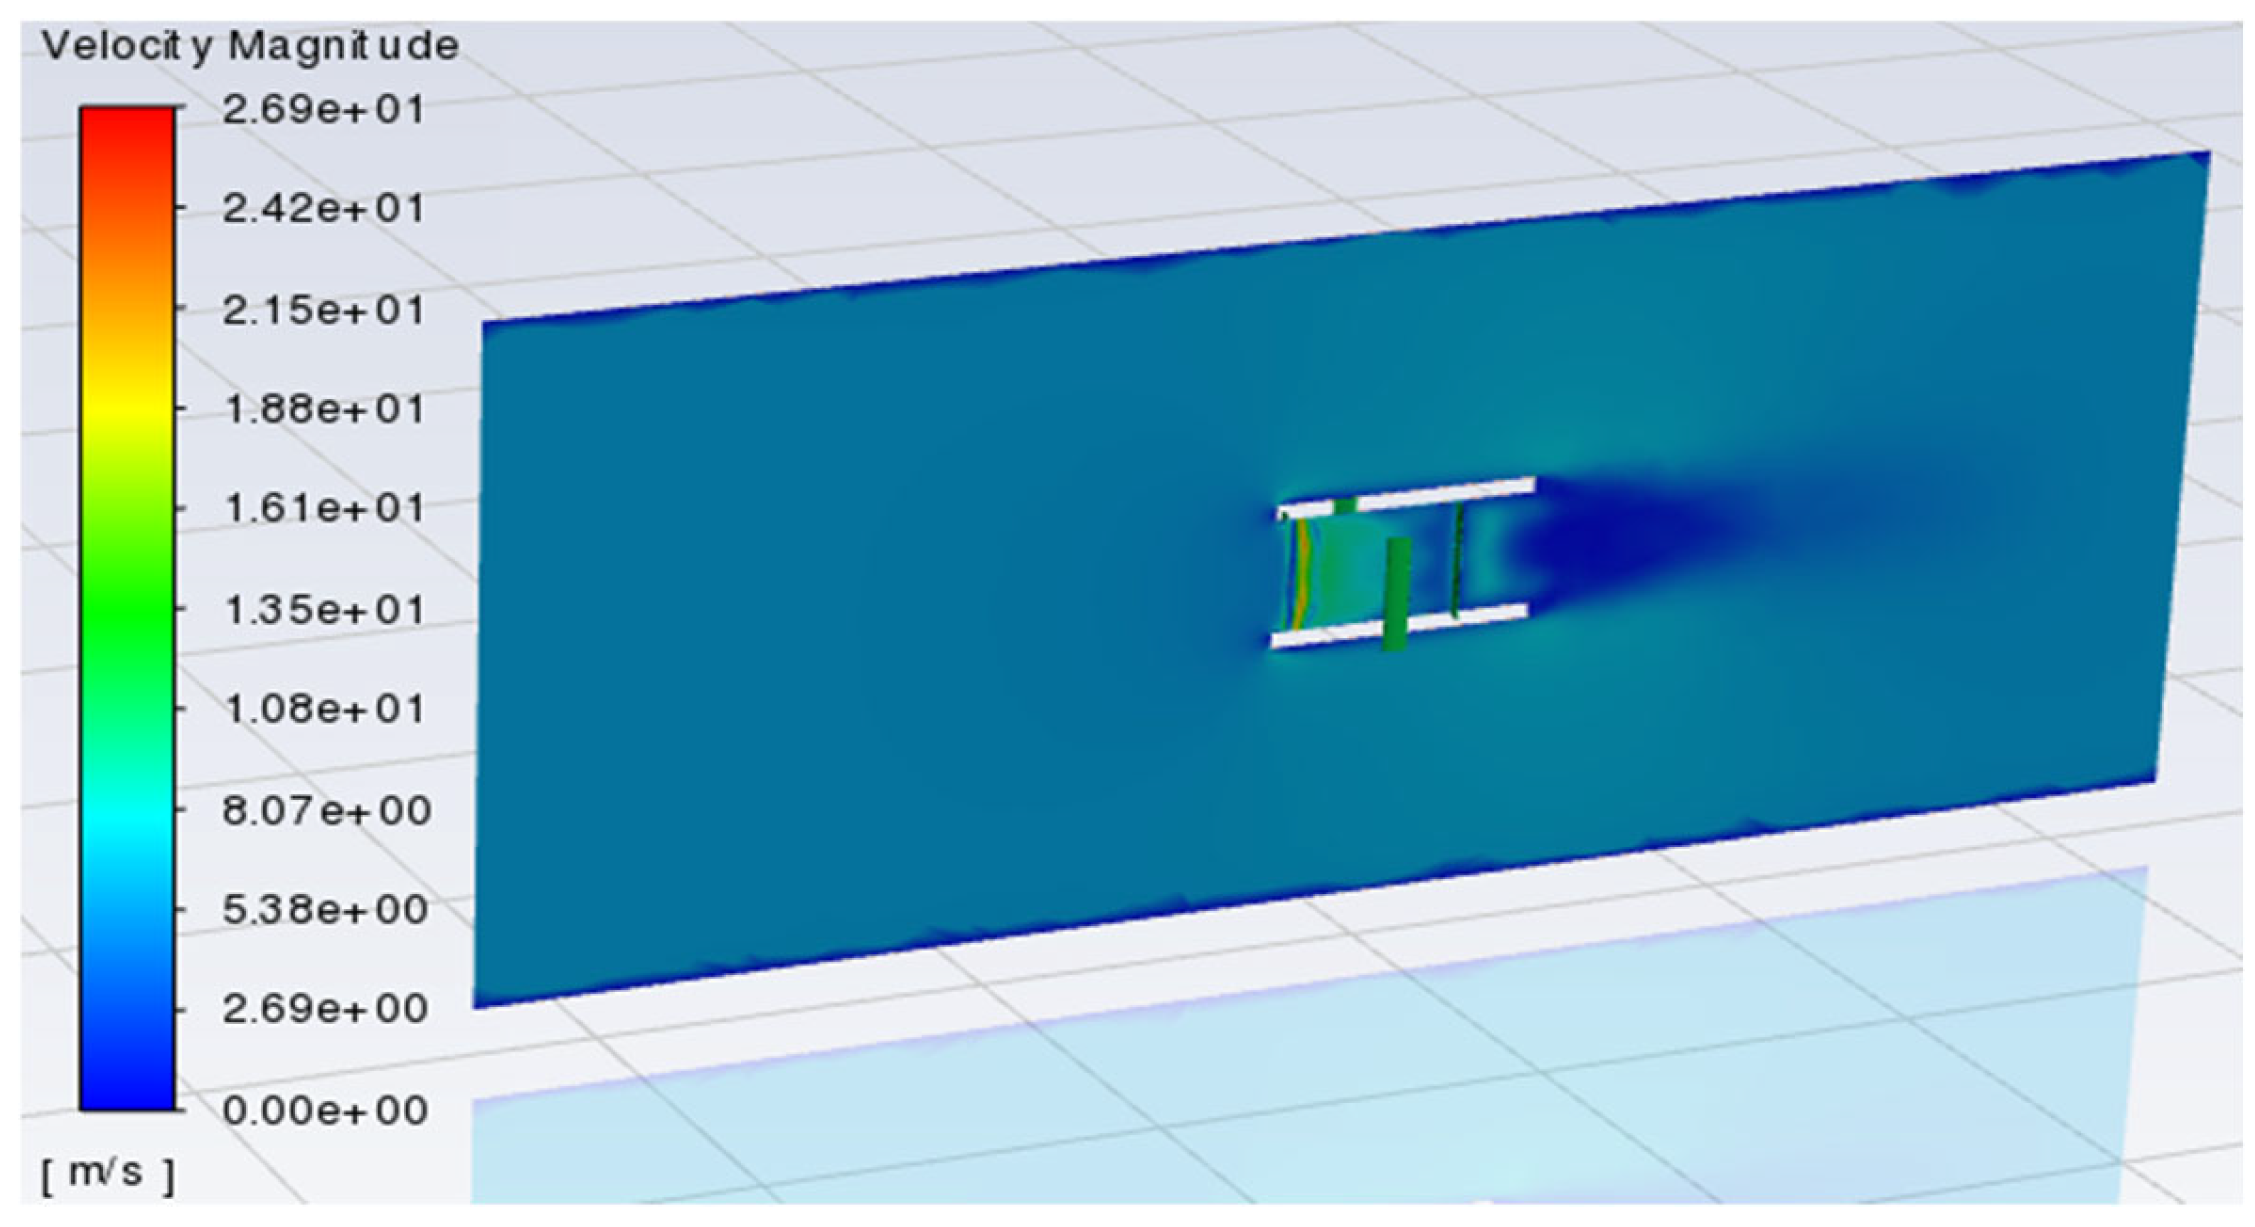
The case used in group A in this research showed the steam flow results through the turbine with the GOE-222 hydrofoil. As the Figure 19 demonstrates, the velocity at the point in the simulation has a velocity of 2.06 m/s, which is slightly higher than the data obtained from the previous study [9]. Given the higher thickness of the new hydrofoil, the new turbine with these data performed a larger inducing effect to the stream flow through the turbine.
Group B:
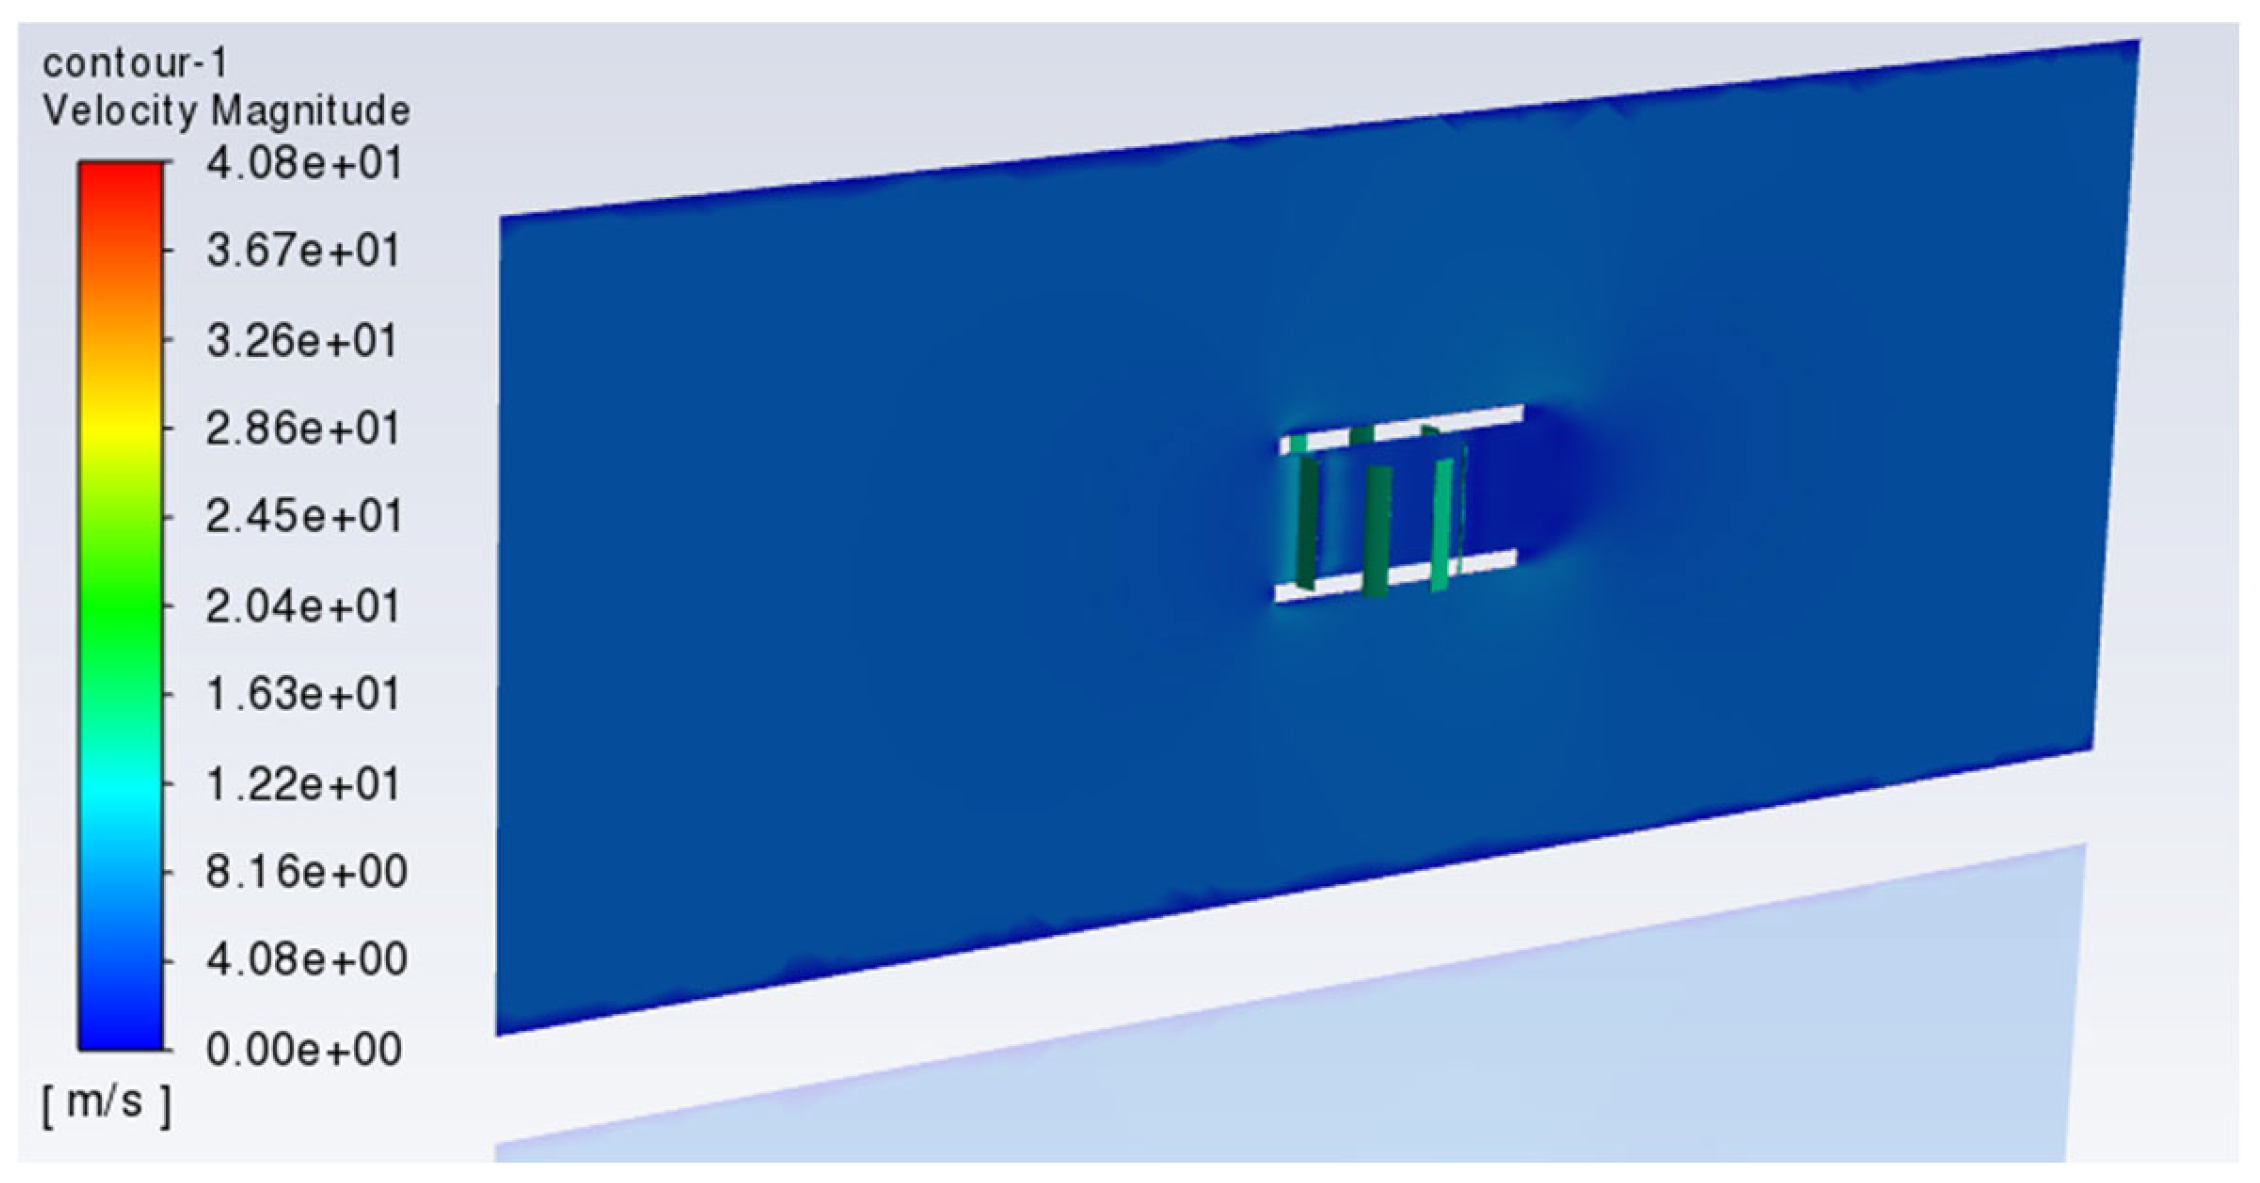
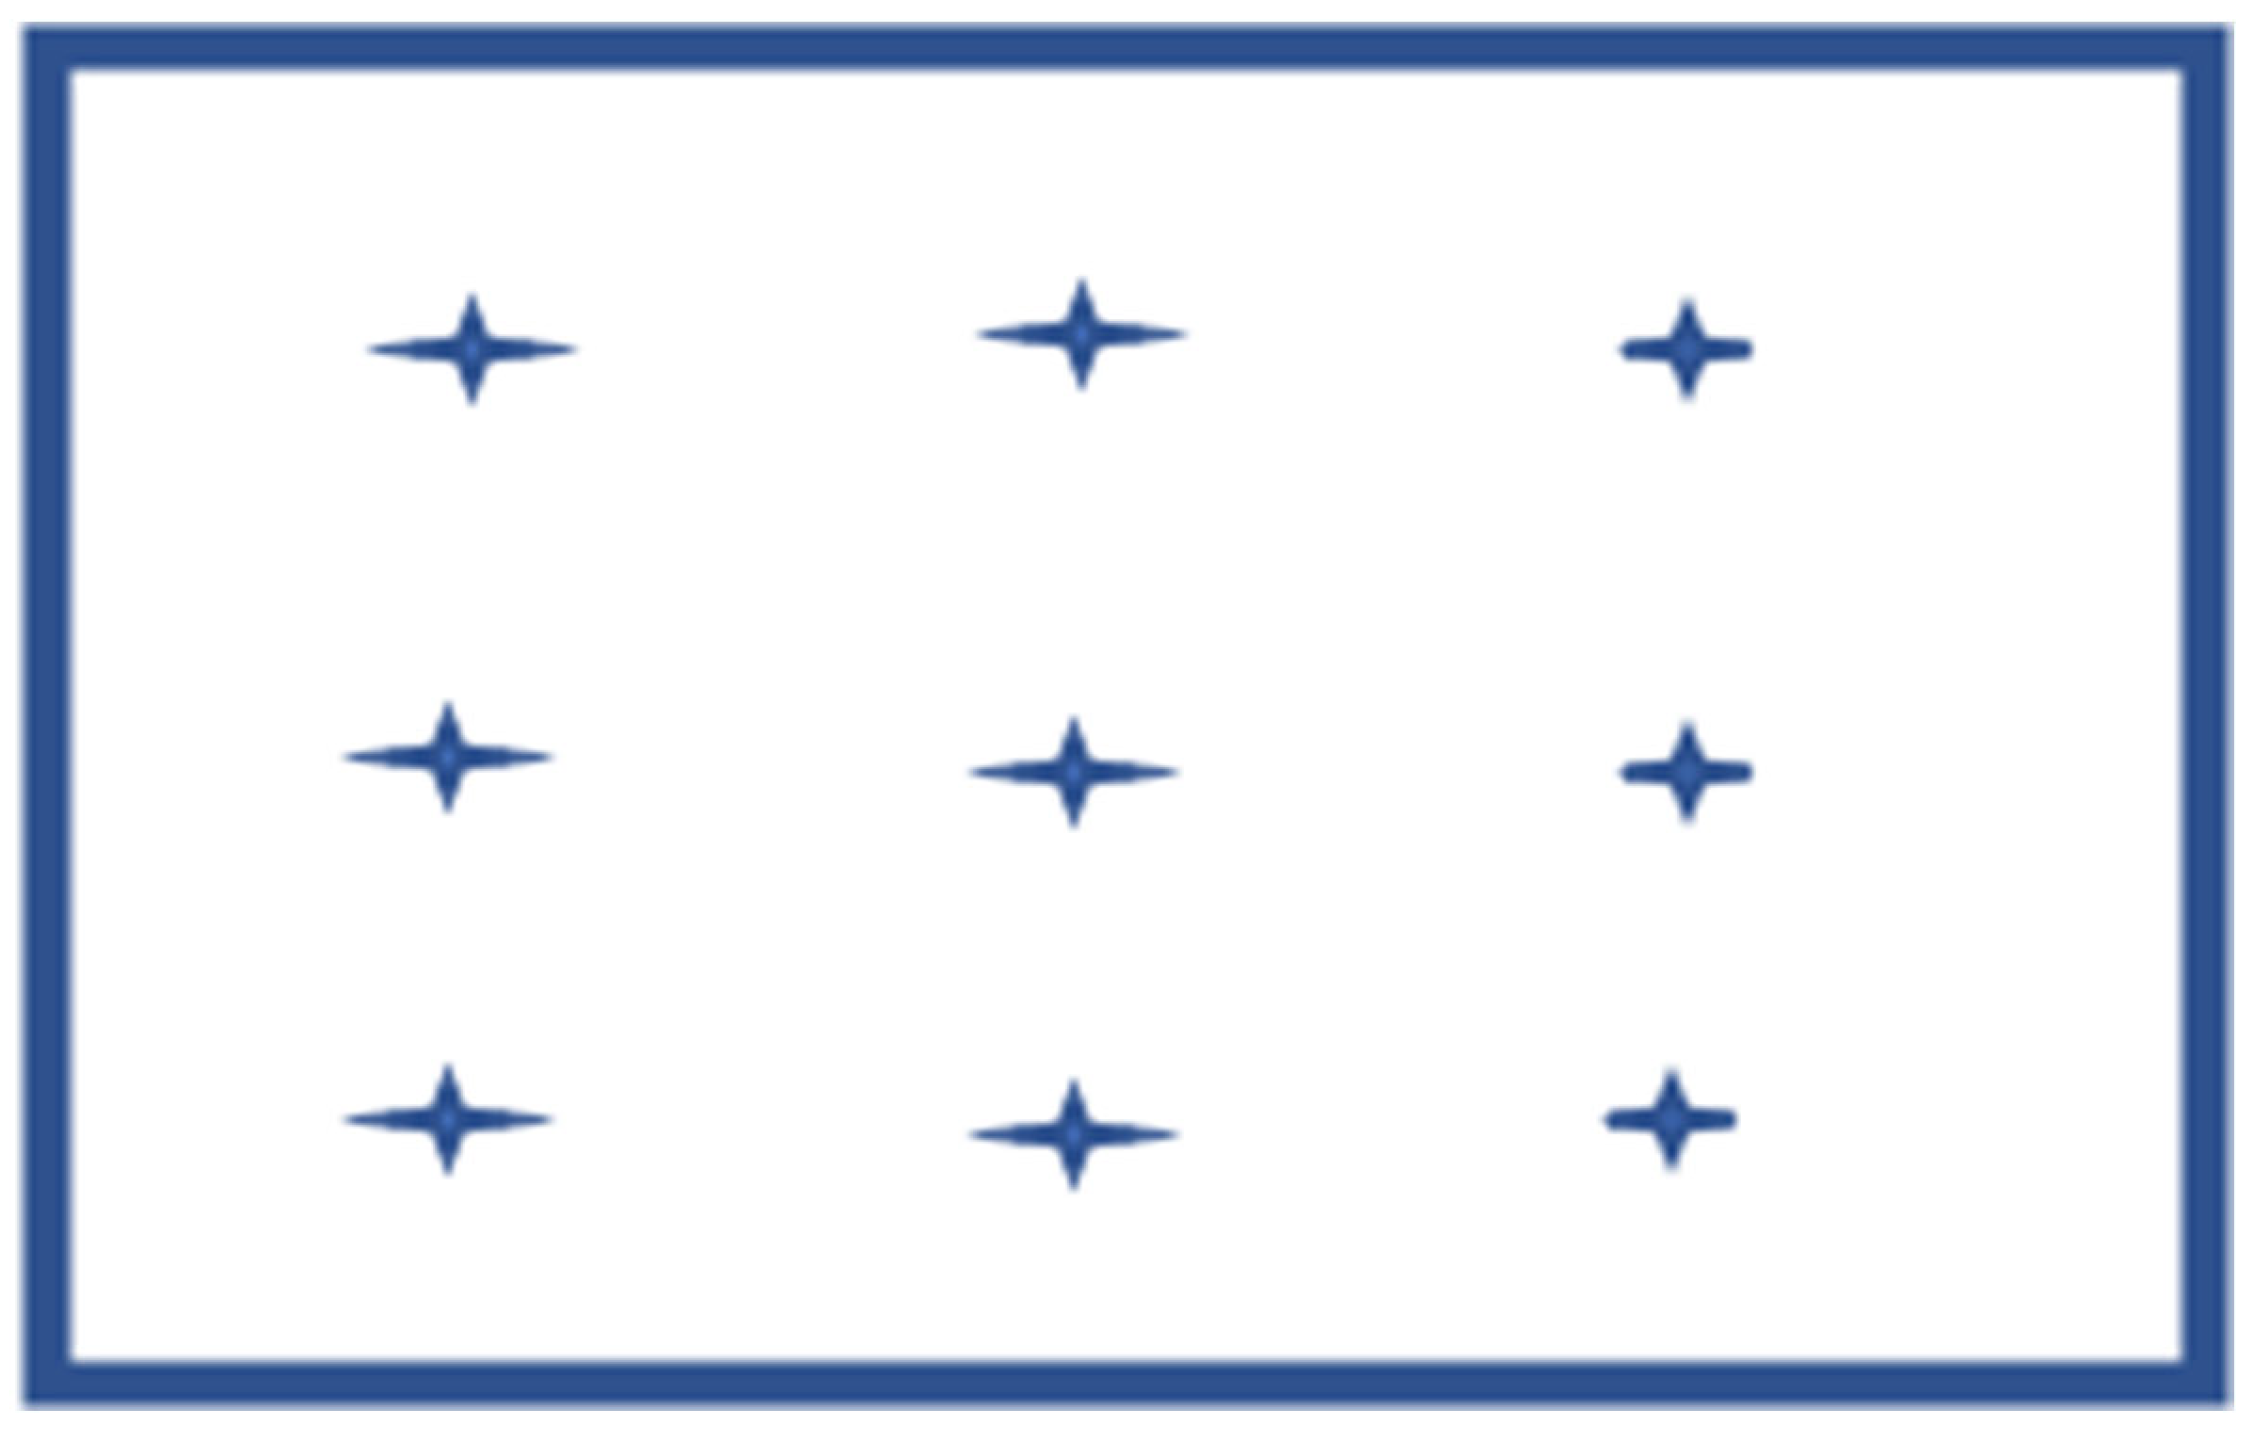
The simulation results obtained from the above two cases in Figure 20 and Figure 21 are designed to be recorded by two methods. One method is to collect the velocity from the input and output surface of the turbine as the measuring points, as illustrated in Figure 22 below. The capacity of turbines with different numbers of blades is designed to be compared by the energy reduction of the steam flow through the rotor. The other one is to use the monitor function in simulation software to observe the torque on the blades which represented the energy caught by the rotor. Both of the two methods can check each other as they served the same target.
According to the principle of mass conservation, the volumetric flow rate at the inlet and outlet of a tidal turbine system should be equal in the absence of external forces. If the two openings have identical cross-sectional areas, the average flow velocities are also expected to be the same. Therefore, many studies have evaluated tidal turbine efficiency by calculating the product of rotor torque and angular velocity and comparing it to the maximum theoretical energy flux based on inlet flow conditions.
However, in the present simulation, the venturi structure is enclosed by hydrofoil-shaped surfaces, which induces asymmetric inlet and outlet flow characteristics, resulting in unequal volumetric flow rates. This flow divergence renders direct surface integration of kinetic energy across these planes unreliable for accurately quantifying the energy extracted by the rotor. Additionally, the rotor operates under passive rotation, and thus its angular velocity is not constant. To simplify the evaluation, this study adopts a method based on local velocity sampling and kinetic energy comparison to assess the performance of different turbine configurations. Although this method does not capture the full spatially averaged energy transport across the flow domain, it enables a meaningful and consistent comparative analysis across turbine designs. All simulations are conducted under identical boundary conditions and employ the same velocity sampling strategy, ensuring the validity of relative performance comparisons, even if absolute energy conversion efficiency cannot be fully resolved.
The figure illustrates the arrangement of nine measurement points at both the inlet and outlet surfaces of the turbine. On each side, three points are positioned along the centreline of the two openings to capture representative inlet and outlet velocities. The remaining twelve points are divided into two vertical columns located on the same turbine surface and distributed evenly at three height levels to obtain the average velocity at different zones. The set of points near the inlet is defined as “Velocity 1”, while the set near the outlet is defined as “Velocity 2”. Based on the difference in local kinetic energy before and after the rotor, the turbine’s catching capacity can be estimated. This reflects the energy extracted from the flow and provides a basis for performance comparison among different structural designs.
E r e d u c t i o n = K i n K o u t = m ˙ i n V 1 2 m ˙ o u t V 2 2 ,
where
  • K i n is the kinetic energy at the central point of the input surface of the turbine;
  • K o u t is the kinetic energy at the central point of the outflow surface of the turbine;
  • m ˙ i n is the unit mass flow rate at the central point of the input surface of the turbine;
  • m ˙ o u t is the unit mass flow rate at the central point of the outflow surface of the turbine.
Assume the unit mass flow through the input surface of turbine is the same as that at outflow surface.
Then,
m ˙ i n   = m ˙ o u t ,
E r e d u c t i o n = m ˙ V 1 2 V 2 2 ,
where
  • m ˙ is the mass flow through the turbine in unit time.
According to the data recorded in Table 2, the energy reduction can be calculated by two different velocities. Though the boundary condition set the same inlet velocity at the surface of the computational domain, the input velocity is different in the model with four blades and the model with eight blades, which caused a different mass flow rate through the turbines between two models. Thus, the energy is expressed by the equation in which the constant A values, as the input surface area of the turbine, are equal to each other.
E r e d u c t i o n =   m ˙ V 1 2 V 2 2 = ρ A V 1 V 1 2 V 2 2 .
Based on the data presented in Table 2, the turbine equipped with four blades exhibits a consistently higher flow velocity through the rotor compared to the eight-blade configuration. Furthermore, the energy reduction observed in the four-blade turbine is approximately twice that of the eight-blade counterpart, indicating a significantly greater capacity for energy extraction. This trend is further supported by the calculated efficiency values, where the four-blade turbine achieves an efficiency of 78%, in contrast to 59% for the eight-blade turbine. As the velocity is obtained as instantaneous velocity, these results clearly suggest that increasing the number of blades may lead to diminishing the peak power generation performance under the given operating conditions.
Figure 23 presents the time-dependent torque responses of tidal turbines equipped with four and eight blades, respectively, under identical inflow and boundary conditions. The torque curve corresponding to the four-blade configuration demonstrates higher peak amplitudes and greater fluctuation compared to the eight-blade case.
The integrated area under the torque–time curve as recorded in Table 3—representing the net angular impulse—is slightly greater for the four-blade turbine. This implies that it experiences a larger cumulative rotational driving force over the same time interval.
Taken together, these results suggest that the four-blade turbine, despite exhibiting greater unsteady torque characteristics, achieves higher angular acceleration and superior instantaneous energy conversion efficiency. This configuration ultimately absorbs more hydrodynamic energy in a freely rotating regime without generator loading. While the eight-blade turbine benefits from more uniform and continuous blade–flow interaction, which leads to smoother torque profiles, its lower moment amplitude results in a comparatively reduced energy conversion. This trade-off highlights the importance of balancing torque stability with extraction efficiency when optimising the blade number in tidal turbine design.

5. Discussion

During the research process in this report, we identified several factors that can cause inaccuracy of the results, as shown below:
Group A:
In the mesh validation part, the comparison of the computational cases with different mesh sizes revealed that some cases had inaccurate vortex flows around the turbine output, which is different from the results from a previous study. There are three main reasons that can lead to this inaccuracy.
  • There was a large difference in meshing size between the element around the turbine and the surrounding element, which caused the connection problem between two sizes of element. In group A, the meshing size in the surrounding computational domain is 0.03 m to save computational capacity, while the meshing size attached to the hydrofoil is only 0.01 m because of the tiny dimension of the hydrofoil geometry, which is established based on the data profile with the unit below 0.01 m.
  • The result from this research is obtained from the 3D model, which is a more complex model than the previous study. Thus, the meshing problem can be amplified by the effect from the steam flow on different heights.
  • The boundary layer is not considered in detail in group A because of the limitation of the element size. The element number in the above meshing document is already approaching 512,000, while the number is higher in the condition with inflation attached with the hydrofoil on the side panel of the turbine.
Group B:
  • One of the observation methods used in group B involved selecting nine points, and a local velocity was found, which can cause inaccurate data and low risk resistance from the accident condition.
  • Because of the limitation of the project period, the comparison cases used in group B only include two models. Based on the results obtained from the two models, it is not easy to conclude the tendency directly and there is a high possibility of being impacted by the error data.
Given the problems summarised above, the simulation method can be improved in further studies in the respective aspects, as shown below:
  • It is important to increase the number of measuring points at the opening to improve the accuracy and representativeness of the velocity.
  • For the performance of the venturi structure in tidal turbine, the mass change during the turbine operation should be considered. As the DHV used the hydrofoil structure on the side panel which allow the fluid flows in through the interval of the hydrofoil, the energy capture should also calculate the energy reduction that occurs in the increasing mass.
  • Multiple models during the simulation process should be established to increase fault tolerance, so that the capacity of resisting disturbance and accuracy of the data can be highly ensured.

6. Conclusions

This research reported a numerical analysis about parameter adjustments to the Davidson Hill Venturi tidal turbine. In the previous research from Burchell, J et al. [9], researchers focused on the influence of the angle with hydrofoil on the side panel on the performance of the tidal turbine. However, the other parameters of the DHV turbine can also affect the performance of power generation. This report used a four-case comparison in the CFD simulation software to investigate the influence of the new shape of the hydrofoil and a different number of blades on the centre rotor. In terms of the models based on the k-ω SST turbulence model, the models in group A kept the element number under the limitation of 512,000 in the software, while the element number in group B is much larger than this limitation because of the dynamic meshing, which is over 20 million elements. Thus, the simulation result from group B used supercomputing resources. The illustrated simulation showed the fluid performance of the stream flow through the turbine model. The results are analysed in two groups of comparison.
Unlike previous studies that focused solely on the hydrofoil angle, this work expands the design space by exploring the effects of hydrofoil geometry (GOE-222) and rotor blade count (four compared with eight blades) on the energy capture capability of the DHV turbine. The results demonstrate that the integration of the GOE-222 hydrofoil significantly enhances the venturi-induced flow acceleration, raising the flow velocity at the turbine core from 1.8 m/s to 2.06 m/s, thereby improving the power extraction potential. Additionally, the dynamic simulations reveal that the rotor with four blades outperforms the eight-blade configuration in both flow deceleration and torque generation. The four-blade turbine exhibits a higher net energy reduction across the turbine cross-section and a greater integrated moment profile, confirming its superior efficiency. This dual-parameter optimisation suggests that strategic geometric refinement of the venturi enclosure and careful selection of blade number can substantially enhance the performance of vertical axis tidal turbines, particularly in low-flow environments where deployment feasibility has traditionally been constrained.
Future work should incorporate experimental validation and extend the parametric scope to include pitch variation, hydrofoil surface roughness, and turbulence model sensitivity, to support robust design for real-world implementation.

Author Contributions

Conceptualisation, H.W. and M.H.; methodology, H.W. and J.B.; software, H.W.; validation, H.W.; investigation, H.W.; resources, M.H.; writing—original draft preparation, H.W.; visualisation, H.W.; supervision, J.B.; project administration, H.W. All authors have read and agreed to the published version of the manuscript.

Funding

This research received no external funding.

Data Availability Statement

Restrictions apply to the availability of these data. The original geometry data of DHV turbine was supported by Mark Hill’s research. The shape profile of hydrofoil was obtained from Airfoil Tools and are available at: http://airfoiltools.com/airfoil/details?airfoil=goe222-il (accessed on 7 June 2021).

Acknowledgments

I would like to express my gratitude to all those who offer great help for my thesis. First of all, I would like to express my deepest gratitude to my supervisor, Joseph Burchell, who gave me considerable help by means of suggestion, comments, and criticism. His encouragement and unwavering support have sustained me through frustration and depression. Second, I feel grateful to Mark Hill for his valuable instructions and suggestions on the research direction of my thesis and modelling in my research process. Finally, my thanks go to Roman Gabl, who provided me the guidance about the Computational Fluid Dynamics software.

Conflicts of Interest

Authors Mark Hill and Joseph Burchell were employed by the DHV Turbines Ltd. The remaining authors declare that the research was conducted in the absence of any commercial or financial relationships that could be construed as a potential conflict of interest.

References

  1. Khan, N.; Abas, N. Powering the people beyond 2050. Sci. Echnol. Dev. 2012, 31, 131–151. [Google Scholar]
  2. Abas, N.; Kalair, A.; Khan, N. Review of fossil fuels and future energy technologies. Futures 2015, 69, 31–49. [Google Scholar] [CrossRef]
  3. Turcotte, D.L.; Schubert, G. Geodynamics, 2nd ed.; Cambridge University Press: Cambridge, UK, 2002. [Google Scholar]
  4. Williams, G.E. Geological constraints on the Precambrian history of Earth’s rotation and the Moon’s orbit. Rev. Geophys. 2000, 38, 37–59. [Google Scholar] [CrossRef]
  5. Khan, N.; Kalair, A.; Abas, N.; Haider, A. Ocean tidal, wave and thermal energy technologies. Renew. Sustain. Energy Rev. 2017, 72, 590–604. [Google Scholar] [CrossRef]
  6. Khanjanpour, M.H.; Javadi, A.A. Optimization of a Horizontal Axis Tidal (HAT) turbine for powering a Reverse Osmosis (RO) desalination system using Computational Fluid Dynamics (CFD) and Taguchi method. Energy Convers. Manag. 2021, 231, 113833. [Google Scholar] [CrossRef]
  7. Ibrahim, W.I.; Mohamed, M.R.; Ismail, R.M.T.R.; Leung, P.K.; Xing, W.W.; Shah, A.A. Hydrokinetic energy harnessing technologies: A review. Energy Rep. 2021, 7, 2021–2042. [Google Scholar] [CrossRef]
  8. Khan, M.J.; Bhuyan, G.; Iqbal, M.T.; Quaicoe, J.E. Hydrokinetic energy conversion systems and assessment of horizontal and vertical axis turbines for river and tidal applications: A technology status review. Appl. Energy 2009, 86, 1823–1835. [Google Scholar] [CrossRef]
  9. Gabl, R.; Burchell, J.; Hill, M.; Ingram, D.M. Sensitivity analysis of a Venturi shaped structure for cross-flow turbines. Eng. Appl. Comput. Fluid Mech. 2022, 16, 2243–2269. [Google Scholar] [CrossRef]
  10. DHV Turbines Ltd. 2021. Available online: http://www.dhvturbines.com/?cv=1 (accessed on 23 August 2021).
  11. EU-OEA. European Ocean Energy Association. Available online: https://www.oceanenergy-europe.eu/ocean-energy/ (accessed on 23 August 2021).
  12. López, I.; Andreu, J.; Ceballos, S.; de Alegría, I.M.; Kortabarria, I. Review of wave energy technologies and the necessary power-equipment. Renew Sustain. Energy Rev. 2013, 27, 413–434. [Google Scholar] [CrossRef]
  13. Met Office. Climate Zones. 2018. Available online: https://weather.metoffice.gov.uk/climate/climate-explained/climate-zones (accessed on 17 August 2021).
  14. Priegue, L.; Stoesser, T. The influence of blade roughness on the performance of a vertical axis tidal turbine. Int. J. Mar. Energy 2017, 17, 136–146. [Google Scholar] [CrossRef]
  15. Islam, M.; Ting, D.S.K.; Fartaj, A. Aerodynamic models for darrieus-type straight-bladed vertical axis wind turbines. Renew. Sustain. Energy Rev. 2008, 12, 1087–1109. [Google Scholar] [CrossRef]
  16. Brahimi, M.T.; Allet, A.; Paraschivoiu, I. Aerodynamic analysis models for vertical-axis wind turbines. Int. J. Rotating Mach. 1995, 2, 15–21. [Google Scholar] [CrossRef]
  17. Dai, Y.M.; Gardiner, N.; Sutton, R.; Dyson, P.K. Hydrodynamic analysis models for the design of Darrieus-type vertical-axis marine current turbines. J. Eng. Marit. Environ. 2011, 225, 295–307. [Google Scholar] [CrossRef]
  18. Patel, V.; Eldho, T.I.; Prabhu, S.V. Experimental investigations on Darrieus straight blade turbine for tidal current application and parametric optimization for hydro farm arrangement. Int. J. Mar. Energy 2017, 17, 110–135. [Google Scholar] [CrossRef]
  19. Hirsch, H.; Mandal, A.C. A cascade theory for the aerodynamic performance of darrieus wind turbines. Wind. Eng. 1987, 11, 164–175. [Google Scholar]
  20. Chen, J.; Yang, H.; Yang, M.; Xu, H.; Hu, Z. A comprehensive review of the theoretical approaches for the airfoil design of lift-type vertical axis wind turbine. Renew. Sustain. Energy Rev. 2015, 51, 1709–1720. [Google Scholar] [CrossRef]
  21. Chen, J.; Chen, L.; Xu, H.; Yang, H.; Ye, C.; Liu, D. Performance improvement of a vertical axis wind turbine by comprehensive assessment of an airfoil family. Energy 2016, 114, 318–331. [Google Scholar] [CrossRef]
  22. Patel, V.; Bhat, G.; Eltho, T.I.; Prabhu, S.V. Influence of overlap ratio and apsect ratio on the performance of Savonius hydrokinetic turbine. Int. J. Energy Res. 2016, 41, 829–844. [Google Scholar] [CrossRef]
  23. Joo, S.; Choi, H.; Lee, J. Aerodynamic characteristics of two-bladed H-Darrieus at various solidities and rotating speeds. Energy 2015, 90, 439–451. [Google Scholar] [CrossRef]
  24. Tummala, A.; Velamati, R.K.; Sinha, D.K.; Indraja, V.; Krishna, V.H. A review on small scale wind turbines. Renew. Sustain. Energy Rev. 2016, 56, 1351–1371. [Google Scholar] [CrossRef]
  25. Singh, M.A.; Biswas, A.; Misra, R.D. Investigation of self-starting and high rotor solidity on the performance of a three S1210 blade H-type Darrieus rotor. Renew. Energy 2015, 76, 381–387. [Google Scholar] [CrossRef]
  26. Hwang, I.S.; Lee, Y.H.; Kim, S.J. Optimization of cycloidal water turbine and the performance improvement by individual blade control. Appl. Energy 2009, 86, 1532–1540. [Google Scholar] [CrossRef]
  27. Mohamed, M.H.; Ali, A.M.; Hafiz, A.A. CFD analysis for H-rotor Darrieus turbine as a low speed wind energy converter. Eng. Sci. Technol. Int. J. 2015, 18, 1–13. [Google Scholar] [CrossRef]
  28. Ferrer, E.; Willden, R.H.J. Blade–wake interactions in cross-flow turbines. Int. J. Mar. Energy 2015, 11, 71–83. [Google Scholar] [CrossRef]
  29. Shiono, M.; Suzuki, K.; Kiho, S. An experimental study of the characteristics of a darrieus turbine for tidal power generation. Electr. Eng. Jpn. 2000, 132, 38–47. [Google Scholar] [CrossRef]
  30. Chen, W.-H.; Lam, T.T.; Chang, M.-H.; Jin, L.; Chueh, C.-C.; Augusto, G.L. Optimizing H-Darrieus Wind Turbine Performance with Double-Deflector Design. Energies 2024, 17, 503. [Google Scholar] [CrossRef]
  31. Mohamed, M.H. Performance investigation of H-rotor Darrieus turbine with new airfoil shapes. Energy 2012, 47, 522–530. [Google Scholar] [CrossRef]
  32. Tjiu, W.; Marnoto, T.; Mat, S.; Ruslan, M.H. Darrieus vertical axis wind turbine for power generation I: Assessment of Darrieus VAWT configurations. Renew. Energy 2015, 75, 50–67. [Google Scholar] [CrossRef]
  33. Antheaume, S.; Maître, T.; Achard, J.L. Hydraulic Darrieus turbines efficiency for free fluid flow conditions versus power farms conditions. Renew. Energy 2008, 33, 2186–2198. [Google Scholar] [CrossRef]
  34. Giorgetti, S.; Pellegrini, G.; Zanforlin, S. CFD investigation on the aerodynamic interferences between medium-solidity Darrieus Vertical Axis Wind Turbines. Energy Procedia 2015, 81, 227–239. [Google Scholar] [CrossRef]
  35. Shaheen, M.; Abdallah, S. Development of efficient vertical axis wind turbine clustered farms. Renew. Sustain. Energy Rev. 2016, 63, 237–244. [Google Scholar] [CrossRef]
  36. Maslov, N.; Charpentier, J.F.; Claramunt, C. A modelling approach for a cost-based evaluation of the energy produced by a marine energy farm. Int. J. Mar. Energy 2015, 9, 1–19. [Google Scholar] [CrossRef]
  37. Ross, I.; Altman, A. Wind tunnel blockage corrections: Review and application to Savonius vertical-axis wind turbines. J. Wind. Eng. Ind. Aerodyn. 2011, 99, 523–538. [Google Scholar] [CrossRef]
  38. Fiedler, A.J.; Tullis, S. Blade offset and pitch effects on a high solidity vertical axis wind turbine. Wind. Eng. 2009, 33, 237–246. [Google Scholar] [CrossRef]
  39. Priegue, L.; Stoesser, T.; Runge, S. Effect of blade parameters on the performance of a cross-flow turbine. In Proceedings of the E-Proceedings of the 36th IAHR World Congress, The Hague, The Netherlands, 28 June–3 July 2015. [Google Scholar]
  40. Miller, M.A.; Duvvuri, S.; Hultmark, M. Solidity effects on the performance of vertical-axis wind turbines. Flow 2021, 1, E9. [Google Scholar] [CrossRef]
  41. Gorlov, A. Unidirectional Helical Reaction Turbine. U.S. Patent No 5,451,137, 19 September 1995. [Google Scholar]
  42. Islam, M.; Ting, D.; Fartaj, A. Desirable airfoil features for smaller-capacity straight-bladed VAWT. Wind. Eng. 2007, 31, 165–196. [Google Scholar] [CrossRef]
  43. Soraghan, C. Influence of lift to drag ratio on optimal aerodynamic performance of straight blade vertical axis wind turbines. In Proceedings of the Europe’s Premier Wind Energy Event, Vienna, Austria, 4–7 February 2013. [Google Scholar]
  44. Castiglione, T.; Barbarelli, S.; Zupone, G.L.; Bova, S. Flow-field and wake analysis of novel double-rotor open-center tidal current turbine by CFD simulations. Ocean Eng. 2021, 222, 108597. [Google Scholar] [CrossRef]
  45. Mason-Jones, A.; O′Doherty, T.; O′Doherty, D.M.; Evans, P.S.; Wooldridge, C.F. Characterisation of a HATT using CFD and ADCP site data. In Proceedings of the 10th World Renewable Energy Congress, Grasgow, UK, 19–25 July 2008. [Google Scholar]
  46. Harrison, M.E.; Batten, W.M.J.; Myers, L.E.; Bahaj, A.S. A comparison between CFD simulations and experiments for predicting the far wake of horizontal axis tidal turbines. In Proceedings of the 8th European Wave and Tidal Ensergy Conference, Uppsala, Sweden, 7–10 September 2009. [Google Scholar]
  47. Li, Y.; Çalişal, S.M. A discrete vortex method for simulating a stand-alone tidal-current turbine: Modeling and validation. J. Offshore Mech. Arct. Eng. 2010, 132, 031102. [Google Scholar] [CrossRef]
  48. Harrison, M.E.; Batten, W.M.J.; Bahaj, A.S. A Blade Element Actuator Disc Approach Applied to Tidal Stream Turbines. In Proceedings of the OCEANS 2010 MTS/IEEE SEATTLE, Seattle, WA, USA, 20–23 September 2010; pp. 1–8. [Google Scholar]
  49. Belloni, C.S.K.; Willden, R.H.J.; Houlsby, G.T. An investigation of ducted and open-centre tidal turbines employing CFD-embedded BEM. Renew. Energy 2017, 108, 622–634. [Google Scholar] [CrossRef]
  50. Myers, L.E.; Bahaj, A.S. Experimental analysis of the flow field around horizontal axis tidal turbines by use of scale mesh disk rotor simulators. Ocean Eng. 2009, 37, 218–227. [Google Scholar] [CrossRef]
  51. Allsop, S.; Peyrard, C.; Thies, P.R.; Boulougouris, E.; Harrison, G.P. Hydrodynamic analysis of a ducted, open centre tidal stream turbine using blade element momentum theory. Ocean Eng. 2017, 141, 531–542. [Google Scholar] [CrossRef]
  52. Maître, T.; Amet, E.; Pellone, C. Modeling of the flow in a darrieus water turbine: Wall grid refinement analysis and comparison with experiments. Renew. Energy 2013, 51, 497–512. [Google Scholar] [CrossRef]
  53. Roa, A.M.; Aumelas, V.; Maître, T.; Pellone, C. Numerical and experimental analysis of a Darrieus-type cross flow water turbine in bare and shrouded configurations. IOP Conf. Ser. Earth Environ. Sci. 2010, 12, 012113. [Google Scholar] [CrossRef]
  54. McNaughton, J.; Billard, F.; Revell, A. Turbulence modelling of low reynolds number flow effects around a vertical axis turbine at a range of tip-speed ratios. J. Fluids Struct. 2014, 47, 124–138. [Google Scholar] [CrossRef]
  55. Howell, R.; Qin, N.; Edwards, J.; Durrani, N. Wind tunnel and numerical study of a small vertical axis wind turbine. Renew. Energy 2010, 35, 412–422. [Google Scholar] [CrossRef]
  56. Marsh, P.; Ranmuthugala, D.; Penesis, I.; Thomas, G. Numerical investigation of the influence of blade helicity on the performance characteristics of vertical axis tidal turbines. Renew. Energy 2015, 81, 926–935. [Google Scholar] [CrossRef]
  57. Rodi, W.; Constantinescu, G.; Stoesser, T. Large-eddy simulation in hydraulics. In IAHR Monographs; CRC Press: Leiden, The Netherlands, 2013; ISBN 9781138000247. [Google Scholar]
  58. Stoesser, T. Large-eddy simulation in hydraulics: Quo vadis? J. Hydraul. Res. 2014, 52, 441–452. [Google Scholar] [CrossRef]
  59. Kear, M.; Evans, B.; Ellis, R.; Rolland, S. Computational aerodynamic optimisation of vertical axis wind turbine blades. Appl. Math. Model. 2015, 40, 1038–1051. [Google Scholar] [CrossRef]
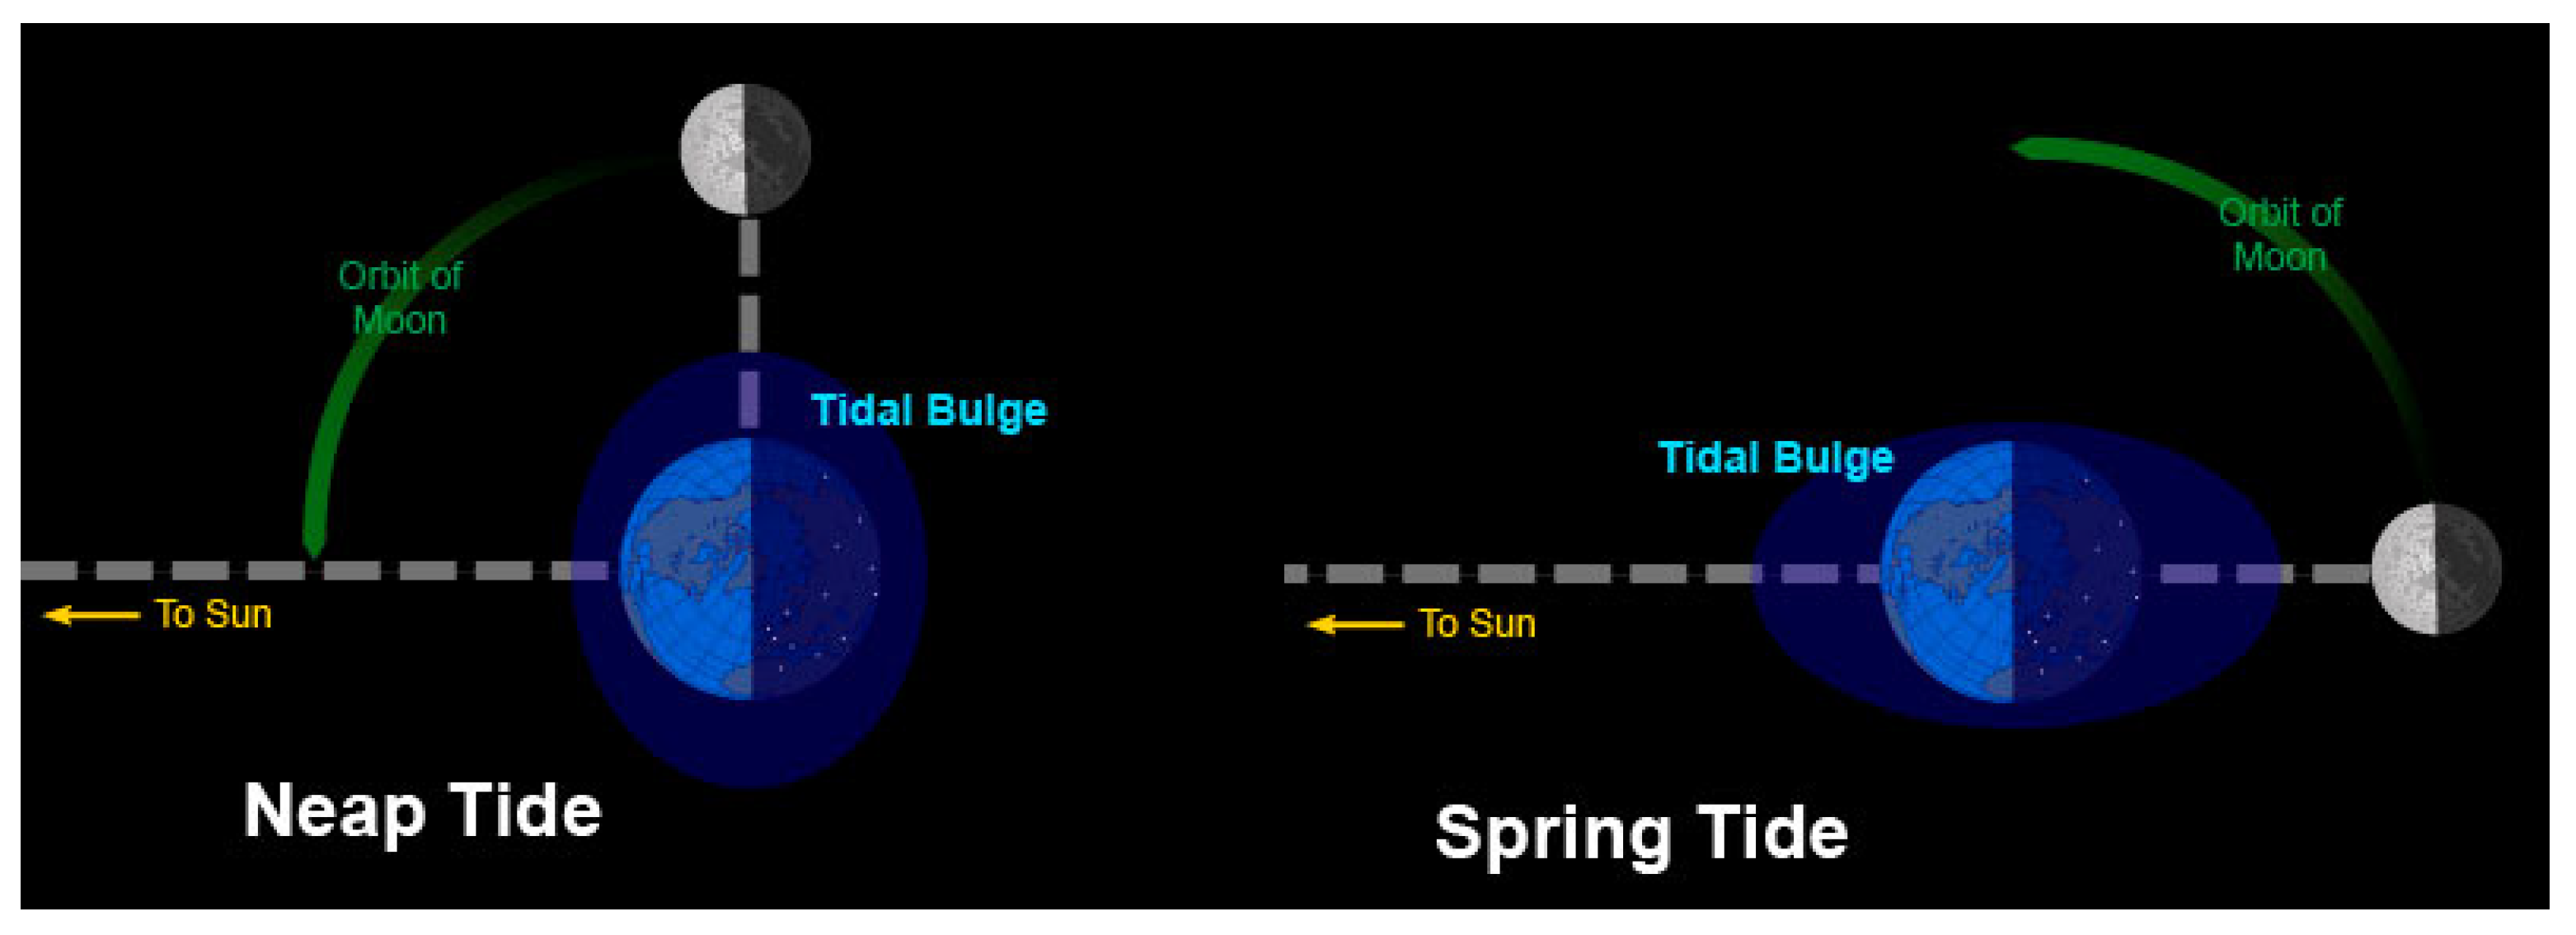
Figure 1. Tide period chart.
Energies 18 04763 g001
Figure 2. Four types of tidal generation location.
Energies 18 04763 g002
Figure 3. Horizontal axis tidal turbine.
Energies 18 04763 g003
Figure 4. Vertical axis tidal turbine.
Energies 18 04763 g004
Figure 5. DHV turbine structure.
Energies 18 04763 g005
Figure 6. Fluid condition around foil shape.
Energies 18 04763 g006
Figure 7. Venturi effect caused by Bernoulli’s equation.
Energies 18 04763 g007
Figure 8. Turbine model with new hydrofoil in simulation.
Energies 18 04763 g008
Figure 9. Curve shape based on the data profile.
Energies 18 04763 g009
Figure 10. Turbine front view.
Energies 18 04763 g010
Figure 11. Turbine plan view.
Energies 18 04763 g011
Figure 12. 3D model of turbine with four blades.
Energies 18 04763 g012
Figure 13. 3D Turbine model with 8 blades.
Energies 18 04763 g013
Figure 14. Imported model of blades from Alireza Ahani.
Energies 18 04763 g014
Figure 15. Section view of meshing around the turbine with hydrofoil.
Energies 18 04763 g015
Figure 16. Velocity variation through centreline.
Energies 18 04763 g016
Figure 17. Meshing of turbine with rotor.
Energies 18 04763 g017
Figure 18. Previous study results.
Energies 18 04763 g018
Figure 19. Contour chart in group A simulation.
Energies 18 04763 g019
Figure 20. Velocity contour chart of four-blade turbine.
Energies 18 04763 g020
Figure 21. Velocity contour chart of eight-blade turbine.
Energies 18 04763 g021
Figure 22. Measuring points allocation on the turbine opening surface.
Energies 18 04763 g022
Figure 23. Blade moment during the turbine operation.
Energies 18 04763 g023
Table 1. Data profile of the GOE-222 from airfoil website.
Upper Line (Blue)Lower Line (Red)
Coordinate (X) mmCoordinate (Y) mmCoordinate (X) mmCoordinate (Y) mm
0000
3.466529.034444.2344−5.30248
7.1700413.654368.28236−7.1416
14.7034820.5368416.30244−9.39784
22.2843226.4713224.30356−11.2464
29.9441630.9901232.26044−12.3366
45.3870837.6608848.12364−13.5406
60.9500842.0659263.92996−13.6449
92.2530447.5959295.37196−10.6966
123.805648.49336126.7065−5.7038
155.500446.71428158.0537−1.02384
187.331142.41352189.44832.86612
219.338834.80108220.94724.71156
251.422325.77612252.5444.75896
283.638414.22632284.21993.35592
299.80187.44496300.1021.83596
3160.474316−0.474
Table 2. Velocity at the input and outflow surface of turbines with different number of blades.
Model with Four BladesModel with Eight Blades
Velocity 1 ( m / s )5.6606854.435567
Velocity 2 ( m / s )2.6162852.081603
Energy reduction ( k g · m 2 / s 3 )142.677 ρ A52.095 ρ A
Efficiency78%59%
Table 3. Area based on the integral of blade moment to time step.
Four-Blade TurbineEight-Blade Turbine
Area (net angular impulse N · m · s )290273
Disclaimer/Publisher’s Note: The statements, opinions and data contained in all publications are solely those of the individual author(s) and contributor(s) and not of MDPI and/or the editor(s). MDPI and/or the editor(s) disclaim responsibility for any injury to people or property resulting from any ideas, methods, instructions or products referred to in the content.