Abstract
This study empirically verified the effect of solar radiation on the building envelope, with particular emphasis on the generated surface temperature. A model of a cellular concrete block wall with ETICS (External Thermal Insulation Composite System) was constructed with varying insulation-plaster configurations, followed by tests in a “sun chamber” aging chamber and numerical analyses. The measurement results were compared with those from the numerical simulations, taking into account the thermal properties of the materials used and the radiation exposure conditions. The purpose of the study was to determine to what extent different types of plasters and insulation materials affect the heating of the façades. Computer simulations confirmed the direction of energy flow and the gradual heating of successive layers. Furthermore, the differences between the material variants were consistent with the experimental observations. By modeling perfectly uniform conditions, the numerical analysis allowed us to limit the impact of radiation variability, resulting in results with reduced error.
1. Introduction
The European Directive 2010/31/E(EPBD) [1] forced the development of research on the dynamic thermal properties of building elements. Thermal characteristics describe the dynamic response of the system to varying loads over time [2]. Heat conduction is one of the main means of heat transfer between the interior and exterior through the building envelope [3], and the key parameters are the building’s aspect ratio [4], the window-to-wall ratio [5], and the thermal conductivity of the walls [6,7]. However, in some cases (historic buildings), due to the specific qualities of the façade, the use of thermal insulation is not recommended or hindered. In addition, exterior wall insulation materials are often exposed to adverse weather conditions including solar radiation [8].
The building material used in the construction of the walls, and which is exposed to the direct influence of the external climate, has a direct impact on the temperature and humidity inside the building, which is controlled by the wall structure [9,10,11]. The causes of material decomposition can be determined from information on changes in temperature and humidity [12], which promote chemical decomposition through dissolution, oxidation, or physical decomposition [13,14] or biodeterioration in the form of microbial colonization [15,16]. Monitoring of the studied parameters is one of the priorities of microclimatic research [17]. It should be noted that the absorption of solar energy by the wall is influenced by factors such as the heat accumulation coefficient of the wall, the heat-transfer coefficient of the south wall’s outer surface, the radiation intensity, consecutive sunny days, and the outdoor air temperature [18]. The results also show that the SER is strongly affected by the heat-transfer coefficient of the wall’s outer surface, with lower coefficients having a more obvious influence [19]. Generally, all such measures can be said to lead to so-called passive wall cooling [20]. In addition to façades with high thermal inertia [21], passive radiative cooling materials [22], insulating materials [23,24], modular living wall systems [25], ventilated façades [26], and Trombe walls [27], color-changing partitions [28,29], are also used. Giovani’s research [29] showed that in desert climates, the maximum surface temperature difference between black and white roofs in summer could reach 30–40 °C, and that high-reflectance roofs made of reflective materials or colors reduced the cooling energy demand and mitigated urban heat islands [30]. Therefore, the authors of this article undertook research on the influence of façade materials, plasters, and paints on surface temperature distribution and heat transport.
The authors of this article, through their research, obtained data to evaluate the influence of the type of plastering and the properties of thermal insulation on the process of heat accumulation and heat transfer through the façade. The results of the experiment may find application in the design of energy-efficient insulation systems as well as in the selection of building materials that provide optimal protection against the overheating of exterior walls under conditions of intense sunlight. The results of the empirical measurements were compared with the results of the simulations. The aim of this comparison was to verify the agreement of the experimental results with theoretical predictions and to identify any discrepancies arising from real-world conditions, which cannot always be fully accounted for in the models. The numerical calculations were based on classical methods for determining the heat flow in the building partitions. In order to carry out the numerical simulation, the partition under study was mapped in the Ansys and THERM programs, which allow for the precise analysis of heat flow in complex material systems. The model took into account the actual thermal properties of the materials used and the boundary conditions corresponding to the values recorded during the laboratory test. The heat flow acting on the surface of a partition was mapped, taking into account the influence of solar radiation and convective heat exchange with the surroundings. Through the use of computer simulation, it was possible to obtain an accurate picture of the temperature distribution in the partition structure. A comparison of the numerical results with those obtained empirically allowed for an assessment to be made of the accuracy of the model used and its applicability in further research into optimizing the thermal insulation of building façades. The added value of the work was the use of a world-unique aging chamber. To simulate the atmospheric environment, a rotating climatic aging chamber was applied, whose stand consisted of four chambers. The core was made up of a central rotating chamber that had four exposition walls, with the dimensions 1.55 × 2.10 m, to mount the test samples.
2. Methods
As part of this study, an experimental verification of the effect of solar radiation on the building envelope was carried out, with particular reference to the temperature generated on its surface.
For the purposes of the experiment, a model two-layer wall with ETICS insulation with different insulation and plaster layer arrangements was created (chapter 2.1.).
The experiment was conducted under laboratory conditions, in an aging chamber, a ‘sun chamber’, which enabled temperature changes to be reproduced precisely and the effect of radiation on the test surfaces to be controlled (chapter 2.2.). The scope of the work did not include issues related to the moisture content of the materials, their long-term aging, or the effect of UV radiation. The influence of atmospheric conditions other than solar radiation (precipitation, wind) was also not analyzed.
In addition, numerical calculations were carried out using the Ansys and THERM programs (chapter 2.3.), which allowed for precise analysis of the heat flow in complex partition systems.
2.1. Characteristics of Testing Samples
In order to analyze the physical phenomena associated with the heating and heat transfer of building materials, a stand was prepared with a varied combination of insulation materials and renderings.
A sample of a two-layer wall with ETICS insulation with an area of 160 × 202 cm was made. The structural layer of the wall was made of 12 cm thick cellular concrete blocks with adhesive mortar. Then, a 20 cm thick layer of thermal insulation made of polystyrene foam boards fixed with adhesive mortar was attached to the wall layer. For comparison purposes, three types of polystyrene foam were used, laid in 50 cm wide horizontal strips, with different thermal conductivity coefficients λ:
- White EPS with graphite (λ = 0.042 W/m·K);
- Graphite EPS (λ = 0.033 W/m·K);
- White EPS (λ = 0.040 W/m·K).
On the surface of the polystyrene-insulated wall, a reinforcement layer of glass-fiber mesh embedded in adhesive mortar was made and then finished with a plaster coating with a roughcast structure and a grain size of 1.5 mm. Three types of thin-coat plaster were laid in 50 cm wide vertical strips:
- Acrylic render (λ = 0.76 W/m·K, α = 0.55) painted with heat-reflective paint to reduce heat gain (d = 2 mm, λ = 0.053 × 10⁻² W/m·K, ε = 0.99, α = 0.0996);
- Acrylic render (λ = 0.76 W/m·K, ε = 1, α = 0.55);
- Silicone render (λ = 0.76 W/m·K, ε = 0.98, α = 0.55).
The emissivity ε of the finishing layers was determined using a thermal imaging camera and thermocouple-type sensors connected to a recorder on a separately laid plaster strip outside the test bench.
We denoted the solar absorptivity by α.
The general layout of the wall layers and the location of subsequent partition systems (layers: insulation and plaster) are shown in Figure 1.
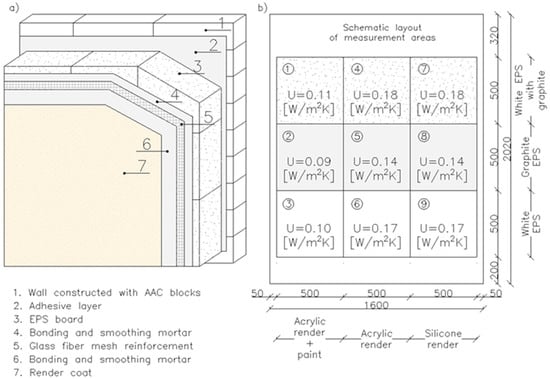
Figure 1.
Arrangement of layers: (a) diagram of the layers of the partition under consideration and (b) the tested arrangements (insulation-plaster) of the partition.
2.2. Tests in the Aging Chamber
Solar heating tests on plaster were carried out in an aging chamber. A test rig designed for atmospheric aging was used to simulate solar radiation. A climate chamber, part of the aging chamber, the so-called ‘sun chamber’, was used in the study, whose task was to simulate solar performance through illumination.
The ‘sun chamber’ inflicts radiation close to natural sunlight in the 400–700 nm range through a system of 20 metal-halide (MH) lamps, each with 8 kW of power and 10 UV-mimicking ultraviolet emitters. The MH lamps, with a color temperature of 4500 K and a luminous flux of 35,000 Lm, are characterized by good reproduction in the spectrum of natural solar radiation.
The test specimens were prepared as ETICS (External Thermal Composite Insulation System)-type external wall insulation systems. The prepared system of nine specimens, with different layers of polystyrene and plaster, was built over the entire surface of one of the walls of the central exhibition chamber with an area of 1.6 × 2.1 m (as described in chapter 2.1.). In order to collect measurement data of the heating temperature of the plaster in the central point of each sample (50 × 50 cm field), thermocouple-type sensors were installed in the flush-mounted layer and on the render surface (Figure 2 and Figure 3). Individual sensors were connected to an Ahlborn Therm 5500-3 multi-channel recorder (Holzkirchen, Germany). In this way, the test samples, together with the recording system, were prepared for testing.
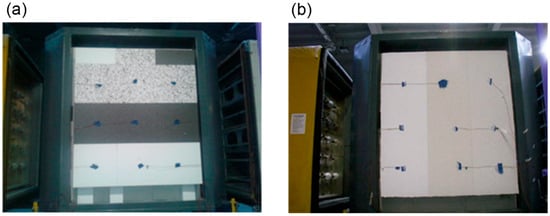
Figure 2.
Layering of thermal insulation layers and temperature sensors: (a) under the render; (b) on the render surface.
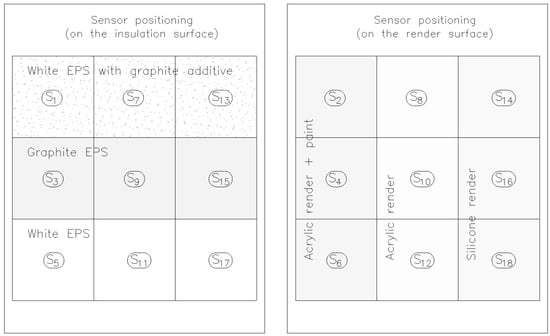
Figure 3.
Location and marking of the temperature sensors under the render and on the render surface.
The experimental study was conducted under the following conditions: air temperature near the sample: Meas. I—22.4 °C, Meas. II—33.5 °C, Meas. III—25.3 °C, Meas. IV—23.5 °C, Meas. V—23.5 °C; air temperature in the laboratory: 17.0 ± 0.2 °C; air humidity: 24%; and air velocity inside the laboratory: 0.1 m/s.
The tests were repeated five times to verify the results and assess the effect of varying the position of the radiation source on the temperature distribution on the partition surface. The distance of the light source from the test surface was changed three times, while the material properties and geometry of the partition were unchanged. The test was carried out with the lamps positioned at distances from the test surface of the partition equal to 66 cm, 23 cm, and 45 cm (Figure 4):
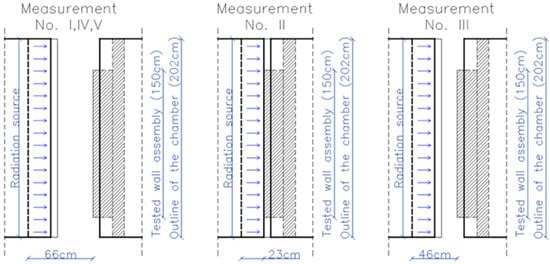
Figure 4.
Location of the solar radiation source in relation to the test wall.
Once the aging chamber lamps were switched on, regular temperature readings were taken at 2-minute intervals for a period of 2 h. This process allowed the surface temperature changes of the tested materials to be accurately monitored under the influence of the thermal radiation emitted by the lamps. By recording the temperature values at specific measurement points, it was possible to analyze the dynamics of surface heating as a function of time.
At the end of the heating stage, the lamps were switched off, and temperature readings were continued at the same measuring points every 2 min for a further 2 h. This stage was aimed at assessing the cooling process of the surface and determining the time required to reach thermal equilibrium with the surroundings.
2.3. Numerical Analyses
In parallel to the tests in the aging chamber, the experimental situation was also modeled in Ansys, version 2024 R2, and THERM, version 7.6.
In Ansys in the Steady-State Thermal module, 3D analyses were carried out using the finite element method (FEM). The boundary conditions were set so that the specimen was treated as a section of wall (i.e., the width and height of the specimen was not limited). The simulation was based on the introduced geometry, taking into account the material layers and their thermal properties as faithfully as possible, reflecting the specimens used in the experimental studies. The boundary conditions corresponded to the test setup from Measurement IV.
The modeling process in THERM began by importing the geometry of the system under analysis and defining the material parameters and boundary conditions. In THERM, 2D finite-difference analyses were carried out on the created geometry of the analyzed system and after defining the material parameters and boundary conditions.
3. Results and Discussion
The maximum temperatures recorded during the measurement are presented in Figure 5.
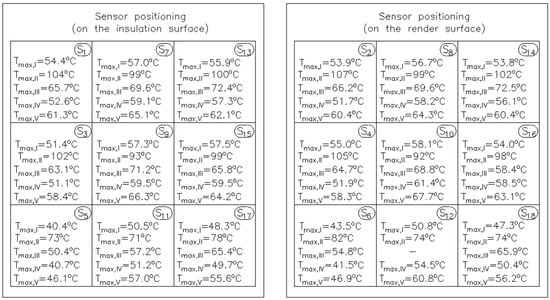
Figure 5.
Surface temperatures of render and insulation—Measurements I–V.
During the operation of the aging chamber, the light bulbs generate high temperatures. To prevent emergency situations, the device is equipped with autonomous safety mechanisms that deactivate individual bulbs depending on the temperature. In order to analyze the impact of this aspect, the irradiance level in the central part of the wall, formed by the nine test fields combined, was monitored. The readings were taken over a period of 2.5 h, at 2-minute intervals (Figure 6).
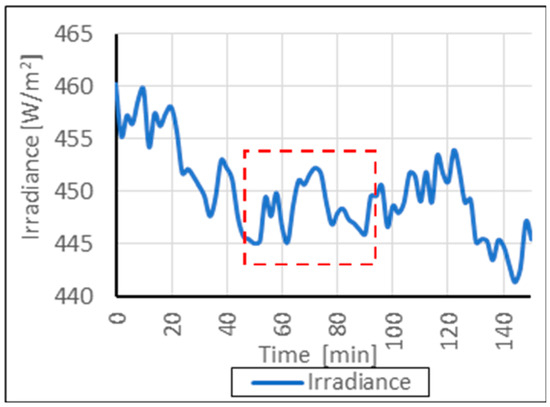
Figure 6.
Variation of the solar radiation intensity over time. The area marked in red is enlarged in Figure 7.
The recorded temperature fluctuations on the surface of the wall section exhibited a clear correlation with the observed variations in irradiance. This relationship is illustrated in Figure 7 (a fragment of the measurement presented in Figure 6), where it is evident that a decrease in irradiance resulted in a temperature drop, while an increase in irradiance led to a renewed rise in surface temperature.
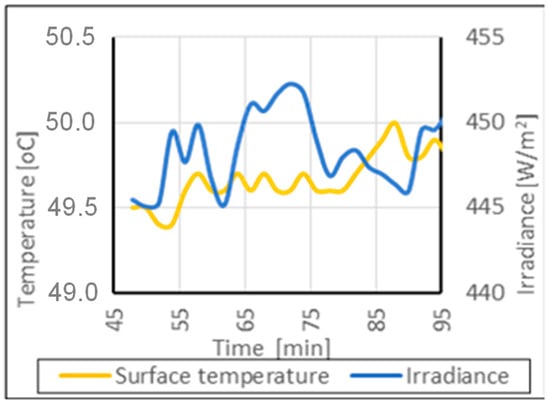
Figure 7.
Dependency of temperature variation on the solar radiation intensity over time.
During the 150-minute measurement period, the irradiance levels varied between 441 W/m2 and 461 W/m2, representing a fluctuation of less than 5%. These temporal variations—caused by automatic bulb shutoffs—resulted in corresponding fluctuations in the temperature readings; however, the extent of these deviations was considered acceptable.
To ensure the reliability of the measurements, irradiance was verified using a solarimeter across different test fields on the wall. During Measurement I, Field 5 recorded 389.6 W/m2, while Field 3 showed only 275.8 W/m2. Even greater discrepancies were observed during Measurement III, with irradiance ranging from a maximum of 499.4 W/m2 to a minimum of 332.0 W/m2. The distribution of irradiance across the surface of the wall section is illustrated in Figure 8.
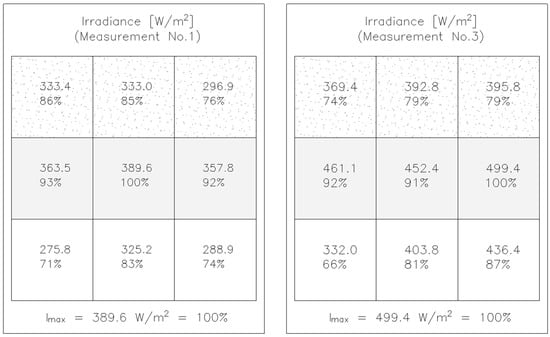
Figure 8.
Irradiance values recorded for Measurements I and III.
To assess the significance of this parameter, the measured irradiance values were compared with the corresponding render surface temperatures in Table 1.

Table 1.
Summary of the irradiance measurements for individual test fields with corresponding render surface temperatures—Measurements I and III.
The study was conducted on fields with different material parameters, making it necessary to determine the relationship between irradiance and temperature.
Based on Table 2, it was found that in the analyzed cases, an irradiance level ranging from 5.5 W/m2 to 8.6 W/m2 was required to generate a 1 °C increase in temperature. As demonstrated in Table 1, the maximum difference in measured irradiance reached nearly 170 W/m2.
Table 2.
Irradiance required to generate a 1 °C temperature rise, depending on the test field on the wall section.
This analysis highlighted that directly comparing different test fields without standardizing the radiation intensity would be methodologically inappropriate. To ensure the reliability and accuracy of the study results, a correction of the temperature readings was necessary. It was assumed that the highest measured irradiance in a given test served as the reference level (100%), and the values for the remaining fields were expressed as a percentage of this reference value. Using this percentage relationship, the recorded temperatures were recalculated accordingly.
Temperature corrections were performed based on the irradiance distribution pattern shown in Figure 8 (where for Measurements I, II, IV, and V: 100% = 389.6 W/m2, and for Measurement III: 100% = 499.4 W/m2), with the adjusted results presented in Figure 9.
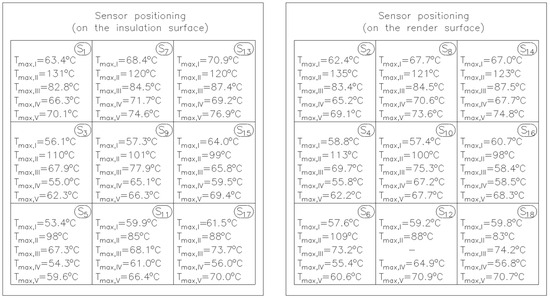
Figure 9.
Corrected temperature values based on irradiance uniformity—Measurements I–V.
To illustrate the dynamic impact of radiant exposure on the temperatures at the render surface and within the insulation layer, Figure 10 and Figure 11 present time-dependent temperature profiles for two of the five measurements conducted.
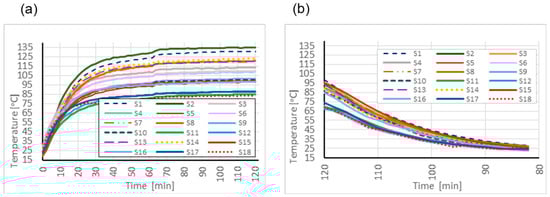
Figure 10.
Temperature change over time: (a) under solar radiation exposure and (b) after switching off the radiation source—Measurement II.
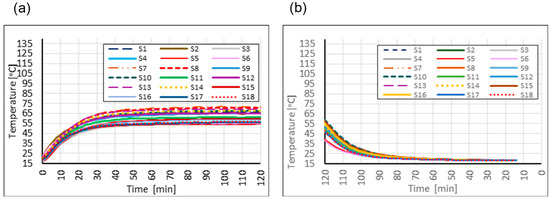
Figure 11.
Temperature change over time: (a) under solar radiation exposure and (b) after switching off the radiation source—Measurement IV.
The graphs captured both the heating phase, resulting from exposure to the radiation source (Figure 10a and Figure 11a), and the cooling phase following its deactivation (Figure 10b and Figure 11b). This dual-phase representation enabled the analysis of both the intensity of the thermal response and the thermal release capability of the tested material assemblies.
It was observed that the temperature differences between the readings taken on the render surface and those on the insulation (EPS) surface varied depending on the position of the measurement points across the tested fields. The results are presented in Figure 12a–e.
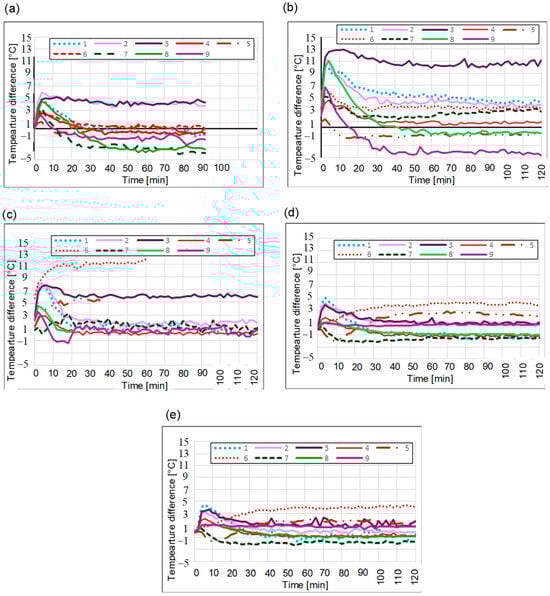
Figure 12.
Temperature difference between the render surface and insulation—(a) Measurement I, (b) Measurement II, (c) Measurement III, (d) Measurement IV, and (e) Measurement V.
The recorded differences in temperature values can, from a physical standpoint, be attributed to varying material properties such as the thermal transmittance coefficient, surface emissivity, or the ability to absorb radiation.
3.1. Influence of Plaster Type and Insulation Material on Temperature Variations
The diagrams presented in the following (Figure 13, Figure 14 and Figure 15) illustrate the variations in temperature differences between the values measured on the surface of the render (exterior plaster layer) and those recorded on the surface of the thermal insulation over time. The measurements were conducted on samples featuring different finishing systems: acrylic plaster finished with a thermal-insulating paint, standard acrylic plaster, and a silicone plaster.
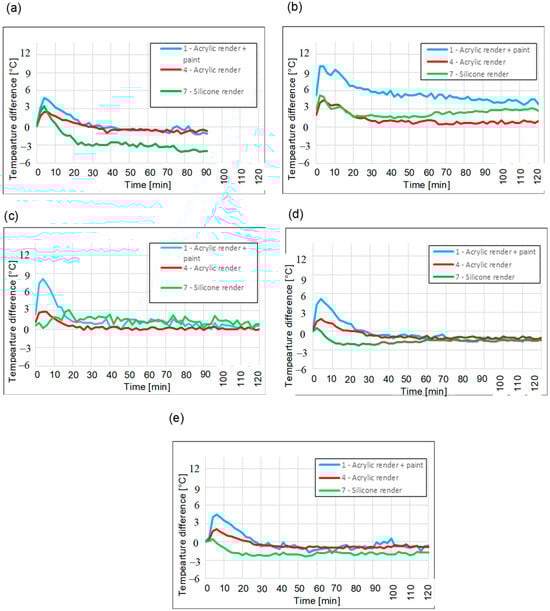
Figure 13.
Temperature difference between the render surface and insulation—white polystyrene with graphite, λ = 0.042 W/(m·K)—(a) Measurement I, (b) Measurement II, (c) Measurement III, (d) Measurement IV, and (e) Measurement V.
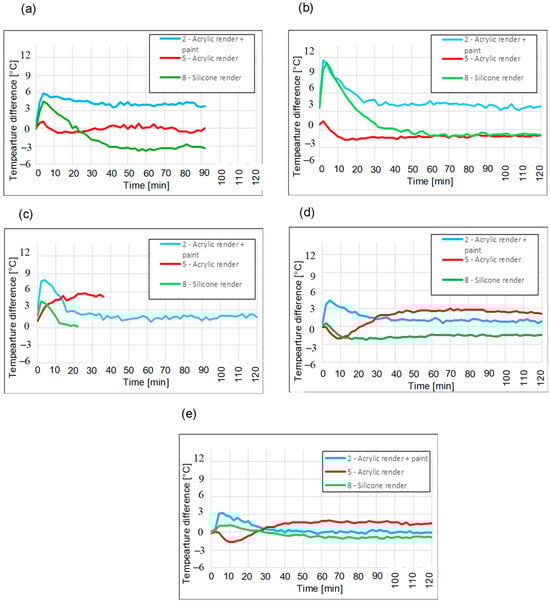
Figure 14.
Temperature difference between the render surface and insulation—graphite polystyrene, λ = 0.033 W/(m·K)—(a) Measurement I, (b) Measurement II, (c) Measurement III, (d) Measurement IV, and (e) Measurement V.
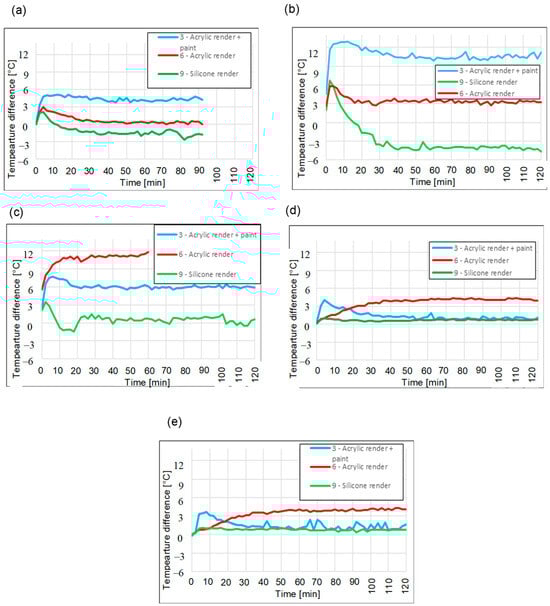
Figure 15.
Temperature difference between the render surface and insulation—white polystyrene, λ = 0.040 W/(m·K)—(a) Measurement I, (b) Measurement II, (c) Measurement III, (d) Measurement IV, and (e) Measurement V.
To enable comparative analysis, the results were grouped based on the type of thermal insulation used—specifically expanded polystyrene (EPS) variants with different thermal conductivity coefficients.
The tests were carried out under defined atmospheric conditions, with temperature values recorded at consistent time intervals. This ensured a reliable assessment of the thermal characteristics of the tested assemblies.
The results for test fields in which white expanded polystyrene with a graphite additive was used as an insulating layer are presented in Figure 13a–e. The acrylic render variant finished with thermochromic paint demonstrated a medium and highest temperature difference—indicating the best thermal properties. The acrylic and silicone render consistently showed low to medium thermal properties.
Figure 14a–e refers to test fields in which graphite polystyrene was used as an insulating layer. The summary of the five measurement series indicates that when using the more thermally efficient graphite-enhanced polystyrene (λ = 0.033 W/m·K), the measurement results changed slightly. The acrylic render with thermal paint more frequently maintained a high temperature differential, which may suggest its more favorable role in preventing heat loss when paired with graphite insulation.
The measurement data for samples with white polystyrene insulation are shown in Figure 15a–e. For white expanded polystyrene (λ = 0.040 W/m∙K), the highest thermal performance was generally exhibited by the acrylic render with thermal paint, which throughout most of the test series achieved the greatest temperature differences, thus providing the highest resistance to heat flow. In this configuration, the acrylic render performed better than when combined with other insulation materials—often demonstrating stable and predictable thermal behavior. In this case, silicone plaster definitely gave way to the others.
Based on the analysis of fifteen graphs depicting the temperature difference between the render surface and the insulation layer for three types of polystyrene—white expanded polystyrene with graphite additive (λ = 0.042 W/m∙K), graphite-enhanced polystyrene (Grey EPS) (λ = 0.033 W/m∙K), and white expanded polystyrene (λ = 0.040 W/m∙K)—clear conclusions can be drawn regarding the behavior of façade systems in response to thermal radiation. Despite the variability in conditions (especially the notable difference in radiation source distance in Measurements II and III), several repeatable tendencies and material-related distinctions were observed.
The silicone render consistently exhibited a characteristic trend of rapidly decreasing temperature differences, often resulting in negative values—indicating that the render surface became cooler than the insulation surface. This suggests a rapid transfer of thermal energy through the finishing layer, which may be attributed to its low thermal mass and high thermal conductivity, which allow heat to pass through the silicone coating without significant accumulation at the façade level.
The acrylic render demonstrated a more stable and predictable behavior. In most measurements—regardless of insulation type—it maintained moderate temperature differences (~0–5 °C), rarely falling below zero.
The acrylic render with thermal paint almost universally produced the highest temperature differences, indicating high reflectivity, as claimed by the manufacturer. Its overall profile suggests that this render variant most effectively reduced heat transfer to the insulation layer, particularly under intense thermal exposure. This effect was most pronounced in Measurement II (closest heat source), where the acrylic + paint system exhibited temperature differences several times greater than the other render types.
When comparing system performance across insulation types, it is evident that grey EPS, being the most thermally resistant (λ = 0.033 W/m∙K), amplified the contrast between the renders—highlighting the poor insulating performance of silicone and the strong barrier effect of acrylic + paint. White EPS with the graphite additive presented a more balanced profile, whereas the silicone render often showed moderate efficiency. Meanwhile, standard white EPS, although theoretically less insulating, demonstrated a surprisingly effective performance when combined with acrylic render—indicating a possible synergistic effect between its moderate conductivity and the thermal mass of the render.
In an ETICS system with a façade plaster, sunlight absorption occurs primarily on the plaster surface, but some long-wave thermal radiation can penetrate the plaster layer, especially thin-layer plaster, and affect the polystyrene. Differences in α between the polystyrene layers may then have a secondary, but measurable, effect on the temperature distribution within the partition, as confirmed by the measurement results.
3.2. Influence of Radiation Source Distance
In order to fully understand the behavior of the tested material systems under thermal exposure, five levels of exposure were analyzed, differing both in the distance between the radiation source and the wall assembly and in radiation intensity. This comparison made it possible to clearly distinguish the impact of external conditions from the intrinsic material properties of the samples and assess how the geometric relationship between the source and the wall influences the heating of façade surfaces. Table 3 presents the summarized measurement data. The reported radiation intensity was the highest among the measured values.
Table 3.
Overview of the measurement conditions.
Measurement II was characterized by the shortest distance between the radiation source and the wall, combined with a very high radiation intensity, which allowed for the identification of particularly adverse conditions for envelope systems exposed to local heat sources. Measurement III, despite an even higher intensity, was conducted from a greater distance, which significantly influenced the temperature distribution over time. Measurements I, IV, and V formed a comparative group with standardized exposure conditions.
The graphs do not include the values recorded during measurement disturbances resulting from mechanical interference with the sensor system (e.g., the need to adjust their mounting or restore proper contact with the tested surface). These data were deliberately excluded from the analysis, as they are not representative of the actual thermal response of the system.
In all nine measurement areas, the dominant influence of the distance between the radiation source and the wall assembly on the temperature profile of the tested systems was unequivocally confirmed (Figure 16, Figure 17 and Figure 18). Measurement II, in which the source was placed closest to the wall—just 23 cm away—at a radiation intensity of 450 W/m2, resulted in the most rapid and extreme temperature increases across all samples. Under these conditions, the final surface temperatures frequently exceeded 120 °C, regardless of the type of EPS or render used. This clearly indicates that the thermal load intensity outweighs the effect of the material characteristics. In Measurement III, despite an even higher radiation intensity (499.4 W/m2), the use of a greater source-to-surface distance (45 cm) resulted in notably lower temperatures. This confirms that the efficiency of heat transfer is determined not only by the power of the thermal flux, but above all, by the spatial configuration between the source and the heated surface including both the distance the radiation travels and the presence of obstacles that may restrict free air movement and thus convection.
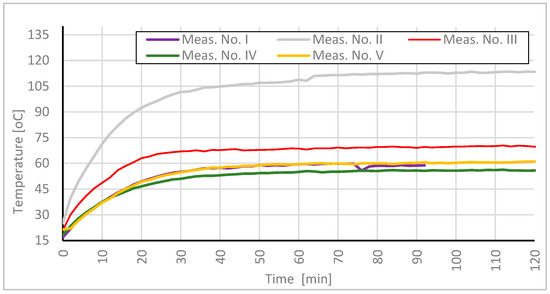
Figure 16.
Temperature change over time—comparison of the results on the surface of the finishing layer in Measurement area 2 across consecutive measurements.
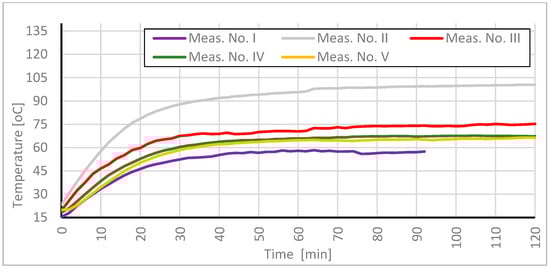
Figure 17.
Temperature change over time—comparison of results on the surface of the finishing layer in Measurement area 5 across consecutive measurements.
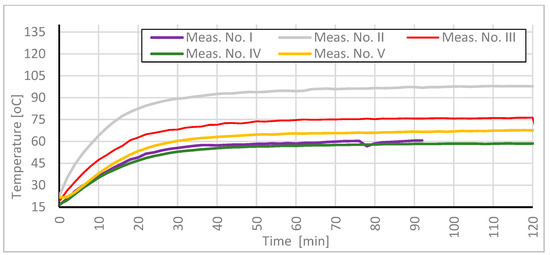
Figure 18.
Temperature change over time—comparison of results on the surface of the finishing layer in Measurement area 8 across consecutive measurements.
A key physical phenomenon that further explains the materials’ strong response to proximity heating is the limitation of convective heat exchange with the environment. In Measurement II, due to the very small gap between the radiation source and the wall surface, airflow was severely restricted, preventing the efficient displacement of heated air. This limited air circulation caused the formation of a localized layer of warm air that was not effectively replaced by cooler ambient air. The resulting “thermal cushion” effect led to continuous surface heating, as the heat that would otherwise be dissipated by natural convection remained trapped. Consequently, the system exhibited a nonlinear temperature increase in response to reduced distance; despite relatively minor differences in radiation intensity between tests, temperature differences reached several tens of degrees Celsius.
Measurements I, IV, and V, conducted at the greatest distance (66 cm) and a radiation intensity of 389.6 W/m2, showed the lowest temperatures and the most stable profiles. In these cases, the available space allowed for free airflow and more efficient heat dissipation into the environment, effectively limiting surface temperature rises. Furthermore, under moderate radiation conditions, the differences between the materials became more distinguishable, suggesting that thermal performance characteristics become more apparent when surface phenomena are not overshadowed by extreme radiation exposure.
In summary, reducing the distance between the radiation source and the wall assembly increased both the intensity of heat input and the restriction of heat dissipation through natural convection. These effects act synergistically, producing a pronounced nonlinear rise in the temperature of the material. As a result, even minor changes in exposure geometry may have greater thermal implications than the material parameters themselves. This phenomenon has practical importance in real-world conditions, where wall systems are often subjected to intense, directional solar radiation such as sun-exposed façades, narrow gaps between buildings, or adjacency to heat-emitting surfaces like asphalt. In such scenarios, the thermal protection performance depends not only on the insulation properties, but also on environmental factors that either enable or hinder effective heat exchange with the surroundings.
3.3. Numerical Simulation
In parallel with the experimental study, the scenario was also modeled using Ansys software, version 2024 R2, the Steady-State Thermal module, and THERM software, version 7.6.
THERM is a tool that uses a two-dimensional steady-state heat conduction model, as described.
This program focuses solely on thermal conductivity, without the ability to account for full thermal radiation or dynamic phenomena.
Ansys Steady-State Thermal, on the other hand, is an advanced numerical tool that also uses the Fourier equation in steady-state mode, but in a full 3D or 2D model:
The analysis conducted in both programs focused on the case with one-way heat transfer (from the outer to the inner surface of the partition), which physically implies a 1D model. However, using Ansys allowed for the accurate representation of the influence of solar radiation (through a defined heat flux and emissivity) and the temperature distribution in the layered material, which exceeds the capabilities of THERM.
The numerical modeling conducted included several simplifying assumptions that could have contributed to the differences between the simulation results and the actual measurements. The most important include:
- 1.
- Ignoring natural airflows (free convection) around the tested element—the model primarily considered thermal conductivity and radiation, assuming a simplified or constant convection coefficient, without dynamic air exchange with the surroundings.
- 2.
- Idealization of contact conditions between the system layers (e.g., plaster—polystyrene)—in reality, micro-gaps, discontinuities, or heat transfer resistances may occur, which were not reflected in the model.
- 3.
- Simplified boundary conditions for thermal radiation—the simulation used averaged values of emissivity and radiant flux, ignoring minor differences resulting from surface texture.
- 4.
- Assumption of material homogeneity—the model did not account for local inhomogeneities in the insulating material (e.g., in the case of white polystyrene with added graphite), which could have affected the local temperature distribution.
- 5.
- Constant ambient conditions—constant ambient temperature and radiation conditions were assumed, ignoring their possible fluctuations during the actual experiment.
The results for the selected test areas are presented in Table 4.
Table 4.
Summary of selected results obtained using Ansys and THERM software.
The analyses took into account the material parameters of the façade renders, the thermal properties of the applied insulation, and the boundary conditions simulating solar exposure (excluding UV radiation) as well as convective and radiative heat exchange with the surrounding environment, consistent with the conditions of Measurement IV.
Table 5 presents the maximum surface temperatures obtained across nine test fields, calculated using different numerical tools: Ansys Steady-State Thermal and THERM. For comparison, these results were juxtaposed with data from the experimental measurements.
Table 5.
Summary of results obtained through numerical simulation.
In the comparative analysis of results obtained in the simulation environments Ansys (Steady-State Thermal) and THERM, against the measurement data from the fourth experimental cycle, clear quantitative discrepancies were observed in the recorded surface temperatures. In most cases, the THERM software more accurately reflected the experimental measurements—the absolute deviations were generally within ±5 °C, corresponding to a relative error in the range of 1–11%. The results obtained in Ansys showed larger differences, reaching up to 26% (e.g., Field 3), which may indicate limitations of the applied model or simplifications in the boundary conditions.
The highest relative errors in both simulation environments were observed for Fields 2 and 3, where the differences between the calculated and measured temperatures reached −14.4 °C in Ansys and −6.4 °C in THERM. It should be noted that Fields 1–3 were coated with a thermal insulation paint with reflective properties. This layer could have reduced heat absorption and altered the local thermal balance, which may not have been fully captured in the simulation models—especially in Ansys, where this effect may have been underestimated.
For Fields 4–7, the agreement between the simulation results and the experimental data was significantly better, particularly in the case of THERM. For example, Field 6 exhibited only a 1% error, confirming the reliability of the model when appropriately configured with accurate material and boundary parameters. The discrepancies in Ansys were more pronounced but still within the acceptable range for preliminary analyses.
The largest deviations (up to −14% in THERM and −22% in Ansys) for Field 9 may have resulted from local differences in emissivity, conductivity, or even nonlinear thermal conduction through the layers—effects that are often averaged or omitted in simplified models. This highlights the need for further refinement of the simulation frameworks.
In summary, THERM—due to its simplified but accurately configured two-dimensional model—proved more effective in replicating the experimental results. Ansys, while more suitable for general analysis, requires precise input parameter definitions for comparative evaluations. Particular attention should be paid to the optical and thermal properties of surface layers—such as reflective coatings—that can significantly affect the temperature distribution within the envelope.
4. Conclusions
The conducted research enabled a comprehensive, multi-faceted evaluation of the influence of thermal radiation on vertical building envelopes, taking into account material variability and exposure geometry. Through five repeated measurement cycles and the application of various finishing and insulation configurations, it was possible to analyze both the dynamic characteristics of wall heating and the long-term effectiveness of thermal protection.
The results recorded across five measurement series clearly demonstrate that both the radiation intensity and the mechanisms of heat dissipation into the environment significantly influence the level of envelope heating as well as the way in which heat is distributed throughout its structure. The most extreme heating conditions occurred during Measurement II, where the smallest distance between the radiation source and the envelope (23 cm) led to the highest recorded surface temperatures on the exterior render, and in many cases, also on the surface of the insulation layer. In contrast, Measurement III, although it had the highest recorded radiation intensity (499.4 W/m2), resulted in slightly lower temperatures. This can be attributed to the greater distance, which allowed for more efficient heat exchange with the surrounding air, thus reducing the severity of the thermal load. In Measurements I, IV, and V, conducted with the radiation source placed at a greater distance (66 cm), lower temperature values and greater measurement repeatability were observed—creating optimal conditions for comparing the performance of different insulation materials.
A comparison of the maximum temperatures recorded on the surface of the façade render and on the insulation (Figure 19 and Figure 20) revealed significant differences in the thermal behavior of the tested material assemblies. In many cases, the render surface reached higher temperatures during the initial phase of radiation exposure due to its direct exposure to the heat source. However, with prolonged heating and increased thermal load, the temperature on the insulation surface occasionally exceeded that of the render—indicating heat accumulation in the deeper layers of the wall assembly. The final temperature distribution was thus the result of both the individual material properties and their interactions within the entire system.
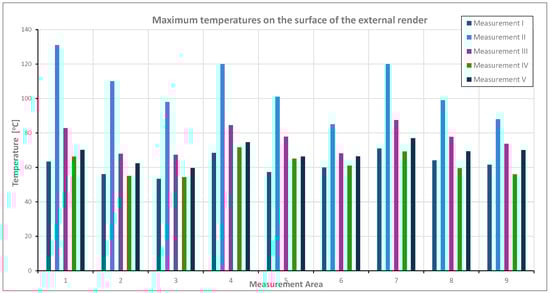
Figure 19.
Graph of the maximum temperatures on the surface of the insulation layer for the nine tested areas across five consecutive measurements.
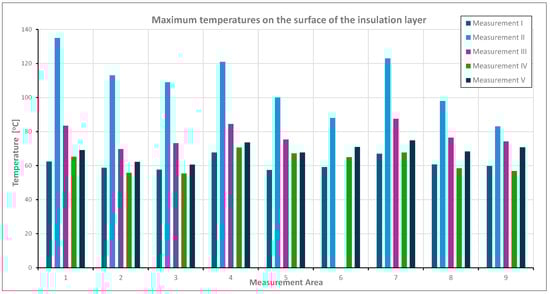
Figure 20.
Graph of the maximum temperatures on the surface of the external render for the nine tested areas across five consecutive measurements.
In this study, the distance between the radiation source and the test surface was treated as a model equivalent of real-world conditions with limited heat dissipation such as dense urban settings, poor natural ventilation, or shading. The findings indicate that under such conditions, the envelope is subjected to intensified heating, which should be considered in façade design and the selection of finishing materials.
The inclusion of numerical thermal simulations using dedicated software provided valuable support to the experimental work. Two approaches were employed: a simplified 2D model using THERM to analyze cross-sectional heat conduction, and an advanced 3D simulation using Ansys, enabling the tracking of temperature distribution over time.
The simulations confirmed the direction of energy flow and the progressive heating of successive layers. Differences between material variants observed in the simulation results were consistent with the experimental findings. The numerical approach, based on ideally homogeneous conditions, helped minimize the impact of radiation variability.
From an engineering perspective, the use of two independent simulation methods enabled the cross-validation of results and enhanced the reliability of conclusions. Numerical tools allow for the rapid testing of new material and geometric configurations at the design stage, making them an extremely useful component in optimizing construction solutions. However, it is important to emphasize that experimentally obtained results remain more representative of real-world use and are essential for validating numerical models.
The final analysis confirmed that the effectiveness of a thermal barrier is a function of multiple interacting factors—not only material technical parameters, but also environmental conditions and exposure geometry. Even with identical layer geometries, changes in convective conditions can lead to significant differences in surface heating. The collected measurements, supported by graphical analysis, suggest that insulation surface temperature is one of the key indicators of the thermal protection efficiency of wall assemblies, directly impacting building energy performance and occupant comfort. This work contributes to the broader discussion on the impact of façade materials and colors on the passive cooling of buildings. Our research indicates a need for further development in this area of passive cooling. On the one hand, we presented a research methodology using a rotating chamber to simulate the aging of materials under real-world conditions, which in itself is an original proposal to complement established research methods. On the other hand, we confirmed research results obtained using other research methods known from the literature, simultaneously identifying gaps in knowledge and proposing further research development in this area.
Author Contributions
Conceptualization, J.W., M.M., J.B. (Jerzy Bochen), and J.B. (Janusz Belok); Methodology, J.W., M.M., J.B. (Jerzy Bochen), and J.B. (Janusz Belok); Software, J.W.; Validation, J.W., M.M., and J.B. (Jerzy Bochen); Formal analysis, J.W., M.M., and A.N., Investigation, J.W., M.M., and A.N.; Data curation, J.W., M.M., J.B. (Jerzy Bochen), J.B. (Janusz Belok), and I.P.-S.; Writing—original draft preparation, J.W., A.N., and I.P.-S.; Writing—review and editing, J.W., A.N., and I.P.-S.; Visualization, J.W., A.N., and I.P.-S. All authors have read and agreed to the published version of the manuscript.
Funding
This research received no external funding.
Data Availability Statement
The data are available through the authors.
Conflicts of Interest
The authors declare no conflicts of interest.
References
- European Union. Directive 2010/31/EU. European Parliament and of the Council of 19 May 2010 on the Energy Performance of Buildings (receast). Off. J. Eur. Union L 153 2010, 13–35. [Google Scholar]
- Mazzeo, D.; Oliveti, G.; Arcuri, N. Mapping of the seasonal dynamic properties of building walls in actual periodic conditions and effects produced by solar radiation incident on the outer and inner surfaces of the wall. Appl. Therm. Eng. 2016, 102, 1157–1174. [Google Scholar] [CrossRef]
- Zhou, Y.; Dang, G.; Zhang, T.; Qi, F. Development of an hourly incidentsolar radiation calculation methodology for building envelopes under ground-object obstruction conditions. Build. Environ. 2025, 282, 113304. [Google Scholar] [CrossRef]
- Lan, Y.; Zhan, Q. How do urban buildings impact summer air temperature? The effects of building configurations in space and time. Build. Environ. 2017, 125, 88–98. [Google Scholar] [CrossRef]
- Sayadi, S.; Hayati, A.; Salmanzadeh, M. Optimization of window-to-wall ratio for buildings located in different climates: An IDA-indoor climate and Energy simulation study. Energies 2021, 14, 1974. [Google Scholar] [CrossRef]
- Wang, Y.; Liu, K.; Liu, Y.; Wang, D.; Liu, J. The impact of temperature and relative humidity dependent thermal conductivity of insulation materials on heat transfer through the building envelope. J. Build. Eng. 2022, 46, 103700. [Google Scholar] [CrossRef]
- Orlik-Kożdoń, B.; Nowoświat, A. Modelling and testing of a granular insulating material. J. Build. Phys. 2018, 42, 6–15. [Google Scholar] [CrossRef]
- Pokorska-Silva, I.; Kadela, M.; Małek, M.; Fedorowicz, L. An assessment of the thermal behavior of envelope surface coatings with different colors. Polymers 2021, 13, 82. [Google Scholar] [CrossRef] [PubMed]
- Tavil, A. Thermal behavior of masonry walls in Istanbul. Constr. Build. Mater. 2004, 18, 111–118. [Google Scholar] [CrossRef]
- Orosa, J.A.; Baaliña, A. Improving PAQ and comfort conditions in Spanish office buildings with passive climate control. Build. Environ. 2009, 44, 502–508. [Google Scholar] [CrossRef]
- Martínez-Garrido, M.I.; Aparicio, S.; Fort, R.; Anaya, J.J.; Izquierdo, M.A.G. Effect of solar radiation and humidity on the inner core walls in historic buildings. Constr. Build. Mater. 2014, 51, 383–394. [Google Scholar] [CrossRef][Green Version]
- Camuffo, D. Indoor dynamic climatology: Investigations on the interactions between walls and indoor environment. Atmos. Environ. 1983, 17, 1803–1809. [Google Scholar] [CrossRef]
- Espinoza, R.M.; Franke, L.; Deckelmann, G. Phase changes of salts in porous materials: Crystallization, hydronation and deliquescence. Constr. Build. Mater. 2008, 22, 1758–1773. [Google Scholar] [CrossRef]
- Grossi, C.M.; Brimblecombe, P.; Menéndez, B.; Benavente, D.; Harris, I.; Déqué, M. Climatology of salt transitions and implications for stone weathering. Sci. Total. Environ. 2011, 409, 2577–2585. [Google Scholar] [CrossRef]
- Viitanen, H.; Vinha, J.; Salminen, K.; Ojanen, T.; Peuhkuri, R.; Paajanen, L.; Lähdesmäki, K. Moisture and Bio-deterioration Risk of Building Materials and Structures. J. Build. Phys. 2009, 33, 201–224. [Google Scholar] [CrossRef]
- Ito, K. Numerical prediction model for fungal growth coupled with hygrothermal transfer in building materials. Indoor Built Environ. 2012, 21, 845–856. [Google Scholar] [CrossRef]
- Säid, M.N.A.; Brown, W.C.; Shirtliffe, C.J.; Maurenbrecher, A.H.P. Monitoring of the building envelope of a heritage house: A case study. Energy Build. 1999, 30, 211–219. [Google Scholar] [CrossRef]
- Li, H.; Jia, H.; Zhong, K.; Zhai, Z. Analysis of factors influencing actual absorption of solar energy by building walls. Energy 2021, 215, 118988. [Google Scholar] [CrossRef]
- Li, H.; Zhong, K.; Yu, J.; Kang, Y.; Zhai, Z. Solar energy absorption effect of buildings in hot summer and cold winter climate zone, China. Sol. Energy 2020, 198, 519–528. [Google Scholar] [CrossRef]
- Yu, Y.; Ejohwomu, O.; Gallego-Schmid, A. Pssive cooling for circular economy: Building materials and design solutions. ScienceDirect 2025, 135, 332–337. [Google Scholar] [CrossRef]
- Carbonari, A. Retrofit of Italian School Buildings. The Influence of Thermal Inertia and Solar Gains on Energy Demand and Comfort. Future Cities Environ. 2019, 5, 3. [Google Scholar] [CrossRef]
- Geetha, N.B.; Velraj, R. Passive cooling methods for energy efficient buildings with without thermal energy storage—A review. Energy Educ. Sci. Technol. Part A Energy Sci. Res. 2012, 29, 913–946. [Google Scholar]
- Onyenokporo, N.C.; Taki, A.; Montalvo, L.Z.; Oyinlola, M.A. Exploring the Impact of Rice Husk Ash Masonry Blocks on Building Energy Performance. Buildings 2024, 14, 1290. [Google Scholar] [CrossRef]
- Belhous, M.; Boumhaout, M.; Oukach, S.; Hamdi, H. Effects of a Material Based on Dte Palm Fibers on the Thermal Behavior of a Residential Building in the Atlantic Climate of Morocco. Sustainability 2023, 15, 6314. [Google Scholar] [CrossRef]
- Kio, P.; Ali, A.K. In situ experimental evaluation of a novel modular living wall system for industrial symbiosis. Energy Build. 2021, 252, 111405. [Google Scholar] [CrossRef]
- Onyszkiewicz, J.; Sadowski, K. Proposals for the revitalization of prefabricated building facades in terms of the principles of sustainable development and social participation. J. Build. Eng. 2022, 46, 103713. [Google Scholar] [CrossRef]
- Randjelovic, D.; Vasov, M.; Ignjatovic, M.; Stojiljkovic, M.; Bogdanovic, V. Investigation of a passive design approach for a building facility: A case study. Energy Sources Part A Recovery Util. Environ. Eff. 2021, 47, 8890–8908. [Google Scholar] [CrossRef]
- Al-Obaidi, K.M.; Ismail, M.; Rahman, A.M.A. Passive cooling techniques through reflective and radiative roofs in tropical houses in Southeast Asia: A literature review. Front. Archit. Res. 2014, 3, 283–297. [Google Scholar] [CrossRef]
- Giovoni, B. Passive Low Energy Cooling of Buildings; John Wiley & Sons: Hoboken, NJ, USA, 1994. [Google Scholar]
- Sanchez, E.C.; Diaz, J.R.D.; Kampouropulos, K. Novel Architectural Strategies to Support an nZEB Mediterranean School. IOP Conf. Ser. Maer. Sci. Eng. 2019, 603, 042012. [Google Scholar] [CrossRef]


Disclaimer/Publisher’s Note: The statements, opinions and data contained in all publications are solely those of the individual author(s) and contributor(s) and not of MDPI and/or the editor(s). MDPI and/or the editor(s) disclaim responsibility for any injury to people or property resulting from any ideas, methods, instructions or products referred to in the content. |
© 2025 by the authors. Licensee MDPI, Basel, Switzerland. This article is an open access article distributed under the terms and conditions of the Creative Commons Attribution (CC BY) license (https://creativecommons.org/licenses/by/4.0/).