Article

Reserve Planning Method for High-Penetration Wind Power Systems Considering Typhoon Weather

1
State Key Laboratory of Power Transmission Equipment Technology, School of Electrical Engineering, Chongqing University, Chongqing 400044, China
2
Grid Planning and Research Center, Guangdong Power Grid Corporation, China Southern Power Grid, Guangzhou 510080, China
*
Author to whom correspondence should be addressed.
Energies 2025, 18(17), 4737; https://doi.org/10.3390/en18174737
Submission received: 8 August 2025 / Revised: 29 August 2025 / Accepted: 2 September 2025 / Published: 5 September 2025
(This article belongs to the Special Issue Development and Efficient Utilization of Renewable and Clean Energy)

Abstract

The large-scale integration of wind power into coastal power systems introduces significant challenges to reserve planning, especially under the threat of typhoons, which can cause extensive generation loss and threaten system security. Conventional reserve planning methods often fail to account for such extreme typhoon events. To fill the gap, this paper proposes a novel two-stage reserve planning framework that integrates economic optimization with operational security verification. In the first stage, a diverse set of high-impact typhoon scenarios are generated using a multivariate Markov chain Monte Carlo (MMCMC)–based path reconstruction method, which captures the dynamic evolution of key typhoon characteristics. In the second stage, the economically optimal reserve capacity is identified through cost-benefit analysis and then validated against the typhoon scenarios via N − 1 security verification. A case study on the modified IEEE RTS79 test system indicates that economically optimal reserve may be inadequate for ensuring security under severe typhoon conditions. However, a small increase in reserve capacity can effectively enhance system resilience with minimal additional cost. These results highlight the importance of incorporating typhoon scenario-based security verification into reserve planning especially for high-penetration wind power systems in coastal regions.

1. Introduction

In the context of the global energy transition, renewable energy sources, particularly wind power, have experienced rapid and large-scale development [1]. By the end of 2024, the cumulative installed wind power capacity in China exceeded 520.68 GW, including 39.1 GW of offshore wind power capacity [2,3]. This remarkable growth highlights the more critical role of wind power in the modern energy mix. However, the rapid integration of wind power also intensifies the operational challenges due to its inherent intermittency and volatility. To maintain supply–demand balance in high-penetration wind power systems, it is essential to be equipped with sufficient reserve capacity, which has become a critical issue in power system planning.
However, the rapid integration of wind power introduces significant operational challenges due to its inherent intermittency, volatility, and forecast errors. While the literature presents advanced methods, such as stochastic and convex optimization, to manage these routine uncertainties in economic dispatch [4,5], the coastal power systems face a greater threat from extreme weather. Events like typhoons pose a greater threat than routine fluctuations in wind output. Specifically, as a typhoon passes, the extreme wind speeds near its center often exceed the cut-out threshold of wind turbines, forcing large-scale shutdowns of offshore wind farms and causing substantial loss of generation capacity in a short period [6,7]. Such sudden and concentrated loss of generation caused by a single event presents critical threat to the supply–demand balance of the whole system, which may render the conventional reserve planning methods designed for the usual contingencies insufficient [8].
To ensure system-level security, the reserve planning of power systems adopts the N − 1 criterion, which requires the system to withstand the failure of any single generating unit without compromising supply–demand balance [9,10]. However, performing N − 1 security verification across all 8760 h of the planning year is computationally intensive and often unnecessary. The more efficient and focused approach is to evaluate system performance under extreme scenarios that are expected to impose the highest operational stress [11,12]. Typhoon weather is particularly important in this regard, as it can cause large-scale curtailment of renewable generation and force the system to rely heavily on conventional generating units to maintain power balance. This results in the highly stressed operating condition, where the system has limited ability to respond to additional failures. If N − 1 contingency occurs under such conditions, the remaining reserve may be insufficient, thus leading to load shedding. Therefore, performing N − 1 security verification under typhoon scenarios provides a practical and effective means of ensuring that the planned reserve capacity can maintain the system security.
Methodologies for power system reserve planning have been extensively explored in the literature. They are generally categorized into two main categories: deterministic and probabilistic approaches. Deterministic methods establish reserve requirements based on predefined criteria, such as the loss of the largest single generating unit or a fixed percentage of the peak load [13]. While simple and easy to implement, these methods struggle to address the growing uncertainty introduced by the large-scale integration of renewable energy sources. To overcome these limitations, probabilistic approaches have been developed by explicitly modeling the inherent uncertainties in system operation, thereby enabling more rigorous assessment of risk. These can be further divided into two subcategories: those based on reliability criteria and those based on cost-benefit analysis. The reliability-based methods determine the minimum reserve capacity required to satisfy predefined reliability targets, such as loss of load expectation (LOLE) or expected energy not supplied (EENS) [14]. Alternatively, cost-benefit analysis evaluates the trade-off between the cost of reserve investments and the economic value of improved reliability [15]. Reference [16] proposed a framework to determine the optimal reserve capacity by maximizing social welfare, defined as the net benefit from balancing reserve-related costs and reliability gains. Furthermore, to better account for the risk preferences associated with extreme events, reference [13] assigns greater weight to low-probability, high-impact scenarios. Although these probabilistic approaches represent significant methodological advancement, they frequently rely on reliability indices calculated over long time periods. Consequently, the weakness of the system in the face of rare but severe events such as typhoon weather is overlooked, potentially resulting in a reserve that fails to guarantee security under these extreme conditions.
To assess the potential impact of typhoons, a critical challenge is the generation of numerous reconstructed typhoon paths to encompass a wide range of potential scenarios. Foundational work by reference [17] introduced an event-based Monte Carlo simulation framework to generate large ensembles of hurricane events. Building upon this, reference [18] developed a statistical-deterministic downscaling method that produces synthetic tracks consistent with outputs from large-scale climate models. For planning applications, reference [19,20] employed statistical track models that predict typhoon paths using regression equations based on the current state of the typhoon. However, these path generation methods are built upon an empirical framework that suffers from two key limitations. Firstly, they rely on static regression formulas derived from historical data, which cannot adapt to the dynamic evolution of the typhoon’s physical state. This limits the ability of the model to capture non-stationary behaviors, such as rapid intensification or decay. Secondly, these models do not explicitly incorporate the statistical interdependencies among the key meteorological variables. For example, the correlation between central pressure and translational velocity is not reflected in the state transition logic [21]. As a result, the interactions among multiple variables are treated independently, which further constrains the physical realism of the generated scenarios, potentially leading to inaccurate assessment of risks posed by the typhoon.
To fill this research gap, this paper proposes a two-stage reserve planning method for high-penetration wind power systems that considers typhoon weather. The objective is to determine the reserve capacity that is both economical and sufficient to maintaining system security during extreme typhoon events. The main contributions of this work are presented as follows:
  • A typhoon path reconstruction method based on the multivariate Markov chain Monte Carlo (MMCMC) algorithm is proposed to generate a diverse set of spatiotemporally coherent typhoon paths. By integrating these paths with a composite wind field model that incorporates translational velocity, the source-load scenarios are constructed, thus providing a solid foundation for subsequent N − 1 security verification and reserve planning;
  • An innovative two-stage reserve planning framework is developed. In the first stage, a cost-benefit analysis is conducted to identify the economically optimal reserve capacity. In the second stage, rigorous N − 1 security verification is performed under extreme typhoon scenarios using hourly time-series production simulation (HTSPS), thereby achieving an effective balance between economy and security.
The remainder of this paper is organized as follows: Section 2 details the source-load scenario generation method considering typhoon weather, along with the two-stage reserve planning framework. Section 3 presents and discusses the results from a case study on the modified IEEE RTS-79 test system. Section 4 concludes this paper.

2. Materials and Methods

This paper proposes a reserve planning method for high-penetration wind power systems that accounts for typhoon weather, as illustrated in Figure 1. The proposed method consists of two key phases: (1) the generation of the source-load scenario under typhoon weather for the planning year and (2) two-stage reserve determination for the planning year.
(1)
Generation of source-load scenario under typhoon weather for the planning year: Firstly, historical typhoon path data and load data are collected at an hourly resolution. Then, to reflect the spatiotemporal characteristics of typhoons, the MMCMC algorithm is employed to reconstruct typhoon paths for the planning year. A typhoon wind field model is established by jointly considering both rotational wind field and the translational velocity of the typhoon. After this, the impact of the typhoon on individual wind farms is identified. Subsequently, wind speed and output data for the wind farms are obtained, and corresponding source-load scenarios under typhoon weather are then generated.
(2)
Two-stage reserve capacity determination for the planning year: Based on the generating units and load data for the planning year, reserve capacity r is set in an incremental manner. Then, a cost-benefit analysis is performed, incorporating sequential Monte Carlo simulation (SMCS), stochastic production simulation (SPS), and the uniform annual value method. This process yields both the reliability benefit and reserve-related cost. Subsequently, an N − 1 security verification for generating units is performed on the source-load scenarios under typhoon weather, based on HTSPS. Ultimately, this framework establishes the final reserve capacity that is not only economically justified by the cost-benefit analysis but also confirmed to be secure through N − 1 verification under typhoon scenarios.

2.1. Source-Load Scenario Generation Under Typhoon Weather for the Planning Year

This subsection presents the methodology for generating source-load scenarios under typhoon weather for the planning year, a process essential for capturing the dynamic and uncertain impacts of typhoons on wind power output. This methodology is composed of four core modules: typhoon path reconstruction, typhoon wind field modeling, typhoon impact mechanism, and wind power and load scenario modeling.

2.1.1. Typhoon Path Reconstruction Based on MMCMC Algorithm

Typhoon paths for the planning year are reconstructed by means of the MMCMC algorithm, which effectively captures the spatiotemporal characteristics and inherent uncertainties of typhoon translation.
In this algorithm, the typhoon path is modeled as a sequence of multivariate discrete states. At time t, the path state is represented as a N index -dimensional vector s = [ s t 1 , s t 2 , , s t N index ] , where N index represents the number of state indicators. These indicators include central pressure as well as the zonal and meridional translational velocity of the typhoon center. The state transition follows a first-order multivariate Markov process [22], with the transition probability is defined as
P ( s t + 1 = j | s t = i ) = p i , j , i , j S
where i and j are two state vectors from the discrete state space S , and p i , j is an element of the joint state transition probability matrix, representing the transition probability from state i at time t to state j at time t + 1. Based on the joint state transition probability matrix P, which is estimated from historical typhoon data, reconstructed typhoon state sequences { s 0 , s 1 , , s T } are generated through Markov chain sampling, where T denotes the total amount of time in the reconstructed typhoon path.
Firstly, a joint state transition probability matrix P N S × N S is constructed, where NS is the total number of discrete states. NS is determined by the number of discrete states for each indicator N state raised to the power of the number of indicators N index , i.e., N S = N state N index . The construction process involves the following.
At each time, the typhoon path state contains the three state indicators mentioned above, which are originally continuous variables. These variables are discretized into Nstate distinct states, and the resulting typhoon path state is represented as s t = [ s t 1 , s t 2 , , s t N index ] . Each component s t i { 0 ,   1 ,   , N state 1 } represents the discretized level of the corresponding indicator. The discrete vector s is then mapped onto a unique state index I s { 1 ,   2 ,   , N s } using the following encoding rule:
I s = i = 1 N index ( s i 1 ) N state N index i + 1
A zero matrix F N S × N S is initialized to record state transition frequencies between states. For each historical typhoon path state sequence, if the transition occurs from state i to state j, the corresponding element f i , j in matrix F is incremented by 1. By traversing through all adjacent state pairs in the historical data, the matrix F accumulates the transition frequencies between different states.
The joint state transition probability matrix P is derived by dividing each element f i , j in the matrix F by the sum of elements in its corresponding row:
p i , j = f i , j k S f i , k , i , j S
Secondly, typhoon paths in the planning year are reconstructed based on the derived probability matrix P. This involves the following.
To facilitate efficient sampling, a cumulative transition probability matrix P cum N S × N S is derived from the joint transition matrix P. Each element p i , j cum is calculated as
p i , j cum = l j p i , l , i , j S
where lj denotes lexicographic ordering of multivariate states. Lexicographic ordering compares two vectors dimension by dimension: it starts with the first dimension, and if they are equal, moves to the next, and so on. For example, given multivariate states a = [0, 1, 1] and b = [1, 0, 0], a < b under lexicographic order because 0 < 1 in their first dimension.
Utilizing the Monte Carlo method, a random state sequence of typhoon path is generated for the planning year. Starting from an initial path state i0, a uniform random number u ∈ [0, 1] is continuously generated. This u is compared with the elements in row i of the cumulative probability transition matrix P cum . If p i , j 1 cum < u p i , j cum , and then the next state is j. This process is iteratively repeated until the full sequence of discrete typhoon states of the desired length is generated.
The generated state sequence, composed of encoded discrete states, is then decoded into continuous typhoon path data using the following formula:
Path t = L ( s t ) + ξ t ( U ( s t ) L ( s t ) )
where Path t N i n d e x is the reconstructed typhoon path data at time t. L ( s t ) N i n d e x and U ( s t ) N i n d e x are the lower and upper bounds of the typhoon path interval covered by st, respectively. ξ N i n d e x is a vector whose elements are independently drawn from the uniform distribution on the interval [0, 1]. This process yields the hourly central pressure and translational velocity of the typhoon for the planning year.
The decoded hourly data provide the basis for constructing the full spatiotemporal trajectory of each typhoon, defining its complete lifecycle from genesis to termination. The process begins by stochastically sampling an initial genesis point from the empirical distribution of historical starting locations. From this point, the path propagates forward as the hourly positions are iteratively computed by integrating the decoded velocity sequence. The trajectory concludes once its total duration, itself sampled from the historical distribution of typhoon lifetimes, is reached.

2.1.2. Typhoon Wind Field Model with Rotational and Translational Components

This paper establishes a comprehensive model by integrating the classical rotational wind field with the translational velocity of the typhoon.
The Batts model [23] is adopted to describe the radial wind field. The maximum gradient wind speed V g x at the radius of maximum wind R max is calculated as
V g x = K Δ P R max / 2 f
where K represents an empirical constant, taken as 6.72 in this paper. ΔP represents the pressure difference between the typhoon periphery and its center, expressed in hectopascals (hPa). f = 2ωsinϕ represents the Coriolis parameter, with ω being the rotational angular velocity of Earth and ϕ being the latitude of typhoon center. The radius of maximum wind R max is estimated using the following empirical formula:
R max = e 0.1239 Δ P max 0.6033 + 5.1034
where Δ P max represents the maximum pressure difference.
The 10 min average maximum wind speed at a 10 m height, denoted as V 10 R max , is computed by incorporating the translational velocity V T of the typhoon as
V 10 R max = 0.865 V g x + 0.5 V T
The wind speed at the turbine hub height z at radius R is then extrapolated from the 10 m height wind speed V 10 R max , using the wind profile power law:
v z R = V 10 R max ( z / 10 ) γ R / R max , R < R max V 10 R max ( z / 10 ) γ R max / R β , R R max
where γ and β represent the empirical exponents, taken as 0.09 and 0.7 in this paper, respectively.
To capture the asymmetric wind distribution caused by the translation of the typhoon, the final wind velocity is modeled as the vector superposition of the radial wind component v r a d , derived from the Batts model, and the translational wind component v t r a . The resulting wind speed v a c t u a l is the magnitude of this resultant vector:
v a c t u a l = v r a d + v t r a = ( v r a d x + v t r a x ) 2 + ( v r a d y + v t r a y ) 2
where and the superscripts x and y denote the zonal and meridional directions, respectively. This composite model provides more physically realistic wind field representation.

2.1.3. Typhoon Impact Assessment Based on Geometric Circle Judgment Method

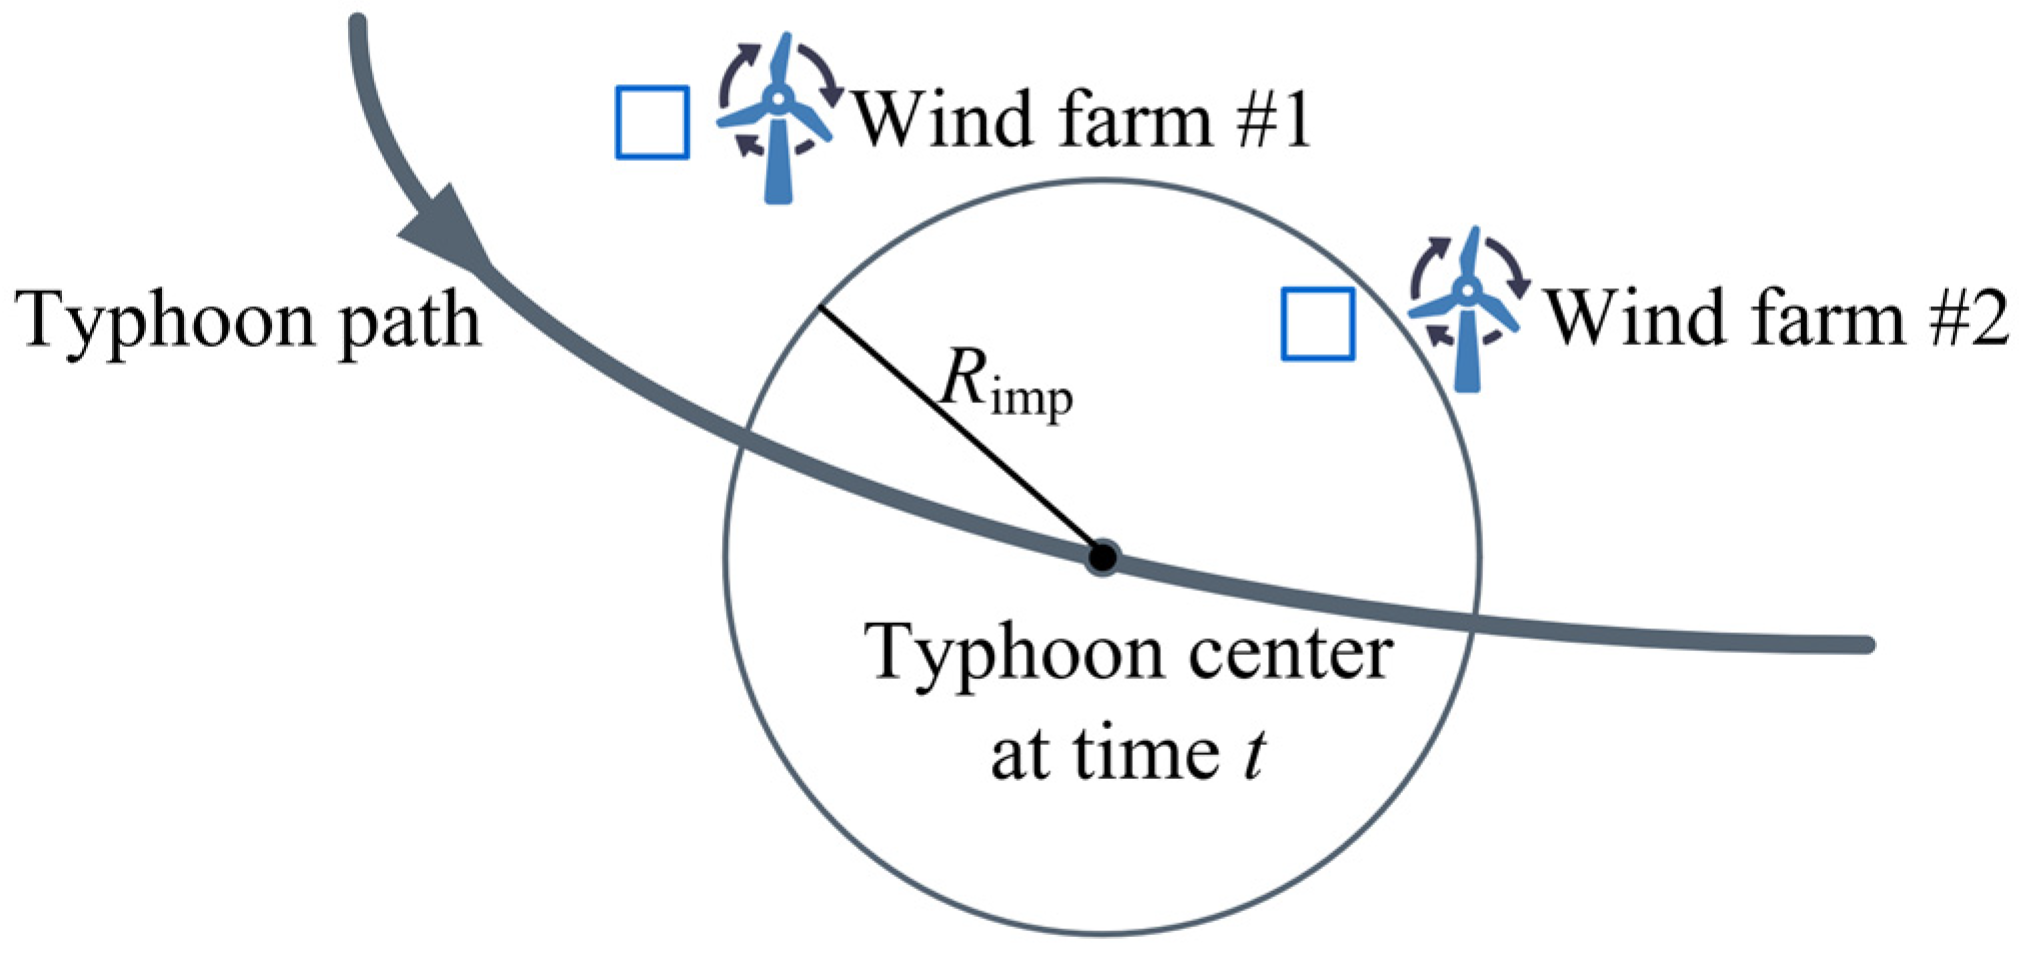
To determine which wind farms are affected by the typhoon, a geometric circle judgment method [24] is employed. As illustrated in Figure 2, for each time of the reconstructed typhoon path, a circular impact zone is defined with the typhoon center as the origin and R imp as the radius. If the geographical coordinates of a wind farm fall within this circle (e.g., wind farm #1 in Figure 2), the wind farm is considered to be affected by the typhoon at that time. Conversely, wind farms located outside the impact zone (e.g., wind farm #2) are assumed unaffected and operate under normal meteorological conditions.

2.1.4. Wind Power and Load Scenario Model

A 96 h source-load scenario is constructed for each reconstructed typhoon event. The 96 h duration is chosen based on statistical analysis of historical typhoon events [25], which shows that it is sufficient to encompass the full life cycle of most significant typhoon events.
Based on the 96 h time-series wind speed sequence of all wind farms, the corresponding wind power output is calculated through the wind power curve function [26]:
P t = 0 , 0 v t v c i A + B × v t + C × v t 2 P r , v c i < v t v r P r , v r < v t v c o 0 , v c o < v t
where v t is the wind speed at time t. v c i , v r , and v c o are the cut-in, rated, and cut-out wind speeds, respectively. P r is the rated power. The coefficients A, B, and C are calculated as follows:
A = 1 v c i v r 2 v c i v c i + v r 4 v c i × v r v c i + v r 2 v r 3 B = 1 v c i v r 2 4 v c i + v r v c i + v r 2 v r 3 3 v c i + v r C = 1 v c i v r 2 2 4 v c i + v r 2 v r 3
Simultaneously, the corresponding 96 h load profile is generated using an approach that leverages the feed-forward neural network (FFNN) [27]. The FFNN is trained on historical data to establish the relationship between key meteorological variables (e.g., temperature, wind speed, precipitation) and load of power system specifically during the typhoon events. For the reconstructed path, this trained FFNN generates the hourly load for the typhoon event.
The models of wind power and load create a set of source-load scenarios for the subsequent reserve planning analysis.

2.2. Two-Stage Reserve Planning Framework Considering Typhoon Weather

This section presents the two-stage reserve planning framework that integrates the cost-benefit analysis with the N − 1 security verification under typhoon weather. In the first stage, the economically optimal reserve capacity is determined by maximizing the comprehensive benefit of the power system. In the second stage, this reserve capacity is rigorously tested against the typhoon scenarios from Section 2.1. If the system fails to meet the N − 1 security criterion, the reserve capacity is incrementally added and the verification is repeated. This iterative process ensures the final planned reserve capacity is both economical and secure against the extreme typhoon weather.

2.2.1. Investment Decision Model for Reserve Planning Based on Cost-Benefit Analysis

The initial investment decision model for reserve capacity is based on cost-benefit analysis [13]. The objective is to determine the reserve capacity r that maximizes the comprehensive benefit f(r) of the power system. The comprehensive benefit is defined as the difference between the reliability benefit B(r) and the reserve-related cost C(r):
max f ( r ) = B ( r ) C ( r )
The reserve-related cost C(r) includes the capital cost of constructing reserve capacity and the change in operational cost of the power system:
C ( r ) = C cap ( r ) + C op ( r ) C op ( 0 )
where C cap r represents the capital cost of constructing reserve capacity r. It is annualized over the planning year using the uniform annual value method. C op ( 0 ) and C op ( r ) represent the operational costs of all units in the system before and after applying the reserve capacity r, respectively. These costs, which include fuel, operation, maintenance, and environmental costs, are calculated using the SPS method [28] for the planning year.
The reliability benefit B(r) represents the economic value of the improvement in power system reliability achieved through the reserve capacity r. It is quantified as the reduction in the reliability cost:
B ( r ) = X ( 0 ) X ( r )
where X(0) and X(r) are the system reliability costs before and after applying the reserve capacity r, respectively. The reliability cost is calculated based on the Expected Energy Not Supplied (EENS) index, which is obtained via SMCS for the planning year. The simulation is deemed to have converged and is terminated when the coefficient of variation of the EENS estimate falls below a predefined threshold, typically set at 5%, to ensure the stability and statistical reliability of the results [29]. The EENS is then monetized by multiplying it with the value of lost load (VOLL) to represent the economic impact of outages [29].
The optimal reserve capacity r* is determined as the point at which the comprehensive benefit f(r) reaches its maximum. This decision is guided by the principle of marginal benefit-cost equilibrium, which asserts that it is economically rational to increase reserve capacity if the marginal benefit ∂B(r)/∂r exceeds the marginal cost ∂C(r)/∂r. The comprehensive benefit f(r) is maximized at the point where the marginal benefit equals the marginal cost. Therefore, the optimal reserve capacity r* is identified by evaluating f(r) across a range of reserve capacities and selecting the value that yields the maximum comprehensive benefit.

2.2.2. N − 1 Security Verification Under Typhoon Scenarios Based on HTSPS

The economically optimal reserve capacity identified in the first stage then undergoes the N − 1 security verification. This stage employs HTSPS to assess whether the planned reserve is adequate to withstand the typhoon scenarios. The core of this verification is an optimization model designed to check for any potential load shedding under N − 1 contingencies during the 96 h typhoon events.
Let Ω be the set of all typhoon scenarios generated as described in Section 2.1. The objective of the model is to minimize the total load shedding of each typhoon scenario ω ∈ Ω under N − 1 generating unit contingencies:
min t T k K P L S , ω , t , k
where T represents the set of hourly time steps within the 96 h typhoon scenario. K represents the set of N − 1 generating unit contingencies. P L S , ω , t , k is the load shedding in scenario ω at hour t under contingency k.
The optimization is subject to a set of operational constraints:
  • System power balance constraint
At each hour t in scenario ω, the total power generated must match the system load to maintain the power balance:
i G P G , i , ω , t + j W P W , j , ω , t + P R , ω , t = P L , ω , t P L S , ω , t
where P G , i , ω , t and P W , j , ω , t represent the power outputs of conventional generating unit i and wind farm j at time t, respectively. P R , ω , t represents the reserve power dispatched at time t, subject to 0 P R , ω , t r . P L , ω , t is the load demand, and P L S , ω , t is the load shedding;
  • Conventional generating unit constraints
Each conventional generating unit must operate within its technical output limits:
P G , i min X i , t P G , i , ω , t P G , i max X i , t
where P G , i min and P G , i max denote the minimum and maximum output limits of unit i, and u i , t is a binary variable indicating whether unit i is up ( X i , t = 1) or down ( X i , t = 0) at time t.
The change in output of conventional unit between consecutive time steps is limited by its ramp rate constraints:
R i down P G , i , ω , t P G , i , ω , t 1 R i up
where R i up and R i down are the maximum ramp-up and ramp-down rates of unit i, respectively.
Each conventional generating unit must be subject to the minimum up and down time constraints:
Y i , t + j = 1 T i up Z i , t + j 1 Z i , t + j = 1 T i down Y i , t + j 1
where Y i , t and Z i , t are binary variables representing the start-up and shut-down decisions of unit i at time t, respectively. That is, Y i , t = 1 indicates that unit i is started up at time t, while Z i , t = 1 indicates it is shut down. T i up and T i down are the minimum up and down times for unit i.
In addition, the logical relationship between unit status and decisions must satisfy
X i , t X i , t 1 Y i , t + Z i , t = 0 X i , t X i , t 1 + Y i , t 0 X i , t + X i , t 1 + Y i , t 2 X i , t X i , t 1 + Z i , t 0 X i , t + X i , t 1 + Z i , t 2
  • Wind power output constraint
The dispatched power from wind farm j cannot exceed its maximum available power:
0 P W , j , ω , t P W , j , ω , t max
where P W , j , ω , t max represents the theoretical maximum wind power at time t, derived from the meteorological data of the typhoon scenario and calculated using the wind power model introduced in Equation (11);
  • N − 1 power balance constraint
For each contingency k (the outage of a single generating unit), the system must be able to re-dispatch and achieve new power balance. To guarantee model feasibility, a slack variable P L S , ω , t N     1 , τ   is introduced to allow for load shedding when an N − 1 contingency occurs. The power balance constraint for the τ-th N − 1 scenario is formulated as
i G P G , i , ω , t χ i τ + j W P W , j , ω , t χ i τ + P R , ω , t = P L , ω , t P L S , ω , t N 1 , τ
where χ i τ is the availability index function in the τ-th N − 1 scenario, with χ i τ = 1 indicating that unit or wind farm i remains operational, and χ i τ = 0 indicating failure. Additionally, the P L S , ω , t N     1 , τ   is subject to 0 ≤ P L S , ω , t N     1 , τ   P L , ω , t .
The given reserve capacity r is considered to have satisfied the security verification only if the objective function (i.e., Equation (16)) is zero, meaning no load shedding is required for any N − 1 contingency in any of the simulated typhoon scenarios. If the objective value is non-zero, it indicates that the reserve capacity r is insufficient. In this case, the reserve is incrementally increased, and the verification process is repeated.

3. Test Results

To validate the effectiveness of the proposed two-stage reserve planning framework, a series of tests were conducted. This section first describes the setup of the case study, including the test system, wind farm configurations, typhoon data, and economic parameters. Then, it presents the results of the typhoon scenario generation and the subsequent reserve planning with security verification.

3.1. Case Study Description

The experiments were conducted on the modified IEEE RTS-79 test system [30]. The original system includes 32 conventional generating units with a total installed capacity of 3405 MW, and the peak load for the planning year was set to 3050 MW. To create a high-penetration wind power scenario, a 355 MW conventional unit was retired. Based on an assumed capacity credit of 25% for wind power [31], this retired unit was replaced by four offshore wind farms with a total capacity of 1400 MW.
The four offshore wind farms, with capacities of 300 MW, 300 MW, 400 MW, and 400 MW, are based on the Yangjiang Shapa Offshore Wind Farms and the Nanpeng Island Offshore Wind Farms [32,33], as detailed in Table 1. The parameters for the wind turbines are listed in Table 2. For the typhoon impact assessment, the radius of the circular impact zone R imp was set to 600 km. The historical typhoon data was sourced from the Typhoon Website of China Meteorological Administration [25], encompassing all the tropical cyclones that have affected Guangdong Province since 1949.
The economic parameters used in the cost-benefit analysis are given in Table 3 [34]. As VOLL varies by region, a representative value from [34] was adopted to provide a consistent reference for the analysis. The planned reserve capacity was treated as a new generating unit for investment calculation purposes.
All optimization and calculation were implemented in the MATLAB (R2024b, The MathWorks, Inc., Natick, MA, USA). The HTSPS for the security verification was modeled using YALMIP.

3.2. Typhoon Scenario Generation

This section applies the source-load scenario generation method detailed in Section 2.1, to produce diverse and realistic typhoon events for the subsequent reserve planning.

3.2.1. Reconstructed Typhoon Paths

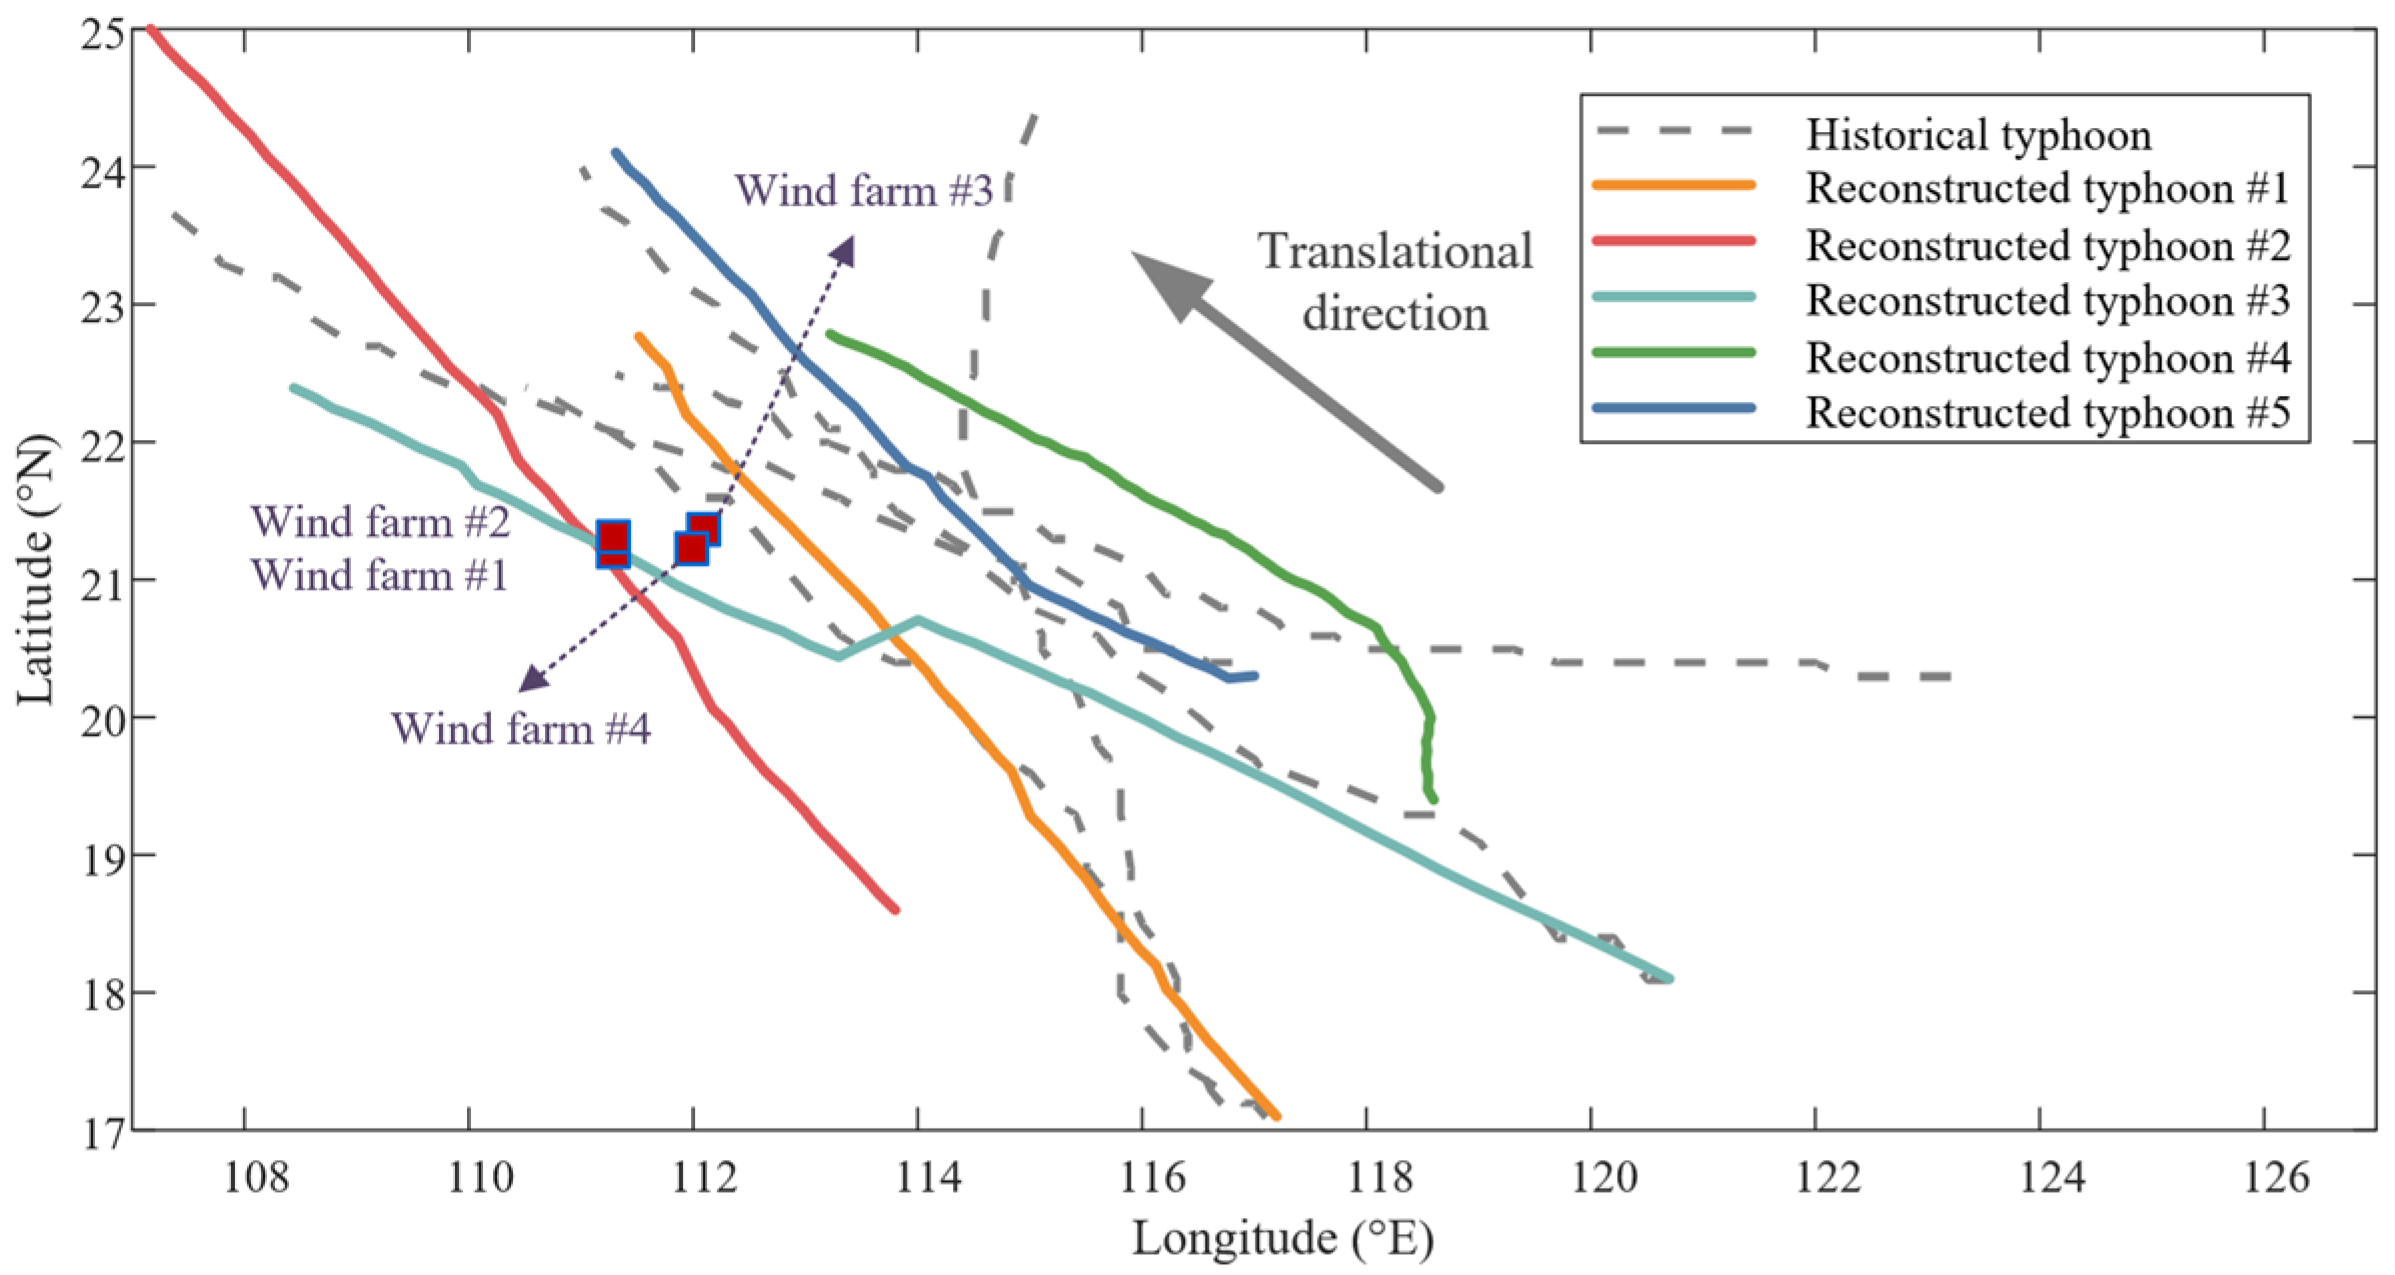
The MMCMC algorithm was utilized to generate typhoon paths. Figure 3 illustrates five representative historical typhoon paths and five reconstructed paths. The locations of the four offshore wind farms are also marked to provide geographical context.
A visual comparison reveals strong consistency between the historical and reconstructed typhoon paths. The reconstructed paths originate from typical genesis locations and generally follow the prevalent northwestward track towards the coastline, demonstrating that the model successfully captures the fundamental spatiotemporal characteristics of typhoons in this region.
Crucially, the reconstructed paths are not mere replicas of historical typhoon events but represent a diverse set of future scenarios. These paths exhibit significant variations in translational speed, track curvature, and proximity to the wind farms. For instance, reconstructed typhoons #2 and #3 pass directly over the wind farm, representing the worst-case direct-hit event. In contrast, reconstructed typhoon #4 remains further from the wind farm, suggesting a less severe impact. This diversity is essential for conducting security verification that accounts for the inherent uncertainty of typhoons.
To rigorously validate the performance of the algorithm and justify its parameter selection, comprehensive evaluation was conducted against both historical data and the conventional Vickery-based empirical algorithm [35]. A critical parameter in the MMCMC -based algorithm is the discretization level N state , which balances model fidelity against complexity. To determine an appropriate value, the sensitivity analysis was performed by varying N state at 5, 10, and 20.
The ability of the proposed algorithm to reconstruct the typhoon intensity distribution was evaluated first. Figure 4 compares the probability density function (PDF) of the central pressure. Overall, the proposed MMCMC algorithm provides a closer match to the historical distribution, with smaller deviation in capturing the shape and peak when compared to the Vickery algorithm. The sensitivity analysis further reveals that the parameter N state significantly affects the performance of algorithm. Among the tested values, the algorithm with N state = 10 demonstrates the best fit to the historical data, while N state = 5 yields the poorest results, and N state = 20 provides an intermediate fit. These findings confirm the effectiveness of the MMCMC algorithm and identify N state = 10 as the most suitable choice.
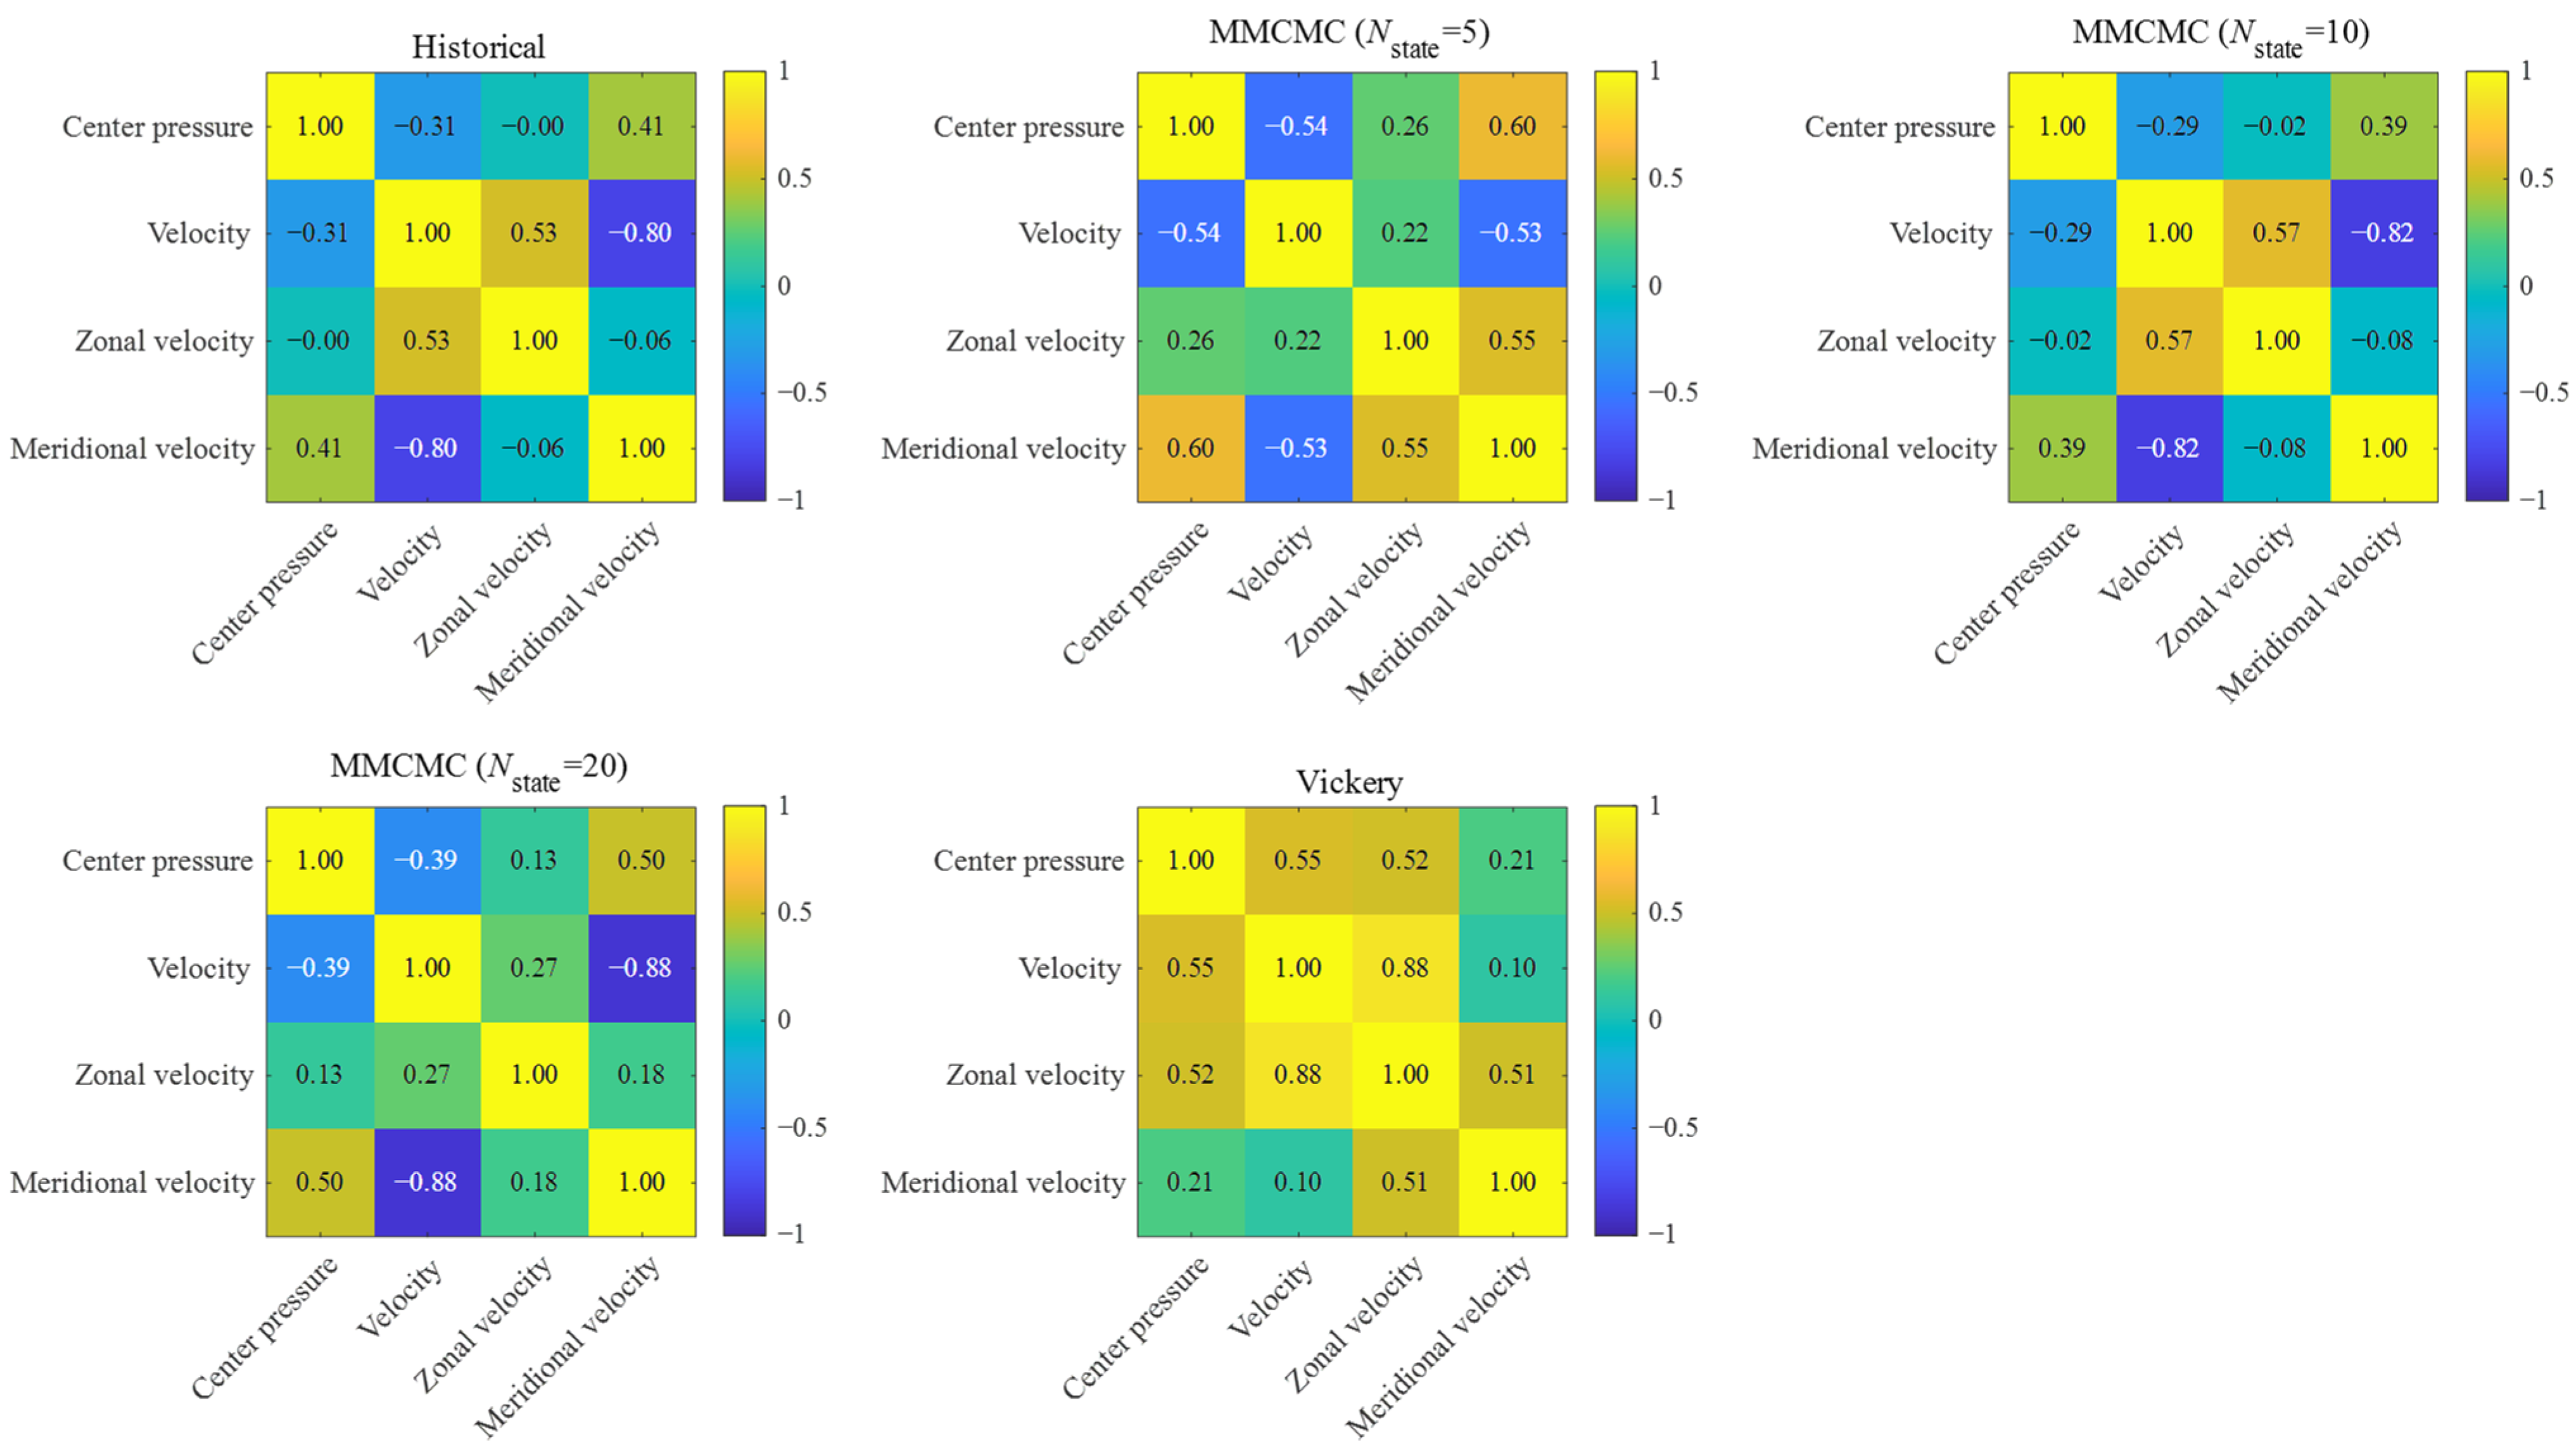
Beyond reconstructing the distribution of individual variables, a key strength of the proposed algorithm lies in its ability to capture the correlation among them. To verify this capability, correlation coefficient matrices of key variables were analyzed, as illustrated in Figure 5. The results show that the MMCMC algorithm preserves the complex correlation structures observed in the historical data much more effectively than the Vickery algorithm. Furthermore, within the sensitivity analysis of the MMCMC algorithm, the correlation matrix obtained with N state = 10 provides the closest match to the historical data, thereby reinforcing its selection as the optimal choice.
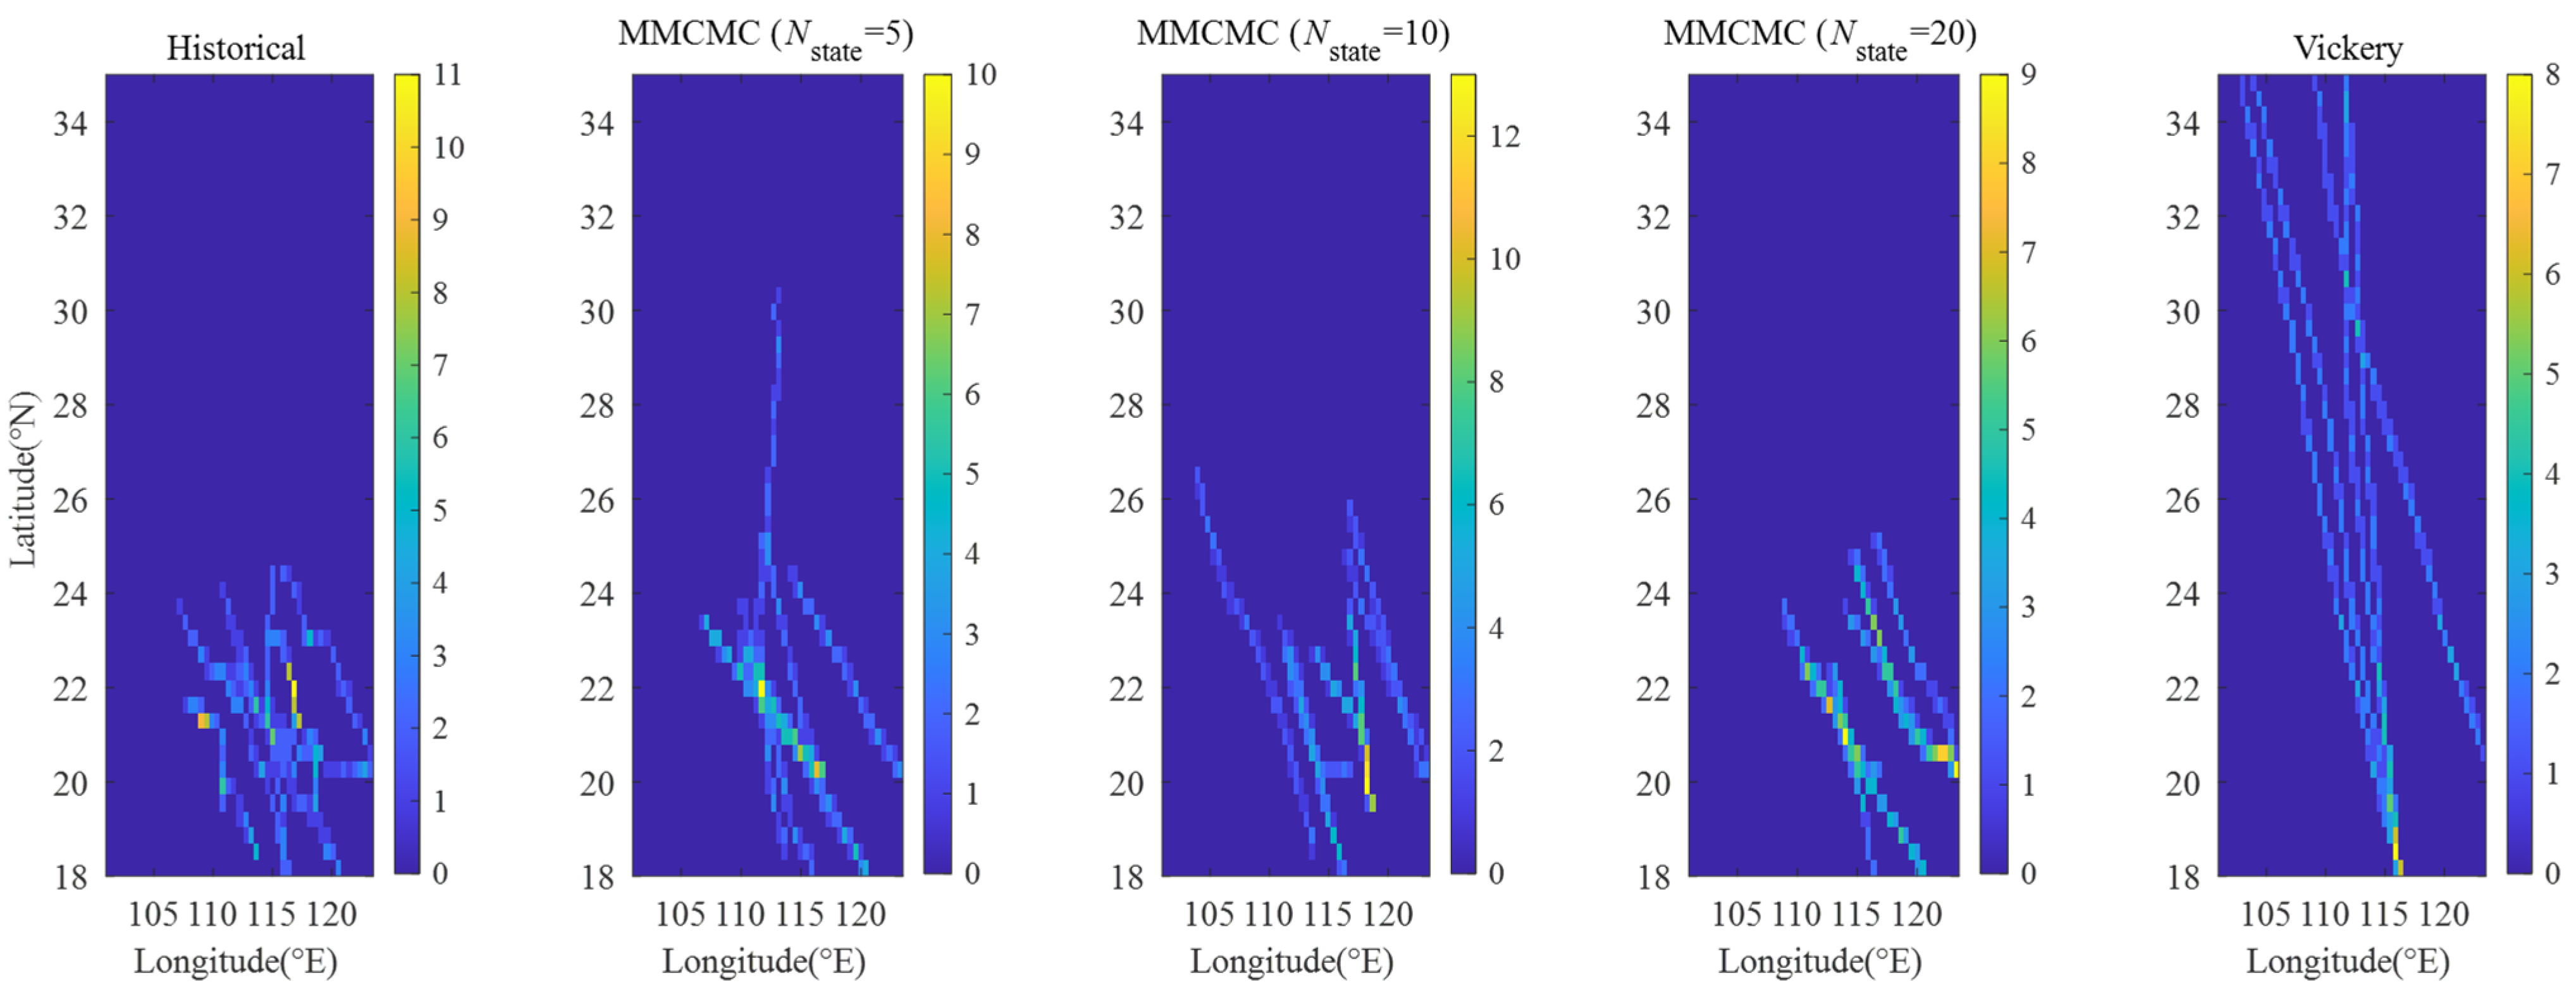
Finally, the spatial distribution of the generated paths was compared against historical data, as shown in the spatial density heatmaps in Figure 6. Overall, the proposed MMCMC algorithm more accurately reproduces the spatial distribution of historical typhoons, while the Vickery algorithm fails to adequately capture these characteristics. Within the sensitivity analysis for the MMCMC algorithm, the results show that the heatmap generated with N state = 10 and 20 aligns most closely with the historical distribution.
In summary, the results confirm that the path reconstruction method successfully generates a rich and credible ensemble of typhoon paths. In addition, through this comprehensive validation based on intensity distribution, variable correlation, and spatial distribution, N state = 10 was identified as the optimal parameter. This provides a solid foundation for the subsequent analysis.

3.2.2. Generated Source-Load Scenarios

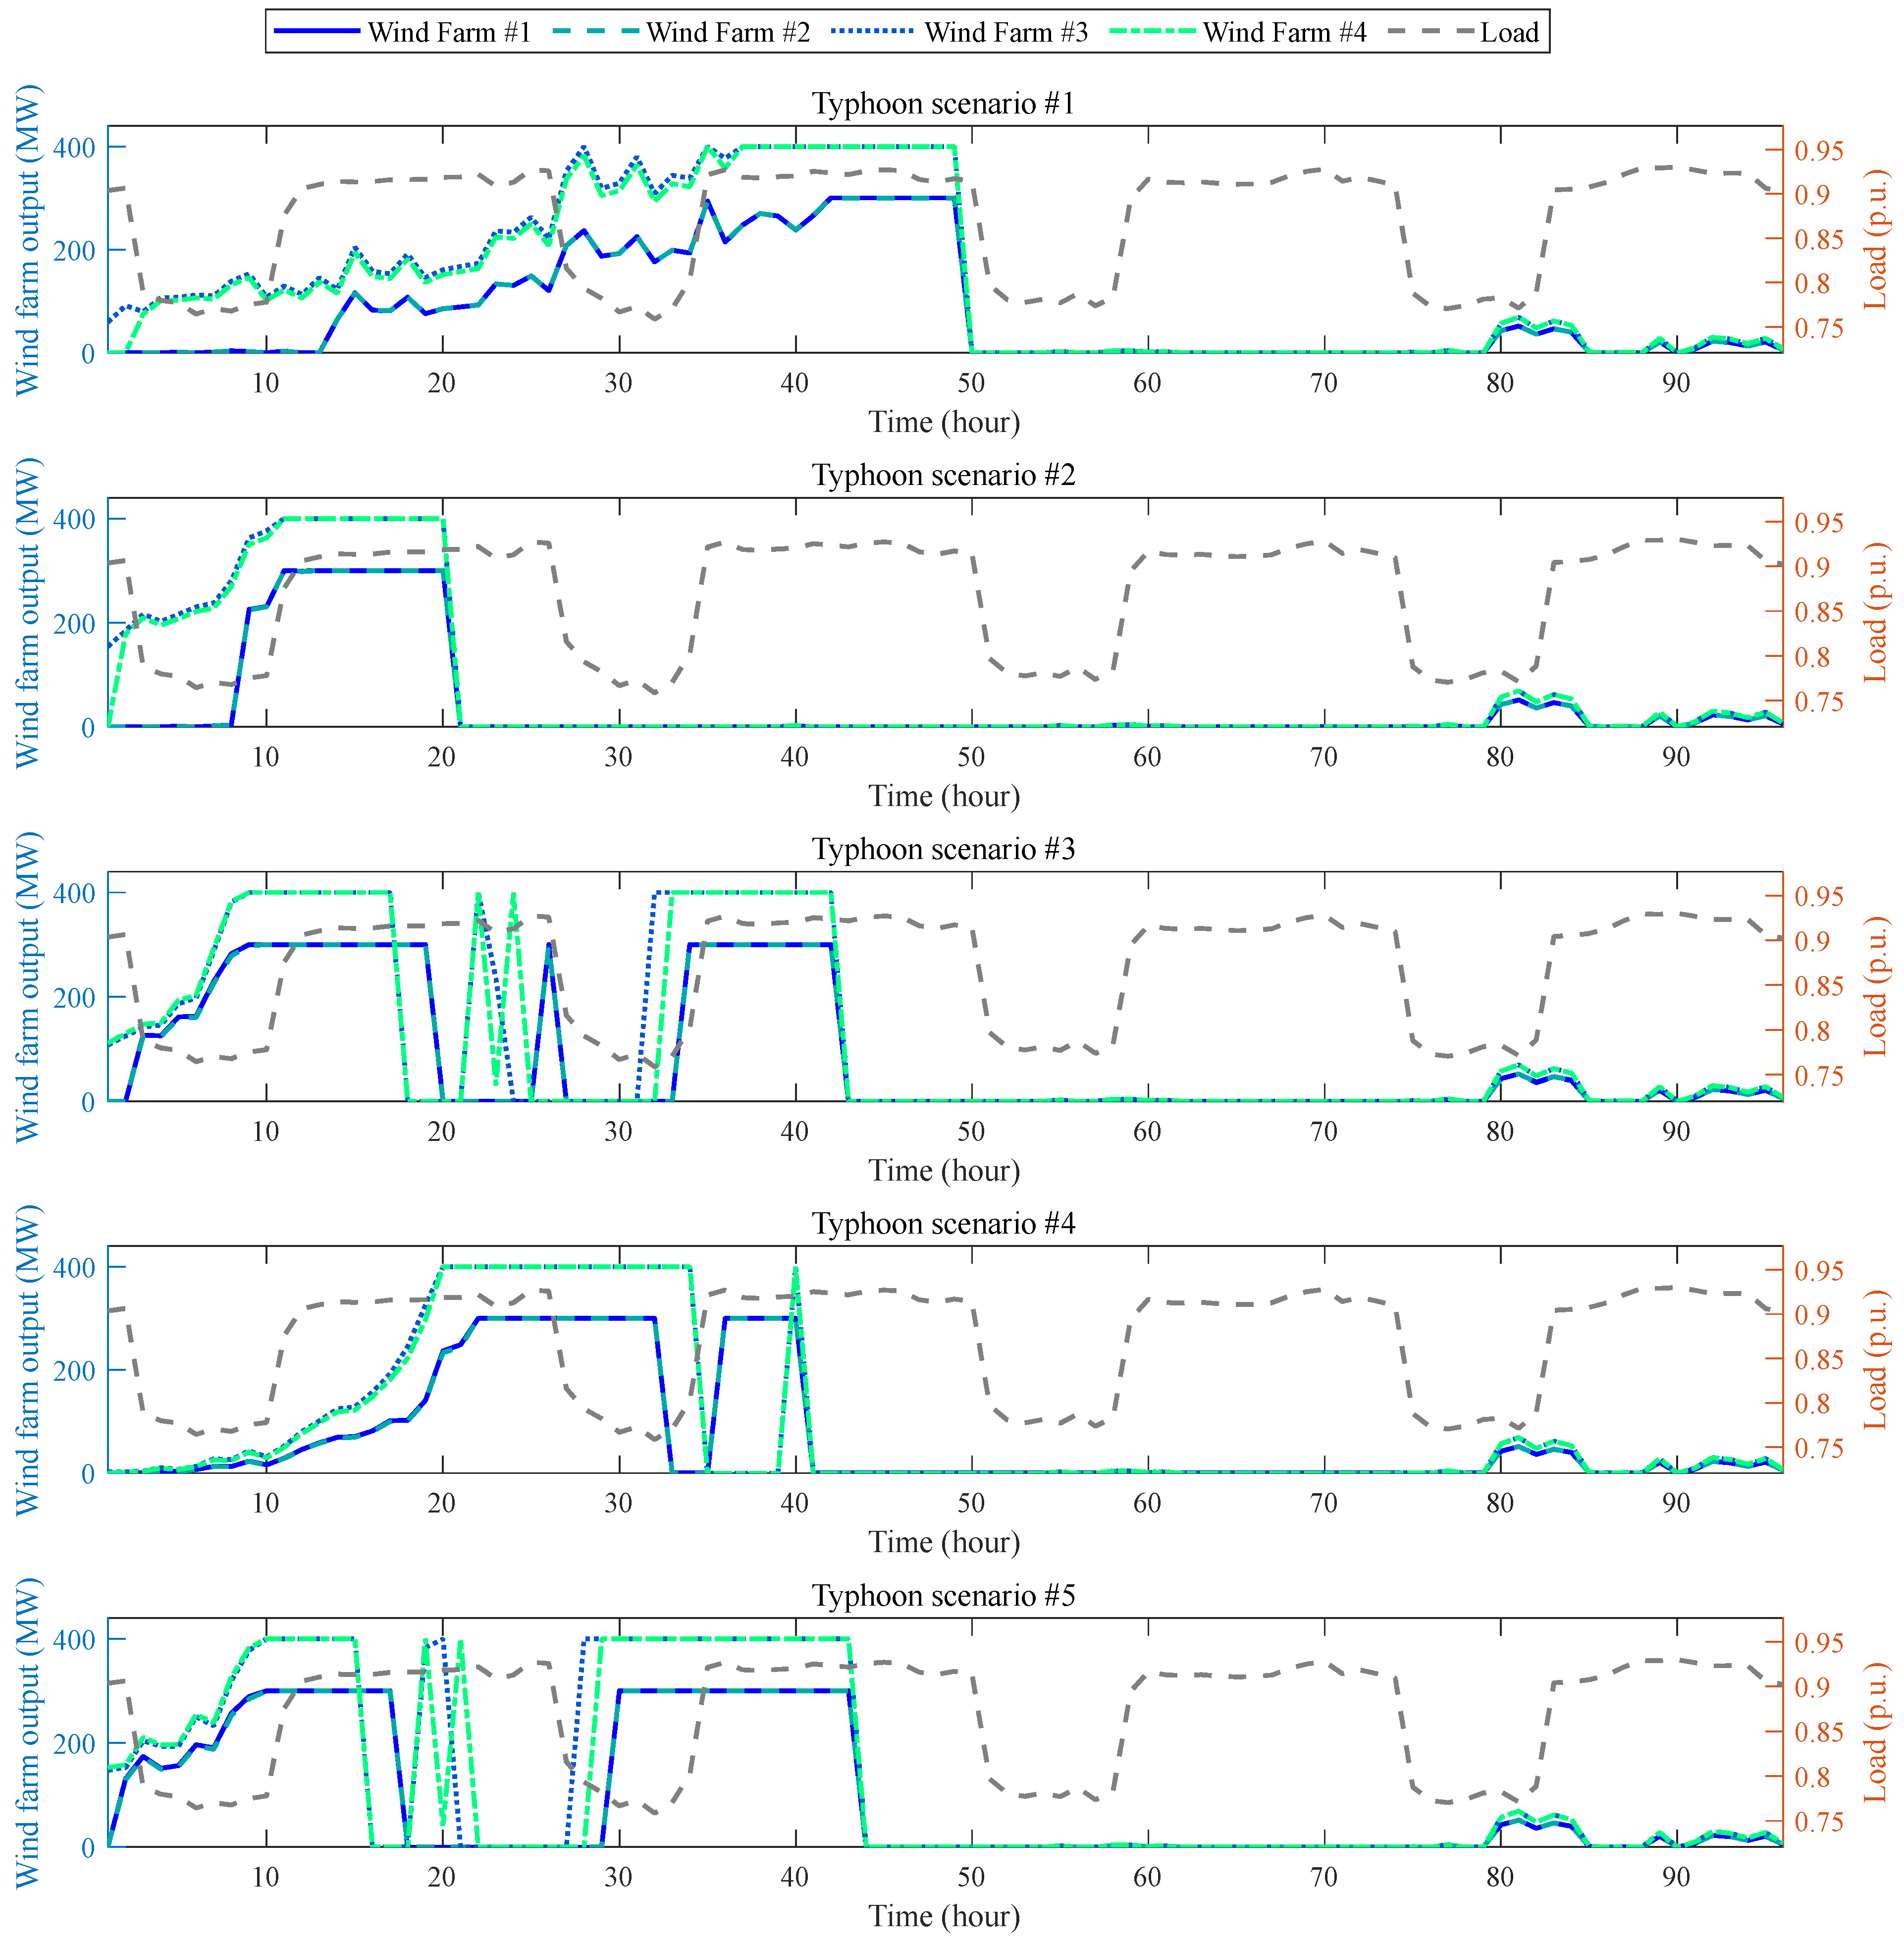
Based on the reconstructed typhoon paths, the corresponding 96 h source-load scenarios were generated. Figure 7 presents the test results for the five scenarios, with each subplot illustrating the power outputs of the four wind farms alongside the system load level.
The results reveal highly dynamic patterns of wind power generation during typhoon events. While each scenario exhibits distinct features, the overall output trend commonly follows a lifecycle. To illustrate this clearly, typhoon scenario #5 is selected as a representative case, based on which the following five typical phases are identified:
  • Initial ramp-up phase (0–15 h): As the typhoon approaches from a distance, wind speeds gradually increase, leading to a steady rise in the power output of the wind farms;
  • High volatility phase (15–22 h): During this phase, the wind speeds fluctuate around the 25 m/s cut-out threshold. This results in highly unstable output, with the wind farms shifting between full power output and zero;
  • Sustained shutdown phase (22–27 h): As the center of typhoon passes near to the wind farms, wind speeds consistently exceed the cut-out threshold. As a result, the wind farms are forced into complete shutdown, leading to a total loss of 1400 MW of generation capacity;
  • Stable output phase (27–43 h): As the typhoon moves away, wind speeds fall below the cut-out threshold but remain high, enabling the wind farms to operate at their rated capacity;
  • Low output phase (43–96 h): After the typhoon has completely passed, wind speeds drop to very low levels. Consequently, wind power generation becomes minimal, reflecting the calm atmospheric conditions that typically follow a typhoon event.
While the overall lifecycle pattern is generally consistent, the timing and duration of each phase vary significantly depending on the specific path and intensity of the typhoon. For instance, in typhoon scenario #1, the typhoon intensity is relatively low, resulting in a continuous gradual increase in wind farm output during the typhoon period, followed directly by the stable output phase and low output phase, with no experience of the high volatility phase and sustained shutdown phase.
The analysis reveals two critical periods for supply adequacy: high-volatility phase and low-output phase. During the high-volatility phase, severe and unpredictable power fluctuations occur while system demand remains high, posing significant challenges to maintaining stable power supply. Moreover, the low-output phase results in a prolonged period of insufficient power supply. These large-scale imbalances between supply and demand highlight the key role of reserve capacity in ensuring the supply security of the system.

3.3. Two-Stage Reserve Planning

This section presents the results of the two-stage reserve planning framework. The first stage identifies the economically optimal reserve capacity based on the cost-benefit analysis for the planning year. The second stage then verifies the adequacy of this reserve capacity against the N − 1 contingencies within the generated typhoon scenarios.

3.3.1. Cost-Benefit Analysis for Reserve Planning

To determine the economically optimal reserve capacity, the cost-benefit analysis was conducted across a range of reserve capacities. The analysis began with the base reserve capacity of 400 MW, corresponding to the capacity of the largest generating unit, and the reserve capacity was incrementally increased in steps of 20 MW. For each reserve capacity, the reserve-related cost and reliability benefit were calculated using the models described in Section 2.2.1.
The results of the cost-benefit analysis are presented in Table 4. As the planned reserve capacity increases, the reserve-related cost shows steady, near-linear increase due to the capital cost for additional reserve capacity. Meanwhile, the reliability benefit also increases with additional reserve, but this increase follows the principle of diminishing marginal returns, where the incremental benefit gained from each additional MW of reserve becomes smaller as the reliability of the system improves.
The comprehensive benefit, defined as the net benefit obtained by subtracting the reserve-related cost from the reliability benefit, initially increases with increasing reserve capacity, reaches a peak, and then declines. As shown in Table 4, the maximum comprehensive benefit of USD 1.4413 × 10⁸ is achieved at the reserve capacity of 480 MW. Accordingly, 480 MW represents the economically optimal reserve capacity for the system for the planning year.

3.3.2. N − 1 Security Verification

In the second stage of the framework, the N − 1 security verification was conducted across increasing reserve capacities under the five typhoon scenarios detailed in Section 3.2.2. This verification aimed to determine the minimum reserve capacity required to eliminate load shedding under all N − 1 contingencies.
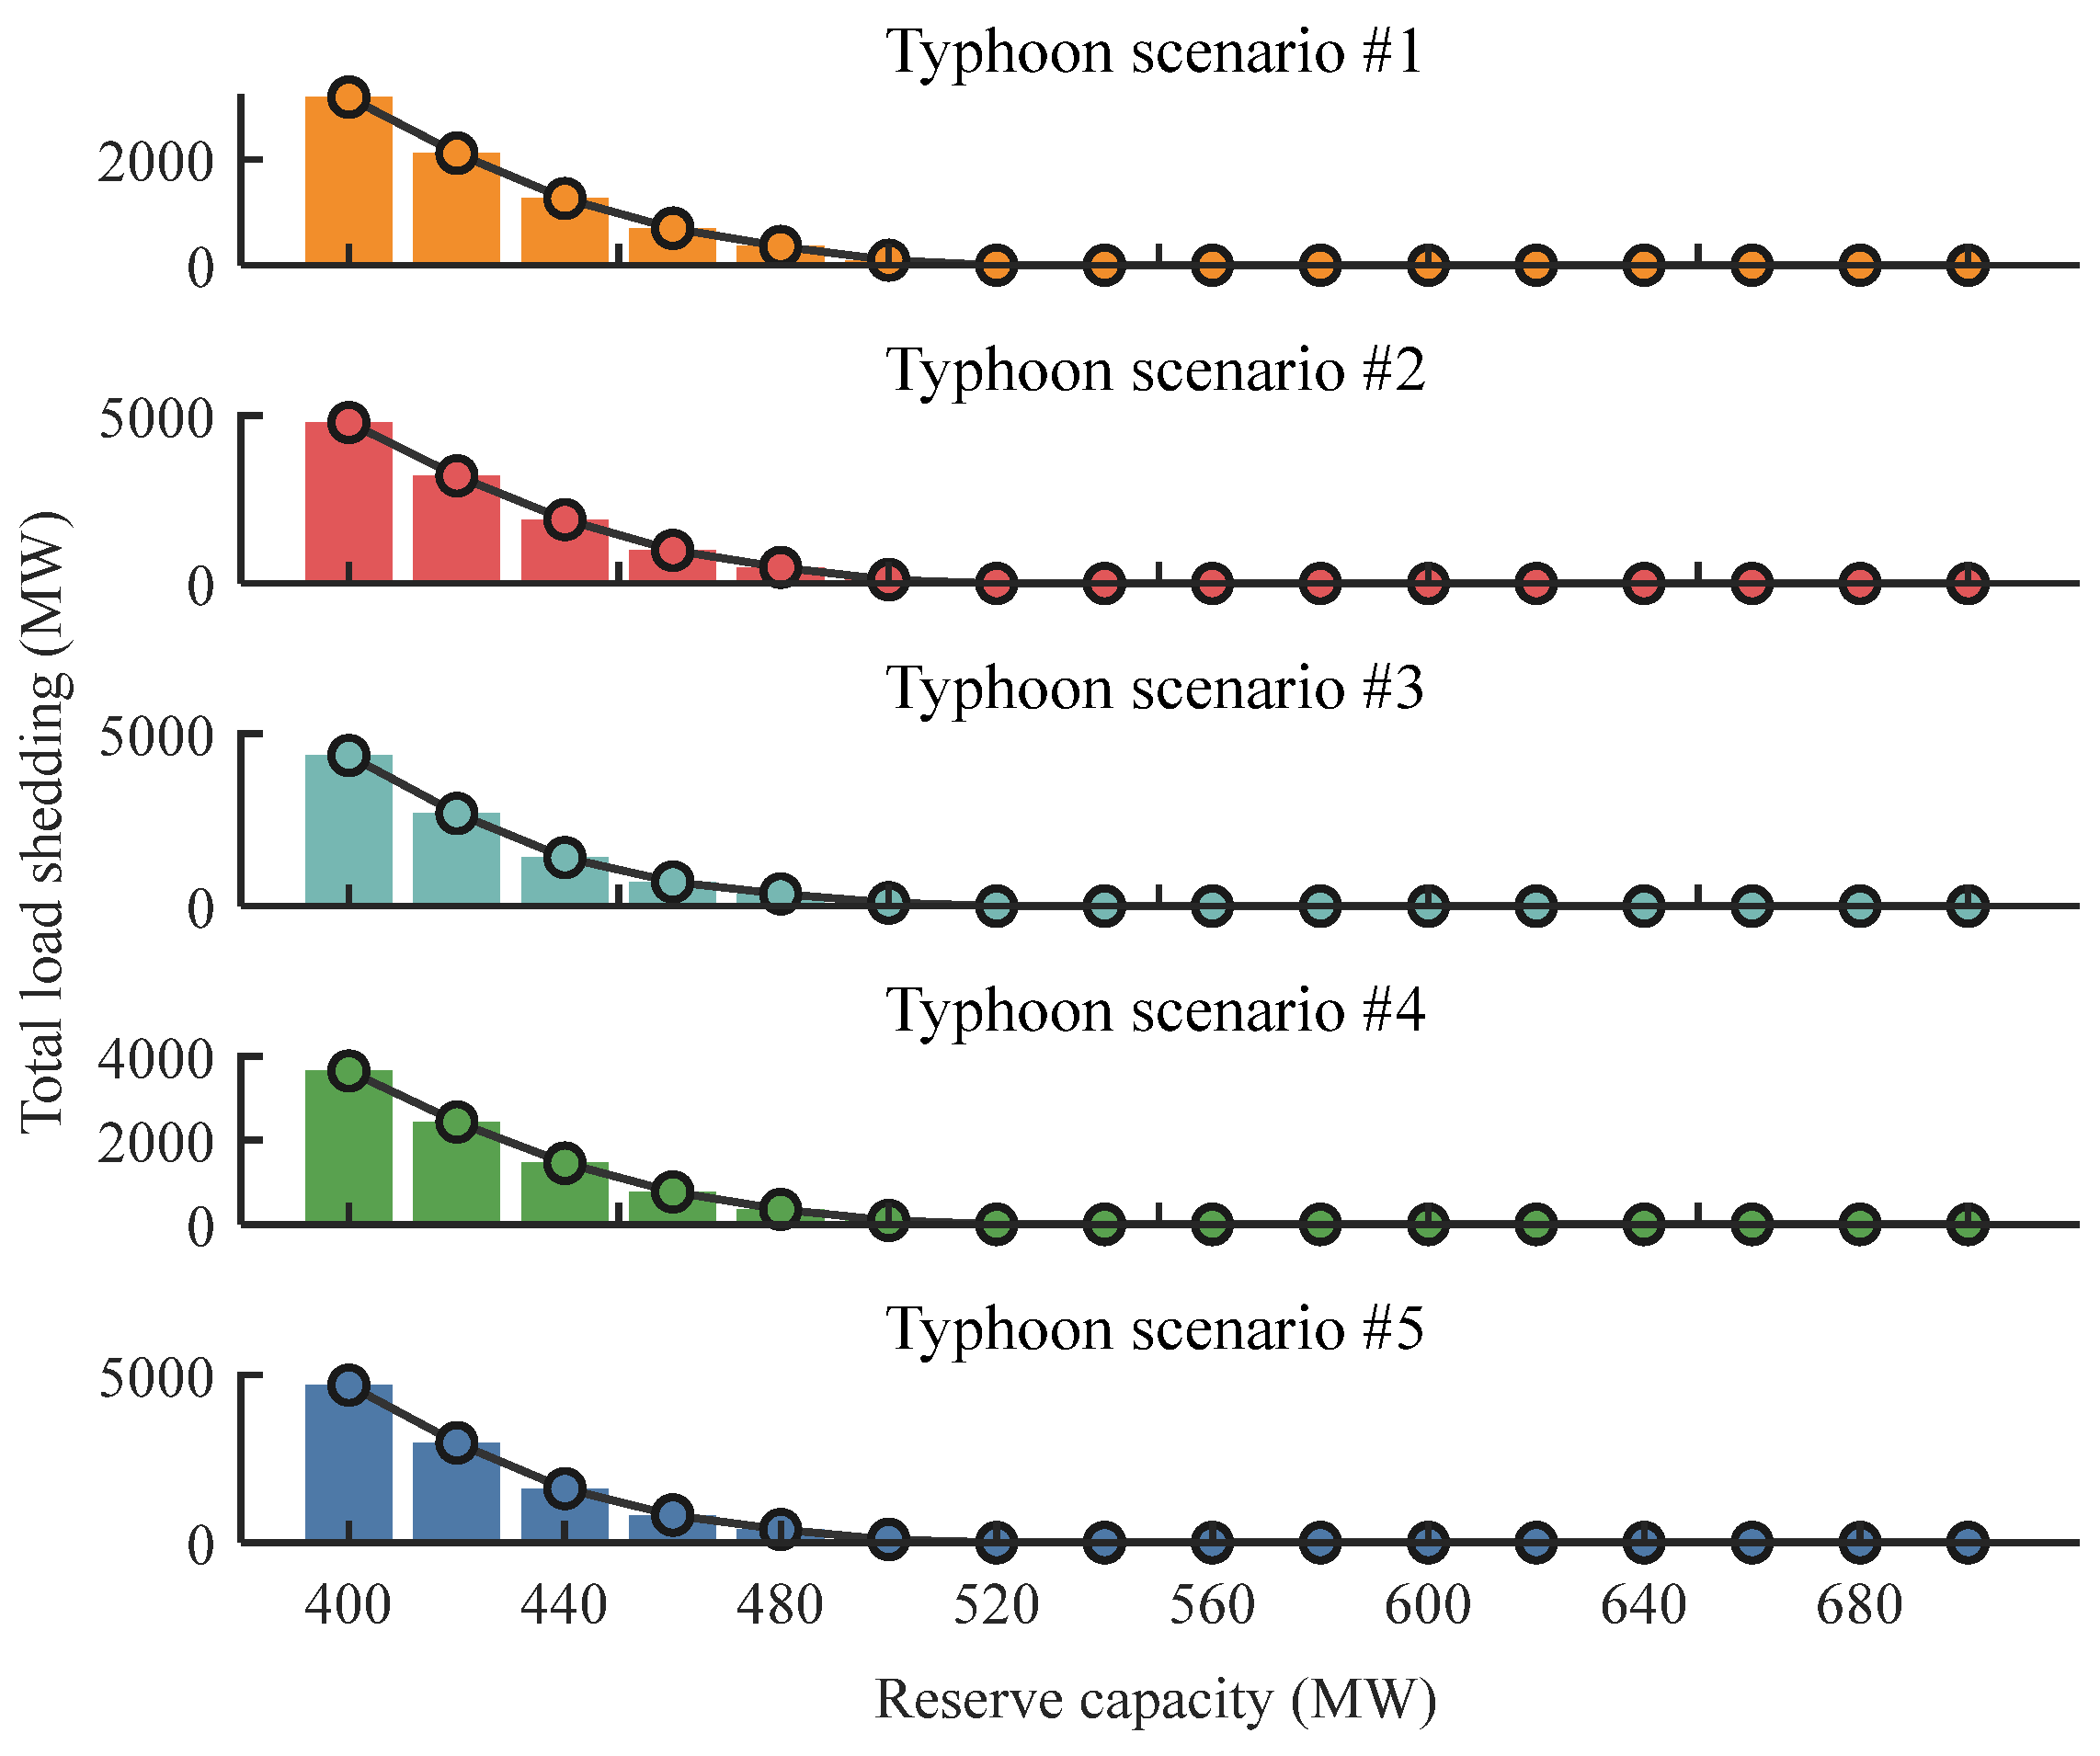
Figure 8 illustrates the total load shedding of N − 1 security verification for five typhoon scenarios as a function of reserve capacity. The results demonstrate that different typhoon scenarios impose varying levels of stress on the system. Typhoon scenarios #2, #3, and #5 are the most severe, leading to substantial load shedding at lower reserve capacities. This is attributed to the path and intensity of the typhoon, which create the significant power deficit when combined with N − 1 contingencies.
As expected, increasing reserve capacity reduces the load shedding in all scenarios. However, the key finding is that the economically optimal reserve capacity of 480 MW is insufficient to guarantee N − 1 security. At this capacity, load shedding is still observed across all scenarios, indicating a high risk of system unreliability under extreme conditions.
Further verification reveals that the reserve capacity of 520 MW is required to reduce the N − 1 load shedding to zero across all scenarios. To refine this result, a detailed verification was conducted with the smaller step size of 1 MW in the reserve range. This more granular calculation revealed that the reserve capacity of 516 MW is the precise minimum required to reduce the N − 1 load shedding to zero across all scenarios. This capacity thus represents the minimum reserve level that satisfies the N − 1 security criterion under extreme weather conditions.
To explicitly highlight the necessity and superior resilience of the proposed two-stage framework, the comparative analysis was conducted against both the deterministic N − 1 criterion and the conventional single-stage reserve planning framework [13,14]. The deterministic method sets the reserve capacity as equal to the largest single generating unit, which is 400 MW in this study. This conventional framework determines optimal reserve capacity solely by maximizing comprehensive benefit, omitting the scenario-based security verification that is central to our second stage, resulting in 480 MW.
The results of both frameworks are summarized in Table 5. The comparison clearly demonstrates the limitations of conventional methods when faced with extreme weather. The deterministic method, while simple, is grossly inadequate, resulting in a severe load shedding of 4937.66 MW under the typhoon scenarios. The single-stage framework, while maximizing the comprehensive benefit at 480 MW, still fails to ensure operational security, leading to a significant load shedding of 1920.39 MW. In contrast, the proposed two-stage framework integrates N − 1 security verification under typhoon scenarios, demonstrating that an incremental 36 MW reserve is required to fully eliminate load shedding during these typhoon events. Although this adjustment reduces the comprehensive benefit by 0.18%, which is from USD 1.4413 × 10⁸ to USD 1.4387 × 10⁸, the minimal economic trade-off is justified by the critical enhancement of system security.
This analysis highlights a notable limitation of purely economic optimization frameworks, which fail to guarantee security against high-impact, low-probability events. By combining economy with rigorous security validation, the proposed two-stage framework can obtain more robust solution for reserve planning, especially for coastal power systems with high penetration of wind energy.

4. Conclusions

This paper proposed an innovative two-stage reserve planning framework to address the critical challenge of ensuring power system security in coastal regions with high wind power penetration under the threat of typhoons. The methodology integrates a novel typhoon scenario generation technique with a planning process that sequentially optimizes for economy and verifies for operational security, aiming to identify a planning reserve that is both cost-effective and resilient. The main findings of this paper are as follows:
  • The proposed MMCMC-based method successfully reconstructs a diverse set of spatiotemporally coherent typhoon paths. Compared with conventional empirical models, this method explicitly captures the dynamic evolution of key meteorological variables, such as central pressure and translational velocity. As a result, it generates high-impact and physically plausible source-load scenarios, which provide a solid foundation for rigorous security verification;
  • The proposed two-stage planning framework also proves effective for reserve decision-making under extreme weather conditions. While the cost-benefit analysis identifies 480 MW as the economically optimal reserve capacity, the subsequent N − 1 security verification under typhoon scenarios shows that this level is insufficient to prevent load shedding. A reserve of 520 MW is needed to ensure system reliability. Although this adjustment leads to a minor 0.44% reduction in terms of economic benefit, it significantly enhances system resilience. These findings highlight the value of combining economic optimization with scenario-based security assessment to support robust reserve planning under extreme typhoon weather.

Author Contributions

Conceptualization, J.T. and J.W.; methodology, H.C., S.P. and J.W.; software, H.C., Q.S. and J.W.; validation, W.P. and Q.S.; formal analysis, H.C. and S.P.; investigation, W.P. and J.W.; resources, J.T.; data curation, H.C.; writing—original draft preparation, H.C.; writing—review and editing, Q.S. and J.T.; visualization, W.P.; supervision, J.T.; project administration, S.P. and J.T.; funding acquisition, S.P. All authors have read and agreed to the published version of the manuscript.

Funding

This research was funded by the Key Science and Technology Project of China Southern Power Grid, grant number GDKJXM20240053.

Data Availability Statement

Data are available on reasonable request. The data are not publicly available due to privacy restrictions.

Conflicts of Interest

Author Sui Peng was employed by the company Guangdong Power Grid Corporation. The remaining authors declare that the research was conducted in the absence of any commercial or financial relationships that could be construed as a potential conflict of interest.

References

  1. Li, D.; Zhao, X.; Xu, W.; Ge, C.; Li, C. A Novel Renewable Energy Scenario Generation Method Based on Multi-Resolution Denoising Diffusion Probabilistic Models. Energies 2025, 18, 3781. [Google Scholar] [CrossRef]
  2. National Energy Administration. National Energy Administration Releases 2024 National Power Industry Statistics. 2025. Available online: https://www.nea.gov.cn/20250121/097bfd7c1cd3498897639857d86d5dac/c.html (accessed on 24 July 2025).
  3. National Energy Administration. China’s Offshore Wind Power Capacity Reaches 39.1 GW. 2024. Available online: https://www.nea.gov.cn/2024-11/22/c_1212407828.htm (accessed on 24 July 2025).
  4. Banzo, M.; Ramos, A. Stochastic Optimization Model for Electric Power System Planning of Offshore Wind Farms. IEEE Trans. Power Syst. 2011, 26, 1338–1348. [Google Scholar] [CrossRef]
  5. Liang, Z.; Chung, C.Y.; Zhang, W.; Wang, Q.; Lin, W.; Wang, C. Enabling High-Efficiency Economic Dispatch of Hybrid AC/DC Networked Microgrids: Steady-State Convex Bi-Directional Converter Models. IEEE Trans. Smart Grid 2025, 16, 45–61. [Google Scholar] [CrossRef]
  6. Ti, B.; Li, G.; Zhou, M.; Wang, J. Resilience Assessment and Improvement for Cyber-Physical Power Systems Under Typhoon Disasters. IEEE Trans. Smart Grid 2022, 13, 783–794. [Google Scholar] [CrossRef]
  7. He, J.; Hu, Z.; Liu, Y.; Bao, Z.; Zhu, Y. Dispatch Strategy for the Power System with Large Offshore Wind Power Integration under a Typhoon: A Two-Stage Sample Robust Optimization Approach. IEEE Trans. Ind. Appl. 2025, 61, 4636–4648. [Google Scholar] [CrossRef]
  8. Qian, M.; Chen, N.; Chen, Y.; Chen, C.; Qiu, W.; Zhao, D.; Lin, Z. Optimal Coordinated Dispatching Strategy of Multi-Sources Power System with Wind, Hydro and Thermal Power Based on CVaR in Typhoon Environment. Energies 2021, 14, 3735. [Google Scholar] [CrossRef]
  9. Wang, Q.; McCalley, J.D. Risk and “N-1” Criteria Coordination for Real-Time Operations. IEEE Trans. Power Syst. 2013, 28, 3505–3506. [Google Scholar] [CrossRef]
  10. Lin, Z.; Hu, Z.; Song, Y. Distribution Network Expansion Planning Considering N−1 Criterion. IEEE Trans. Power Syst. 2019, 34, 2476–2478. [Google Scholar] [CrossRef]
  11. Younesi, A.; Shayeghi, H.; Safari, A.; Siano, P. A Quantitative Resilience Measure Framework for Power Systems Against Wide-Area Extreme Events. IEEE Syst. J. 2021, 15, 915–922. [Google Scholar] [CrossRef]
  12. Panteli, M.; Mancarella, P. Modeling and Evaluating the Resilience of Critical Electrical Power Infrastructure to Extreme Weather Events. IEEE Syst. J. 2017, 11, 1733–1742. [Google Scholar] [CrossRef]
  13. Li, Z.; Li, W.; Samson, S.Y.; Zhang, X.; Huang, L. Fast Frequency Response Reserve Planning for Power Systems Considering Homogeneous Extreme Risks. IEEE Trans. Ind. Appl. 2023, 59, 2314–2325. [Google Scholar] [CrossRef]
  14. Ding, Y.; Wang, P.; Goel, L.; Loh, P.C.; Wu, Q. Long-Term Reserve Expansion of Power Systems with High Wind Power Penetration Using Universal Generating Function Methods. IEEE Trans. Power Syst. 2011, 26, 766–774. [Google Scholar] [CrossRef]
  15. Ortega-Vazquez, M.A.; Kirschen, D.S. Optimizing the Spinning Reserve Requirements Using a Cost/Benefit Analysis. IEEE Trans. Power Syst. 2007, 22, 24–33. [Google Scholar] [CrossRef]
  16. Leite, D.S.A.M.; Sales, W.S.; Manso, L.A.F.; Vieira, L.C. Long-Term Probabilistic Evaluation of Operating Reserve Requirements with Renewable Sources. IEEE Trans. Power Syst. 2010, 25, 106–116. [Google Scholar] [CrossRef]
  17. Huang, Z.; Rosowsky, D.V.; Sparks, P.R. Hurricane Simulation Techniques for the Evaluation of Wind Speeds and Expected Insurance Losses. J. Wind Eng. Ind. Aerodyn. 2001, 89, 605–617. [Google Scholar] [CrossRef]
  18. Emanuel, K. Climate and Tropical Cyclone Activity: A New Model Downscaling Approach. J. Clim. 2006, 19, 4797–4802. [Google Scholar] [CrossRef]
  19. Hu, B.; Li, M.; Niu, T.; Zhou, P.; Li, Y.; Xie, K.; Li, C. Hardening planning of overhead distribution lines in typhoon-prone areas by considering the typhoon motion paths and the line load reliability. Int. J. Electr. Power Energy Syst. 2021, 129, 106836. [Google Scholar] [CrossRef]
  20. Huang, M.; Wang, Q.; Li, Q.; Jing, R.; Lin, N.; Wang, L. Typhoon wind hazard estimation by full-track simulation with various wind intensity models. J. Wind Eng. Ind. Aerodyn. 2021, 218, 104792. [Google Scholar] [CrossRef]
  21. Tu, S.; Chan, J.C.L.; Xu, J.; Zhong, Q.; Zhou, W.; Zhang, Y. Increase in tropical cyclone rain rate with translation speed. Nat. Commun. 2022, 13, 7325. [Google Scholar] [CrossRef]
  22. Yang, H.; Li, Y.; Lu, L.; Qi, R. First order multivariate Markov chain model for generating annual weather data for Hong Kong. Energy Build. 2011, 43, 1153–1162. [Google Scholar] [CrossRef]
  23. Liu, X.; Hou, K.; Jia, H.; Zhao, J.; Mili, L.; Jin, X. A Planning-Oriented Resilience Assessment Framework for Transmission Systems Under Typhoon Disasters. IEEE Trans. Smart Grid 2020, 11, 5431–5441. [Google Scholar] [CrossRef]
  24. Vickery, P.J.; Twisdale, L.A. Prediction of Hurricane Wind Speeds in the United States. J. Struct. Eng. 1995, 121, 1691–1699. [Google Scholar] [CrossRef]
  25. CMA Typhoon Real-Time Tracking System. Available online: http://typhoon.nmc.cn/web.html (accessed on 24 July 2025).
  26. Xie, K.; Jiang, Z.; Li, W. Effect of wind speed on wind turbine power converter reliability. IEEE Trans. Energy Convers. 2012, 27, 96–104. [Google Scholar] [CrossRef]
  27. Laudani, A.; Lozito, G.M.; Riganti Fulginei, F.; Salvini, A. On Training Efficiency and Computational Costs of a Feed Forward Neural Network: A Review. Comput. Intell. Neurosci. 2015, 2015, 818243. [Google Scholar] [CrossRef]
  28. Wang, X. Fundamentals of Power System Planning; China Electric Power Press: Beijing, China, 1994; pp. 61–83. [Google Scholar]
  29. Billinton, R.; Li, W. Reliability Assessment of Electric Power Systems Using Monte Carlo Methods; Springer Science+Business Media: New York, NY, USA, 1994. [Google Scholar]
  30. Probability Methods Subcommittee. IEEE Reliability Test System. IEEE Trans. Power Appar. Syst. 1979, PAS-98, 2047–2054. [CrossRef]
  31. Tapetado, P.; Usaola, J. Capacity credits of wind and solar generation: The Spanish case. Renew. Energy 2019, 143, 164–175. [Google Scholar] [CrossRef]
  32. Guangdong Provincial Department of Natural Resources Website. Available online: https://nr.gd.gov.cn/gkmlpt/content/4/4298/post_4298962.html (accessed on 24 July 2025).
  33. Guangdong Provincial Department of Natural Resources Website. Public Notice on Proposed Change of Sea Use for Yangxi Shapa Phase 5 Offshore Wind Farm Project (300 MW), Yangjiang, Guangdong Province. Available online: https://nr.gd.gov.cn/gkmlpt/content/4/4298/post_4298964.html (accessed on 24 July 2025).
  34. Qu, C.; Wang, X.; Zeng, P.; Xie, S. Long-term Reserve Planning and Decision Based on Conditional Cost-benefit Analysis. Proc. CSEE 2014, 34, 5642–5650. [Google Scholar] [CrossRef]
  35. Vickery, P.J.; Skerlj, P.F.; Twisdale, L.A. Simulation of hurricane risk in the US using empirical track model. Nat. Hazards Rev. 2000, 126, 1222–1237. [Google Scholar]
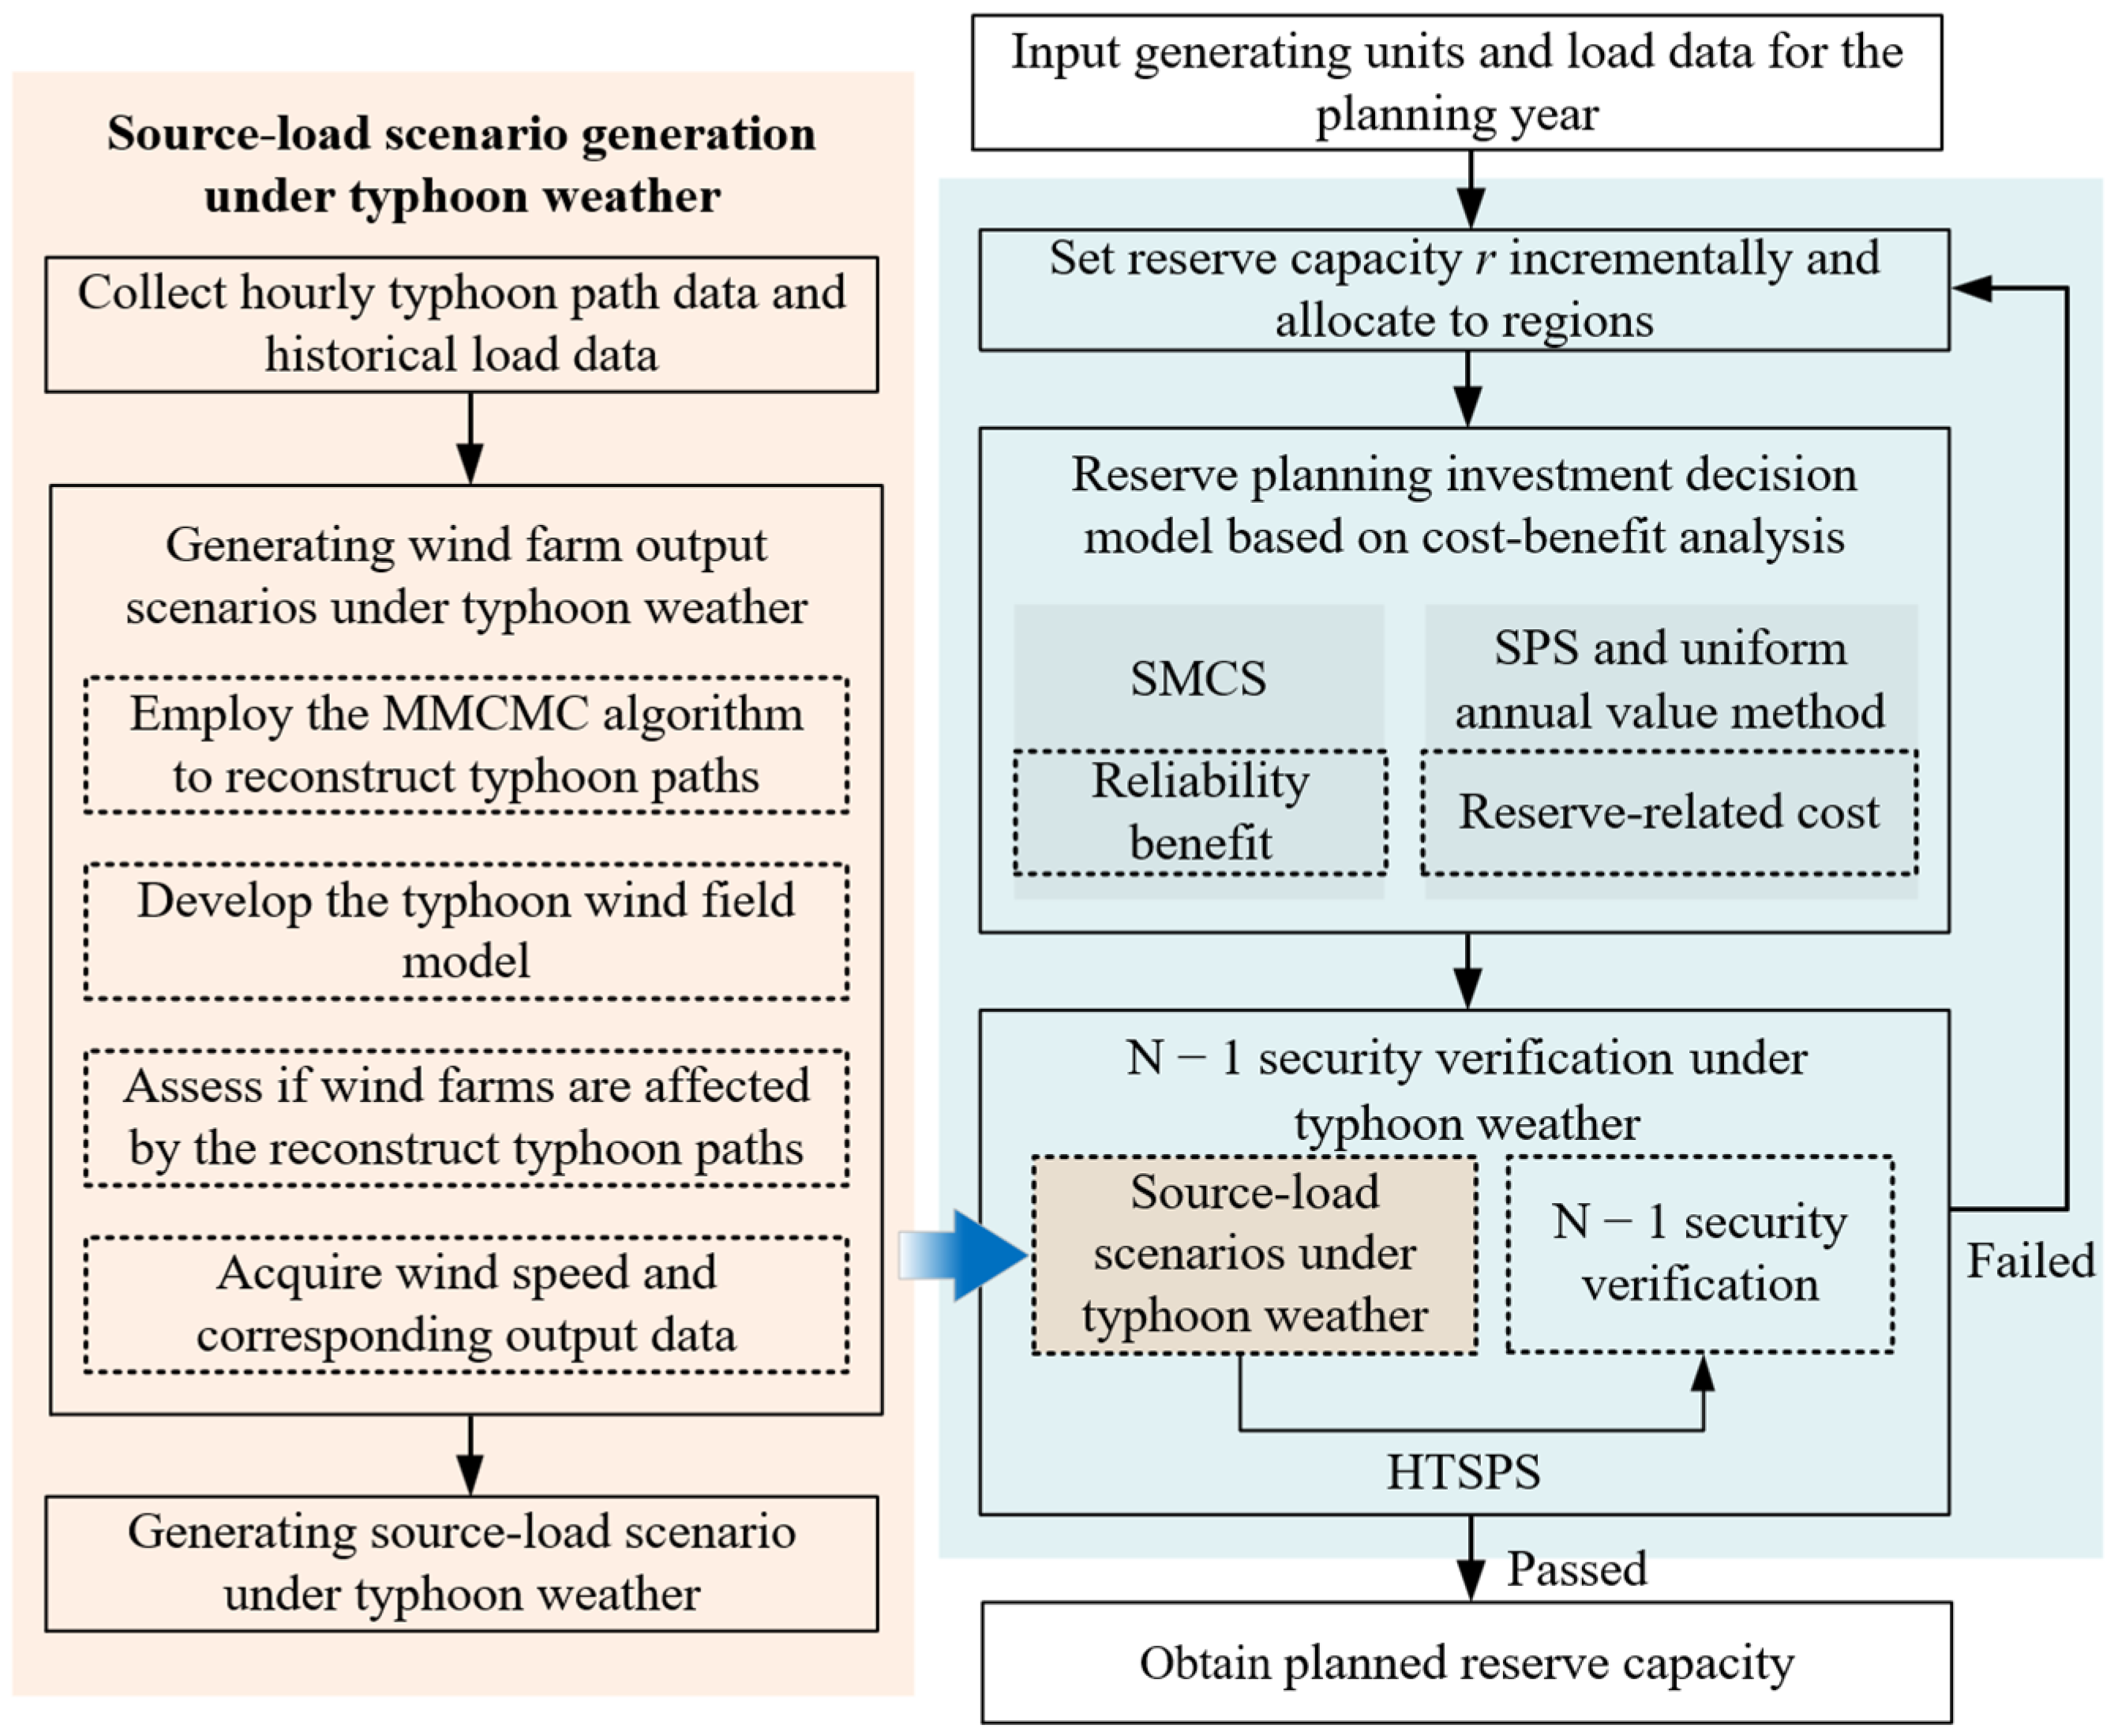
Figure 1. The structure of the proposed reserve planning method.
Energies 18 04737 g001
Figure 2. The geometric circle judgment method.
Energies 18 04737 g002
Figure 3. Historical and reconstructed typhoon.
Energies 18 04737 g003
Figure 4. PDF of typhoon central pressure for historical and reconstructed data.
Energies 18 04737 g004
Figure 5. Correlation coefficient matrices for historical and reconstructed typhoon paths.
Energies 18 04737 g005
Figure 6. Heatmap of spatial distribution density for historical and reconstructed typhoon paths.
Energies 18 04737 g006
Figure 7. Generated 96 h source-load scenarios of typhoon.
Energies 18 04737 g007
Figure 8. Total load shedding of N − 1 security verification for five typhoon scenarios.
Energies 18 04737 g008
Table 1. Geographical coordinates and installed capacities of the offshore wind farms.
Wind FarmCapacity (MW)Latitude (° N)Longitude (° E)
130021.31111.66
230021.33111.66
340021.50112.28
440021.46112.17
Table 2. Parameters of the wind turbines.
ParameterRated Power (MW)Hub Height (m)Cut-In Wind Speed (m/s)Rated Wind Speed (m/s)Cut-Out Wind Speed (m/s)
Value1415031025
Table 3. Economic parameters for the cost-benefit analysis.
ParameterCapital Cost ($/MW)Equipment Lifetime (Year)Discount Rate (%)VOLL ($/kWh)
Value6 × 10530105.27
Table 4. The results of the cost-benefit analysis.
Reserve (MW)400420440460480500520540
Reserve-related cost (USD 107)2.71182.84112.97013.09903.22773.35623.48463.6128
Reliability benefit (USD 108)1.69471.71351.73291.74801.76401.77671.78351.7962
Comprehensive benefit (USD 108)1.42361.42941.43591.43811.44131.44111.43501.4349
Reserve (MW)560580600620640660680700
Reserve-related cost (USD 107)3.74093.86893.99684.12464.25244.38014.50774.6353
Reliability benefit (USD 108)1.80651.81181.81671.82391.82811.83281.83541.8389
Comprehensive benefit (USD 108)1.43241.42491.41701.41141.40291.39481.38471.3753
Table 5. Results of single-stage and two-stage reserve planning approaches.
MetricDeterministic MethodSingle-StageTwo-Stage
Reserve capacity (MW)400480516
Comprehensive benefit (USD 108)1.42361.44131.4387
Total load shedding under typhoon scenarios (MW)4937.661920.390
Disclaimer/Publisher’s Note: The statements, opinions and data contained in all publications are solely those of the individual author(s) and contributor(s) and not of MDPI and/or the editor(s). MDPI and/or the editor(s) disclaim responsibility for any injury to people or property resulting from any ideas, methods, instructions or products referred to in the content.