Abstract
This paper describes an improved version of a sampling-based bridge designed for impedance calibration. Based on the original concept of the new multiplexer, which constitutes a key element of the improved impedance bridge, we propose a new procedure for determining the complex voltage ratio using both successive and simultaneous sampling. The procedure significantly improves the accuracy of impedance comparisons by eliminating digitizer gain errors and reducing errors caused by instabilities in the excitation voltages supplied by the precision sources driving the bridge arms. An implementation of the new procedure, employing an innovative cross-multiplexer together with modified software, is presented. We also provide an analysis of selected error sources, including the effects of digitizer nonlinearity, which is crucial when applying the modified method for determining the impedance ratio. Finally, validation results are presented, demonstrating the performance and accuracy of the SUT sampling-based bridge in comparison with another validated bridge used at the Italian National Metrology Institute (INRIM) in Turin.
1. Introduction
The development of impedance comparison systems is currently crucial for the energy storage industry. This is because impedance methods have recently become fundamental tools for diagnosing batteries, capacitors, and fuel cells. The importance of impedance component measurements in the power industry continues to grow each year. In certain applications, such as battery energy storage systems (BESS), precise resistance or impedance measurements are essential. Monitoring the condition of battery systems is necessary, as it impacts not only operational reliability but also human safety [1].
Assessing one of the most important indicators of battery condition—the State of Health —typically requires either single-point impedance measurements or the application of electrochemical impedance spectroscopy (EIS) [2,3,4,5]. Impedance methods play a key role in electrochemical measurements, which are essential for analyzing processes occurring in batteries, fuel cells, and other energy storage systems. The ongoing development of primary impedance metrology, including the most accurate impedance bridges [6,7], provides the necessary reference standards for calibrating instruments used in diagnostic measurements and materials testing.
Therefore, the importance of impedance measurements and the corresponding standards for reproducing impedance components is steadily increasing worldwide. In recent years, many National Metrology Institutes (NMIs) have developed digital impedance bridges for the realization of national impedance scales, deriving the units of farad and henry from the resistance unit, the ohm [8,9,10,11,12,13,14]. Most of these bridges are designed for four-terminal-pair (4TP) comparisons [15], which ensure immunity to electromagnetic interference and enable high accuracy across a wide impedance range [16].
Bridges that incorporate quantum Josephson voltage standards [11,12,13,14] and those adapted for the quantum Hall effect [13,14] for R-C comparisons are currently being developed by the leading NMIs. As an alternative, metrology institutes in other countries use non-quantum bridges that employ semiconductor AC voltage sources as stable supplies or voltage ratio standards. The accuracy of these non-quantum bridges typically ranges from 10−5 to 10−6 [17].
A major advantage of bridges equipped with digital voltage sources is their ability to measure impedance across the entire complex plane, as well as their ease of automation—capabilities not offered by traditional transformer bridges.
Since 2020, a non-quantum, sampling-based impedance bridge has been under development in Poland at the Central Office of Measures (GUM), in collaboration with the Silesian University of Technology (SUT). More recently, this research has also been conducted in cooperation with the University of Zielona Góra (UZG) as part of the “Polish Metrology II” programme.
The primary motivation for the research presented in this paper is to enhance the accuracy of impedance comparisons at the highest metrological level. The authors focus on the implementation of a new measurement procedure for sampling-based impedance bridges [9,10,17].
The primary sources of error in impedance comparison using sampling bridges are associated with measuring the complex voltage ratio with a digitizer. In practice, two approaches are employed: sequential and simultaneous sampling. In sequential sampling, a single A/D converter with a multiplexer is typically used, whereas simultaneous sampling relies on two separate A/D converters. Each approach offers distinct advantages and limitations. Nonetheless, regardless of the chosen approach, the dominant error contributions introduced by the digitizer in a sampling bridge arise from its nonlinearity as well as from the impact of input switching on the operating conditions of the bridge.
The paper introduces a novel solution involving a two-output cross-multiplexer, which—unlike the single-output multiplexers commonly used in some NMIs—enables both simultaneous and successive sampling, thereby combining the advantages of the two approaches. It should be emphasized that the authors primarily focus on investigating the impact of digitizer nonlinearity on the accuracy improvement of the bridge. Achieving this objective required the development and implementation of a sufficiently precise method for determining nonlinearity. The proposed method, together with the reported results on digitizer nonlinearity errors, can be applied to mitigate their influence on the uncertainty of impedance comparison, offering an alternative to the software-based correction method already employed in sampling bridges [9]. Moreover, these findings may also be of interest to researchers utilizing high-resolution commercial digitizers in their experimental work.
2. The 4TP Sampling-Based Bridge
2.1. Principle and Implementation
The schematic of the sampling-based impedance bridge developed at SUT and implemented at GUM is shown in Figure 1. The two 4TP impedance standards to be compared (Z1 and Z2) are supplied with voltages generated by the high-performance two-channel AC voltage source developed at SUT [18]. At the equilibrium state (VL1 = VL2 = 0), attained by adjusting E2 and E0, the impedance ratio is related to the voltage ratio by the following equation:
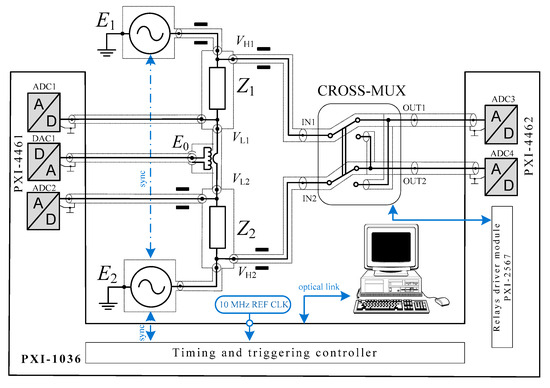
Figure 1.
Schematic of the modified sampling-based 4TP bridge. Solid black rectangles represent coaxial current equalizers (chokes).
In the bridge structure, two PXI modules were employed (see 1 in Figure 2). The PXI-4461 includes two analog-to-digital channels and two digital-to-analog channels. The analog-to-digital channels AI0 and AI1 operate as digitizers, denoted as ADC1 and ADC2, respectively, while the digital-to-analog channel AO0 functions as a sinusoidal signal generator, denoted as DAC1. In turn, the PXI-4462 module provides four analog-to-digital channels, two of which are used as digitizers ADC3 and ADC4. The measurement of the voltage ratio is carried out by sampling the voltages VH1 and VH2 using two digitizers, ADC3 and ADC4, switched by means of the cross-multiplexer (CROSS-MUX) designed and fabricated at SUT. The DAC1 delivers a sinusoidal signal, synchronized with E1 and E2, to compensate for the voltage drop across the connecting cable between two resistors. The system is designed as fully coaxial to ensure high immunity to electromagnetic interferences. Details on the synchronization and balancing of the bridge are provided in [17].
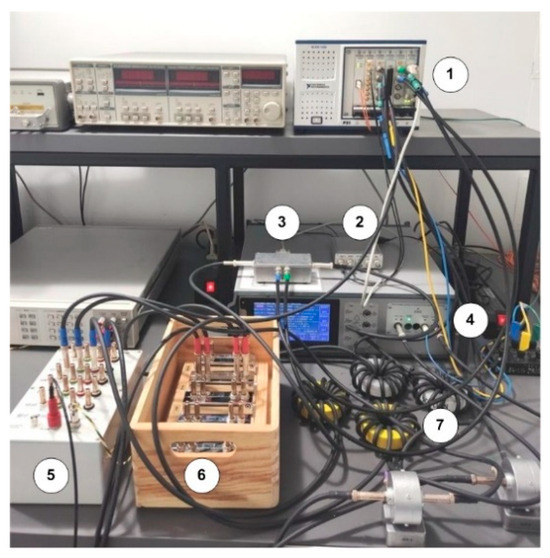
Figure 2.
Implementation of the sampling-based bridge: 1—NI PXI sampling system, 2—optical-to-TTL converter, 3—a new CROSS-MUX, 4—digital AC voltage source, 5—4TP thermostatized capacitance standards, 6—4TP Vishay resistance standards, 7—current equalizers (chokes).
2.2. New Procedure—Analysis
In the typical configuration of sampling bridges used at NMIs [8,10,17], the voltages VH1 and VH2 are measured successively using a single-output multiplexer and a digitizer. Employing a single digitizer switched by a multiplexer is generally more advantageous than directly measuring the voltages across the impedance standards using two separate digitizers. This is primarily because the digitizer’s gain error cancels out when the same device is used to measure both VH1 and VH2. However, the use of a multiplexer introduces certain drawbacks. Specifically, the unused channel must be connected to a dummy impedance that matches the input impedance of the digitizer. In addition, short-term instability in the dual-channel AC voltage source may affect the accuracy of the final voltage ratio measurement.
Consequently, an idea emerged to combine the advantages of successive and simultaneous sampling by implementing a novel two-output coaxial CROSS-MUX (➂ in Figure 2). Measurements showed that its switching time is below 0.6 ms (Figure 3). Characterization of the symmetry and crosstalk of the CROSS-MUX is detailed in [19]. Experimental results of the CROSS-MUX admittances showed that the impedance ratio error component related to the CROSS-MUX asymmetry does not exceed 1 × 10⁻⁸ at a frequency of 20 kHz, which is the maximum frequency value for the SUT digital sampling-based bridge [19].
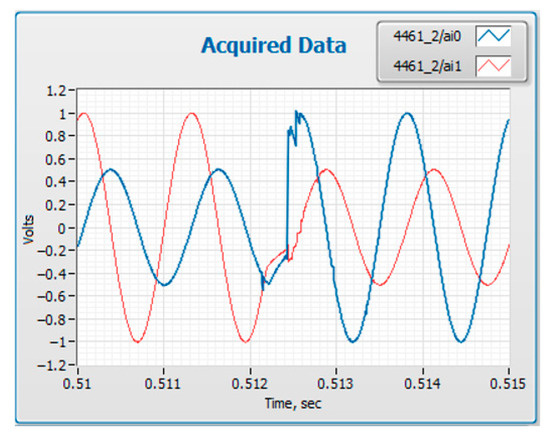
Figure 3.
Voltages VH1 and VH2 acquired by two digitizers (AI0 and AI1, respectively) boarded on DAQ.
NI PXI-4462. The transient state due to switching is visible between 0.512 s and 0.513 s.
Utilization of the mentioned multiplexer enables the measurement of voltages VH1 and VH2:
- (1)
- Applying simultaneous sampling by both digitizers (ADC3 and ADC4) in forward (F) CROSS-MUX configuration: IN1 → OUT1, IN2 → OUT2);
- (2)
- Applying simultaneous sampling by both digitizers (ADC3 and ADC4) in reversed (R) CROSS-MUX configuration: IN1 → OUT2, IN2 → OUT1).
Now, it is possible to determine the voltage ratio in four different ways:
- 1—using only digitizer ADC3 with successive sampling (VH1 is measured in forward mode, VH2 in reversed mode);
- 2—using only digitizer ADC4 with successive sampling (VH2 is measured in forward mode, VH1 in reversed mode);
- 3—using both digitizers with simultaneous sampling in forward mode;
- 4—using both digitizers with simultaneous sampling in reversed mode.
The principle for minimizing complex gain error in systems employing simultaneous sampling is presented in [20]. In steady-state conditions, assuming a linear model, the frequency properties of a real two-channel digitizer can be described by its spectral transfer functions:
where and are the complex output and input voltages (i-th output of CROSS-MUX), respectively, |Hi| is the modulus, and is the phase shift between these voltages for the i-th channel.
If the same measurement ranges are used in both digitizer channels, the systematic relative gain errors δi introduced by the data acquisition module channels can be represented as
where H is the transfer function of the ideal path (not introducing any gain errors).
The gain errors introduced by the digitizer can be eliminated by measuring the voltages VH1 and VH2 for the two CROSS-MUX configurations. Assuming that the CROSS-MUX does not introduce additional errors (regardless of the configuration ), the impedance ratios (1) for the forward and reversed positions are equal to
On the other hand, during successive sampling, short-term drift δt of the voltage ratio E1/E2 may occur. Hence, the ratio of voltages across compared impedances for the reversed configuration differs from that for the forward configuration, which can be expressed as
This leads to related errors in the voltages measured by the digitizers for different CROSS-MUX configurations.
The geometric mean of Equation (4) allows for the elimination of the effect of gain errors on the impedance ratio (1):
After taking into account Equation (5) in the above relationship, we have
To calculate the impedance ratio, the voltages determined for different CROSS-MUX configurations by an individual digitizer can also be used:
The geometric mean of Equation (8) can be written as
After considering Equation (5), we obtain
To take advantages of both sampling methods (successive and simultaneous), the final result of the impedance ratio is calculated as the geometric mean:
After considering (7) and (10), we finally obtain
Therefore, we note that calculating the geometric mean of the voltage ratios (see Equations (4) and (8)) eliminates gain errors in the digitizer paths and reduces the error due to generator drift by a factor of two.
2.3. New Procedure—Implementation
As shown in Figure 1, the sampling bridge is fully computer controlled. A LabVIEW program manages the data acquisition process. The data transfer between the PXI modules and the computer is conducted via an optical link, ensuring good electrical insulation. The flow chart of the new measurement procedure based on the presented method of determining the voltage ratio is presented in Figure 4. A Quasi-Newton method [21] is implemented in the software for balancing the bridge. Voltages VH1 and VH2 for each mode (forward and reverse) are sampled for 500 ms at a frequency as close as possible to the maximum permissible value, which for PXI-4461 and PXI-4462 is 204.8 kSa/s. The sampling frequency is always selected to ensure coherent sampling. Typically, 10 switching sequences (each sequence consists of at least 20 periods) are taken for analysis after removing samples received at the time of CROSS-MUX switching. RMS voltages are calculated using DFT. The entire measurement procedure is repeated 12 times. Excessive error (outliers) removal using the Dixon method and statistical methods allows for the detection of any gross errors, and ultimately, 10 results are considered to determine the final impedance ratio value. Furthermore, the standard deviation is determined, which is used to estimate Type A uncertainty.
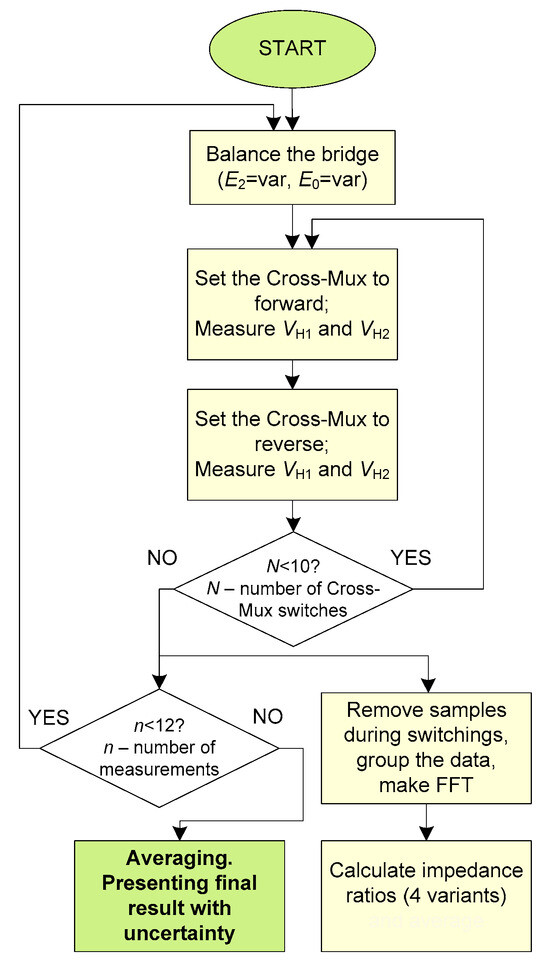
Figure 4.
Flow chart of the new measurement procedure.
Averaging of the four variants analyzed in Section 2.1 (two measurements for successive sampling and two for simultaneous sampling) has a positive effect on the comparison results, not only due to the reduction of the gain error and source instability, but also due to the possible reduction of nonlinearity error. As shown in [22], the impact of the nonlinearity when using two digitizers (simultaneous sampling with the digitizers switched) can be greater than in the case of successive sampling. Due to nonlinearity errors, the actual voltages VH1 and VH2 differ from the readings. It can be shown that with channel swapping the relative error of the voltage ratio measurement resulting from the digitizer nonlinearity can be expressed by the following relationship [22]:
where g1 and g2—gains of the digitizer V1 and V2, respectively; —voltages measured by a digitizer in forward and reverse mode, respectively.
Equation (13) indicates that, depending on the signs of the gains for both digitizers, some compensation for the nonlinearity errors may occur but it is not guaranteed. Therefore, it is desirable to conduct an appropriate investigation of the effect of digitizer nonlinearity.
3. Methods
3.1. Digitizer Nonlinearity
NI PXI-4462 and NI PXI-4461 modules are currently used in sampling and generating bridges at SUT, GUM, and UZG. Preliminary nonlinearity tests performed for voltage ratios ranging from 1:1 to 10:1 showed that the PXI-4462 digitizers used in the SUT exhibit relatively large nonlinearity errors for voltage ratios close to 2:1, compared to the PXI-4461 digitizers used in the GUM. Moreover, recent comparisons of GUM and SUT impedance standards calibrated at INRIM have demonstrated that the voltage value and range of the digitizer can influence nonlinearity errors. In practice, R-C (resistor vs. capacitor) comparisons are often performed at 1 kHz, making the behavior of samplers for voltage ratios close to 2:1 of significant practical interest. Therefore, it was decided to examine this issue more closely, with particular attention to the potential impact of the input voltage, frequency, and the digitizer range on the nonlinearity error.
The capacitance permutation method [23,24,25,26] was employed to assess the nonlinearity of PXI-4462 digitizers. This method involves cyclically switching a group of N nominally equal capacitors in a bridge, thereby creating standard voltage ratios ranging from 1:1 to N:1. Recently, at SUT, a prototype system with permuted capacitors has been significantly improved using highly stable and well-aligned capacitors with C0G (NP0) dielectric. The previous version of the device presented in [23] was modified by replacing the old 1.5 nF polystyrene capacitors with eleven new SMD 10 nF C0G capacitors from Murata (Japan), selected from a large group of several hundred pieces. Measurements performed at GUM using high-precision capacitance bridge Andeen-Hagerling AH2700A indicated that the relative spread of the capacitance values for the selected 11 pieces is below 2 × 10⁻⁵. Such a range means that the maximum error in reproducing the reference voltage ratio does not exceed 10−9. Moreover, investigations carried out at SUT using a precise temperature chamber [27] show that the temperature coefficients of the used capacitors are within the range of −5 ppm/K to +5 ppm/K. The steel block with capacitors is well shielded and well thermally isolated, which limits the influence of the ambient temperature on the change in capacitance values.
Nonlinearity measurements of four digitizers (marked AI0, AI1, AI2, and AI4) present in the PXI-4462 data acquisition module, applied in the SUT sampling bridge, were carried out. The tests were performed in a thermally stabilized room with a temperature of (23.0 ± 0.5) °C. The coaxial permuting capacitor device described in Section 3.1 was used for nonlinearity testing. The measurements were made using the scheme presented in Figure 5. The case presented here is for the implementation of a voltage ratio of 2:1, as only two of the eleven capacitors included in the PCD were used. A high-performance two-channel source of digitally synthesized AC voltage marked by ➃ in Figure 2 was used to energize the bridge.

Figure 5.
Scheme for nonlinearity investigation. Permutation No.1 for 2:1 ratio is shown.
After balancing the bridge, the voltages V1 and V2 were sampled for 500 ms with a sampling rate corresponding to taking 100 samples per period. After this time, the multiplexer was switched and the next samples for both DUTs were collected in the reversed position of the CROSS-MUX. A total of 10 switching sequences were taken for analysis after removing samples received at the time of CROSS-MUX switching. RMS voltages were calculated using the DFT. The entire measurement procedure (balancing and voltage measurements) was repeated 12 times to obtain, after removing the outliers, 10 results taken to calculate the final voltage ratio and standard deviation. A software program written in the LabVIEW environment was utilized for balancing the bridge and measuring the voltage ratio. Finally, the relative nonlinearity errors δnonl were calculated using the following formula:
where Γm and Γtrue are the measured and true value of the voltage ratio, respectively.
3.2. Validation Test
A set of five thermoregulated capacitance standards (1 nF, 10 nF, 100 nF, 1 μF, and 10 μF), KC0G-1XF, developed at GUM, and a set of five resistance standards, H484GE, using Vishay HZ series resistors (10 Ω, 100 Ω, 1 kΩ, 10 kΩ, and 100 kΩ) developed at SUT, were used to validate the bridge. Details on the construction and performance of the impedance standards are given in [27]. The measurements were performed in a thermally stabilized room with a temperature of (23.0 ± 0.5) °C using the bridge presented in Figure 1. The same data acquisition procedure (balancing, switching, sampling) was used as in the nonlinearity tests (see Section 3.1). The comparisons were performed at a frequency of 1 kHz, and the voltage across the compared capacitors equaled 1 V.
4. Results
4.1. Digitizer Nonlinearity
Nonlinearity tests were first performed for the digitizer range 3.16 V, which is the most often used to sample the voltages across the compared impedances in the sampling-based bridges. For this range, five voltages were applied: 2 V, 2.25 V, 2.5 V, 2.75 V, and 3 V. Then, the measurements were repeated for the digitizer range of 1 V at voltages of 0.63 V, 0.71 V, 0.79 V, 0.87 V, and 0.95 V, which correspond to the same percentage values of the range as those used previously for the 3.16 V range. These values (from 0.63 V to 3 V) encompass the typical voltage range employed in comparisons of impedance standards using digital bridges. The indicated voltages refer to the amplitude value on the object placed in the upper arm of the bridge (C1 in Figure 5). The tests were performed for a voltage ratio of 2:1, which, as mentioned earlier, is important for impedance comparison. The measurements were carried out for four different frequencies (100 Hz, 1 kHz, 1592 Hz, and 5 kHz) covering the range of comparison with the sampling-based impedance bridge developed at the SUT and GUM.
Nonlinearity results for the range 3.16 V are presented in Figure 6a–d. The results for the 1 V range are presented in Figure 7. The error bars in the figures correspond to Type A uncertainties. The obtained results confirmed earlier assumptions that the voltage value can determine the nonlinearity error values. A very strong voltage dependence of the nonlinearity errors was observed for all digitizers for frequencies of 100 Hz and 1 kHz, both for the 3.16 V and for 1 V ranges. The largest nonlinearity errors (whose absolute value exceeds 30 μV/V) were observed for voltages close to the end of the measurement range, both for 3.16 V and 1 V. For most cases presented in Figure 6 and Figure 7, the relative nonlinearity error tends to decrease with the increase in the measured voltages. For frequencies 100 Hz and 1 kHz, the error characteristic crosses zero, so it is possible to select the measurement voltage to eliminate nonlinearity errors. However, it requires knowledge of the digitizer’s voltage characteristic for all voltage ratios used in impedance comparisons. If we use voltages other than the one for which the voltage characteristic passes through zero, then in order to obtain a relative comparison uncertainty of 10−5 or better, we should introduce appropriate corrections of the digitizer nonlinearity in the software.
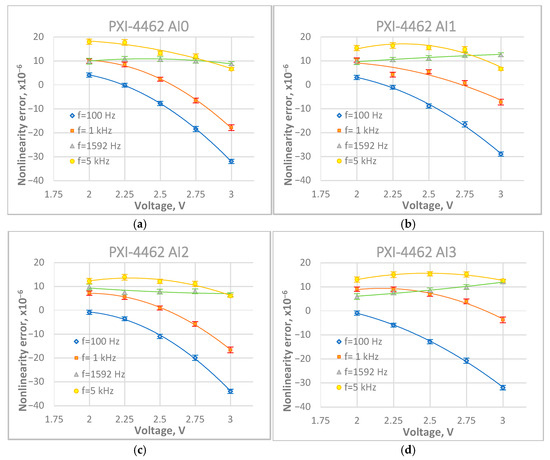
Figure 6.
Nonlinearity results for digitizer PXI-4462 range 3.16 V: (a) AI0, (b) AI1, (c) AI2, (d) AI3.
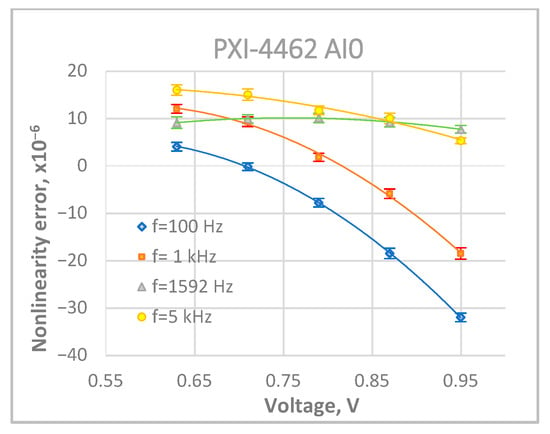
Figure 7.
Nonlinearity results for digitizer PXI-4462 range 1 V.
Basically, digitizers on the same DAQ show similar nonlinearity error behavior as a function of voltage ratio. Therefore, some compensation for nonlinearity errors should be expected when using the channel swapping (see Equation (13)).
It was observed that both the shape of the characteristics and the values of the nonlinearity errors of the PXI-4462 AI0 digitizer for the 1 V range (Figure 7) correspond to those obtained for the 3.16 V range (Figure 6a). This indicates that the nonlinearity of the digitizer originates from the A/D converter itself rather than from the input circuitry (amplifiers and dividers).
4.2. Validation Test
The impedance ratio values of the R-C standards measured with the sampling bridge were compared with the values obtained with the validated sourcing bridge used in INRIM. The comparison results are given in Table 1.

Table 1.
Validation results of the improved sampling-based bridge.
The difference between the measured and reference values for all standard pairs does not exceed the uncertainty value of the reference ratio determination U ([ΓR]). This proves that the bridge presented in this paper allows for measurements with an uncertainty of 10−6.
The main uncertainty components for the developed sampling bridge are as follows:
- (1)
- Voltage ratio instability (type B), estimated at 1.5 × 10⁻⁷ (see [18]);
- (2)
- Balance threshold (type B), estimated at 0.8 × 10⁻⁶;
- (3)
- Digitizer’s nonlinearity (type B), results given in Section 4.1;
- (4)
- Measured voltage ratio value (type A), typically below 1 × 10⁻⁶.
5. Conclusions
This paper presents a modification of the digital sampling-based impedance bridge, which involves determining the impedance ratio based on two types of sampling: simultaneous and successive. This modification consists of implementing a new coaxial cross-multiplexer with two outputs. From the perspective of applying the new measurement method, understanding the nonlinearity errors of the digitizers used is essential.
The results obtained indicate the potential to select two digitizers with similar nonlinearity errors, enabling partial compensation of systematic errors. Consequently, it is possible to achieve a comparison uncertainty as low as 5 × 10⁻⁶ without requiring software-based correction of nonlinearity errors.
Furthermore, the test results revealed a significant dependence of the digitizers’ nonlinearity on frequency while showing no dependence on the selected input range. This prompts measurement system designers expecting uncertainty below 5 × 10⁻⁶ to apply nonlinearity corrections separately for each measurement frequency.
These findings offer new insights into the study of digitizer nonlinearity. It was previously assumed that small voltage changes would not influence nonlinearity errors and that such errors primarily depend on the voltage ratio. However, the present study demonstrates that nonlinearity errors can be greater at lower voltage ratios than at higher ones, as evidenced by the results reported here.
Following the application of the new voltage ratio determination method, the bridge validation performed against the validated system used at INRIM shows that the relative uncertainty of the improved sampling-based impedance bridge presented here is at the level of 10−6.
Author Contributions
Conceptualization, K.M. and J.A.; methodology, M.K. (Marian Kampik), R.R., J.K. and M.K. (Mirosław Kozioł); software, K.M.; investigation, K.M., J.K., M.K. (Mirosław Kozioł), M.K. (Maciej Koszarny) and A.Z.; resources, K.M., M.K. (Maciej Koszarny), A.Z. and J.J.; data curation, K.M.; writing—original draft preparation, K.M. and J.A.; writing—review and editing, R.R., J.K., M.K. (Marian Kampik), A.Z. and, J.J.; supervision, M.K. (Marian Kampik), J.K. and R.R.; funding acquisition, R.R. All authors have read and agreed to the published version of the manuscript.
Funding
This research was funded by the Polish Ministry of Science and Higher Education (grant No. PM-II/SP/0067/2024/02), realized within the framework of the program “Polish Metrology II”.
Data Availability Statement
Measurement results are available on local disks and can be made available following an individual request by an interested person.
Acknowledgments
The authors would like to thank Frédéric Overney, METAS, Switzerland, for fruitful discussions and inspirations concerning nonlinearity investigation, and Krzysztof Kubiczek, SUT, Poland, for support in bridge software development.
Conflicts of Interest
The authors declare no conflicts of interest.
Abbreviations
The following abbreviations are used in this manuscript:
| SUT | Silesian University of Technology, Gliwice, Poland |
| UZG | University of Zielona Góra, Zielona Góra, Poland |
| GUM | Central Office of Measures, Warsaw, Poland |
| INRIM | Istituto Nazionale di Ricerca Metrologica, Torino, Italy |
| METAS | Federal Institute of Metrology, Bern, Switzerland |
| NMI | National Metrology Institute |
| 4TP | Four-terminal pair, type of terminals |
| ADC | Analog to digital converter |
| DAC | Digital to analog converter |
| PXI | PCI Extensions for Instrumentation |
| SMD | Surface mount device |
| CROSS-MUX | Cross-multiplexer |
| DFT | Discrete Fourier Transform |
| NI | National Instruments, producer of automated test equipment, Austin, USA |
References
- Mašlán, S.; He, H.; Bergsten, T.; Seitz, S.; Heins, T.P. Interlaboratory comparison of battery impedance analyzers calibration. Measurement 2023, 218, 113176. [Google Scholar] [CrossRef]
- Barsoukov, E.; Macdonald, J.R. Impedance Spectroscopy: Theory, Experiment, and Applications; Wiley: Hoboken, NJ, USA, 2018. [Google Scholar]
- Xiao, Y.; Huang, X.; Meng, J.; Zhang, Y.; Knap, V.; Stroe, D.-I. Electrochemical Impedance Spectroscopy-Based Characterization and Modeling of Lithium-Ion Batteries Based on Frequency Selection. Batteries 2025, 11, 11. [Google Scholar] [CrossRef]
- Kanoun, O. (Ed.) Impedance Spectroscopy/Advanced Applications: Battery Research, Bioimpedance, System Design; Springer: Berlin/Heidelberg, Germany, 2021. [Google Scholar]
- Pandey, L.; Kumar, D.; Parkash, O.; Pandey, S. Analytical Impedance Spectroscopy; CRC Press: Boca Raton, FL, USA, 2024. [Google Scholar]
- Overney, F.; Jeanneret, B. Impedance bridges: From Wheatstone to Josephson. Metrologia 2018, 55, 119–134. [Google Scholar] [CrossRef]
- Ortolano, M.; Marzano, M.; Overney, F.; Eichenberger, A.L.; Kucera, J.; D’Elia, V. An International Trilateral Comparison Among the Newest Generations of Digital and Josephson Impedance Bridges. IEEE Trans. Instrum. Meas. 2025, 74, 1501009. [Google Scholar] [CrossRef]
- Ortolano, M.; Palafox, L.; Kučera, J.; Callegaro, L.; D’Elia, V.; Marzano, M.; Overney, F.; Gülmez, G. An international comparison of phase angle standards between the novel impedance bridges of CMI, INRIM and METAS. Metrologia 2018, 55, 499–512. [Google Scholar] [CrossRef]
- Mašláň, S.; Šíra, M.; Skalická, T.; Bergsten, T. Four-Terminal Pair Digital Sampling Impedance Bridge up to 1MHz. IEEE Trans. on Instr. Meas. 2019, 68, 1860–1869. [Google Scholar] [CrossRef]
- Overney, F.; Jeanneret, B. RLC Bridge Based on an Automated Synchronous Sampling System. IEEE Trans. Instr. Meas. 2011, 60, 2393–2398. [Google Scholar] [CrossRef]
- Pimsut, Y.; Bauer, S.; Karus, M.; Behr, R.; Kruskopf, M.; Kieler, O.; Palafox, L. Development and implementation of an automated four terminal-pair Josephson impedance bridge. Metrologia 2024, 61, 025007. [Google Scholar] [CrossRef]
- Overney, F.; Flowers-Jacobs, N.E.; Jeanneret, B.; Rufenacht, A.; Fox, A.E.; Underwood, J.M.; Koffman, A.D.; Benz, S.P. Josephson-based full digital bridge for high-accuracy impedance comparison. Metrologia 2016, 53, 1045–1053. [Google Scholar] [CrossRef]
- Bauer, S.; Behr, R.; Hagen, T.; Kieler, O.; Lee, J.; Palafox, L.; Schurr, J. A novel two-terminal-pair pulse-driven Josephson impedance bridge linking a 10 nF capacitance standard to the quantized Hall resistance. Metrologia 2017, 54, 152–160. [Google Scholar] [CrossRef]
- Bauer, S.; Behr, R.; Elmquist, R.E.; Götz, M.; Herick, J.; Kieler, O.; Kruskop, M.; Lee, J.; Palafox, L.; Pimsut, Y. A Four-terminal-pair Josephson impedance bridge combined with a graphene-quantized Hall resistance. Meas. Sci. Technol. 2021, 32, 065007. [Google Scholar] [CrossRef]
- Kibble, B.P. Four terminal-pair to anything else! In Proceedings of the IEE Colloquium on Interconnections from DC to Microwaves (Ref. No. 1999/019), London, UK, 18 February 1999; pp. 6/1–6/6. [Google Scholar]
- Awan, S.; Kibble, B.; Schurr, J. Coaxial Electrical Circuits for Interference-Free Measurements (Electrical Measurement); IET: Edison, NJ, USA, 2010. [Google Scholar]
- Musioł, K.; Kampik, M.; Ziółek, A.; Jursza, J. Experiences with a new sampling-based four-terminal-pair digital impedance bridge. Measurement 2022, 205, 112159. [Google Scholar] [CrossRef]
- Kampik, M.; Musioł, K. Investigations of the high-performance source of digitally synthesized sinusoidal voltage for primary impedance metrology. Measurement 2021, 168, 108308. [Google Scholar] [CrossRef]
- Musioł, K.; Kampik, M. Development of four-terminal sampling-based digital impedance bridge. Metrol. Meas. Syst. 2025, 32, 1–9. [Google Scholar] [CrossRef]
- Augustyn, J.; Kampik, M.; Musioł, K. Investigation of Selected Reconstruction Algorithms Used for Determination of Complex Ratio of AC Voltages. IEEE Trans. Instrum. Meas. 2021, 70, 1503209. [Google Scholar] [CrossRef]
- Callegaro, L. On strategies for automatic bridge balancing. IEEE Trans. Instrum. Meas. 2005, 54, 529–532. [Google Scholar] [CrossRef]
- Ortolano, M.; Marzano, M.; D’Elia, V.; Tran, N.T.M.; Rybski, R.; Kaczmarek, J.; Kozioł, M.; Musioł, K.; Christensen, A.E.; Callegaro, L.; et al. A Comprehensive Analysis of Error Sources in Electronic Fully Digital Impedance Bridges. IEEE Trans. Instrum. Meas. 2021, 70, 1500914. [Google Scholar] [CrossRef]
- Kampik, M.; Kubiczek, K.; Musioł, K.; Zawadzki, P.; Ziółek, A.; Jursza, J.; Koszarny, M. Linearity measurement of digitizers used in sampling-based digital impedance bridges by the method of permuting capacitors. Metrol. Hallmark 2024, 1, 1–9. [Google Scholar]
- Shin, S.S.; Kim, W.-S.; Kim, D.B. Characterization of an automated permuting capacitive device for AC voltage ratio calibration. IEEE Trans. Instrum. Meas. 2025, 74, 1013207. [Google Scholar] [CrossRef]
- Hsu, J.C.; Gong, J.; Huang, C.-F. An automated permuting capacitor device for calibration of IVDs. IEEE Trans. Instrum. Meas. 2014, 63, 2271–2278. [Google Scholar] [CrossRef]
- Cutkosky, R.D.; Shields, J.Q. The precision measurement of transformer ratios. NBS Spec. Publ. 1968, 300–303, 349. [Google Scholar] [CrossRef]
- Kampik, M.; Musioł, K.; Rybski, R.; Kaczmarek, J.; Kozioł, M.; Koszarny, M.; Ziółek, A.; Jursza, J.; Zawadzki, P. Temperature Dependence of the New Calibration Infrastructure for Impedance Metrology. Energies 2025, 18, 3018. [Google Scholar] [CrossRef]
Disclaimer/Publisher’s Note: The statements, opinions and data contained in all publications are solely those of the individual author(s) and contributor(s) and not of MDPI and/or the editor(s). MDPI and/or the editor(s) disclaim responsibility for any injury to people or property resulting from any ideas, methods, instructions or products referred to in the content. |
© 2025 by the authors. Licensee MDPI, Basel, Switzerland. This article is an open access article distributed under the terms and conditions of the Creative Commons Attribution (CC BY) license (https://creativecommons.org/licenses/by/4.0/).