Article

Is the Grid Ready for the Electric Vehicle Transition?

1
Department of Information Display, Kyung Hee University, 26 Kyunghee-daero, Dongdaemun-gu, Seoul 02447, Republic of Korea
2
Nopalu Institute of Science and Technology, Nord Foire, Dakar BP 29044, Senegal
Energies 2025, 18(17), 4730; https://doi.org/10.3390/en18174730
Submission received: 6 August 2025 / Revised: 29 August 2025 / Accepted: 2 September 2025 / Published: 5 September 2025

Abstract

The advancement of electric mobility undoubtedly presents a chance to reduce carbon emissions in road transport and ideally mitigate global warming. The significant and ongoing swift growth in the uptake of electric vehicles (EVs) clearly demonstrates a successful technological advancement; however, it comes with significant obstacles, particularly regarding the grids’ ability to provide adequate energy and, more importantly, a sufficient installed capacity to manage potential spikes during massive EV charging. Another significant challenge for nations aiming for 100% registrations made of EVs is the S-curve that accompanies their adoption. The S-curve illustrates three primary phases, one of which features a swift increase in the EV fleet, and this phase is likely to surpass grid investments and enhancements in many countries. This manuscript discusses a study on grid preparedness for the EV transition, addressing potential challenges, the benefits of public charging stations, particularly in densely populated regions, and the incorporation of renewable energy. Renewable energy offers the chance to alleviate the pressure on grids, provided that charging behaviors correspond with generation times. There is a need for progress in battery technology to replace classical gas stations with standalone solar or wind powered charging stations. This manuscript showcases this particular scenario in the United States of America (U.S.).

1. Introduction

EVs of every kind are currently replacing 1.5 million barrels of oil per day, which is approximately 3% of the overall demand for road fuel [1]. The competition has begun to reduce carbon emissions from road transportation and encourage drivers to transition to EVs in many countries. Nonetheless, EVs represent the future of transportation, provided sufficient energy can be produced to sustain them all. In 2020, there were 16.5 million EVs on roads globally [2,3]; this number is projected to increase to 300 million by 2030 [2,3]. With these increasing figures, in nations with the greatest EV adoption, grids might face difficulties without investment and changes in charging behaviors. As an example, it is forecasted that the maximum net electricity demand may rise by as much as 50% with complete electrification of the fleet in the US. For the specific western US area, analysts show that when the penetration reaches 30% to 40% of vehicles on the road, the grid will undergo considerable strain without substantial investments and modifications in charging behaviors. Due to the time required to charge EVs with standard chargers, drivers often leave their vehicles to charge in the evening and overnight, increasing strain on the grid. Generally, electric energy demand reaches its highest point between 5 and 9 pm when individuals come home from work and utilize household electric appliances. This suggests that if vehicle owners charged their cars during the day, particularly with the potential of solar energy, it could reduce expenses and assist the grid as the number of EVs rises to achieve sustainability targets. It is feasible to sync EV charging times with high renewable energy generation and apply dynamic pricing or incentives for EV users to charge with renewable energy sources. The transformation of road transportation with the rise in EVs, with projections indicating that 42% of worldwide light-duty vehicle sales will be electric by 2030 [2,3], is a significant challenge for the grid’s readiness and resilience for the transition to EVs. Grid resilience, which is an essential factor in maintaining the stability and dependability of an electrical grid, includes the ability to adjust for unexpected obstacles and swiftly bounce back from difficulties, whether these arise from human-induced problems, like the surge from massive EV charging, or from natural calamities. Resilience in the case of massive EV adoption is especially gauged by a grid’s ability to keep delivering essential loads, even when confronted with high-impact occurrences such as the simultaneous, massive demand from EV fleet charging [4]. Attaining grid resilience requires a multifaceted strategy, which encompasses bolstering essential infrastructure to endure severe conditions and deploying sophisticated control algorithms. The surge in electricity demand will place more pressure on the grid. In order to match the rapid increase in EV adoption, utilities must respond promptly to ready the grid for this emerging load type. However, conventional utility business models and regulations, which are as effective for reactive planning regarding new loads as they would be for new residential complexes, currently do not permit the proactive grid investments needed for EVs. The uncertainty surrounding the precise charging requirements for EVs, such as when, where, and how much, stands in stark contrast to regulatory demands for prudent investments aimed at minimizing costs for ratepayers. Significant challenges are present in certain areas at the local distribution transformer or feeder level, whereas other places benefit from a considerable amount of unused capacity and will not need grid upgrades. Given that grid hosting capacities vary considerably across different locations, even within the same distribution network, planning for the rollout of EV charging presents a highly site-specific challenge. Microgrids, as a potential local solution, represent a significant source of resilience within the larger grid [5,6]. They provide islanding capabilities, enabling them to function autonomously during power surges or outages, and they ensure a steady flow of renewable energy.
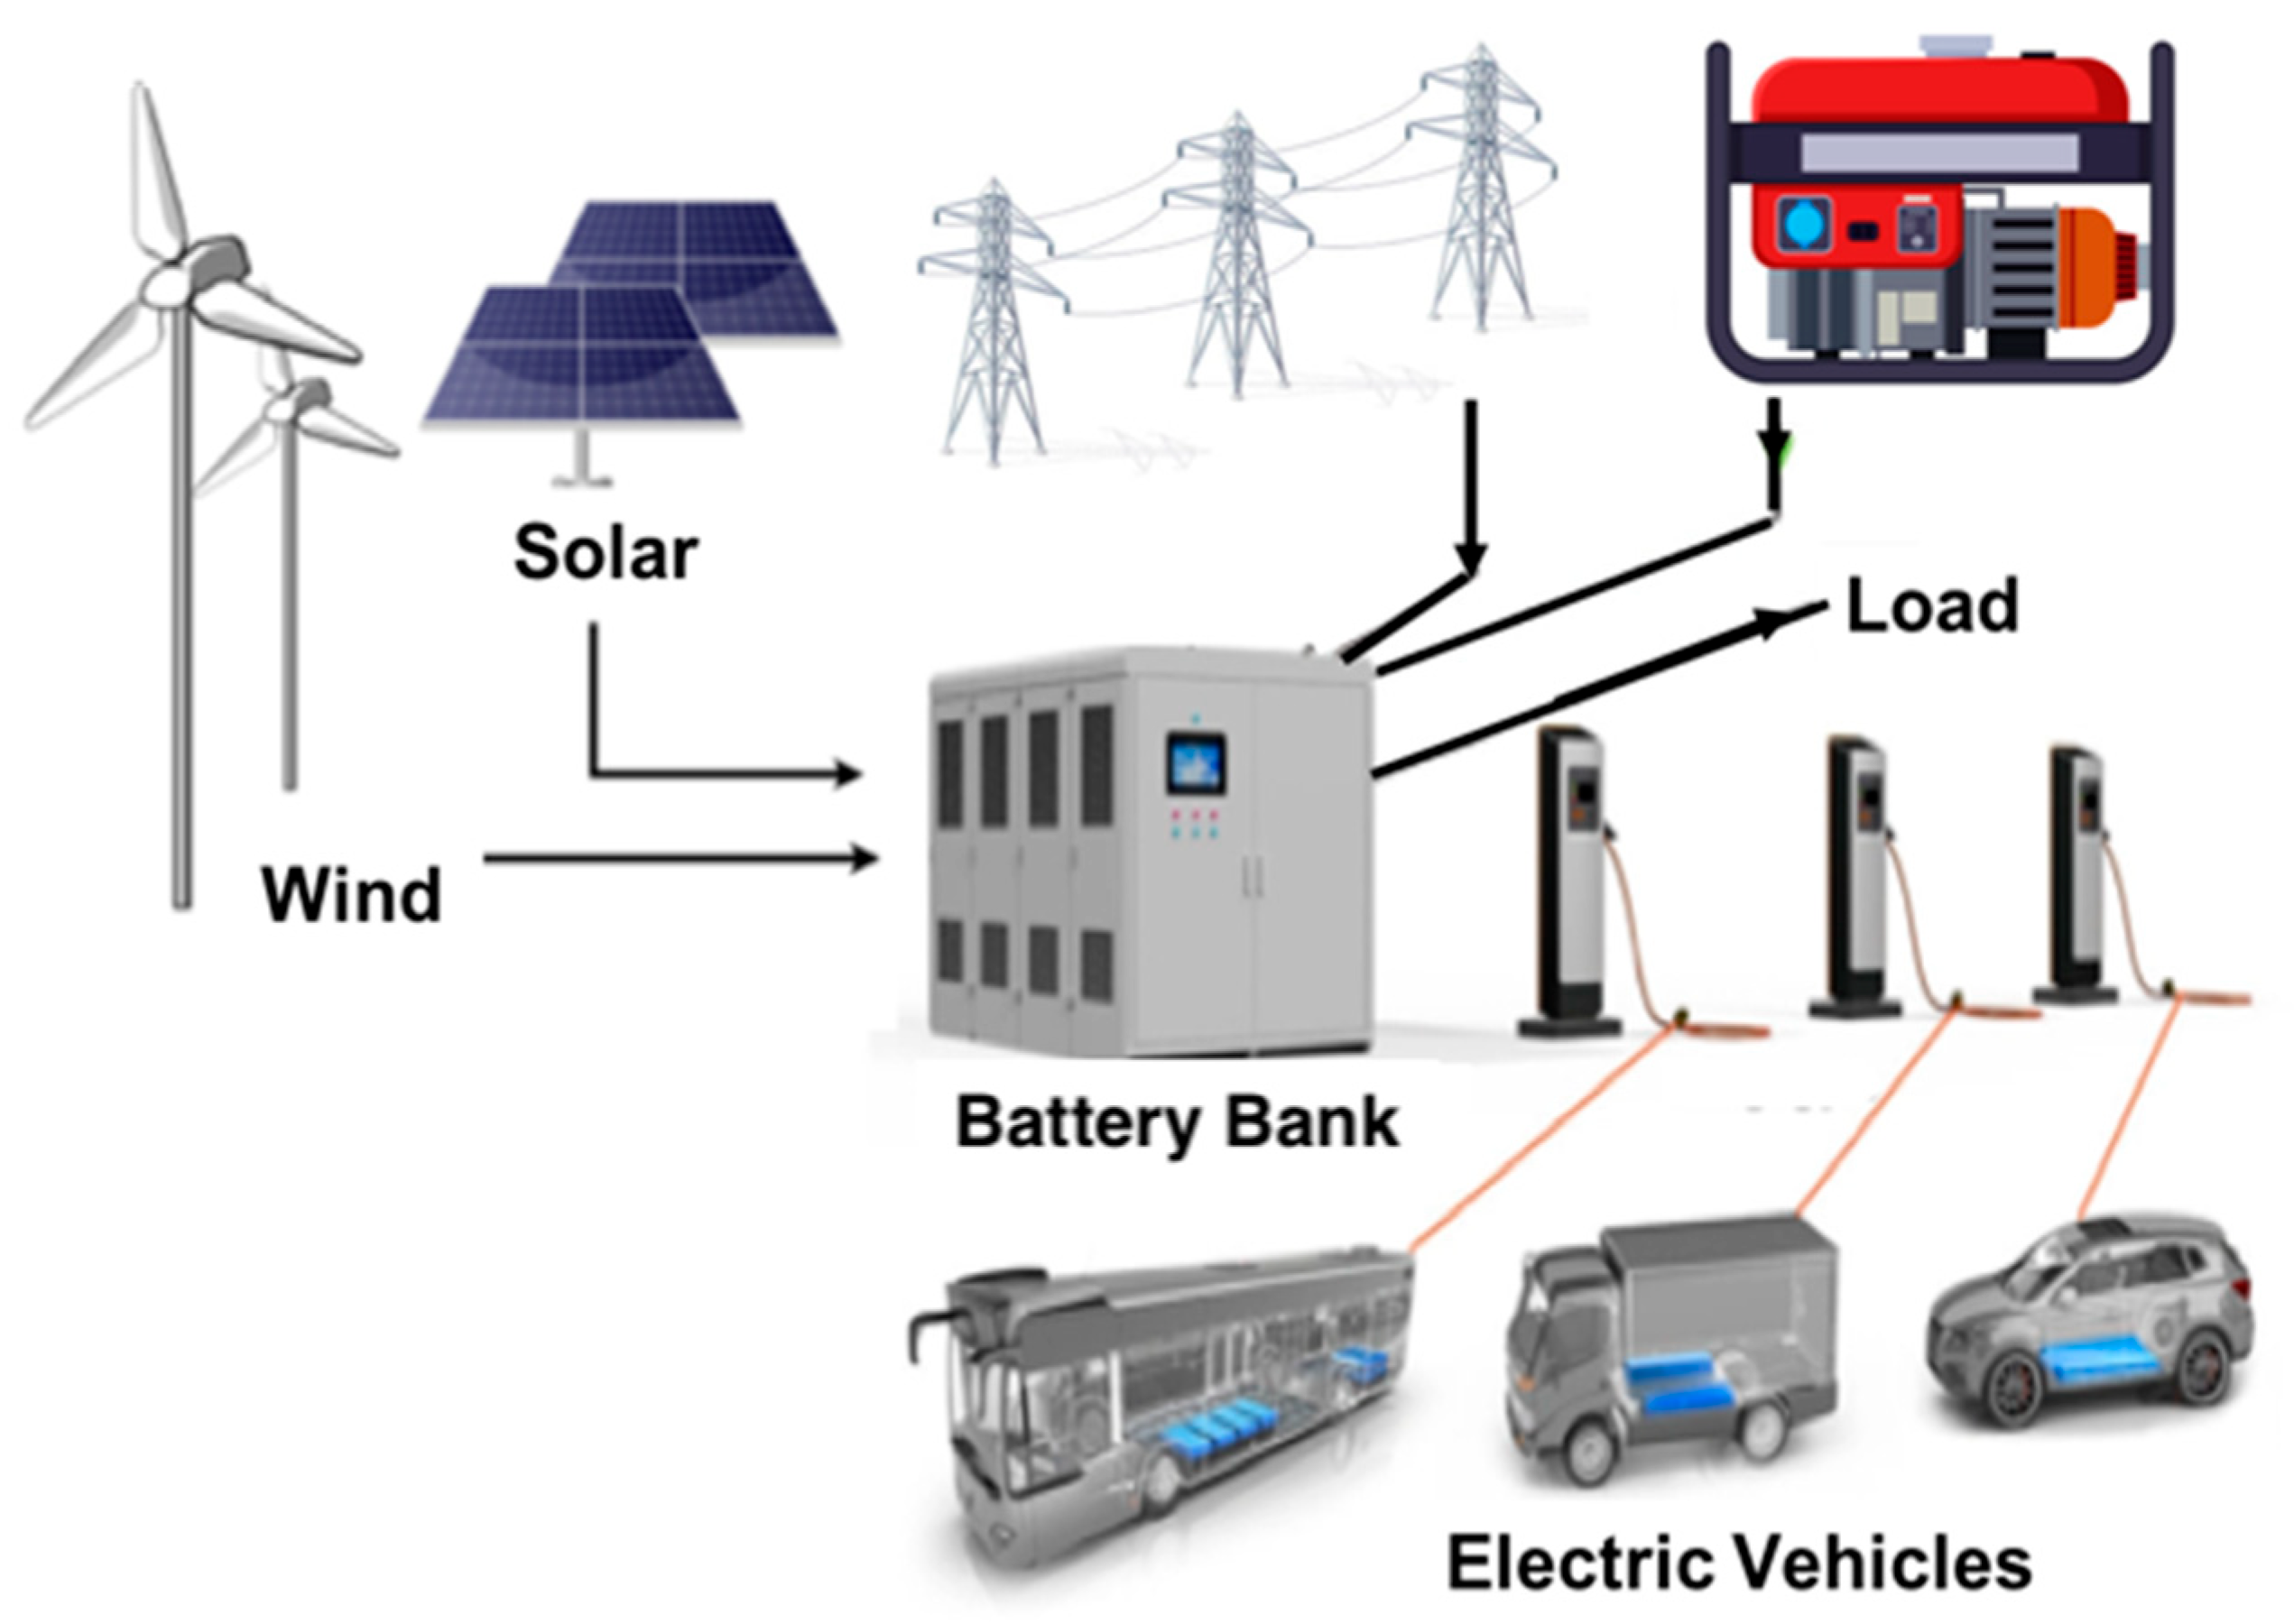
Figure 1 below shows the general structure of a microgrid. Microgrids can operate independently, integrate into a larger community network, or act as black start systems, improving the reliability of power systems. Microgrids can provide an extra level of resilience, and a systematic framework aids in comprehending and managing grid conditions during and following surge occurrences. This comprehensive strategy is essential for maintaining a constant supply of electricity, even during challenging circumstances [5,6].
Another innovative strategy in EV charging could emerge from time-of-use pricing. This strategy will promote charging during off-peak times by providing reduced electricity rates at those hours. Increased attention towards smart charging and the application of algorithms and communication technologies help to plan charging during the best times. In that regard, it might be required to have a better organized Vehicle-to-Grid (V2G) technology [7,8] enabling EVs to supply energy back to the grid during high demand periods. The grid’s resilience will be necessary due to the extra load from EVs, which can cause localized grid strain, particularly in regions with outdated infrastructure.
In fact, in a completely electrified fleet, the demand on the grid from road transport could potentially exceed current systems’ capacities during peak times. Although it is improbable for EV charging times to align throughout a power system, it remains feasible that numerous EVs or the entire local fleet may be charging simultaneously within a distribution transformer or zone substation area, potentially leading to complications.
Distribution grids require the capability to simulate future charging demands and effects across different scenarios. This encompasses comprehending EV penetration by area, charging habits, and the capacity to implement these through flexibility management. It may include existing and prospective rooftop solar photovoltaic penetration, along with storage accessibility for a strong and rapid development of renewable energy potential. It involves forecasting the future effects on grid infrastructure, taking into account storage capacity and needs, and evaluating investment necessities well ahead of time. Numerous networks worldwide acknowledge the necessity of addressing these challenges and are eager to advance. Nevertheless, the existing regulatory framework may require modifications in several instances. Numerous regions throughout the world are making significant investments in solar energy. For instance, in Europe, the REPowerEU plan [9,10] outlines that the European Union’s new solar energy strategy aims for solar panels on every residential rooftop across the continent by 2029 [9,10]. Utilizing this daytime energy will be crucial as the world transitions to renewable sources, particularly in relation with the EV transition.
In fact, a realistic solution may come from a higher integration of renewable energy even if it will not be achieved without challenges. Transitioning to EVs and the simultaneous exploitation of renewable energy to tackle climate change are commendable goals in their own right. Reducing fossil fuel use substantially is crucial for reaching those goals. However, attempting to execute such transitions on a massive scale within a short period is fraught with difficulties, risks, and unexpected outcomes that necessitate a committed and clear vision to be addressed effectively and realistically. Scaling up means not only manufacturing millions of EVs each year but also offering assistance with recharging and maintenance.
Presently, there is an increase in public charging stations along with the EV fleet. They are an adequate solutions, particularly for fast charging in densely populated areas such as major cities where home charging is not an available solution. Public charging infrastructures represent a viable business model that allows for the development of EVs by reducing range anxiety.
The transition to EVs offers a chance as well to enhance the incorporation of renewable energy within the transportation industry. Figure 2 illustrates an example of a public charging station with the integration of photovoltaic solar panels.
By synchronizing EV charging with times of elevated renewable energy production, such as photovoltaic solar, it can be guaranteed that EVs will run on clean energy, further lowering their carbon impact and improving transportation sustainability.
Simultaneously transforming the energy and transportation sectors will involve a wide range of both known and unexpected factors that will interact intricately in complex and unpredictable ways. As EVs and renewable energy expand, the challenges and solutions will involve progressively larger populations and areas. Each proposed solution is expected to create further obstacles. Moreover, the increasing scale threatens individuals’ entrenched beliefs, ways of life, and livelihoods, many of which could be altered or made obsolete. Adjusting to technological shifts is tough, but adapting to social shifts is even harder.
The challenge in the massive adoption of EVs is not necessarily energy but more so power capacity. This challenge is even greater when considering the fast progress of EV adoption, as shown by the S-curve describing the adoption of EVs in different countries, particularly those with a higher EV penetration rate [11,12].
Despite these challenges, some countries are having almost 100% of new registrations made up of EVs [11,12]. It is feasible to sync EV charging times with high renewable energy capacity and apply dynamic pricing or incentives for EV users to charge with renewable energy sources.
This study investigates how prepared grids are for the EV transition through benchmarking, particularly the necessity for technical updates, investments, and reforms to follow when considering an S-curve model for the adoption of EVs. Countries that are close to completing the full EV transition are highlighted as models based on their environmental policies, energy resources, grid management practices, and additional factors that may influence EV adoption. This manuscript presents, as well, the challenge of integrating renewable energy in charging solutions, particularly for off-grid systems that could potentially replace gas stations. Grids need to be better prepared for local challenges when integrating fast public charging stations. The U.S. is presented as a case study with the exploration of the installed power and energy consumption, power and energy demand from an EV fleet, the forecast of electricity usage in the transportation sector, and possible solutions for the better integration of V2G.

2. Literature Review

Research since ~2018 consistently shows that large-scale EV adoption will stress distribution networks if charging is unmanaged, but smart charging, time-of-use pricing, and V2G services can largely mitigate those impacts and if implemented at scale, turn EVs into grid flexibility resources. However, achieving this requires coordinated upgrades across hardware (transformers, substations), communications and control, market/regulatory frameworks, and consumer participation [13,14,15].
Major themes in the literature deal with distribution-level impacts and hosting capacity, smart charging and demand-side control, V2G and bidirectional charging, operational and real-time challenges, policy, and markets and stakeholder coordination.

2.1. Distribution-Level Impacts and Hosting Capacity

Many studies evaluate how unmanaged charging increases peak demand, voltage violations, conductor/transformer loading, and unbalance, which reduce the hosting capacity of feeders. Papers use feeder simulations with projected EV adoption scenarios to quantify where and when upgrades are needed. Studies repeatedly find that local transformer overloading and feeder voltage limits are the first bottlenecks, not bulk transmission, in typical scenarios [16].

2.2. Smart Charging and Demand-Side Control

A large body of work shows that delaying or modulating charging via smart charging algorithms (centralized or market-based) greatly reduces peak loads and defers capital upgrades. Reviews of smart-charging strategies (including market-based approaches) show they are effective in model studies and pilots but require interoperable communications, consumer incentives, and regulatory clarity [17].

2.3. Vehicle-to-Grid (V2G) and Bidirectional Charging

Recent comprehensive reviews and agency reports highlight V2G as a potential source of flexibility (frequency regulation, peak shaving, and resilience), but practical deployment is still limited by battery degradation concerns, aggregator business models, and standards and interconnection rules. The Department of Energy (DOE) in the US and several recent review papers stress that V2G can help but only if policy, controls, and compensation mechanisms align [18,19].

2.4. Operational and Real-Time Challenges

Papers analyzing real-time operations point to state estimation, visibility, and distribution system operator (DSO) operational tools as being underdeveloped. Real-time coordination is more difficult when high-power DC fast chargers (HPC) are involved; these create short, intense demand spikes and require different mitigation than overnight residential charging [20].

2.5. Policy, Markets, and Stakeholder Coordination

The readiness of grids is not only technical. Reviews emphasize regulatory changes (tariffs, interconnection, and data sharing), utility business model evolution, and consumer adoption incentives. Large agency reports and recent papers call for coordinated planning between utilities, automakers, charging providers, and regulators [13,21].
Here are five statements about the most load-bearing conclusions from the recent literature.
(1)
Unmanaged charging often creates local distribution problems before bulk grid problems appear. Upgrades (transformers, service runs) may be needed in high-penetration neighborhoods [22].
(2)
Smart charging can defer or avoid many upgrades and integrate more renewables by shifting the load to midday or off-peak periods [23].
(3)
V2G could provide valuable services, but real-world uptake is limited by economics, standards, and battery warranty concerns; more pilots and market designs are needed [24].
(4)
High-power fast charging is a special case: it can create severe short-term peaks and may require local storage, dedicated grid upgrades, or managed queuing/CS scheduling [25].
(5)
Policy and coordination are critical: technical solutions alone will not scale without tariffs, interconnection policy, and data privacy frameworks [13].

3. Increased Electricity Demand and Strain on Grids

3.1. Charging Infrastructure Planning

How much charging power should be installed to support each new EV added to the fleet?
This is commonly expressed in kilowatts (kW) of the charger capacity per EV.
Rule of thumb:
  • Residential/light-use scenario:
~1 to 2 kW per EV;
  • Public and commercial infrastructure:
~2 to 7 kW per EV;
  • Fast-charging focused (urban, highway):
~10 to 15+ kW per EV.
Examples (from global averages):
  • U.S. target (Department of Energy (DOE), National Electric Vehicle Infrastructure (NEVI) plans):
~0.3 to 0.5 kW of public charger capacity per EV;
  • South Korea (2023):
~1.2 public chargers per EV, averaging ~7 kW per charger, so about 8.4 kW/EV (but overbuilt compared to many).
Energy Use Estimate per EV
How much energy must the grid support per EV per year (for charging)? It is a different measure:
  • Average EV consumption: ~15–20 kWh per 100 km;
  • Annual driving (global average): ~12,000–15,000 km/year;
  • 1800–3000 kWh/year per EV.
So, grid planning must support that much energy (not power) per EV.
For grid or station designers planning EV infrastructure, a basic planning guide might look like Table 1.

3.2. Grid Stress and Electric Vehicle Transition

Switching to non-emitting transportation could lead to higher energy demand. The increase in EVs is not necessarily an issue tied to energy. The growing number of EVs will not likely pose an energy issue but instead a capacity challenge in distribution networks, as in an extreme situation where every household charges simultaneously alongside their typical electricity usage. Simultaneous EV charging, for a given grid, could lead to peak load management challenges, particularly during high-demand periods. This kind of circumstance can intensify surges in demand. This problem will require upgrading transformers, substations, and distribution systems to manage increased loads. The implementation of sophisticated grid management systems, like real-time surveillance and predictive analysis, should also be considered.
At present, home charging is certainly the favored choice for EV users [26,27] when it is possible. Charging an EV at home or at public stations impacts power demand and, consequently, creates strain on the grid. The charging infrastructure required to power the forthcoming EV fleet is expected to lead to significant spikes in electric load growth, and most existing grids are not equipped to meet this energy demand. To fully support the EV revolution and decrease emissions from this sector, faster and smarter grid planning is necessary.
Considering an EV’s typical energy usage of 0.20 kWh for every kilometer or 0.32 kWh for each mile [28,29], the average energy needed for the daily travel of individuals can be examined.
The U.S. Department of Transportation states that the average American drives 13,476 miles annually, which is about 36.92 miles each day. By utilizing the typical energy usage of an EV, a residential EV charger would consume approximately 11.81 kWh daily to restore its driving range. This equates to approximately 353.3 kWh each month and 4310.65 kWh annually.
Driving behaviors differ greatly among European nations, but the EU average is approximately 2814.20 miles annually, which translates to 7.7 miles daily. In this scenario, a residential EV charger would consume approximately 2.48 kWh daily, which totals 74.40 kWh monthly and 905.20 kWh annually.
Table 2 below compares the current installed capacity of 20 countries with the highest EV penetration rates and the power required if all the entire fleet was made of EVs and would be recharged simultaneously with an average power of 7 kW per vehicle. Obviously most home chargers are between 2 and 3 kW, but public level 2 chargers are up to 7 kW, and some EVs, such as Teslas, are charged with power over 7 kW. Only three countries, those with the highest EV penetration rate in the list, have an installed capacity greater than that potential demand: Norway, Iceland, and Sweden. These three countries have a grid with the potential to simultaneously power the entire fleet if it was to be made up exclusively of EVs. All the other countries on the list present a deficit. Norway, Iceland, and Sweden present, as well, a very high ratio of renewable energy percentage in their total installed capacity. The USA and China present the highest power deficit.
Countries with the lowest ratio of EV charging demand vs. installed power may need a strategy in case of a surge. Even though grids are being upgraded, the main problem to solve is how to guarantee that the progress in grid development is not too far behind the progress of the EV fleet, and there is a real management strategy as to the offer of fast public charging stations.
Norway and Iceland, occupying the top two positions for the rate of EVs in new registrations, are significantly ahead of other nations in the group of countries with the highest proportions of EV uptake, as shown Table 1 [11,12]. It is probable that these two nations will achieve 100% of new EV registrations within the next few years [11,12]. Norway and Iceland showcase characteristics that align with the EV transition. They hold the first and second positions in GDP per capita within the provided countries, second and first in lowest density of population density, second and first in kWh per capita, and are average regarding the number of vehicles per 1000 inhabitants but are highly urbanized with an extremely low population density (Table 1). These elements indicate that both Norway and Iceland possess the financial capacity to purchase EVs and demonstrate resilience in their energy sectors, aligning with grid preparedness and suitability for the transition to EVs (Table 1). Based on Table 1, Norway, Iceland, and Sweden are the only three countries among those listed to have an installed capacity out pacing the demand that would come from the entire fleet if it was completely electrified presently.
Conversely, countries with a dense population, low kWh/per capita production, a high vehicle count per capita, low GDP per capita, and a high kWh to liter of fuel ratio [11] will likely encounter significant difficulties in ensuring a considerable share of EVs in their fleet. These nations will require significant structural changes, especially to align the power sector with the EV transition.
Public charging stations may be a necessity to solve the problem of range anxiety and also solve the issue of grid strain, as they allow for the control of the maximum number of EVs that can be charged simultaneously. This is particularly the case in densely populated urban areas where home charging is not an available alternative. This can be well illustrated by the example of South Korea. As of 2024, the number of registered cars in Seoul, the capital city of South Korea, was 3,191,162. It means that Seoul citizens own one car per 2.94 people. This is about one person different from the 1.98 to 1 nationwide [33]. South Korea is gradually transitioning to electric transportation. Considering worries regarding the impending climate crisis, South Korean car manufacturers and battery companies are collaborating with the government to hasten the uptake of EVs. As a key player in the worldwide automobile industry, South Korea seeks to boost the domestic market share of EVs and deliver 4.5 million units by 2030, prioritizing eco-friendly vehicles. In 2023, South Korea saw the registration of 543.9 thousand EVs, marking a significant rise since 2013. Along with hybrid and hydrogen vehicles, the percentage of eco-friendly vehicles among all registered vehicles in South Korea was approximately 8.2 percent in 2023 [34].
In response to the problem of grid strain and increasing demand, public charging stations seem to be an adequate solution to guarantee a successful EV transition. The development of charging infrastructure is essential for enabling the worldwide transition to electric transportation. Public charging stations are essential to the EV ecosystem, alleviating range anxiety and providing easy access to charging for EV owners who lack a charging station at home or are frequently traveling. As per the IEA, by the end of 2023, there were 2.7 million public charging stations globally, with over 900,000 established in 2022. Although home charging primarily satisfies most charging requirements, public charging infrastructure remains essential for promoting EV adoption, particularly in densely populated urban regions where home charging is significantly less common.
Faster, more powerful EV charging stations amplify the positive and negative impacts that these stations can have on the grid. One 350 kW charger impacts the grid similarly to 50 smaller 7 kW chargers operating concurrently. However, the 350 kW charger will not be allocated among different feeders or substations as 50 smaller 7 kW chargers would be. Another difference is that the individual 350 kW charger ought to be easier to manage because there is only one control point. However, the strongest EV charging stations tend to be the least flexible, making them less compatible with charging management systems. This happens as the most powerful EV charging stations, level 3, are used in situations where time is restricted. Consequently, customers using fast EV charging stations have not set aside time for a slower charge or any wait times required for grid requirements. Additionally, EV charging stations do not always operate at their full power capacity, and the charging rates for EVs vary when power sharing is enabled among nearby chargers. These are elements concerning EV charging stations that may be influential as charging prices continue to increase.
Since 2019, China has established over a million new public charging stations, showing an unparalleled commitment to EV infrastructure compared to any other nation in recent years. South Korea is at the forefront regarding public charging stations for every 1000 EVs. As per IEA data, at the close of 2022, South Korea boasted 201,000 public chargers for its 357,000 plug-in electric passenger vehicles, which translates to 563 charging stations for every electric car—the highest density among the largest EV markets globally.
China boasts 1.76 million charging stations, making up nearly two thirds of the global public charging network; however, because of its large EV population, the nation ranks third in chargers available per EV on the road. In that regard, the Netherlands stands in second place, boasting 235 public chargers for every 1000 EVs.
Seoul has one of the highest urban densities of population in the world (Table 2). The example of South Korea leading the number of charging stations per 1000 EVs (Figure 3) is the main proof that these charging infrastructures are one of the best responses to grid stress due to EV fleets.
Countries with the lowest density of population show a lower number of charging stations per 1000 EVs, as is the case in Norway that presents the highest EV penetration rate and one of the lowest densities of population. Home charging is the main option in Norway.
Based on Table 3 below and Figure 3, countries with higher densities of population, particularly in urban areas, have opted for public charging stations to guarantee the EV transition. The availability and adequate distribution of public charging stations allow for good control of grid management as well and avoids any risk of a power surge. Nevertheless, the challenge is to have the development of charging stations match the penetration rate of EVs, as most nations are still in the early stage of EV adoption.
There is an impact of public EV charging stations on grid strain. Public charging stations, especially fast chargers, can significantly increase electricity demand, particularly during peak hours. In dense urban areas like Seoul in South Korea, simultaneous charging by multiple EVs can strain local distribution networks, leading to voltage drops, transformer overloads, and increased grid instability. This is especially critical if the infrastructure was not originally designed to handle high, sudden loads. The challenge intensifies with the high penetration of EVs and clustering of charging stations in specific zones (malls, apartment complexes). Mitigating these effects requires smart grid technologies, time-of-use pricing, demand-side management, and the integration of local renewable energy and energy storage systems to reduce reliance on the main grid during high-demand periods.
As an illustration, let us consider an urban district and evening peak load scenario. In a busy urban neighborhood, a new EV charging hub with 10 DC fast chargers (each rated at 100 kW) is installed near a shopping mall. During the evening rush hour (5–8 PM) when residents return home and electricity demand is already high, 8 out of 10 chargers are occupied simultaneously. This adds a sudden load of 800 kW to the local grid.
The area’s existing transformer was originally designed for a maximum local load of 1 MW, already operating near 90% capacity during peak hours. The added EV charging demand causes the transformer to exceed its limit, resulting in
  • Voltage fluctuations;
  • Overheating of grid components;
  • Risk of localized blackouts or the need for load shedding;
  • Reduced lifespan of equipment due to overuse.
Cities can manage this challenge to prevent such grid strain. Utilities might implement
  • Smart charging systems that schedule EV charging during off-peak hours;
  • Battery energy storage at the station to buffer demand;
  • Time-of-use pricing to discourage peak-hour charging.
Growing electricity demands and the pressure on grids create challenges for the real-world application of charging solutions. There is the possibility of infrastructure being overwhelmed. Local distribution networks and transformers were not created to handle peak loads from EVs. In regions with concentrated EV usage, there is a danger of regular outages or infrastructure breakdowns. Improvements are necessary, but they come at a cost. Increasing grid capacity (such as substations, cables, transformers) requires substantial capital investment. Utilities must seek funding or incentives to actively improve the infrastructure. In comparing charging time to grid peaks, EVs are frequently charged during evening peak times when home demand is already elevated. In the absence of load-shifting incentives, this deteriorates peak demand curves. Due to constraints in urban areas, such as in densely populated cities like Seoul, there is a lack of physical space available for the installation of high-capacity chargers. Renovating buildings or sites presents intricate permitting and construction difficulties. Coordination gaps and inadequate collaboration among utilities, city planners, and private charging providers hinder the rollout. Insufficient uniformity in charging infrastructure hinders grid integration. Regulatory obstacles exist; extended approval processes for grid enhancements or charger licenses hinder progress. Obsolete regulations might overlook the requirements of EV infrastructure. The use of renewable energy is still behind; EVs are best suited for the integration of renewable energy, yet numerous grids remain reliant on fossil fuels. Without pairing solar/storage, EVs can elevate carbon intensity during peak periods.

3.3. Renewable Energy and Off-Grid Charging Solutions

A stationary off-grid EV charging station generally employs renewable energy sources like photovoltaic solar or wind to generate electricity and store it in batteries. This configuration is perfect to reduce stress on the grid or for areas with restricted or inconsistent grid availability. This approach is eco-friendly and may be economical over time or drive subsidies if necessary. The worldwide off-grid EV charging market is projected to hit USD 1.2 billion by 2028 [37], fueled by increasing EV demand, investments in renewable energy, and the development of battery technology. EVs can, as well, facilitate higher integration of renewable energy sources by using their batteries to store excess generation. This concept of Vehicle-to-Grid (V2G) [7,8] is gaining popularity in different parts of the world. Advantages of off-grid EV charging stations comprise energy autonomy, reassurance, scalability, eco-friendliness, enhanced accessibility, readiness for emergencies, and, obviously, less stress on grids. Off-grid EV charging stations provide advantages that render them an appealing option for sustainable and dependable EV charging. Off-grid EV charging solutions decrease reliance on the utility grid, lessening the effects of grid-associated strain. Using renewable energy sources such as solar power for off-grid charging aids in lowering carbon emissions and conserving natural resources. Utilizing clean energy, off-grid charging stations promote a more sustainable future and support international environmental objectives.
Factors to consider encompass greater upfront investment expenses, reliance on weather, battery storage capabilities, and maintenance needs. In fact, off-grid EV charging stations provide numerous advantages, yet they also entail certain considerations and limitations. For photovoltaic energy, this may pose a restriction for regions with insufficient sunlight or during times of prolonged cloudiness. The capacity of battery storage in off-grid EV charging stations can influence both the charging speed and obviously the number of EVs that can be charged. The space area needed for solar panels may be a major challenge in urban areas. Despite these obstacles, off-grid EV charging stations [38] provide a dependable and sustainable option for charging electric EVs and solve the problem of grids’ lack of readiness.
Standalone solar charging systems, as a developing business, are gaining popularity for single households. They remain practical to charge one vehicle per household without much challenge.
The integration of renewable energy presents challenges to power EV charging stations. The standalone mobile EV rapid charging stations come with integrated batteries, making them ideal for charging EVs anytime and anywhere, as it is, presently, for gas stations and ICE vehicles. The advanced, possibly mobile, EV chargers offer unparalleled flexibility and effectiveness, allowing for a seamless, practical charging experience. The state-of-the-art charging station combines innovative DC fast-charging technology with the most secure lithium-ion (Li-ion) battery chemistry, ensuring ample energy to recharge electric vehicles. These battery packs can be charged primarily using renewable energy sources but, as well, if needed, the electrical grid or a DC fast charger, guaranteeing that EV owners are always ready to power up.
These stations quickly deliver fast charging to all electric vehicle models that are DC-compatible. This improves the availability of charging for various electric vehicles. Customize your charging experience by selecting various power outputs and battery sizes to meet individual requirements.
Figure 4 represents types of off-grid EV charging stations with the grid as a backup; this may represent the future of electric transportation, as they allow fast charging. They alleviate grid pressure and enable opportunities for renewable energy advancements and energy storage options for the integrated decarbonization of road transport. Consideration should be given to regulation and cost. The updated subsidy guidelines may necessitate that investors work closely with decision makers to guarantee access to EV charging infrastructure and reduce range anxiety for electric vehicle owners.
In a successful transition to EVs, off-grid solar charging stations will take the place of existing gas stations due to their effective integration, particularly in densely populated areas. Nonetheless, significant challenges exist, such as cost, battery lifespan, and, primarily, the current energy density of Li-ion batteries, which will require considerable space for energy storage to match the capacity of existing gas stations. The current Li-ion battery technology is projected to provide approximately 10 years of functionality before requiring replacement [39].
To achieve practical integration of battery off-grid charging stations, battery technology must improve its energy density significantly to align with the widespread adoption of EVs. A typical gasoline-powered vehicle comes with a fuel tank of 13 to 16 gallons (50 to 60 L), while an electric vehicle generally has a battery capacity of around 40 kWh on average. Gas tanks at service stations typically hold between 12,000 and 24,000 gallons, allowing them to refuel around 750 to 1500 vehicle tanks. To achieve the same capacity of an off-grid Li-ion battery station, a range of 60,000 kWh to 120,000 kWh will be required. To achieve a density of 500 Wh/L, the total volume required will range from 120,000 to 240,000 L or 120 to 240 m3, which is roughly equivalent to 2 to 4 × 40 ft containers.
A more cohesive implementation of off-grid solar-powered EV charging stations will necessitate advancements in battery technology. For example, to store 45.42 m3 (12,000 gallons) of battery energy to charge 750 electric vehicles, the energy battery density required would need to be at least around 120,000 kWh/50 m3, which is 2400 Wh/L compared to the current density of under 1000 Wh/L. Indeed, Li-ion batteries usually possess energy densities that range from 150 to 250 Wh/kg or 300 to 700 Wh/L. The figure of 2400 Wh/L equates to almost 1000 Wh/kg.
Moreover, to power an off-grid 60,000 kWh battery system with solar photovoltaic under an average of 6 sun hours per day using 20% efficient solar panels, it will require 10 MW of solar panels, which equals roughly 50 × 103 m2 (=5 ha). Clearly, such projects would be quite impractical, particularly in urban areas.
Table 4 compares the characteristics of a gas station vs. an off-grid EV charging station. The density of energy in gasoline allows for much smaller size stations, while an equivalent off-grid EV charging station would need much more space for the battery, and the installed solar capacity would cover surface areas not generally available in urban areas.
There is a need for technical improvements to achieve the competitive replacement of gas stations with off-grid charging stations for EVs. The cost of Li-ion batteries, as well, will need to drop for investors to massively invest in the upcoming business.
There is an alternative to the replacement of gas stations. Fast-charging hubs can support long-term scalability and are ideal for highway corridors or EV-dense zones. Gas station replacements are more accessible in cities but may struggle with future demand without infrastructure upgrades. Here is a comparison between EV fast-charging hubs and traditional gas station replacements:
  • Fast-Charging Hubs
Purpose: Built from the ground up for high-throughput EV charging.
Location: Often located at highway exits, malls, or dedicated charging zones.
Capacity: 10–50+ chargers; supports simultaneous fast charging (50–350 kW).
Design: Optimized for EV traffic flow, short wait times, and grid infrastructure.
Grid Impact: High peak demand; often equipped with energy storage or smart-grid tech to buffer strain.
Vision: Serves as a new model for electric mobility infrastructure.
  • Gas Station Replacements
Purpose: Retrofit of existing gas stations to add EV chargers.
Location: Urban and suburban fueling stations.
Capacity: Typically 2–4 chargers due to space and grid constraints.
Design: Limited redesign; may cause bottlenecks if EV volume increases.
Grid Impact: Lower per-site demand, but less optimized for large-scale charging.
Vision: Transitional model to integrate EVs into existing fuel networks.
Solar-integrated EV charging is generally more feasible at rural/depot or suburban sites than in dense urban cores, not because the sun is “worse” in cities, but because shading, space, and load profile mismatches bite harder.

3.4. Grid Context

  • Urban feeders: More capacity but also more constraints/transformer loading and longer interconnection queues in hotspots.
  • Rural feeders: Weaker lines/voltages, but easier land/staging for on-site storage and bigger PV to manage peaks.

3.5. Load Profile (This Matters as Much as the Sun)

  • Workplace/daytime L2 aligns well with the solar curve → high PV self-consumption with minimal storage.
  • Residential/evening or highway DCFC is anti-solar (evenings/weekends, stochastic peaks) → storage or grid import becomes key.
  • Fleet depots (school buses, municipal, and delivery): Predictable dwell times; often ideal for PV + storage arbitrage and demand-charge control.

4. Power and Energy Demand from EV Fleet: Case Study of the USA

EVs represent the future of transportation, provided that sufficient energy can be produced to fuel the entire new fleet. The existing charging practices for EVs will not be sustainable for the grid unless adjustments are implemented prior to achieving net-zero targets for EVs. Significant funding is required for a successful transition to EVs. The grid will undergo considerable stress without substantial investments and modifications in charging behaviors. Policy makers should urge the consideration of utilities that promote daytime charging and motivate investment in charging infrastructure to transition drivers from home to their workplaces for charging. Management solutions for charging and grid enhancements to support fast EV charging stations can control the electric load that EVs contribute to the grid both in time and space. Controlled charging offers significant benefits to the utility by preventing expensive upgrades to the grid. Shifting the EV load from peak periods to off-peak times will reduce the total expenses of EV-related grid enhancements. This is usually accomplished by transmitting a price signal to EV owners, which can be executed via conventional managed charging methods, unidirectional from the grid to the vehicle, or bidirectional charging approaches, occurring both from the grid to the vehicle and in the opposite direction. Managed charging strategies represent one of the easiest methods to divert EV charging from peak grid loads by making charging away from home relatively cheaper. By avoiding expensive grid upgrades, utilities can transfer those savings to EV owners, encouraging them to engage in managed charging. These incentives consist of time-of-use pricing, demand response rates, and real-time pricing, among others. The savings for EV owners could lower the overall cost of ownership, which is likely to boost EV sales.
Approximately 80% of EV charging in the U.S takes place at home, while the remaining 20% happens at public charging stations [40]. Nevertheless, the quantity of EV charging stations has increased more than twofold since 2020. In December 2020, the Department of Energy announced that there were almost 29,000 public charging stations across the country [41]. As of February 2024, that figure had risen to over 61,000 stations [41]. More than 95% of Americans now reside in a county with at least one public EV charging station [42]. EV charging stations are easiest to reach for people living in cities: 60% of urban dwellers reside within a mile of the closest public EV charger, in contrast to 41% of suburban residents and merely 17% of rural individuals.
Nighttime home charging loses the potential of solar energy, as presented Figure 5, and puts more stress on the grid, and there are limitations on the acceptable integration of wind energy in urban areas.
Figure 5 shows how a mismatch between the charging time of EVs and the availability of solar energy can waste the potential to relieve stress on the grid.
The grid carries significant consequences. Two significant implications stand out: firstly, the price signals do not correspond with what is optimal for the grid and for ratepayers. The second point is the need to think about investments in charging facilities for workplaces.
Daytime charging might decrease electricity demand in comparison to home charging, which is mostly performed at night. This requires enabling drivers to charge their EVs at their convenience outside their residence, making use of work or public charging stations, and restricting home charging. Along with minimizing grid effects, charging during the day can utilize surplus electricity generated from solar photovoltaic at peak production times. Nonetheless, this solution could render EV charging less convenient and might not be appreciated by EV owners.
A frequently employed tactic to shift the EV peak demand away from the grid’s net peak is for utilities to communicate price signals to EV owners via time-of-use pricing or demand response rates. Real-time pricing is another possibility but has typically only been used in pilot projects so far. Such pricing strategies can motivate EV owners to recharge their vehicle during less busy peak hours.
Intelligently managed charging approaches charging rate indicators typically depend on the EV owner’s knowledge of fluctuating electricity costs. Nonetheless, there are intelligent charging methods where a controller begins charging at predetermined times based on utility pricing or grid conditions as variables.
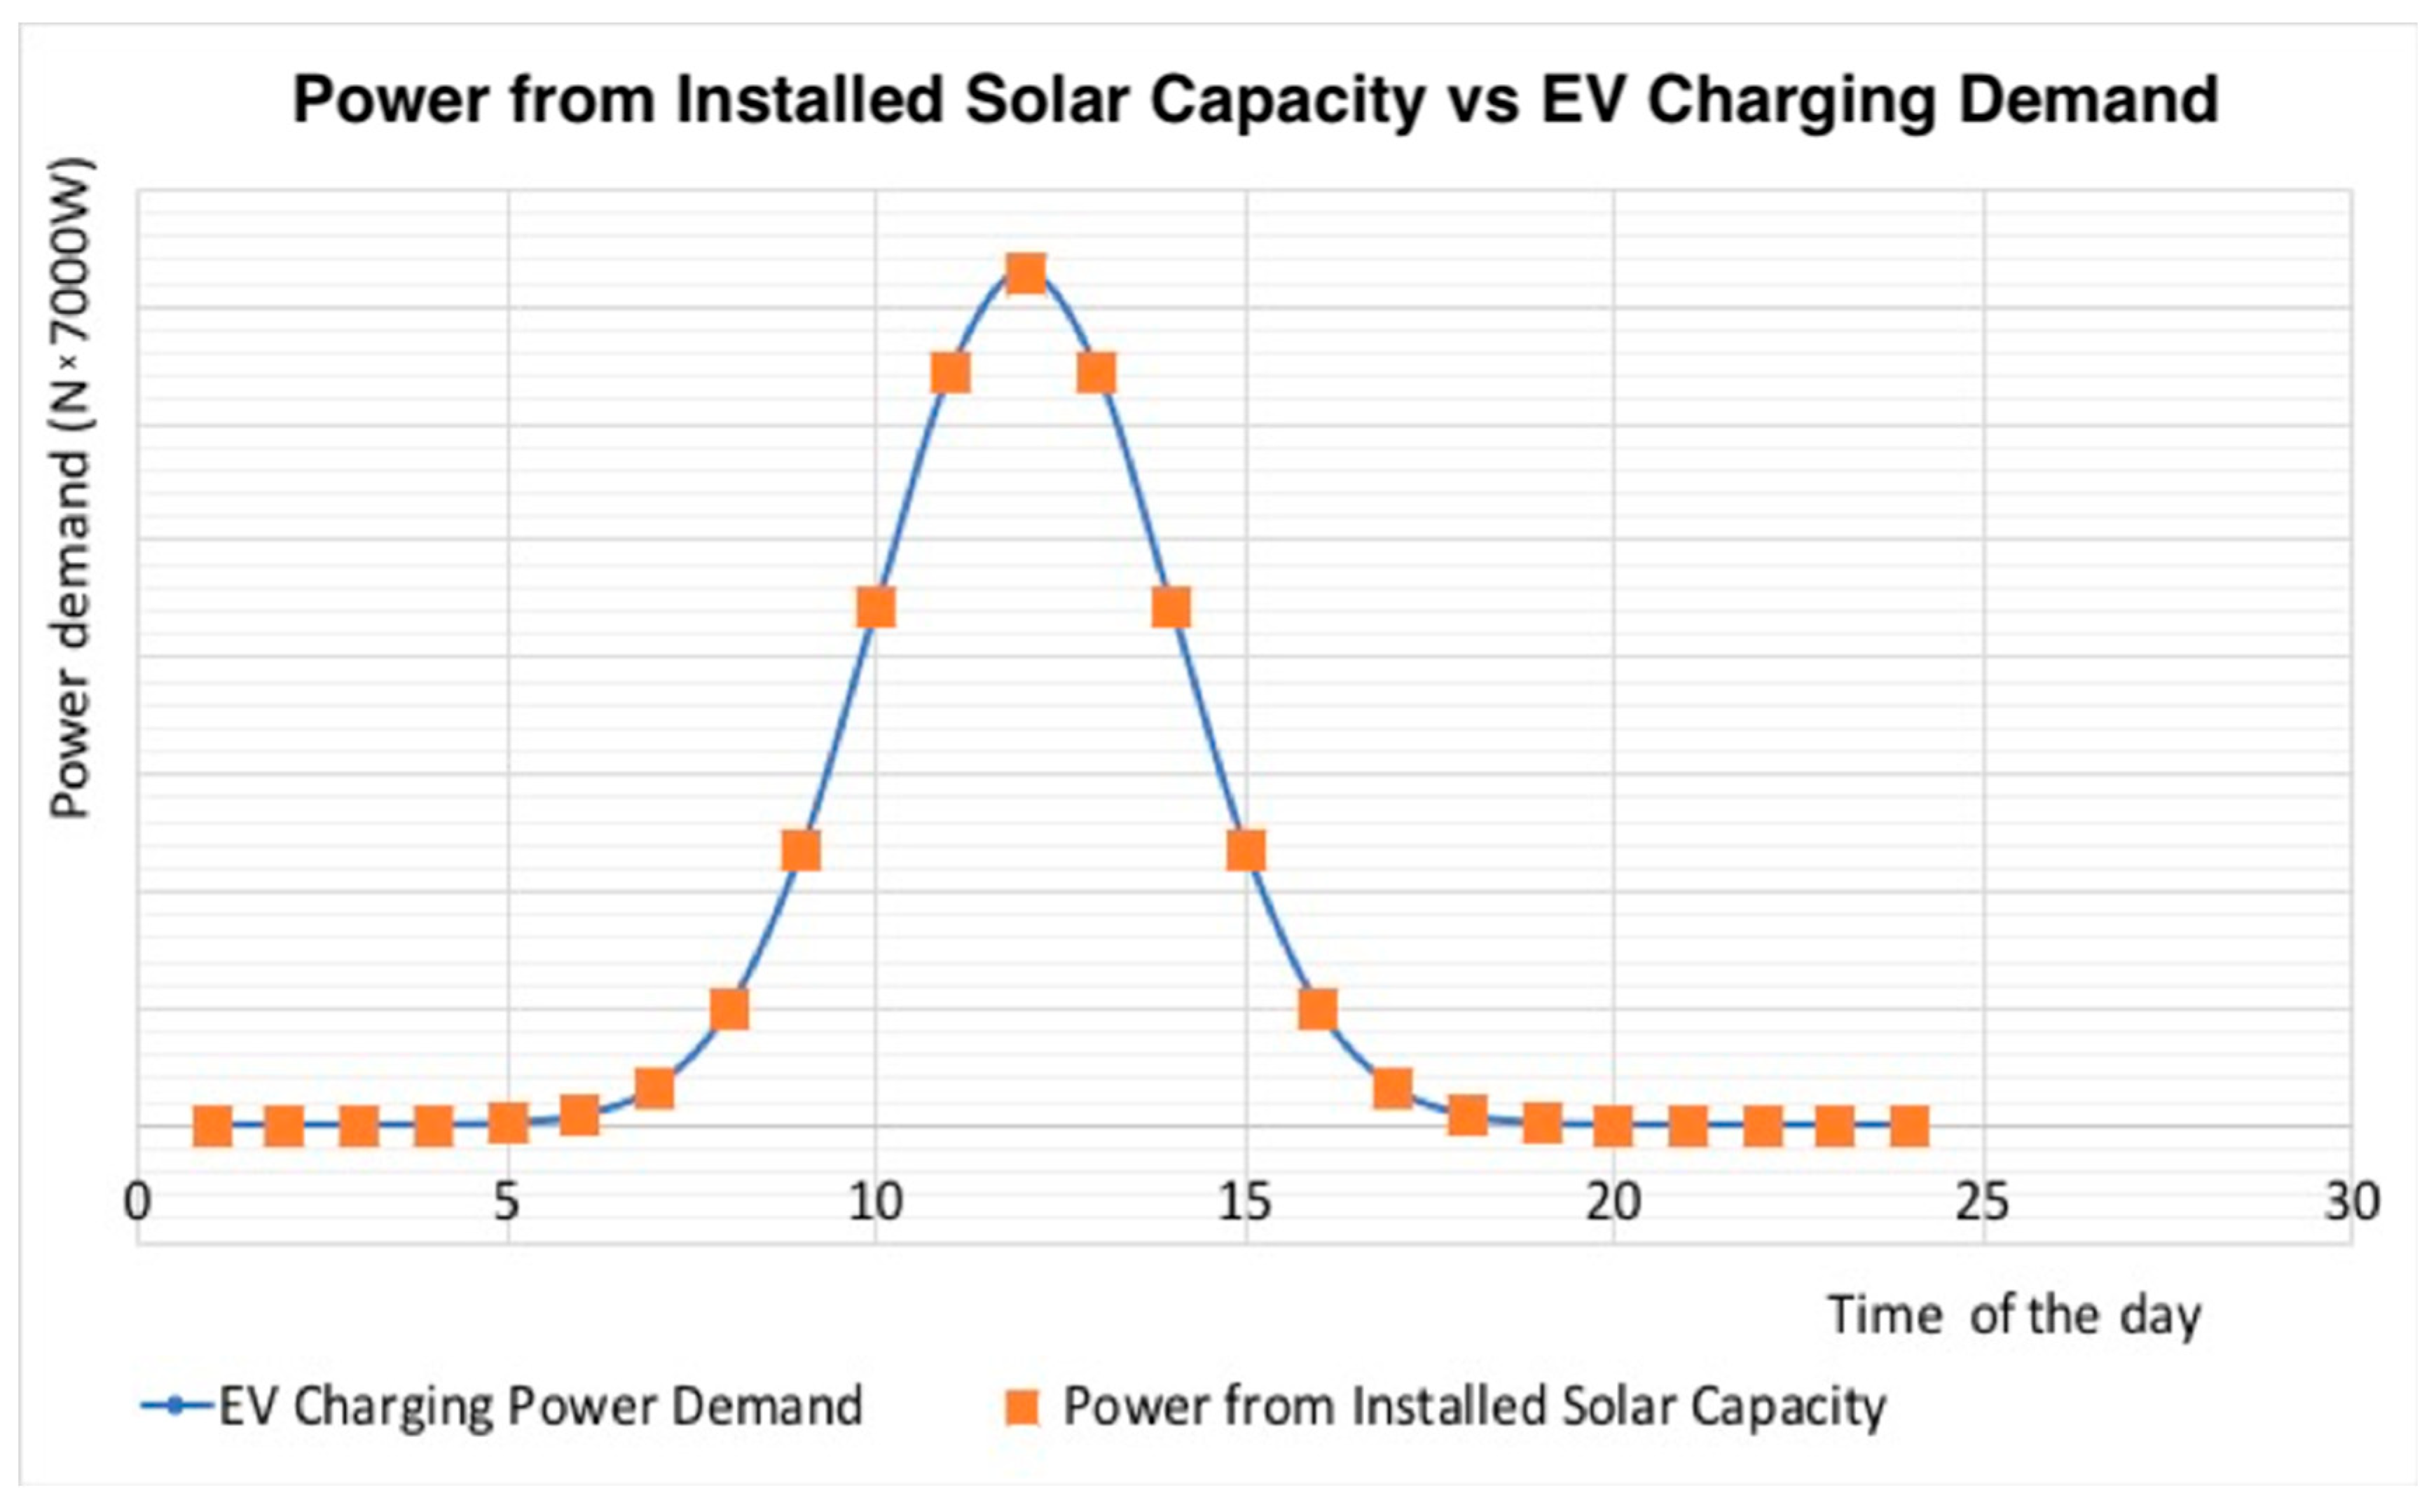
An ideal scenario would correspond to Figure 6 below. With a given proportion, the peak charging time for EVs corresponds to the peak generation of photovoltaic solar energy and giving the full sense of V2G.
Figure 6 shows how a good match between the charging period of EVs and the availability of solar energy can relieve pressure on the grid.
According to the World Economic Forum’s 2021 [43] report ‘Getting to Net Zero: Increasing Clean Electrification by Empowering Demand,’ smart technology that enables consumers will be essential for delivering flexible, resilient, and sustainable energy. The future role of V2G will enable the bidirectional energy flow between EVs and the grid and vice versa. V2G will enhance the power grid’s capacity during times of peak demand, alleviate local congestion, and act as a safeguard against power intermittency. It will additionally assist in decreasing the overall expense.
Readying the grid to support load growth and charging infrastructure may be difficult. The grid designed to handle load increases poses new challenges for utilities and grid operators. Currently, utilities develop infrastructure based on service requests, with some integrating broader system growth strategies that utilize conservative load growth forecasts. Nonetheless, the electric demand from EVs is anticipated to hit approximately 1500 TWh per year by 2050, about the same as the electricity usage of the whole US residential sector in 2018. Most utility load predictions and infrastructure strategies do not presently consider this increase in demand.
Moreover, the distinct traits of EV charging, particularly the substantial and immediate power requirements for fast chargers, set apart the load increase linked to transportation electrification from other types of load growth that utilities are familiar with managing. Utilities are utilized for constructing reactively instead of proactively. For instance, when servicing a newly constructed apartment complex, utilities have sufficient time to prepare during the construction phase, making it straightforward to forecast and control the upcoming demand. However, a swiftly expanding EV market generates a completely new demand to provide substantial amounts of power where it has not been traditionally required and with significantly shorter lead times.
To keep up with the rapid increase in EV adoption, utilities must act swiftly to ready the grid for this new kind of demand. However, conventional utility business frameworks and regulations, which effectively cater to reactive strategies for additional demands like new residential complexes, presently do not permit the forward-thinking grid investments required by EVs. The uncertainty about the exact charging requirements of EVs such as when, where, and how much stands in stark contrast to regulatory demands for the prudence of investments, aimed at minimizing costs for ratepayers.

4.1. Installed Capacity and Energy Consumption in the United States

The United States is the second biggest consumer of energy overall and specifically of oil and refined products [44]. Nonetheless, the existing and projected capacity and consumption are enhancing towards a situation of reduced imports and more effective utilization of all energy resources. The large new reserves of oil and natural gas from domestic shale are dramatically transforming the perspective on future self-sustainability. The ongoing advancement of “renewable” and “alternative” energy sources will lessen the dependence on conventional “fossil” fuels.
Petroleum primarily utilized for transportation holds the largest portion at 36%. Natural gas ranks second, accounting for 32% of energy consumption [44,45,46,47]. Even though the electricity ratio in the transportation sector is currently minimal and it was the same from the early introduction of EVs (under 0.2%) [48], EVs present an opportunity for this sector to greatly decrease petroleum use via electrification. Light-duty vehicles account for over 60% of the energy used in transportation today, positioning them as the central target of electrification initiatives [49]. Medium- and heavy-duty vehicles represent the next largest category (about 20%), and although some of these might be electrified, it is challenging to rival diesel powertrains in these uses. The probable load profile for medium- to heavy-duty vehicles is also quite uncertain, complicating the creation and integration of their corresponding load profiles into the models.
Table 5 below shows the very small proportion of electric energy used in the sector of transportation. Nevertheless, the most determinant factor is the power, as a surge may occur if all EVs are simultaneously connected to the grid as presented Table 1.
The portion of electric energy used in the transportation sector is still limited, but it is likely to sharply grow in the next years and for 20 consecutive years, as shown by the S-curve, Figure 7, below.

4.2. Energy Demand from EV Fleet

A 7 kW charging power represents the optimal compromise between charging speed, infrastructure constraints, and cost-effectiveness, enabling overnight full charges on residential single-phase networks while minimizing grid impact and supporting global AC charging standards.
Here is a comprehensive justification for 7 kW charging power around technical feasibility, user convenience, infrastructure compatibility, and cost-effectiveness.

4.2.1. Charging Speed and User Convenience

  • Moderate Charging Time: A 7 kW charger provides a balance between fast charging and cost. For a typical EV battery of 50 kWh, the charging time from 0% to 100% at 7 kW is
C h a r g i n g   T i m e = B a t t e r y   C a p a c i t y C h a r g i n g   P o w e r = 50   kWh 7   kW 7.1   h
This makes it ideal for overnight home charging or long dwell-time locations (e.g., workplaces).
  • Improves Adoption: For users without access to fast chargers, 7 kW ensures daily driving needs (30–60 km) can be met with just 1–2 h of charging.

4.2.2. Electrical Infrastructure Compatibility

  • Single-Phase Residential Systems: In many regions (e.g., Europe, Asia), single-phase 230 V systems are standard. At 32 A, the maximum continuous power is
P = V × I = 230 V × 32 A = 7.36 kW.
This makes 7 kW a practical upper limit without major home rewiring.
  • Avoids Grid Overload: Compared to high-power DC fast chargers (50 kW+), 7 kW AC chargers reduce peak demand and lower stress on local distribution networks.

4.2.3. Cost and Infrastructure Efficiency

  • Lower Installation Cost: AC 7 kW chargers are significantly cheaper than DC fast chargers in terms of hardware and grid upgrades.
  • Energy Efficiency: AC charging at 7 kW typically maintains high efficiency (≈94%), reducing energy losses compared to higher current draws.

4.2.4. Vehicle Onboard Charger Limitations

  • Many EVs are equipped with onboard chargers rated 6.6 kW or 7.4 kW, making 7 kW the sweet spot for AC charging without exceeding onboard limits.

4.2.5. Alignment with Global Standards

  • IEC 61851 and SAE J1772 recommend 7.4 kW (230 V, 32 A single-phase) as a standard for level 2 AC charging [51].
  • Used widely in Europe, Asia, and North America for home and public charging.

4.2.6. Grid-Friendly and Renewable Integration

  • At 7 kW, load management and demand response systems can effectively schedule charging during off-peak hours, supporting renewable energy integration without destabilizing the grid.
A comparative figure could compare 3.6 kW vs. 7 kW vs. 22 kW charging times and grid impact.
In 2022, transportation still accounted for less than 0.2% of the total electric energy consumed in the USA, Table 4. The inclusion of EVs in the fleet and the goal to substitute all ICE vehicles with EVs pose significant difficulties for grids. The challenge is more significant for power distribution compared to energy use.
The introduction of EVs as an emerging technology in a specific market can be effectively illustrated by the S-curve [11]. This model is also suitable for forecasting the shifts in overall power and energy needs resulting from an EV fleet. The model illustrates the duration required to enhance the power grid to meet the impending demand.
The rate of adoption for EVs as an emerging technology is illustrated by the S-curve, as shown in the following equation:
R t = 1 1 + e x p α t k
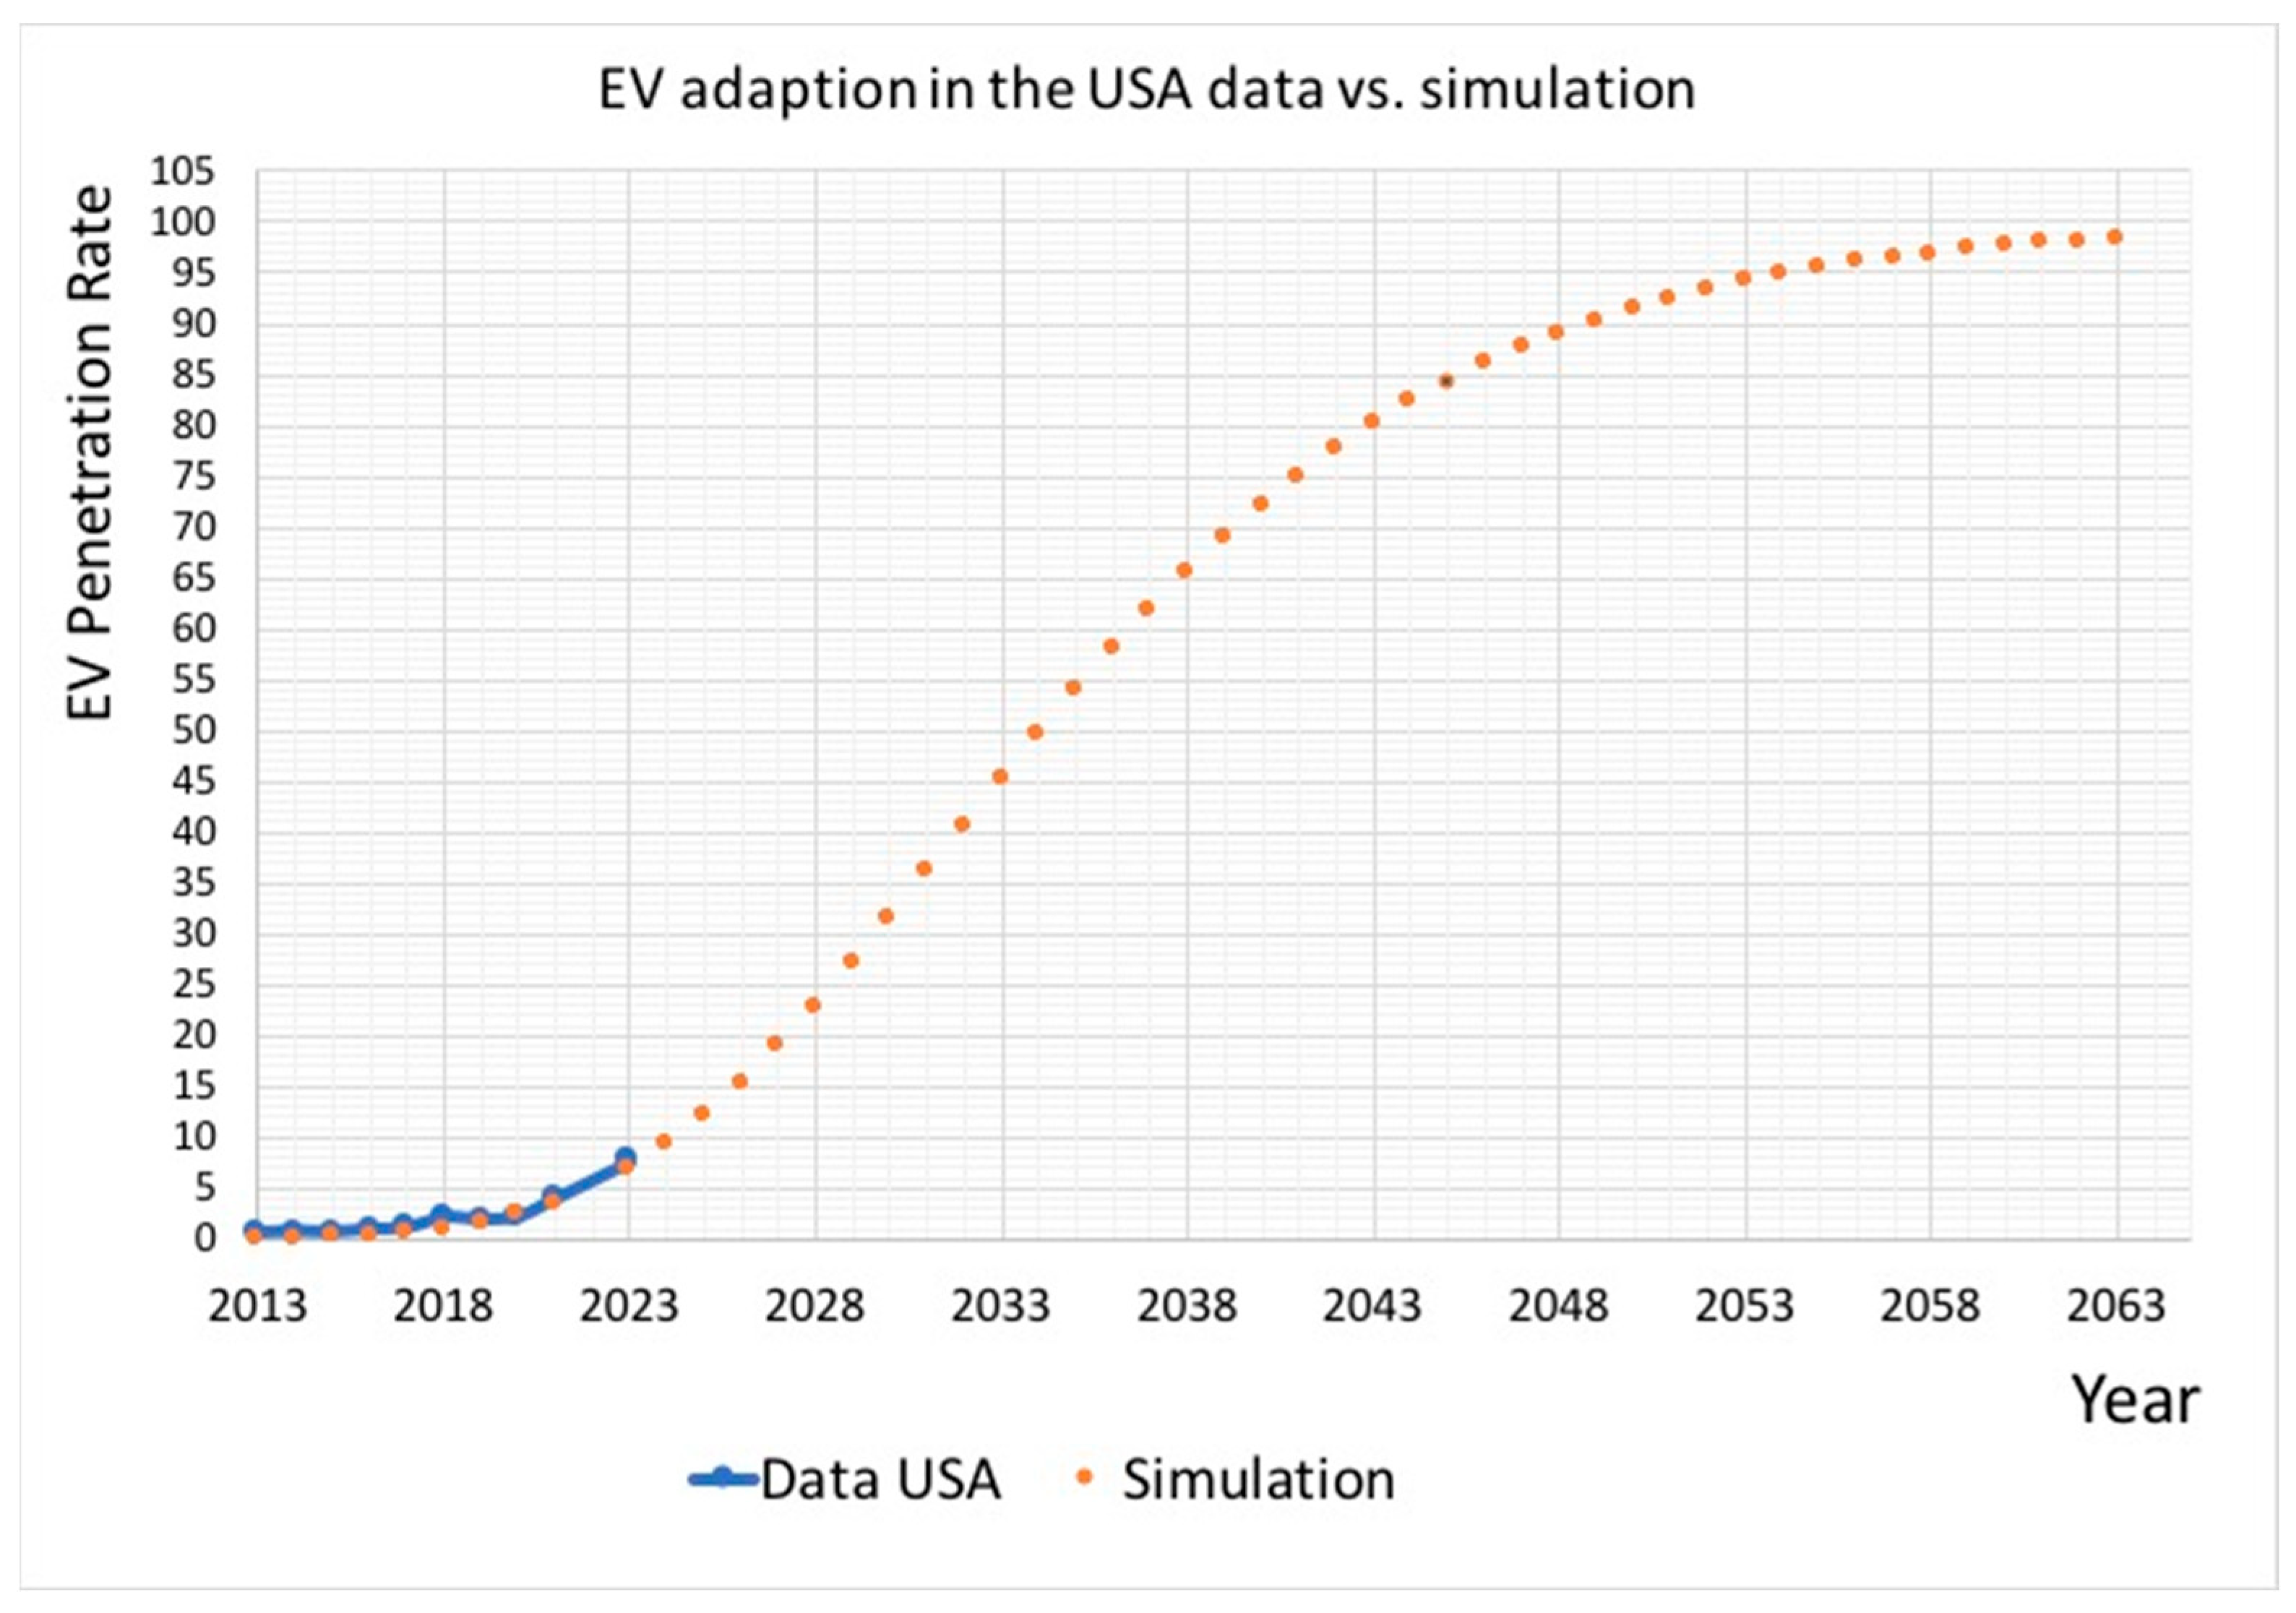
where α and k are derived from an empirical approach [11,12]. The penetration of EVs in the US market illustrated in Figure 7 is defined by: α = 0.13 and k = 11.1 [11,12].
A detailed study of the S-curve and the derivation of values α and k are presented in References [11,12].
Figure 7 shows that it will take about 50 years in the USA for all new registrations to be made of EVs if the same trend is to continue, considering a meaningful uptake from 2013. The main problem will result from the rapid growth of the EV fleet in the 20 years between the 10th year of introduction to 30 years. The first 10 years will not generate a real challenge for the grid if the progress in EV adoption is very slow, corresponding to the first phase of the S-curve (Figure 7). Utility companies will need strategies to promptly react to power generation capacity and management systems.
N (t) = number of vehicles
NICE (t) = ICE vehicles fleet
NEV (t) = EVs fleet
N(t) = NEV(t) + NICE(t)
N t = N 0 1 + β t
β is the growth rate of the total fleet.
N E V t = N t R t
Average yearly energy demand per EV:
USA: 4310.65 kWh annually;
Europe: 905.20 kWh annually.
Evolution in EV-related energy demand in the USA:
Regarding the US market as a reference, the US Motor Vehicles Sales Growth rate is updated monthly, available from January 1977 to December 2024, and an average growth rate of 1.8% through 2050 is considered in this manuscript.
The USA market is characterized by α = 0.13 and k = 11.1, based on actual data and an S-curve-based simulation, as presented in Figure 7.
β = 0.02 is a realistic estimate.
Some 283.4 million vehicles were registered in the United States in 2022. The figures include passenger cars, motorcycles, trucks, buses, and other vehicles. The number of light trucks sold in the U.S. stood at 10.9 million units in 2022.
It can be considered that currently N0 = 283.4 × 10⁶
E t = 4310.65 × N E V t × R t   in   kWh
E t = 4310.65 × N 0 1 + β t × 1 1 + exp α t k   in   kWh
The power demand if all the current fleets were changed at once: P(t) = 7 × 103 × 283.4 × 106 = 1983.8 GW; such a power exceeds the present power installed in the USA.
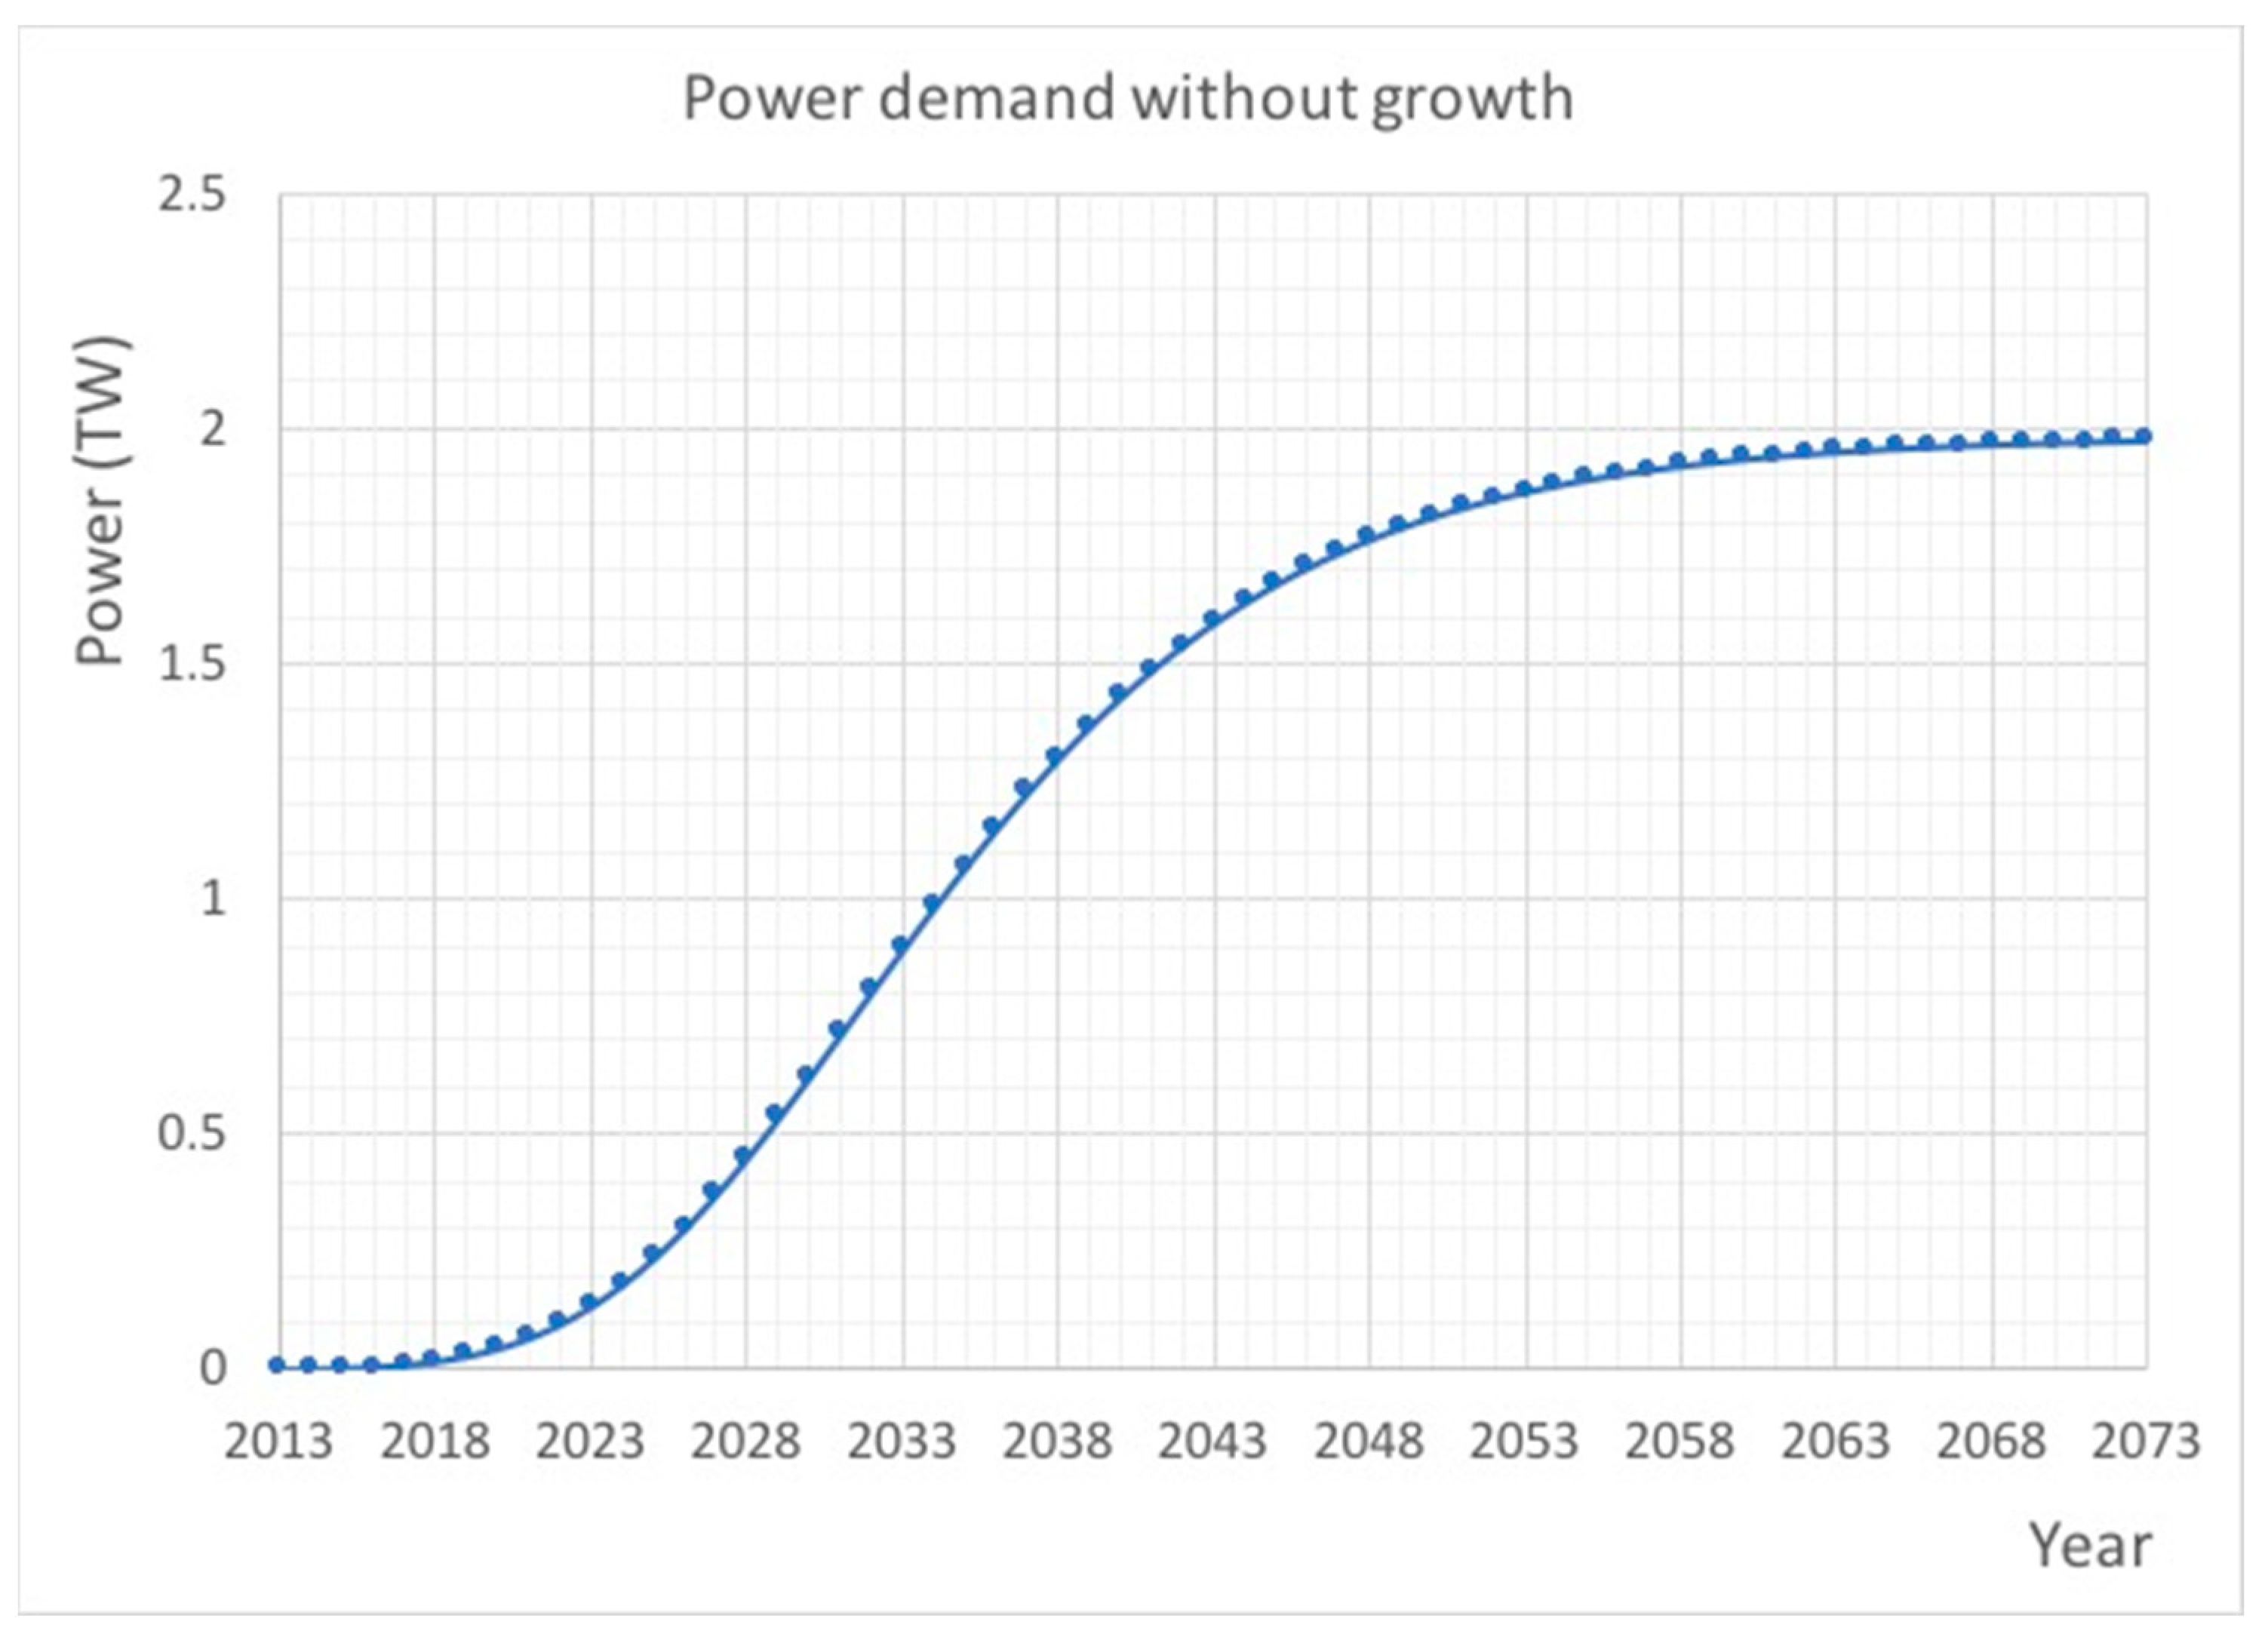
The progress of power demand based on the S-curve if there is no fleet growth:
P t = 7 × 10 3 × 283.4 × 10 6 × 1 1 + exp 0.13 t 11.1
A major aspect of the EV transition and the relation to grid readiness is that the adoption of EVs is not uniform across time. After an initial introduction period, there is a period of fast growth before a slowdown, as described by the S-curve [11]. Based on Figure 8, the main challenges with EV adoption in the USA will be between 10 and 30 years after the introduction of EVs.
If the fleet remains constant, so will be the power demand related to the mass adoption of EVs once saturation is reached. If the fleet growth is included with a realistic rate β = 0.02 for the USA, for example, the energy and power demand from the EV fleet will inflate, as illustrated in Equations (9) and (10) and Figure 8, with the extreme hypothesis that all EVs are charged simultaneously.
E t = 4310.65 × 283.4 × 10 6 × 1 + 0.02 t × 1 1 + exp 0.13 t 11.1
P t = 7 × 10 3 × 283.4 × 10 6 × 1 + 0.02 t × 1 1 + exp 0.13 t 11.1
  • Evolution in EV-related energy demands in the Europe:
E t = 905.20 × N E V t × R t   in   kWh
E t = 905.20 × N 0 1 + β t × 1 1 + e x p α t k   in   kWh
The installed capacity in the USA stands at 1201.260 GW [51]. According to Figure 8 above, in approximately 50 years, the demand for power to charge EVs will equal the current capacity installed in the USA. Based on Figure 9, the demand from an EV fleet may reach over 6 TW 60 years after the initial adoption of EVs.
In 2023, the electric power sector in the United States had an estimated net capacity of approximately 1.19 TW. This number is anticipated to rise by over 97 percent over the next thirty years, hitting around 2.17 TW by 2050 (Figure 10).
This upgraded grid in 30 years will still be under stress if the entire fleet is replaced by EVs, as shown in Figure 8 and Figure 9, which estimate the power needed for a full EV fleet.
There is no doubt about the need to upgrade the power system and the whole distribution system. It is necessary to have a better management system and emphasis on level 2 or level 3 public charging stations.

4.3. Forecast of Electricity Usage in the Transportation Sector

The proportion of electricity in global primary energy usage is expected to rise from 26% in 2022 to 37% by 2050 [53]. The primary factor behind this growth will be the increase in electric transportation. EVs are progressively boosting worldwide electricity demands. EVs now account for 20% of new car sales worldwide [54]. Even though electricity continues to be a small energy source for global transportation, predictions suggest that electricity demands in transportation could rise by 10% annually up to 2050 [55]. The rising demand for electricity from EVs generates a new dynamic in energy usage and underscores the need for forward-thinking energy strategies that integrate transportation and electricity planning.
According to Figure 8 and Figure 9, the primary challenge for the USA during the next two decades will stem from the fact that this timeframe aligns with the phase of rapid EV adoption, as presented in the S-curve, Figure 7. The fast growth period is between the 10th and 30th year of adoption of EVs, in the case of the USA, as shown Figure 7. The transition to electric power for vehicles will inherently create a new need for electricity generation and energy management. Understanding load profiles will be essential. Load shapes can be described as the hourly distribution of loads based on a specific set of variables, including equipment, operational traits, and other influences like weather and demographics. EV load profiles are crucial for utility distribution and system planning and are becoming essential as more EVs are charged on the electric grid. If the effects of EV charging are not included in utility planning, the industry faces the danger of inadequate capacity in the distribution system and supply as an increasing number of customers embrace EVs. It is crucial to grasp the overall background information on EVs, as it clarifies the significance of EV load shapes, outlines the factors and choices that need to be addressed for a study to generate EV load shapes, and offers instances of essential research questions that ought to be contemplated in any EV load investigation.
For sound proactive measures, regional hourly demand trends for EVs are needed for the years through 2050 to support the analysis of a situation with a considerable renewable energy output. To estimate the electrical energy needs for transportation, some input variables should be considered as the regional population forecast data [56], historical vehicle per capita statistics [57], and growth functions for market penetration to estimate the number of EVs in each analysis region. Upon the examination of a limiting case from reference [58], a unique market saturation situation where 50% of sales are EVs consuming an average of about 6 kWh per day indicates the necessary adjustment. It is essential to comprehend load profiles for the transportation sector. Hourly load profiles for EVs have been recorded in numerous sources [59,60,61]. Regarding the integration of renewable energy, three scenarios can be used [62,63]. In the initial situation, the consumer can connect and charge right after the vehicle finishes its last trip of the day. This scenario is known as “no utility control”, since the vehicle load depends on consumer demand and charges until the battery reaches full capacity or the consumer starts a new trip. The second scenario is called “opportunity”, which assumes that charging infrastructure is extensive, and the consumer chooses to plug in anytime the vehicle is parked, no matter how long it is stationary. This scenario leads to significantly higher fuel savings, but it also increases daytime EV demands, total energy needs, and potential battery deterioration. The availability of renewable energy power sources is not a requirement to charge the vehicle, even if it may have the advantage of a good match with the potential of solar photovoltaic energy on the condition that the infrastructure is available. A third scenario is called a “valley filling” approach. The “valley filling” strategy encourages EV charging during low-demand periods, maximizing the utilization of the surplus grid capacity and enhancing stability. At first, this scenario was structured to allow for the utility to completely oversee the delivery of daily energy needs in accordance with the evening decline of a typical daily utility load curve. However, in the context of the high renewable energy ratio, it may be more beneficial for a utility to charge vehicles at different times throughout the day. As a result, the “valley filling” load curve is used to define an energy demand that must be met during the day, although there are no restrictions on the timing of when this needs to happen. Both the “no utility control” and “opportunity” scenarios assumed 110 V, 1.4 kW charging rates, whereas the “valley filling” curve allowed for 3 kW charging to best match the energy needs with the utility valley profile.
For an adequate integration of renewable energy, managed vehicle charging can be advantageous for utilities and system operations, and as a result, drivers would be encouraged to engage in a regulated charging program. Users would charge at home without managing utility resources, but as public infrastructure improves and consumers learn to optimize their vehicle technology investments, charging opportunities will expand. The combination of hourly load profile results over a given period can lead to the generation of a cumulative load profile for each vehicle.
The entire load pattern exclusively demonstrates the static load profile. The dynamic segment overseen by the utility, “valley filling”, grows from 0% of the demand in 2010 to roughly 45% of the total demand by 2050 [64].
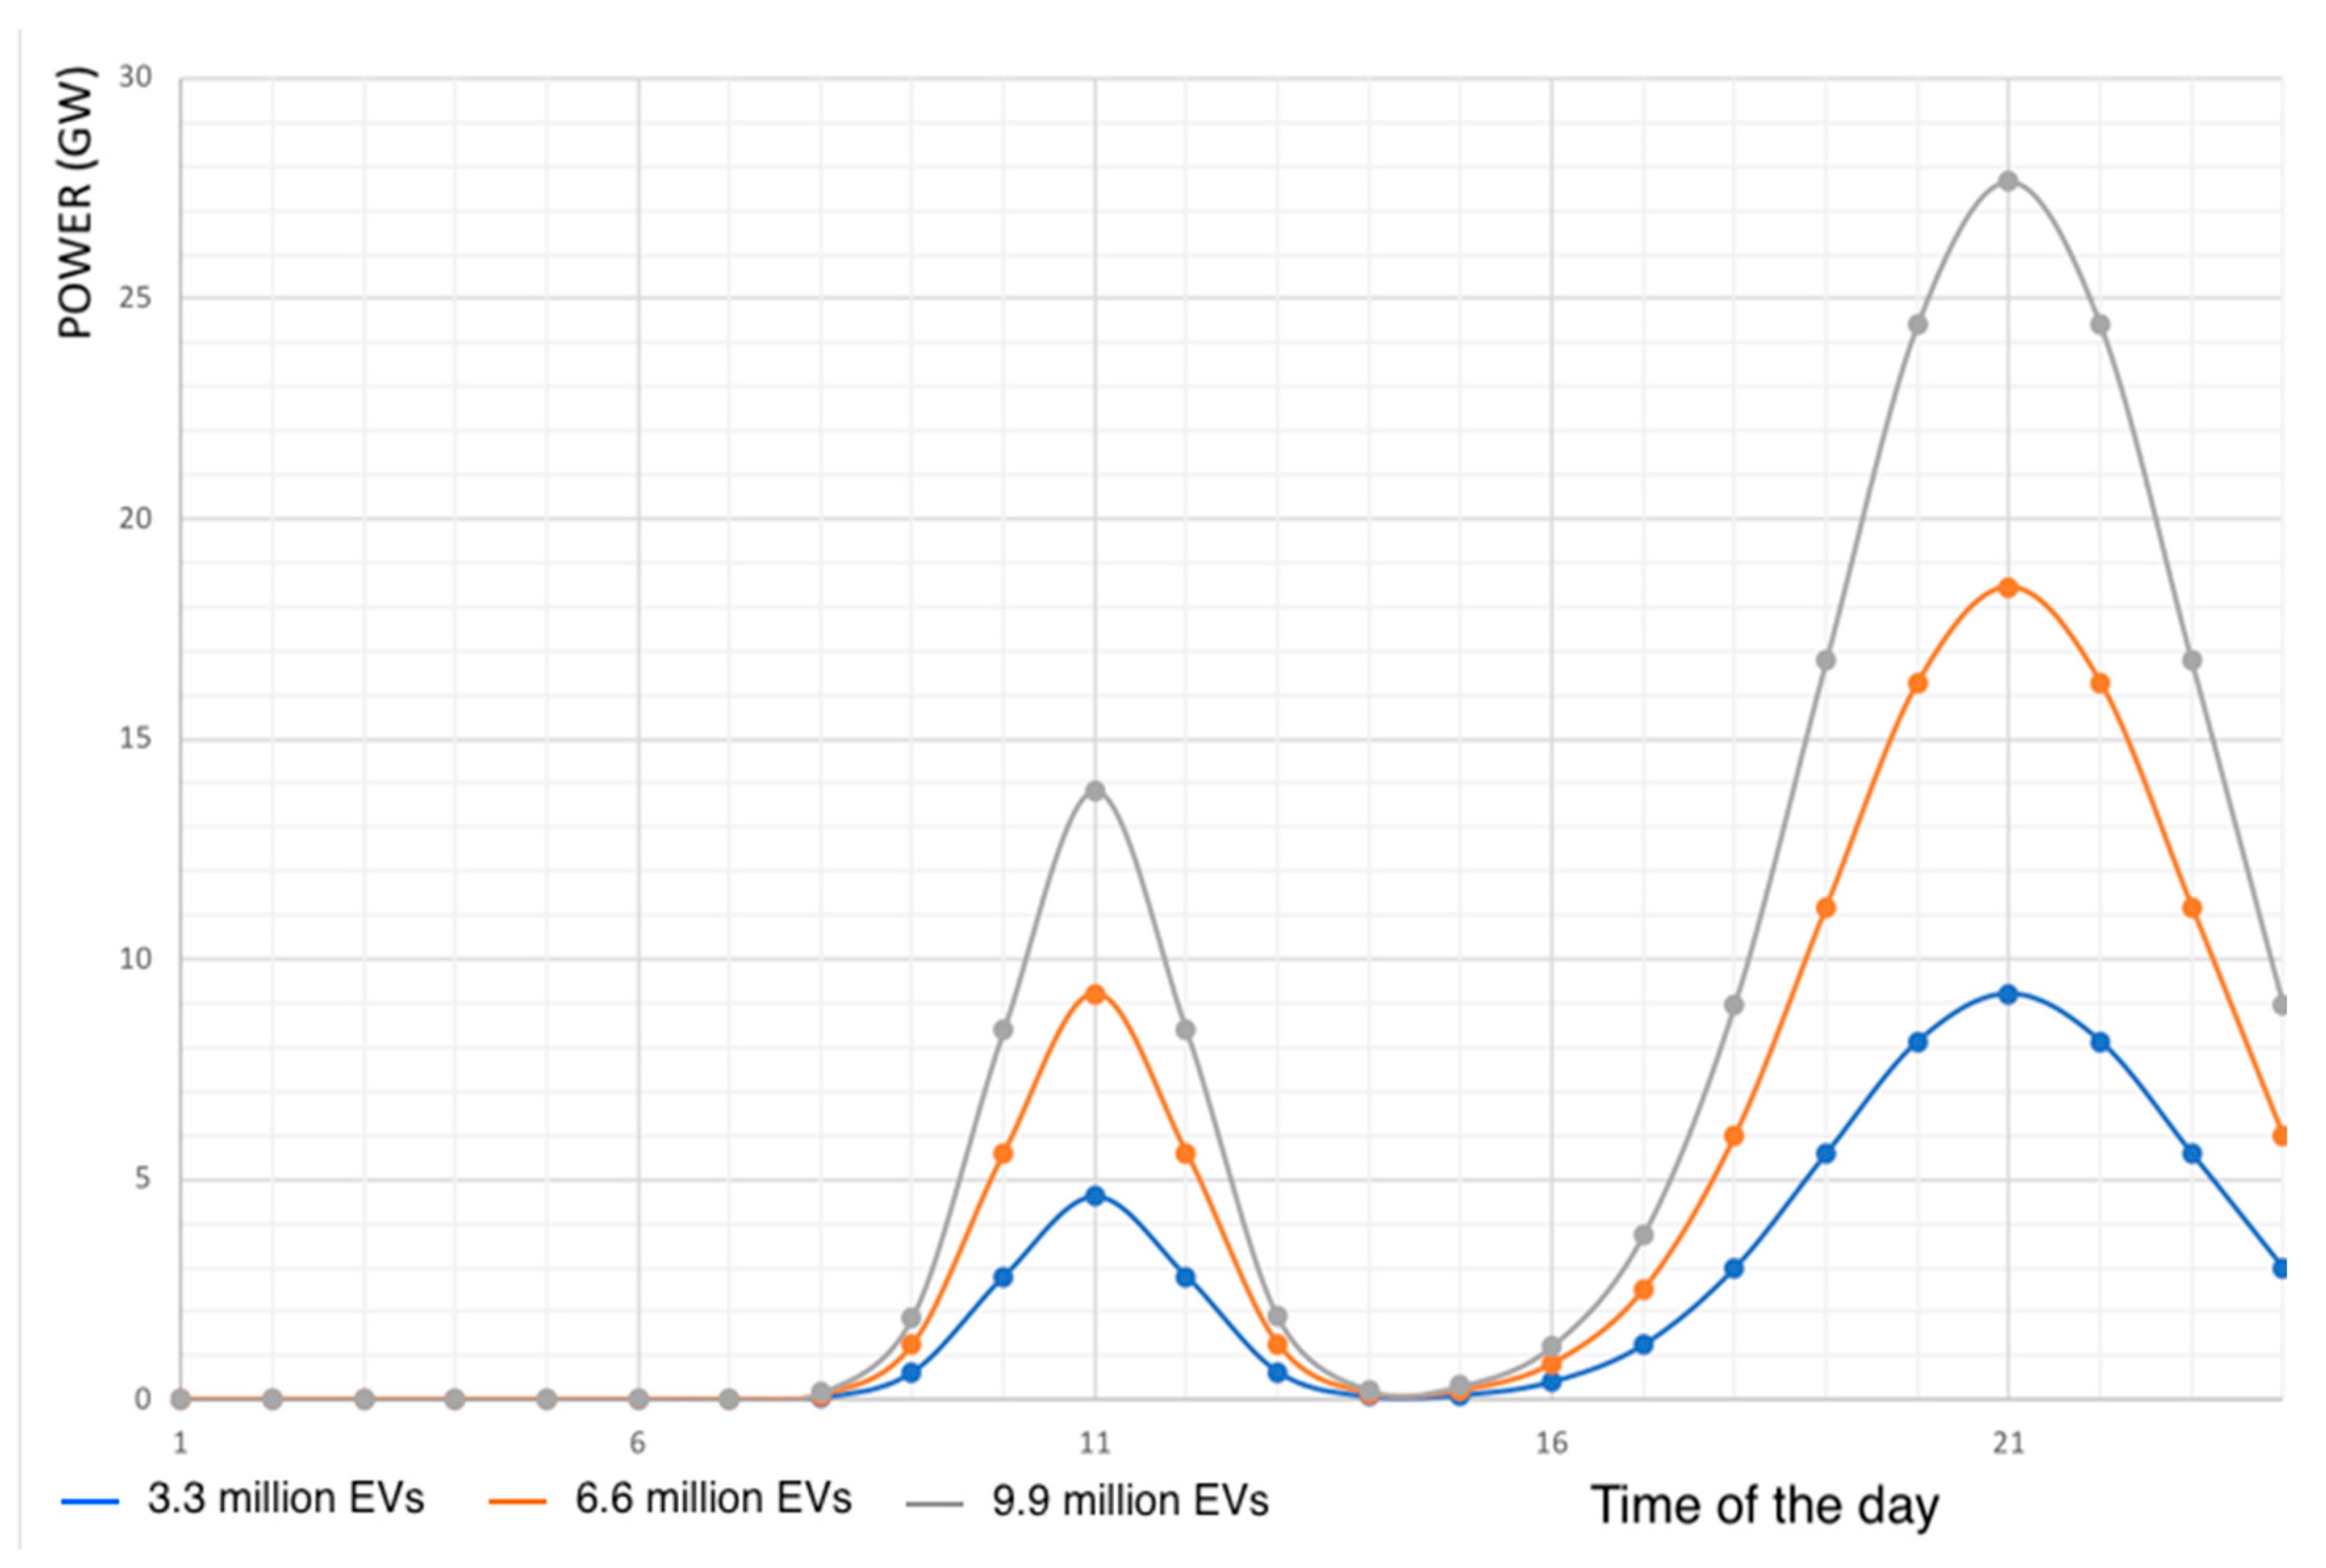
Figure 11 shows a model of a load profile for the entire EV fleet presently in the USA, the current 3.3 million EVs, the potential doubling to 6.6 million EVs, and the tripling to 9.9 million EVs, with an average charging power of 7 kW, 80% of vehicles charging at home with a peak around 9 PM, and 20% charging at work with a peak around 11 AM. The power demands in Figure 11 remain as the potential for the grid in general.
Charging at home during the night is the most effective method for reducing peak demands in the early evening; however, a preference for charging at work better aligns EV charging requirements with the availability of solar energy.
If the whole fleet consists of EVs, such as 283.4 million EVs, Figure 12 indicates utilizing 20% daytime charging with photovoltaic solar energy and 80% overnight home charging. Night charging leads to a peak of 0.791 TW at 9 PM, with the charging distributed over nearly 10 h. A total of 0.791 TW stays within the grid’s capacity but could pose a significant challenge for it.
The “valley filling” model may apply to stand-alone charging stations cumulatively with renewable energy sources. Such a system may be artificial intelligence (AI)-assisted; the battery will be charged from the grid only if the demand is below a certain threshold, otherwise, the renewable energy source, solar or wind, will be the only charging power. This will be a good combination of renewable energy sources and the grid. Technical evolution in battery technology as well as more substantial price drops would give more sustainability to such a business model to offer an equivalent service to what is currently offered for ICE vehicles. This model offers better control and adaptability of the grid compared to individual EV owners’ charging-based “valley filling” model. The stress is projected on the charging station rather than the grid. This model is more sustainable than stand-alone home charging stations, as well, where the individual system needs to communicate with the grid.

4.4. Evolution of the Electricity Sector vs. The S-Curve in the Adoption of EVs in the USA

A comparison of the evolution in the electricity sector and power plants vs. the S-curve in the adoption of EVs in the USA is necessary, focusing on timeline alignment, dynamics, and implications.
Electricity Sector Investment Trends in the USA
Investment Characteristics:
  • Long-term and capital intensive: Power plants require upfront investment with long lead times (5–15+ years).
  • Driven by policy and demand forecasts: Federal/state policies (e.g., Inflation Reduction Act), emissions targets, and expected load growth from EVs and electrification drive investments.
  • Grid modernization focus: Increasing investments in transmission, smart grids, storage, and distributed energy resources.
Recent Data Highlights:
USD 100B+ annually in U.S. power sector investments [65].
Shift toward renewables: Solar, wind, and storage now dominate new capacity.
Utilities are now planning for EV-driven load growth, leading to strategic investments in grid expansion and resiliency.
S-Curve of EV adoption in the USA
S-Curve Basics:
  • Slow start → rapid growth → saturation.
  • EV adoption driven by price drops (esp. batteries), policy incentives, infrastructure, and consumer behavior.
Current Phase (2025):
  • Inflection point/early majority (Figure 7):
    EVs ~10–12% of new vehicle sales (2024 data).
    Used EV market growing.
    Infrastructure (chargers) lagging behind but accelerating.
Some of the Key Drivers:
  • Federal policies: IRA (Inflation Reduction Act) subsidies, tax credits for EVs and chargers.
  • State mandates, e.g., California’s ZEV (Zero Emission Vehicle) mandates.
  • Private investment in charging networks (Tesla, Electrify America, etc.).
Table 6 summarizes the comparison between the evolution of the EV fleet and the development of the power sector in the USA.
Interconnection and implications
  • EVs increase electricity demand → need for new generation capacity and grid upgrades.
  • EV adoption accelerates grid modernization: more flexible, digital, and distributed systems.
  • The mismatch in timelines: EV growth is fast after the inflection point in the curve (Figure 7), but utility investment cycles are slower. There is risk of grid unpreparedness without coordination.
  • Opportunity: EVs can be grid assets (V2G, smart charging) but it requires integrated planning.
Strategic insight
To ensure synchronized energy transition, the U.S. must
  • Align EV adoption trajectories with utility infrastructure planning.
  • Accelerate permitting and interconnection for power projects.
  • Scale charging infrastructure with high geographic equity.
Enable data sharing between utilities and automakers to evaluate U.S. EV fleet growth versus installed electric power capacity between 2006 and 2024, along with projections through 2050.
Here is a comprehensive comparison of U.S. EV fleet growth versus installed electric power capacity between 2006 and 2024, along with projections through 2050.
  • EV Fleet Evolution: 2006–2024 and Future Outlook
  • In 2006, EVs were virtually negligible in the U.S. fleet, with fewer than ~10,000 plug-in vehicles. Low-speed EVs numbered around 60–76,000, but mass-market highway-capable EVs were nearly absent [66].
  • By 2020, the cumulative plug-in electric vehicles sold since 2010 reached ~1.8 million, with roughly 2 million EVs on the road (about 1% of ~290 million total vehicles) [67].
  • By 2023, cumulative plug-in sales reached ~4.68 million units. The EV market share of new car sales rose to 9.1%, and total EVs represented ~1.4% of all vehicles (~4 million EVs) [68,69].
  • In 2024, new EV registrations were around 1.1 million (~9.2% of new registrations), aligning with Experian’s estimate of ~4 million EVs on the road out of 292 million (~1.4%) [68].
Projections for 2050:
  • EY (pre-pandemic) projected EVs would rise from ~2 million in 2020 (~2%) to ~88 million (approx. 65% share) by 2050 in U.S. fleet stock [70].
  • IEA/EIA scenarios suggest 11–26% of light-duty vehicle stock in 2050 will be plug-in vehicles, depending on assumptions (~up to 65% under aggressive adoption) [71].
  • Based on a slower turnover, even if all new sales became electric, it would likely take until the 2040s or 2050s before EVs constitute a majority of the total fleet (~60–70%) [72].
Installed Electric Generating Capacity: 2006–2024 and Trajectory
  • As of 2024, the U.S.’s total installed generating capacity stood at approximately 1250 GW (~1.25 TW) [73].
  • Significant capacity additions are occurring, and about 35 GW were added in 2024 [74].
Projections for 2050:
  • According to EIA’s ‘Annual Energy Outlook Reference Case’, the total capacity doubles (2.1 TW–2.2 TW) by 2050, roughly 2 × from the current ~1.1 TW in 2022 [75].
Table 7 summarizes a quantitative comparison between the evolution of the EV fleet and the development of the power sector in the USA between 2006 and 2024 and projections through to 2050.
Interlinked trends and implications
  • The electrification of transportation will significantly increase electricity demands; some forecasts project a demand growth of 25% by 2030 and ~78% by 2050 [76], driven by EVs, AI, the electrification of heating, and industrialization [77,78].
  • Replacing fossil fuels and supporting EV load means capacity must expand not only to meet demand but also to replace the retired coal and gas plants, and firm capacity must ensure reliability.
  • Battery storage growth (~doubling in 2024 alone) is vital to support intermittent solar and wind power [79].
Key Takeaways
  • The EV fleet grew from virtually zero in 2006 to ~4 million by 2024 (~1–1.4% of total vehicles).
  • If adoption accelerates, EVs could make up 25–65% of U.S. vehicles by 2050, depending on turnover and policy.
  • Installed generating capacity has grown to ~1.25 TW by 2024 and is projected to double or even triple by 2050, with solar and wind dominating the expansion.
  • The shift is not just growth, it is a transformation of the energy system, coupling clean generation growth with massive new electricity demands from electric transport.
This dual transformation reflects a system-wide shift: transportation electrification and clean power expansion are advancing in tandem. But the scale-up must accelerate; EV adoption needs sustained policy support and turnover of the existing fleet, while electricity capacity growth must align with clean energy goals and grid reliability.

4.5. Vehicle to Grid

V2G is at the intersection of auto, power, and telecom standards, so “little” gaps compound into big frictions that hinder its expansion. Here is a crisp map of the main policy, market, and technical barriers, and the most practical ways to unblock them.

4.6. Policy and Market Barriers

  • Interconnection certification bottlenecks
In North America, many bidirectional chargers still lack the latest UL 1741 SB certification; several states noted that requiring SB today effectively blocks interconnection, so they have issued temporary waivers while the market catches up. Solution: Keep waivers in place with clear sunsets; publish fast-track test plans for V2G DC and AC paths (UL 9741 + 1741 SA/SB; SAE J3072 for onboard AC) [80,81].
  • Wholesale market access is still incomplete
FERC Order 2222 opens US wholesale markets to DER aggregations (which should include EVs), but several RTOs are still finalizing or refining compliance, leaving limited, uneven routes for aggregated V2G.
Solution: finish 2222 implementations with an explicit EV/V2G participation model (telemetry granularity, baseline methods, and mobile-asset registration) [82].
  • Retail tariffs and metering rules are not V2G-ready
Many jurisdictions do not permit (or do not fairly compensate) exports from mobile storage, or they lack sub-metering rules when a single premise has a home load and EV exports.
Solution: Create EV-specific export tariffs (time-varying energy and performance payments for ancillary services), allow certified sub-metering at the EVSE, and clarify “mobile BESS” interconnection categories [83].
  • Consumer protection and warranty ambiguity
Automakers often restrict V2G in warranties; customers cannot gauge the degradation risk vs. revenue.
Solution: Standardized V2G warranty addenda (cycle/throughput allowances), transparent degradation compensation in programs, and minimum customer protections in aggregator offers. (The DOE’s 2025 VGI assessment calls for exactly these program structures) [84].
  • Fragmented pilots and permitting
Lessons are scattered across pilots, and local permitting staff rarely see V2G applications.
Solution: National/state V2G playbooks (model interconnection checklists, single-line diagrams, and cybersecurity profiles) and a centralized pilot registry [80].

4.7. Technical and Standards Barriers and Solutions

  • Interoperability across the stack is immature
Bidirectional communication depends on ISO 15118-20 (plug-and-charge and V2G features), but support is uneven across vehicles and chargers; legacy DIN 70121 gear cannot speak 15118 features, and backends juggle OCPP variants. Fix: Require ISO 15118-20 for any new bidirectional ports after a set date; fund cross-vendor plugfests; and certify EVSE to support both 15118 and DIN during transition [85].
  • Device availability and pairing constraints
Today, many deployments certify a specific vehicle–charger pair (especially for V2G-AC via SAE J3072), limiting the scale.
Solution: Accelerate generic certification paths (J3072 with standardized utility profiles; broaden UL 9741/1741 test matrices) and prioritize DC V2G where certification is clearer [86].
  • Cybersecurity and identity management
Strong PKI and TLS are mandatory in 15118-20, but roaming trust and certificate lifecycles across OEMs, CPOs, and aggregators are still maturing.
Solution: Adopt national trust lists and PKI governance aligned with 15118-20 and require secure firmware update policies in interconnection approvals [87].
  • Telemetry, baselining, and aggregation control
Markets require reliable real-time telemetry and auditable baselines that reflect mobile asset behavior. Fix: Standardize telemetry points and control latencies for V2G assets in market rules; use aggregator gateways that translate between market signals and 15118/OCPP. (DOE 2025 highlights the need for consistent data schemas) [88].
  • Battery degradation uncertainty (and perception)
The literature is mixed: some studies show modest extra aging from V2G; others show a small to minimal impact with smart strategies.
Solution: Design programs that limit depth-of-discharge windows, cap daily energy throughput, and compensate measured degradation. Publish independent field data from long-running pilots [89,90]

4.8. Practical Roadmap

  • Start where value is the highest: Commercial fleets (buses, last-mile vans) with depot dwell time and predictable schedules; use DC V2G first to reduce interop friction [88].
  • Standard gates for new installs: Require an ISO 15118-20 capability for any bidirectional port after a future cutoff; keep DIN 70121 as receive-only during transition [85].
  • Finish the market plumbing: Complete FERC 2222 implementations with V2G-specific telemetry/baseline rules; allow small-asset aggregations everywhere [91].
  • Fix interconnection now: Maintain UL 1741 SB waivers where needed with clear criteria; publish a uniform fast-track checklist for V2G DC/AC (UL 9741 + 1741 SA/SB, SAE J3072) [80].
  • Tariffs that pencil out: EV export rates that stack TOU and ancillary service payments; explicit sub-metering rules at the EVSE; and customer protections and warranty addenda [92].
  • Interoperability proof: Fund recurring multi-vendor plugfests and publish pass/fail matrices (ISO 15118-20 + OCPP backend behaviors) [85].
  • Trust and security: Adopt a national/sector PKI and certificate policy aligned with 15118-20; require secure update practices in interconnection approvals [85].

5. Conclusions

The S-curve is a common model used to describe the adoption of new technologies, including EVs. It shows how adoption typically starts slowly, accelerates rapidly once a tipping point is reached, and then levels off as saturation approaches. Understanding this curve is essential when considering how the electrical grid must evolve to support mass EV adoption.
Key points on EV transition and grid readiness include:
1.
S-Curve of EV adoption
Early stages correspond to slow growth: high costs, limited models, and range anxiety dominate.
Inflection points correspond to the beginning of rapid growth: cost parity with internal combustion engine vehicles, improved infrastructure, and policy support fuel acceleration.
Mature stage, corresponding to the plateau: market saturation leads to slower growth.
2.
Implications for the grid involve
  • Load growth: As EV adoption increases, electricity demand rises significantly, particularly in residential areas.
  • Peak demand stress: Unmanaged EV charging, especially in the evenings, could exacerbate peak load issues and would require a behavior shift.
  • Infrastructure needs: Grid modernization, more transformers, distribution upgrades, and smart meters will be necessary.
  • Smart charging: Time-of-use pricing, V2G, and managed charging can mitigate stress and improve efficiency.
  • Renewable integration: As EVs can act as distributed storage, they can help stabilize the grid when paired with intermittent renewables like solar and wind.
3.
Timing is critical
In fact, the steep part of the S-curve can sneak up on regulators and utilities. If grid planning and upgrades lag behind EV growth, it could lead to localized blackouts or grid reliability issues.
The rapid growth of an EV fleet may pose serious challenges to grids in all countries with a high ratio of electrified fleets. Norway, Iceland, and Sweden are the countries with the highest EV penetration rate worldwide, with a potential for Norway and Iceland to have all new registrations made of EVs in the next coming years. These three countries are the only countries within those with a high EV penetration rate that have an installed electric capacity greater than the potential demand from the entire fleet if it was made of EVs that would be charged simultaneously. The biggest threat does not come from energy demand but most likely from the installed power capacity and distribution system. The other major challenge is likely to come from the phase of rapid growth of the EV fleet; this growth, as described by the S-curve, is likely to outpace the necessary upgrade of grids. New investments are needed to get grids ready for a full EV transition. Reforms are also needed as incentives regarding tariff rearrangements so that charging habits align with the potential of renewable energy, particularly photovoltaic solar energy. Public charging stations look to be an adequate solution to solve the problem of grid anxiety, and they control the rhythm of charging habits, particularly in densely populated regions where home charging is not an available option, mostly due to the types of housing. The integration of renewable energy in off-grid public charging structures may be a solution despite challenges, but to be a credible alternative to current gas stations, it will be necessary to progress in battery technology, with energy densities that may need to double compared to what is available presently. To overcome the problem of the rapid growth of an EV fleet, microgrids may be an appropriate solution. Microgrids present a viable option for boosting resilience to prevent major power failures from overload-related disasters. The concept of a microgrid is presented as a technique to consistently incorporate distributed energy resources, like energy storage systems and controlled loads. A microgrid can connect with and disconnect from the larger utility grid, enabling it to operate in either grid-connected or standalone mode. In contrast to conventional centralized grids, microgrids are primarily structured to handle and integrate distributed energy resources, allowing them to satisfy local demand without needing costly transmission infrastructures. On the other hand, and as an alternative, a smart grid [93] describes a type of electrical system that employs two-way flows of power and information, ensures secure communication technology, and provides computational intelligence from generation to consumption to create an enhanced energy network, as it can be needed from the EV fleet demand.
Remedial solutions need to be found before major problems occur. In fact, EV adoption can either stress the grid or strengthen it. If policies incentivize smart charging, V2G, and renewable integration, EVs become a flexible resource rather than a dump load. Preparing the electrical grid for the EV transition is a big challenge that requires policy changes and targeted investments in multiple areas: generation, transmission, distribution, demand management, and digital infrastructure.

5.1. Policy Changes

Policies need to address grid capacity, flexibility, decarbonization, and integration with EV charging.

5.1.1. Grid Modernization and Reliability Mandates

  • Require utilities to upgrade aging infrastructure and incorporate smart grid technologies (real-time monitoring, automation).
  • Implement performance standards for resilience against EV load spikes.

5.1.2. Charging Infrastructure Regulation

  • Set national standards for fast charging (power levels, connectors).
  • Right-to-charge laws for apartments and workplaces.
  • Mandate interoperability between charging networks.

5.1.3. Renewable Integration and Storage Policies

  • Policies to align EV load growth with renewable generation expansion.
  • Incentives for grid scale and distributed storage to balance intermittent renewables.

5.1.4. Dynamic Pricing and Demand Response

  • Mandate time-of-use tariffs or real-time pricing to encourage off-peak EV charging.
  • Encourage V2G participation through clear market rules.

5.1.5. Planning and Forecasting Requirements

  • Require utilities to model EV adoption scenarios in Integrated Resource Plans (IRPs).
  • Long-term forecasting to avoid under/over-investment

5.2. Investment Priorities

Investments should focus on capacity expansion, smart infrastructure, and localized solutions.

5.2.1. Transmission and Distribution Upgrades

  • Reinforce distribution feeders in urban and suburban areas (EV clusters).
  • Expand high-voltage transmission for renewables and EV charging corridors.

5.2.2. Charging Network Deployment

  • Highway fast chargers with high power (≥350 kW).
  • Urban DC fast-charging hubs in dense cities.
  • Residential and workplace slow chargers with incentives for smart charging.

5.2.3. Smart Grid and Digitalization

  • Deploy Advanced Metering Infrastructure (AMI) for real-time data.
  • Invest in AI-based load forecasting and automated demand response systems.

5.2.4. Energy Storage and Flexible Resources

  • Battery storage for peak shaving and renewable balancing.
  • Distributed energy resources (DER) like rooftop solar panels and batteries near EV clusters.

5.2.5. Vehicle-to-Grid (V2G) Infrastructure

  • Enable bidirectional chargers.
  • Create market participation frameworks so EVs can provide ancillary services.

5.3. Investment Models and Financing

  • Public–Private Partnerships (PPPs) for charging infrastructure.
  • Green bonds and climate funds for grid modernization.
  • Utility cost recovery mechanisms to finance upgrades.

5.4. Timeline Considerations Based on the S-Curve Adoption of EVs

  • Short-term (2025): Smart charging incentives, basic V2G pilots, and targeted distribution upgrades.
  • Medium-term (2030): Large-scale charging corridors, V2G integration, and significant grid reinforcement.
  • Long-term (2040+): Full digital grid, autonomous charging, and renewable-dominated EV ecosystem.

Funding

This research received no external funding.

Data Availability Statement

The original contributions presented in this study are included in the article. Further inquiries can be directed to the corresponding author.

Conflicts of Interest

The author declares no conflicts of interest.

References

  1. Abo-Khalil, A.G.; Abdelkareem, M.A.; Sayed, E.T.; Maghrabie, H.M.; Radwan, A.; Rezk, H.; Olabi, A.G. Electric vehicle impact on energy industry, policy, technical barriers, and power systems. Int. J. Thermofluids 2022, 13, 100134. [Google Scholar] [CrossRef]
  2. Zhu, Y.; Choma, E.F.; Wang, K.; Wang, H. Electric vehicle adoption delivers public health and environmental benefits. Eco Environ. Health 2023, 2, 193–194. [Google Scholar] [CrossRef]
  3. Tan, V.K.M.; Yong, J.Y.; Ramachandaramurthy, V.K.; Mansor, M.; Teh, J.; Guerrero, J.M. Factors influencing global transportation electrification: Comparative analysis of electric and internal combustion engine vehicles. Renew. Sustain. Energy Rev. 2023, 184, 113582. [Google Scholar] [CrossRef]
  4. Liu, H.; Wang, D.Z.W. Locating multiple types of charging facilities for battery electric vehicles. Transp. Res. Part B Methodol. 2017, 103, 30–55. [Google Scholar] [CrossRef]
  5. Yoldaş, Y.; Önen, A.; Muyeen, S.M.; Vasilakos, A.V.; Alan, İ. Enhancing smart grid with microgrids: Challenges and opportunities. Renew. Sustain. Energy Rev. 2017, 72, 205–214. [Google Scholar] [CrossRef]
  6. Khan, A.A.; Kubra, K.; Islam, M.R.; Rahman, M.A.; Hassan, M. Microgrid-based operational framework for grid resiliency enhancement: A case study at KUET campus in Bangladesh. Energy Rep. 2024, 11, 1752–1765. [Google Scholar] [CrossRef]
  7. Kumar, P.; Channi, H.K.; Kumar, R.; Rajiv, A.; Kumari, B.; Singh, G.; Singh, S.; Dyab, I.F.; Lozanović, J. A comprehensive review of vehicle-to-grid integration in electric vehicles: Powering the future. Energy Convers. Manag. X 2025, 25, 100864. [Google Scholar] [CrossRef]
  8. Owens, J.; Miller, I.; Gençer, E. Can vehicle-to-grid facilitate the transition to low carbon energy systems? Energy Adv. 2022, 1, 943–1072. [Google Scholar] [CrossRef]
  9. Mathisen, S.; Zeyringer, M.; Haaskjold, K.; Löffler, K.; Mata, É.; Sandvall, A.; Andersen, K.S.; Vågerö, O.; Wolfgang, O. The REPowerEU policy’s impact on the Nordic power system. Energy Strategy Rev. 2024, 54, 101454. [Google Scholar] [CrossRef]
  10. Vezzoni, R. Green growth for whom, how and why? The REPowerEU Plan and the inconsistencies of European Union energy policy. Energy Res. Soc. Sci. 2023, 101, 103134. [Google Scholar] [CrossRef]
  11. Diouf, B. The Electric Vehicle Transition. Environ. Sci. Adv. 2024, 3, 332. [Google Scholar] [CrossRef]
  12. Diouf, B. Modeling the Used Vehicle Market Share in the Electric Vehicle Transition. World Electr. Veh. J. 2025, 16, 29. [Google Scholar] [CrossRef]
  13. The Department of Energy’s Energy. Available online: https://www.energy.gov/sites/default/files/2024-10/Congressional%20Report%20EV%20Grid%20Impacts.pdf (accessed on 5 August 2025).
  14. Ayoade, I.A.; Longe, O.M. A Comprehensive Review on Smart Electromobility Charging Infrastructure. World Electr. Veh. J. 2024, 15, 286. [Google Scholar] [CrossRef]
  15. Duan, C.; Motter, A.E. Grid congestion stymies climate benefit from U.S. vehicle electrification. Nat. Commun. 2025, 16, 7242. [Google Scholar] [CrossRef]
  16. van den Berg, M.A.; Lampropoulos, I.; Alskaif, T.A. Impact of electric vehicles charging demand on distribution transformers in an office area and determination of flexibility potential. Sustain. Energy Grids Netw. 2021, 26, 100452. [Google Scholar] [CrossRef]
  17. Johnsen, D.; Ostendorf, L.; Bechberger, M.; Strommenger, D. Review on Smart Charging of Electric Vehicles via Market-Based Incentives, Grid-Friendly and Grid-Compatible Measures. World Electr. Veh. J. 2023, 14, 25. [Google Scholar] [CrossRef]
  18. The Department of Energy’s Energy. Available online: https://www.energy.gov/sites/default/files/2025-01/Vehicle_Grid_Integration_Asseessment_Report_01162025.pdf (accessed on 5 August 2025).
  19. Štogl, O.; Miltner, M.; Zanocco, C.; Traverso, M.; Starý, O. Electric vehicles as facilitators of grid stability and flexibility: A multidisciplinary overview. WIREs Energy Environ. 2024, 13, e536. [Google Scholar] [CrossRef]
  20. Khan, M.O.; Kirmani, S.; Rihan, M. Impact assessment of electric vehicle charging on distribution networks. Renew. Energy Focus 2024, 50, 100599. [Google Scholar] [CrossRef]
  21. Al-Amin, G.M.; Shafiullah, M.; Shoeb, S.M.; Ferdous, S.M.; Anda, M. Grid Integration of EV: A review on stakeholder’s objectives, challenges, and strategic implications. e-Prime 2025, 11, 100930. [Google Scholar] [CrossRef]
  22. Nutkani, I.; Toole, H.; Andrew, L.P.C. Impact of EV charging on electrical distribution network and mitigating solutions—A review. IET Smart Grid 2024, 7, 485–502. [Google Scholar] [CrossRef]
  23. Bastida-Molina, P.; Rivera, Y.; Berna-Escriche, C.; Blanco, D.; Álvarez-Piñeiro, L. Challenges and Opportunities in Electric Vehicle Charging: Harnessing Solar Photovoltaic Surpluses for Demand-Side Management. Machines 2024, 12, 144. [Google Scholar] [CrossRef]
  24. Zhang, C.; Wang, X.; Wang, Y.; Tang, P. Economic Viability of Vehicle-to-Grid (V2G) Reassessed: A Degradation Cost Integrated Life-Cycle Analysis. Sustainability 2025, 17, 5626. [Google Scholar] [CrossRef]
  25. Ibrahim, R.A.; Gaber, I.M.; Zakzouk, N.E. Analysis of multidimensional impacts of electric vehicles penetration in distribution networks. Sci. Rep. 2024, 14, 27854. [Google Scholar] [CrossRef]
  26. Visaria, A.A.; Jensen, A.F.; Thorhauge, M.; Mabit, S.E. User preferences for EV charging, pricing schemes, and charging infrastructure. Transp. Res. Part A Policy Pract. 2022, 165, 120–143. [Google Scholar] [CrossRef]
  27. Dini, P.; Saponara, S.; Colicelli, A. Overview on Battery Charging Systems for Electric Vehicles. Electronics 2023, 12, 4295. [Google Scholar] [CrossRef]
  28. Weiss, M.; Winbush, T.; Newman, A.; Helmers, E. Energy Consumption of Electric Vehicles in Europe. Sustainability 2024, 16, 7529. [Google Scholar] [CrossRef]
  29. Charging the Future. Available online: https://evbox.com/en/ev-home-charger-electricity-usage (accessed on 5 August 2025).
  30. Global EV Sales by Country. Available online: https://roadgenius.com/cars/ev/statistics/sales-by-country/ (accessed on 5 August 2025).
  31. Share Plug-In Electric Cars in Selected Markets. Available online: https://en.wikipedia.org/wiki/Electric_car_use_by_country#/media/File:PEVs_in_use_Top_countries_&_regional_markets_2020.png (accessed on 5 August 2025).
  32. The Global EV Market Overview in 2025. Available online: https://www.virta.global/global-electric-vehicle-market (accessed on 5 August 2025).
  33. Automotive Registered Statistics for 2023. Available online: https://www.mk.co.kr/en/society/10921207 (accessed on 5 August 2025).
  34. EVs Registered in South Korea. Available online: https://www.statista.com/statistics/1097976/south-korea-total-registration-number-of-electric-vehicles/ (accessed on 5 August 2025).
  35. Countries with Best EV Charging Infrastructure. Available online: https://www.statista.com/chart/30897/countries-with-the-best-ev-charging-infrastructure/ (accessed on 5 August 2025).
  36. City Population in Norway. Available online: https://www.citypopulation.de/en/norway/cities/ (accessed on 5 August 2025).
  37. Ahmad, F.; Iqbal, A.; Ashraf, I.; Marzband, M.; Khan, I. Optimal location of electric vehicle charging station and its impact on distribution network: A review. Energy Rep. 2022, 8, 2314–2333. [Google Scholar] [CrossRef]
  38. Off-Grid Charging-Station. Available online: https://yocharge.com/faq/what-is-off-grid-ev-charging-station/ (accessed on 5 August 2025).
  39. Yang, M.; Sun, X.; Liu, R.; Wang, L.; Zhao, F.; Mei, X. Predict the lifetime of lithium-ion batteries using early cycles: A review. Appl. Energy 2024, 376, 124171. [Google Scholar] [CrossRef]
  40. Carlton, G.J.; Sultana, S. Electric vehicle charging station accessibility and land use clustering: A case study of the Chicago region. J. Urban Mobil. 2022, 2, 100019. [Google Scholar] [CrossRef]
  41. EV Charging Infrastructure in the U.S. Available online: https://www.pewresearch.org/data-labs/2024/05/23/electric-vehicle-charging-infrastructure-in-the-u-s/ (accessed on 5 August 2025).
  42. Proximity to Charging Stations. Available online: https://inframanage.com/proximity-to-charging-station-correlates-with-ev-switch-us-survey/ (accessed on 5 August 2025).
  43. EV Charging Habits. Available online: https://www.weforum.org/stories/2023/01/electric-cars-charging-habits/ (accessed on 5 August 2025).
  44. Ahmad, T.; Zhang, D. A critical review of comparative global historical energy consumption and future demand: The story told so far. Energy Rep. 2020, 6, 1973–1991. [Google Scholar] [CrossRef]
  45. U.S. Energy Information Administration. Monthly Energy Review, April 2022; U.S. EIA: Washington, DC, USA, 2022. [Google Scholar]
  46. U.S. Energy. Available online: https://www.eia.gov/energyexplained/us-energy-facts/ (accessed on 5 August 2025).
  47. Energy Production and Consumption in the U.S. Available online: https://www.e-education.psu.edu/ebf301/node/457 (accessed on 5 August 2025).
  48. Rigogiannis, N.; Bogatsis, I.; Pechlivanis, C.; Kyritsis, A.; Papanikolaou, N. Moving towards Greener Road Transportation: A Review. Clean Technol. 2023, 5, 766–790. [Google Scholar] [CrossRef]
  49. Barman, P.; Dutta, L.; Bordoloi, S.; Kalita, A.; Buragohain, P.; Bharali, S.; Azzopardi, B. Renewable energy integration with electric vehicle technology: A review of the existing smart charging approaches. Renew. Sustain. Energy Rev. 2023, 183, 113518. [Google Scholar] [CrossRef]
  50. U.S. Energy Consumption by Sector. Available online: https://www.statista.com/statistics/560927/us-retail-electricity-consumption-by-sector/ (accessed on 5 August 2025).
  51. Tasnim, M.N.; Akter, S.; Shahjalal, M.; Shams, T.; Davari, P.; Iqbal, A. A critical review of the effect of light duty electric vehicle charging on the power grid. Energy Rep. 2023, 10, 4126–4147. [Google Scholar] [CrossRef]
  52. Electric Power Sector Capacity. Available online: https://www.statista.com/statistics/504369/electric-power-sector-capacity-in-the-us-forecast/ (accessed on 5 August 2025).
  53. Gielen, D.; Boshell, F.; Saygin, D.; Morgan, D.M.; Wagner, N.; Gorini, R. The role of renewable energy in the global energy transformation. Energy Strategy Rev. 2019, 24, 38–50. [Google Scholar] [CrossRef]
  54. Nogueira, T.; Sousa, E.; Alves, G.R. Electric vehicles growth until 2030: Impact on the distribution network power. Energy Rep. 2022, 8, 145–152. [Google Scholar] [CrossRef]
  55. McKinsey & Company. Global Energy Perspective 2024. McKinsey Global Energy and Materials Practice. 2024. Available online: https://www.mckinsey.com/industries/energy-and-materials/our-insights/global-energy-perspective (accessed on 5 August 2025).
  56. Hamed, M.M.; Ali, H.; Abdelal, Q. Forecasting annual electric power consumption using a random parameters model with heterogeneity in means and variances. Energy 2022, 255, 124510. [Google Scholar] [CrossRef]
  57. Paul, J.; Blumenberg, E. Vehicle ownership rates: The role of lifecycle, period, and cohort effects. Transp. Res. Interdiscip. Perspect. 2023, 21, 100892. [Google Scholar] [CrossRef]
  58. Buhmann, K.M.; Criado, J.R. Consumers’ preferences for electric vehicles: The role of status and reputation. Transp. Res. Part D Transp. Environ. 2023, 114, 103530. [Google Scholar] [CrossRef]
  59. Wang, H.; Guo, F.; Sivakumar, A. Analysing the impact of electric vehicle charging on households: An interrelated load profile generation approach. Energy Build. 2025, 335, 115558. [Google Scholar] [CrossRef]
  60. Andersen, F.M.; Jacobsen, H.K.; Gunkel, P.A. Hourly charging profiles for electric vehicles and their effect on the aggregated consumption profile in Denmark. Int. J. Electr. Power Energy Syst. 2021, 130, 106900. [Google Scholar] [CrossRef]
  61. Baek, K.; Lee, E.; Kim, J. A dataset for multi-faceted analysis of electric vehicle charging transactions. Sci. Data 2024, 11, 262. [Google Scholar] [CrossRef]
  62. Manousakis, N.M.; Kanellos, F.D. Integration of Renewable Energy and Electric Vehicles in Power Systems: A Review. Processes 2023, 11, 1544. [Google Scholar] [CrossRef]
  63. Amiruddin, A.; Dargaville, R.; Liebman, A.; Gawler, R. Integration of Electric Vehicles and Renewable Energy in Indonesia’s Electrical Grid. Energies 2024, 17, 2037. [Google Scholar] [CrossRef]
  64. Electricity Demand in 2050. Available online: https://www.pnnl.gov/main/publications/external/technical_reports/PNNL-23491.pdf (accessed on 5 August 2025).
  65. U.S. Energy Expenditure. Available online: https://www.ft.com/content/051f2361-de09-4744-814f-0de4b9b6c0d0 (accessed on 5 August 2025).
  66. EV Fleet Projection. Available online: https://about.bnef.com/insights/clean-transport/electric-vehicle-fleet-set-to-hit-100-million-by-2026-but-stronger-push-needed-to-stay-on-track-for-net-zero/ (accessed on 5 August 2025).
  67. Pelegov, D.V.; Chanaron, J.-J. Electric Car Market Analysis Using Open Data: Sales, Volatility Assessment, and Forecasting. Sustainability 2023, 15, 399. [Google Scholar] [CrossRef]
  68. EV Adoption Trends. Available online: https://www.spglobal.com/mobility/en/research-analysis/electric-vehicle-adoption-trends-its-not-all-grim.html (accessed on 5 August 2025).
  69. Number of EVs in the U.S. Available online: https://www.experian.com/blogs/ask-experian/how-many-evs-are-in-us/ (accessed on 5 August 2025).
  70. Shaping the EV Market. Available online: https://www.ey.com/en_us/insights/automotive/five-hypotheses-shaping-the-electric-vehicle-market (accessed on 5 August 2025).
  71. EV Adoption in the U.S. Available online: https://evtcp.org/country/united-states-of-america/ (accessed on 5 August 2025).
  72. New Cars Market in the U.S. Available online: https://time.com/6280316/ev-impact-aging-gasoline-cars/ (accessed on 5 August 2025).
  73. Energy Sources in the U.S. Available online: https://natlawreview.com/article/evolving-mix-energy-sources-uss-electric-generating-capacity (accessed on 5 August 2025).
  74. Mix of Energy Sources in the U.S. Available online: https://www.eia.gov/energyexplained/electricity/electricity-in-the-us-generation-capacity-and-sales.php (accessed on 5 August 2025).
  75. Evolution Mix of Energy Sources in the U.S. Available online: https://www.foley.com/insights/publications/2024/09/the-evolving-mix-of-the-energy-sources-for-the-u-s-s-electric-generating-capacity/ (accessed on 5 August 2025).
  76. Load Growth. Available online: https://www.utilitydive.com/news/icf-sees-25-load-growth-by-2030-up-to-40-price-increase/748711/ (accessed on 5 August 2025).
  77. Plug-In EVs. Available online: https://en.wikipedia.org/wiki/Plug-in_electric_vehicle (accessed on 5 August 2025).
  78. Here’s How EV Sales Are Affecting Oil Demand. Available online: https://www.investors.com/news/oil-prices-trump-drill-baby-drill-evs-oil-stocks-demand (accessed on 5 August 2025).
  79. Rahman, M.M.; Thill, J.-C. A Comprehensive Survey of the Key Determinants of Electric Vehicle Adoption: Challenges and Opportunities in the Smart City Context. World Electr. Veh. J. 2024, 15, 588. [Google Scholar] [CrossRef]
  80. California Public Utilities Commission. Available online: https://www.cpuc.ca.gov/-/media/cpuc-website/divisions/energy-division/documents/transportation-electrification/energization/2025-vgi-forum-slide-deck.pdf (accessed on 5 August 2025).
  81. AI and Grid. Available online: https://www.ul.com/news/ul-solutions-issues-first-certification-ul-9741-and-ul-1741-sa-ai-driven-vehicle-grid (accessed on 5 August 2025).
  82. Federal Energy Regulatory Commission. Available online: https://cuswebsite.blob.core.windows.net/2222tracker/Tracker-Report-November-2024.pdf (accessed on 5 August 2025).
  83. California Public Utilities Commission. Available online: https://www.cpuc.ca.gov/industries-and-topics/electrical-energy/infrastructure/transportation-electrification/vehicle-grid-integration-activities (accessed on 5 August 2025).
  84. Menyhart, J. Electric Vehicles and Energy Communities: Vehicle-to-Grid Opportunities and a Sustainable Future. Energies 2025, 18, 854. [Google Scholar] [CrossRef]
  85. California Energy Commission. Available online: https://e-mobility.abb.com/sites/default/files/2024-12/241218_ABB_White-Paper.pdf (accessed on 5 August 2025).
  86. SAE International. Fermata Energy. Available online: https://fermataenergy.com/resources/key-takeaways-from-v2g-forum-san-diego-2024/ (accessed on 5 August 2025).
  87. Johnson, J.; Berg, T.; Anderson, B.; Wright, B. Review of Electric Vehicle Charger Cybersecurity Vulnerabilities, Potential Impacts, and Defenses. Energies 2022, 15, 3931. [Google Scholar] [CrossRef]
  88. Dik, A.; Omer, S.; Boukhanouf, R. Electric Vehicles: V2G for Rapid, Safe, and Green EV Penetration. Energies 2022, 15, 803. [Google Scholar] [CrossRef]
  89. Sagaria, S.; van der Kam, M.; Boström, T. Vehicle-to-grid impact on battery degradation and estimation of V2G economic compensation. Appl. Energy 2025, 377 Pt B, 124546. [Google Scholar] [CrossRef]
  90. V2G. Available online: https://newmobility.news/2025/08/05/german-study-shows-v2g-has-minor-impact-on-battery-degradation/ (accessed on 5 August 2025).
  91. Federal Energy Regulatory Commission. Available online: https://www.ferc.gov/ferc-order-no-2222-explainer-facilitating-participation-electricity-markets-distributed-energy (accessed on 5 August 2025).
  92. California Energy Commission. Available online: https://www.energy.ca.gov/programs-and-topics/programs/vehicle-grid-integration-program (accessed on 5 August 2025).
  93. Fang, X.; Misra, S.; Xue, G.; Yang, D. Smart grid—the new and improved power grid: A survey. IEEE Commun. Surv. Tutorials 2012, 14, 944–980. [Google Scholar] [CrossRef]
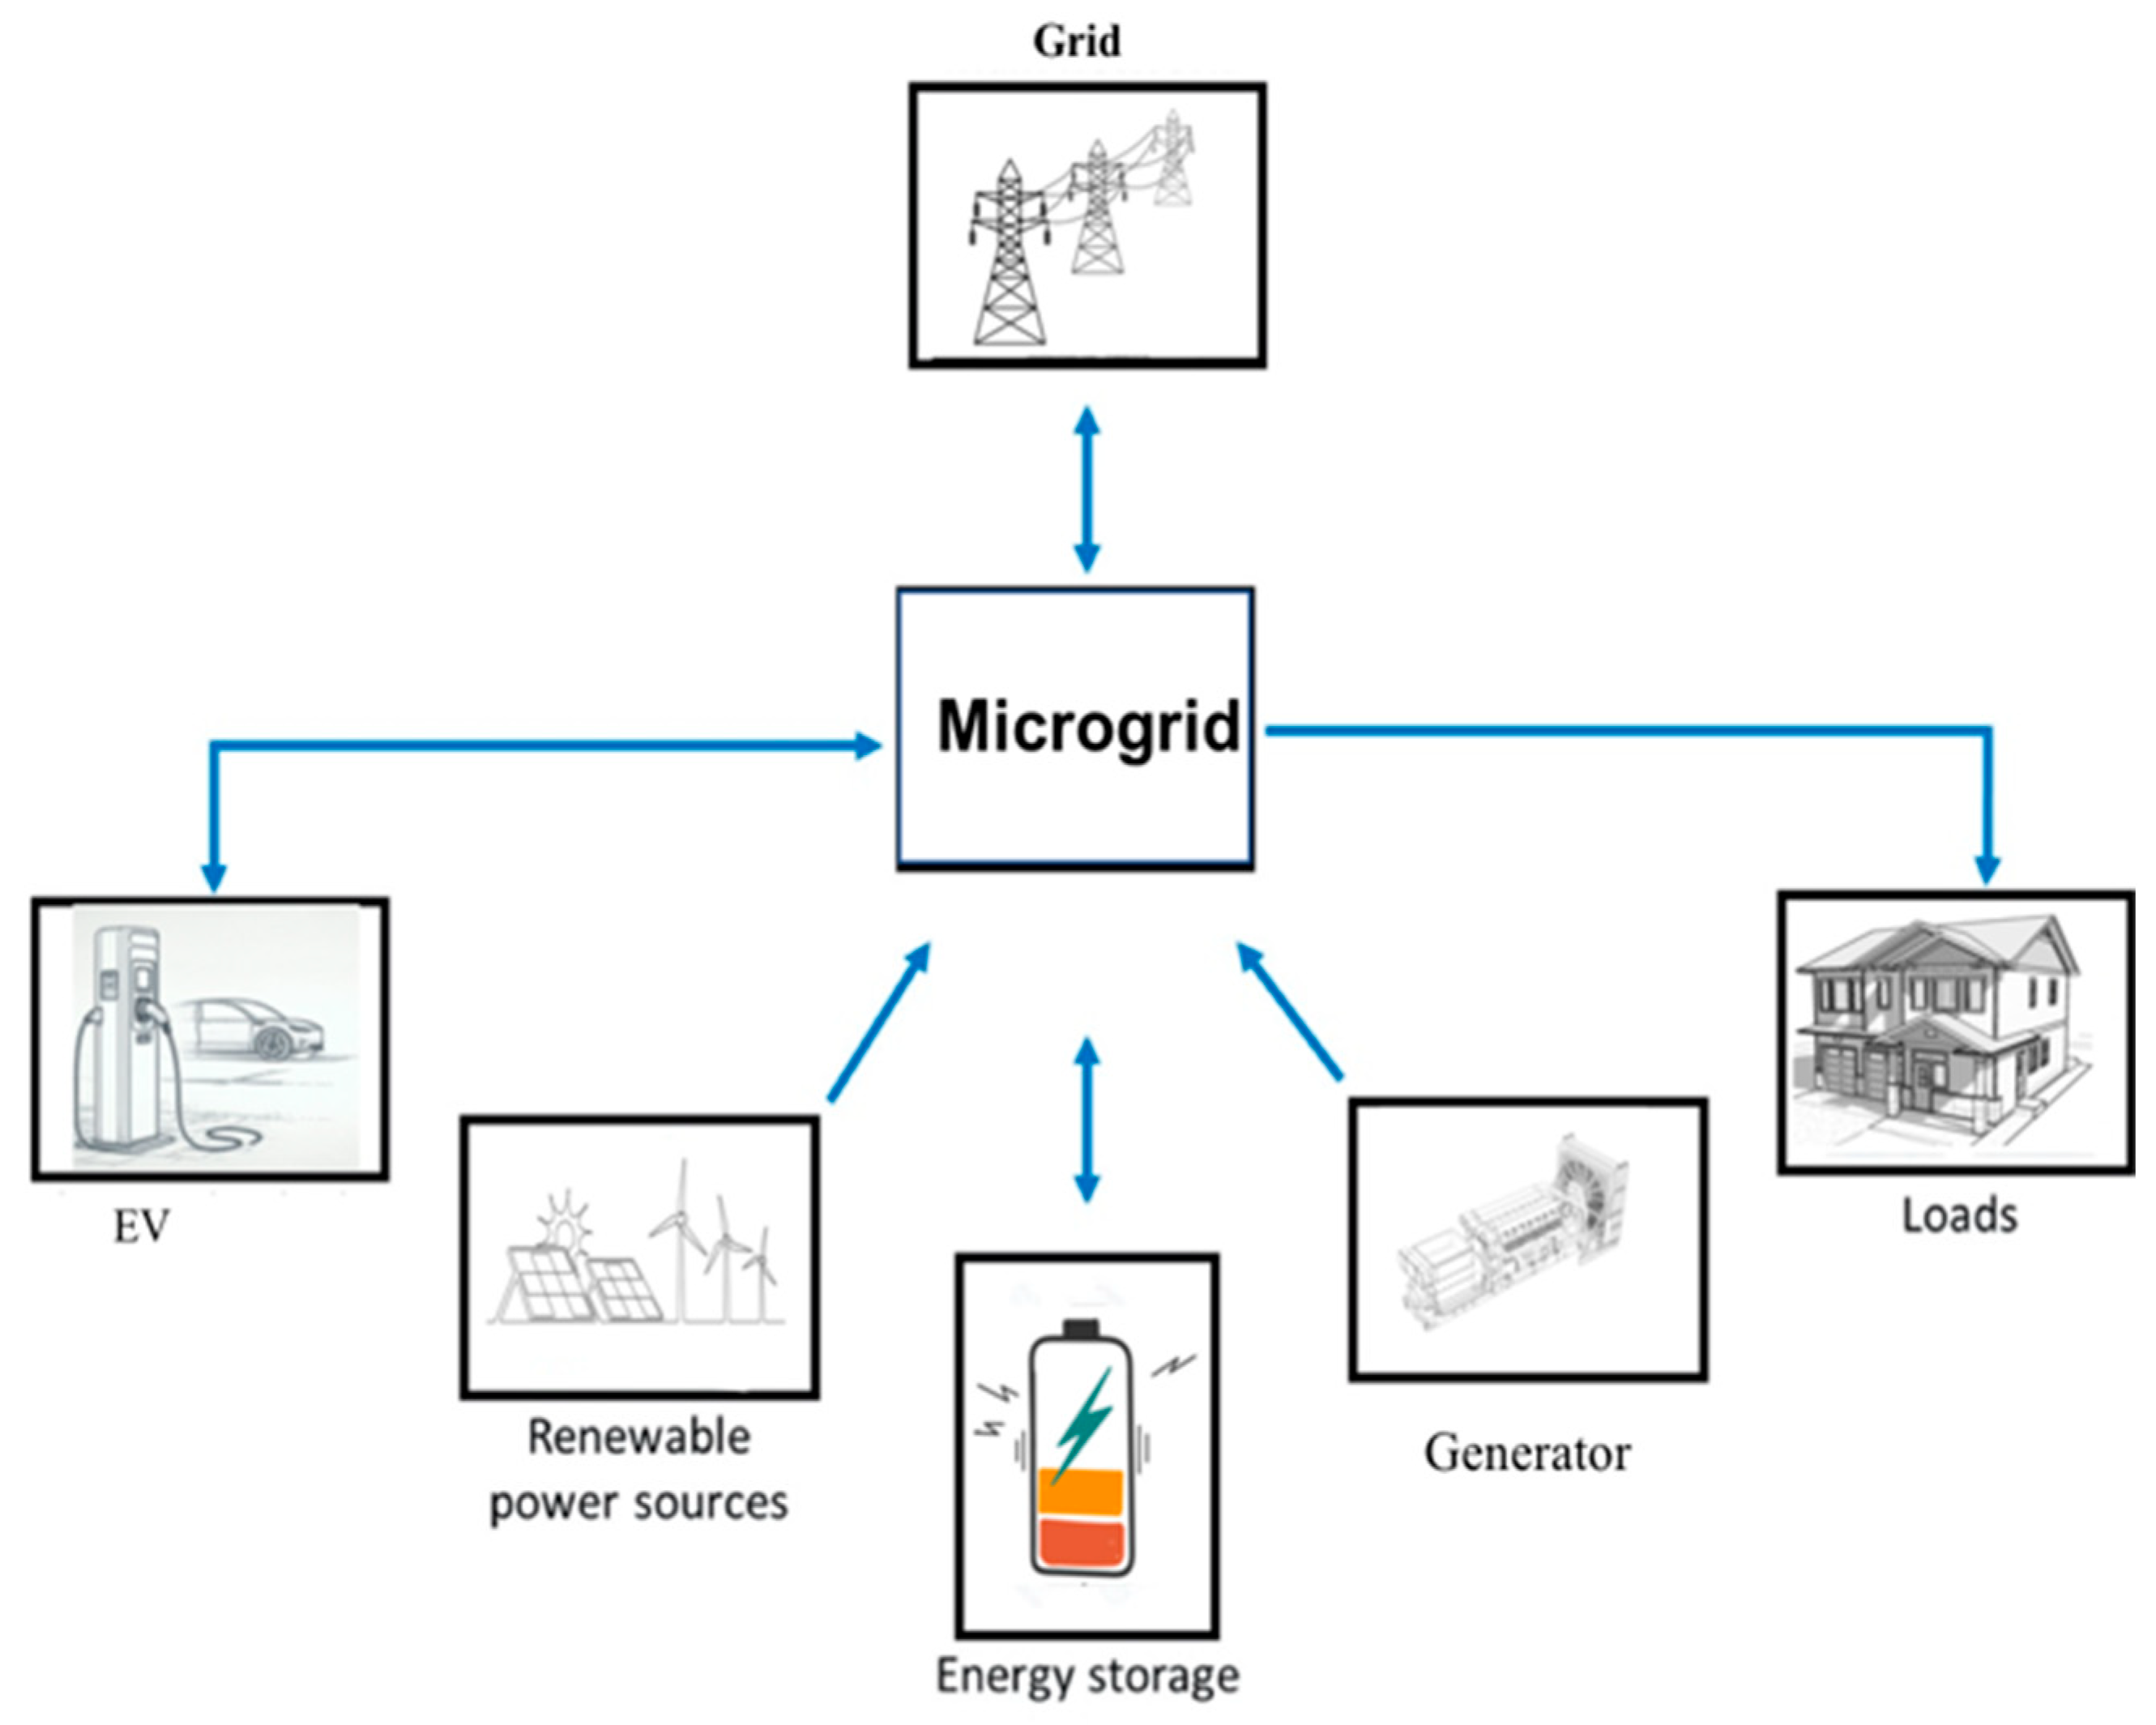
Figure 1. General structure of a microgrid.
Energies 18 04730 g001
Figure 2. Solar energy-assisted EV charging.
Energies 18 04730 g002
Figure 3. Number of charging stations per 1000 EVs in 2022 [35].
Energies 18 04730 g003
Figure 4. Off-grid EV charging station with integrated battery: the developing business.
Energies 18 04730 g004
Figure 5. Model solar irradiation period vs. EV charging period (N is the number of EVs charged at 7000 W).
Energies 18 04730 g005
Figure 6. Model of ideal EV charging habits to integrate solar photovoltaic energy (N is the number of EVs charged at 7000 W).
Energies 18 04730 g006
Figure 7. EV penetration in the US market.
Energies 18 04730 g007
Figure 8. Power demand from the EV fleet from a constant fleet.
Energies 18 04730 g008
Figure 9. Evolution of power demand from EV fleet.
Energies 18 04730 g009
Figure 10. Electric power sector capacity in the United States with a forecast to 2050 [52].
Energies 18 04730 g010
Figure 11. Model shape and transition of load profile for 3.3 million EVs, the double, and the triple.
Energies 18 04730 g011
Figure 12. Model shape and transition of load profile for the entire fleet made of EVs.
Energies 18 04730 g012
Table 1. Common charging conditions for EVs.
Use CasePower to Install per EVNotes
Home charging2–3 kWOvernight slow charge (level 1/2)
Workplace/public5–7 kWLevel 2 chargers
Fast-charging sites10–50+ kWDC fast charging (DCFC) or Tesla superchargers
National grid avg.~1.5–3 kW per EVDepends on usage intensity
Table 2. Power demand of EV fleets in countries with the highest EV penetration [30,31,32].
EV Penetration RateInstalled Capacity (MW)Generation (GWh)Vehicles
(fleet)
EVs FleetAll EVs (MW) *Max Evs * PossiblePower * Mismatch (MW)
Norway29%40,540143,3833,469,692900,000 24,2885,791,429+16,252
Iceland18%300619,865306,56319,2152146429,429+860
Sweden11%52,706173,7545,682,251560,00039,7767,529,429+12,930
Denmark 11%19,50333,7273,222,575300,00022,5582,786,143−3055
Finland 8.1%24,78470,1624,221,85283,80029,5533,540,571−4769
Netherlands 8.3%57,194120,84010,062,194700,00070,4358,170,571−13,241
Germany 5.4%261,086560,75952,714,4332,500,000369,00137,298,000−107,915
Switzerland 5.8%24,01458,7265,301,789172,00037,1133,430,571−13,099
Portugal1.8723,31645,5437,198,871111,00050,3923,330,857−27,076
United Kingdom 5%111,020318,59541,700,0001,580,000291,90015,860,000−180,880
France 4.1%148,914446,29144,444,9651,570,000311,11521,273,429−162,201
Belgium 8.2%26,31090,8936,977,664254,24048,8443,758,571−22,534
China7.6%2,593,5898,881,870440,000,00021,800,0003,080,000370,512,714−486,411
Italy3.8%123,327274,16444,888,074220,000314,21717,618,143−190,890
Spain1.2130,908265,31230,724,166466,178215,06918,701,143−84,161
Greece 2.3%22,33649,1795,777,241134,48440,4413,190,857−18,105
Canada2.3%158,973637,99626,302,526550,000184,11822,710,429−25,145
South Korea 2.4%146,539606,76025,949,201553,000181,64420,934,143−35,105
United States2.1%1,201,2604,291,954283,400,9864,800,0001,983,807171,608,571−782,547
New Zealand 2.4%10,41244,1784,794,156102,38433,5591,487,429−23,147
* Remark: Max EVs possible is the maximum number of EVs that can be charged simultaneously at 7 kW under the current installed capacity. Power Mismatch is the difference between the installed capacity and the required capacity to simultaneously charge the entire fleet at 7 kW if it was made up exclusively of EVs. All EVs (MW) is the power required if the entire fleet was made of EVs charged at the same time at 7 kW for each EV.
Table 3. Population characteristics of capital cities and countries with highest EV penetration [36].
Capital City/CountrySize Capital (km2)National Density/km2Density (Capital)/km2Population Capital CityPop. Growth (%) (2023–2024)Number of Cars per 1000 (National)
Oslo/Norway42618.241684717,7100.86550
Reykjavik/Iceland73.13.7333281239,7331.88779
Stockholm/Sweden48325.9137481,809,4121.12473
Copenhagen/Denmark292138.847171,378,6490.93472
Helsinki/Finland21418.443148674,5000.88660
Amsterdam/Netherlands168533.367821,136,2101501
Berlin/Germany891231.340363,596,9990.81578
Bern/Switzerland51.6217.12655136,9880.54546
Lisbon/Portugal84.9112.26427545,796−0.13549
London/United Kingdom117227674908,776,5350.74480
Paris/France106121.120,0162,113,705−0.61570
Brussels/Belgium33.1383.35948196,8281.23507
Beijing/China16,410150133218,960,7441.27194
Roma/Italy1287195.321402,754,7190.42682
Madrid/Spain60696.3256503,422,4160.56553
Athena/Greece38.9679.4017,0003,146,164−0.07550
Ottawa/Canada5494.20919451,068,8211.45707
Seoul/Republic of Korea605484.715,8399,586,1950.21500
Washington/United States15837.184289678,9720.92850
Auckland/New Zealand60719.2923721,440,3000.34889
Table 4. Gas station vs. off-grid EV charging station.
Gas StationOff-Grid EV StationFuture Off-Grid EV Station
Capacity12,000 gal60,000 kWh/120 m3 60,000 kWh/45.42 m3
Tank60 L40 kWh40 kWh
Number of vehicles750750750
Energy density32.4 MJ/L500 Wh/L2400 Wh/L
Table 5. Electricity consumption in the United States from 2016 to 2022, by sector (in terawatt-hours) [50].
2016201720182019202020212022
Residential1411.061378.651469.11440.31464.61470.51509.2
Commercial1367.191352.891381.761360.881287.41328.41390.9
Industrial976.72984.31001.61002.35959.11000.61020.5
Transportation7.57.527.677.636.56.36.6
Table 6. Comparison between the power sector and the evolution in the EV fleet.
AspectElectricity Sector and Power PlantsEV Adoption (S-Curve)
Time HorizonLong (10–40 years lifespan for assets)Medium (10–15 years to full market maturity)
Investment DynamicsPolicy and forecast-driven, steady capital deploymentConsumer behavior-driven, nonlinear growth
Growth CurveLinear or incremental (with policy shocks)Exponential (S-curve)
Tech DisruptionGradual transition (e.g., coal → renewables)Rapid, with tipping points (battery breakthroughs, mandates)
Policy RoleCrucial (e.g., clean energy standards, tax credits)Crucial (e.g., EV tax credits, bans on ICE sales)
Infrastructure BottleneckGrid interconnection delays, transmission siting issuesCharging infrastructure, battery supply chains
Market ActorsRegulated utilities, IPPs, and federal/state governmentsAutomakers, consumers, startups, and federal/state regulators
Table 7. Summary of the evolution of the EV fleet and installed capacity.
Metric~2006~20202023/242050 Projection
EV Fleet (plug-in stock)~10 k~2 M (1%)~4 M (~1.4%)~65–90 M (~25–65%) depending on scenario
Total vehicle stock~250 M~290 M~292 M~350–400 M
Installed capacity (GW)~800–900 GW (est)~1150 GW~1250 GW~2100–2500 GW (2×–3× current)
Disclaimer/Publisher’s Note: The statements, opinions and data contained in all publications are solely those of the individual author(s) and contributor(s) and not of MDPI and/or the editor(s). MDPI and/or the editor(s) disclaim responsibility for any injury to people or property resulting from any ideas, methods, instructions or products referred to in the content.