Article

Experimental Investigation of the Capture Performance Model for a Novel Omnidirectional Wave Energy Converter

by
Wensheng Wang
1,2,3,4,
Jingfeng Liu
1,2,3,4,
Zhenpeng Wang
1,2,3,4,
Zhaoji Lin
1,2,3,4,
Guoyu Zhang
1,2,3,4 and
Yaqun Zhang
1,2,3,4,*
1
College of Energy Science and Technology, University of Science and Technology of China, Hefei 230026, China
2
Guangzhou Institute of Energy Conversion, Chinese Academy of Sciences, Guangzhou 510640, China
3
Innovation Academy of South China Sea Ecology and Environmental Engineering, Chinese Academy of Sciences, Guangzhou 510301, China
4
Key Laboratory of Renewable Energy, Chinese Academy of Sciences, Guangzhou 510640, China
*
Author to whom correspondence should be addressed.
Energies 2025, 18(17), 4729; https://doi.org/10.3390/en18174729
Submission received: 8 July 2025 / Revised: 8 August 2025 / Accepted: 22 August 2025 / Published: 5 September 2025
(This article belongs to the Section A3: Wind, Wave and Tidal Energy)

Abstract

The performance of wave energy converters (WECs) in terms of energy capture presents considerable challenges in enhancing conversion efficiency. This research proposes a structural design and operational principle for an omnidirectional oscillating buoy WEC (OOBWEC), featuring six absorbers arranged in a circular configuration. To validate the proposed design and operational principle, experimental investigations were conducted within a wave flume. The experimental findings indicate that the capture width ratio (CWR) peaked at approximately 68.15% when the incident wave period was 1.8 s and the wave height was 80 mm. It was observed that as the wave period increased, the CWR initially rose before gradually declining. Conversely, an increase in wave height corresponded with a gradual decrease in the CWR. Notably, due to the angle of the incoming waves, the power captured by the forward absorber significantly exceeded that of the other absorbers. These results provide a basis for future numerical simulations, and further experimental studies will be conducted to optimize the WEC’s structure and improve its energy conversion efficiency.

1. Introduction

With the continuous rise in global temperatures, the urgency of achieving the dual-carbon goals (carbon peaking and carbon neutrality) has significantly increased. To reduce dependence on conventional fossil fuels, substantial enhancement of renewable energy development and utilization is imperative. As a sustainable and renewable marine energy resource, ocean wave energy offers distinct advantages, including wide geographical distribution, consistent availability, high energy conversion efficiency, and operational feasibility [1,2,3]. Consequently, numerous coastal nations have prioritized the development and deployment of wave energy technologies to harness this resource for green power generation [4].
WECs, which are marine devices designed to harness wave energy, can be classified into three primary categories based on their energy capture mechanisms: oscillating buoys (OB), overtopping devices (OP), and oscillating water columns (OWC) [5]. Oscillating buoy wave energy converters (OBWECs) consist of a moving component that captures wave energy and a stationary component that provides a foundation for the movement. The conversion of wave energy into other energy forms occurs through the relative motion between the moving and stationary components induced by wave action. Among the various types of WECs, OBWECs are noted for their diversity and rapid development [6], and their technological advancements are more established compared to other types [7], making them particularly suitable for regions with low energy flow density [8,9].
The hydrodynamic motion of WECs during wave energy capture can be described by six degrees of freedom (DOF): pitch, roll, heave, surge, sway, and yaw. Current WEC designs primarily employ single-degree-of-freedom (SDOF) or multi-degree-of-freedom (MDOF) motion mechanisms. For example, the PowerBuoy by Ocean Power Technologies [10,11] and Ireland’s WaveBob, which utilize heave motion, are typical SDOF systems [12]. The University of Edinburgh’s “Duck” device and the UK’s Pelamis WEC [13,14], which operate via pitching motion, also fall into this category [15]. However, SDOF devices suffer from limited power output, leading to high generation costs and large sea area requirements.
MDOF WECs represent a specialized technical category with limited typologies. Based on the kinematic behavior of floating bodies, they are systematically divided into two distinct classes: single-body multi-degree-of-freedom (SB-MDOF) WECs and multi-body multi-degree-of-freedom (MB-MDOF) WECs.
The SB-MDOF WECs class refers to devices where a single absorber captures wave energy through simultaneous motion across two or more DOFs. Currently, SB-MDOF WECs remain scarce and are predominantly in the research and development stage. A notable example is Canada’s WET EnGen [16], which converts wave energy into hydraulic power via combined heave and pitch motions. Most flexible WECs, such as the UK’s Anaconda device, also fall into this category, utilizing multi-DOF deformations of a flexible rubber tube to capture omnidirectional wave motions. While these devices exhibit superior wave capture capability and adaptability to varying wave directions, heights, and periods, their highly flexible motion profiles impose stringent demands on structural integrity and Power Take-Off (PTO) system performance. Inadequate design in these aspects can lead to high vulnerability to damage due to cyclic loading.
MB-MDOF devices have multiple absorbers within the same system performing independent DOF motions to capture wave energy synergistically. MB-MDOF technologies are relatively more mature and have reached the real sea demonstration stage, exemplified by Denmark’s Wave Star [17] and China’s Sharp Eagle WEC [18,19]. By integrating floaters specialized for different motions, these devices enhance adaptability to multi-directional waves and improve energy capture efficiency. However, they face challenges such as large overall volume, significant hydrodynamic interference between floaters, and complex motion coordination mechanisms, which complicate engineering implementation and operational maintenance. Numerical studies using computational fluid dynamics (CFD) have shown that MB-MDOF devices can achieve 25–40% higher CWR than SDOF ones [20,21].
This paper presents a novel oscillating-floater-type omnidirectional WEC, categorized as an MBDOF WEC. This WEC features a new structural design scheme. It takes a cylindrical buoy structure serving as the central foundation and omni-directionally arranges multiple absorbers of varying geometric dimensions, so the device is enabled to capture wave energy across diverse wave incidence directions, periods, and heights. This design enhances CWR and improves the device’s adaptability to marine environmental conditions. Section 2 of this paper details the structural design and operational principle of the device. To validate the feasibility of the design scheme, Section 3 describes the physical model testing methodology and setup. Section 4 statistically analyzes the test data, examining the model’s sensitivity to incident wave height and period, and investigates the impact of wave approach angles on the capture power of the absorbers.

2. Method

2.1. System Description

The Ocean-Based OOBWEC consists of several key components, including the primary structure, PTO, anchoring system, and control system. The primary structure features six wave absorbers and a cylindrical buoy, as depicted in Figure 1. The wave absorbers are designed as hollow structures resembling the profile of a sea eagle’s head, with a total of six units. Among the six, three are large absorbers of uniform size, and the remaining three are small floats of uniform size as well. The three large absorbers are positioned at different locations within the device. The three small absorbers are also arranged at different positions in the circumferential direction of the WEC. The cylindrical buoy is composed of a cylindrical cavity buoy and two circular plates (damping plate_1 and damping plate_2). The cylindrical buoy exhibits a rectangular shape in its longitudinal section and a circular shape in its transverse section. The two circular plates are positioned at the top and bottom of the cylindrical cavity float, maintaining a parallel orientation. The central axes of the three circular components are aligned. The six wave absorbs are symmetrically arranged around the circumference of the cylinder, centered on the axis of the cylindrical cavity float. Each absorber is connected to the cylindrical cavity buoy through two mechanisms: a hydraulic cylinder located at the upper end of the absorber and an articulated support structure situated at the lower end. The inherent buoyancy of the WEC is provided by the hollow cylindrical buoy and the hollow absorbers.
The OOBWEC is classified as an OBWEC, whose energy conversion principle is shown in Figure 2. During the process of wave energy capture, the absorber functions as the dynamic component, while the main floating body serves as the stator structure. When subjected to incident waves, under the action of mooring forces, the main body (as the stator) remains stationary, while the absorbers (as rotors) perform reciprocating oscillatory motions relative to the main body. The reciprocal rocking of the absorbers against the main body drives the hydraulic cylinders mounted at the upper end of the main body to undergo reciprocating compression and extension. This process converts wave energy into mechanical energy of the hydraulic cylinders, then transmitted into electrical energy through PTO.

2.2. Experimental Setup

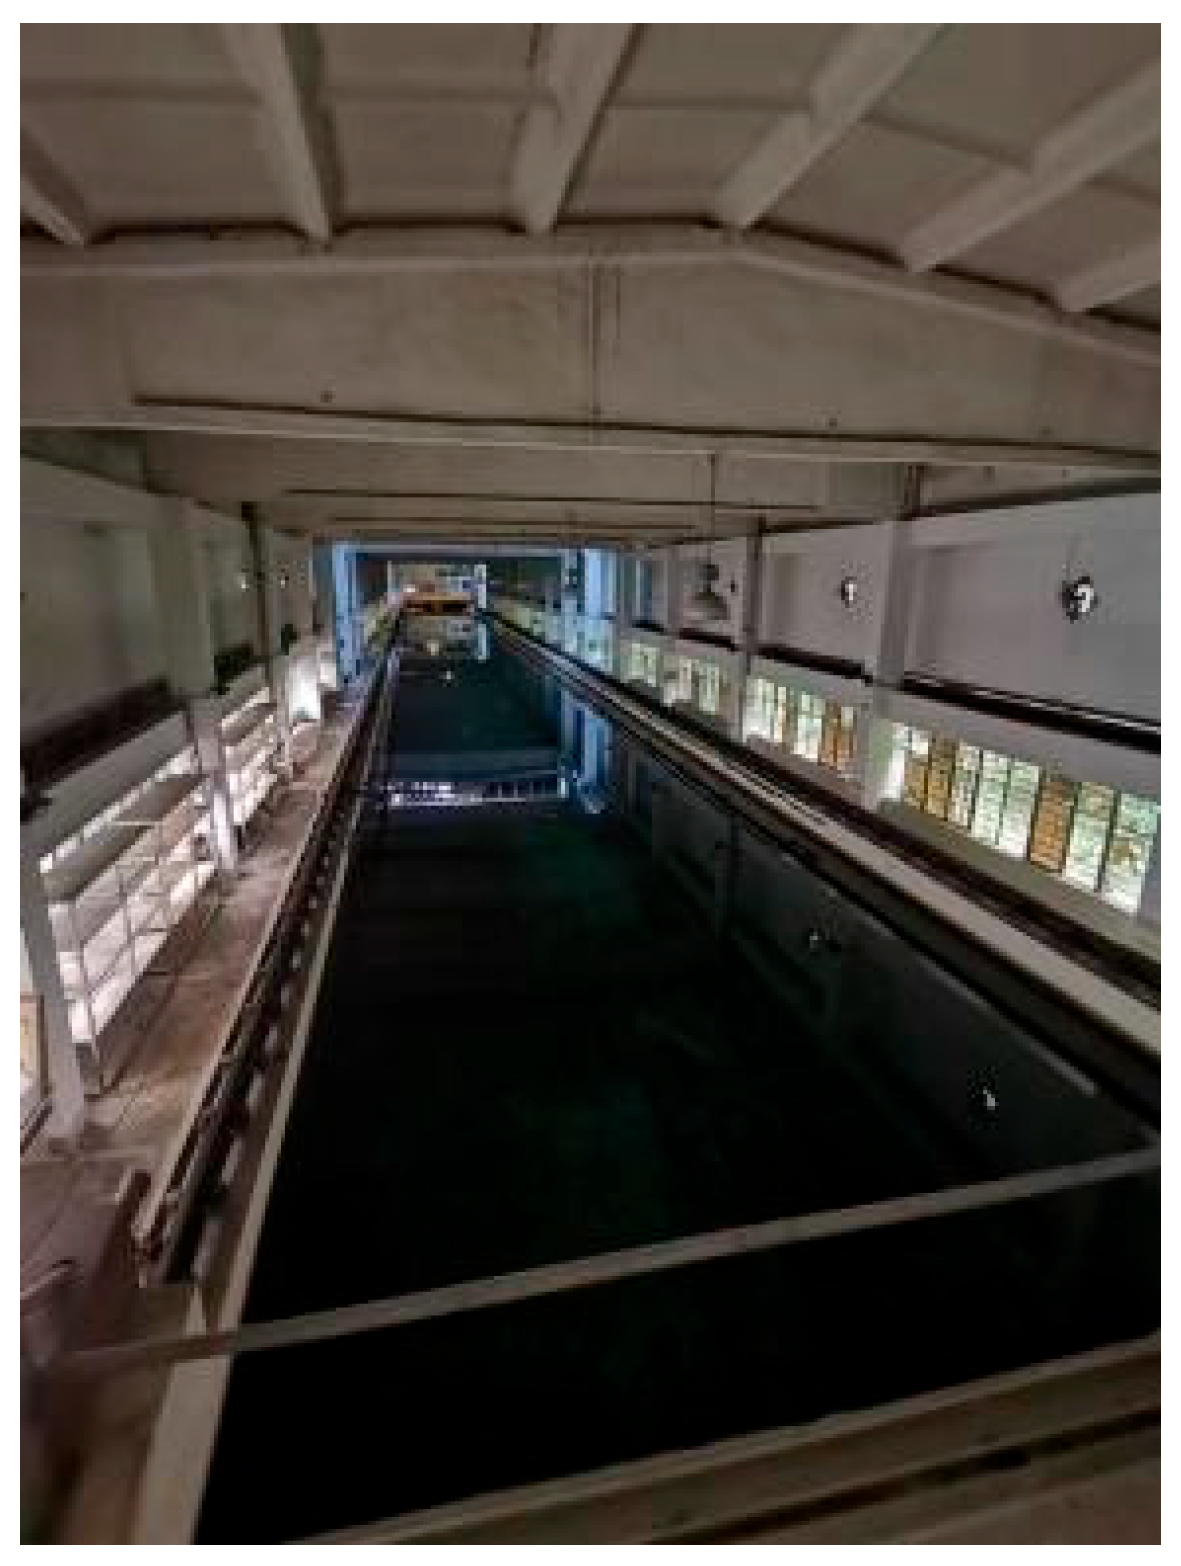
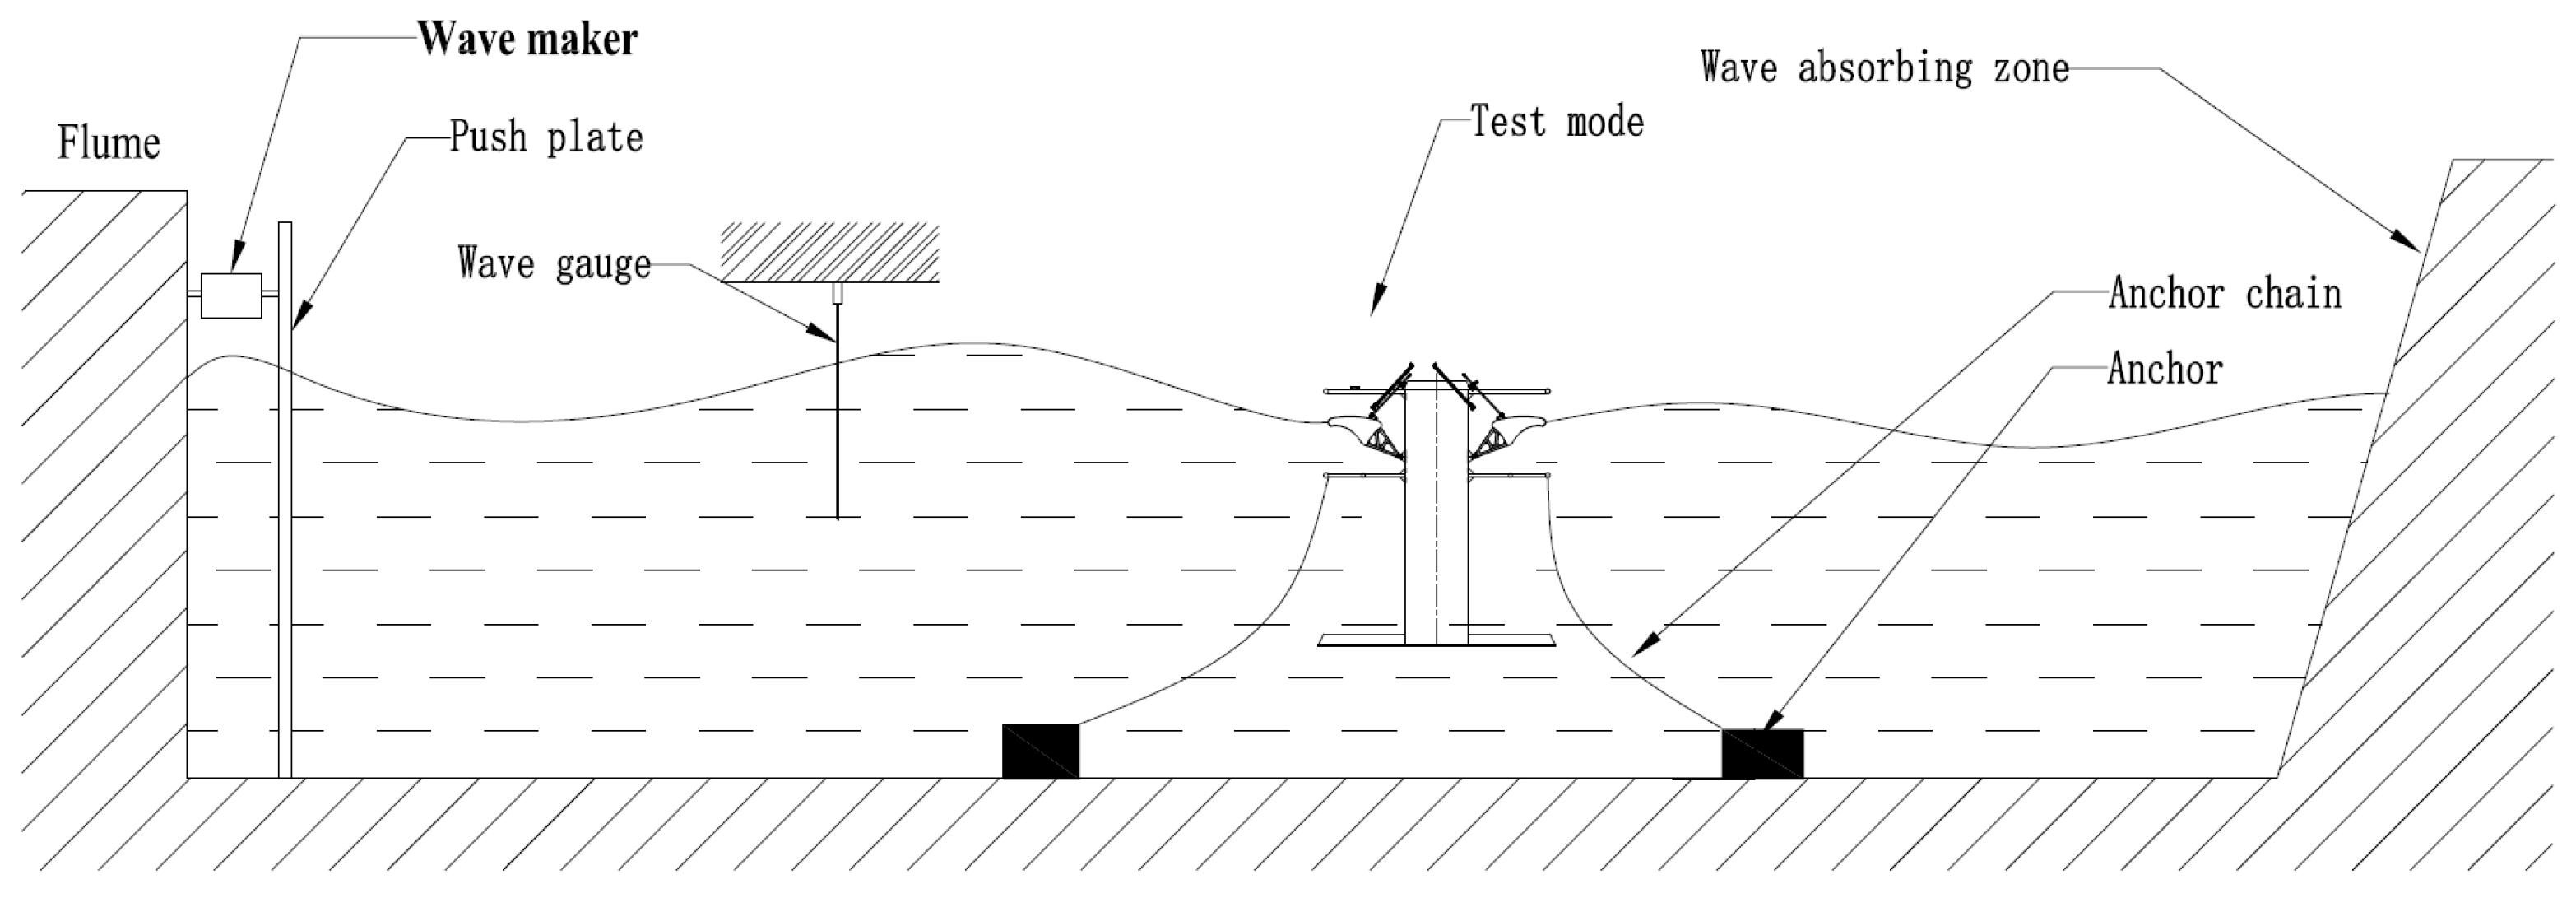
The experiment was carried out in the ship tank at South China University of Technology, as illustrated in Figure 3. The tank measures 120 m in length, 8 m in width, and 4 m in depth, situated further from the wave maker. At one end of the tank, a pusher-type wave maker is installed, which is capable of generating a variety of both regular and irregular wave patterns. Conversely, the opposite end of the tank features a wave dissipation dike.
The OOBWEC model is made of steel and features a diameter of 2.14 m, a total height of 2.38 m, and an overall wave width of 1.34 m. It is equipped with six absorbers, each with a wave width of 0.8 m. Under operational conditions, the model has a draft depth of 1.97 m, and the detailed geometric specifications are provided in Table 1.
In the marine environment of China’s coastal waters, field observations indicate that incident wave heights typically range from 0.5 m to 1.5 m, with wave periods varying between 2 s and 6 s [22]. Considering the geometric dimensions of the wave testing pool and its wave generation capacity, a physical model with a scaling ratio of λ = 1:5 was developed. The model-prototype relationships follow Froude similarity principles, with key scaling parameters summarized in Table 2 below:
In the table, Ls is the dimensional parameter of the prototype machine; Lm is the dimensional parameter of the model; Ts/Tm are the time parameters of the prototype machine and the model, respectively; As/Am are the area parameters of the prototype machine and the model, respectively; s / m are the volume parameters of the prototype machine and the model, respectively; Fs/Fm are the force parameters of the prototype machine and the model, respectively; and Ps/Pm are the pressure parameters of the prototype machine and the model, respectively.
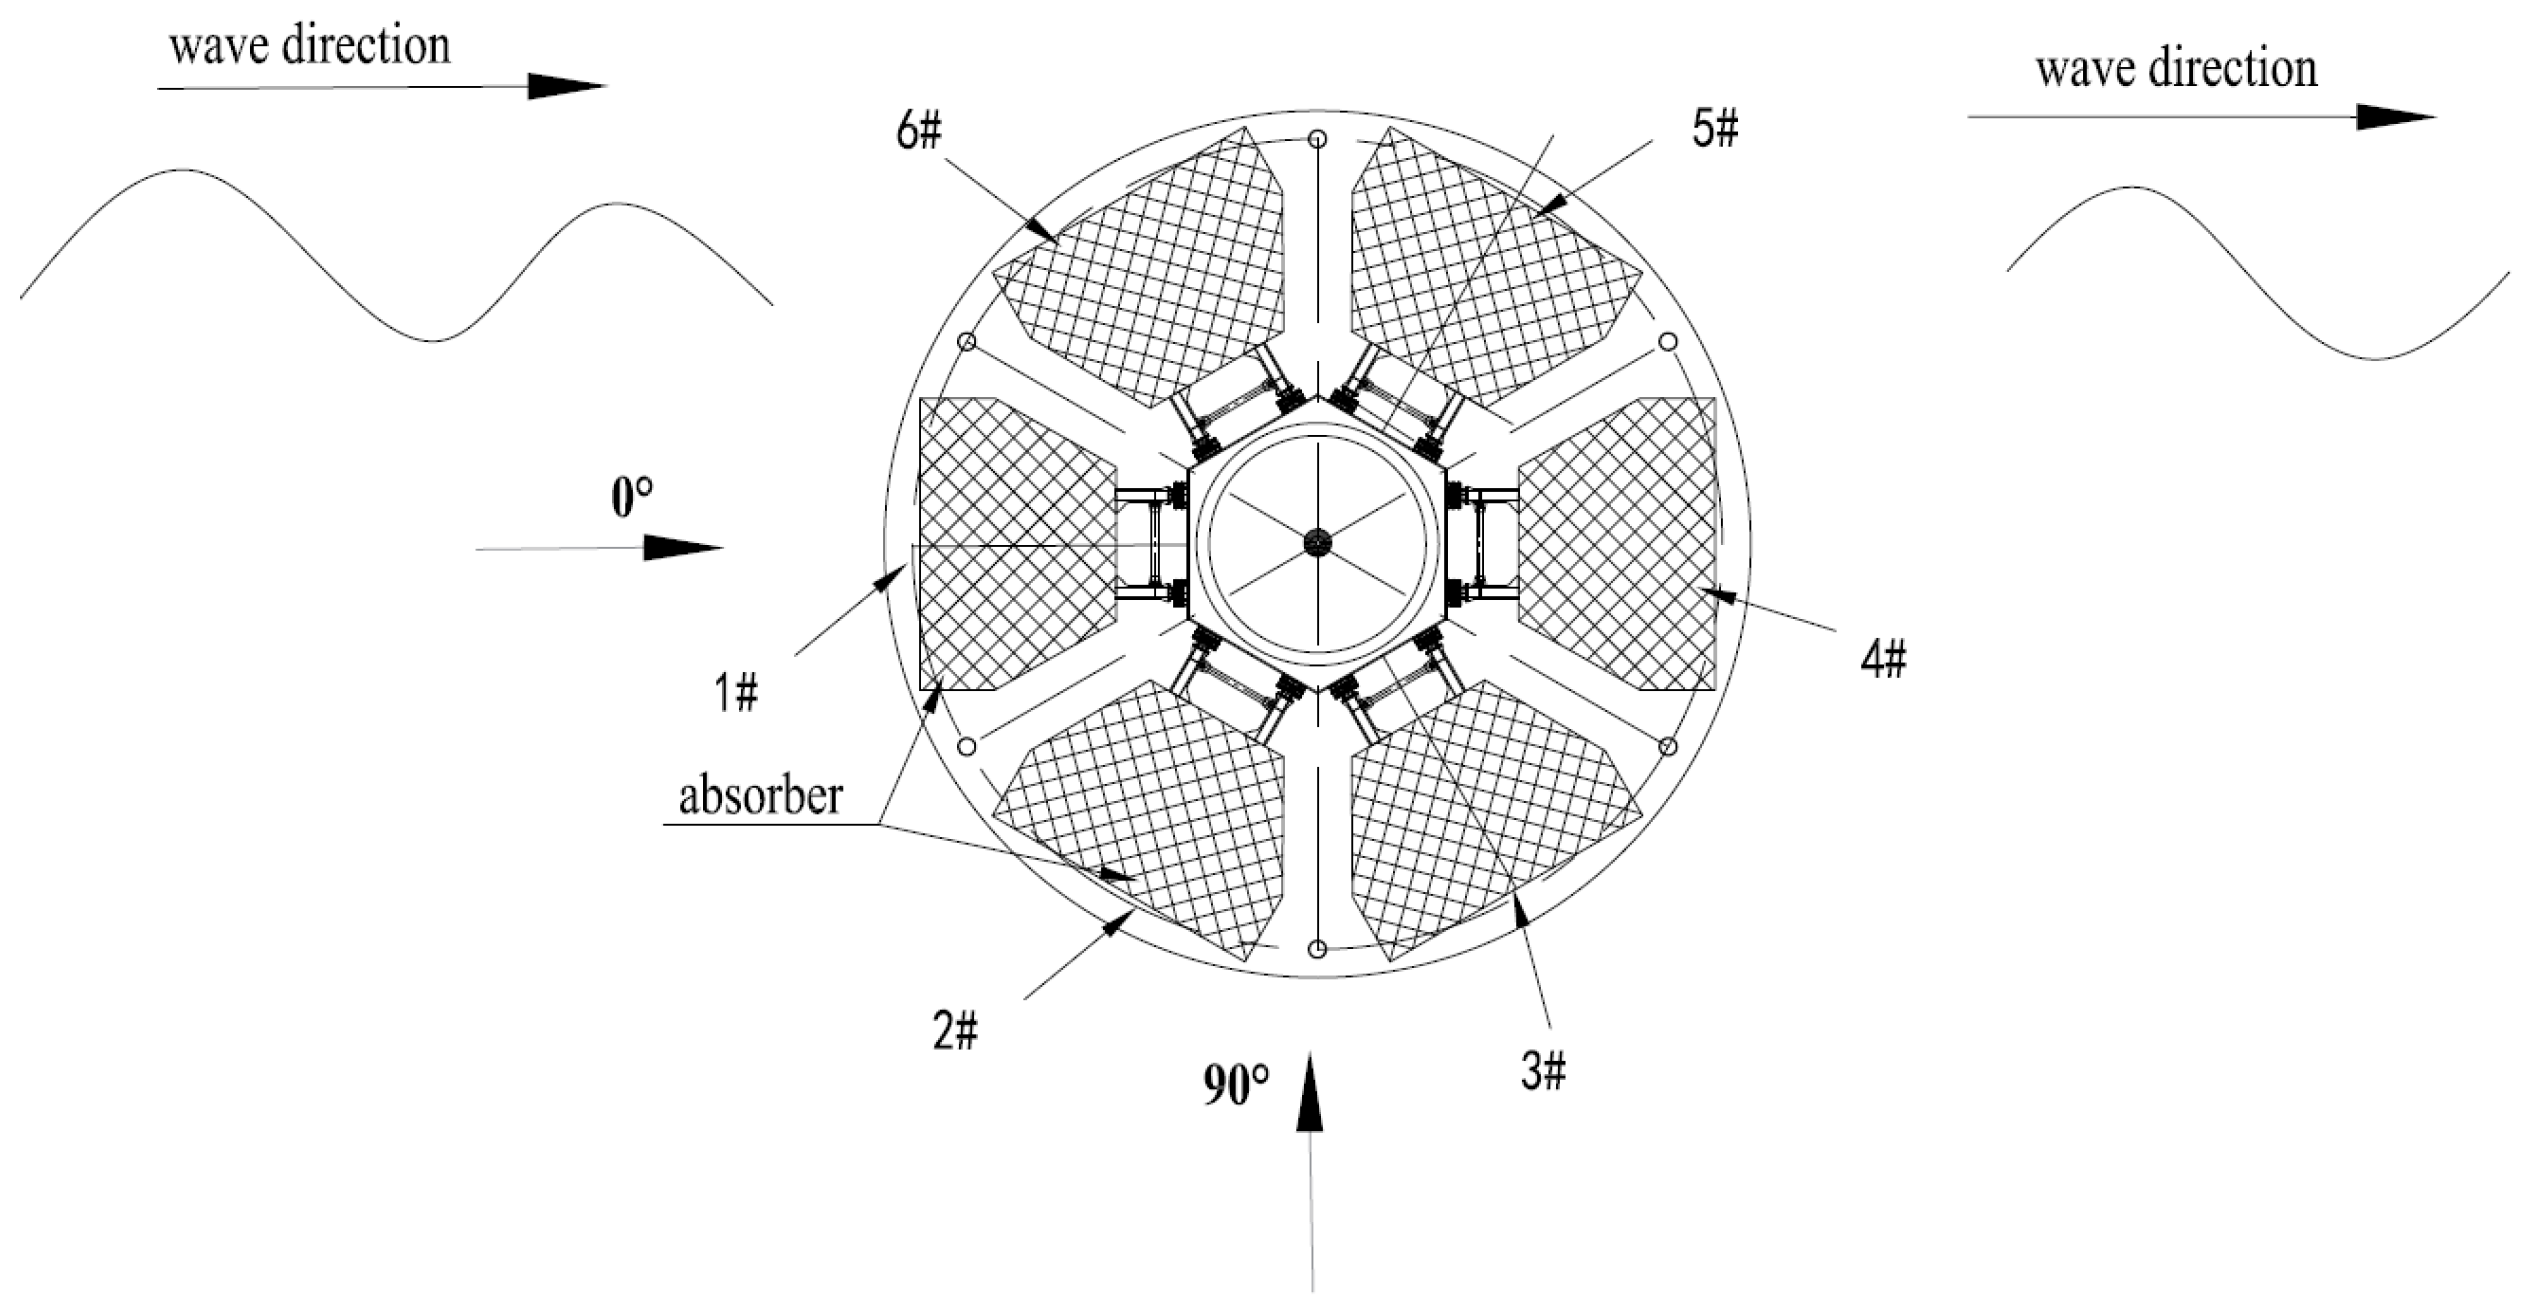
The physical model is moored within the wave pool using three mooring chains, positioned along the pool’s central axis at a distance of approximately 20 m from the wave generator. Among the six absorbers, the 1# one is designated as the primary energy capture unit. It is oriented parallel to the pool’s central axis, facing the wave propagation direction at a 0° incidence angle, ensuring direct alignment with oncoming waves. The overall configuration of the test model is illustrated in Figure 4, while the absorber numbering scheme—with subsequent floaters sequentially numbered in a counterclockwise pattern—is depicted in Figure 5. The mooring system employs a triangular deployment: the three chains are angularly spaced at 120° intervals to form a symmetrical restraint structure. Each chain consists of a 6 m long, 4 mm diameter rigid anchor chain terminated with a 20 kg anchor. During testing, the chains are pre-tensioned to maintain static equilibrium, ensuring that the underwater appendages remain stationary relative to wave-induced motions of the absorber floaters.
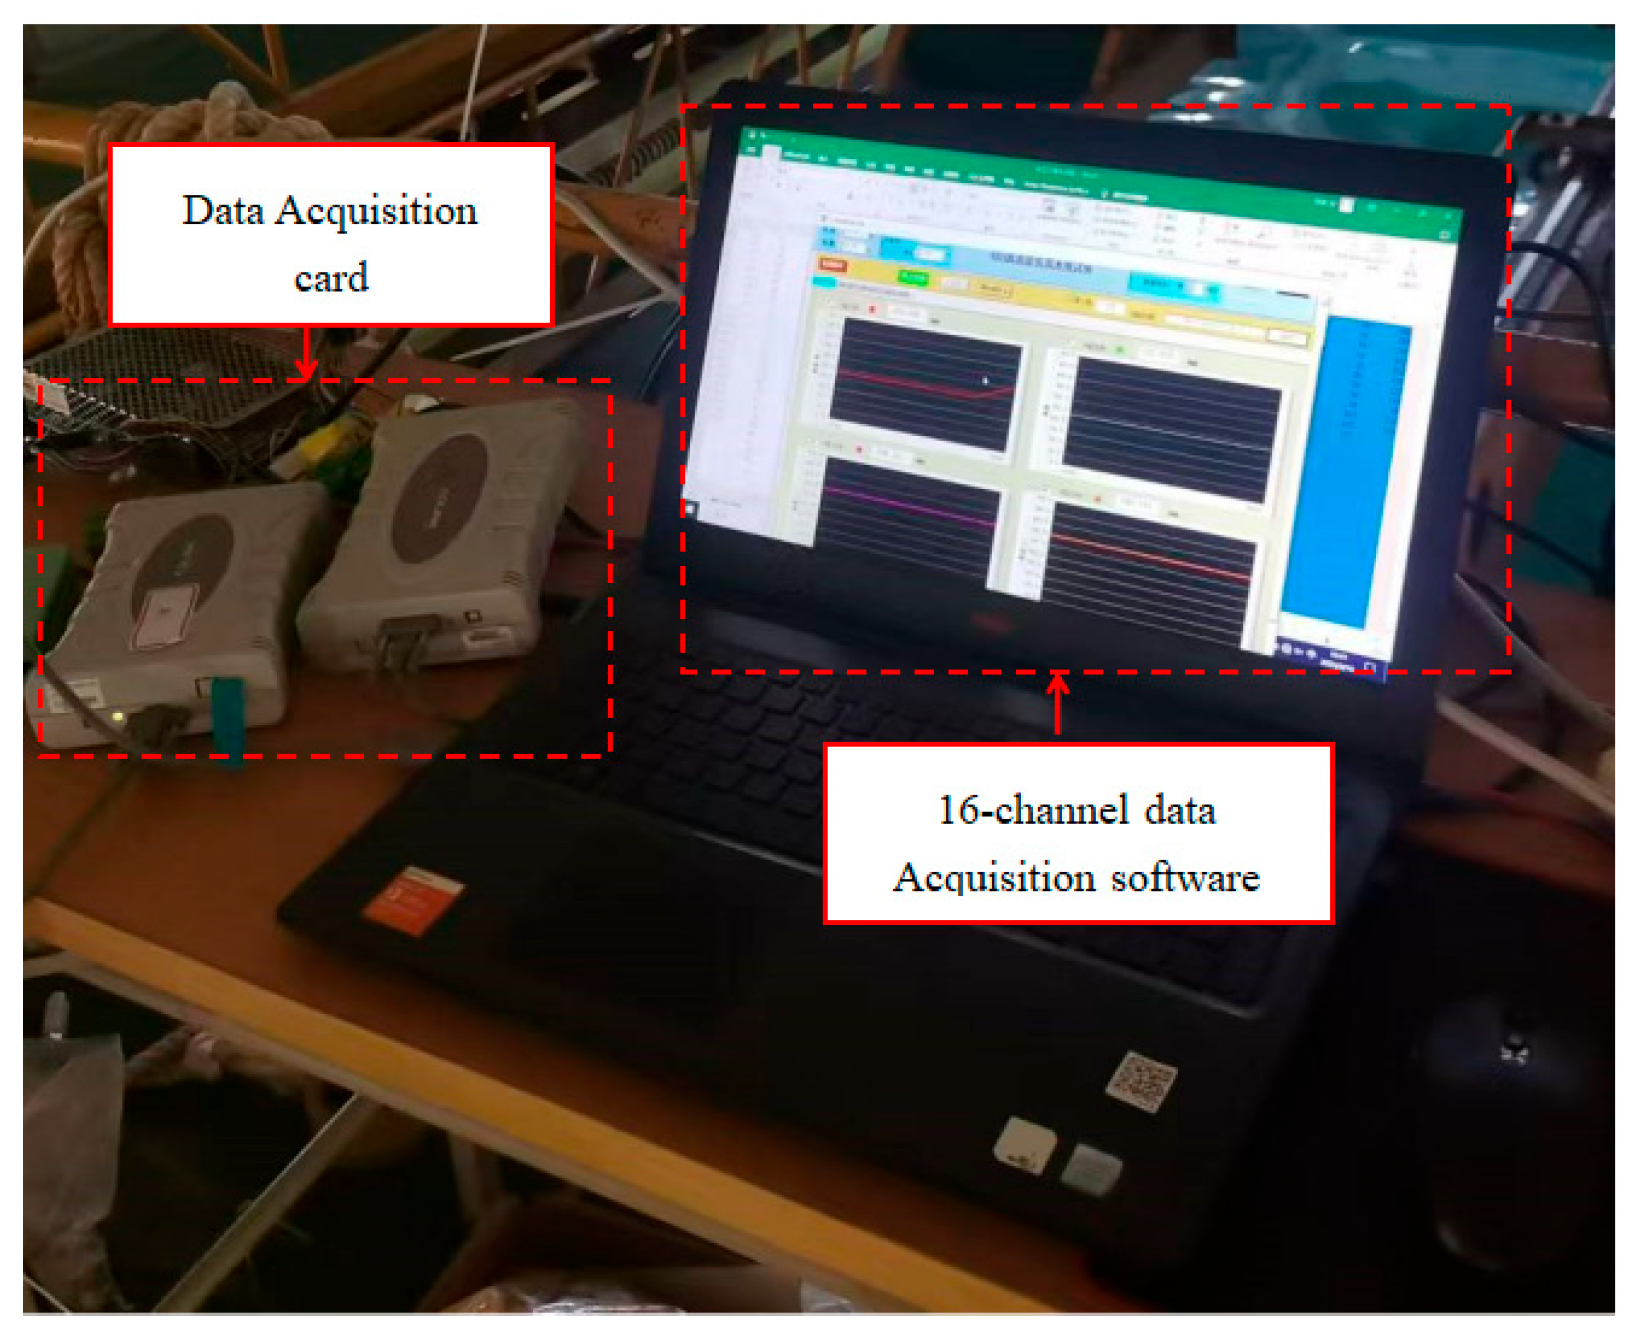
Located 10 m away from the wave generator, a digital wave gauge was employed for gathering data regarding the heights and periods of the incident waves. Furthermore, a displacement sensor and a tension pressure sensor were installed on each absorber of the model to monitor the motion and force exerted on the absorbers, as represented in Figure 6. The data acquisition instruments are enumerated in Figure 4. All data are collected in real time through a 16-channel acquisition system, as illustrated in Figure 7, with a sampling frequency set at 12 Hz.
In accordance with the scale ratio of λ = 1:5, the regular wave height during the testing phase varies between 100 mm and 180 mm, while the wave period ranges from 0.9 s to 2.68 s. The specific conditions of the regular waves are detailed in Table 3.

3. Data Processing

During the experiments, each case was repeated three times, and the final result was calculated as the average of these three trials. The mean wave power of regular waves in the infinite water depth act on the WEC given by reference, is expressed by the following formula [23]:
E w = ρ g H 2 ω 16 k [ 1 + 2 k h / sinh ( 2 k h ) ] B
where E w is the wave power of the incident wave, ρ denotes the density of water, g represents the acceleration due to gravity, H indicates the wave height when the pool is devoid of water, h signifies the water depth, ω is the angular frequency (ω = 2π/T), T is period of the wave, k refers to the wave number, and B indicates the total wave-facing width of the model.
The mechanical energy output from the hydraulic cylinders within a single acquisition time cell, which corresponds to the wave energy harnessed by an individual absorber, is defined as follows:
W i = F i s i
where W i is the mechanical energy output, Fi and si represent the force and displacement of the hydraulic cylinder, respectively.
Furthermore, the total wave energy captured by a single absorber under each operational condition is represented as follows:
W p = t t + n T W i d t
where Wp is the power captured by a single absorber during one operational condition.
The average wave power captured by the model for each operational condition is expressed as follows:
E p = i = 1 6 1 n T t t + n T F i s i d t
where Ep is the average power captured by a single absorber during one operational condition; n signifies the number of waves encountered by the absorber during one operational condition.
Ultimately, the CWR of the model can be assessed through the average kinetic power and the incident wave power, which is articulated as follows:
η CWR = E p E W 100 %
here, ηCWR is the CWR of the model during one operational condition.

4. Result and Discussion

Under the specified operating conditions and duration, the WEC was exposed to a minimum of 20 wave cycles. For each set of operating conditions, Equations (1) to (5) were employed to calculate the CWR and capture power of the model, which were then subjected to comparative analysis.

4.1. Effect of Wave Height

Figure 8 shows the CWR curves of the model across various wave heights. The data indicate a general trend of a gradual decline in the CWR as wave height increases. For incident wave heights of 60 mm, 80 mm, and 100 mm, the model exhibits peak CWR values at a period of 1.8 s, measuring 65.18%, 68.14%, and 64.52%, respectively. Conversely, the lowest CWR values for these heights occur at a period of 2.7 s, with corresponding values of 35.13%, 29.72%, and 22.15%. At an incident wave height of 120 mm, the model achieves its maximum CWR of 56.68% at a period of 1.3 s, while the minimum CWR is recorded at 2.7 s, at 18.8%. For an incident wave height of 140 mm, the model’s highest CWR is 56.79% at 1.8 s, which is marginally greater than the 56.72% observed at 1.3 s, with the lowest value dropping to 16.76% at a period of 2.7 s. The WEC achieves the optimal CWR at a wave height of 80 mm and a period of 1.8 s. This is because under the combined action of gravity, wave forces, damping forces, and other resultant forces, the absorber demonstrates good follow ability to incident waves. Compared with other working conditions, the float’s motion response speed and amplitude exhibit the best performance under these conditions.
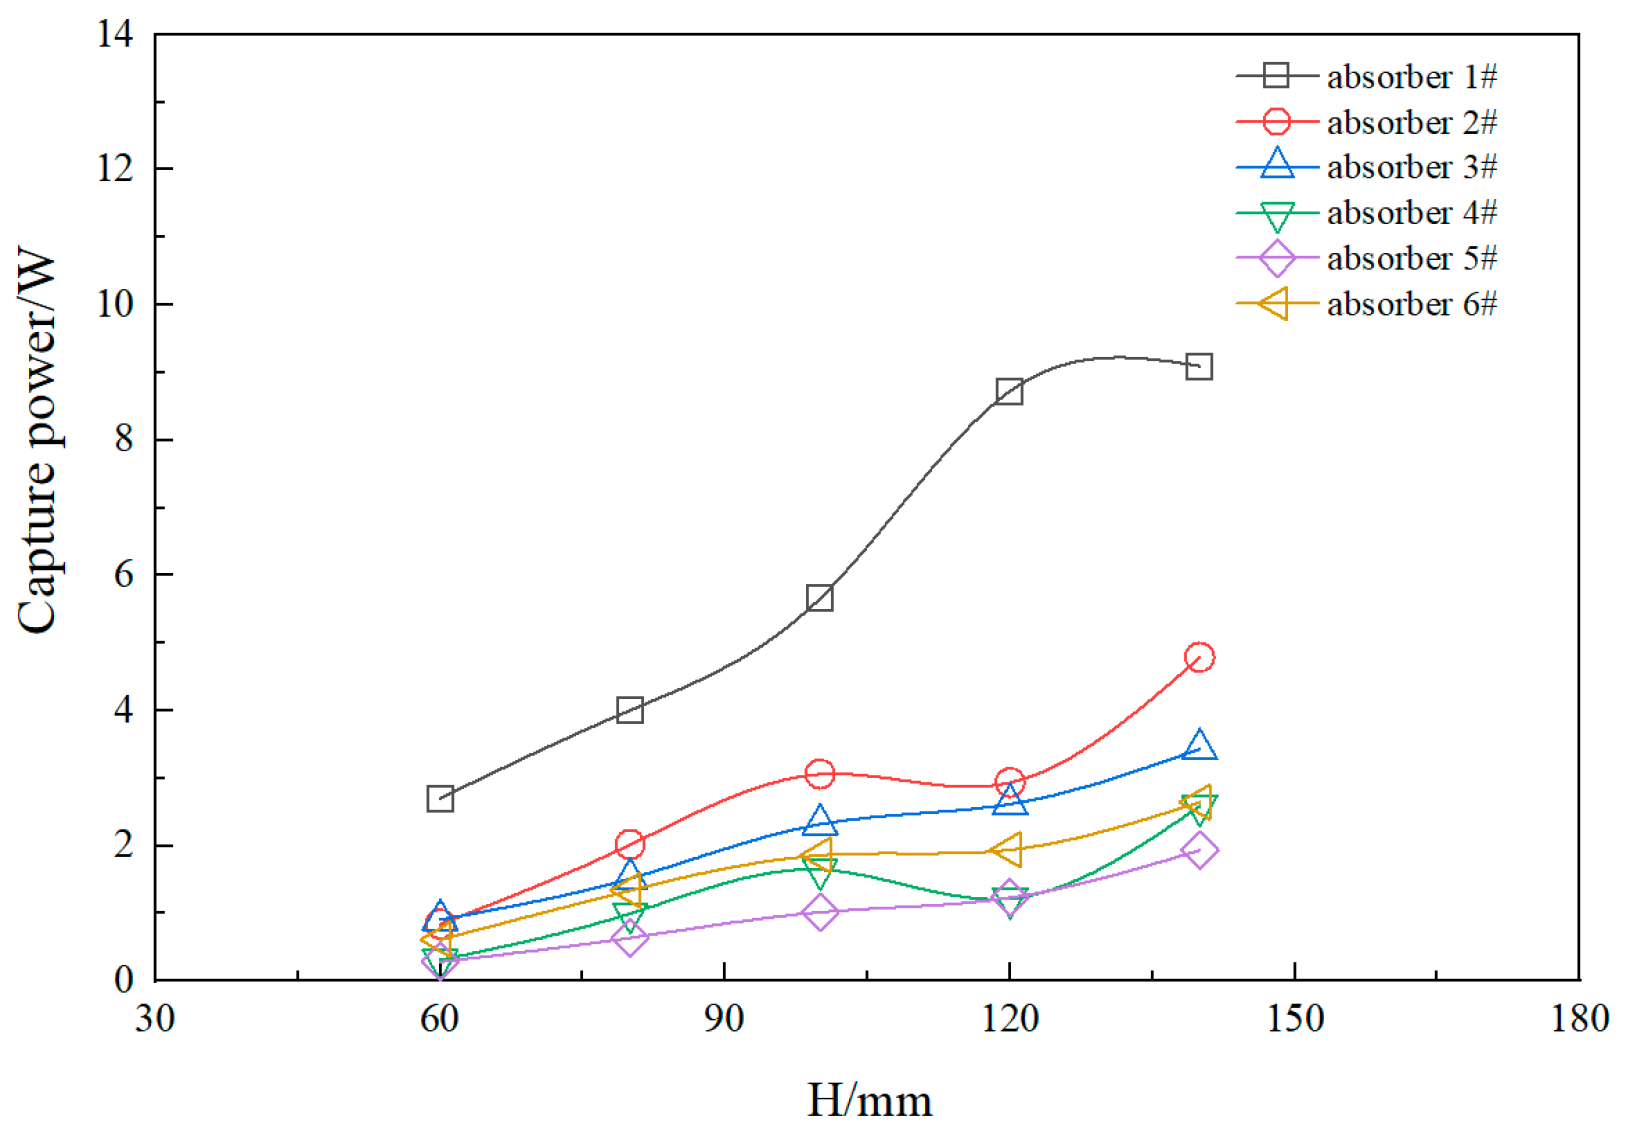
As illustrated in Figure 9, the power captured by each absorber is influenced by the wave height, when the incident wave period is 1.8 s. The power captured by the absorbers generally increases with rising wave height; however, the first absorber (1#) exhibits a significantly higher captured power compared to the others. For all absorbers, with the exception of 1#, there exists a linear correlation between captured power and wave height. From the above results, the Ep of the 1# absorber is significantly greater than that of other absorbers. The captured power of the 1# absorber demonstrates a proportional relationship with wave height when the latter is below 100 mm. Conversely, when wave height exceeds 100 mm, the captured power increases in a parabolic manner, reaching a maximum of 9.1 W at a wave height of 140 mm. The primary cause of the aforementioned phenomenon is that the 1# absorber, oriented at a 0° wave approach angle, captures wave energy at the optimal wave-facing orientation. In the wave flume, unabsorbed wave energy by the 1# floater propagates forward and is sequentially captured by other floaters in the order of their wave exposure timing. The CWR of the 5# absorber, which is the farthest one from the incident wave source, remains consistently the lowest.

4.2. Effect of Wave Period

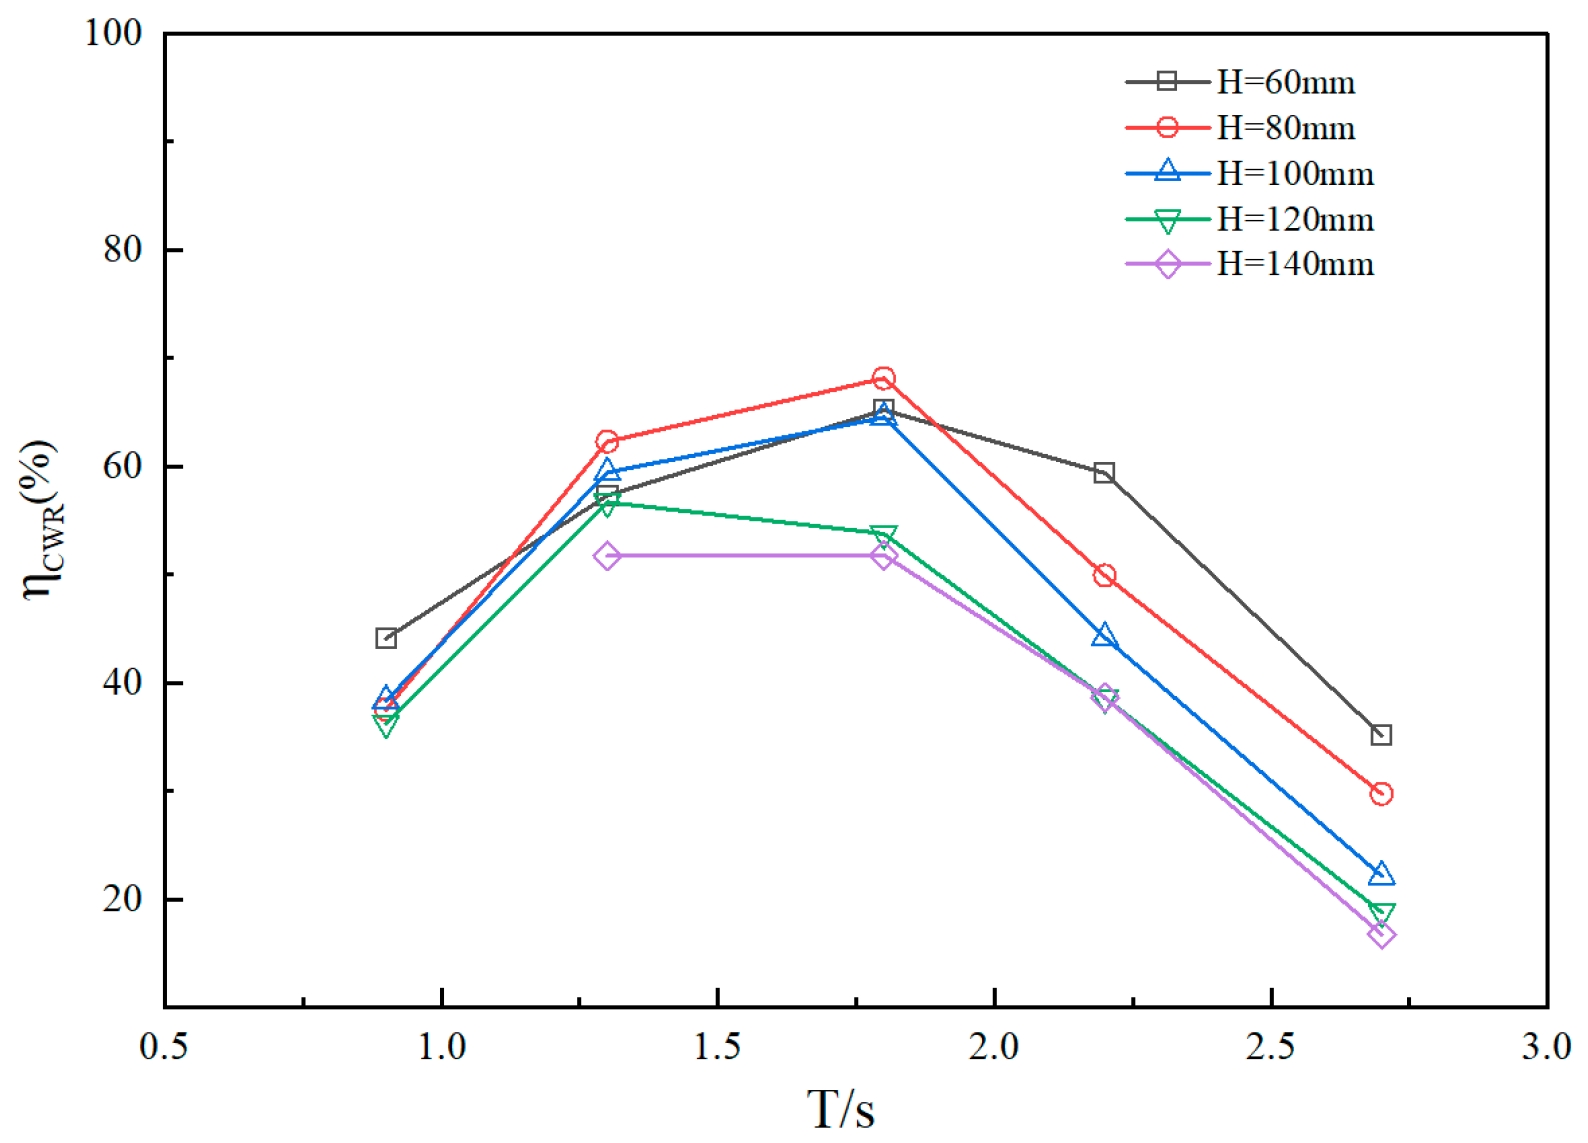
Figure 10 illustrates the CWR curves of the model across various periods. The CWR of the model, in response to differing incident wave heights, initially exhibits a decrease, followed by an increase, and subsequently a gradual decline as the period increases. At an incident wave period of 0.9 s, the CWR predominantly hovers around 35% for most incident wave heights, with a notable increase to 44% observed at an incident wave height of 60 mm. At a period of 1.3 s, the disparity in CWR across varying wave heights becomes more pronounced, peaking at 62.27% for a wave height of 80 mm, before decreasing to a minimum of 51.72% at a wave height of 140 mm. As the incident wave period extends to 1.8 s, the variation in CWR continues to widen, with maximum and minimum values recorded at 68.15% and 51.79%, respectively, for wave heights of 80 mm and 140 mm. At a period of 2.2 s, the differences in CWR among the models at each wave height further increase, reaching a maximum of 59.36% at a wave height of 60 mm and a minimum of 38.6% at wave heights of 120 mm and 140 mm. However, as the period remains at 2.2 s, the gap in CWR begins to diminish, with the maximum value recorded at 35.13% for a wave height of 60 mm and the minimum decreasing to 16.76% for a wave height of 140 mm. These observations suggest that the absorbers exhibit optimal wave capture capabilities when the intrinsic period of the model is approximately 1.8 s. Under this condition, the absorber (as the rotor) exhibits the maximum motion amplitude. The relative motion amplitude between the rotor and the stator reaches its maximum value, enabling the capture of a significantly higher amount of wave energy.
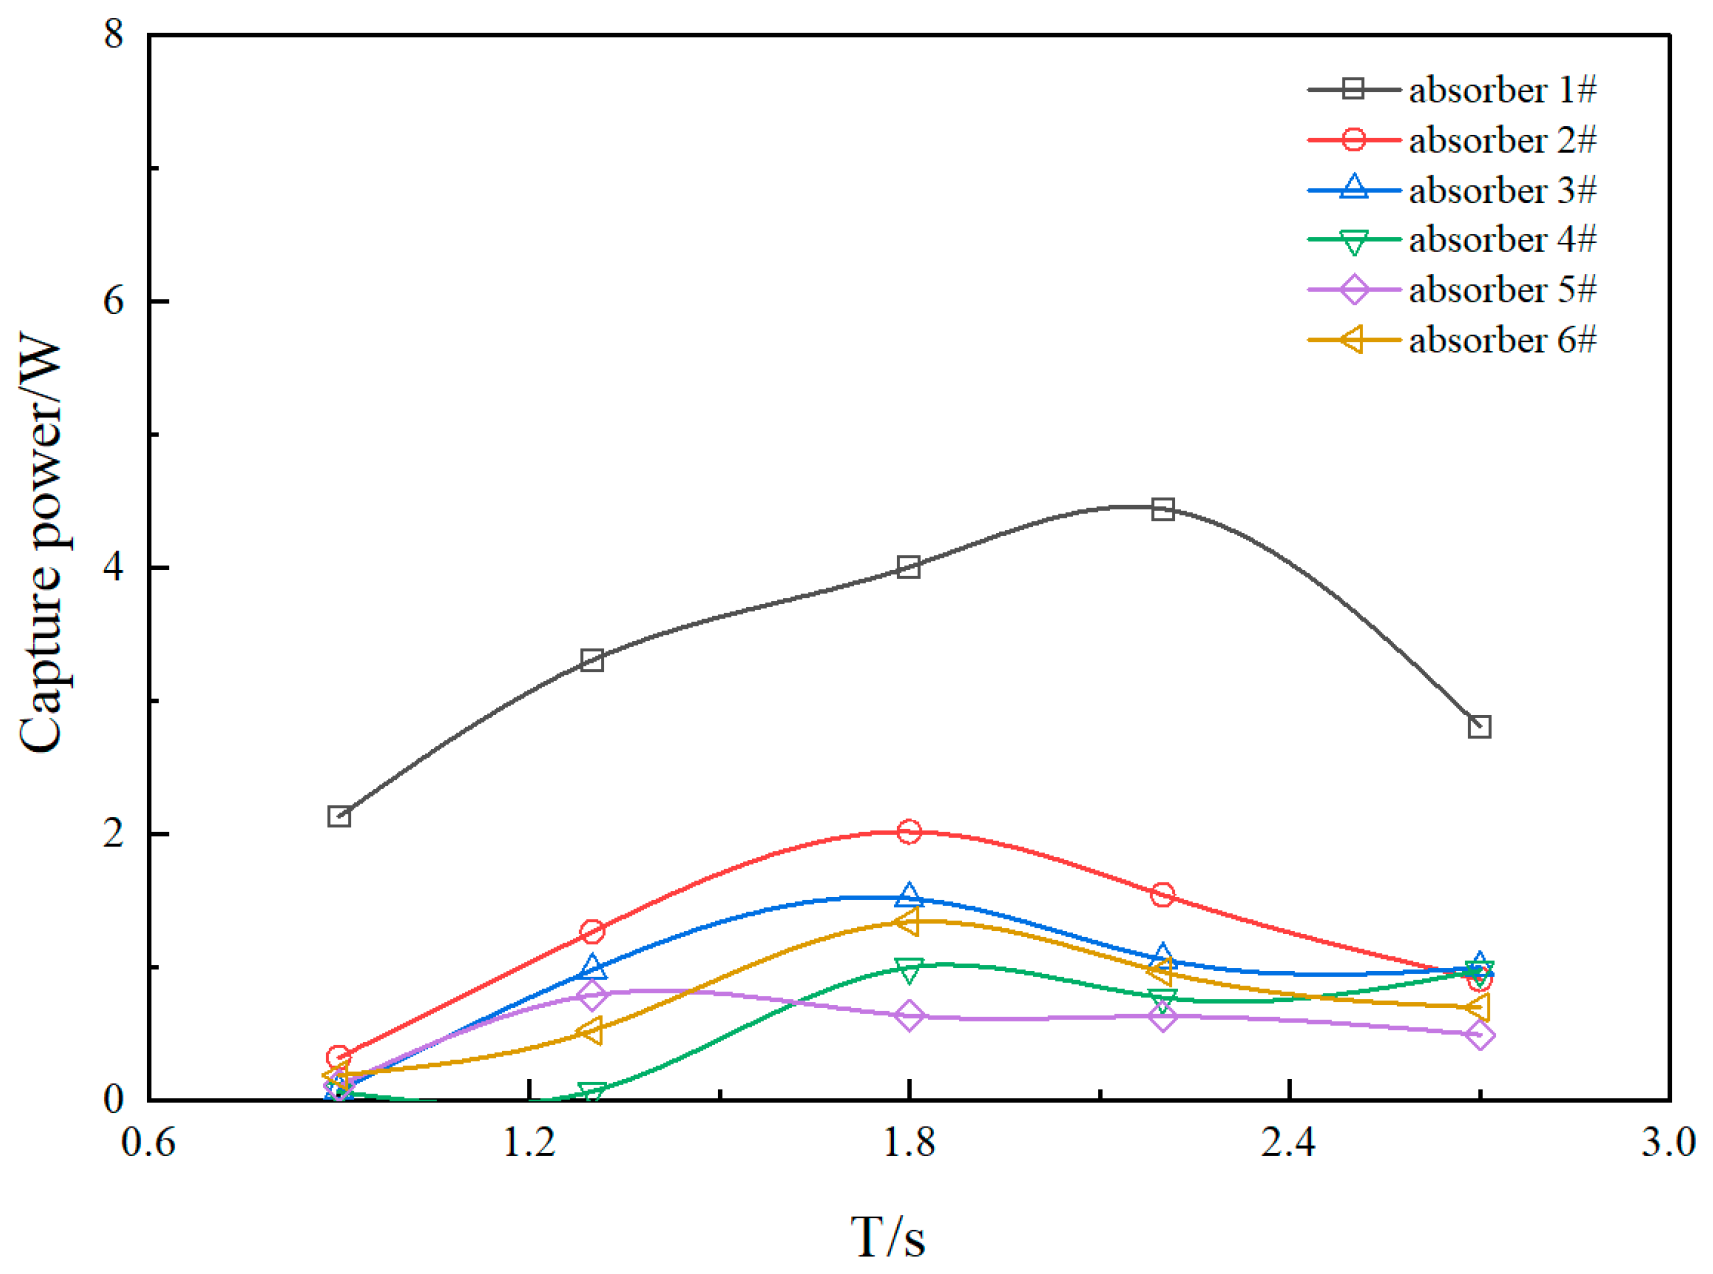
Figure 11 illustrates the relationship between the captured power of each absorber and the wave period, specifically when the incident wave height is 80 mm. The captured power for each float initially increases with the wave period before subsequently decreasing. Notably, the captured power of the 1# absorber, which is oriented directly towards the wave, significantly exceeds that of the other floats. This variation in captured power can be attributed to the distinct hydraulic damping configurations of each float, resulting in differing inertial properties and consequently varying periods at which maximum captured power is achieved. As depicted in Figure 11, the 1# absorber reaches its peak captured power at a wave period of 2.2 s, while the maximum values for floats 2#, 3#, 4#, and 6# occur at 1.8 s, and for float 5# at 1.3 s. The aforementioned phenomenon reveals that the motion response of the 1# absorber is non-uniform with those of other floats. In contrast, the motion responses of floats 2#, 3#, 4#, and 6# are consistent. The abnormally low motion response of the 5# absorber is likely attributed to its positioning and structural configurations.

4.3. Effect of Freedom

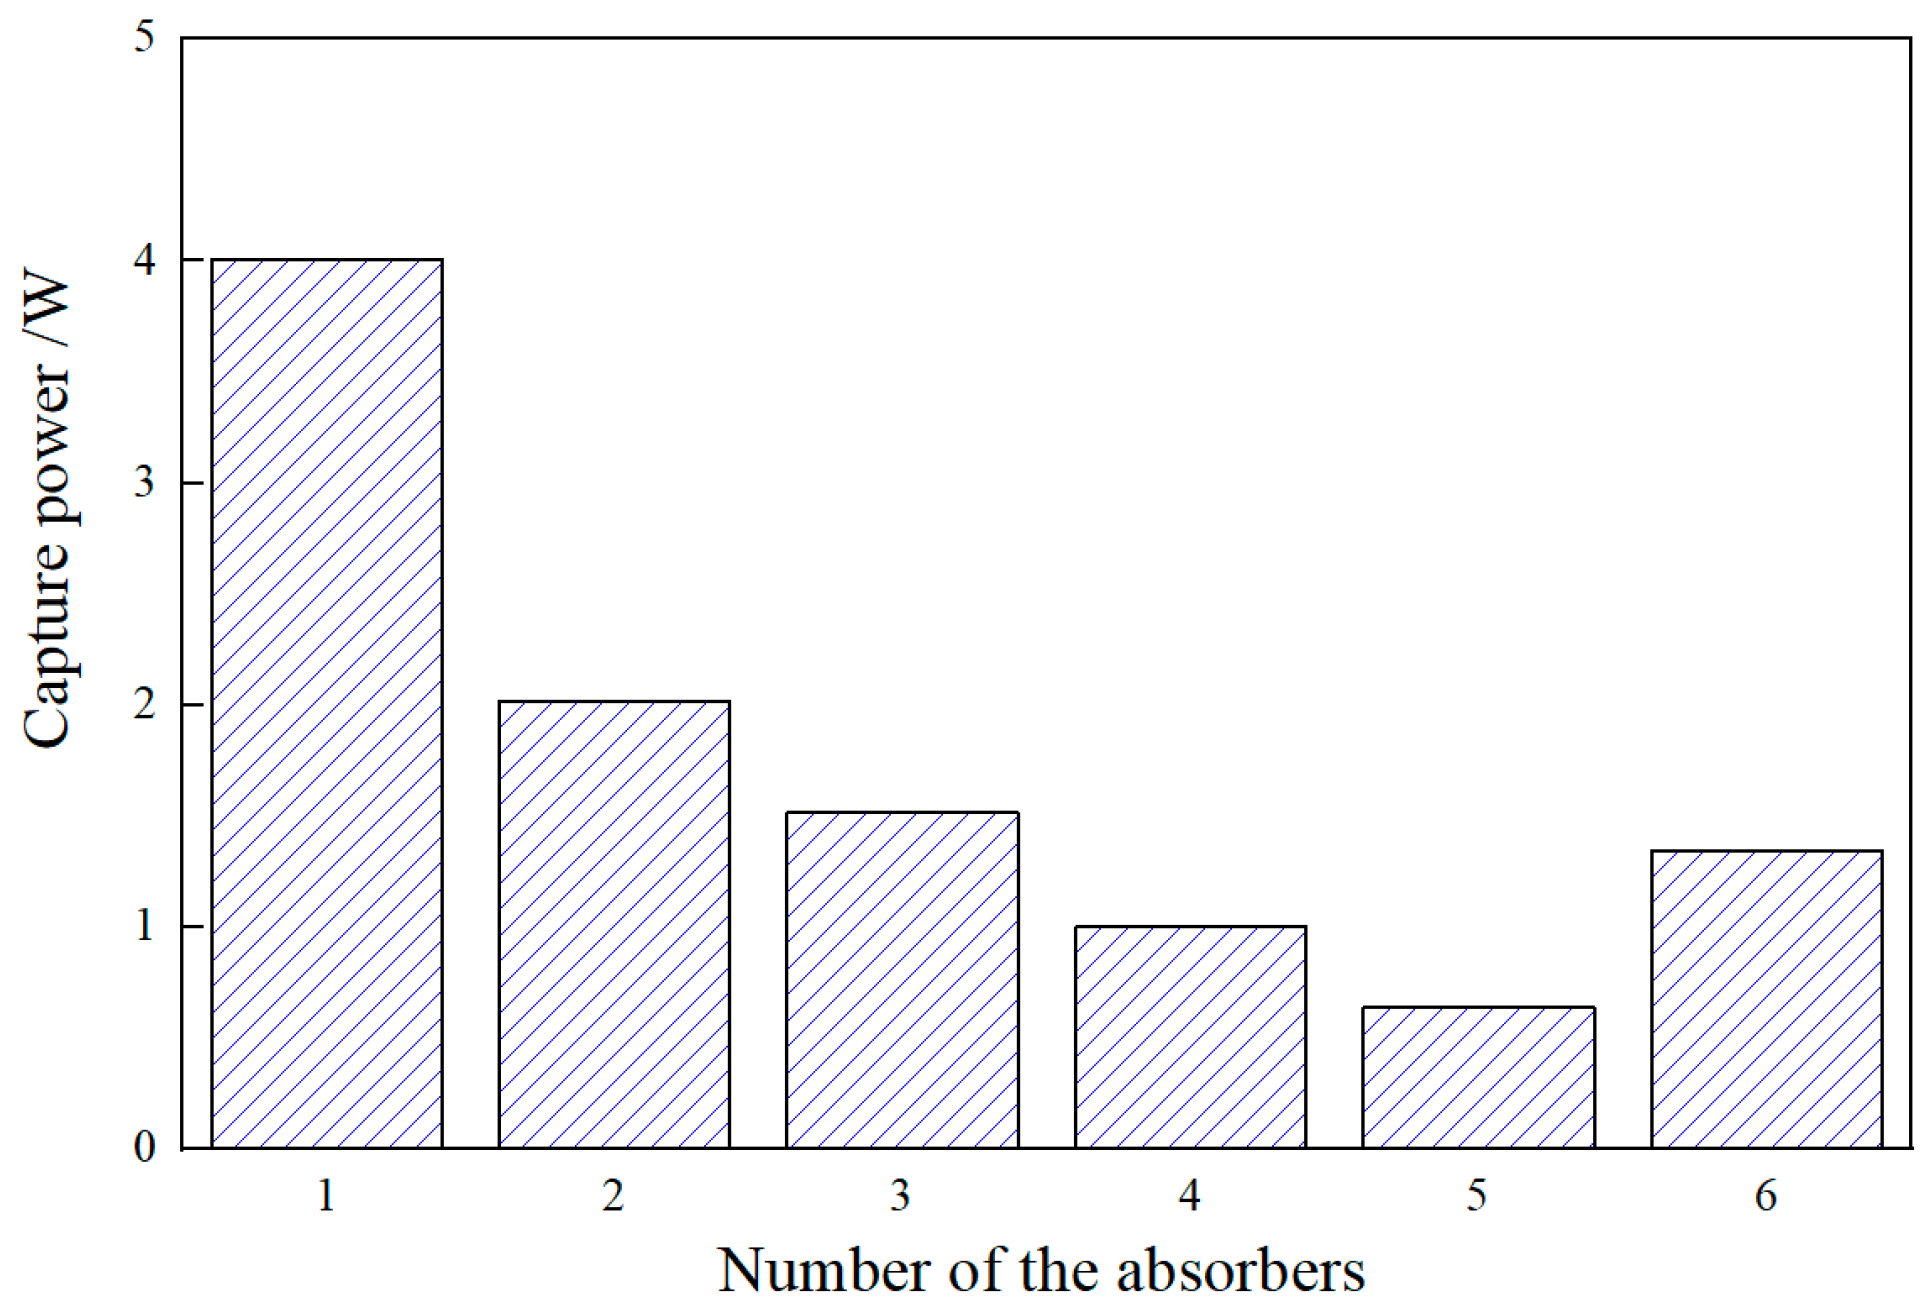
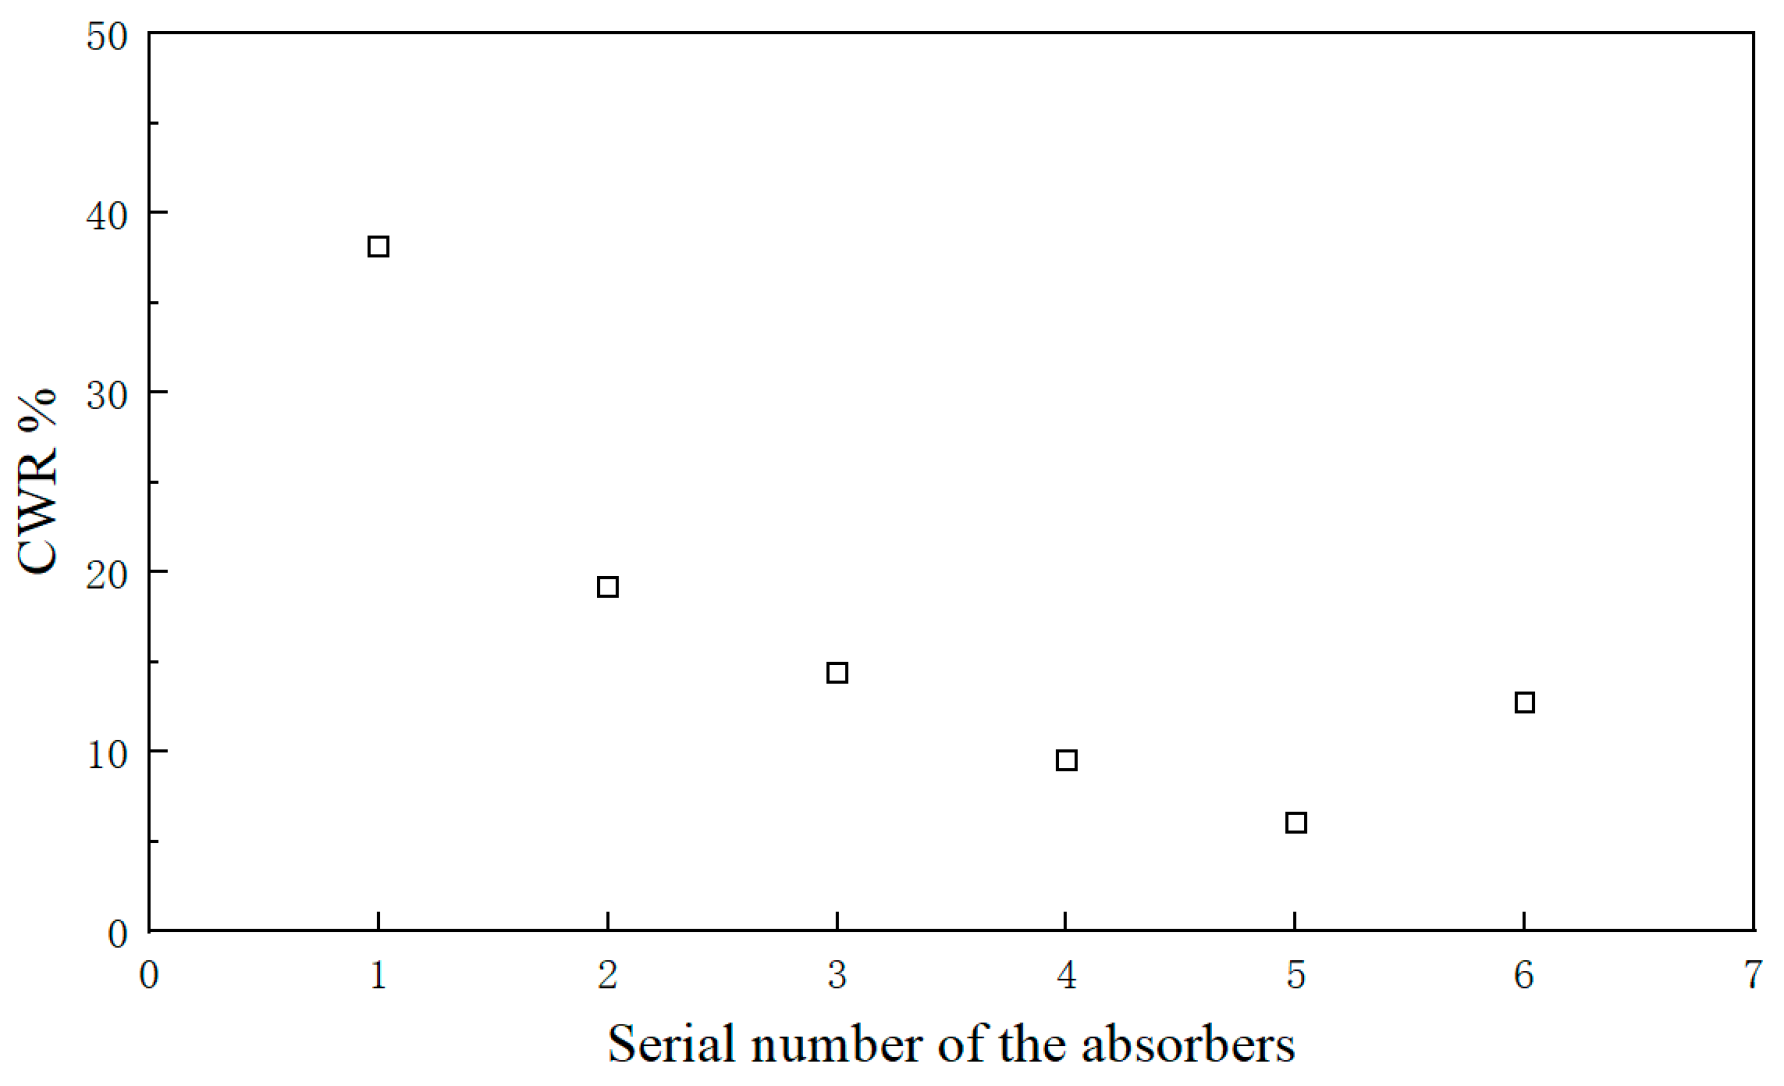
The arrangement of the absorbers around the main float is circular, as shown in Figure 5. The 1# through 6# floats are positioned at angles of 0°, 60°, 120°, 180°, 240° (−120°), and 300° (−60°) relative to the center axis and the angle of the incident wave (referred to as the wave angle). Under the influence of the incident wave, each float captures wave energy with varying degrees of effectiveness, as illustrated in Figure 12, while Figure 13 presents the ratio of captured power to the total power for each float. Given that the wave angle is 0°, indicating a direct wave, the 1# absorber exhibits the highest captured power. The 2# and 6# floats, positioned symmetrically relative to the 1# float, capture slightly less power due to their wave angle of 120°. Conversely, the 5# absorber demonstrates the lowest captured power, primarily because a significant portion of the energy is absorbed by the 6# float, which is positioned to capture energy from waves at a smaller angle. Although the 3# float shares the same wave angle as the 5# float, it captures more energy, likely due to lower installation resistance compared to the 5# float. The 4# float, despite encountering waves at the largest angle, captures slightly more power than the 5# float, a phenomenon attributed to wave circumference and reflection effects that enhance energy convergence at the float.

5. Conclusions

In this study, a model test in wave flume is done to investigate the WEC and the influence of wave height, period, and motion degrees of freedom on energy capture, motion response, and performance of a novel device for wave energy power generation. The major findings are as follows:
(1) The scale ratio model tests of the designed omnidirectional WEC indicate that the maximum CWR reaches 68.15% when the incident wave period is 1.8 s and the wave height is 80 mm.
(2) Among the various absorbers, 1# demonstrates significantly higher capture power compared to the others. The peak capture power is observed at an incident wave period of 1.8 s and a wave height of 140 mm, representing 38.09% of the total capture power of the model.
(3) The influence of the wave angle on the capture power and CWR of the WEC is very significant. For the OOBWEC, the overall capture power is not solely determined by the absorbers directly facing the incoming waves but also by the collective performance of all absorbers. The capture capacity of a floating body reaches its maximum when the direction of its wave capture motion aligns with the angle of wave incidence. In the design process, priority should be given to configuring absorbers that are optimally oriented to meet the incoming waves head-on in order to achieve the highest CWR. Subsequently, the wave incidence angles for the remaining absorbers should be considered to optimize their individual capture efficiencies, thereby maximizing the CWR for the second and third wave energy capture phases.
(4) Due to the constraints of the flume conditions, such as incident waves and the mooring system, the experiment was necessarily simplified. These simplifications may introduce potential errors into the experimental results and should be carefully considered in the design process of the WEC.

Author Contributions

W.W.: methodology, data curation. J.L.: methodology, investigation, data curation. Z.W.: methodology, data curation. Z.L.: data curation. G.Z.: data curation. Y.Z.: formal analysis, investigation, data curation, writing—review and editing, visualization. All authors have read and agreed to the published version of the manuscript.

Funding

This research was funded by National Key Research and Development Program (NKRP) 2023YFC3106903-1; Science and Technology Major Project Guangxi Province (Grant No. GUIKE AA24206015). And The APC was funded by [2023YFC3106903-1].

Data Availability Statement

The original contributions presented in this study are included in the article. Further inquiries can be directed to the corresponding author(s).

Acknowledgments

During the preparation of this work the author(s) used [Youdao Translator] in order to [translate]. After using this tool/service, the author(s) reviewed and edited the content as needed and take(s) full responsibility for the content of the publication.

Conflicts of Interest

The authors declare that they have no known competing financial interests or personal relationships that could have appeared to influence the work reported in this paper.

Nomenclature

CFDcomputational fluid dynamics
CWRcapture width ratio
DOFdegrees of freedom
MB-MDOFmulti-body multi-degree-of-freedom
OBoscillating buoy
OBWECsoscillating buoy wave energy converters
OOBWEComnidirectional oscillating buoy WEC
OPovertopping devices
OWCoscillating water columns
PTOpower Take-Off
SDOFsingle degree-of-freedom
SB-MDOFsystematically divided into two distinct classes: single-body multi-degree-of-freedom
WECwave energy converter

References

  1. Leonard, M.D.; Michaelides, E.E.; Michaelides, D.N. Energy storage needs for the substitution of fossil fuel power plants with renewables. Renew. Energy 2020, 145, 951–962. [Google Scholar] [CrossRef]
  2. Guo, C.; Sheng, W.; De Silva, D.G.; Aggidis, G. A review of the levelized cost of wave energy based on a techno-economic model. Energies 2023, 16, 2144. [Google Scholar] [CrossRef]
  3. He, F.; Liu, Y.; Pan, J.; Ye, X.; Jiao, P. Advanced ocean wave energy harvesting: Current progress and future trends. J. Zhejiang Univ. Sci. 2023, 24, 91–108. [Google Scholar] [CrossRef]
  4. Seongho, A.; Vincent, S.N. Investigation of Mixed Long-Term Nonstationary Trends in Global Wave Energy Systems. J. Clean. Prod. 2024, 476, 143758. [Google Scholar] [CrossRef]
  5. Falcao, A.F.O. Wave energy utilization: A review of the technologies. Renew. Sustain. Energy 2010, 14, 899–918. [Google Scholar] [CrossRef]
  6. Shi, H.; Liu, Z. Research progress and development trend of ocean wave energy. Ocean. Sci. Technol. Feral. 2021, 39, 22–28. [Google Scholar]
  7. Farrok, O.; Farah, M.M.; Islam, M.R. Introduction to the Principles of Wave Energy Conversion. In Oceanic Wave Energy Conversion; Springer: Singapore, 2024; pp. 1–15. [Google Scholar]
  8. López, I.; Andreu, J.; Ceballos, S.; de Alegría, I.M.; Kortabarria, I. Review of wave energytechnologies and the necessary power-equipment. Renew. Sustain. Energy Rev. 2013, 27, 413–434. [Google Scholar] [CrossRef]
  9. Ma, Y.; Tan, Q.; Niu, B.; Hu, C.; Men, X. Research progress of floating multi-energy combined power generation device. Chin. J. Ship Res. 2024, 19, 3–20. (In Chinese) [Google Scholar]
  10. Parsa, K.; Mekhiche, M.; Sarokhan, J.; Stewart, D. Performance of OPT’s Commercial PB3 Power Buoy During 2016 Ocean Deployment and Comparison to Projected Model Results. In Proceedings of the ASME 2017 36th International Conference on Ocean, Offshore and Arctic Engineering, Trondheim, Norway, 25–30 June 2017. [Google Scholar]
  11. Waters, R.; Stålberg, M.; Danielsson, O.; Svensson, O.; Gustafsson, S.; Strömstedt, E.; Eriksson, M.; Sundberg, J.; Leijon, M. Experimental results from sea trials of an offshore wave energy system. Appl. Phys. Lett. 2007, 90, 034105. [Google Scholar] [CrossRef]
  12. Weber, J.; Mouwen, F.; Parish, A.; Robertson, D. Wavebob-research & development network and tools in context of systems engineerings. In Proceedings of the 8th EuroPean Wave Tidal Energy Conference, Uppsala, Sweden, 7 September 2009; pp. 416–420. [Google Scholar]
  13. Dalton, G.J.; Alcorn, R.; Lewis, T. Case study feasibility analysis of the pelamis wave energyconvertor in lreland, portugal and north america. Renew. Energy 2010, 35, 443–455. [Google Scholar] [CrossRef]
  14. Palha, A.; Mendes, L.; Fortes, C.J.; Brito-Melo, A.; Sarmento, A. The impact of wave energy farms in the shorelinewave climate: Portuguese pilot zone case study using pelamis energy wave devices. Renew. Energy 2010, 35, 62–77. [Google Scholar] [CrossRef]
  15. Zhang, C.; Huang, S.; You, Y.G.; Sheng, S.W. Numerical research and open sea tests of a 100 kW modified Edinburgh Duck wave energy convertor. Front. Energy Res. 2019, 7, 9. [Google Scholar] [CrossRef]
  16. OPT. Ocean Power Technologies Announces Results for the Fiscal Fourth Quarter and Full Year Ended 30 April 2014; OPT: Richmond, CA, USA, 2014. [Google Scholar]
  17. Murray, R.; Rastegar, J.; Ahmadian, M.; Ghasemi-Nejhad, M.N. Novel Two-Stage Piezoelectric-Based Ocean Wave Energy Harvesters for Moored or Unmoored Buoys. In Proceedings of the Active and Passive Smart Structures and Integrated System 2009, San Diego, CA, USA, 8–12 March 2009. [Google Scholar]
  18. Zhang, Y.Q.; You, Y.G.; Shneng, S.W.; Wang, W.S. Analysis and optimization of hydrodynamic performance of eagle wave energy generator. Ship Mech. 2017, 21, 533–540. [Google Scholar]
  19. Sheng, S.W.; Zhang, Y.Q.; Wang, K.L.; Ye, Y.; You, Y.G. Research on power generation system of eagle wave power plant. Renew. Energy 2015, 33, 1422–1426. [Google Scholar]
  20. Shi, H.; Huang, S.; Cao, F. Hydrodynamic performance and power absorption of a multi-freedom buoy wave energy device. Ocean. Eng. 2019, 172, 541–549. [Google Scholar] [CrossRef]
  21. Azam, A.; Ahmed, A.; Li, H.; Tairab, A.M.; Jia, C.; Li, N.; Zhang, Z. Design and analysis of the optimal spinning top-shaped buoy for wave energy harvesting in low energy density seas for sustainable marine aquaculture. Ocean. Eng. 2022, 255, 111434. [Google Scholar] [CrossRef]
  22. Xi, L.T.; Li, X.F.; Song, L.J.; Yang, S.B.; Huang, Z.Z. Simulation and Evaluation of Wave Energy Resources in the South China Sea. Renew. Energy 2021, 39, 561–568. [Google Scholar]
  23. Zhang, Y.; You, Y.; Hu, J.; Wu, B. Investigation of wave energy resource evaluation for A finite water depth at random wave sea states. Acta Energiae Solaris Sin. 2012, 33, 1060–1066. [Google Scholar]
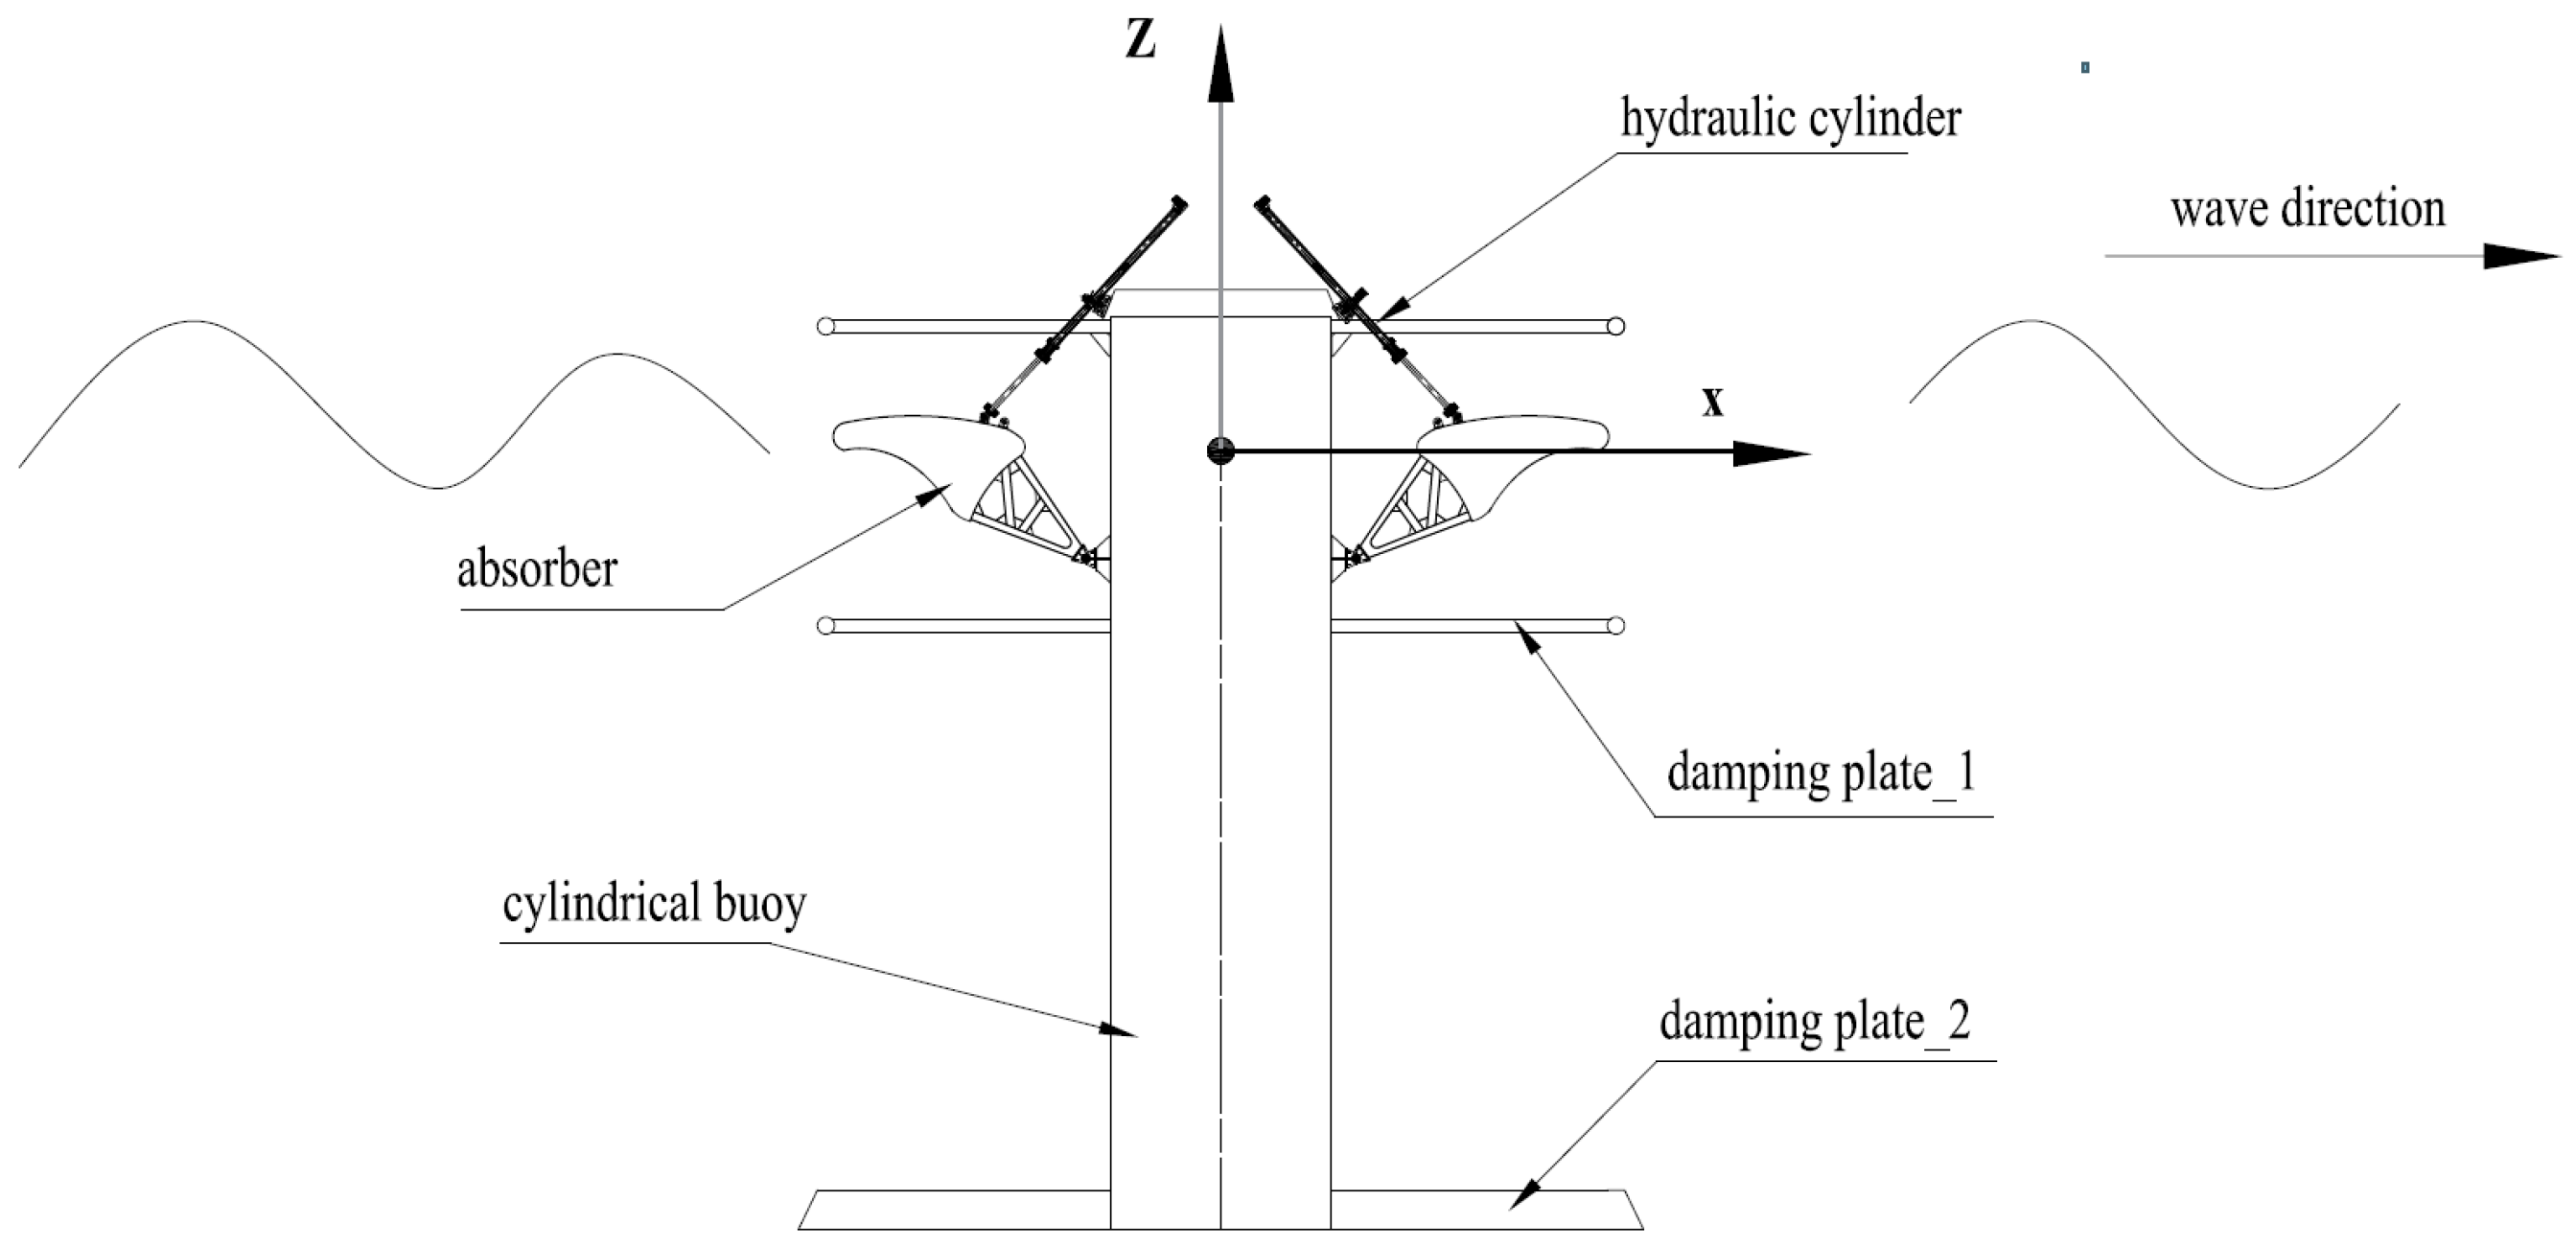
Figure 1. Structure of the OOBWEC.
Energies 18 04729 g001
Figure 2. Energy conversion principle of OOBWEC.
Energies 18 04729 g002
Figure 3. Experimental enviroment of wave flume.
Energies 18 04729 g003
Figure 4. General layout of experiment model.
Energies 18 04729 g004
Figure 5. Arrangement of the absorbers.
Energies 18 04729 g005
Figure 6. View of sensors.
Energies 18 04729 g006
Figure 7. View of data acquisition system.
Energies 18 04729 g007
Figure 8. CWR varying with the wave height.
Energies 18 04729 g008
Figure 9. Capture power varying with the wave height.
Energies 18 04729 g009
Figure 10. CWR varying with the wave period.
Energies 18 04729 g010
Figure 11. Period-CWR curves for each absorber.
Energies 18 04729 g011
Figure 12. Capture power of each wave absorber (H = 80 mm, T = 1.8 s).
Energies 18 04729 g012
Figure 13. Power ratio of each absorber (H = 80 mm, T = 1.8 s).
Energies 18 04729 g013
Table 1. Main dimensional parameters of the OOBWEC.
NO.ParametersData
1Total length (m)2.14
2Total width (m)2.14
3Total height (m)2.38
4Operating draft (m)1.97
5Number of absorbers6
6Width of absorbers (m)0.8
7Weight (kg)360
Table 2. Conversion relationships of various physical quantities.
Physical QuantitiesSymbolicRatio
linear scaleLs/Lm λ
periodTs/Tm λ 1 / 2
areaAs/Am λ 2
volumes s / m λ 3
forceFs/Fm γ λ 3
powerPs/Pm λ 7 / 2
Table 3. Experimental condition.
CaseReal SeaWave Flume
Mean Height (m)Mean Period (s)Mean Height (m)Mean Period (s)
1–40.3~0.620.06~0.120.9
5–90.3~0.730.06~0.141.3
10–140.3~0.740.06~0.141.8
15–190.3~0.750.06~0.142.2
20–240.3~0.760.06~0.142.7
Disclaimer/Publisher’s Note: The statements, opinions and data contained in all publications are solely those of the individual author(s) and contributor(s) and not of MDPI and/or the editor(s). MDPI and/or the editor(s) disclaim responsibility for any injury to people or property resulting from any ideas, methods, instructions or products referred to in the content.