Article

Combined Effect of ABL Profile and Rotation in Wind Turbine Wakes: New Three-Dimensional Wake Mode

by
José A. Martinez-Trespalacios
1,*,†,
Dimas A. Barile
2,3,†,
John L. Millan-Gandara
4,
Jairo Useche
1 and
Alejandro D. Otero
2,3,*
1
Mechanical Engineering Program, School of Engineering, Universidad Tecnológica de Bolívar, Parque Industrial y Tecnológico Carlos Vélez Pombo, Cartagena 130001, Colombia
2
Facultad de Ingeniería, Universidad de Buenos Aires, Buenos Aires 1428, Argentina
3
Centro de Simulación Computacional para Aplicaciones Tecnológicas, Consejo Nacional de Investigaciones Científicas y Tecnológicas, Buenos Aires 1425, Argentina
4
Tecnología en Mantenimiento Mecánico, Tecnología en Mantenimiento Eléctrico, Universidad del Sinú, Cartagena 130015, Colombia
*
Authors to whom correspondence should be addressed.
These authors contributed equally to this work.
Energies 2025, 18(17), 4726; https://doi.org/10.3390/en18174726
Submission received: 14 April 2025 / Revised: 22 May 2025 / Accepted: 27 May 2025 / Published: 5 September 2025
(This article belongs to the Section A3: Wind, Wave and Tidal Energy)

Abstract

The combination of the atmospheric boundary layer (ABL) profile and the rotation of wind turbine wakes leads to lateral and vertical displacements of the wake center and to changes in the wake diameter, which are not taken into account by conventional analytical wake models. In this work, the dependence of these asymmetries on the turbulence intensity, ranging from 0.040 to 0.145, is investigated downstream using computational fluid dynamics (CFD) simulations. Based on this analysis, a new 3D Gaussian wake model is proposed. This model introduces a novel approach to define the wake diameter and center deviation based on a new length scaling. The performance of this new wake model is also optimized for a large range of downstream distances, up to 49 rotor diameters (49D). The performance of the new wake model is evaluated against other well established models using the PyWake library as a testbench. The new model outperforms the other models over the entire turbulence range, with a few exceptions. Remarkably, the proposed model achieves satisfactory results without the need for additional ground models. In addition, the proposed model was found to have the least underestimation of the wake effect.

1. Introduction

Today, wind power is one of the most promising energy sources on which to base the energy transition that is being pursued, with significant progress being made around the world [1,2]. As a result, the proliferation of wind farms is increasing, accompanied by the discovery of previously unknown phenomena.
Wind farms are currently being built extensively around the world to contribute to environmental sustainability. However, this widespread construction has resulted in the clustering of multiple wind farms in certain regions, such as the North Sea [3] and the US Midwest [4]. The North Sea in particular is an exceptionally favourable location for the development of wind farms, with average wind speeds of up to 13 m/s [5]. With around 70 wind farms comprising almost 3000 turbines, the North Sea has a cumulative power generation capacity of around 14,000 MW [5]. These wind farms are strategically located at distances of up to 30 km from each other to mitigate the wake effect. However, some studies have shown that the effects persist even at longer distances [6,7]. In various regions, including the Taiwan Strait and the Adriatic Sea, there are ongoing plans to develop complex wind farm systems [5,8]. In addition, countries such as China, the USA, Brazil, and others are strategically planning the construction of multiple wind farms in areas characterized by optimal wind conditions [5].
Recent aerial measurements, along with several investigations, suggest that the interaction between neighboring wind farms can significantly affect their operational performance [3,7,9,10,11]. Some work has found that speed does not recover to 95% at distances greater than 50 km [6,7]. Attempts have been made by Cañadillas et al. [9] to propose new engineering models to simulate the far-wake effect between farms. However, recommendations have been made for future research to propose more refined engineering models to predict the far-wake effect for distances less than 30 km. In addition, Cañadillas et al. [9] emphasizes that this distance is where the effect between farms is the most sensitive and is currently considered a limitation. However, simulations and measurements of the distant wake effect have revealed new phenomena, such as the movement of the wake center along the vertical axis [12,13], which add more complexity to modeling interactions between farms that have not been considered before. In this context, the interaction between wind farms poses new challenges that need to be addressed in the design of wind farms.
CFD has become a key tool in the analysis of wind turbine wake interactions. Among the available turbulence modeling strategies, Reynolds-Averaged Navier–Stokes (RANS) models have traditionally been the most widely adopted due to their relatively low computational cost and reasonable accuracy when evaluating time-averaged flow properties. RANS models are particularly well suited for inflow conditions where the time variations in the mean flow occur at much lower frequencies than the turbulence itself [14,15]. For steady or quasi-steady simulations, RANS approaches remain a practical and efficient option, especially in engineering studies focused on the mean behavior of the wake rather than its transient features [16]. Large Eddy Simulation (LES), on the other hand, has proven effective in capturing unsteady wake dynamics and large-scale turbulent structures [14]. While LES offers enhanced detail and accuracy, particularly in unsteady scenarios, it remains computationally expensive—especially for simulations involving large domains such as entire wind farms or far-wake analyses [16]. Moreover, several studies comparing RANS and LES results in wind turbine simulations have shown that RANS models continue to be competitive [17,18], achieving similar levels of accuracy in many cases but at a fraction of the computational cost. Hybrid modeling strategies combining the strengths of RANS and LES have also been proposed, aiming to leverage the accuracy of LES in critical regions while maintaining the efficiency of RANS in the rest of the domain [18]. The high cost of LES and the ability of RANS models to reproduce steady-state conditions with relatively affordable computational demands continue to motivate their use in the development of analytical models.
For scenarios that require running a large number of simulations—such as Wind Farm Layout Optimization Problems (WFLOP) or real-time control applications—neither LES nor RANS approaches are computationally feasible. In these contexts, analytical wake models have emerged as a compelling alternative due to their efficiency and scalability. These models typically require only about 10 3 CPU hours per simulation, in contrast to the 10 3 10 4 h commonly needed for CFD methods [16], while still providing acceptable accuracy for system-level analysis and decision-making. Their simplicity, low computational cost, and ease of integration into optimization or control frameworks make analytical models especially suitable for preliminary design, fast evaluations, and embedded applications.
One of the earliest and still widely used analytical wake models was proposed by Katic et al. [19]. This model, grounded in the principle of mass conservation, assumes a uniform velocity deficit and a linearly expanding wake diameter. Subsequent refinements, such as those introduced by Frandsen et al. [20] and Larsen [21], incorporated additional effects, including turbulence intensity and wind turbine thrust, while maintaining the top-hat velocity profile.
Further advances were made with the proposal of Bastankhah and Porté-Agel [22], who introduced Gaussian models based on the principles of conservation of mass and momentum. Building on this, Niayifar and Porté-Agel [23], Pedersen et al. [24], and others attempted to integrate turbulence intensity into Gaussian models and proposed new relationships for wake diameter expansion. Zong and Porté-Agel [25] refined the Gaussian model by optimising parameters to make it more realistic. More recently, Vahidi and Porté-Agel [26] introduced a novel analytical model based on streamwise scaling with near-wake length. This method was evaluated by Souaiby and Porté-Agel [27] to predict the velocity deficit downstream of wind farms and showed that previous wake models underestimated the velocity of the wake deficit by assuming a linear or quasi-linear wake expansion rate, while the new models gave better results. Other investigations have demonstrated the importance of describing the wake effect in very long wind turbine wakes and confirmed an upward shift of wakes in large wind farms [12,13,28,29]. Recently, there has been a growing interest in understanding the impact of the Coriolis effect on the behavior of wind turbine wakes [30]. To address this phenomenon, researchers have proposed analytical models that explicitly incorporate this effect into wake simulations [31], with the aim of providing a more comprehensive understanding of wake behavior and improving the accuracy of wake predictions.
Additionally, efforts have been made to model the dynamic effects of the wake, such as wake meandering, which refers to the low-frequency lateral and vertical displacement of the wake centerline. Larsen et al. [32] proposed a physically based model that unifies the description of wake dynamics and turbine loading, enabling direct integration into aeroelastic simulations. Jiménez et al. [33] introduced a deterministic wake meandering model tailored for floating offshore wind turbines. More recently, Brugger et al. [34] improved the predictive capacity of the dynamic wake meandering model by incorporating the turbulent Schmidt number, enhancing the temporal accuracy and reducing errors in velocity deficit and turbulence intensity.
The main objective of the present work is to study the combined effect of the atmospheric boundary layer profile and the wake rotation on wake development. Based on the results, a new length scaling approach is proposed to formulate a new 3D Gaussian model capable of describing very long wakes. First, three well-established reference analytical models found in the literature are outlined. Subsequently, the setup of the RANS (Reynolds-averaged Navier–Stokes equations) simulations performed and the results of these simulations are detailed, focusing on wake effects up to 49 D . Then, the proposed new model is formulated and its performance is evaluated in comparison with the reference models. Finally, conclusions are drawn and the following steps are proposed.

2. Reference Analytical Wake Models

In this section, three well-established analytical wake models are described, which will then be used to compare the proposed new model together with the CFD analysis. The selection of these models is not arbitrary, as they represent a sequence of improvements proposed for the original models to enrich the representational capability and incorporate new phenomena. None of these models take into account the combined effect of the ABL profile and wake rotation, which will be the subject of Section 3.

2.1. Turbulence Optimized Park Model

The Turbulence Optimized Park model (TurbOPark) is an improvement of the classical model of Katic et al. [19] that aims to incorporate the turbulence effect. Accordingly, it is a top-hat-shaped model where the velocity deficit is defined by
Δ U ( x ) U = D 2 D w ( x ) 2 ( 1 1 C T )
where Δ U ( x ) is the velocity deficit induced by the wind turbine, U is the reference wind speed at hub height, x is the downstream distance from the wind turbine, D is the rotor diameter, and C T is the thrust coefficient of the turbine. The TurbOPark model proposed by Nygaard et al. [35] presented a new approach to define the wake diameter D w based on the turbulence intensity:
D w ( x ) = D + A I 0 D β α + β x / D 2 + 1 1 + α 2 l n ( α + β x / D 2 + 1 + 1 ) α ( 1 + α 2 + 1 ) ( α + β x / D ) .
where I 0 is the ambient turbulence intensity, α and β are two model coefficients dependent on I 0 , adopted as α = 1.5 I 0 and β = 0.8 I 0 / C T , and A is a calibration parameter, set equal to 0.6 [35].

2.2. Bastankhah Wake Model

Bastankhah and Porté-Agel [22] proposed an entirely new approach to analytic models by replacing the top-hat profile with a Gaussian one. The Gaussian-shaped normalized velocity deficit is derived by applying momentum and mass conservation principles while neglecting viscous and pressure terms. The normalized velocity deficit induced by the wind turbine is represented as
Δ U ( x ) U = C ( x ) e 1 2 1 ( σ / D ) 2 z D 2 + y D 2 .
where y and z are, respectively, the lateral and vertical coordinates, and the variance σ is related to the wake width. In Equation (3), C ( x ) is the maximum velocity deficit at the rotor axis in each downstream position, defined according to
C ( x ) = 1 1 C T 8 σ / D 2 .
The wake expansion σ is defined as a linear function with constant growth rate:
σ D = k x D + ϵ .
with ϵ = 0.2 1 2 1 + 1 C T 1 C T and k = 0.03245 , resulting from the calibration process.

2.3. Zong Wake Model

A wake model based on the previous Gaussian model was proposed by Zong and Porté-Agel [25], incorporating a new method of wake diameter expansion that takes into account the influence of turbulence. Equation (5) is changed to
σ D = 0.35 + k ln 1 + e x x N W D .
where x N W is the near-wake length calculated from the model by Bastankhah and Porté-Agel [36], which is defined as
x N W = 0.214 + 0.144 q 1 0.134 + 0.124 q 1 0.214 + 0.144 q 0.134 + 0.124 q r 0 d r d x .
In Equation (8), q = 1 1 C T , r 0 = D 2 q + 1 2 , and d r d x = d r d x a 2 + d r d x q 2 + d r d x λ 2 , with d r d x a = 2.5 I 0 + 0.005 , d r d x q = ( 1 q ) 1.49 + q 9.76 ( 1 + q ) , and d r d x λ = 0.012 B λ , B is the number of blades, and λ is the tip speed ratio.
k is the wake growth rate computed as a function of the streamwise turbulence intensity, defined by Niayifar and Porté-Agel [23] as
k = 0.38 ( I 0 2 + I + 2 ) 1 / 2 + 0.004 .
where I + is the added turbulence intensity, defined as I + = 0.73 a 0.83 I 0 0.03 ( x / D ) 0.32 , where a is the induction factor. Moreover, in order to replicate the influence of the near-wake pressure gradient, the thrust coefficients are modeled using an error function of the streamwise coordinate, C T i ( x ) = 0.82 ( 1 + erf ( x / D ) ) / 2 , introducing a gradual escalation of the wake deficit when x < 2 D .

3. Analysis of Far Wakes Under ABL Inflow and Rotation

In this section, the downwind lateral and vertical shift of the wake center due to the ABL profile and its own rotation is studied for different turbulence intensities using CFD.

3.1. Numerical Setup

The CFD simulations performed in this study were carried out using the open-source software OpenFOAM [37]. A steady-state approach was adopted by employing an RANS solver with the Realizable k ϵ turbulence model [38]. This assumption allows for capturing the time-averaged characteristics of the wake flow, which is consistent with the scope of the present work. As boundary condition, a neutral atmospheric boundary layer (ABL) profile was imposed at the inlet of the domain. This profile was defined using the classical logarithmic law, as shown in Equation (9) and illustrated in Figure 1.
U ( z ) = U κ ln z + z 0 z 0 ,
where U ( z ) is the mean wind speed at height z, κ is the von Kármán constant (typically 0.41 ), z 0 is the surface roughness length, and U is the friction velocity, which characterizes the shear stress exerted by the wind on the surface. The inlet velocity profile was scaled to impose a reference wind velocity of 8 m/s at the hub height of the wind turbine under study [39] (see Figure 1). Turbulence intensities (TIs) ranging from 0.04 to 0.145 were set to represent both onshore and offshore conditions. The TI value is determined as T I = ( 2 / 3 T K E ) 1 / 2 / U h u b , where T K E is the turbulent kinetic energy k obtained from the CFD simulations and U h u b is the velocity at hub height. The roughness at the bottom was configured to maintain turbulence intensity throughout the flow, and the corresponding ABL velocity at the top of the domain was set as the boundary condition.
The wind turbine model selected for this study was the NREL-5MW [40], which has a hub height of 90 m and a diameter D = 126 m. This wind turbine is represented by an actuator disc model [41,42], where the equivalent volumetric forces are applied to the fluid without considering the solid geometry. The actuator disc model used for this work was developed and validated in [43], including a mesh sensibility study, and consists of a grid of nodes independent of the CFD mesh, where the local velocity is extracted from the CFD mesh results. The relative velocity is then calculated taking into account the rotation of the turbine. The lift and drag forces are then calculated according to the airfoil profile at the radial position of the node. To avoid numerical instability, once the force corresponding to each node has been calculated, it is distributed to the neighbouring cells by means of a three-dimensional Gaussian function using a regularisation kernel [44]. Further details can be found in [43].
The computational domain was defined as 1134 m (9D) × 1134 m (9D) × 8190 m (65D) in width, height, and length, with the turbine located 630 m (5D) from the inlet boundary. A background mesh of 7 cells/D was defined, after which mesh refinement was performed. As shown in [45,46], for RANS simulation, 14 cells/D is sufficient to study the near wake for a simpler AD, while [47] suggests a minimum of 20 cells/D for more complex AD. In this work, the authors performed two mesh refinements as shown in Figure 2 to obtain 14 cells/D in the far wake and 28 cells/D in the near and middle wake. A mesh gradient was set in the vertical direction from 3 m per cell near the ground to 60 m at the top of the domain.
The RANS setup employed in this study follows the configuration used in previous works, where it was validated against large eddy simulations and experimental data [47,48,49]. These studies confirmed that such a configuration produces reliable results for wake prediction in similar conditions.

3.2. Wake Center Shift

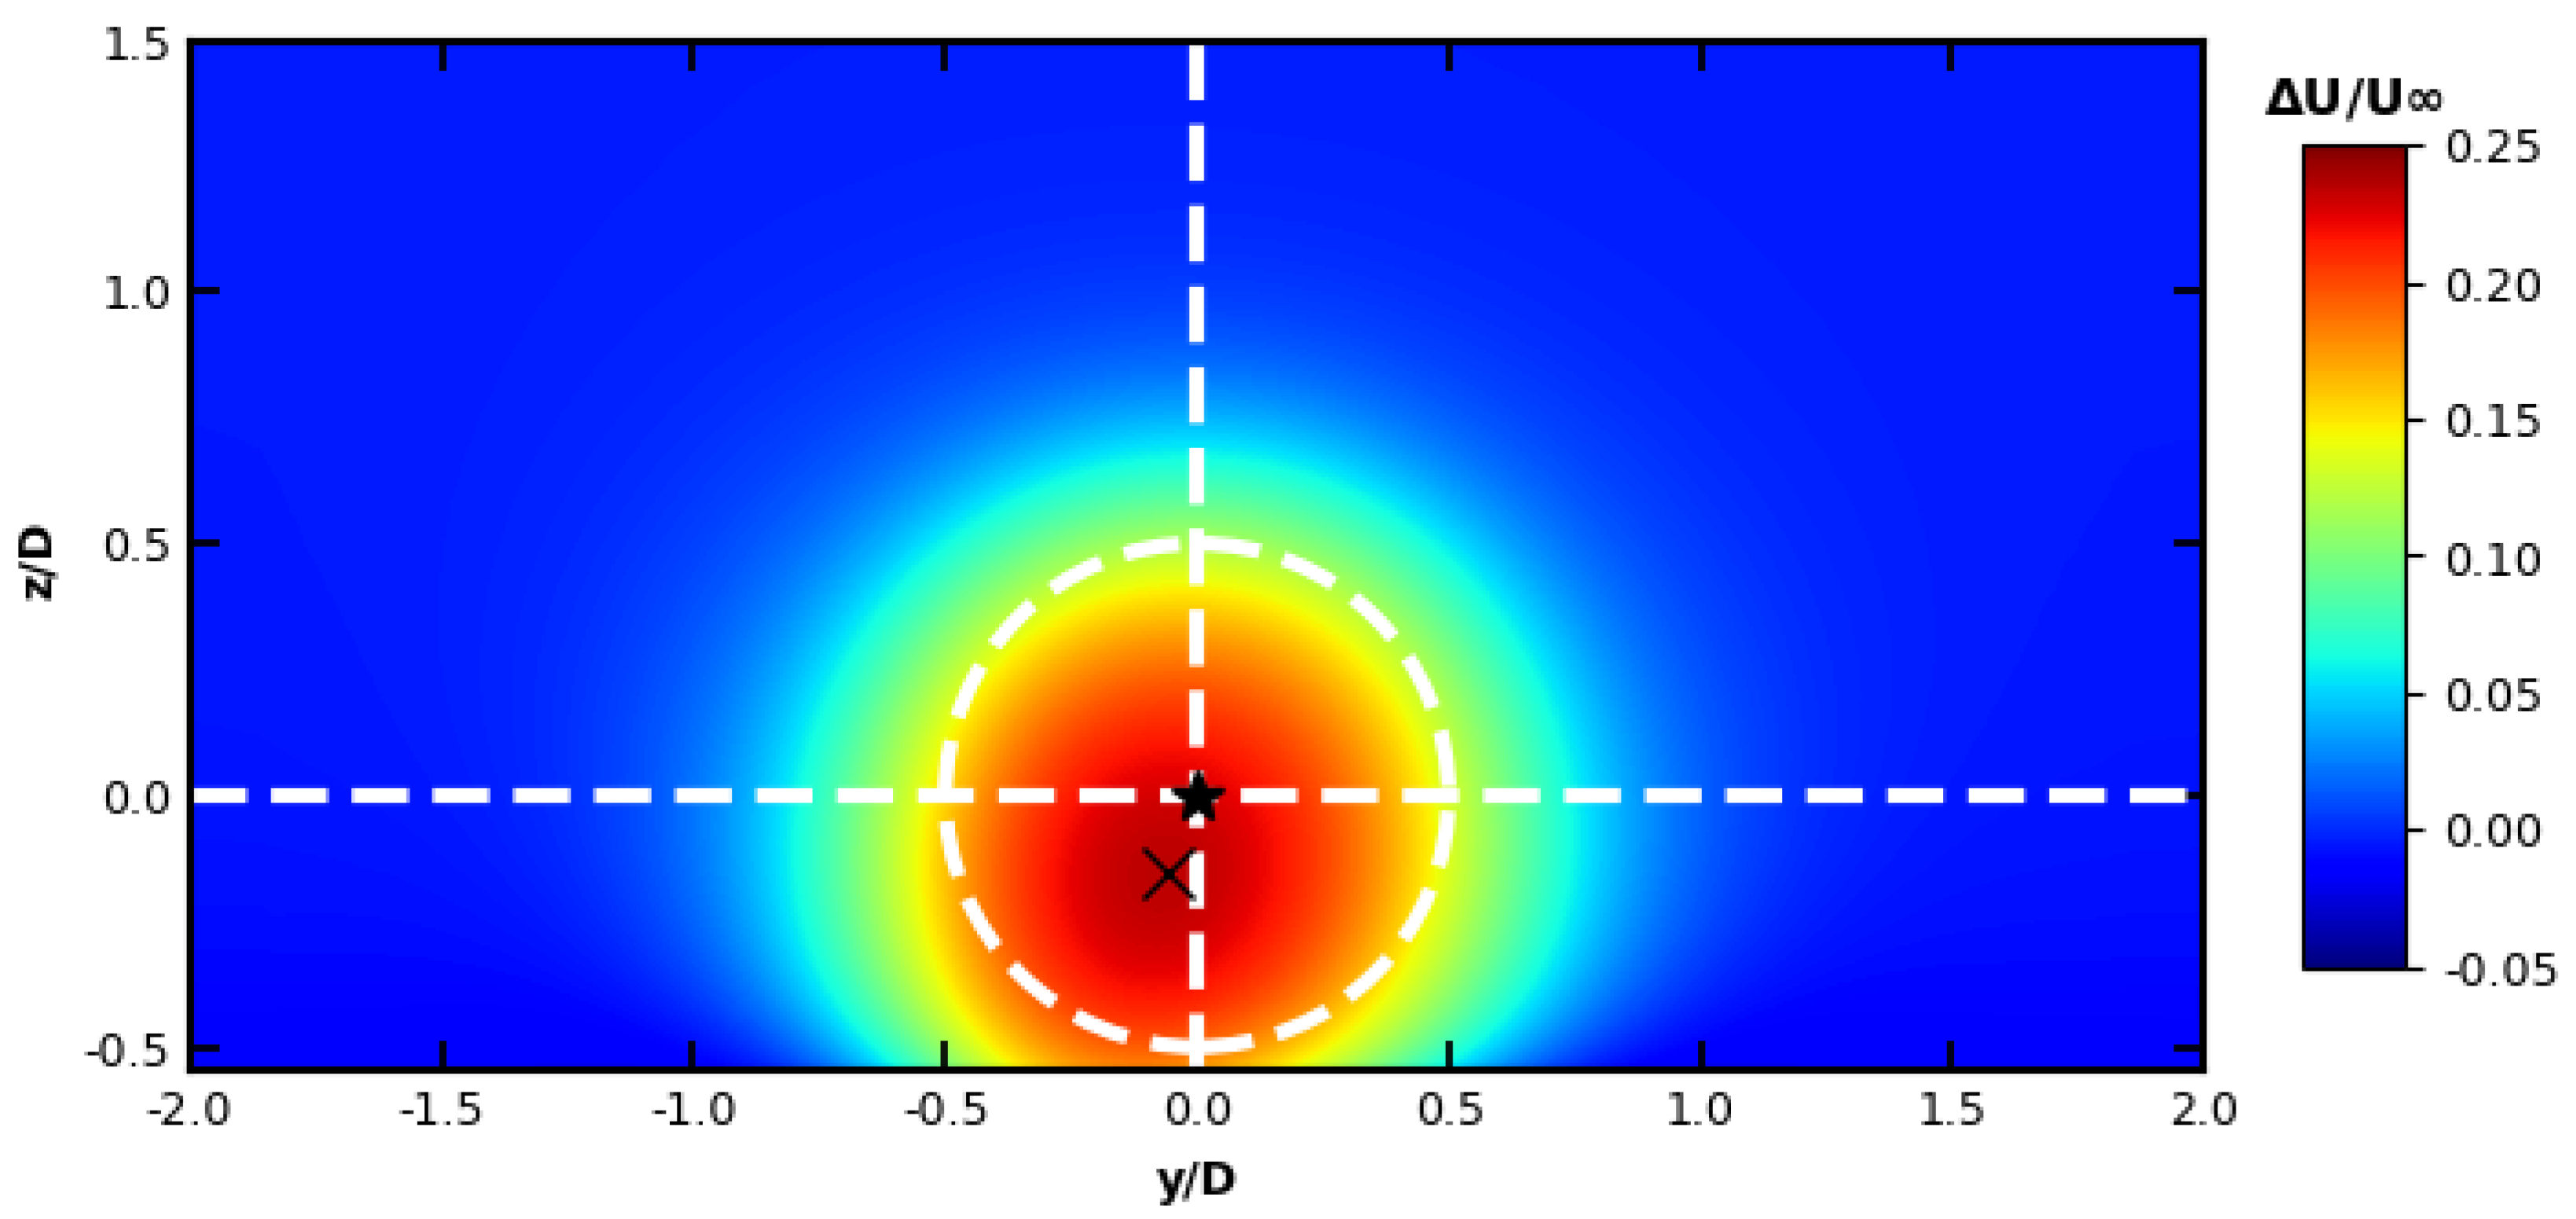
At a particular location downstream, the wake center is defined as the position where the velocity deficit is maximum. In traditional analytical models, the wake center is located on the rotor axis projected downwind. However, it has been shown that due to the effects of the ABL profile and the wake rotation, these positions do not coincide [12]. The accurate prediction of wake shift is crucial from an application perspective, as it enables the optimization of wind turbine spatial distribution within a wind farm. Additionally, it plays a key role in the development of advanced yaw misalignment control strategies, where the intentional deflection of the wake can be leveraged to mitigate downstream wake effects. Furthermore, a precise wake shift estimation allows for a more realistic assessment of energy distribution, facilitating more efficient energy management and resource allocation. The results of the CFD simulation presented in this work illustrate the wake center shift. As shown in Figure 3, at a distance of 5 D downstream for I = 0.085 , the wake center moves laterally and downward.
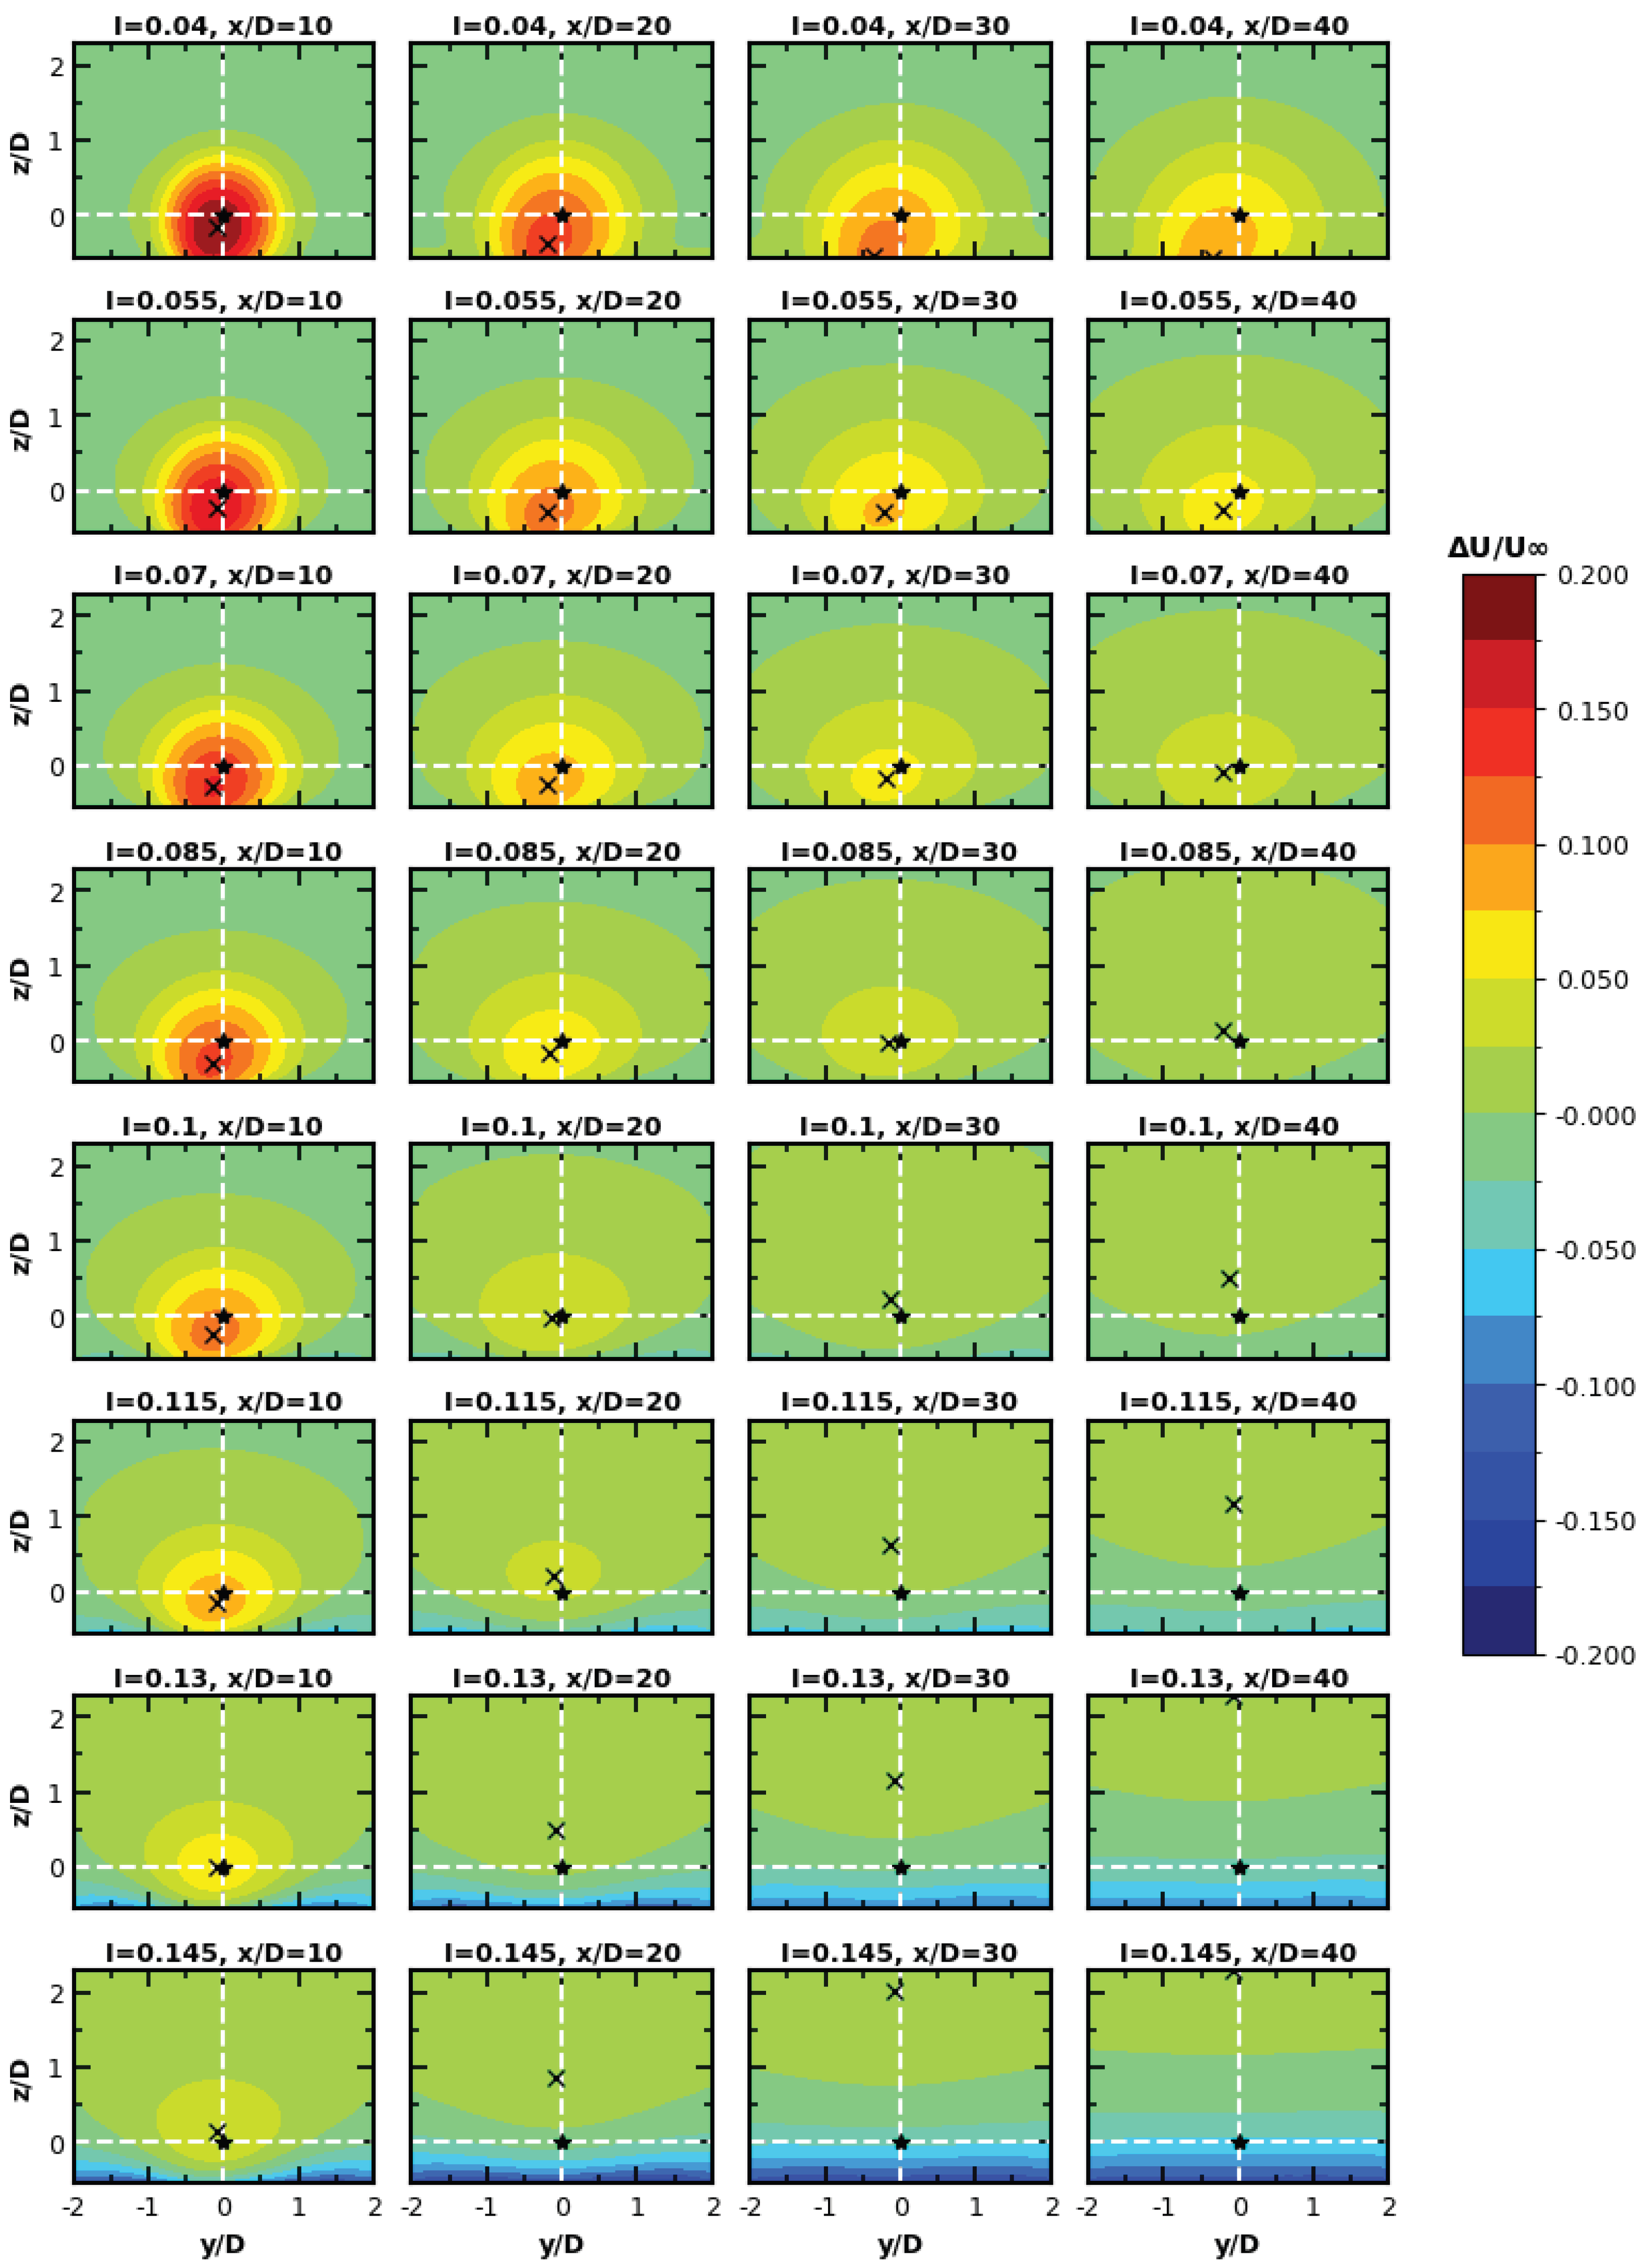
This behavior continues for increasing distances downstream of the wind turbine and depends on the turbulence intensity, as observed in Figure 4, which shows the velocity deficit on vertical planes at distances of 10, 20, 30, and 40 D downwind, for various turbulence intensities. The wake center in each case is indicated by a cross. The vertical shift of the wake center can be observed, similar to that reported by Wang and Yang [12]. This upward shift in the wake is more pronounced for higher turbulence intensity and may shift downward for low turbulence intensity ( I 0.04 ). It is also worth noting the lateral displacement of the wake center. The new wake center position in both the vertical and horizontal axes is the exclusive result of the combination of the ABL profile and wake rotation, which results in the convection of air from regions of low velocity (near to the ground) to regions of high velocity, and vice versa, due to the wake rotation. The sense in the lateral movement depends on the rotor rotation sense. Furthermore, it can be observed that for the highest turbulence intensities ( I > 0.115 ) and at the far downwind locations ( x / D > 20 ), regions with negative deficit are identifiable in the vicinity of the rotor center, as reported in Zhang et al. [13], Bodini et al. [50].
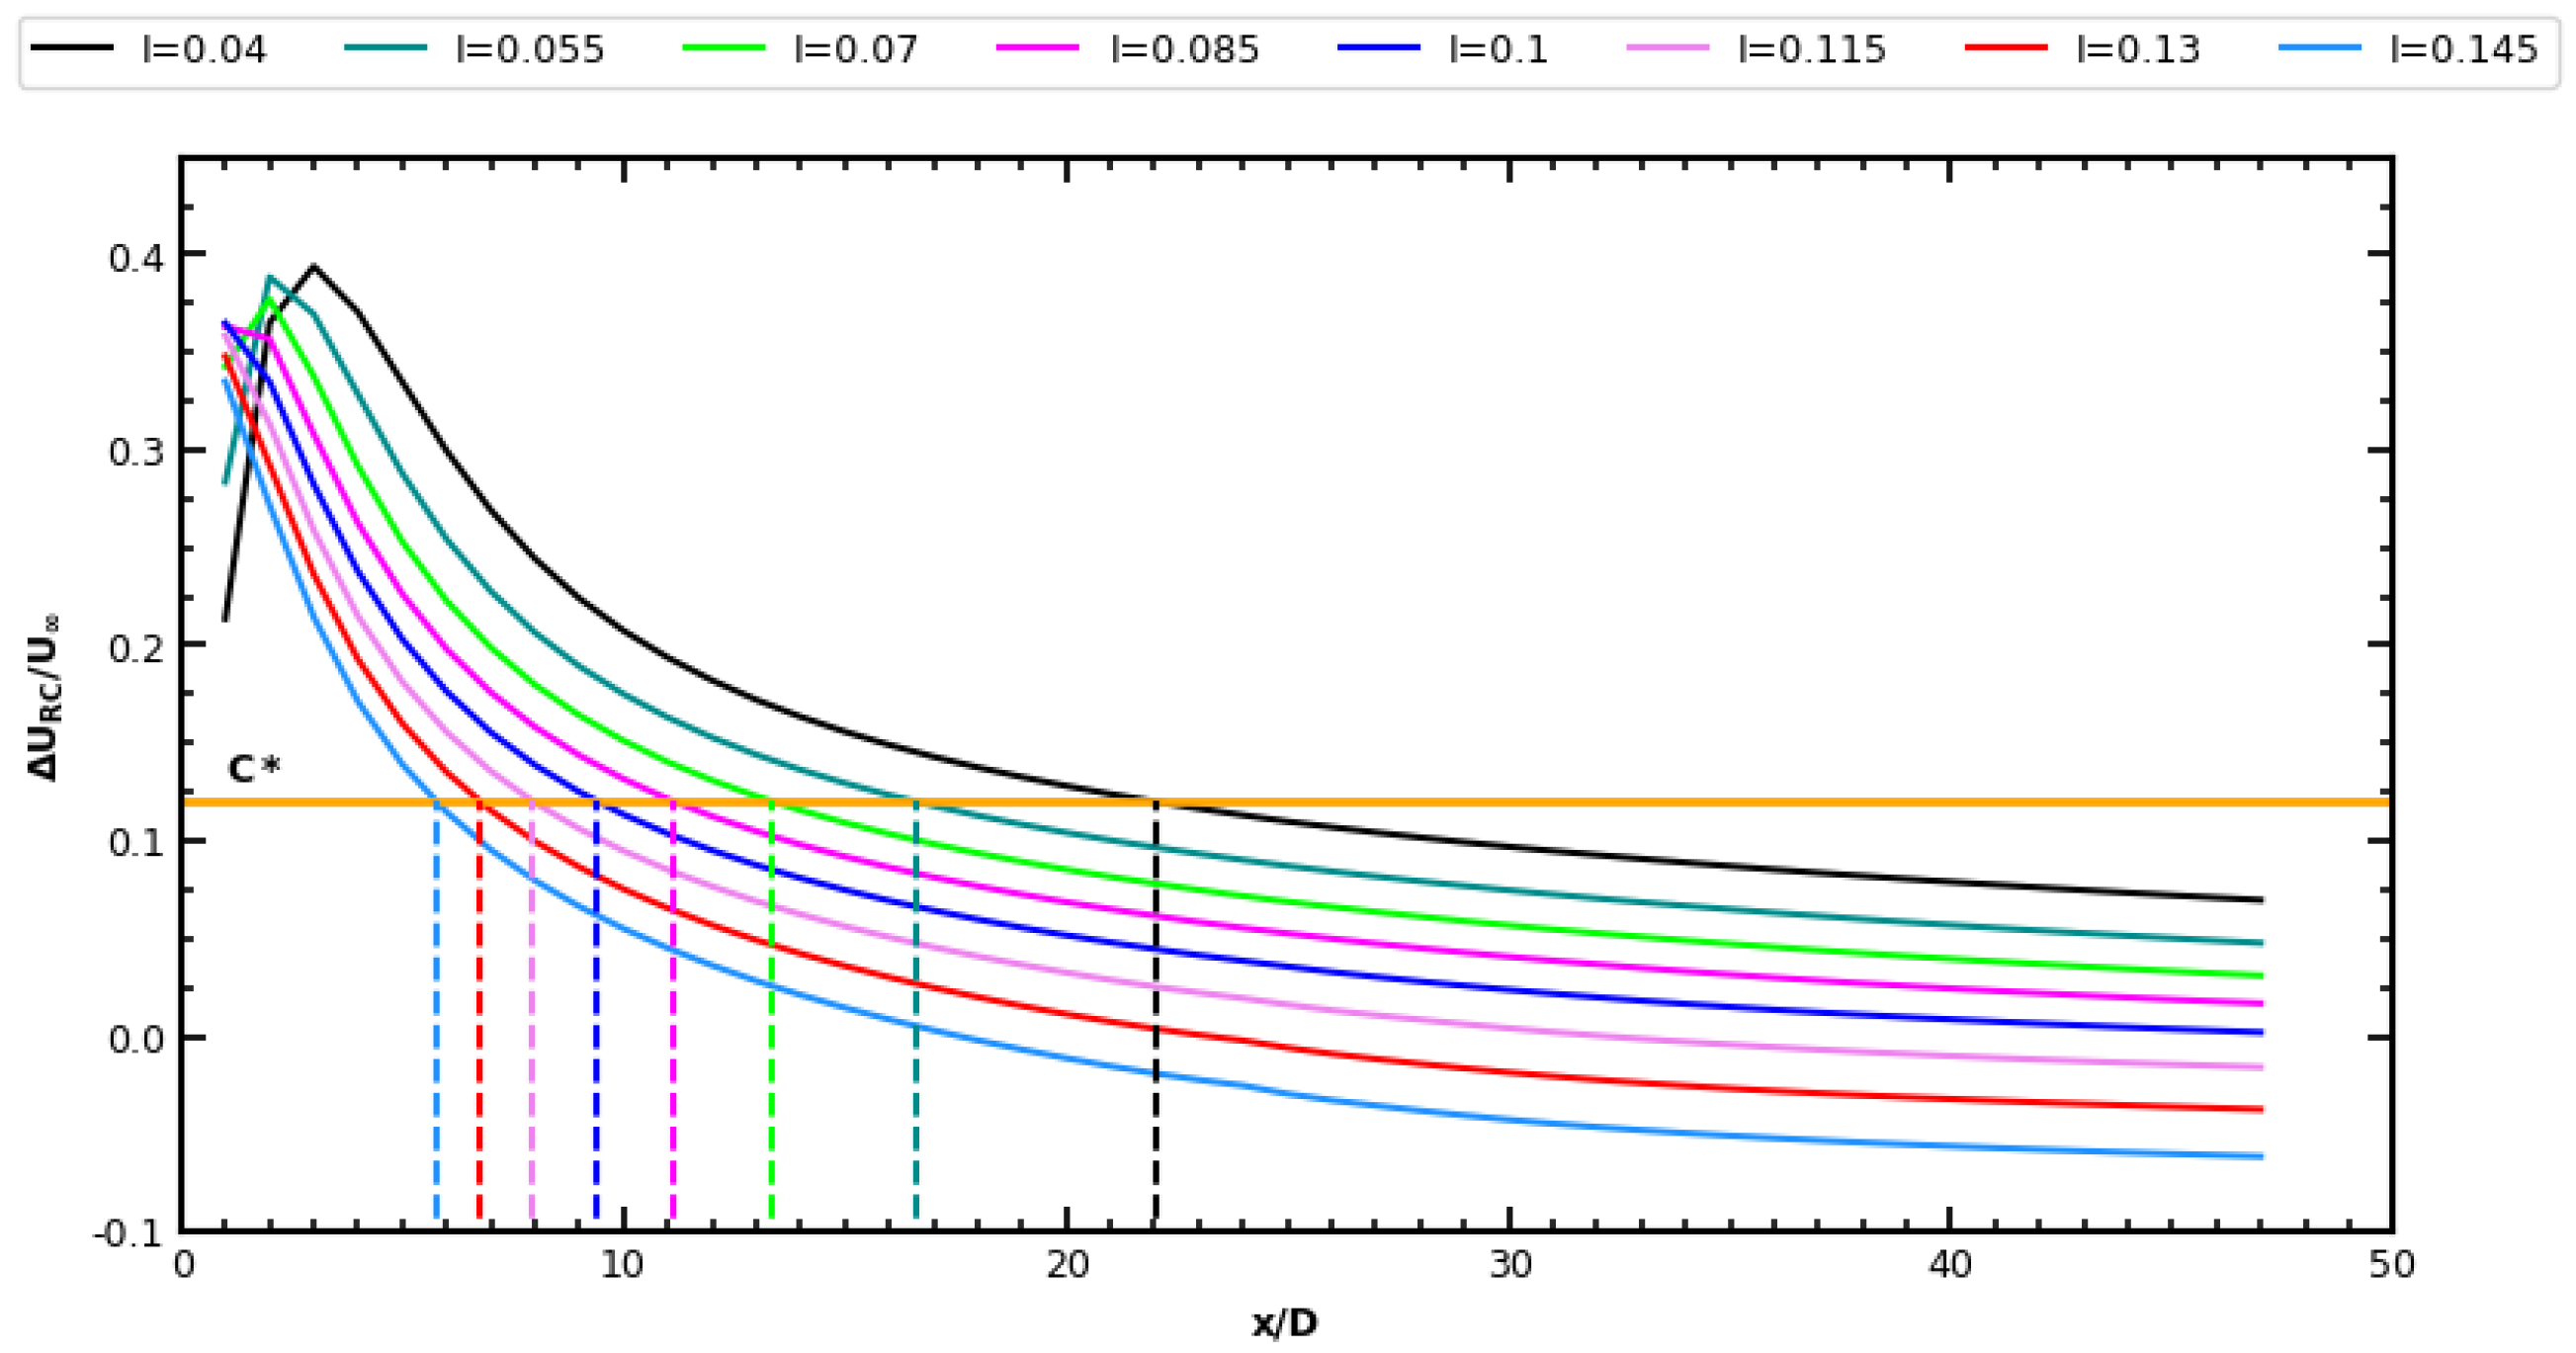
The variation of the velocity deficit with distance from the turbine is shown in Figure 5 for different turbulence intensities. Higher turbulence levels lead to a faster wake recovery, and for sufficiently high turbulence intensities, the velocity deficit completely vanishes at long distances (>20D). However, for lower turbulence intensities, the deficit persists over longer distances. The method to be proposed aims to accurately capture both behaviors, providing a reliable approach for modeling wake evolution under varying turbulence conditions. Figure 6 shows the velocity deficit profiles for different turbulence intensities in both vertical and horizontal planes containing the rotor axis, where the maximum velocity deficit displacement can be clearly observed. It depicts the trends in the wake center shifts for different turbulence intensities and the shape change of the velocity deficit in both the vertical and horizontal planes. This provides novel insights that are lacking in traditional vertical plane analyses that are common in the literature [12,28], where attention to changes in the horizontal plane is rarely observed.
In this context, it is evident that the displacement of the wake center is dependent on the turbulence intensity and the distance from the rotor plane ( x / D ). It is thus possible to devise expressions that establish a connection between the wake width and height and the lateral and vertical displacement with turbulence intensity:
σ y ( x ) = f 1 ( I ) , σ z ( x ) = f 2 ( I ) , y c ( x ) = f 3 ( I ) , z c ( x ) = f 4 ( I ) .
Moreover, it is possible to formulate expressions valid for distances exceeding 20D, which would be applicable to very long wind turbine wakes.
Previous studies have analysed the relationship between the wake diameter and turbulence intensity, although they have not considered the displacement of the wake center [24,25,35,51]. This study will explore a new approach to relate the wake width and height and the movement of the wake center.

3.3. Wake Scaling in Terms of Turbulence

With the aim of analyzing the relationship between the wake shape and turbulence in long wind turbine wakes, both the wake diameter and the displacement of the wake center were calculated to achieve the best fit with the CFD data. This analysis was performed in both the horizontal (y) and vertical (z) directions. Extending the foundational work of Bastankhah and Porté-Agel Bastankhah and Porté-Agel [22], a non-symmetric three-dimensional Gaussian profile was adopted. In contrast to the original symmetric formulation, this version allows the wake center to shift in both the lateral and vertical directions, enabling a more flexible and accurate representation of the wake behavior, as can be observed in Equation (10).
Δ U ( x , y , z ) U = C ( x ) e z z c 2 σ z / D 2 y y c 2 σ y / D 2 ,
where σ y and σ z represent the wake diameter in each axis, while y c and z c denote the deviation from the rotor center of the wake in each axis. This more general profile relaxes the symmetry conditions on wake size and wake center, allowing the CFD results to be more accurately represented. Following the work of Bastankhah and Porté-Agel [22], the maximum deficit at the center of the wake C ( x ) can be generalised as follows:
C ( x ) = 1 1 C T 8 σ z σ y / D 2 ,
with C T the thrust coefficient. This expression continues to obey the laws of conservation that were assumed in the original development.
This formulation enables the construction of a wake model that captures both the change in the wake center position and the asymmetric shape of the wake due to interactions with the ground and the ABL profile without violating conservation principles. In order to fit the parameters of Equation (10), the CFD results were sampled at 200 by 200 points in vertical planes 1D spaced downwind of the turbine. The purpose of using planes to fit the Gaussian profile is to extend the model beyond the main y- and z-axes. The first plane is located at 4D, where the wake initially exhibits a self-similar Gaussian profile, and the linear correlation coefficient of the fit reached a value of 0.99 [28,52]. The last plane is located at 49D, in order to avoid being affected by outlet boundary conditions. Each sampling plane extends 2D on either side of the turbine axis, 2.5D above the hub height, and up to 70 m below the hub. This configuration ensures that the planes do not reach the ground, thus avoiding contamination of the data by the boundary conditions, while fully covering the rotor area of downwind turbines.
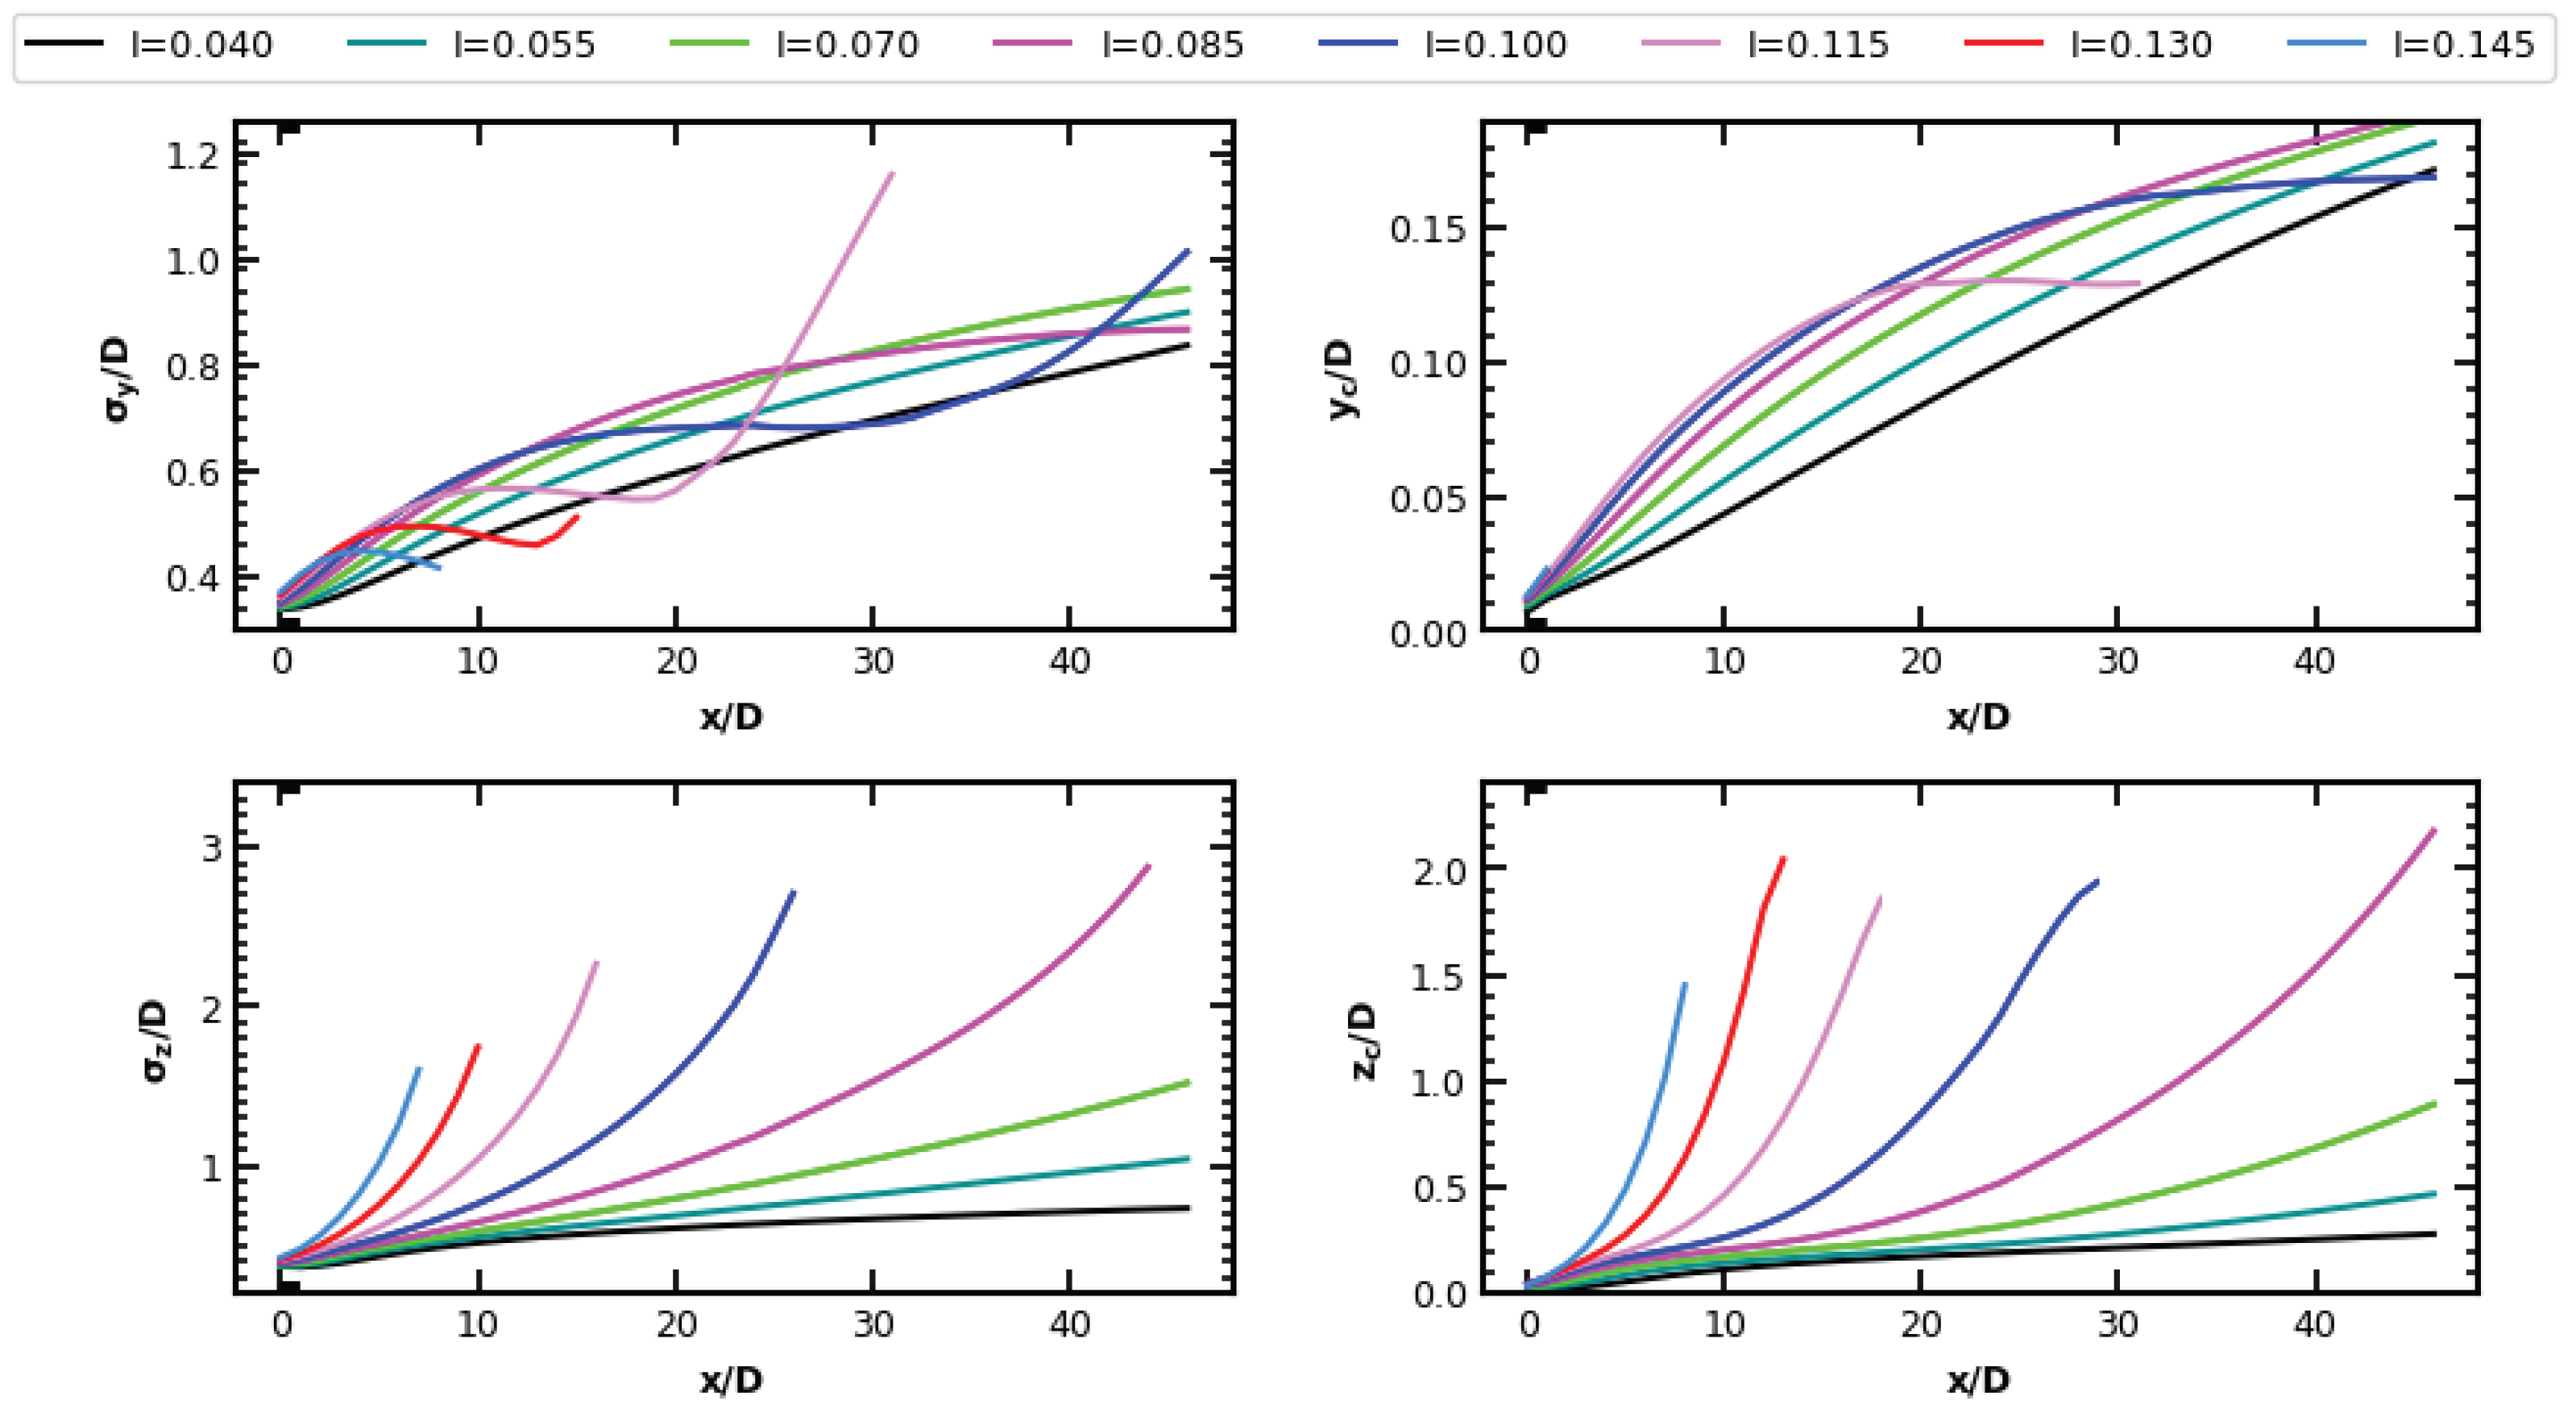
The resulting fitted parameters are presented in Figure 7. In order to calculate the wake diameters ( σ y and σ z ), a 3D Gaussian curve was independently fitted to the data at each plane, according to Equations (10) and (11). The results for σ y and σ z clearly show that the actual behaviour deviates from the linear wake expansion assumption and that the size of the wake differs between the horizontal and vertical directions. The response is different for each axis and variable analysed. However, despite the different dependence on turbulence intensity, similarities can be observed in certain regions. The behaviour of variables under lower turbulence intensity ( I = 0.04 ) resembles that for other turbulence intensities at distances closer to the rotor. This is particularly true for σ y , σ z , and z c . Consequently, it is possible to propose a novel scaling method for graph consolidation.
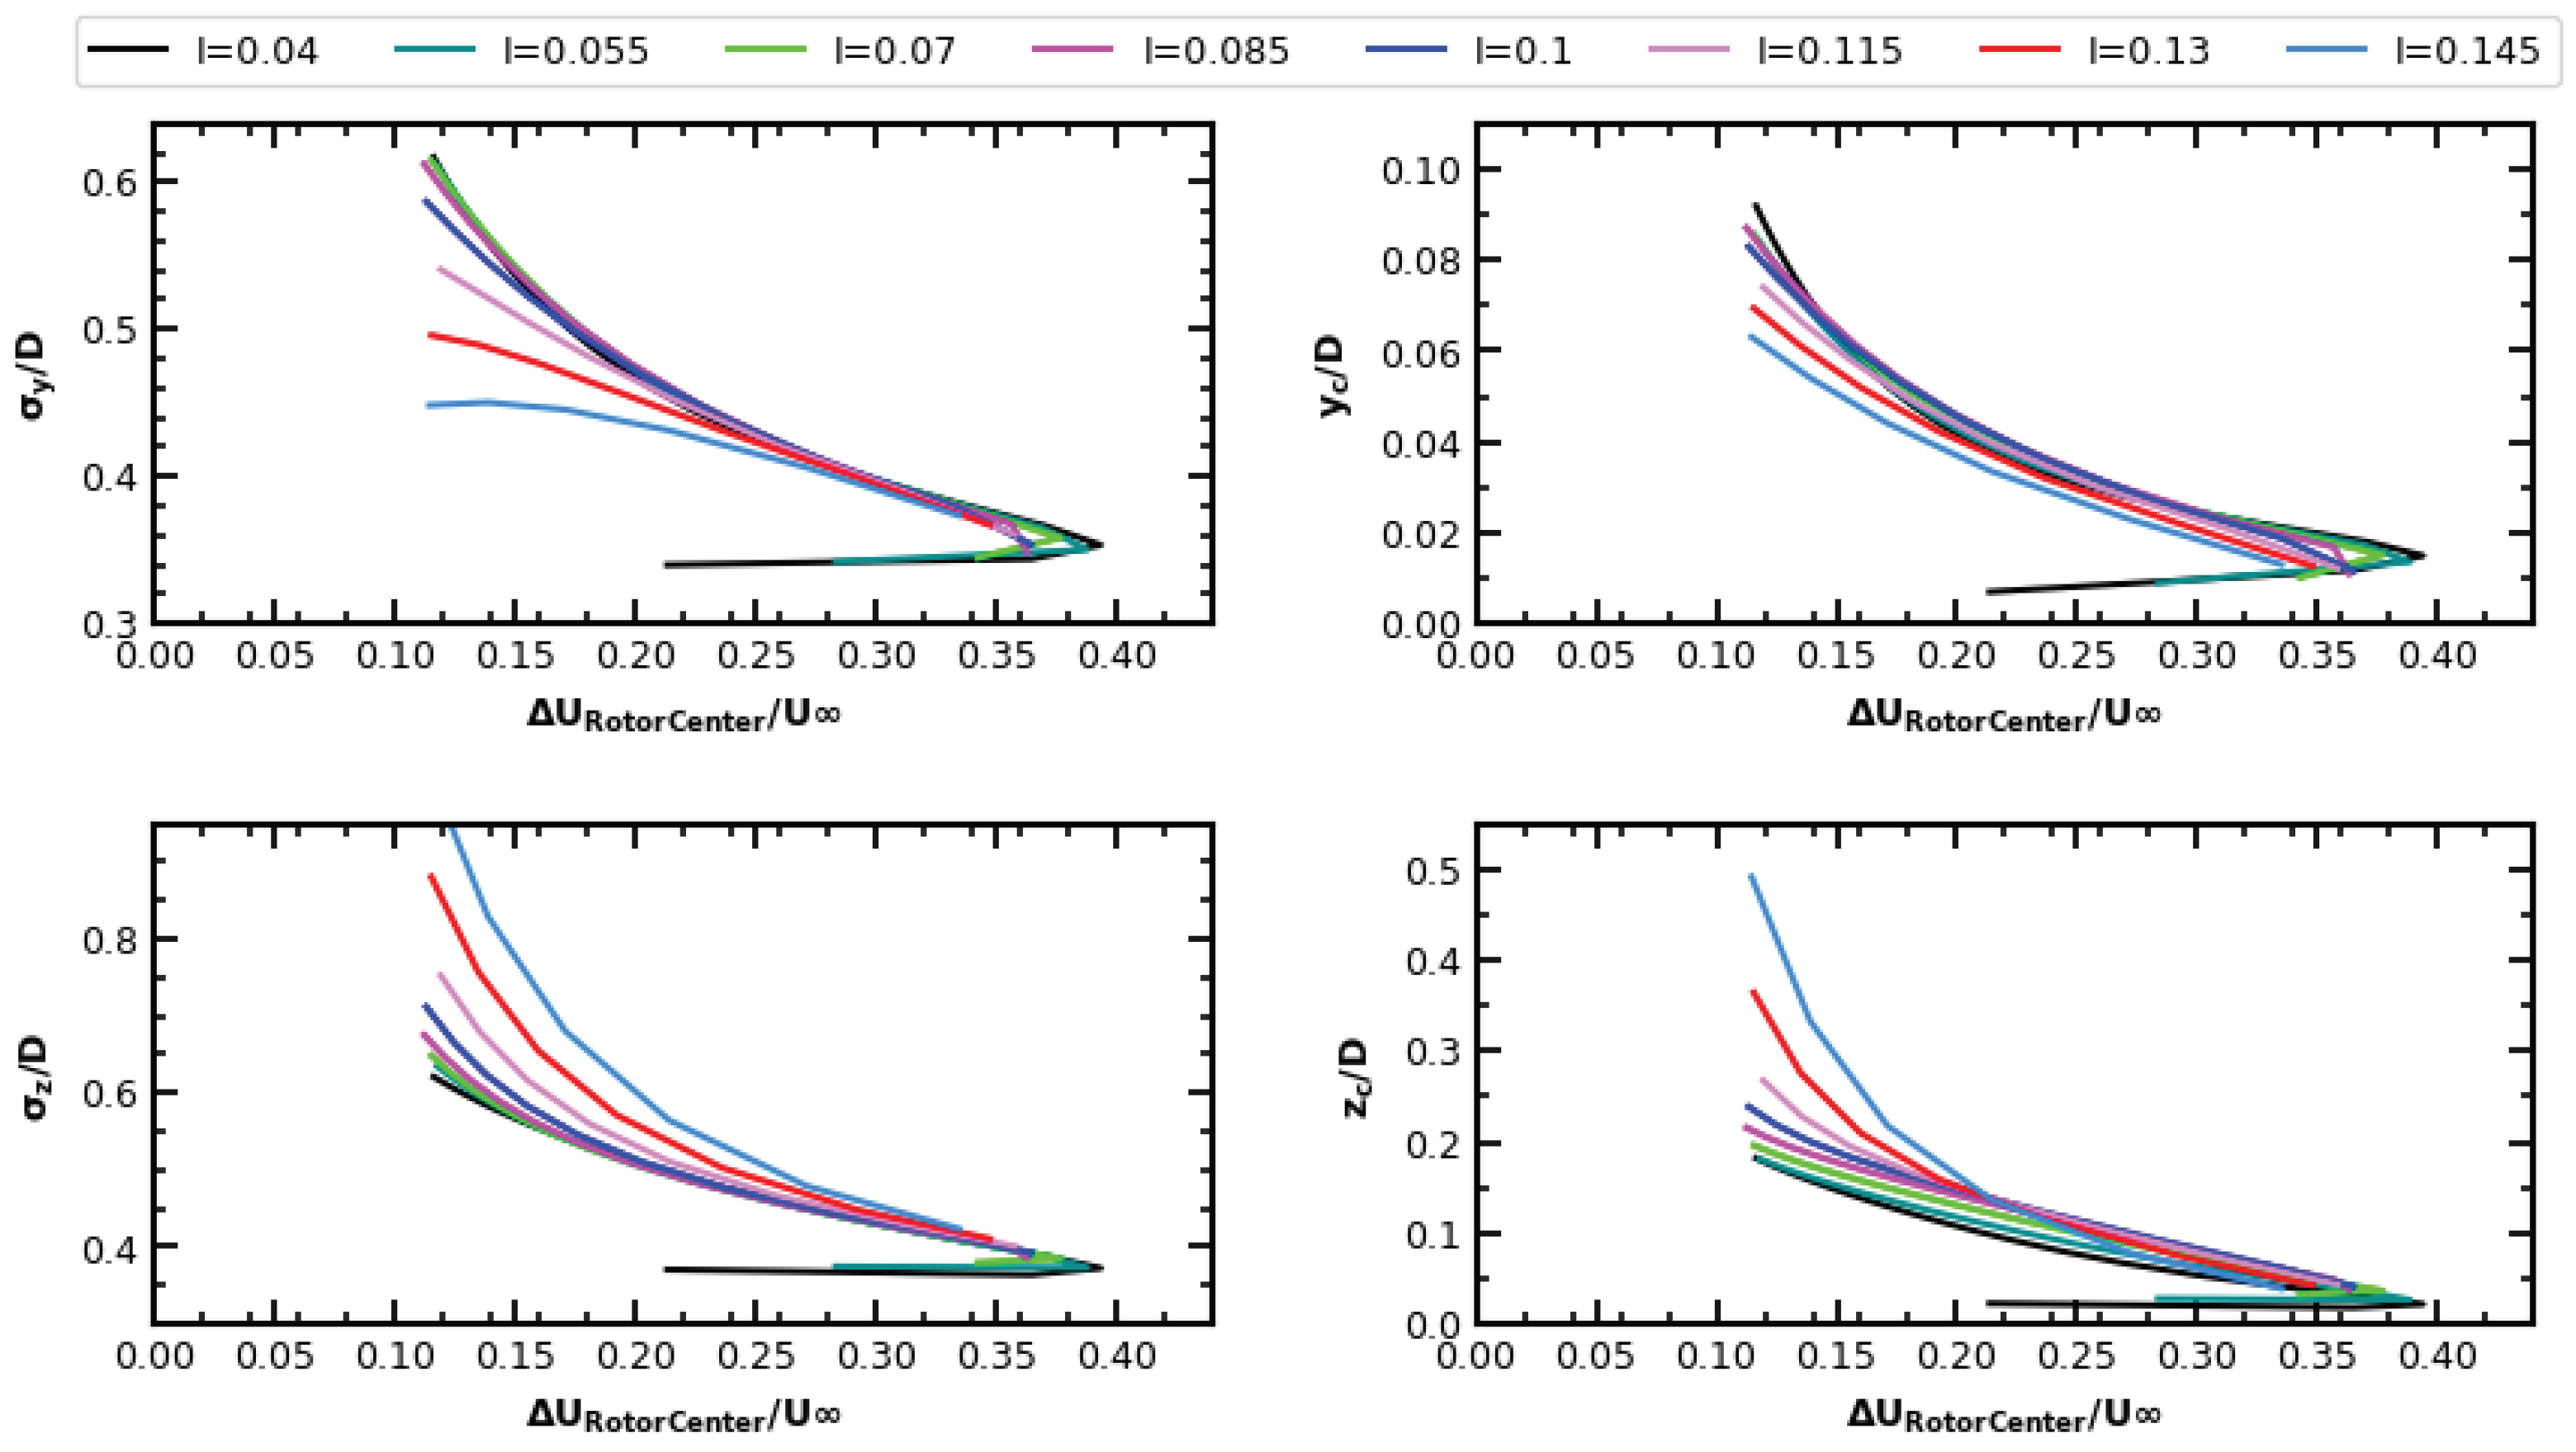
To gain an insight into the potential new scaling, Figure 8 presents the behaviour of the analysed variables with respect to the normalised velocity deficit at the rotor axis. With this modification, the parameters σ y , σ z , y c , and z c exhibit a similar pattern for different turbulence levels. Their curves almost collapse for values greater than 0.1–0.2 of the normalised deficit corresponding to the middle part of the wake, which can reach distances of 9 D for turbulence of 0.13 (typical for onshore sites) and 17 D for turbulence of 0.055 (typical for offshore sites)—see Figure 5. It is therefore possible to propose a new formulation, somehow related to the deficit, which could be applied over a range of turbulence intensities.
For this purpose, a new length scale is defined, starting with the selection of a velocity deficit threshold at the rotor center that is consistent across all analyzed cases. The chosen threshold must remain above the minimum velocity deficit observed under extremely low turbulence conditions ( I = 0.04 ), in order to ensure applicability to all scenarios. An iterative procedure was conducted to test various values of the normalized velocity deficit C , with the goal of improving the agreement between the model predictions and the CFD results. Among the values evaluated, C = 0.12 provided the best overall match with the reference wake profiles and was thus selected as the most representative threshold for defining the new length scale, as illustrated by the horizontal line in Figure 5.
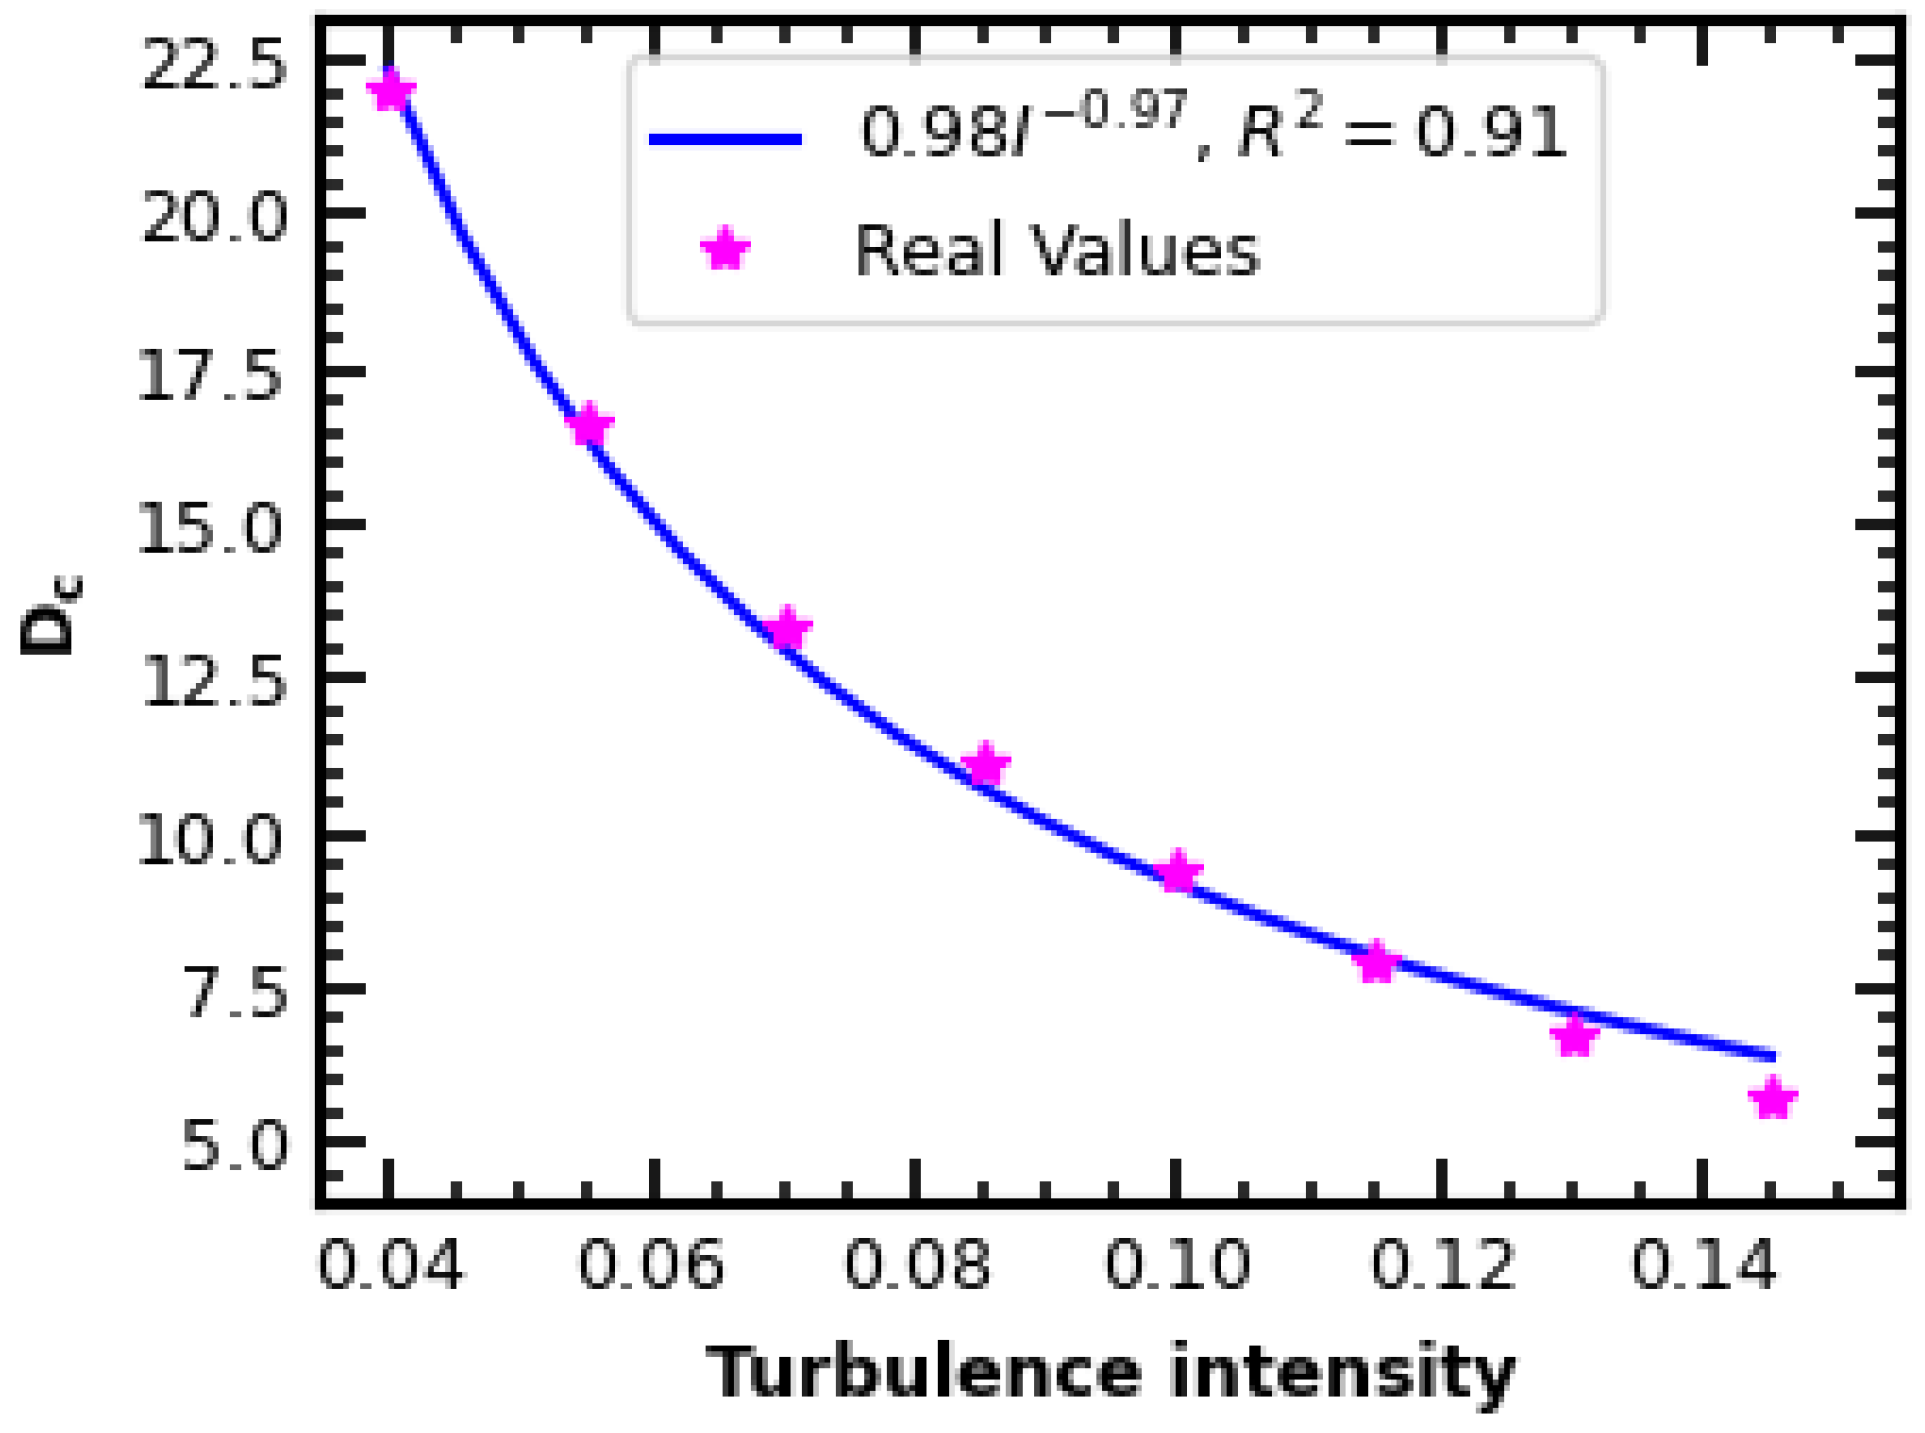
The distances D c at which this deficit value is reached for each turbulence level are then taken as the reference length (vertical dashed lines in Figure 5). In order to implement the proposed normalisation, it is essential to develop a methodology to determine the distance D c associated with each turbulence level, as well as to generalize the model function for any given turbulence value. Therefore, a power function is defined to model D c :
D c = α I β .
with α = 0.98 and β = 0.97 resulting from the CFD results. This power law is illustrated in Figure 9. This figure highlights the agreement between the proposed power function and the results for each turbulence intensity evaluated, ensuring that the model appropriately accounts for any turbulence intensity. Subsequently, each curve is truncated and normalised within the new length scaling unitary interval, as illustrated in Figure 10. The normalized distance ( x ¯ ) is defined as
x ¯ = x D D c .
It is important to note that the new parameters introduced in this development ( D c and x ¯ ) were calculated using normalized magnitudes. As a result, the method is applicable to different conditions—such as different wind turbine models, inlet velocities, and hub heights—although its calibration only required the CFD cases presented in this study. In particular, the dependence on the turbine loading state is taken into account by the relation with C T in Equation (11).
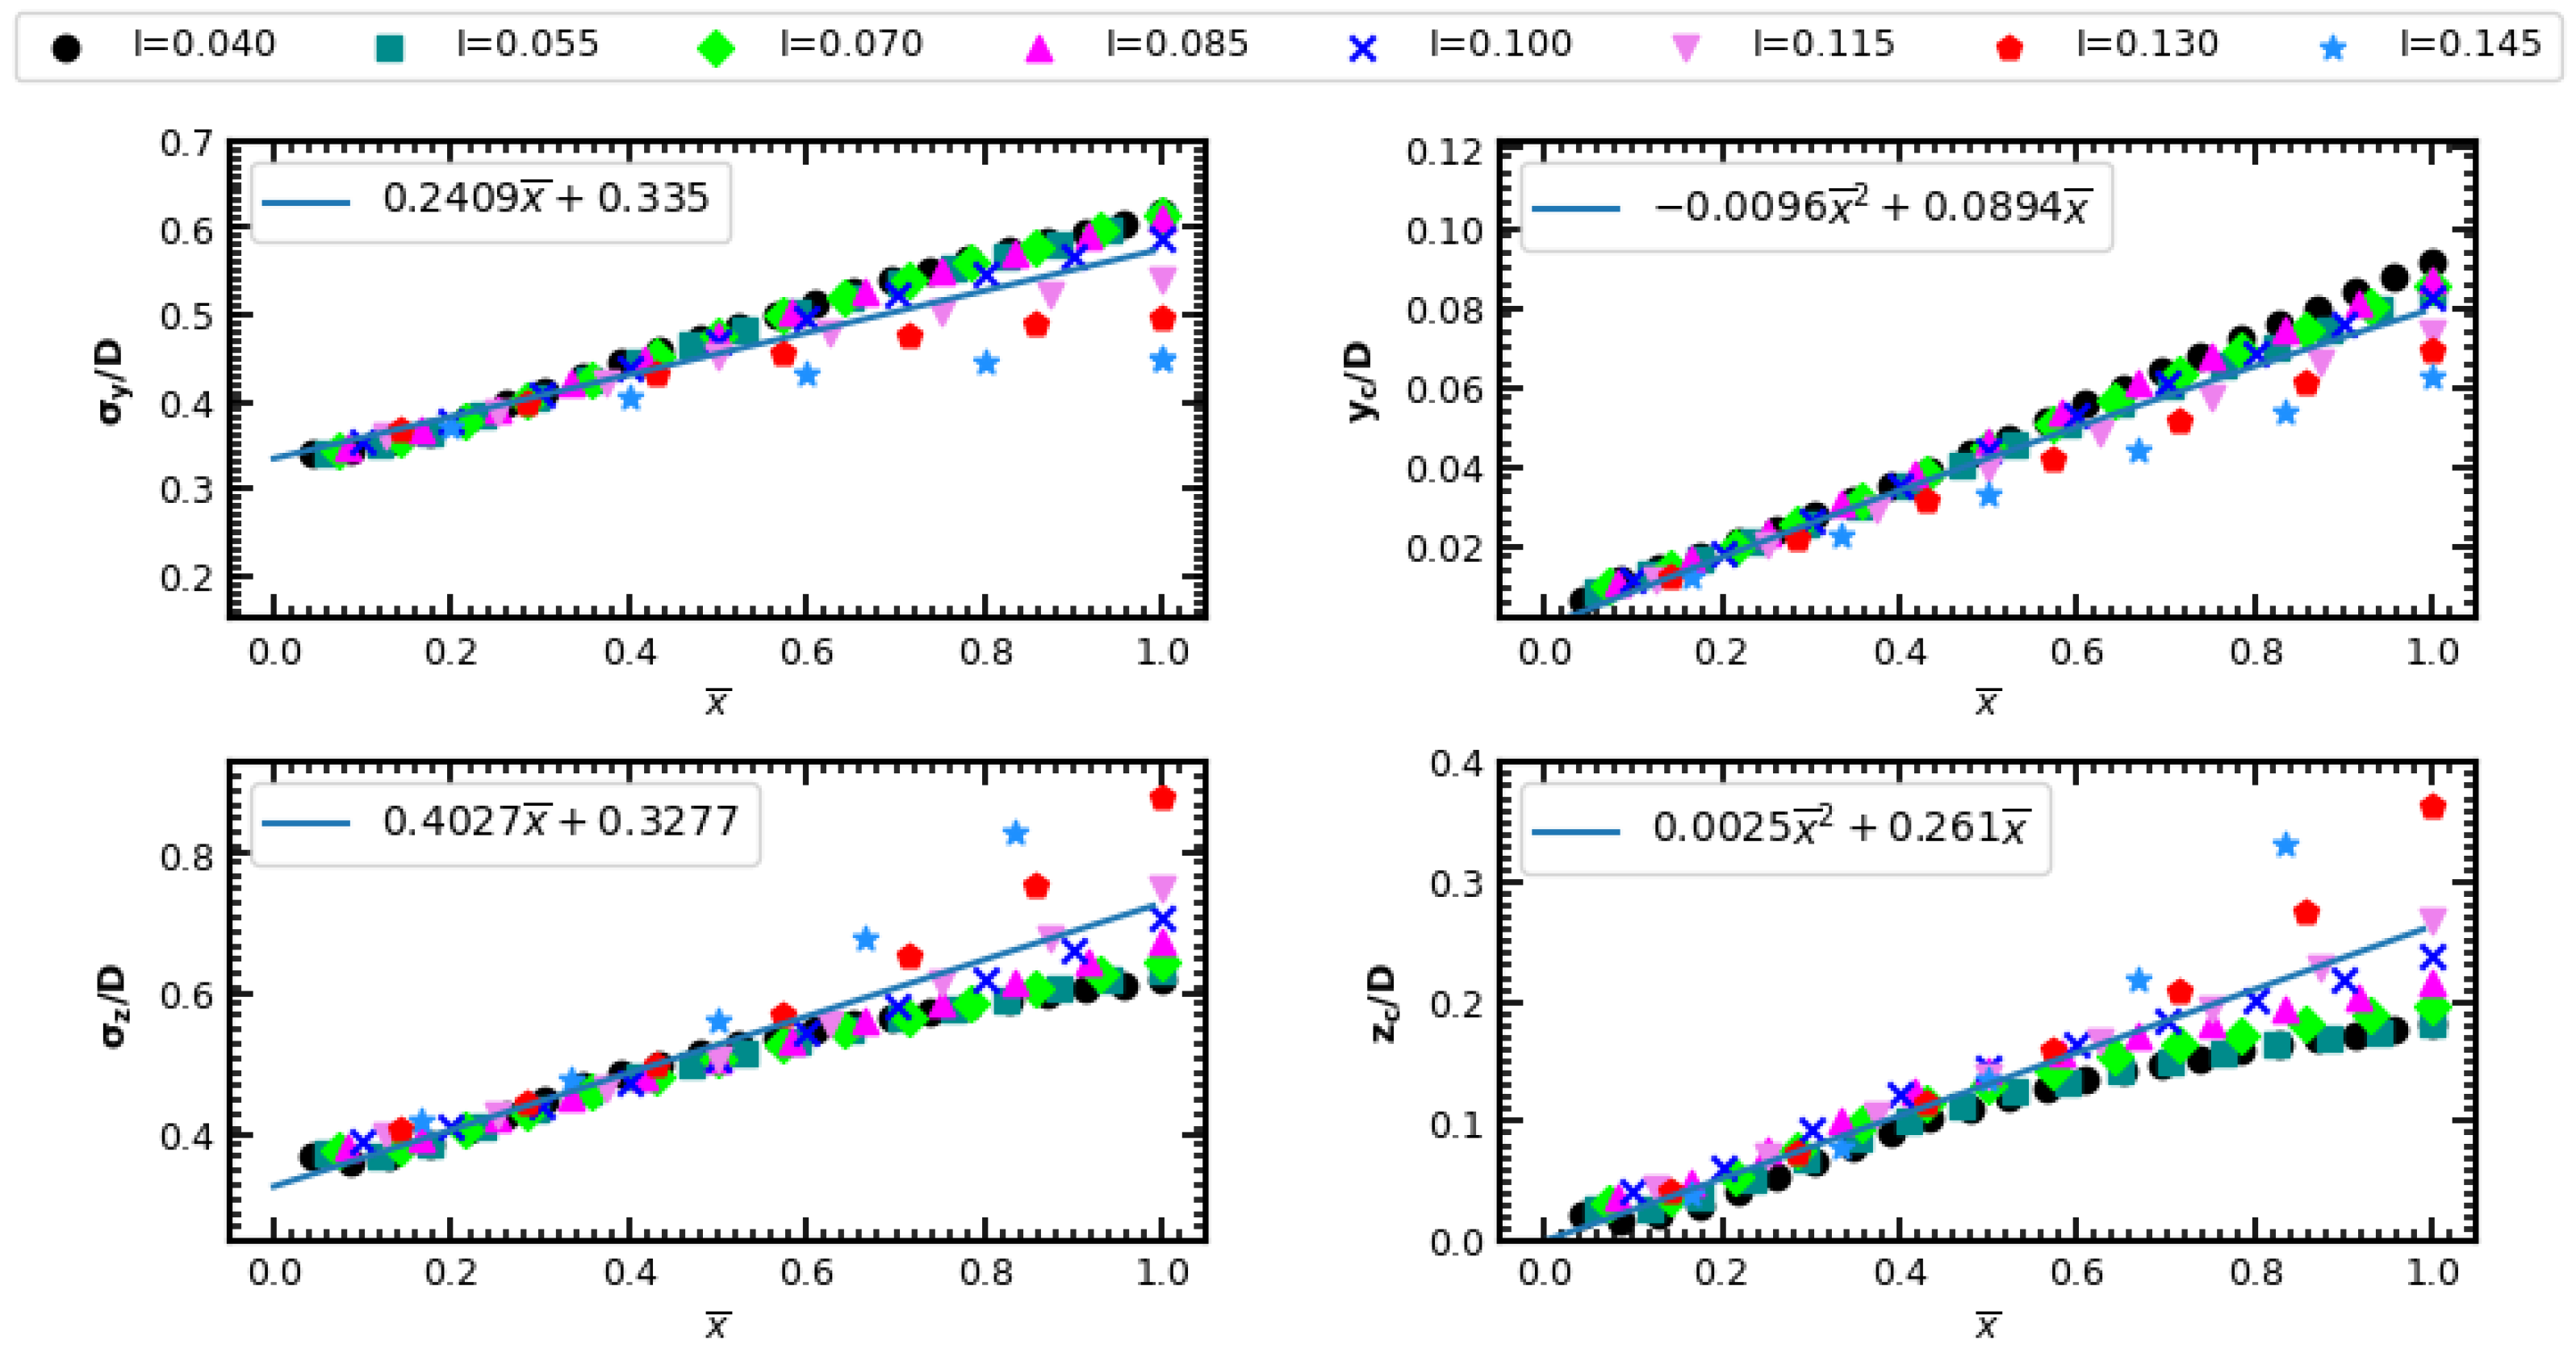
In addition, new functions are presented to describe σ y , σ z , y c , and z c in terms of the new scaled axial coordinate. Linear functions are explored to fit σ y and σ z , while quadratic functions are used for y c and z c . The incorporation of four additional parameters into the model enables the new 3D Gaussian formulation to accommodate a range of turbulence conditions and to describe the change of wake center. Although there is still some dispersion of the values depending on the turbulence level, which is more marked in the z-axis, this formulation has the advantage that the turbulence effect is contained only in the new length scale and general functions can be adopted for the model parameters. Figure 11 presents a flowchart summarizing the procedure followed to estimate the parameters of the new wake model.

4. New 3D Gaussian Wake Model

Finally, the new 3D Gaussian wake model is defined by Equations (10) and (11), with the parameter variation according to the best fit resulting in Equations (14)–(17).
σ y D = 0.2409 x ¯ + 0.3350 ,
σ z D = 0.4027 x ¯ + 0.3277 ,
y c D = 0.0096 x ¯ 2 + 0.0894 x ¯ ,
z c D = 0.0025 x ¯ 2 + 0.2610 x ¯ .
with x ¯ defined by Equation (13) and where Equations (14)–(17) provide the best fit for the values computed using CFD, within the newly normalized space defined by x ¯ . This comparison is further illustrated in Figure 10, where the proposed equations are represented by solid lines, while the CFD simulation results are depicted as discrete points.
The accuracy of the proposed model is evaluated against the well-established models mentioned in Section 2 and CFD simulations. These are all available in the open-source PyWake library [53], which is used as a testbench and where the new model is implemented. PyWake has an implementation of a mirror model to account for the ground effect. Although not included in the original formulation of the reference models, it was enabled in cases where it improved their behaviour with respect to simply feeding in the same ABL profile as the CFD simulations. The mirror ground model was not enabled for TurbOPark, when comparing its error against the CFD results, it was found that the error was greater when the ground model was enabled. For the other models, the error compared to the CFD simulation was lower when the mirror ground model was activated. A probable reason for the higher error in the TurboPark model when the mirror ground model is activated is that the TurboPark model is a top-hat model (with a constant velocity deficit). When the mirror is activated, there is a sudden jump in the wake deficit at certain downstream distance (where the wind turbine and ground deficit profiles intersect), resulting in a higher velocity deficit.
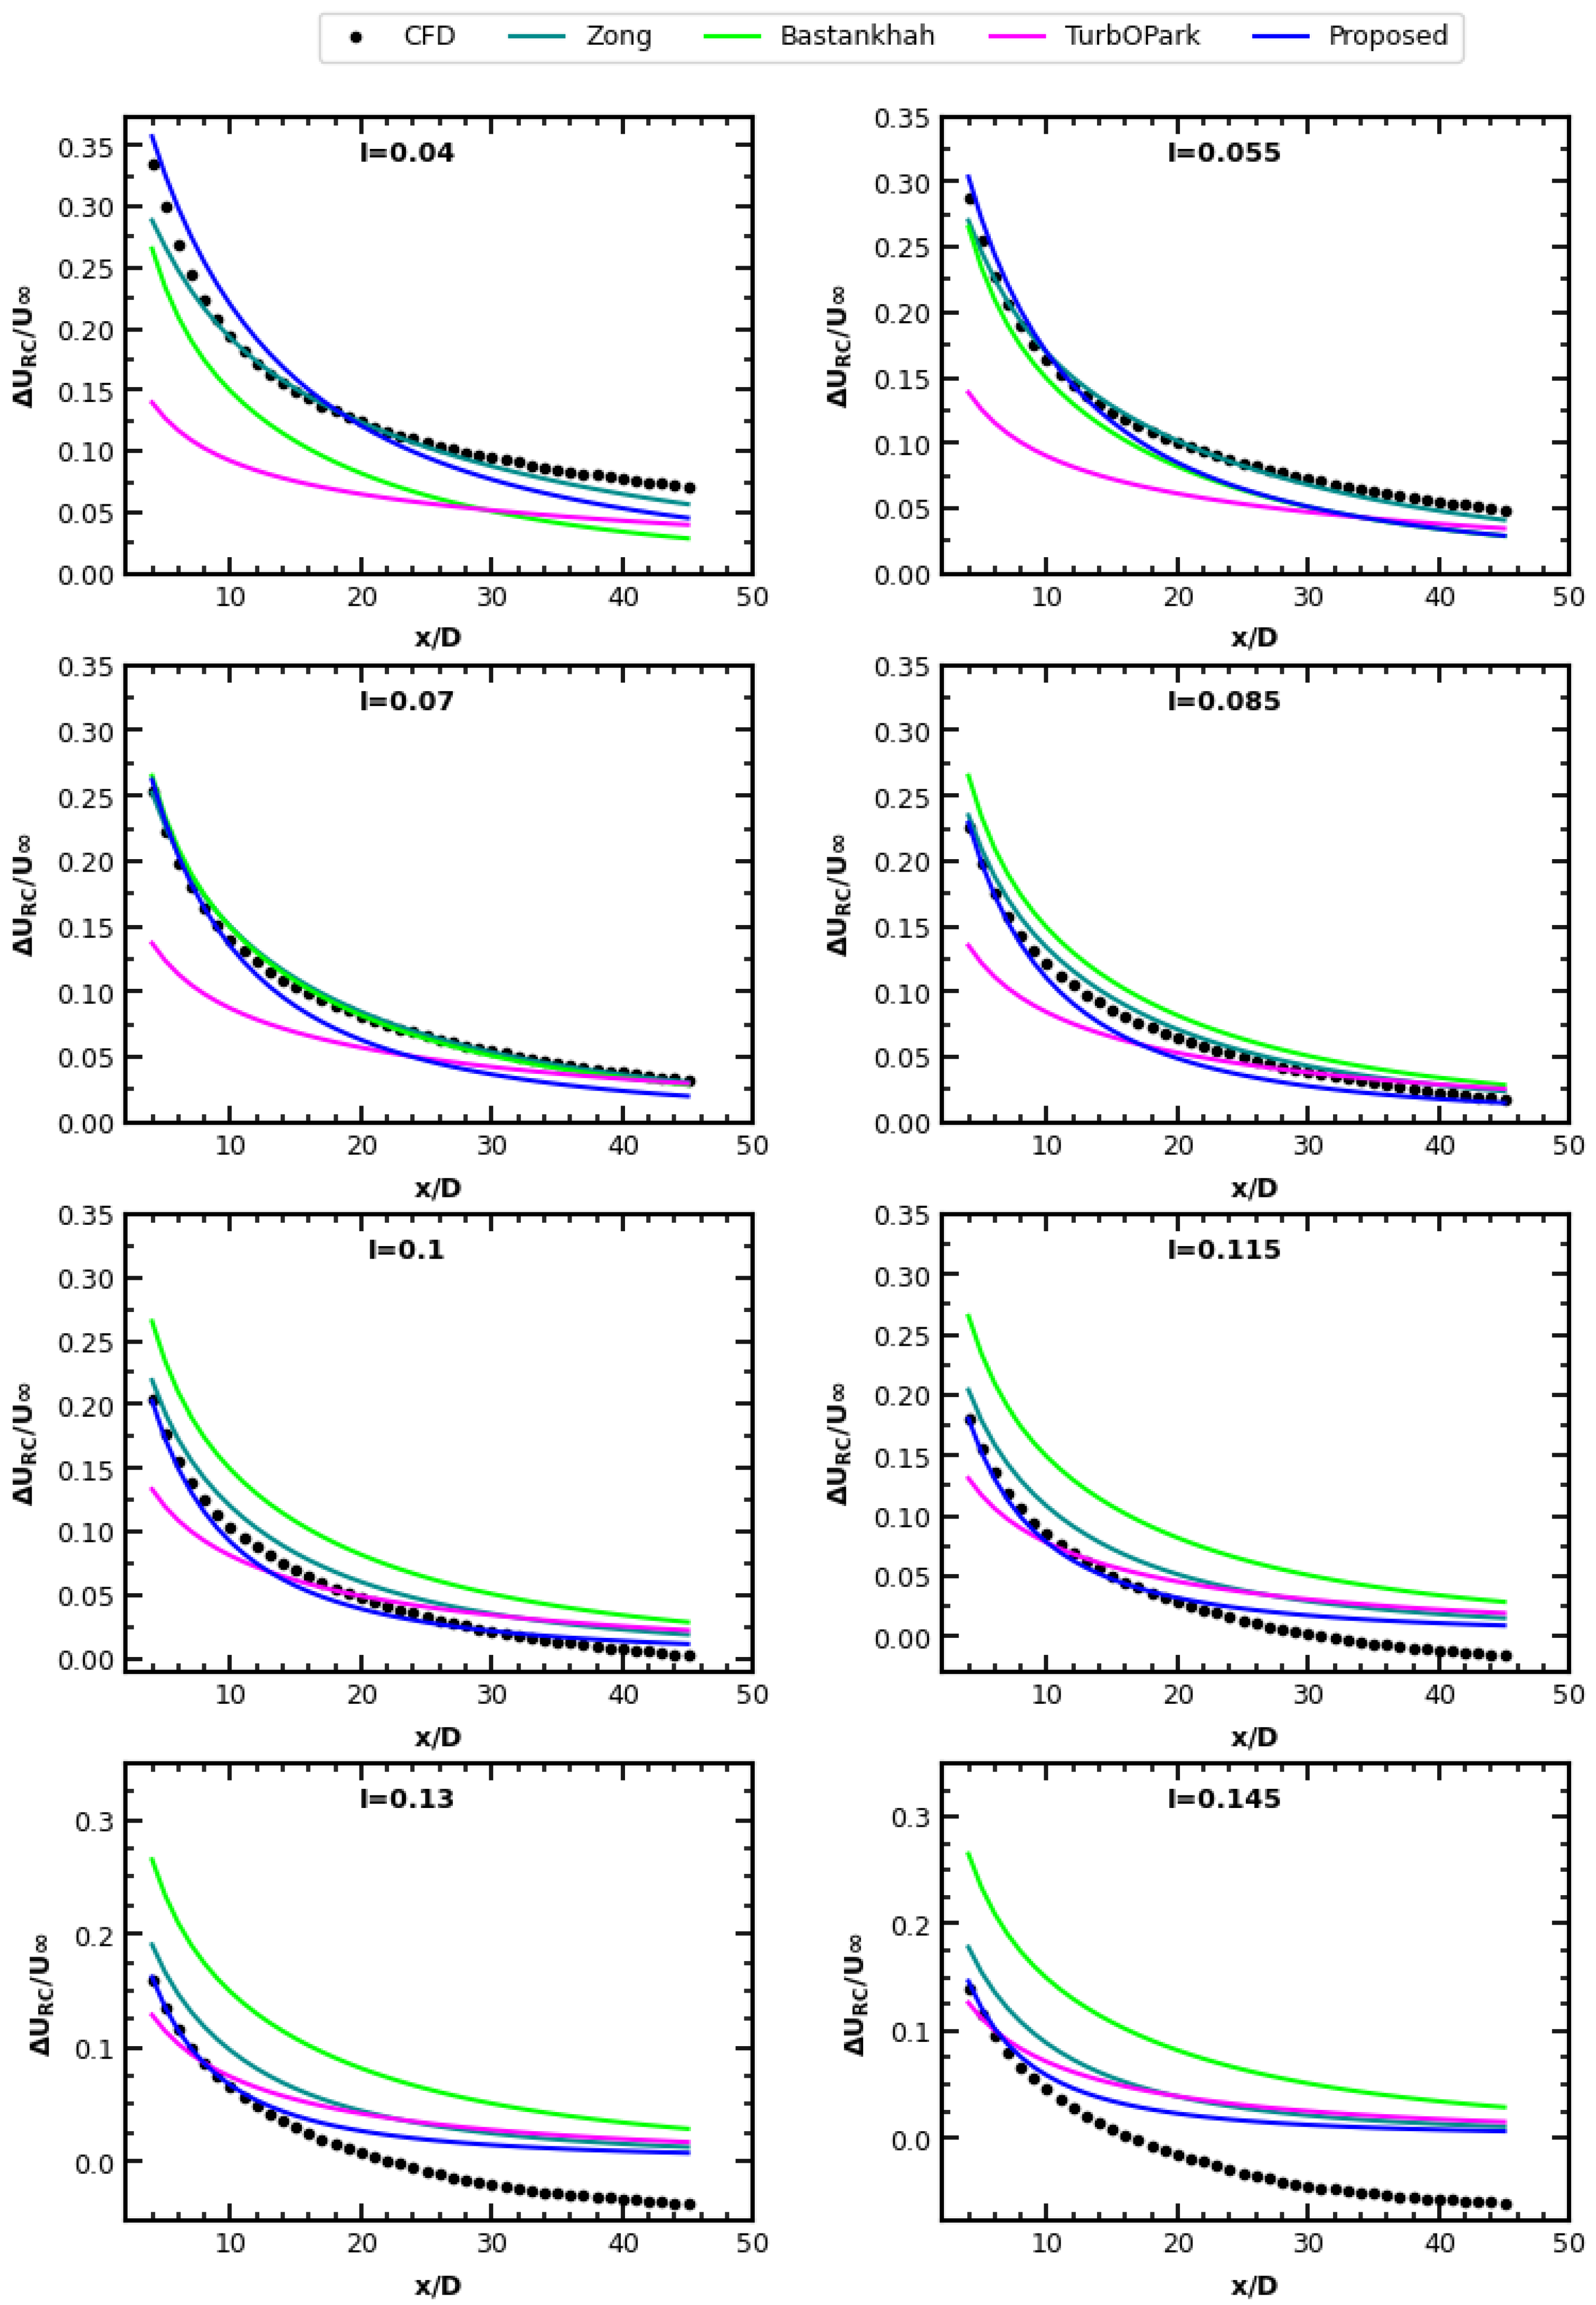
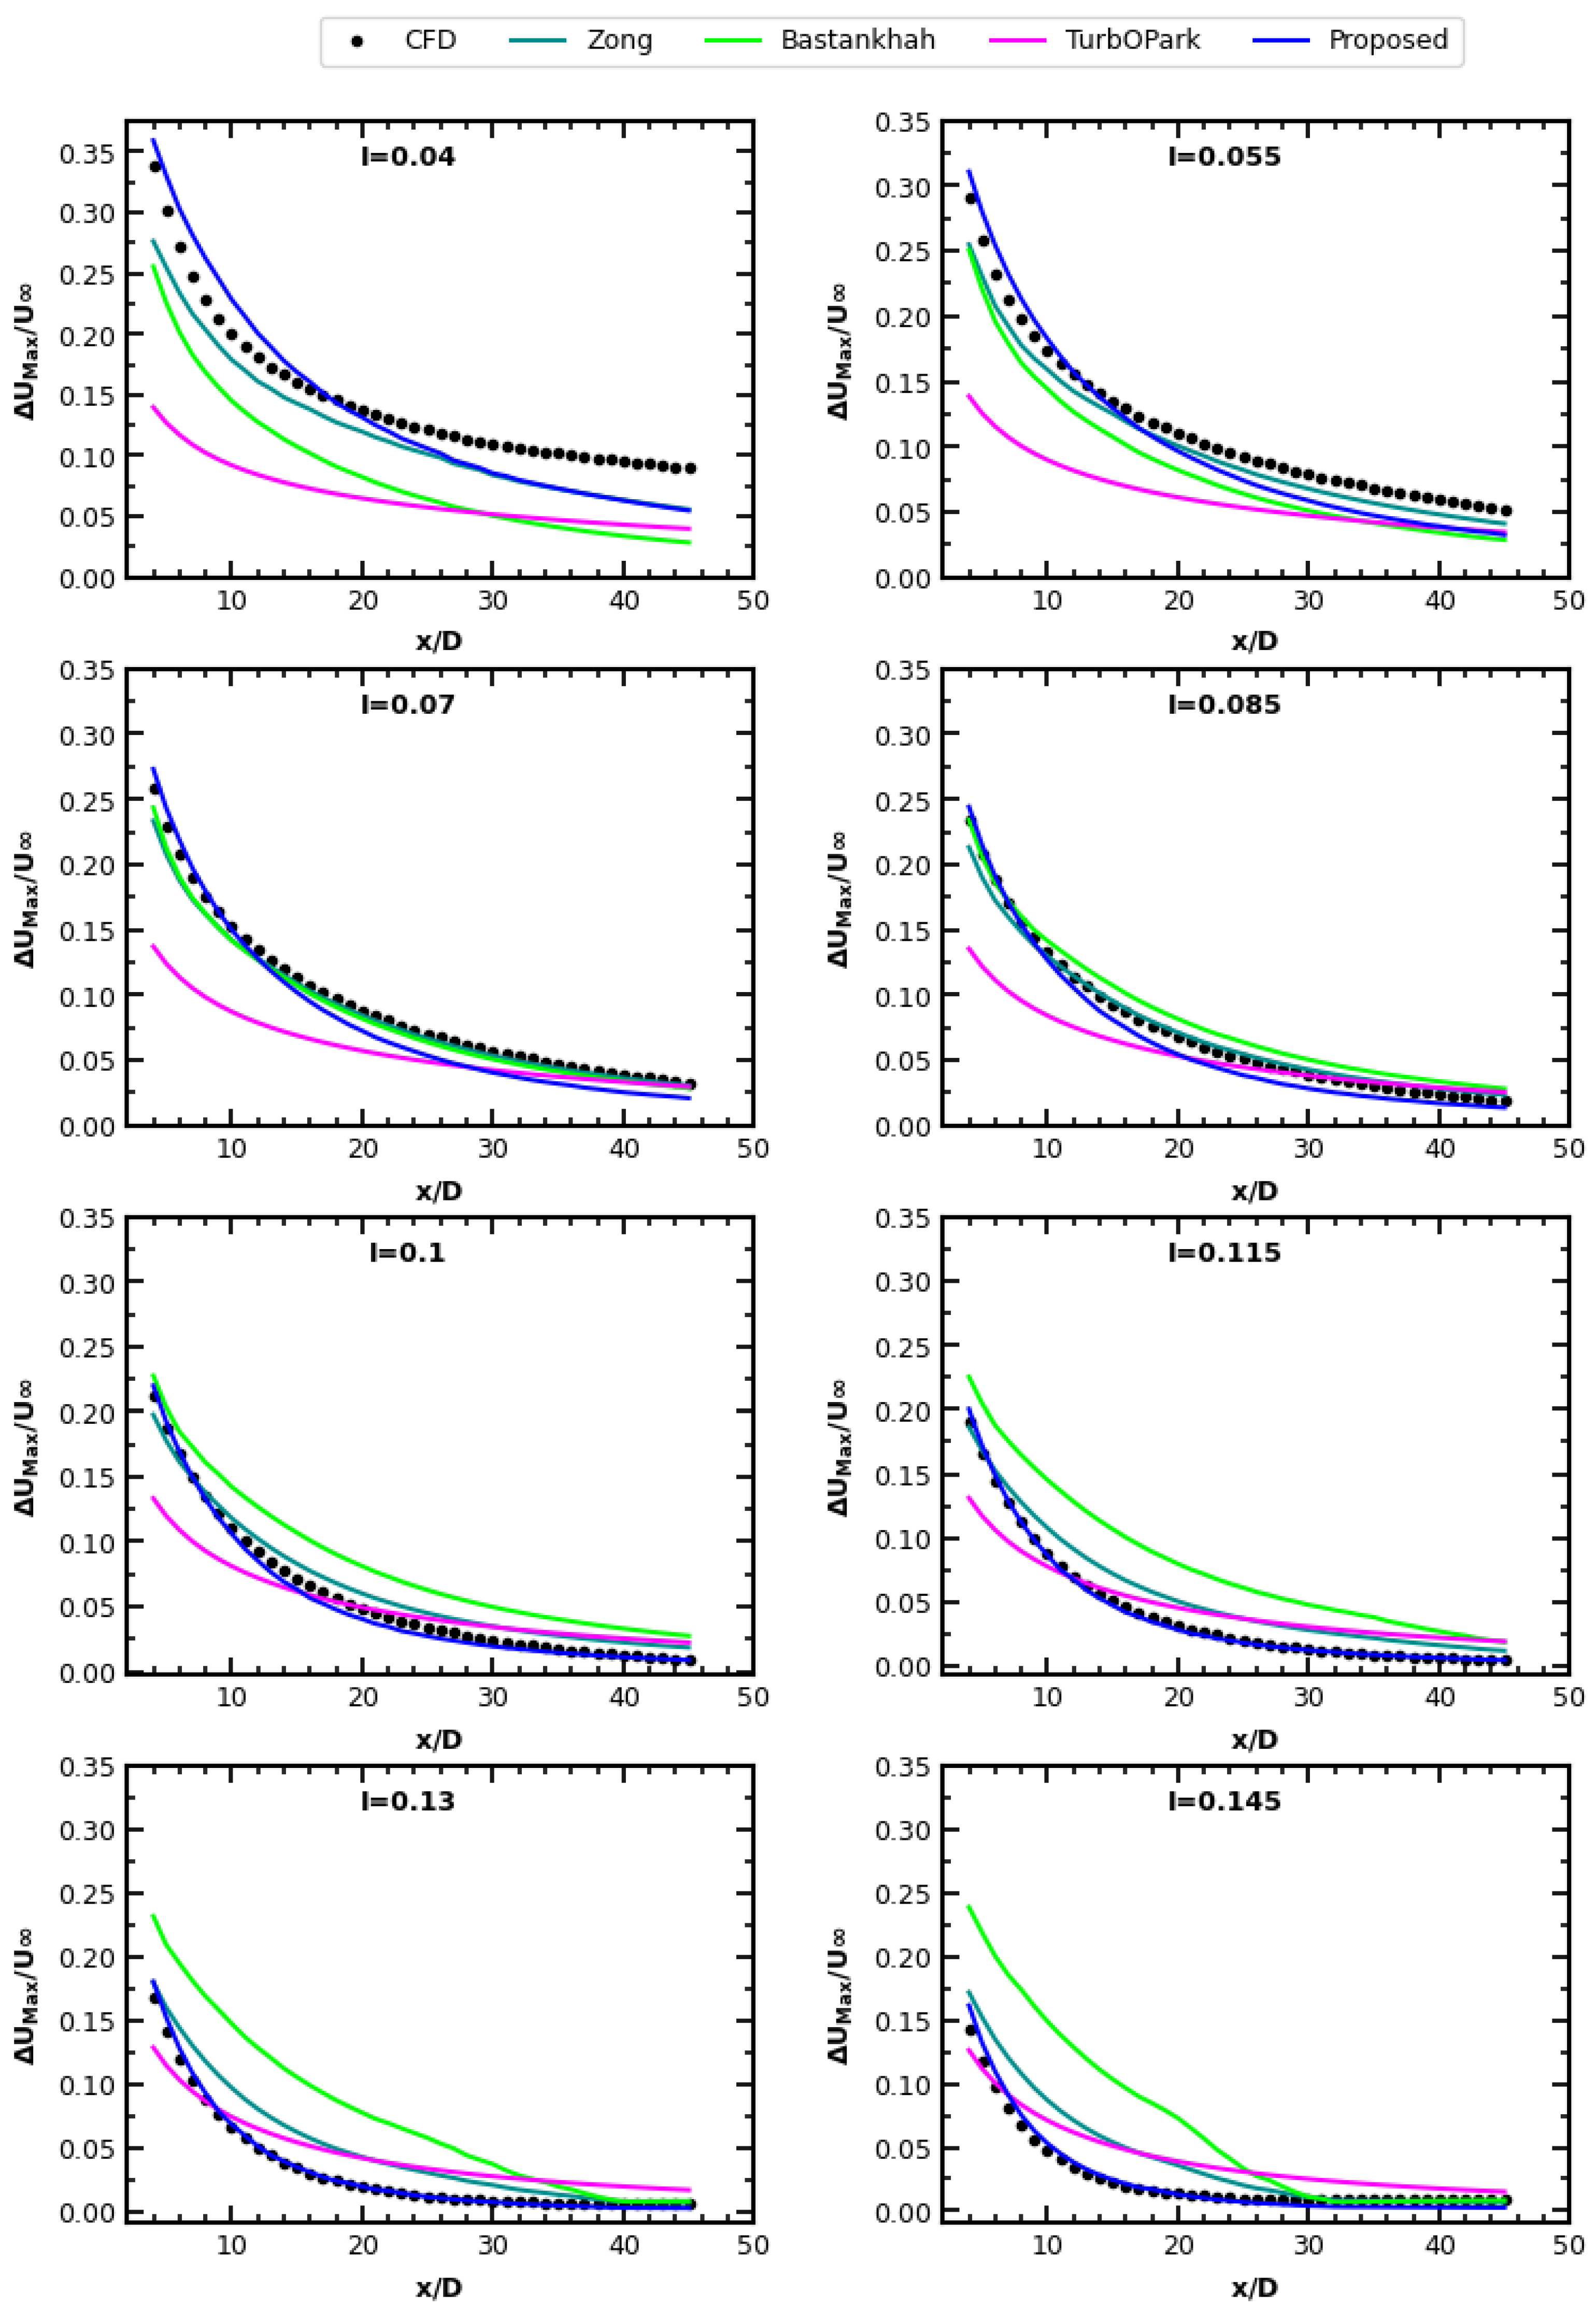
Figure 12 shows the results for the velocity deficit in the rotor axis at different downwind distances. It is evident that the proposed method closely approximates the CFD results and shows the least underestimation of the wake effect compared to other methods. The reference models consistently underestimate the wake effect in low-turbulence conditions typical of offshore sites, both in the near- and far-wake regions. Conversely, the proposed model shows a more accurate representation, although it still underestimates the wake effect, particularly in regions beyond about 23D downstream, but to a lesser extent. Transitioning to high-turbulence scenarios, common in onshore environments, the traditional models show a tendency to underestimate the wake effect in the near wake. In particular, only the Bastankhah model overestimates the effect in both the near and far wake. Here, the proposed model is more consistent with CFD simulations.
However, it should be noted that the maximum deficit is not located in the rotor axis as shown in Section 3.2. Therefore, the results for the wake center are examined in Figure 13. Once again, a close resemblance with the CFD results is found by the proposed method. This suggests that accurate predictions for both the wake center and the deficit at the rotor center are provided by this new method.
As a means of comparison between the reference models and the new one proposed in this work, the root mean squared error (RMSE) of each model with respect to the CFD results and for each turbulence intensity is computed in normal planes downstream. The RMSE error in each plane is defined as
R M S E = i N ( x i ^ x i ) 2 N .
where N is the number of points used in the fitting in each plane, i.e., 200 × 200 points. x i ^ corresponds to the velocity deficit from the CFD for point i, while x i denotes the velocity deficit from the tested model at the same point.
Figure 14 presents the RMSE along the downstream distances for each evaluated wake model. The TurboPark model exhibits the highest errors under low-turbulence conditions (<0.07) across nearly all downstream locations. In contrast, for high turbulence intensities, the Bastankhah model tends to produce the largest errors, particularly at longer distances. The Zong model and the proposed model show very similar performance across most turbulence intensities and downstream locations. However, under low-turbulence conditions, the proposed model consistently achieves lower errors, especially at medium and long downstream distances. The proposed model captures the wake effect more accurately than the other models, resulting in lower overall errors, especially over a wide range of turbulence intensities and at both short and long distances. In conclusion, the proposed model showed superior performance with reduced errors at all downstream distances.
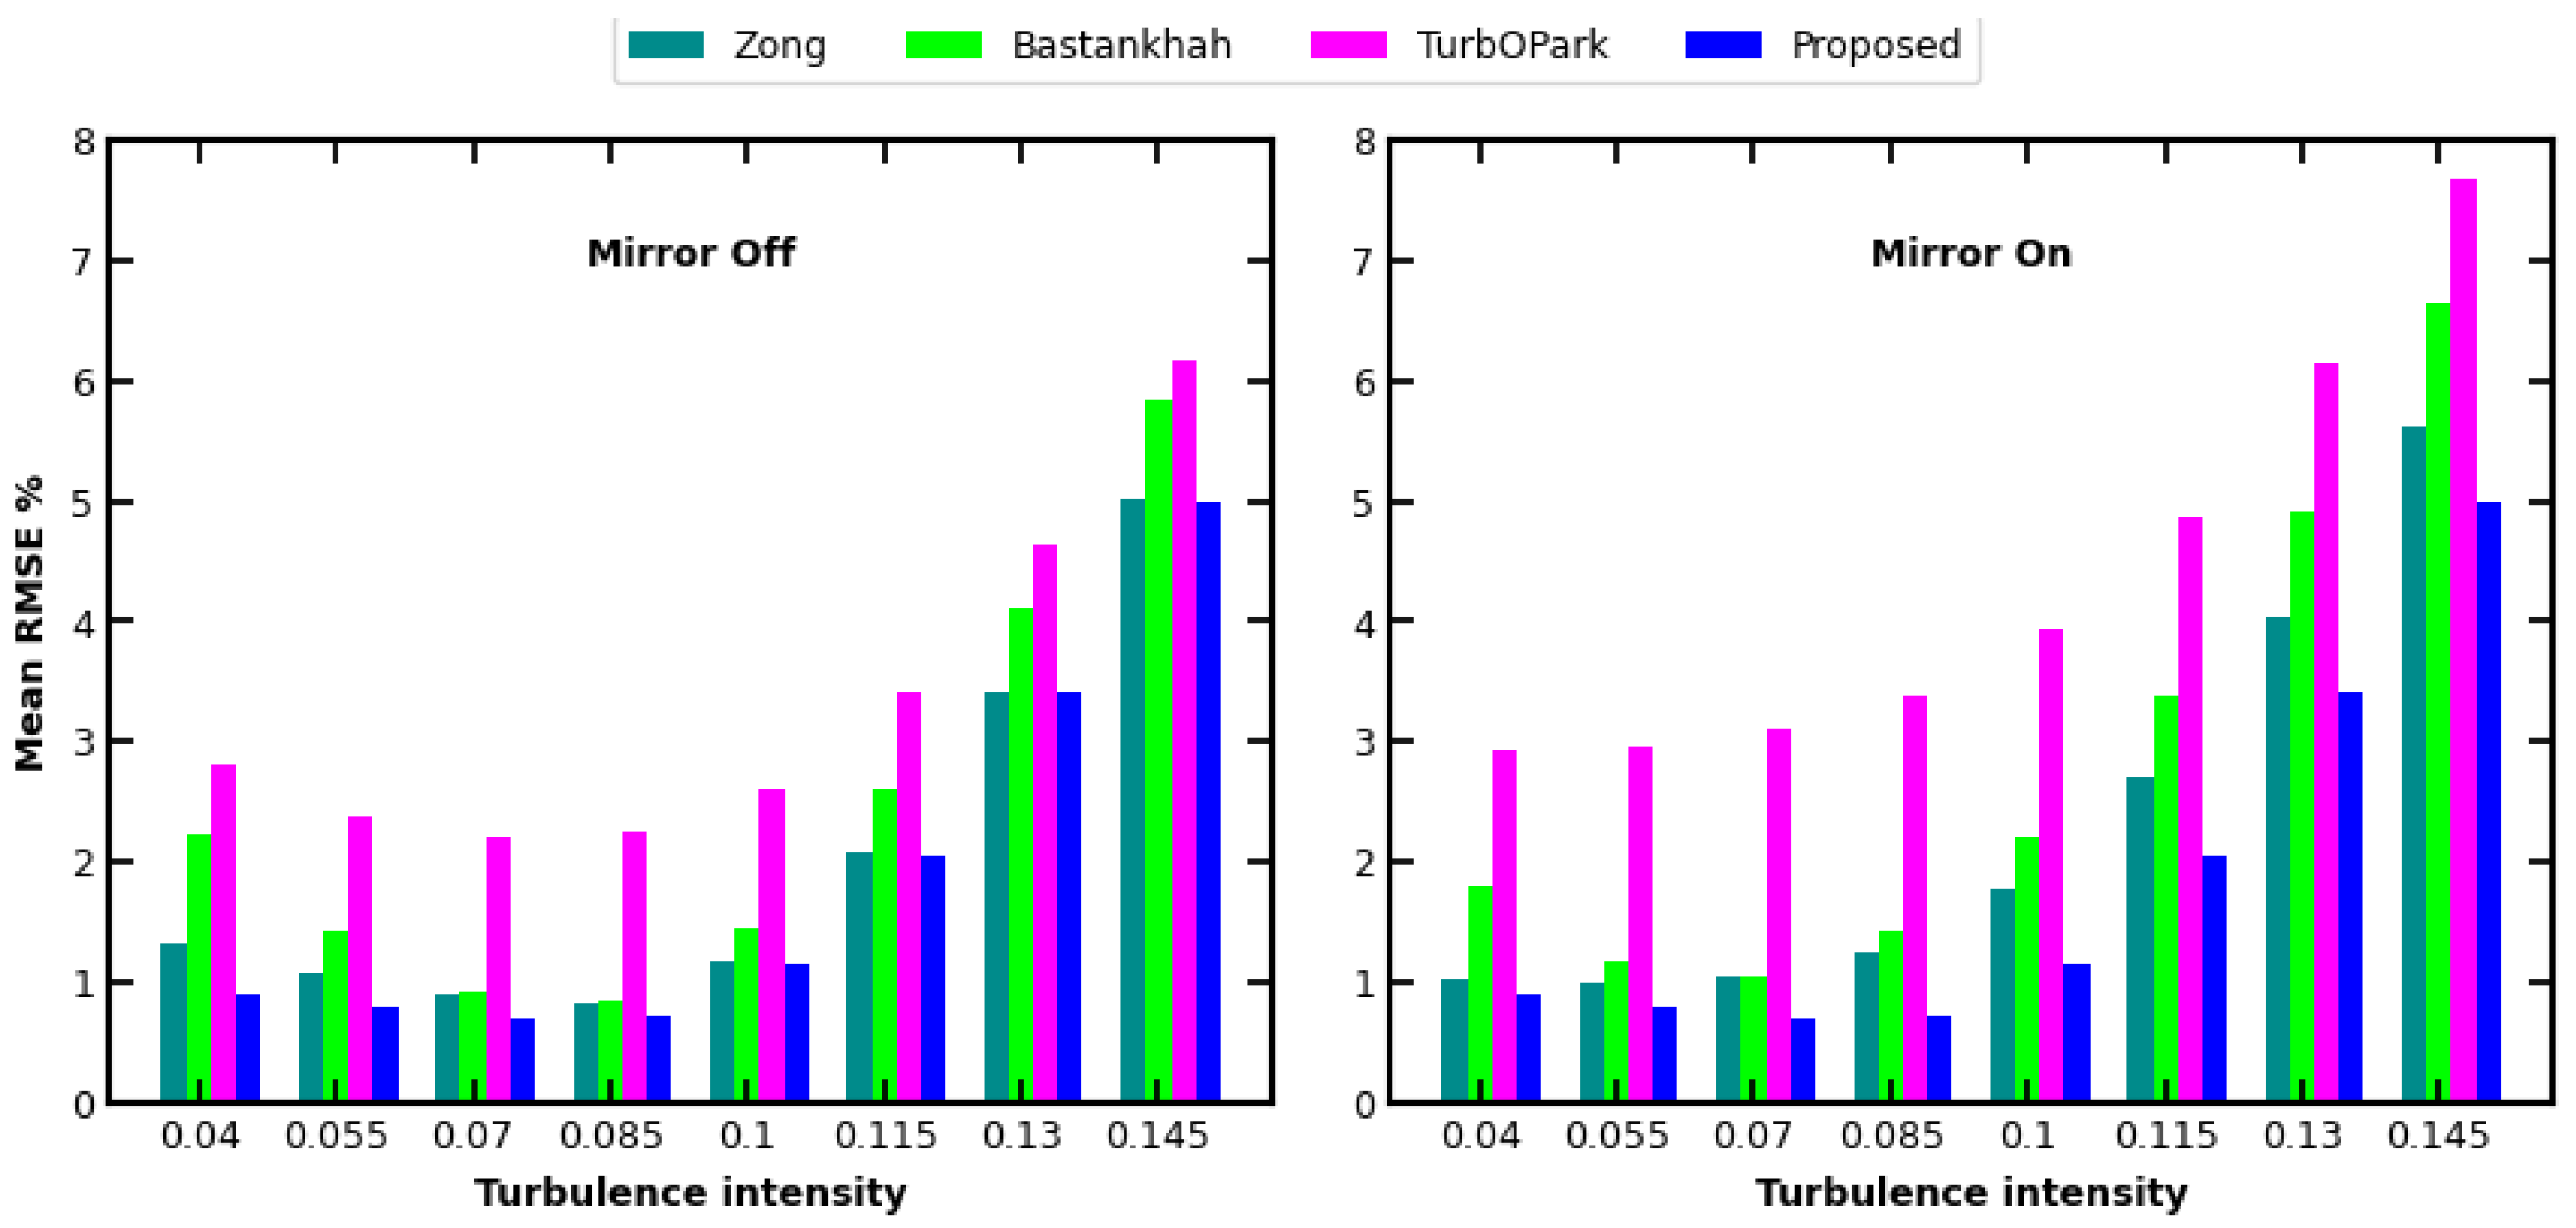
Figure 15 shows the mean value of all RMSEs calculated for planes between 4 D and 49 D . The RMSEs for the first 4 D , where the near-wake phenomena become dominant, have been excluded from the calculation. Here, a comparison is also made between the results obtained with and without the activation of the mirror ground model, in order to understand the differences obtained for the different models. The TurbOPark model is an improvement over the original Jensen model as it incorporates the dependence on turbulence intensity. However, it does not outperform the Bastankhah model, which does not take this dependence into account. Interestingly, the Zong and Bastankhah models give similar results for turbulence values between 0.07 and 0.1. In cases of extreme turbulence intensity, the difference between the Zong and Bastankhah models becomes more pronounced.
The mirror model improves the results for lower turbulence and deteriorates those for higher turbulence. The latter effect is more pronounced in the TurbOPark model, which is the reason why it was switched off in the previous results. In the other Gaussian models, the gain in low and medium turbulence values outweighs the loss in high turbulence values.
It is clear from Figure 15 that the proposed method gives superior results for all turbulence intensities tested. Overall, the proposed method shows a better accuracy along different positions downstream and is able to provide a more accurate velocity deficit estimation.

5. Conclusions and Perspectives

In this study, the combined effect of wake rotation and ABL wind profile was analysed over a wide range of turbulence intensities corresponding to both onshore and offshore situations. Simulations were carried out using RANS equations and a realizable κ ϵ turbulence model, combined with an AD model for turbine description. The study provided a comprehensive understanding of wake diameter expansion and changes in wake center positions downstream. A significant observation was the movement of air masses from high-velocity zones to low-velocity zones and vice versa, which commanded the shift of the wake center positions, particularly in cases of higher turbulence intensity and greater distances (especially beyond 35D). A notable finding was the consistent description of the wake diameter and displacement in the horizontal and vertical axes for different turbulent states, achieved by a unique definition of the sampled space.
Based on these observations, a novel approach to defining a new 3D Gaussian wake model was proposed. This approach allows the representation of wakes generated under different turbulence conditions using the same wake model, while taking into account changes in wake center positions and diameter over downstream distances. The proposed wake model showed promising performance compared to well-established wake models, including recent developments that explicitly incorporate turbulence. It allows the calculation of the velocity deficit at long distances ( x > 20 D ) and could serve as a valuable tool for modelling farm to farm interactions between wind farms.
The proposed wake model allows for a more accurate prediction of the spatial energy density distribution. Furthermore, by incorporating the wake center shift, the model facilitates the optimization of yaw misalignment control strategies. In addition, since the model has been validated over long distances, it could potentially provide a more accurate estimation of wake effects between wind farms.
This model can be directly applied using the results of the present CFD simulations without the need for recalibration. If higher accuracy is required for unusual conditions, the procedure described in this study can simply be repeated by calculating a new D c distance with the parameters adjusted and fitting the model with new equations.
The continuation of this work will focus on testing the performance of the proposed wake method in turbine and wind farm interactions, particularly in combination with appropriate wake superposition methods. In addition, the investigation of changes in wake center positions due to ground interaction, taking into account the Coriolis acceleration, could provide additional valuable insights.

Author Contributions

Conceptualization, A.D.O.; methodology, J.A.M.-T. and A.D.O.; software, J.A.M.-T. and D.A.B.; validation, J.A.M.-T. and D.A.B.; formal analysis, J.A.M.-T., D.A.B., J.L.M.-G., J.U. and A.D.O.; investigation, J.A.M.-T., D.A.B., J.L.M.-G., J.U. and A.D.O.; resources, J.A.M.-T., D.A.B., J.L.M.-G., J.U. and A.D.O.; data curation, J.A.M.-T.; writing—original draft preparation, J.A.M.-T., D.A.B. and A.D.O.; writing—review and editing, J.A.M.-T. and A.D.O.; visualization, J.L.M.-G., J.U. and A.D.O.; supervision, J.U. and A.D.O.; project administration, J.U. and A.D.O.; funding acquisition, J.L.M.-G., J.U. and A.D.O. All authors have read and agreed to the published version of the manuscript.

Funding

This research received no external funding.

Data Availability Statement

The dataset is available on request from the authors.

Acknowledgments

The authors are grateful for the support provided by the Bicentennial Doctoral Excellence Scholarship Programme of Minciencias. In addition, we would like to thank CSC-CONICET for providing computing time on the Tupac HPC facility.

Conflicts of Interest

The authors declare no conflicts of interest.

References

  1. Brindley, G.; Willems, G.; Ramirez, L.; Cole, P.; Klonari, V.; Bickley, J. Wind Energy in Europe 2023 Statistics and the Outlook for 2024–2030; Technical Report; Wind Europe: Brussels, Belgium, 2023. [Google Scholar]
  2. Joyce Lee, F.Z. Global Wind Report 2022; Technical Report; Global Wind Energy Council (GWEC): Brussels, Belgium, 2022. [Google Scholar]
  3. Platis, A.; Siedersleben, S.K.; Bange, J.; Lampert, A.; Bärfuss, K.; Hankers, R.; Cañadillas, B.; Foreman, R.; Schulz-Stellenfleth, J.; Djath, B.; et al. First in situ evidence of wakes in the far field behind offshore wind farms. Sci. Rep. 2018, 8, 2163. [Google Scholar] [CrossRef]
  4. Moriarty, P.; Hamilton, N.; Debnath, M.; Herges, T.; Isom, B.; Lundquist, J.K.; Maniaci, D.; Naughton, B.; Pauly, R.; Roadman, J.; et al. American WAKE Experiment (AWAKEN); NREL: Golden, CO, USA, 2020. [Google Scholar]
  5. 4C Offshore. 4C Offshore—Offshore Wind Farm Map. 2023. Available online: https://map.4coffshore.com/offshorewind (accessed on 8 December 2023).
  6. Letsch, B.; Barriatto, L. Long Distance Offshore Wakes. Brazil Windpower. 2023. Available online: https://abeeolica.org.br/wp-content/uploads/2023/11/4.2AP-1690897876-Long-offshore-wakes_BWP2023_Reformatado.pdf (accessed on 21 May 2025).
  7. Schneemann, J.; Rott, A.; Dörenkämper, M.; Steinfeld, G.; Kühn, M. Cluster wakes impact on a far-distant offshore wind farm’s power. Wind. Energy Sci. 2020, 5, 29–49. [Google Scholar] [CrossRef]
  8. Technology, P. Formosa 1 Offshore Wind Farm. 2019. Available online: https://www.power-technology.com/projects/formosa-1-offshore-wind-farm/ (accessed on 8 December 2023).
  9. Cañadillas, B.; Foreman, R.; Barth, V.; Siedersleben, S.; Lampert, A.; Platis, A.; Djath, B.; Schulz-Stellenfleth, J.; Bange, J.; Emeis, S.; et al. Offshore wind farm wake recovery: Airborne measurements and its representation in engineering models. Wind Energy 2020, 23, 1249–1265. [Google Scholar] [CrossRef]
  10. da Silva, A.I.R.D.; Leite, G.d.N.P.; Araújo, A.M.; Villa, A.A.O.; da Costa, A.C.A.; Moreno, C.A.S.; Weschenfelder, F.; Droguett, E.L. Aerodynamic interference caused by wake effects of repowered wind farms on the annual energy production in neighboring wind farms. Sustain. Energy Technol. Assess. 2024, 64, 103704. [Google Scholar]
  11. Feroz, R.M.A.; Javed, A.; Syed, A.H.; Kazmi, S.A.A.; Uddin, E. Wind speed and power forecasting of a utility-scale wind farm with inter-farm wake interference and seasonal variation. Sustain. Energy Technol. Assess. 2020, 42, 100882. [Google Scholar] [CrossRef]
  12. Wang, Z.; Yang, X. Upward Shift of Wind Turbine Wakes in Large Wind Farms. Energies 2023, 16, 8051. [Google Scholar] [CrossRef]
  13. Zhang, F.; Yang, X.; He, G. Multiscale analysis of a very long wind turbine wake in an atmospheric boundary layer. Phys. Rev. Fluids 2023, 8, 104605. [Google Scholar] [CrossRef]
  14. Pope, S.B. Turbulent Flows; Cambridge University Press: Cambridge, UK, 2000. [Google Scholar]
  15. Chaouat, B. The state of the art of hybrid RANS/LES modeling for the simulation of turbulent flows. Flow Turbul. Combust. 2017, 99, 279–327. [Google Scholar] [CrossRef]
  16. Porté-Agel, F.; Bastankhah, M.; Shamsoddin, S. Wind-Turbine and Wind-Farm Flows: A Review. Bound.-Layer Meteorol. 2020, 174, 1–59. [Google Scholar] [CrossRef]
  17. Tian, L.; Song, Y.; Zhao, N.; Shen, W.; Zhu, C.; Wang, T. Effects of turbulence modelling in AD/RANS simulations of single wind & tidal turbine wakes and double wake interactions. Energy 2020, 208, 118440. [Google Scholar]
  18. Vanderwende, B.J.; Kosović, B.; Lundquist, J.K.; Mirocha, J.D. Simulating effects of a wind-turbine array using LES and RANS. J. Adv. Model. Earth Syst. 2016, 8, 1376–1390. [Google Scholar] [CrossRef]
  19. Katic, I.; Højstrup, J.; Jensen, N. A Simple Model for Cluster Efficiency. Eur. Wind. Energy Assoc. Conf. Exhib. 1987, 1, 407–410. [Google Scholar]
  20. Frandsen, S.; Barthelmie, R.; Pryor, S.; Rathmann, O.; Larsen, S.; Højstrup, J.; Thøgersen, M. Analytical modelling of wind speed deficit in large offshore wind farms. Wind Energy 2006, 9, 39–53. [Google Scholar] [CrossRef]
  21. Larsen, G. A Simple Stationary Semi-Analytical Wake Model; Number 1713(EN) in Denmark. Forskningscenter Risoe; Risoe-R, Risø National Laboratory for Sustainable Energy, Technical University of Denmark: Lyngby, Denmark, 2009. [Google Scholar]
  22. Bastankhah, M.; Porté-Agel, F. A new analytical model for wind-turbine wakes. Renew. Energy 2014, 70, 116–123. [Google Scholar] [CrossRef]
  23. Niayifar, A.; Porté-Agel, F. Analytical modeling of wind farms: A new approach for power prediction. Energies 2016, 9, 741. [Google Scholar] [CrossRef]
  24. Pedersen, J.G.; Svensson, E.; Poulsen, L.; Nygaard, N.G. Turbulence Optimized Park model with Gaussian wake profile. J. Phys. Conf. Ser. 2022, 2265, 022063. [Google Scholar] [CrossRef]
  25. Zong, H.; Porté-Agel, F. A momentum-conserving wake superposition method for wind farm power prediction. J. Fluid Mech. 2020, 889, A8. [Google Scholar] [CrossRef]
  26. Vahidi, D.; Porté-Agel, F. A new streamwise scaling for wind turbine wake modeling in the atmospheric boundary layer. Energies 2022, 15, 9477. [Google Scholar] [CrossRef]
  27. Souaiby, M.; Porté-Agel, F. An improved analytical framework for flow prediction inside and downstream of wind farms. Renew. Energy 2024, 225, 120251. [Google Scholar] [CrossRef]
  28. Carbajo Fuertes, F.; Markfort, C.D.; Porté-Agel, F. Wind turbine wake characterization with nacelle-mounted wind lidars for analytical wake model validation. Remote Sens. 2018, 10, 668. [Google Scholar] [CrossRef]
  29. Barasa, M.; Xuemin, L.; Zhang, Y.; Weiming, X. The impact of the atmospheric boundary layer on the asymmetric wake profile: A bivariate analysis. Sustain. Energy Technol. Assess. 2022, 53, 102563. [Google Scholar] [CrossRef]
  30. Lopes, A.M.; Vicente, A.H.; Sánchez, O.H.; Daus, R.; Koch, H. Operation assessment of analytical wind turbine wake models. J. Wind. Eng. Ind. Aerodyn. 2022, 220, 104840. [Google Scholar] [CrossRef]
  31. Snaiki, R.; Makki, S. A new analytical wind turbine wake model considering the effects of coriolis force and yawed conditions. J. Wind. Eng. Ind. Aerodyn. 2024, 250, 105767. [Google Scholar] [CrossRef]
  32. Larsen, G.C.; Madsen, H.A.; Thomsen, K.; Larsen, T.J. Wake meandering: A pragmatic approach. Wind. Energy Int. J. Prog. Appl. Wind. Power Convers. Technol. 2008, 11, 377–395. [Google Scholar] [CrossRef]
  33. Li, Z.; Yang, X. Resolvent-based motion-to-wake modelling of wind turbine wakes under dynamic rotor motion. J. Fluid Mech. 2024, 980, A48. [Google Scholar] [CrossRef]
  34. Brugger, P.; Markfort, C.D.; Porté-Agel, F. Improvements to the dynamic wake meandering model by incorporating the turbulent Schmidt number. Wind. Energy Sci. 2024, 9, 1363–1379. [Google Scholar] [CrossRef]
  35. Nygaard, N.G.; Steen, S.T.; Poulsen, L.; Pedersen, J.G. Modelling cluster wakes and wind farm blockage. J. Phys. Conf. Ser. 2020, 1618, 062072. [Google Scholar] [CrossRef]
  36. Bastankhah, M.; Porté-Agel, F. Experimental and theoretical study of wind turbine wakes in yawed conditions. J. Fluid Mech. 2016, 806, 506–541. [Google Scholar] [CrossRef]
  37. Greenshields, C. OpenFOAM v11 User Guide; The OpenFOAM Foundation: London, UK, 2023. [Google Scholar]
  38. Shih, T.H.; Liou, W.W.; Shabbir, A.; Yang, Z.; Zhu, J. A new k-ε eddy viscosity model for high reynolds number turbulent flows. Comput. Fluids 1995, 24, 227–238. [Google Scholar] [CrossRef]
  39. Yang, Y.; Gu, M.; Chen, S.; Jin, X. New inflow boundary conditions for modelling the neutral equilibrium atmospheric boundary layer in computational wind engineering. J. Wind. Eng. Ind. Aerodyn. 2009, 97, 88–95. [Google Scholar] [CrossRef]
  40. Jonkman, J.; Butterfield, S.; Musial, W.; Scott, G. Definition of a 5-MW Reference Wind Turbine for Offshore System Development; National Renewable Energy Lab.(NREL): Golden, CO, USA, 2009. [Google Scholar] [CrossRef]
  41. Mikkelsen, R.F. Actuator Disc Methods Applied to Wind Turbines. Ph.D. Thesis, Technical University of Denmark, Kongens Lyngby, Denmark, 2004. [Google Scholar]
  42. Jimenez, A.; Crespo, A.; Migoya, E.; García, J. Advances in large-eddy simulation of a wind turbine wake. J. Phys. Conf. Ser. 2007, 75, 012041. [Google Scholar] [CrossRef]
  43. Navarro Diaz, G.P.; Otero, A.D.; Asmuth, H.; Sørensen, J.N.; Ivanell, S. Actuator line model using simplified force calculation methods. Wind. Energy Sci. 2023, 8, 363–382. [Google Scholar] [CrossRef]
  44. Porté-Agel, F.; Wu, Y.T.; Lu, H.; Conzemius, R.J. Large-eddy simulation of atmospheric boundary layer flow through wind turbines and wind farms. J. Wind. Eng. Ind. Aerodyn. 2011, 99, 154–168. [Google Scholar] [CrossRef]
  45. Diaz, G.P.N.; Saulo, A.C.; Otero, A.D. Wind farm interference and terrain interaction simulation by means of an adaptive actuator disc. J. Wind. Eng. Ind. Aerodyn. 2019, 186, 58–67. [Google Scholar] [CrossRef]
  46. Diaz, G.P.N.; Saulo, A.C.; Otero, A.D. Full wind rose wind farm simulation including wake and terrain effects for energy yield assessment. Energy 2021, 237, 121642. [Google Scholar] [CrossRef]
  47. Diaz, G.P.N.; Saulo, A.C.; Otero, A.D. Comparative study on the wake description using actuator disc model with increasing level of complexity. J. Phys. Conf. Ser. 2019, 1256, 012017. [Google Scholar] [CrossRef]
  48. Asmuth, H.; Diaz, G.P.N.; Madsen, H.A.; Branlard, E.; Forsting, A.R.M.; Nilsson, K.; Jonkman, J.; Ivanell, S. Wind turbine response in waked inflow: A modelling benchmark against full-scale measurements. Renew. Energy 2022, 191, 868–887. [Google Scholar] [CrossRef]
  49. Bastankhah, M.; Mohammadi, M.M.; Lees, C.; Diaz, G.P.N.; Buxton, O.R.; Ivanell, S. A fast-running physics-based wake model for a semi-infinite wind farm. J. Fluid Mech. 2024, 985, A43. [Google Scholar] [CrossRef]
  50. Bodini, N.; Lundquist, J.K.; Moriarty, P. Wind plants can impact long-term local atmospheric conditions. Sci. Rep. 2021, 11, 22939. [Google Scholar] [CrossRef]
  51. Ishihara, T.; Qian, G.W. A new Gaussian-based analytical wake model for wind turbines considering ambient turbulence intensities and thrust coefficient effects. J. Wind. Eng. Ind. Aerodyn. 2018, 177, 275–292. [Google Scholar] [CrossRef]
  52. Sørensen, J.N.; Mikkelsen, R.F.; Henningson, D.S.; Ivanell, S.; Sarmast, S.; Andersen, S.J. Simulation of wind turbine wakes using the actuator line technique. Philos. Trans. R. Soc. A Math. Phys. Eng. Sci. 2015, 373, 20140071. [Google Scholar] [CrossRef] [PubMed]
  53. Pedersen, M.M.; Forsting, A.M.; van der Laan, P.; Riva, R.; Romàn, L.A.A.; Risco, J.C.; Friis-Møller, M.; Quick, J.; Christiansen, J.P.S.; Rodrigues, R.V.; et al. PyWake 2.5.0: An Open-Source Wind Farm Simulation Tool; Technical University of Denmark: Kongens Lyngby, Denmark, 2023. [Google Scholar]
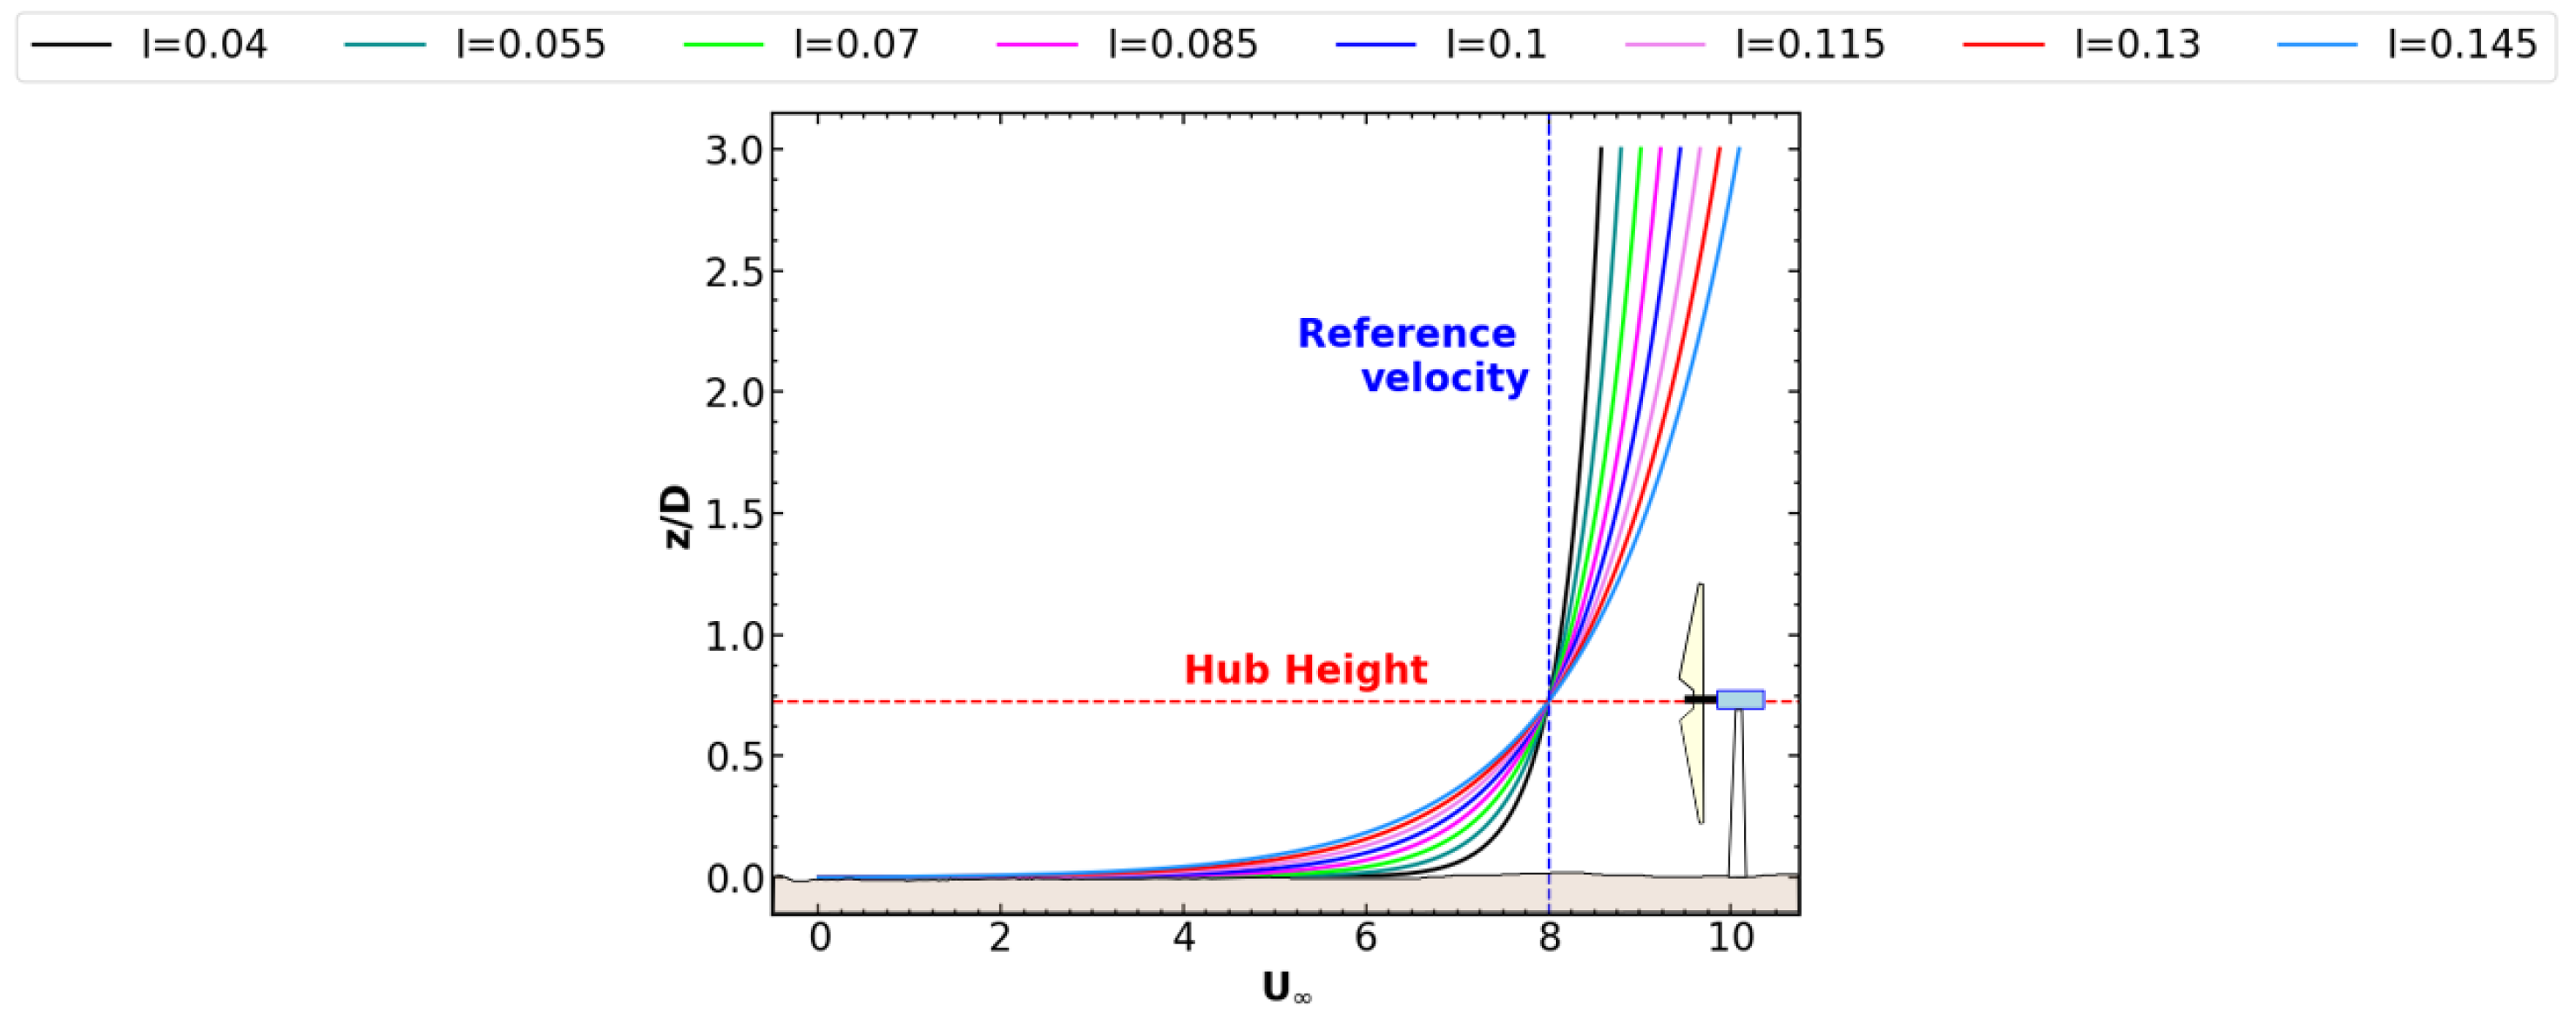
Figure 1. Inlet velocity profiles of the ABL imposed for each turbulence intensity case in CFD simulation.
Energies 18 04726 g001
Figure 2. Mesh for CFD simulations (top view). The actuator disc (marked in red) is placed at 5D from the inlet boundary condition and two mesh refinements are carried out over the background mesh.
Energies 18 04726 g002
Figure 3. Streamwise velocity deficit on a normal plane 5D downstream and for turbulence intensity of 0.085. The rotor center is indicated by a star (★), the wake center by a cross (×), and the corresponding wind turbine rotor position by a white dashed line.
Energies 18 04726 g003
Figure 4. Streamwise velocity deficit contours on normal planes at increasing turbulence intensities (from top to bottom) and distances (10D, 20D, 30D, and 40D from left to right). Stars (★) represent rotor center, and crosses (×) indicate wake center.
Energies 18 04726 g004
Figure 5. Wake velocity deficits at rotor center for different turbulence intensities. C is selected to normalize curves for new scaling proposed in Section 3.3.
Energies 18 04726 g005
Figure 6. Profiles of streamwise velocity deficit on vertical (left) and horizontal (right) planes containing rotor axis, at various downwind locations and turbulence intensities. Blue dotted lines represent hub axis, grey dashed lines show limits of rotor and red lines indicate position of maximum velocity deficit.
Energies 18 04726 g006
Figure 7. Results of fitting the normalized parameters σ y / D , σ z / D , y c / D , and z c / D with CFD results at different downstream distances.
Energies 18 04726 g007
Figure 8. Three-dimensional Gaussian parameters σ y / D , σ z / D , y c / D , and z c / D in terms of the normalized velocity deficit ( Δ U R o t o r C e n t e r / U inf ).
Energies 18 04726 g008
Figure 9. Model for the maximum common velocity deficit ( D c ) versus the turbulence intensity.
Energies 18 04726 g009
Figure 10. Models for σ y / D , σ z / D , y c / D , and z c / D in the new scaled space.
Energies 18 04726 g010
Figure 11. Flowchart of the wake model estimation procedure.
Energies 18 04726 g011
Figure 12. Normalised velocity deficit at the rotor axis as a function of downstream distance. Comparison of three different wake models with the proposed model. The black dots indicate the CFD results.
Energies 18 04726 g012
Figure 13. Normalised wake center velocity deficit as a function of downstream distance. Comparison of three different wake models with the proposed model. The black dots indicate the CFD results.
Energies 18 04726 g013
Figure 14. RMSE at downstream distances for the different wake models at various turbulence intensities.
Energies 18 04726 g014
Figure 15. Mean RMSE along the analysed domain (between 4D and 49D) calculated for each wake model at different turbulence intensities without the mirror ground model (left) and with the mirror activated (right).
Energies 18 04726 g015
Disclaimer/Publisher’s Note: The statements, opinions and data contained in all publications are solely those of the individual author(s) and contributor(s) and not of MDPI and/or the editor(s). MDPI and/or the editor(s) disclaim responsibility for any injury to people or property resulting from any ideas, methods, instructions or products referred to in the content.